Embed Size (px)
Citation preview

Echolocation signals of a beaked whale at Palmyra AtollSimone Baumann-Pickering,a� Sean M. Wiggins, and Ethan H. RothScripps Institution of Oceanography, University of California, San Diego, 9500 Gilman Drive, La Jolla,California 92093-0205
Marie A. RochDepartment of Computer Science, San Diego State University, 5500 Campanile Drive, San Diego,California, 92182-7720
Hans-Ulrich SchnitzlerEberhard-Karls-Universität Tübingen, Zoologisches Institut, Abteilung Tierphysiologie, Auf der Morgenstelle28, 72076 Tübingen, Germany
John A. HildebrandScripps Institution of Oceanography, University of California, San Diego, 9500 Gilman Drive, La Jolla,California 92093-0205
�Received 26 August 2009; revised 23 March 2010; accepted 30 March 2010�
Acoustic recordings from Palmyra Atoll, northern Line Islands, central Pacific, showed upsweepfrequency modulated pulses reminiscent of those produced by beaked whales. These signals hadhigher frequencies, broader bandwidths, longer pulse durations and shorter inter-pulse intervals thanpreviously described pulses of Blainville’s, Cuvier’s and Gervais’ beaked whales �Zimmer et al.�2005�. J. Acoust. Soc. Am. 117, 3919–3927; Johnson et al. �2006�. J. Exp. Biol. 209, 5038–5050;Gillespie et al. �2009�. J. Acoust. Soc. Am. 125, 3428–3433�. They were distinctly differenttemporally and spectrally from the unknown beaked whale at Cross Seamount, HI �McDonald et al.�2009�. J. Acoust. Soc. Am. 125, 624–627�. Genetics on beaked whale specimens found at PalmyraAtoll suggest the presence of a poorly known beaked whale species. Mesoplodon sp. might be thesource of the FM pulses described in this paper. The Palmyra Atoll FM pulse peak frequency wasat 44 kHz with a �10 dB bandwidth of 26 kHz. Mean pulse duration was 355 �s and inter-pulseinterval was 225 ms, with a bimodal distribution. Buzz sequences were detected with inter-pulseintervals below 20 ms and unmodulated spectra, with about 20 dB lower amplitude than prior FMpulses. These clicks had a 39 kHz bandwidth ��10 dB�, peak frequency at 37 kHz, click duration155 �s, and inter-click interval between 4 and 10 ms.© 2010 Acoustical Society of America. �DOI: 10.1121/1.3409478�
PACS number�s�: 43.80.Ka �WWA� Pages: 3790–3799
I. INTRODUCTION
Beaked whales are among the least known large mam-mals on the planet, as they are infrequently encountered inthe field and difficult to identify �e.g., Pitman, 2008�. Theyare pelagic, deep foraging divers with rather short surfaceintervals between dives �e.g., Tyack et al., 2006�. Many ofthe more than 20 species of beaked whales are known onlyfrom strandings and the study of skeletal material �Jeffersonet al., 2008�. The Mesoplodon beaked whales are rarely seenalive although they are the most species rich cetacean genus�Pitman, 2008�. The number of mesoplodont species is stillincreasing with two new species described as recently as1991 and 2002 �Reyes et al., 1991; Dalebout et al., 2002�.
Until a few years ago, the acoustic behavior of beakedwhales was barely known, with descriptions being incom-plete due to restrictions in recording bandwidths �e.g., Cald-well and Caldwell, 1971; Lynn and Reiss, 1992; Dawson etal., 1998�. There has been an increased investigation effort
a�Author to whom correspondence should be addressed. On leave from:Eberhard-Karls-Universität Tübingen, Zoologisches Institut, AbteilungTierphysiologie, Auf der Morgenstelle 28, 72076 Tübingen, Germany.
Electronic mail: [email protected]3790 J. Acoust. Soc. Am. 127 �6�, June 2010 0001-4966/2010/12
after several mass strandings of beaked whales, which havebeen linked to anthropogenic noise during military sonar ex-ercises �Simmonds and Lopez-Jurado, 1991; Frantzis, 1998;Jepson et al., 2003�. New acoustic technologies with a widefrequency range have made it possible to record the ultra-sonic echolocation signals of beaked whales �e.g., Johnsonand Tyack, 2003; Wiggins and Hildebrand, 2007�. Blain-ville’s �Mesoplodon densirostris� and Cuvier’s �Ziphius cavi-rostris� beaked whales are the more commonly encounteredand best acoustically studied among this group of cetaceans�Johnson et al., 2004; Madsen et al., 2005; Zimmer et al.,2005; Johnson et al., 2006, 2008�. Recent recordings of sig-nals from Gervais’ beaked whales reveal their acoustic sig-nature �Gillespie et al., 2009�. All three species produce up-sweep frequency modulated �FM� pulses, which are speciesand activity specific. Johnston et al. �2008� and McDonald etal. �2009� report an FM ultrasonic sound of unknown originwith beaked whale characteristics, discovered on a long-termbroadband acoustic recording from Cross Seamount, HI.Other beaked whales within the genus Hyperoodon and Be-rardius also use short duration, broadband echolocationclicks but restrictions in sampling frequency do not allow for
judgment whether these signals have a frequency sweep© 2010 Acoustical Society of America7�6�/3790/10/$25.00

�Dawson et al., 1998; Rogers and Brown, 1999; Hooker andWhitehead, 2002�. So far we know Baird’s, Arnoux’s andBlainville’s beaked whales also produce whistles �Dawson etal., 1998; Rogers and Brown, 1999; Rankin and Barlow,2007�, while whistles from unidentified small beaked whaleshave been recorded in the Antarctic �J. A. Hildebrand, per-sonal communication�.
The echolocation signals of Blainville’s and Cuvier’sbeaked whales are similar linear upsweep FM pulses ofabout 270 and 200 �s duration, sweeping from 26 to 51 kHzand 31 to 54 kHz with center frequencies of 38 and 42 kHz,and inter-pulse intervals of 370 and 380 ms, respectively�Zimmer et al., 2005; Johnson et al., 2006�. Source levels ofup to 214 dB re 1 �Pa at 1 m peak-to-peak �pp� have beenreported for Cuvier’s beaked whales �Zimmer et al., 2005�.Zimmer et al. �2005� measured a narrow beamwidth withdirectivity index of 30 dB and head scan rates of 25 deg/s forCuvier’s beaked whales. Gervais’ beaked whales produceFM pulses of about 200 �s duration with a dominant fre-quency in the range of 30 to 50 kHz and a mean inter-pulseinterval of 270 ms. The beaked whale signals from CrossSeamount �Johnston et al., 2008; McDonald et al., 2009�swept in a different frequency range from 35 to above100 kHz �the bandwidth limitation of the recording�, withlong pulse durations of about 990 �s, and short inter-pulseintervals of 110 ms.
Most work on toothed whale echolocation has been withcaptive animals and has focused on target detection �e.g., Au,1993; Kastelein et al., 1999� and discrimination �e.g., Au,1993; Kastelein et al., 1997� while little is known about preycapture, particularly in the wild. A few recent studies showthat the phases of prey capture in odontocetes �e.g., Miller etal., 1995; Madsen et al., 2002; Johnson et al., 2004; Miller etal., 2004; Akamatsu et al., 2005; Madsen et al., 2005;Johnson et al., 2006, 2008; Jones et al., 2008; Verfuß et al.,2009� are very similar to those of prey capture in bats �e.g.,Griffin et al., 1960; Kalko and Schnitzler, 1989; Surlykke etal., 1993; Schnitzler and Kalko, 1998; Miller and Surlykke,2001; Schnitzler et al., 2003; Melcón et al., 2007�. Vocaliz-ing with long intervals is used to search for prey items whilea group of signals with short intervals, the buzz, indicateprey capture attempts. Blainville’s beaked whales �Mesopl-odon densirostris� use FM echolocation pulses at 0.2–0.6 sinter-pulse intervals to detect and approach prey. At a dis-tance to prey of about 3–4 m, they switch to a buzz withinter-pulse intervals around 10 ms, using lower energy un-modulated clicks for prey capture �Madsen et al. 2005;Johnson et al. 2006, 2008�.
We describe the spectral and temporal characteristics ofpresumed beaked whale signals recorded with a towed hy-drophone array and found on a yearlong seafloor acousticrecording at Palmyra Atoll. Based on preliminary analysis oftwo stranded specimens from Palmyra Atoll, Dalebout et al.�2007� suggested that the Palmyra Atoll beaked whales mayrepresent yet another undescribed species. We show that theecholocation signals of the Palmyra Atoll beaked whale aresimilar to those of other whales in this family, which changetheir echolocation signal types and signal timing dependent
upon behavioral context.J. Acoust. Soc. Am., Vol. 127, No. 6, June 2010 Baumann
II. MATERIALS AND METHODS
A. Data collection
Our study area is the off-reef of Palmyra Atoll, extend-ing in longitude west to east from 162° 15� W to 161°57� W and in latitude north to south from 5° 57.6� N to 5°49.2� N �Fig. 1�. During two field seasons from September18 to October 13, 2007, and October 14 to November 2,2008 we conducted visual and acoustic surveys off the 26 ftDavis boat, Zenobia. During our daytime surveys we circum-navigated the atoll choosing a route dependant on sea condi-tions and mostly within 0.5 to 4 km of the reef edge. Wemaintained a constant watch with two to three observers. Thesmall boat and heavy swell largely precluded use of binocu-lars for searching. When we detected animals we approachedthem for identification, school size estimation, photographyand acoustic recordings. Recordings were obtained using atowed four-channel hydrophone array, streamed on 80 m ofcable behind the boat. Depending on the animals’ behavior,the array was either towed with speeds ranging between 1and 8 kn, which resulted in a hydrophone water depth of10–15 m, or deployed as a stationary array with a maximumdepth of 80 m. The array was equipped with HS150 hydro-phones �Sonar Research & Development Ltd., Beverley,UK�, which had a sensitivity of �205 dB re V /�Pa and aflat frequency response of �1 dB over the analysis range of8 to 85 kHz. The hydrophones were connected to custom-built preamplifiers band-pass filter electronic circuit boards.The circuit boards were designed to flatten the ambient oceannoise, which resulted in a nonlinear frequency response thatprovided greater gain at higher frequencies where ambientnoise levels are lower and sound attenuation is higher �for adetailed description of the circuit board properties see Wig-gins and Hildebrand, 2007�. Data were digitally sampledwith a MOTU Traveler �Mark of the Unicorn, Cambridge,MA� at a sampling frequency of 192 kHz and recorded di-rectly to a computer hard-disk drive with the software ISH-
MAEL �Mellinger, Oregon State University, Newport�.Parallel to this effort, an autonomous high-frequency
acoustic recording package �HARP� was placed on a steepslope off Palmyra Atoll’s western terrace �Fig. 1�. The HARPdesign differed from what was described in Wiggins and
-1600
-1600
-1600-2000
-1200
-1200
-1200
-1200
-1200
-800
-800
-800
-400
-400
-1600
-160 -1500
10
20
Palmyra Atoll
HawaiianIslands
FIG. 1. Bathymetric map of Palmyra Atoll, with positions of HARPs indi-cated by stars and beaked whale sightings indicated by filled circles. Topright inset shows approximate location of Palmyra Atoll. Data courtesy ofNOAA Coral Reef Ecosystem Division, Pacific Islands Fisheries ScienceCenter and the Pacific Islands Benthic Habitat Mapping Center, SOEST,University of Hawaii. Coastline data courtesy of National Geophysical DataCenter, NOAA Satellite and Information Service, WVS Coastline Database.Plotting with GMT by Paul Wessel and Walter H. F. Smith.
Hildebrand, 2007 as it was in a mooring configuration with
-Pickering et al.: Beaked whale echolocation at Palmyra Atoll 3791

the hydrophone floating at about 20 m above the seafloor. Itrecorded from October 19, 2006 until March 23, 2007 andfrom April 9, 2007 until September 18, 2007. The recordinggap of 16 days between the two deployments correspondedto servicing of batteries and hard drives. During the firstdeployment the HARP was located at 05° 51.85� N 162°09.91� W in 650 m water depth. It was then deployed about1 km east of the initial location at 05° 51.88� N 162°09.36� W in 550 m depth. The recorder was set to a sam-pling frequency of 200 kHz and duty cycled with an onduration of 5 min every 20 min. On the HARP we used anomni-directional transducer �ITC-1042, ITC, Santa Barbara,CA�, which had an approximately flat ��2 dB� frequencyresponse from 10 Hz to 100 kHz with a hydrophone sensi-tivity of �200 dB re V /�Pa. It was connected to a custom-built preamplifier board with band-pass filter and designed tofollow the reciprocal of ocean ambient noise in order tomaximize the dynamic range of the recorder �Wiggins andHildebrand, 2007�. All hydrophones and associated electron-ics were calibrated. The frequency responses of systemswere compensated for during analysis.
B. Signal processing
Signal processing was performed using custom-maderoutines in MATLAB �Mathworks, Natick, MA�. Beakedwhale type sweep signals were detected on array and HARPrecordings. These signals had, in comparison to delphinidclicks, longer durations and an upswept frequency. One se-quence of 1 min 20 s with 109 pulses was detected on thearray recordings of fall 2008. Sixty-five sequences out of 575sequences with beaked whale type sweeps on the yearlongHARP recordings were selected for further analysis. Se-quences were selected when a larger number of signals werewell detectable above noise. In addition to swept pulses therewere a few calling bouts with differing signal pattern andstructure categorized as buzz clicks, based upon their fasterrepetition rate and spectral properties. All sequences weredigitally filtered with a 10-pole Butterworth band-pass filter.The low cutoff frequency was at 8 kHz for FM pulse se-quences. Buzz clicks had a much lower sound pressure leveland therefore the low cutoff frequency was raised to 16 kHzin these sequences to improve the signal-to-noise ratio. Thehigh cutoff frequency was at 85 kHz for both signal types toprevent analysis of possibly aliased parts of the recordedsignal.
FM pulses and buzz clicks were automatically selectedusing a two-step approach. The first step used time-domaincross-correlation of a typical echolocation pulse to detectsignals. Cross-correlation gave the degree of linear relation-ship between an example pulse as the model and the data setto be analyzed. The threshold for cross-correlation was setlow with about 2% missed pulses and missed pulses were oflow signal-to-noise ratio. There was accordingly a high falsealarm rate. These automatic selections were manuallyscanned and all false detections were deleted. A 2.5 ms timeseries window was roughly defined around the detected FMpulses, and a 2 ms window around the detected buzz clicks.
The second automatic selection step determined the exact3792 J. Acoust. Soc. Am., Vol. 127, No. 6, June 2010 Ba
start and end point of the FM pulses and buzz clicks. Thefiner resolution click detection algorithm �Soldevilla et al.,2008� using the Teager energy operator �Kaiser, 1990� wasapplied. By processing three consecutive signal samples, theTeager energy operator provides nearly instantaneous energytracking. The Teager energy operator of a discrete signal isdefined as
��x�n�� = x2�n� − x�n + 1�x�n − 1� , �1�
with n standing for the sample number. The usefulness of theTeager energy operator was successfully demonstrated forthe detection of sperm whale regular and creak clicks �Kan-dia and Stylianou, 2006�. In our analysis, we empiricallychose a noise floor at the 40th percentile of energy for eachclick. Points that had a Teager energy 100 times greater thanthe preceding noise floor and were less than 500 �s apart,were grouped as one click. In case of multiple clicks per15 ms of data, the signal with the highest Teager energy waschosen for analysis. To find the complete click including re-verberations, start and end points were determined as the firstand last points that were three times greater than the noisefloor of a ten-point running mean of the Teager energy. Ad-ditionally, as a comparison, the 98% energy duration wascalculated such that the calculated start and end of a pulse orbuzz click was at the point t in time at which the integral ofthe energy �p2�t�dt� increased or decreased, respectively, nomore than 1% as t increased �Au, 1993�.
In order to calculate signal-to-noise ratios, a 5 ms timeseries window was roughly picked preceding every FM pulseand a 2.5 ms window preceding every buzz click. Spectraof each signal and preceding noise were calculated using1.28 ms of data and a 256-point Hann window centeredaround the pulse or click and in the beginning of the noisesample.
For the calculation of received levels, peak-to-peak lev-els of each FM pulse or buzz click were measured and con-verted into decibel values. The system response was approxi-mately flat ��3 dB� across the frequency range of thesignals. The dB value of the inverse of the system responseat peak frequency was added. Click received levels are givenover a band encompassing the click energy. To approxi-mately represent click sound pressure levels on a plot ofambient noise levels, �10 dB bandwidths of pulses and buzzclicks were calculated according to the definition by Au�1993� and 10 log �bandwidth� was added. Signal-to-noiseratios were calculated with rms signal levels and rms noiselevels. For rms noise level calculation, the noise was digi-tally band-pass filtered with a 10-pole Butterworth filter andcut at 25 and 75 kHz, which was the frequency range repre-sentative of the signals. To use only good quality pulses andclicks for the signal description, potentially clipped signalswere eliminated by allowing only signals with amplitudes upto 80% of the dynamic range of the recording system, whichresulted in a cut-off received level of about 165 dB re 1 �Paat 1 m. Furthermore all FM pulses recorded on the HARPwith a signal-to-noise ratio of less than 20 dB and HARPbuzz clicks as well as array FM pulses with less than 10 dB
were discarded.umann-Pickering et al.: Beaked whale echolocation at Palmyra Atoll

Signal parameters are influenced by the distance and ori-entation of the vocalizing animal to the recording hydro-phone. Lower frequencies are less attenuated over distancethan higher frequencies. The following equation �Richardsonet al., 1995� was used to approximate the influence of attenu-ation:
� = 0.036f1.5 dB/km, �2�
with f being frequency in kHz. At a distance of 100 m the25–85 kHz band was attenuated 0.5–2.8 dB. Thus for shortranges the recorded spectra is similar in shape to the sourcespectra. At 1 km the attenuation will be 5–28 dB in the signalrange and therefore distort the spectral characteristics espe-cially in the high frequencies. The orientation of the whale tothe recording device changes the signal properties as higheroverall amplitudes, more high frequency energy and shorterduration signals are expected when the whale’s vocal beam ison axis with the recorder �Au, 1993�. To minimize thesebiases for the calculation of median signal parameters, onlyhighest amplitude signals were used. FM pulses and buzzclicks from HARP data with received levels between 150 and160 dB re 1 �Pa �pp� were included, leaving 3924 and 113signals, respectively. 52 FM pulses from the array recordingswith received levels between 130 and 160 dB re 1 �Pa �pp�were included. The frequency-related signal parameters peakand center frequency, �3 and �10 dB bandwidth were pro-cessed using methods from Au �1993�. Modulation rate ofFM pulses was measured by computing the instantaneousfrequency over the pulse using the Hilbert transform�Bracewell, 2000�. The instantaneous frequency data werefitted with linear least-squares equations. Errors in the instan-taneous frequency due to noise in the data were eliminatedby discarding frequency values below 25 kHz in the entirepulse and above 80 kHz in the first half of the pulse.
Notable signals recorded were buzz clicks on the HARPand FM pulses from one vocalizing animal in a continuousclick train on the array. Median and percentile values werecalculated for these inter-pulse intervals with non-parametricdistribution. FM pulses on the HARP recording originatedfrom echolocation vocalizations of one or more animals.Inter-pulse intervals smaller than 120 ms were discarded be-cause they showed either a change in echolocation behaviordue to the approach to a target by shortening the inter-pulseinterval, or indicated the presence of two or more animalsvocalizing at the same time. Inter-pulse intervals longer than550 ms were discarded, as they appeared due to larger gapsbetween FM pulse bouts or missed pulses of low amplitude.A histogram of the inter-pulse interval was computed using a10 ms bin width from which two peaks in distribution ap-peared. A Gaussian mixture model with two mixtures wasfitted to the histogram to describe the two peaks �Huang etal., 2001�. Inter-pulse interval means and standard deviationswere derived from the Gaussian model for each peak.
III. RESULTS
A. FM pulse echolocation signals
During our two fall field seasons in the waters sur-rounding Palmyra Atoll we typically had sea states between
Beaufort 3 and 4 and would regularly encounter bottlenoseJ. Acoust. Soc. Am., Vol. 127, No. 6, June 2010 Baumann
dolphins �Tursiops truncatus�, melon-headed whales �Pep-onocephala electra�, Gray’s spinner dolphins �Stenella lon-girostris longirostris�, and once short-finned pilot whales�Globicephala macrorhynchus�. We had a total of three en-counters with beaked whales. During two of the three en-counters the animals were identified to be of the genus Me-soplodon, yet of an unidentified species. One encounter wasof a distant unidentified beaked whale. Both sightings in2007 were of two animals as a group, in one case a Mesopl-odon sp. mother-calf pair �Fig. 2�, the other case was uniden-tified. In 2008 one single Mesoplodon sp. was observedbreaching once within 10 m off the bow of the small researchvessel before starting a dive in perpendicular swim directionto the cruising direction of the boat. This sighting took placeduring bad visibility due to strong rainfall and sea stateBeaufort 3.
During the two Mesoplodon sp. encounters the towedhydrophone array was deployed and the boat was stoppeduntil it drifted with the prevailing currents. Acoustic record-ings were started after the animals had been spotted, carriedout for 1.5 h and stopped after no resighting occurred. Inboth cases there had been a dolphin sighting �unidentifiedand bottlenose dolphin� about half an hour prior and about 5km away from the sighting location. No further cetaceansighting was reported for either of the days after the beakedwhale sighting. Only the recordings of the close encounter infall 2008 had upsweep FM pulses immediately after the ani-mal had breached and started to dive. A total of 109 FMpulses were detected but only 52 had a received sound pres-sure level between 130 and 160 dB re 1 �Pa �pp� and wereused for the array signal description �Table I�. Signals had a�10 dB bandwidth of 39 kHz and a �3 dB bandwidth of12 kHz. The center frequency was at 40 kHz and the peakfrequency at 41 kHz. Linear fitting was used to describemodulation rates which resulted on average in 239 kHz/ms.Teager-energy pulse duration was 167 �s, while 98%-energy duration was 52 �s. Inter-pulse intervals had a me-dian value of 79 ms.
The data analysis of the long-term HARP data showed
FIG. 2. Surfacing sequence mother-calf pair of Mesoplodon sp. at PalmyraAtoll.
upsweep FM pulses, which were similar to the array record-
-Pickering et al.: Beaked whale echolocation at Palmyra Atoll 3793
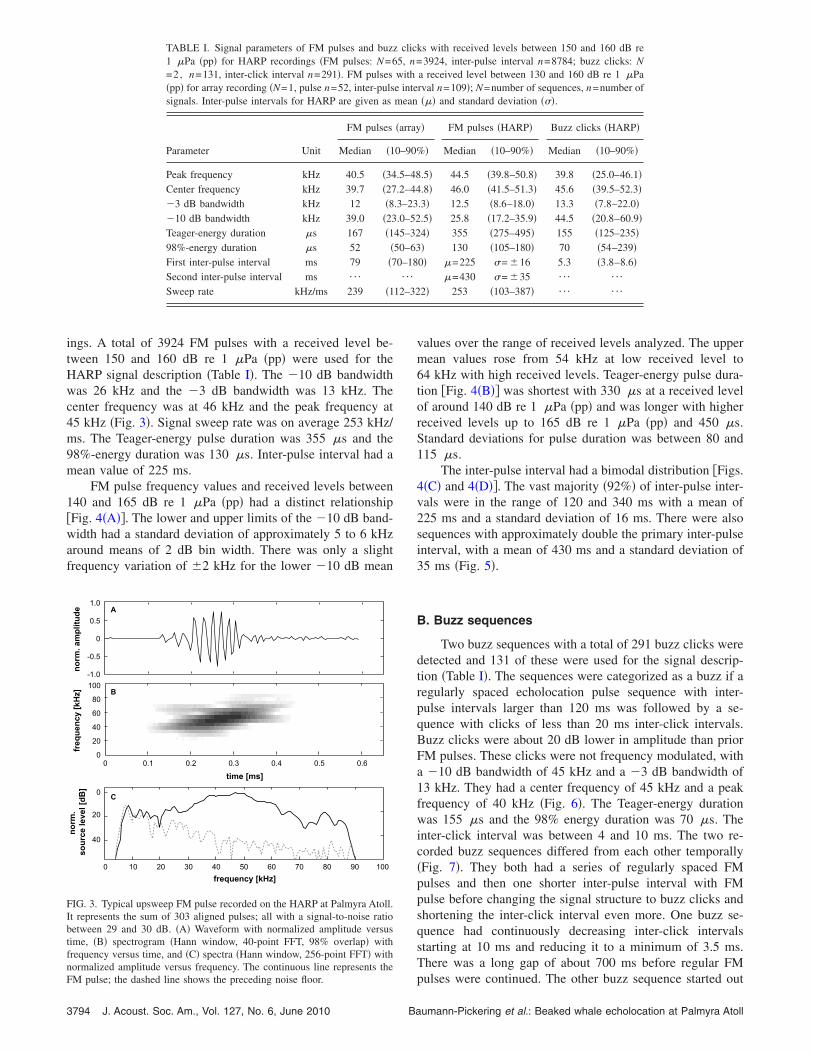
ings. A total of 3924 FM pulses with a received level be-tween 150 and 160 dB re 1 �Pa �pp� were used for theHARP signal description �Table I�. The �10 dB bandwidthwas 26 kHz and the �3 dB bandwidth was 13 kHz. Thecenter frequency was at 46 kHz and the peak frequency at45 kHz �Fig. 3�. Signal sweep rate was on average 253 kHz/ms. The Teager-energy pulse duration was 355 �s and the98%-energy duration was 130 �s. Inter-pulse interval had amean value of 225 ms.
FM pulse frequency values and received levels between140 and 165 dB re 1 �Pa �pp� had a distinct relationship�Fig. 4�A��. The lower and upper limits of the �10 dB band-width had a standard deviation of approximately 5 to 6 kHzaround means of 2 dB bin width. There was only a slightfrequency variation of �2 kHz for the lower �10 dB mean
TABLE I. Signal parameters of FM pulses and buzz1 �Pa �pp� for HARP recordings �FM pulses: N=6=2, n=131, inter-click interval n=291�. FM pulses�pp� for array recording �N=1, pulse n=52, inter-pulssignals. Inter-pulse intervals for HARP are given as
Parameter Unit
FM pulses
Median �1
Peak frequency kHz 40.5 �34Center frequency kHz 39.7 �27�3 dB bandwidth kHz 12 �8�10 dB bandwidth kHz 39.0 �23Teager-energy duration �s 167 �198%-energy duration �s 52 �First inter-pulse interval ms 79 �7Second inter-pulse interval ms ¯
Sweep rate kHz/ms 239 �1
0
20
40
norm.
sourcelevel[dB]
frequency[kHz]
norm.amplitude
time [ms]
frequency [kHz]
FIG. 3. Typical upsweep FM pulse recorded on the HARP at Palmyra Atoll.It represents the sum of 303 aligned pulses; all with a signal-to-noise ratiobetween 29 and 30 dB. �A� Waveform with normalized amplitude versustime, �B� spectrogram �Hann window, 40-point FFT, 98% overlap� withfrequency versus time, and �C� spectra �Hann window, 256-point FFT� withnormalized amplitude versus frequency. The continuous line represents the
FM pulse; the dashed line shows the preceding noise floor.3794 J. Acoust. Soc. Am., Vol. 127, No. 6, June 2010 Ba
values over the range of received levels analyzed. The uppermean values rose from 54 kHz at low received level to64 kHz with high received levels. Teager-energy pulse dura-tion �Fig. 4�B�� was shortest with 330 �s at a received levelof around 140 dB re 1 �Pa �pp� and was longer with higherreceived levels up to 165 dB re 1 �Pa �pp� and 450 �s.Standard deviations for pulse duration was between 80 and115 �s.
The inter-pulse interval had a bimodal distribution �Figs.4�C� and 4�D��. The vast majority �92%� of inter-pulse inter-vals were in the range of 120 and 340 ms with a mean of225 ms and a standard deviation of 16 ms. There were alsosequences with approximately double the primary inter-pulseinterval, with a mean of 430 ms and a standard deviation of35 ms �Fig. 5�.
B. Buzz sequences
Two buzz sequences with a total of 291 buzz clicks weredetected and 131 of these were used for the signal descrip-tion �Table I�. The sequences were categorized as a buzz if aregularly spaced echolocation pulse sequence with inter-pulse intervals larger than 120 ms was followed by a se-quence with clicks of less than 20 ms inter-click intervals.Buzz clicks were about 20 dB lower in amplitude than priorFM pulses. These clicks were not frequency modulated, witha �10 dB bandwidth of 45 kHz and a �3 dB bandwidth of13 kHz. They had a center frequency of 45 kHz and a peakfrequency of 40 kHz �Fig. 6�. The Teager-energy durationwas 155 �s and the 98% energy duration was 70 �s. Theinter-click interval was between 4 and 10 ms. The two re-corded buzz sequences differed from each other temporally�Fig. 7�. They both had a series of regularly spaced FMpulses and then one shorter inter-pulse interval with FMpulse before changing the signal structure to buzz clicks andshortening the inter-click interval even more. One buzz se-quence had continuously decreasing inter-click intervalsstarting at 10 ms and reducing it to a minimum of 3.5 ms.There was a long gap of about 700 ms before regular FM
ks with received levels between 150 and 160 dB re3924, inter-pulse interval n=8784; buzz clicks: N
a received level between 130 and 160 dB re 1 �Parval n=109�; N=number of sequences, n=number of��� and standard deviation ���.
� FM pulses �HARP� Buzz clicks �HARP�
%� Median �10–90%� Median �10–90%�
.5� 44.5 �39.8–50.8� 39.8 �25.0–46.1�
.8� 46.0 �41.5–51.3� 45.6 �39.5–52.3�.3� 12.5 �8.6–18.0� 13.3 �7.8–22.0�.5� 25.8 �17.2–35.9� 44.5 �20.8–60.9�4� 355 �275–495� 155 �125–235�� 130 �105–180� 70 �54–239�
0� �=225 �= �16 5.3 �3.8–8.6��=430 �= �35 ¯ ¯
2� 253 �103–387� ¯ ¯
clic5, n=withe intemean
�array
0–90
.5–48
.2–44.3–23.0–52
45–3250–630–18¯
12–32
pulses were continued. The other buzz sequence started out
umann-Pickering et al.: Beaked whale echolocation at Palmyra Atoll

es fit
with very short inter-click intervals around 4–5 ms, then var-ied between 7 and 9 ms. The sequence ended with a 500 msgap before regularly spaced FM pulses were taken up again.
IV. DISCUSSION
A. Species correlation
Recent analysis �Dalebout, unpublished data� showedthat the two beached skulls from Palmyra Atoll are geneti-cally identical with one stranded specimen found in SriLanka, the beaked whale species Mesoplodon hotaula, ini-tially described by Deraniyagala �1963a, 1963b�. The speciesM. hotaula was considered synonymous with M. gingkodens�Moore and Gilmore, 1965� and because of the similar cra-nial osteology, has probably been mistaken for M. ginkodensnumerous times. No other records since 1963 showed thepresence of M. hotaula, either stranded or alive. During field
received level [dB re 1 μPa at 1 m(pp)]
pulseduration[μs]
0140 150 160 170130
200
400
600
800
A
B
FIG. 4. FM pulse echolocation signals recorded on HARP at Palmyra Atoll.received level with mean value and standard deviation of groups with 2 dB band standard deviation of groups with 2 dB bin width, line of best fit. Box aroin Table I. Data basis �n� for �A� and �B� were 7833 pulses. ��C� and �D�� Hithe dominant first peak and �D� the smaller second peak. Black line indicat
FIG. 5. FM pulse echolocation sequences with �A� single and shorter inter-pulse intervals �mean 225 ms� and �B� double inter-pulse intervals �mean
430 ms�.J. Acoust. Soc. Am., Vol. 127, No. 6, June 2010 Baumann
trips to Palmyra Atoll in fall 2007 and 2008 an unknownspecies of mesoplodont beaked whale was repeatedly seen�trip reports Baumann-Pickering, Pitman and Ballance,Roth�. There has been no confirmed beaked whale sightingor stranding of another species at this location. The sightingswere possibly of living examples of M. hotaula at PalmyraAtoll �Fig. 2�. The head shape was unlike M. densirostris andthe dorsal fin shape unlike M. peruvians �Jefferson et al.,2008�. These two species are the most likely to occur at
0
200
400
600
800
200 400 600
C
D
ower �dark gray� and upper �light gray� limits of �10 dB frequency versusdth, line of best fit. �B� Pulse duration versus received level with mean value150 and 160 dB received level indicates data used for parameter calculationsam of bimodally distributed inter-pulse interval �n=8784� with �C� showingof Gaussian mixture model, two mixtures.
norm.
sourcelevel[dB]
frequency[kHz]
norm.amplitude
0
20
40
time [ms]
frequency [kHz]
FIG. 6. Typical buzz click recorded at Palmyra Atoll. It represents the sumof 48 aligned clicks; all with a signal-to-noise ratio larger than 20 dB. �A�Waveform with normalized amplitude versus time, �B� spectrogram �Hannwindow, 40-point FFT, 98% overlap� with frequency versus time, and �C�spectra �Hann window, 256-point FFT� with normalized amplitude over fre-quency. The continuous line represents the buzz click; the dashed line shows
�A� Lin wiundstogr
the preceding noise floor.
-Pickering et al.: Beaked whale echolocation at Palmyra Atoll 3795

Palmyra Atoll based on the known geographical distributionof mesoplodonts �MacLeod et al., 2006; Jefferson et al.,2008�. Cookiecutter shark �Isistius brasiliensis� bites or toothscrape marks of conspecifics did not leave characteristicwhite scars in this species, which makes them distinguish-able in the field, at least from M. densirostris �trip reportPitman and Ballance�. To distinguish M. hotaula from M.gingkodens a biopsy sample would be necessary. In order tobe certain about the precise species at Palmyra Atoll, morephotos, particularly of adult males with their distinct tooth oneach side of the lower jaw, and biopsy samples would becrucial.
It is probable that the unknown mesoplodont whale, pre-sumably M. hotaula, produced the recorded sounds on thelong-term data set as well as the array data. It has been theonly confirmed species of beaked whale observed around theatoll and during the array recording. The FM pulses on thearray recordings were possibly recorded from a caudal aspectas the animal descended on a dive which resulted in someclicks having low received levels and which could have astrong influence on both temporal and spectral properties ofthe recorded signals. In particular the bandwidth, center andpeak frequency of on-axis signals is likely underestimatedand the duration overestimated. Nevertheless, mean arrayand HARP signal spectra are very similar with more energy
FIG. 7. ��A� and �B�� Change from regular pulses to clicks of buzzes in twosequences with shortening of inter-pulse intervals �open circles� before thebuzz clicks to a minimum of 26 ms �A� and 24 ms �B� followed by inter-click intervals �points� between 10 and 4 ms. After the buzz there was apause of 708 ms �A� and 499 ms �B� before echolocation pulses were re-sumed. �C� Detail of buzz inter-click intervals �points� versus time of se-quence A �black� and B �gray�. Lines in the beginning and end indicate longinter-pulse intervals.
in the frequencies below 35 kHz for probably more off axis,
3796 J. Acoust. Soc. Am., Vol. 127, No. 6, June 2010 Ba
low amplitude array signals �Fig. 8�, resulting in discrepan-cies in median values �Table I�. The beaked whale signalsrecorded in the presence of the Mesoplodon sp. of PalmyraAtoll and described here are unlike previously published FMpulse descriptions in their temporal and spectral properties.They are very different in all aspects to those found at CrossSeamount �Johnston et al., 2008; McDonald et al., 2009�. Yetdespite their differences, they have more similarity withthose of Cuvier’s, Blainville’s and Gervais’ beaked whales,but with higher peak and center frequencies, and shorterinter-pulse intervals �Table II, Fig. 8�.
B. FM pulse echolocation signals
Beaked whale echolocation signals are known to be di-rectional. Zimmer et al. �2005� reported for Cuvier’s beakedwhales a directivity index of 30 dB and head scan rates of25 deg/s. With these beam characteristics only a few secondsof a continuous signal sequence with mostly on axis pulseswould be detectable on a stationary recorder. Given the rangeof received levels and major pulse energy between 30 and60 kHz, the maximum detection range of signals with highsignal-to-noise ratio should approximately be around 3 km�Urick, 1983� and clipping on the recorder appeared when
PA
norm
alized
spectrum
level[dB
]
frequency [kHz]
FIG. 8. Averaged power spectra for four beaked whale species �B=Blainville’s beaked whale, C=Cuvier’s beaked whale, G=Gervais’beaked whale, P=Palmyra beaked whale HARP, PA=Palmyra beaked whalearray�; data and graph adapted from Gillespie et al., 2009.
TABLE II. Comparison of FM pulse parameters of beaked whales.
�10 dBbandwidth
�kHz�
Centerfrequency
�kHz�Duration
��s�
Inter-pulseinterval
�ms�
Blainville’s beaked whalea 25 38 270 370Cuvier’s beaked whaleb 23 42 200 380Gervais’ beaked whalec �25 �45 200 270“Palmyra” beaked whale�HARP� 26 46 355 225“Cross Seamount” beakedwhaled �50 �70 985 110
aJohnson et al., 2006.bZimmer et al., 2005.cGillespie et al., 2009.d
McDonald et al., 2009, personal communication.umann-Pickering et al.: Beaked whale echolocation at Palmyra Atoll

animals approached to about 200 m. Due to the large rangeof distances and aspects of the vocalizing animal to the re-corder one can assume a large variability in both temporaland especially spectral properties �Figs. 4�A� and 4�B��.Looking at lower and upper frequency limits of the �10 dBbandwidth, spectral properties of FM pulse echolocation sig-nals in relation to received levels are almost unaffected in thelower frequencies between 30 and 40 kHz yet higher fre-quencies increase with increasing received level from a meanof 54 to 64 kHz �Fig. 4�A��. This frequency shift was mostlikely due to different distances of the vocalizing animal tothe recorder, which attenuated higher frequencies more atlarger range. A similar trend can be seen in the relationshipof duration and received level �Fig. 4�B��. With increasingreceived level the Teager-energy duration was getting longer,which is most likely not due to actually longer duration sig-nals but due to a better signal-to-noise ratio. Teager-energyduration was used for this comparison as this paper describesclicks from random distances and axis orientations, whichmay be distorted in their wave forms and include reverbera-tions caused by reflections within the head, the sound pro-ducing organs themselves, the external environment, or acombination of these �Au et al., 1978; Soldevilla et al., 2008;Lammers and Castellote, 2009�. Energy duration as a mea-sure of click duration has been widely used for the analysisof on-axis clicks; however, the Teager energy operatorproved to be more appropriate for off-axis signals �Soldevillaet al., 2008�. Teager energy duration values were thereforehigher than the 98% energy duration. The presentation of thefull variety of recorded signals received with passive acous-tic detection shows that both spectral and temporal meanvalues vary depending on the recording circumstances andquality of the signal and which part of the data is being usedfor mean value calculations.
C. Inter-pulse intervals
The Palmyra beaked whale had a large majority of theinter-pulse intervals on the HARP at 225�16 ms �Fig.4�C��. Despite the automatic detection that also counted se-quences with several animals vocalizing, which would resultin shorter inter-pulse intervals, or dropped occasional lowamplitude signals within a sequence, favoring longer inter-vals, the majority �92%� of inter-pulse intervals were withinthe distribution peak of the 225 ms inter-pulse interval. Therewas a second peak in the distribution of longer inter-pulseintervals from the HARP data produced by the Palmyrabeaked whale �Fig. 4�D�� at 430�35 ms, which was ap-proximately double the value of the first and dominant mode.A methodological error due to dropped signals in the detec-tion algorithm can be ruled out as lengthy sequences withlong inter-pulse intervals were found �Fig. 5�B��. We do nothave a hypothesis for the use of a certain short or long inter-pulse interval, though the preference for these indicates aspecialized way of sampling the acoustic scene.
Several species of beaked whales seem to have aspecies-specific inter-pulse interval �Zimmer et al., 2005;Johnson et al., 2006; McDonald et al., 2009� while other
delphinids do not show a species-specific inter-click intervalJ. Acoust. Soc. Am., Vol. 127, No. 6, June 2010 Baumann
but adapt it to their echolocation task �e.g., Verfuß et al.,2005, 2009�. Generally, all echolocating odontocetes prob-ably adjust their vocal behavior to environmental conditionsand optimize their echolocation temporally to a certain habi-tat and prey, similar to what is known for insectivorous bats�e.g., Schnitzler et al., 2003�.
There have been two sequences in the yearlong acousticdata recorded by the bottom-moored recorder that had a ter-minal buzz after a series of regularly spaced FM pulses,which likely originated from this species of beaked whale.The low number could be either due to the strong direction-ality of the click with sound pressure levels 20 dB lower thanFM pulses, or because the main foraging depth of the whaleswere at a different depth than the stationary recorder. Clickswith short inter-click intervals are either terminal buzzes dur-ing prey capture �e.g., Madsen et al., 2005; Verfuß et al.,2009� or burst pulses used in a social context �e.g., Lammerset al., 2006�. The sequences with short inter-click intervalsdescribed had a structure as expected for foraging namelywith a series of regularly spaced pulses followed by a termi-nal buzz and therefore prey capture attempts are more likelythan social calls. In several studies with beaked whales theemitted pulse and the returning echo were described throughrecordings obtained with a system attached to a diving andvocalizing animal. The inter-pulse intervals during searchphase were generally much longer than the two-way traveltime to the apparent target and inter-pulse intervals were inmost cases stable before a terminal buzz started �Madsen etal., 2005; Johnson et al., 2008�. Buzzes were characterizedby inter-click intervals in the range of 3 to 10 ms �Johnson etal., 2006�. The use of stable inter-pulse intervals in beakedwhales during prey capture before the terminal buzz wasinterpreted to be used for maintaining a broad view in amulti-target environment and low click rates would be ben-eficial for strong signals �Madsen et al., 2005�. The strongpreference of the Palmyra beaked whale for a certain inter-pulse interval, while emitting FM pulses, and inter-click in-tervals below 10 ms during the buzz support this theory foranother beaked whale species. The change in signal param-eters from a longer duration FM pulse to broadband, shortduration clicks during the buzz have previously been de-scribed for Blainville’s beaked whales �Johnson et al., 2006�.
V. CONCLUSIONS
The echolocation signals of the mesoplodont beakedwhale at Palmyra Atoll were spectrally and temporally dif-ferent to previously published FM pulse beaked whale sig-nals. The use of regularly spaced FM pulses and the switchto broadband clicks for the buzz, and with it probably preycapture, is a signal structural strategy already known for an-other beaked whale, Mesoplodon densirostris. Further inves-tigations should include photographs of adult males and bi-opsy samples to test the hypothesis that this species isMesoplodon hotaula. The signal description of this paper isthe basis for future analysis of diel and seasonal patterns ofthis species. It will give us insight into the natural behaviorof a beaked whale species in a pristine coral reef environ-
ment with little human impact.-Pickering et al.: Beaked whale echolocation at Palmyra Atoll 3797

ACKNOWLEDGMENTS
The authors thank two anonymous reviewers and M. A.McDonald for their helpful critique on versions of this pub-lication. We also thank X. Alvarez Mico, G. S. Campbell, M.Chitre, C. Garsha, N. Rubio, P. J. Seekings, M. Soldevilla, C.Speed, E. Taylor, K. P. Yeo, for fieldwork, gear and analysisassistance. Successful field work was only possible due tothe cooperative work of the staff of The Nature Conservancy,the Palmyra Atoll Research Consortium, and U. S. Fish andWildlife Service. This research was supported by FrankStone and Ernie Young of the Chief of Naval Operation-N45,Curt Collins of the Naval Postgraduate School, and JeffPolovina and Dave Johnston of the NOAA Pacific IslandsFisheries Science Center. Field work was conducted underUSFWS SUP No. 12533 and NMFS Permit 727-1915.
Akamatsu, T., Wang, D., Wang, K., and Naito, Y. �2005�. “Biosonar behav-ior of free-ranging porpoises,” Proc. R. Soc. London, Ser. B 272, 797–801.
Au, W. W. L. �1993�. The Sonar of Dolphins �Springer, New York, NY�.Au, W. W. L., Floyd, R. W., and Haun, J. E. �1978�. “Propagation of Atlantic
bottlenose dolphin echolocation signals,” J. Acoust. Soc. Am. 64, 411–422.
Bracewell, R. N. �2000�. The Fourier Transform and Its Applications, 3rded. �McGraw-Hill, New York�.
Caldwell, D. K., and Caldwell, M. C. �1971�. “Sounds produced by two rarecetaceans stranded in Florida,” Cetology 4, 1–5.
Dalebout, M. L., Baker, C. S., Steel, D., Robertson, K. M., Chivers, S. J.,Perrin, W. F., Mead, J. G., Grace, R. V., and Schofield, T. D., Jr. �2007�.“A divergent mtDNA lineage among Mesoplodon beaked whales: Molecu-lar evidence for a new species from the tropical Pacific?,” Marine Mam-mal Sci. 23, 954–966.
Dalebout, M. L., Mead, J. G., Baker, C. S., Baker, A. N., and Van Helden,A. L. �2002�. “A new species of beaked whale Mesoplodon perrini sp. n.�Cetacea: Ziphidae� discovered through phylogenetic analyses of mito-chondrial DNA sequences,” Marine Mammal Sci. 18, 577–608.
Dawson, S., Barlow, J., and Ljungblad, D. �1998�. “Sounds recorded fromBaird’s beaked whales, Berardius bairdii,” Marine Mammal Sci. 14, 335–344.
Deraniyagala, P. E. P. �1963a�. “A new beaked whale from Ceylon. Govern-ment information bulletin,” Ceylon Today 12, 13–14.
Deraniyagala, P. E. P. �1963b�. “Mass mortality of the new subspecies ofLittle Piked Whale Balaenoptera acutorostrarta thalmaha and a newbeaked whale Mesoplodon hotaula from Ceylon,” Spolia Zeylanica 30,79–84.
Frantzis, A. �1998�. “Does acoustic testing strand whales?,” Nature �Lon-don� 392, 29.
Gillespie, D., Dunn, C., Gordon, J., Claridge, D., Embling, C., and Boyd, I.�2009�. “Field recordings of Gervais’ beaked whales Mesoplodon euro-paeus from the Bahamas,” J. Acoust. Soc. Am. 125, 3428–3433.
Griffin, D. R., Webster, F. A., and Michael, C. R. �1960�. “The echolocationof flying insects by bats,” Anim. Behav. 8, 141–154.
Hooker, S. K., and Whitehead, H. �2002�. “Click characteristics of northernbottlenose whales �Hyperoodon ampullatus�,” Marine Mammal Sci. 18,69–80.
Huang, X., Acero, A., and Hon, H. W. �2001�. Spoken Language Processing�Prentice-Hall, Upper Saddle River, NJ�.
Jefferson, T. A., Webber, M. A., and Pitman, R. L. �2008�. Marine Mammalsof the World—A Comprehensive Guide to Their Identification �Elsevier,London�.
Jepson, P. D., Arbelo, M., Deaville, R., Patterson, I. A. P., Castro, P., Baker,J. R., Degollada, E., Ross, H. M., Herráez, P., Pocknell, A. M., Rodríguez,F., Howie, F. E., Espinosa, A., Reid, R. J., Jaber, J. R., Martin, V., Cun-ningham, A. A., and Fernández, A. �2003�. “Gas-bubble lesions instranded cetaceans,” Nature �London� 425, 575–576.
Johnson, M., Hickmott, L. S., Aguilar de Soto, N., and Madsen, P. T. �2008�.“Echolocation behavior adapted to prey in foraging Blainville’s beakedwhale �Mesoplodon densirostris�,” Proc. R. Soc. London, Ser. B 275, 133–139.
Johnson, M., Madsen, P. T., Zimmer, W. M. X., Aguilar de Soto, N., and
3798 J. Acoust. Soc. Am., Vol. 127, No. 6, June 2010 Ba
Tyack, P. L. �2004�. “Beaked whales echolocate on prey,” Proc. R. Soc.London, Ser. B 271, S383–S386.
Johnson, M., Madsen, P. T., Zimmer, W. M. X., Aguilar de Soto, N., andTyack, P. L. �2006�. “Foraging Blainville’s beaked whales �Mesoplodondensirostris� produce distinct click types matched to different phases ofecholocation,” J. Exp. Biol. 209, 5038–5050.
Johnson, M. P., and Tyack, P. L. �2003�. “A digital acoustic recording tag formeasuring the response of wild marine mammals to sound,” IEEE J.Ocean. Eng. 28, 3–12.
Johnston, D. W., McDonald, M., Polovina, J., Domokos, R., Wiggins, S.,and Hildebrand, J. �2008�. “Temporal patterns in the acoustic signals ofbeaked whales at Cross Seamount,” Biol. Lett. 4, 208–211.
Jones, B. A., Stanton, T. K., Lavery, A. C., Johnson, M. P., Tyack, P., andMadsen, P. T. �2008�. “Classification of broadband echoes from prey of aforaging Blainville’s beaked whale,” J. Acoust. Soc. Am. 123, 1753–1762.
Kaiser, J. F. �1990�. “On a simple algorithm to calculate the ‘energy’ of asignal,” Proceedings of the IEEE ICASSP, Albuquerque, NM, pp. 381–384.
Kalko, E. K. V., and Schnitzler, H.-U. �1989�. “The echolocation and hunt-ing behavior of Daubenton’s bat, Myotis daubentoni,” Behav. Ecol. Socio-biol. 24, 225–238.
Kandia, V., and Stylianou, Y. �2006�. “Detection of sperm whale clicksbased on the Teager-Kaiser energy operator,” Appl. Acoust. 67, 1144–1163.
Kastelein, R., Schooneman, N. M., Au, W. W. L., Verboom, W. C., andVaughan, N. �1997�. “The ability of a harbour porpoise �Phocoena phoc-oena� to discriminate between objects buried in sand,” in The Biology ofthe Harbour Porpoise, edited by A. J. Read, P. R. Wiepkema, and P. E.Nachtigall �De Spil, Woerden�, pp. 329–342.
Kastelein, R. A., Au, W. W. L., Rippe, H. T., and Schooneman, N. M.�1999�. “Target detection by an echolocating harbour porpoise �Phocoenaphocoena�,” J. Acoust. Soc. Am. 105, 2493–2498.
Lammers, M. O., and Castellote, M. �2009�. “The beluga whale producestwo pulses to form its sonar signal,” Biol. Lett. 5, 297–301.
Lammers, M. O., Schotten, M., and Au, W. W. L. �2006�. “The spatialcontext of free-ranging Hawaiian spinner dolphins �Stenella longirostris�producing acoustic signals,” J. Acoust. Soc. Am. 119, 1244–1250.
Lynn, S. K., and Reiss, D. L. �1992�. “Pulse sequence and whistle produc-tion by two captive beaked whales Mesoplodon species,” Marine MammalSci. 8, 299–305.
MacLeod, C. D., Perrin, W. F., Pitman, R. L., Barlow, J., Ballance, L.,D’Amico, A., Gerrodette, T., Joyce, G., Mullin, K. D., Palka, D. L., andWaring, G. T. �2006�. “Known and inferred distributions of beaked whalespecies �Cetacea: Ziphiidae�,” J. Cetacean Res. Manage 7, 271–286.
Madsen, P. T., Johnson, M., Aguilar de Soto, N., Zimmer, W. M. X., andTyack, P. L. �2005�. “Biosonar performance of foraging beaked whales�Mesoplodon densirostris�,” J. Exp. Biol. 208, 181–194.
Madsen, P. T., Payne, R., Kristiansen, N. U., Wahlberg, M., Kerr, I., andMøhl, B. �2002�. “Sperm whale sound production studied with ultrasoundtime/depth-recording tags,” J. Exp. Biol. 205, 1899–1906.
McDonald, M. A., Hildebrand, J. A., Wiggins, S. M., Johnston, D. W., andPolovina, J. J. �2009�. “An acoustic survey of beaked whales at CrossSeamount near Hawaii,” J. Acoust. Soc. Am. 125, 624–627.
Melcón, M. L., Denzinger, A., and Schnitzler, H.-U. �2007�. “Aerial hawk-ing and landing: Approach behavior in Natterer’s bats, Myotis nattereri�Kuhl 1818�,” J. Exp. Biol. 210, 4457–4464.
Miller, L. A., Pristed, J., Møhl, B., and Surlykke, A. �1995�. “The click-sounds of narwhals �Monodon monoceros� in Inglefield Bay, NorthwestGreenland,” Marine Mammal Sci. 11, 491–502.
Miller, L. A., and Surlykke, A. �2001�. “How some insects detect and avoidbeing eaten by bats: Tactics and countertactics of prey and predator,”Bioscience 51, 570–581.
Miller, P. J. O., Johnson, M. P., and Tyack, P. L. �2004�. “Sperm whalebehavior indicates the use of echolocation click buzzes ‘creaks’ in preycapture,” Proc. R. Soc. London, Ser. B 271, 2239–2247.
Moore, J. C., and Gilmore, R. M. �1965�. “A beaked whale new to thewestern hemisphere,” Nature �London� 205, 1239–1240.
Pitman, R. L. �2008�. “Mesoplodont whales �Mesoplodon spp.�,” in Ency-clopedia of Marine Mammals, 2nd ed., edited by W. F. Perrin, B. Würsig,and J. G. M. Thewissen �Academic, San Diego, CA�, pp. 721–726.
Rankin, S., and Barlow, J. �2007�. “Sounds recorded in the presence ofBlainville’s beaked whales, Mesoplodon densirostris, near Hawaii,” J.Acoust. Soc. Am. 122, 42–45.
Reyes, J. C., Mead, J. G., and Van Waerebeek, K. �1991�. “A new species of
umann-Pickering et al.: Beaked whale echolocation at Palmyra Atoll

beaked whale Mesoplodon peruvianus sp. n. �Cetacea: Ziphiidae� fromPeru,” Marine Mammal Sci. 7, 1–24.
Richardson, W. J., Greene, C. R., Jr., Malme, C. I., and Thomson, D. H.�1995�. Marine Mammals and Noise �Academic, San Diego, CA�.
Rogers, T., and Brown, S. �1999�. “Acoustic observations of Arnoux’sbeaked whale �Berardius arnuxii� off Kemp Land, Antarctica,” MarineMammal Sci. 15, 192–198.
Schnitzler, H.-U., and Kalko, E. K. V. �1998�. “How echolocating batssearch and find food,” in Bat Biology and Conservation, edited by T. H.Kunz and P. A. Racey �Smithsonian Institution Press, Washington, DC�,pp. 183–196.
Schnitzler, H.-U., Moss, C. F., and Denzinger, A. �2003�. “From spatialorientation to food acquisition in echolocating bats,” Trends Ecol. Evol.18, 386–394.
Simmonds, M. P., and Lopez-Jurado, L. F. �1991�. “Whales and the mili-tary,” Nature �London� 351, 448.
Soldevilla, M. S., Henderson, E. E., Campbell, G. S., Wiggins, S. M., Hilde-brand, J. A., and Roch, M. A. �2008�. “Classification of Risso’s and Pacificwhite-sided dolphins using spectral properties of echolocation clicks,” J.Acoust. Soc. Am. 124, 609–624.
Surlykke, A., Miller, L. A., Møhl, B., Andersen, B. B., Christensen-Dalsgaard, J., and Jorgensen, M. B. �1993�. “Echolocation in two very
J. Acoust. Soc. Am., Vol. 127, No. 6, June 2010 Baumann
small bats from Thailand: Craseonycteris thonglongyai and Myotis siligo-rensis,” Behav. Ecol. Sociobiol. 33, 1–12.
Tyack, P. L., Johnson, M., Aguilar de Soto, N., Sturlese, A., and Madsen, P.T. �2006�. “Extreme diving of beaked whales,” J. Exp. Biol. 209, 4238–4253.
Urick, R. J. �1983�. Principles of Underwater Sound �Peninsula, Los Altos,CA�.
Verfuß, U. K., Miller, L. A., Pilz, P. K. D., and Schnitzler, H.-U. �2009�.“Echolocation by two foraging harbour porpoises �Phocoena phocoena�,”J. Exp. Biol. 212, 823–834.
Verfuß, U. K., Miller, L. A., and Schnitzler, H.-U. �2005�. “Spatial orienta-tion in echolocating harbour porpoises �Phocoena phocoena�,” J. Exp.Biol. 208, 3385–3394.
Wiggins, S. M., and Hildebrand, J. A. �2007�. “High-frequency acousticrecording package �HARP� for broad-band, long-term marine mammalmonitoring,” in International Symposium on Underwater Technology 2007and International Workshop on Scientific Use of Submarine Cables andRelated Technologies 2007 �IEEE, Tokyo, Japan�, pp. 551–557.
Zimmer, W. M. X., Johnson, M., Madsen, P. T., and Tyack, P. L. �2005�.“Echolocation clicks of free-ranging Cuvier’s beaked whales �Ziphiuscavirostris�,” J. Acoust. Soc. Am. 117, 3919–3927.
-Pickering et al.: Beaked whale echolocation at Palmyra Atoll 3799