Embed Size (px)
Citation preview
U.S. Department of Commerce | National Oceanic and Atmospheric Administration | National Marine Fisheries Service
Papahānaumokuākea Marine National Monument Marine Debris Student Worksheet ANSWER KEY
Name______________________________________ Date__________________________________________
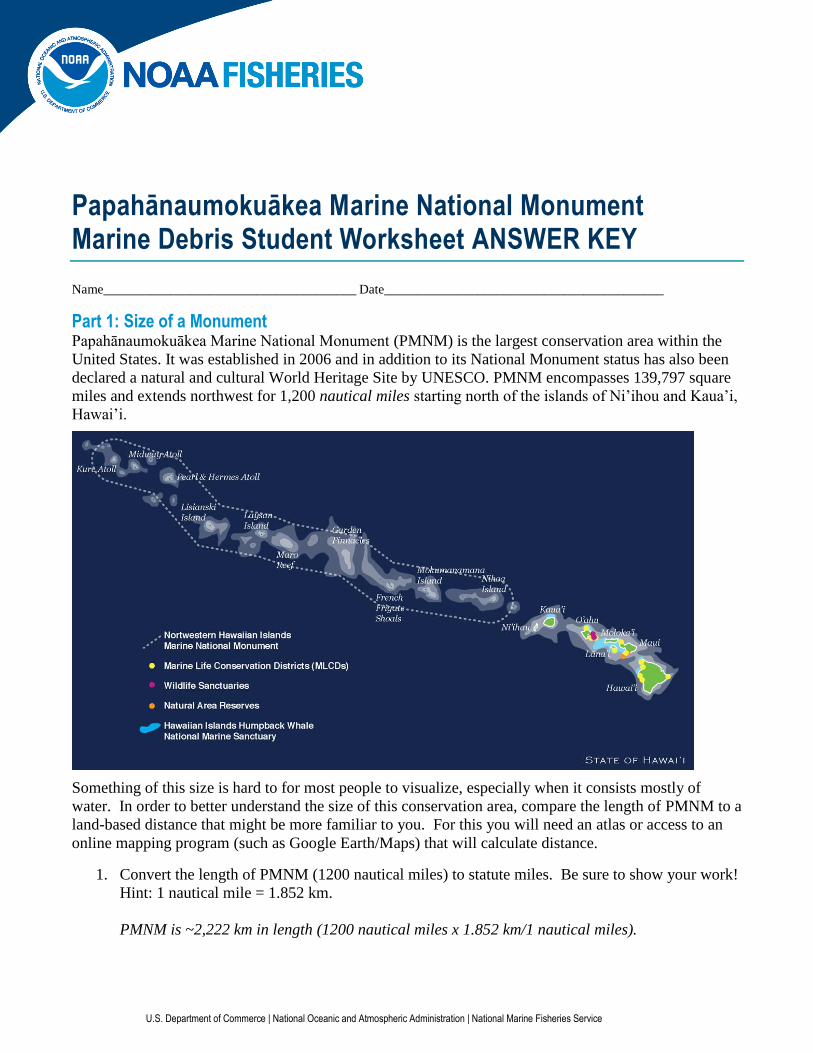
Part 1: Size of a Monument Papahānaumokuākea Marine National Monument (PMNM) is the largest conservation area within the
United States. It was established in 2006 and in addition to its National Monument status has also been
declared a natural and cultural World Heritage Site by UNESCO. PMNM encompasses 139,797 square
miles and extends northwest for 1,200 nautical miles starting north of the islands of Ni’ihou and Kaua’i,
Hawai’i.
Something of this size is hard to for most people to visualize, especially when it consists mostly of
water. In order to better understand the size of this conservation area, compare the length of PMNM to a
land-based distance that might be more familiar to you. For this you will need an atlas or access to an
online mapping program (such as Google Earth/Maps) that will calculate distance.
1. Convert the length of PMNM (1200 nautical miles) to statute miles. Be sure to show your work!
Hint: 1 nautical mile = 1.852 km.
PMNM is ~2,222 km in length (1200 nautical miles x 1.852 km/1 nautical miles).
P a g e 2 | 12
U.S. Department of Commerce | National Oceanic and Atmospheric Administration | National Marine Fisheries Service
Marine National Monument Program | Papahānaumokuākea Marine National Monument
2. Using an atlas or Google Earth/Maps, find a distance between two points that is comparable to
the length of PMNM. What are those two points?
PMNM covers about the same distance in length as the distance from Vancouver, BC and San
Diego, CA, USA. Huge!!
3. How many states and or countries does your land-based calculated distance cross?
The goal is to get students to really grasp the enormous size of Papahānaumokuākea. In the
above example this distance covers parts of two countries and three states. PMNM is the size of
the entire west coast of the US.
4. What might be some issues with trying to manage an area the size of PMNM?
Answers will vary but reasonable thoughts might include issues of managing access, doing any
kind of effective policing, rescue operations, know who and what is actually in PMNM, etc…..
P a g e 3 | 12
U.S. Department of Commerce | National Oceanic and Atmospheric Administration | National Marine Fisheries Service
Marine National Monument Program | Papahānaumokuākea Marine National Monument
Part 2: Marine debris on the move
Surprisingly, one of the significant issues in PMNM is trash. This is particularly striking since there are
no permanent human residents in PMNM. Almost all the trash found in Papahānaumokuākea is
generated outside PMNM and introduced into PMNM by visitors, fishing boats and ocean currents in the
form of marine debris. Whether through ocean dumping, loss of fishing gear, or litter being washed out
to sea in rivers, all the countries in and around the Pacific Ocean are possible sources of marine debris.
In order to determine how marine debris moves around in the ocean scientists create models of ocean
surface currents and track how debris particles move over long periods of time. Today we will make use
of one of these models to investigate where marine debris in Papahānaumokuākea may have originated.
Directions: Using a computer with internet access, navigate to www.adrift.org.au and locate
Papahānaumokuākea (note you can click and drag the map to reposition). Next, spend some time
exploring possible sources of marine debris to PMNM.
1. List five countries in the Pacific region that are modeled to be sources of marine debris to
PMNM.
US, Canada, Mexico, all Central American countries, Japan, Korea, China, most of southeast
Asia
2. List three countries in the Pacific region that are not modeled to be sources of marine debris to
PMNM.
Chile, New Zealand, Tasmania, Peru, and most of Australia
P a g e 4 | 12
U.S. Department of Commerce | National Oceanic and Atmospheric Administration | National Marine Fisheries Service
Marine National Monument Program | Papahānaumokuākea Marine National Monument
3. What are other likely sources of marine debris to PMNM besides the countries you listed above?
Debris from ships at sea (cruise ships, tankers, navy, etc) and derelict fishing gear are also big
sources of marine debris.
4. What are some ways we can prevent marine debris from impacting PMNM and waters closer to
home?
The primary way to keep marine debris from impacting Papahānaumokuākea and waters closer
to home is to prevent debris from entering water ways in the first place. Since much of the
marine debris comes directly from our waste stream, keeping trash out of the waste stream
altogether is important (reduce, reuse, recycle). In addition, anything that keeps trash from
accessing the water is beneficial. Proper disposal of trash at home, school, beaches, parks and
playgrounds is essential. Supporting dedicated public trash and recycling bins, keeping trash
out of open spaces such as streets, sidewalks, parking lots and storm drains, and participating in
and organizing cleanups will all help reduce the amount of marine debris. In addition,
supporting legislation that changes the way we handle waste on a local, state and national level
will help stem the marine debris problem.
P a g e 5 | 12
U.S. Department of Commerce | National Oceanic and Atmospheric Administration | National Marine Fisheries Service
Marine National Monument Program | Papahānaumokuākea Marine National Monument
Part 3: Beach Walk Now that you have determined where some of the marine debris might be coming from, it will be
important to determine what types of marine debris are actually ending up in PMNM. Unfortunately
getting to the islands to survey marine debris is both time consuming and expensive. When faced with
situations similar to this, scientists will often turn to remote sensing techniques to gather data. These
techniques allow data to be collected about an object or an environment without the scientist being
physically present. Probably the oldest and most well-known form of remote sensing is photography,
but other techniques include sonar imaging (radar), multispectral imaging, infrared sensing, and satellite
observations, to name just a few. Today we will make use of a series of photographs taken in PMNM to
try and determine what types of marine debris actually end up in PMNM.
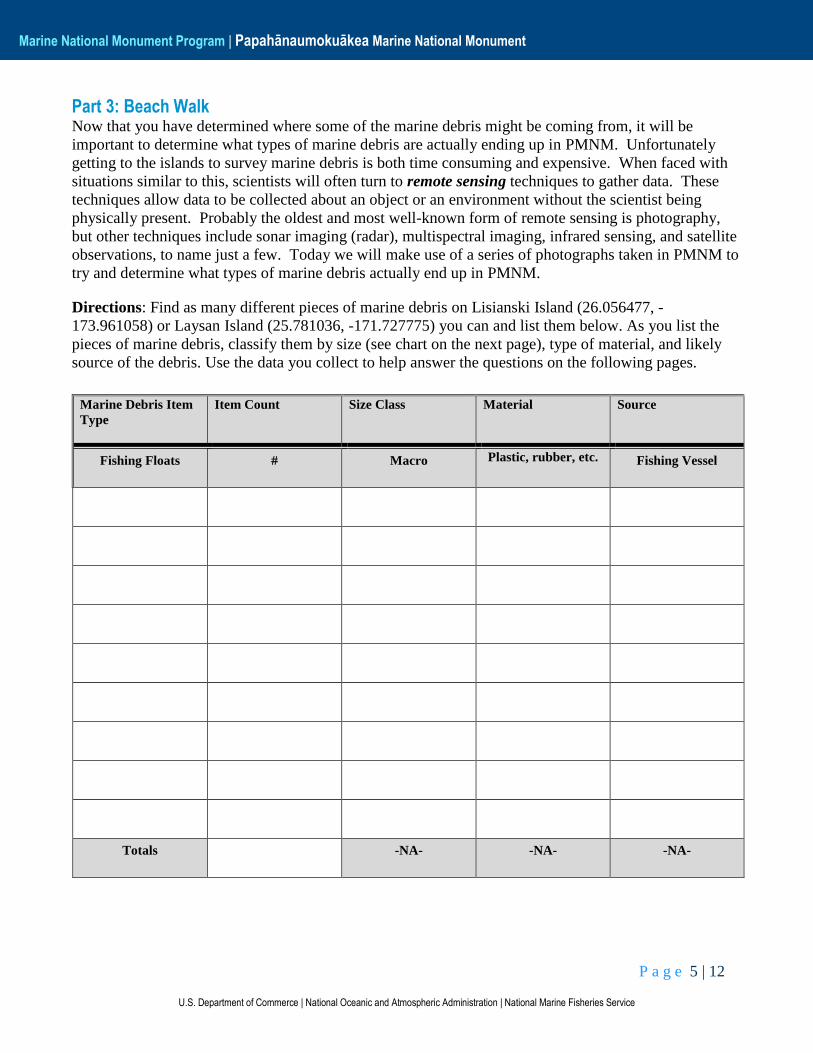
Directions: Find as many different pieces of marine debris on Lisianski Island (26.056477, -
173.961058) or Laysan Island (25.781036, -171.727775) you can and list them below. As you list the
pieces of marine debris, classify them by size (see chart on the next page), type of material, and likely
source of the debris. Use the data you collect to help answer the questions on the following pages.
Marine Debris Item
Type
Item Count Size Class Material Source
Fishing Floats # Macro Plastic, rubber, etc. Fishing Vessel
Totals -NA- -NA- -NA-
P a g e 6 | 12
U.S. Department of Commerce | National Oceanic and Atmospheric Administration | National Marine Fisheries Service
Marine National Monument Program | Papahānaumokuākea Marine National Monument
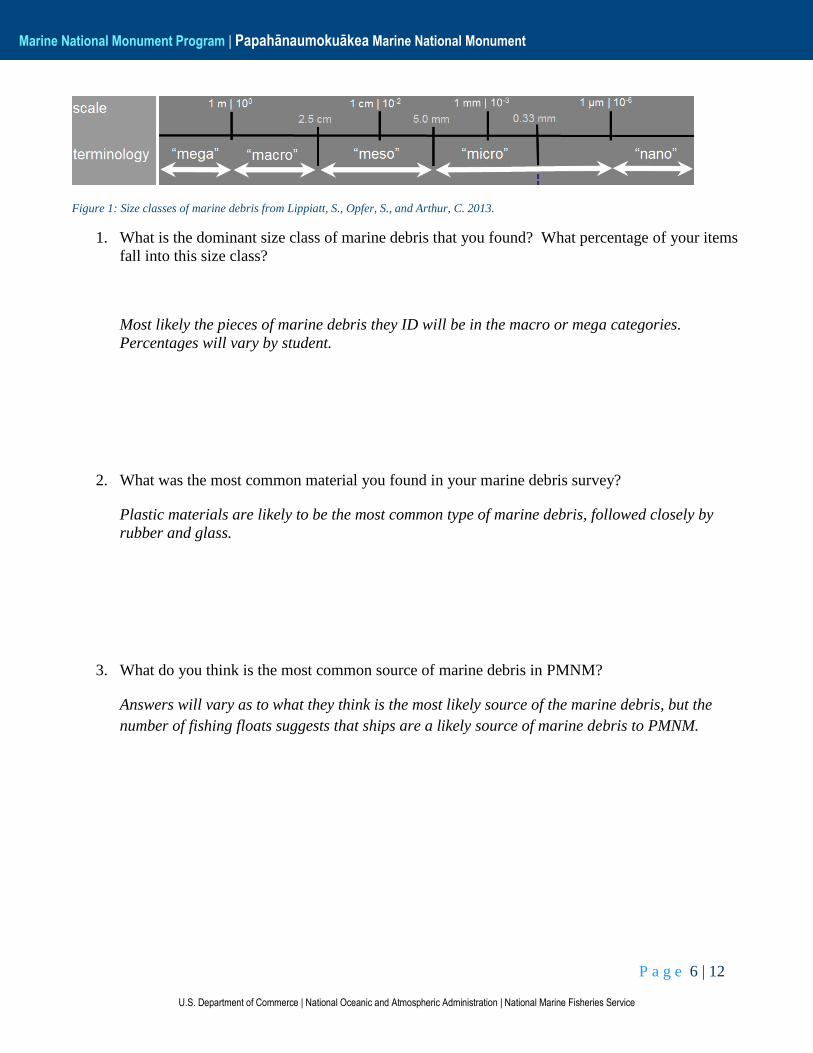
Figure 1: Size classes of marine debris from Lippiatt, S., Opfer, S., and Arthur, C. 2013.
1. What is the dominant size class of marine debris that you found? What percentage of your items
fall into this size class?
Most likely the pieces of marine debris they ID will be in the macro or mega categories.
Percentages will vary by student.
2. What was the most common material you found in your marine debris survey?
Plastic materials are likely to be the most common type of marine debris, followed closely by
rubber and glass.
3. What do you think is the most common source of marine debris in PMNM?
Answers will vary as to what they think is the most likely source of the marine debris, but the
number of fishing floats suggests that ships are a likely source of marine debris to PMNM.
P a g e 7 | 12
U.S. Department of Commerce | National Oceanic and Atmospheric Administration | National Marine Fisheries Service
Marine National Monument Program | Papahānaumokuākea Marine National Monument
Part 4: Characteristics of marine debris Compare your data with another group of students. As a group discuss and answer the following
questions.
1. What characteristics make a material very likely to become marine debris? Does the most
common material in your survey have all of these properties?
Material very likely to become marine debris are typically strong, able to float, resistant
to degradation by the sun, and of a size that is easily transportable by the body of water
they enter (ie plastic bottles are easier to move downstream then abandoned cars).
2. What sizes of marine debris did you NOT find in your visual survey? Where do you think this
size of marine debris might be in the environment? How might you go about counting this size
of marine debris?
The size of marine debris that is unlikely to be found in this visual survey is anything in
the “micro” or “nano” category. This debris is present in the environment and mixes
well with the sand. It is also very prevalent in the oceans where larger scale marine
debris is rarer. This video is useful for understanding where and how this small scale
marine debris collects in the ocean.
http://www.youtube.com/watch?feature=player_embedded&v=IZ27jWzbIU0.
3. List some major impacts (both positive and negative) of marine debris in the environment.
Hazards associated with marine debris certainly outweigh the benefits. Some of the well-
known concerns include entanglement, ingestion, chemical leaching, smothering reefs,
and general environmental blight. Interestingly, for some species there may be some
benefits including transportation, breeding habitat, new food sources (bacterial) and
protection. This is an excellent time to foster discussion about the human impact on
ocean ecosystems.
P a g e 8 | 12
U.S. Department of Commerce | National Oceanic and Atmospheric Administration | National Marine Fisheries Service
Marine National Monument Program | Papahānaumokuākea Marine National Monument
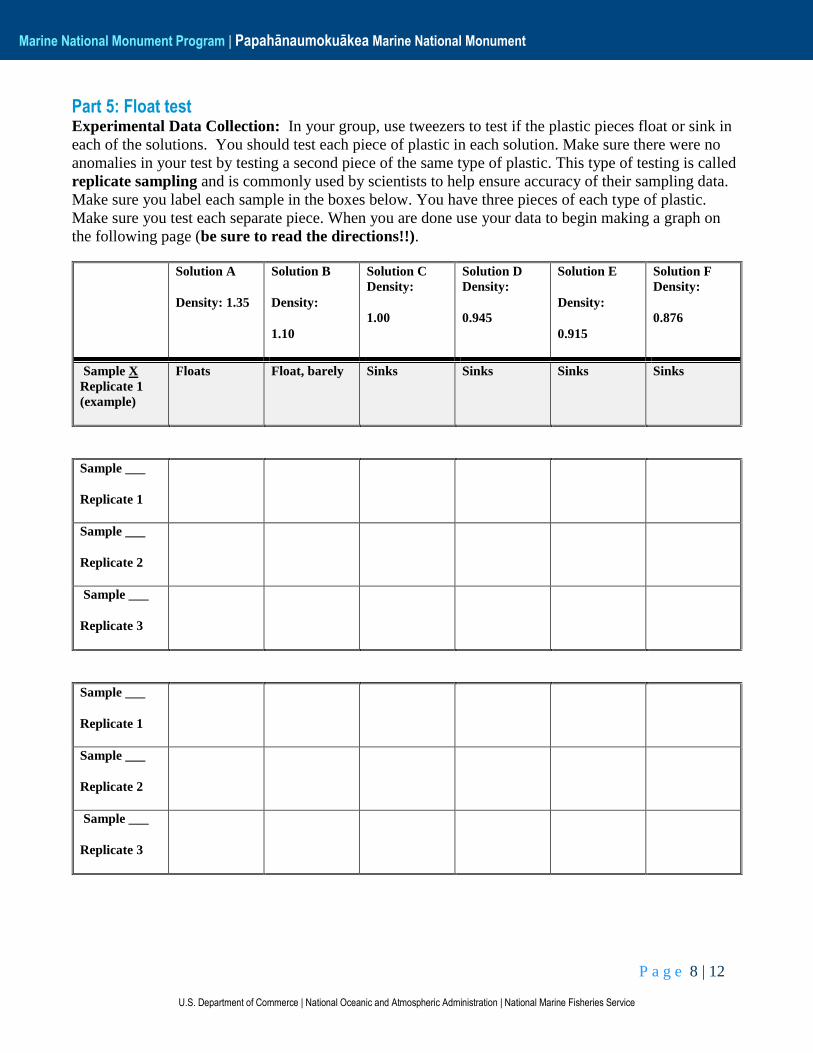
Part 5: Float test Experimental Data Collection: In your group, use tweezers to test if the plastic pieces float or sink in
each of the solutions. You should test each piece of plastic in each solution. Make sure there were no
anomalies in your test by testing a second piece of the same type of plastic. This type of testing is called
replicate sampling and is commonly used by scientists to help ensure accuracy of their sampling data.
Make sure you label each sample in the boxes below. You have three pieces of each type of plastic.
Make sure you test each separate piece. When you are done use your data to begin making a graph on
the following page (be sure to read the directions!!).
Solution A
Density: 1.35
Solution B
Density:
1.10
Solution C
Density:
1.00
Solution D
Density:
0.945
Solution E
Density:
0.915
Solution F
Density:
0.876
Sample X
Replicate 1
(example)
Floats Float, barely Sinks Sinks Sinks Sinks
Sample ___
Replicate 1
Sample ___
Replicate 2
Sample ___
Replicate 3
Sample ___
Replicate 1
Sample ___
Replicate 2
Sample ___
Replicate 3
P a g e 9 | 12
U.S. Department of Commerce | National Oceanic and Atmospheric Administration | National Marine Fisheries Service
Marine National Monument Program | Papahānaumokuākea Marine National Monument
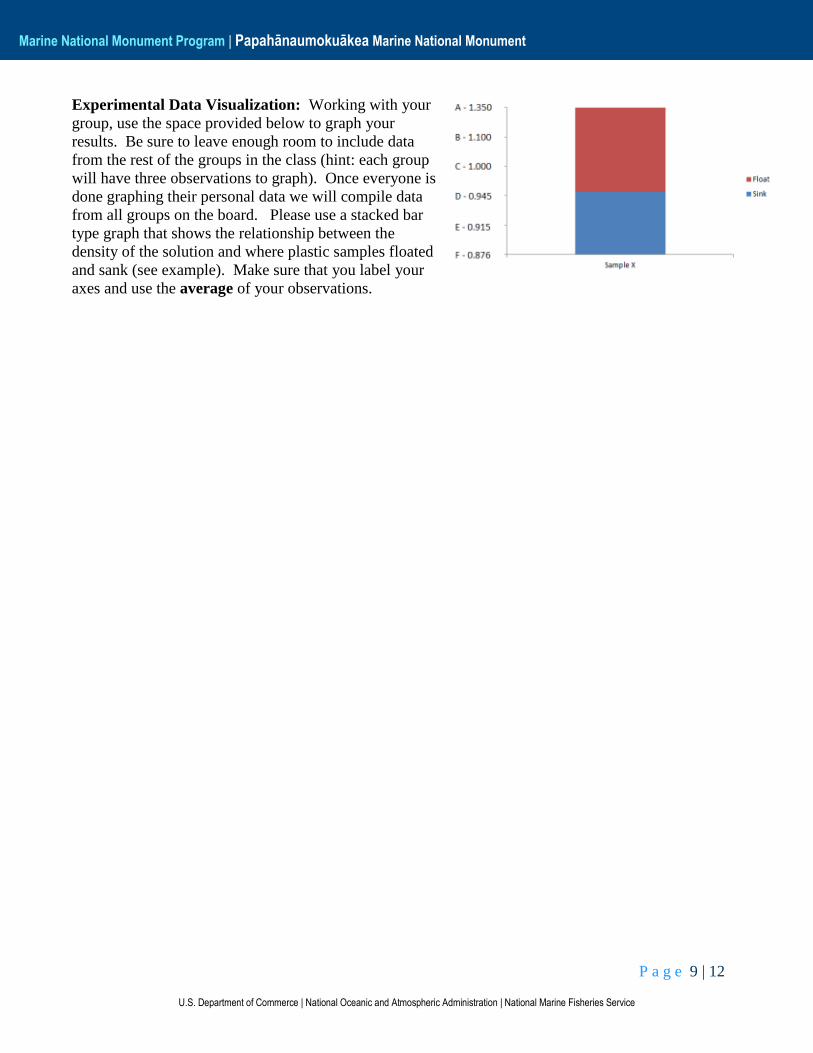
Experimental Data Visualization: Working with your
group, use the space provided below to graph your
results. Be sure to leave enough room to include data
from the rest of the groups in the class (hint: each group
will have three observations to graph). Once everyone is
done graphing their personal data we will compile data
from all groups on the board. Please use a stacked bar
type graph that shows the relationship between the
density of the solution and where plastic samples floated
and sank (see example). Make sure that you label your
axes and use the average of your observations.
P a g e 10 | 12
U.S. Department of Commerce | National Oceanic and Atmospheric Administration | National Marine Fisheries Service
Marine National Monument Program | Papahānaumokuākea Marine National Monument
Experimental Data Explanation: Use your data and the class data to answer the following questions.
Work with your partner to complete the worksheet.
1. What property of the plastic do you think is responsible for which pieces float and which ones
sink?
The goal with this question is to get the student to describe how some plastics are denser than
others. They will probably describe this in terms of floating and sinking.
2. If the plastic pieces you tested were 100 times bigger, would your results be different? Why or
why not?
This question is to re-enforce the concept that density is an intrinsic property, meaning it will be
the same regardless of size of the piece of plastic. However, the shape that plastic takes may
alter the apparent density. For example, a plastic water bottle which is made of PETE
(polyethelyene tetraphalate) has a density of 1.38-1.39 g/ml, which means it should sink in both
fresh (1.00 g/ml) and salt water (1.025 g/ml) and yet because the closed bottle traps air it will
float for long distances on the open ocean. When weathering finally breaks the plastic down and
allows water inside the bottle the density of the plastic alone will now control the buoyancy and
at this point it will sink out of the surface water.
3. Based on your tests, what are the density ranges of your samples? Based on that density range,
what type of plastic (by recycle code) is your unknown plastic?
Answers will vary depending on the samples. However, the main concept the students
should understand that they are not able to determine an exact density for their plastic
sample, only that their plastic falls within a range of densities.
P a g e 11 | 12
U.S. Department of Commerce | National Oceanic and Atmospheric Administration | National Marine Fisheries Service
Marine National Monument Program | Papahānaumokuākea Marine National Monument
4. If you were told that solution C was fresh water, given what you know from your tests, which
plastics (by recycling codes) are most likely to end up in the marine environment? Why do you
think that?
The goal here is to have the students use their collected data (from the whole group) to
understand that any plastic that floats in fresh water is likely to end up in the ocean, but the
plastics that sink in fresh water will not get there as easily. Analysis of surface plastic from the
Atlantic Ocean indicates that the vast majority of plastic that ends up in sea surface collections
are made of polypropylene and polyethylene, both which are less dense than freshwater. By
contrast, almost no polyethylene terephthalate (PETE) was found in surface collections, though
PETE forms a significant portion of plastic debris on beaches (Morét-Ferguson et al., 2010).
5. What physical property of the plastic could change naturally in the marine environment that
might cause plastic pieces to sink out of the surface water?
This question is trying to drive home the idea that density of the plastic relative to the seawater is
controlling if the plastics float or not. Changes to the density, therefore, will determine if the
pieces remain floating or if they will eventually settle out of surface waters. Removal from
surface waters does not eliminate the impacts of these plastic and they will continue to alter
benthic marine habitats and food webs while on the seafloor.
6. What do you think might naturally cause such a change?
Biofouling, which is the accumulation of micro-organisms, plants, algae and animals on a wet
surface, is very common on marine debris and will increase the density of the whole object
(plastic + biological organisms). Weathering breaks down plastics into smaller pieces which
more easily have their density altered by biofouling. Weathering may also eventually rupture
sealed containers that float as a consequence of displacement, at which point they will sink if the
density of plastic is greater than that of the surrounding water.
P a g e 12 | 12
U.S. Department of Commerce | National Oceanic and Atmospheric Administration | National Marine Fisheries Service
Marine National Monument Program | Papahānaumokuākea Marine National Monument
Part 6: Marine debris life cycle Create a life-cycle model for a piece of marine-debris that you found in Papahānaumokuākea. Be sure
to address the following: Where did the object enter the environment? How was the object transported to
Papahānaumokuākea? What processes impacted the object during its travels? What are potential impacts
of that marine debris to the environment? How was the object removed from the marine environment?
What is the likely fate of this marine debris? What potential impact could this marine debris have on
me? What potential impact can I have on marine debris?