Embed Size (px)
Citation preview
Echo TopsFairly accurate at depicting height of storm tops
Inaccurate data close to radar because there is no beam angle high enough to see tops.
Often has stair-stepped appearance due to uneven sampling of data between elevation
scans.
Precipitation Estimates
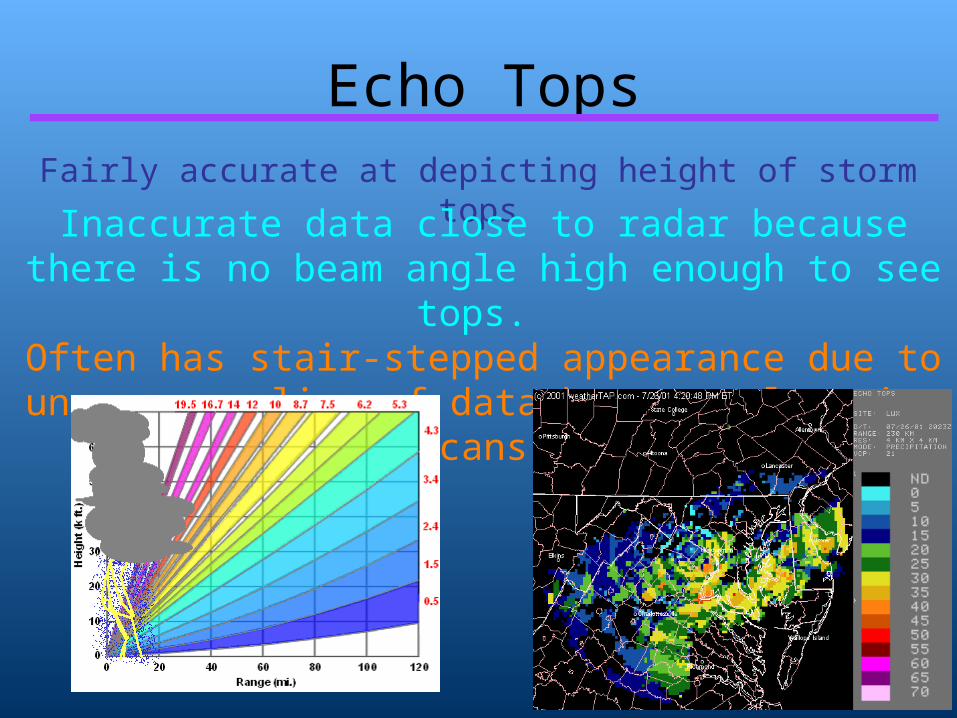
Storm Total Precipitation
●Total estimated accumulation for a set amount of time.●Resets storm total
whenever there is no rain detected for an hour.
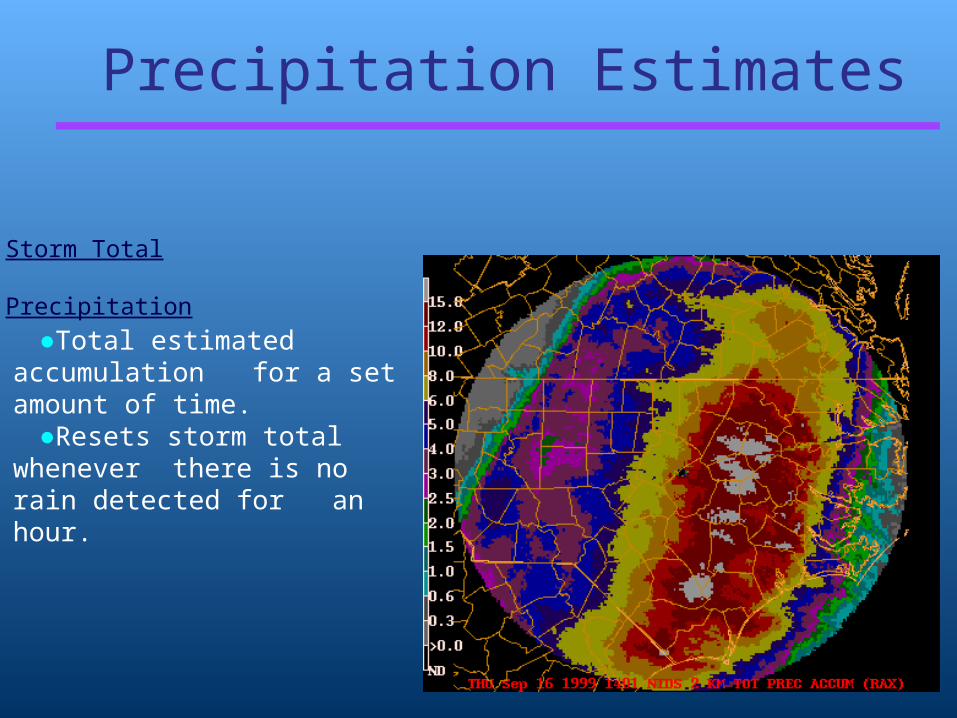
-Updated once per volume scan.-Shows accumulated rainfall for the last hour.-Useful for determining rainfall rate of ongoing convection.
One Hour Precipitation Total
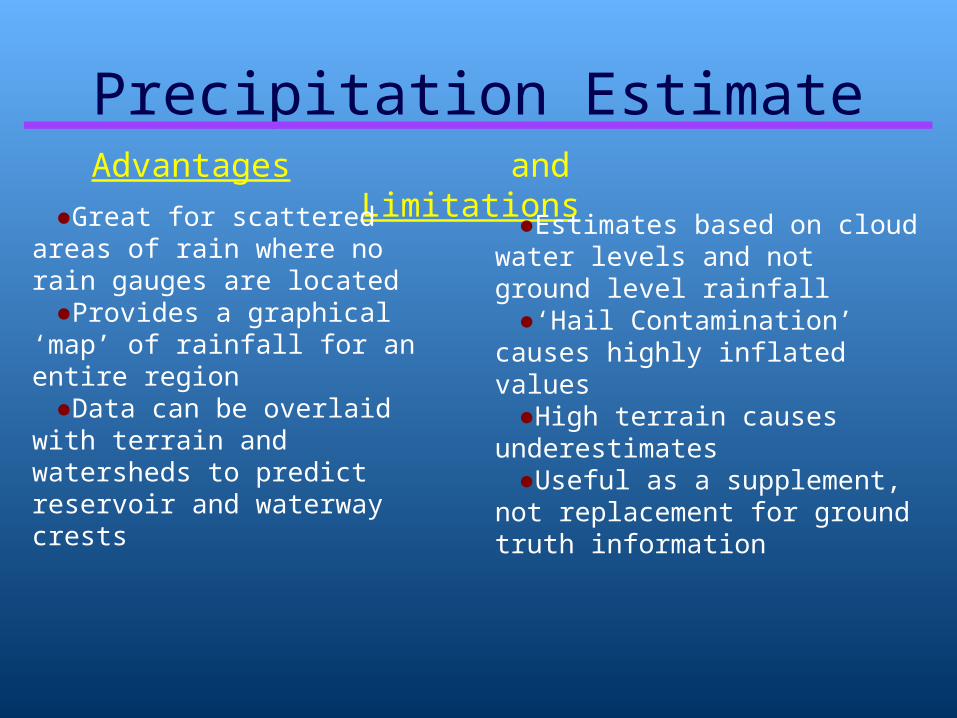
Precipitation EstimateAdvantages and Limitations
●Great for scattered areas of rain where no rain gauges are located
●Provides a graphical ‘map’ of rainfall for an entire region
●Data can be overlaid with terrain and watersheds to predict reservoir and waterway crests
●Estimates based on cloud water levels and not ground level rainfall
●‘Hail Contamination’ causes highly inflated values
●High terrain causes underestimates
●Useful as a supplement, not replacement for ground truth information
Interpreting Doppler Signatures
Display examples provided by:National Weather Service
Steve Davis - Lead ForecasterMilwaukee/Sullivan National
Weather Service Forecast Office
Range 0 120 nm(example)
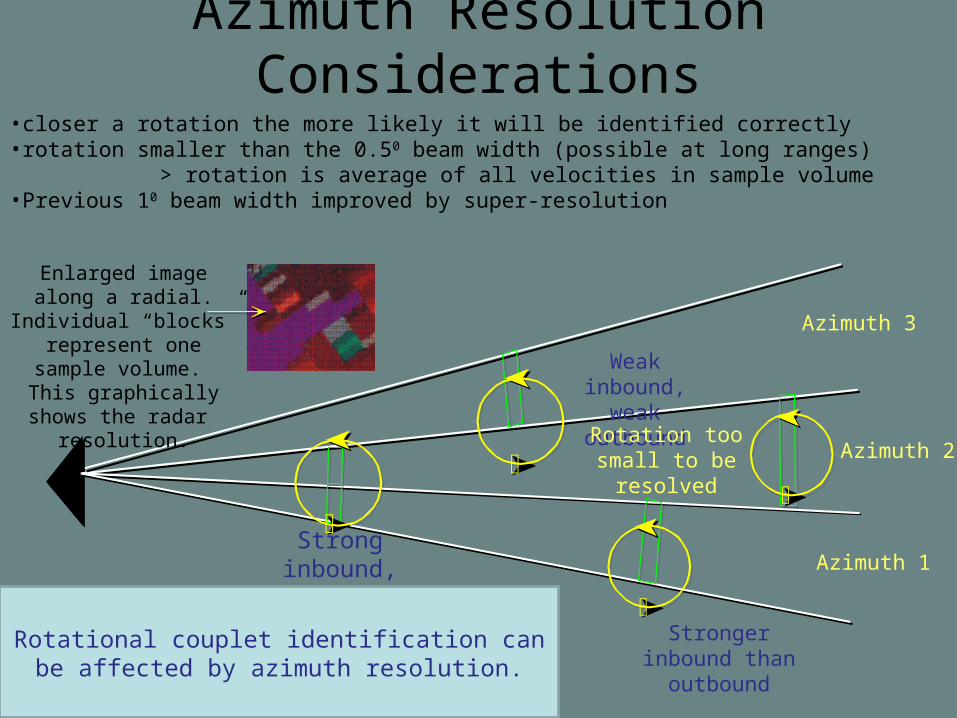
Weak inbound,
weak outboundRotation too
small to be resolved
Stronger inbound than
outbound
Strong inbound, strong
outbound
Azimuth 3
Azimuth 2
Azimuth 1
Enlarged image along a radial. Individual
“blocks” represent one sample
volume. This graphically shows the
radar resolution.
•closer a rotation the more likely it will be identified correctly •rotation smaller than the 0.50 beam width (possible at long ranges)
> rotation is average of all velocities in sample volume•Previous 10 beam width improved by super-resolution
Azimuth Resolution Considerations
Rotational couplet identification can be affected by azimuth resolution.
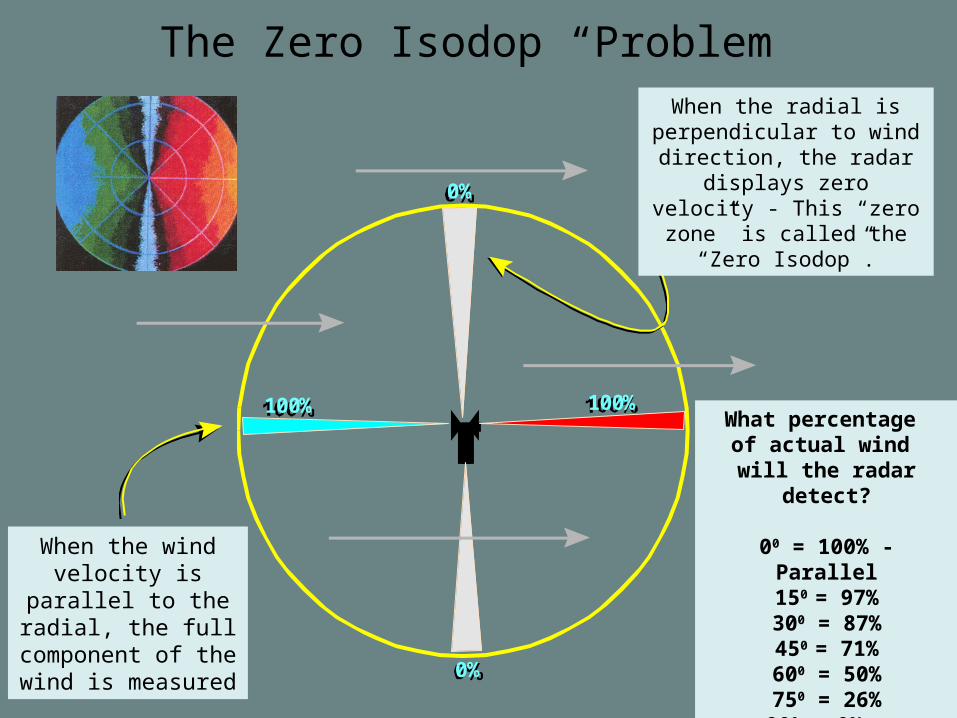
100% 100%
0%
0%
When the wind velocity is parallel to the radial, the full component of
the wind is measured
When the radial is perpendicular to wind direction, the radar
displays zero velocity - This “zero zone” is called
the “Zero Isodop”.
What percentage of actual wind will the radar
detect?
00 = 100% - Parallel150 = 97%300 = 87%450 = 71%600 = 50%750 = 26%900 = 0% -
Perpendicular
The Zero Isodop “Problem”
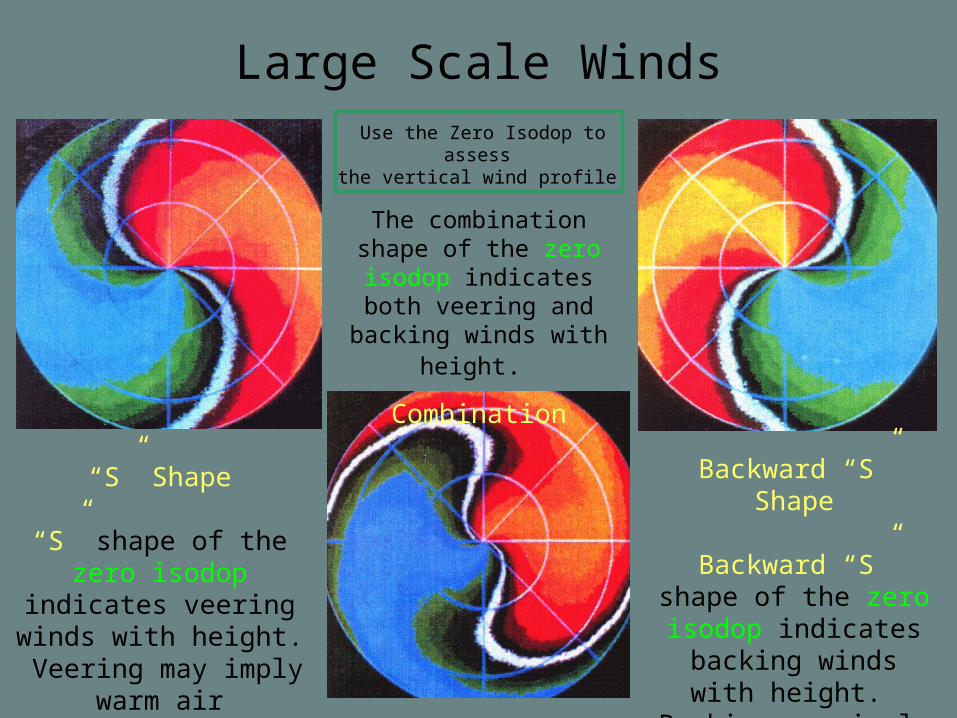
Large Scale Winds
“S” Shape
“S” shape of the zero isodop indicates
veering winds with height. Veering may
imply warm air advection.
The combination shape of the zero isodop
indicates both veering and backing winds with
height.
Combination
Backward “S” Shape
Backward “S” shape of the zero isodop indicates backing
winds with height. Backing may imply cold air advection.
Use the Zero Isodop to assess the vertical wind profile.
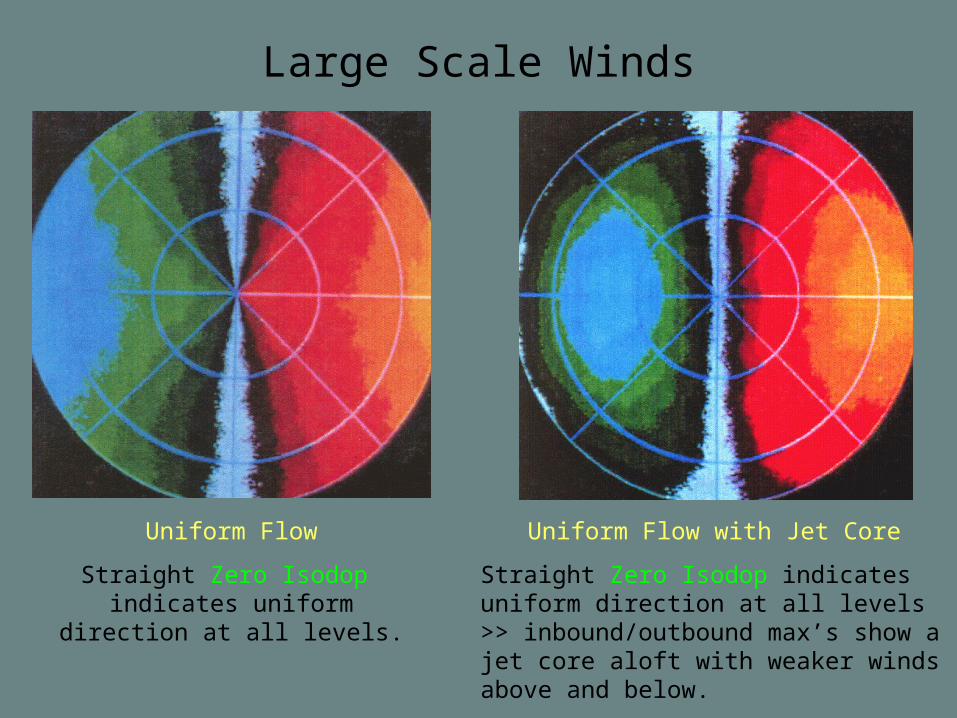
Large Scale Winds
Uniform Flow
Straight Zero Isodop indicates uniform direction at all levels.
Uniform Flow with Jet Core
Straight Zero Isodop indicates uniform direction at all levels >> inbound/outbound max’s show a jet core aloft with weaker winds above and below.
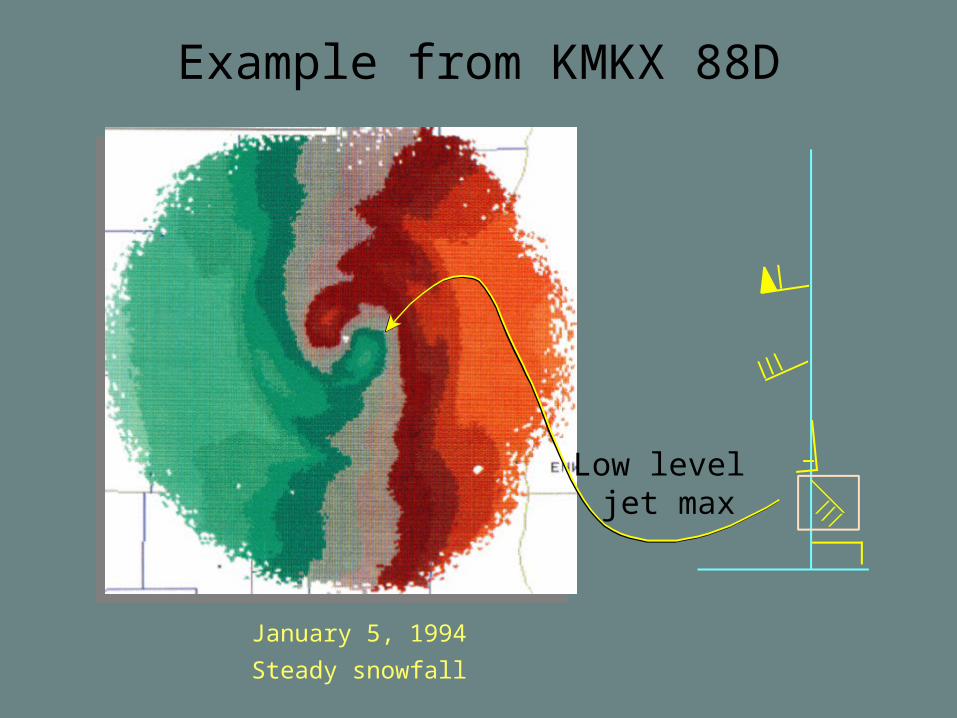
Example from KMKX 88D
Low level jet max
January 5, 1994
Steady snowfall
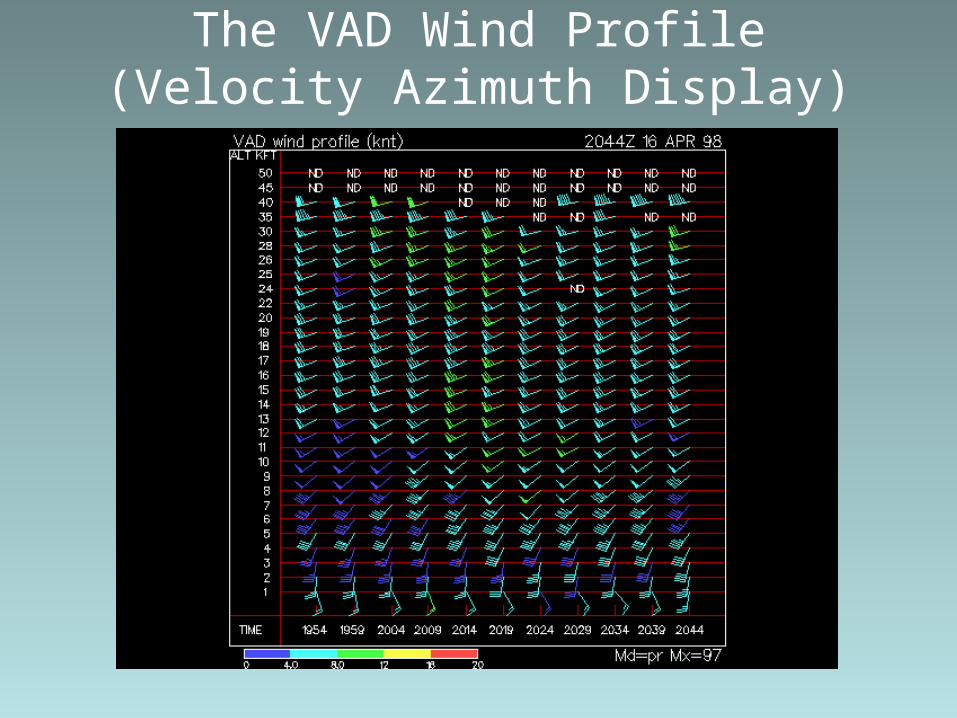
The VAD Wind Profile(Velocity Azimuth Display)
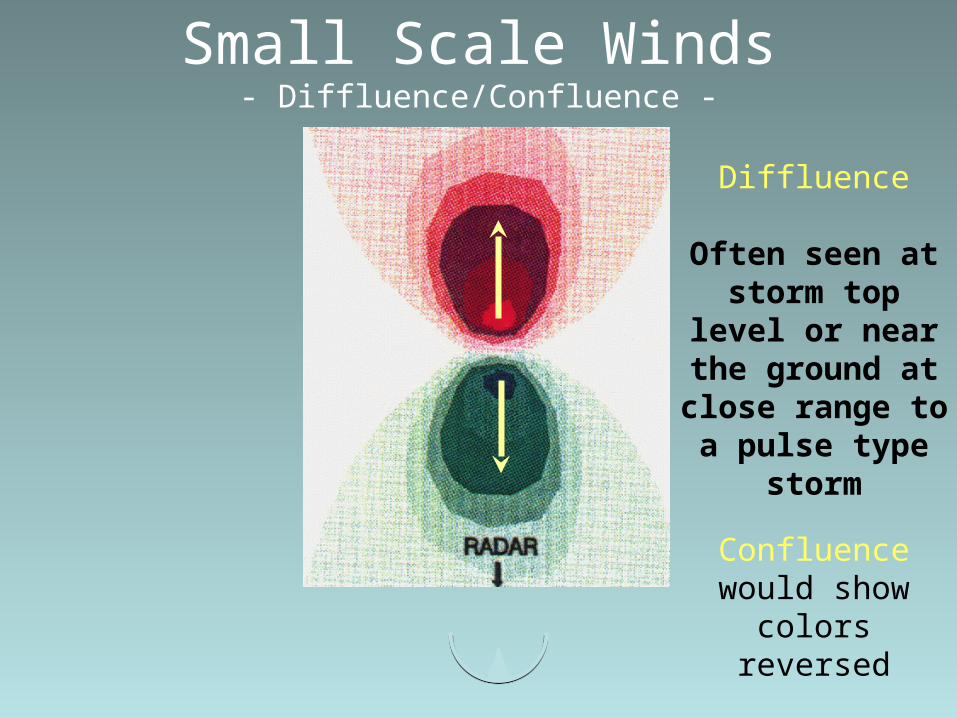
Small Scale Winds- Diffluence/Confluence -
Diffluence
Often seen at storm top
level or near the ground at close range to a pulse type
storm
Confluence would show
colors reversed
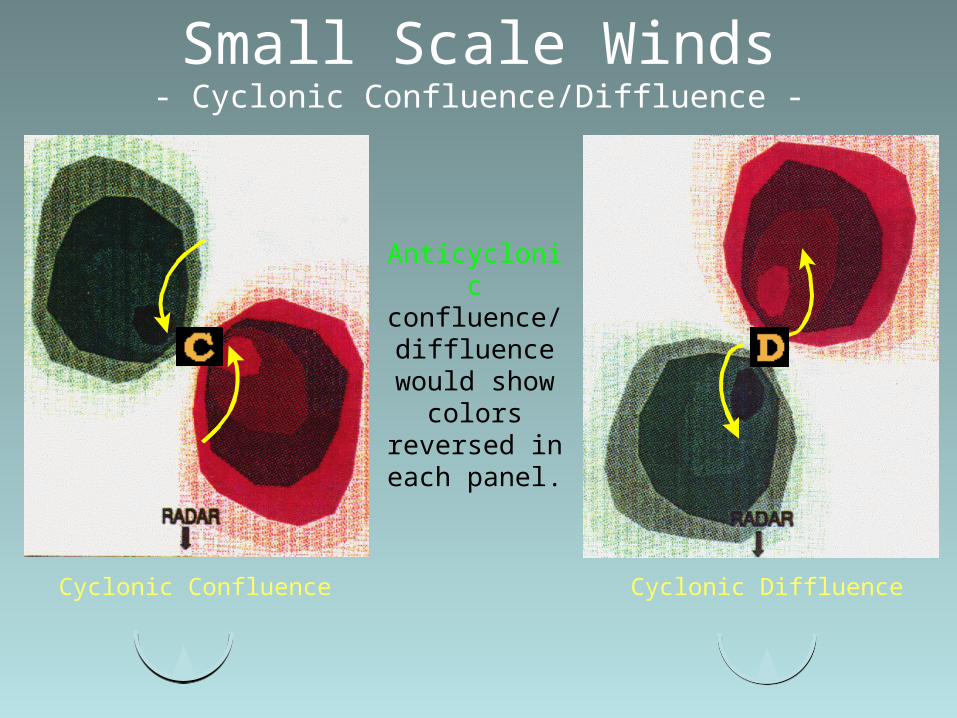
Small Scale Winds- Cyclonic Confluence/Diffluence -
Anticyclonic confluence/ diffluence
would show colors
reversed in each panel.
Cyclonic Confluence Cyclonic Diffluence
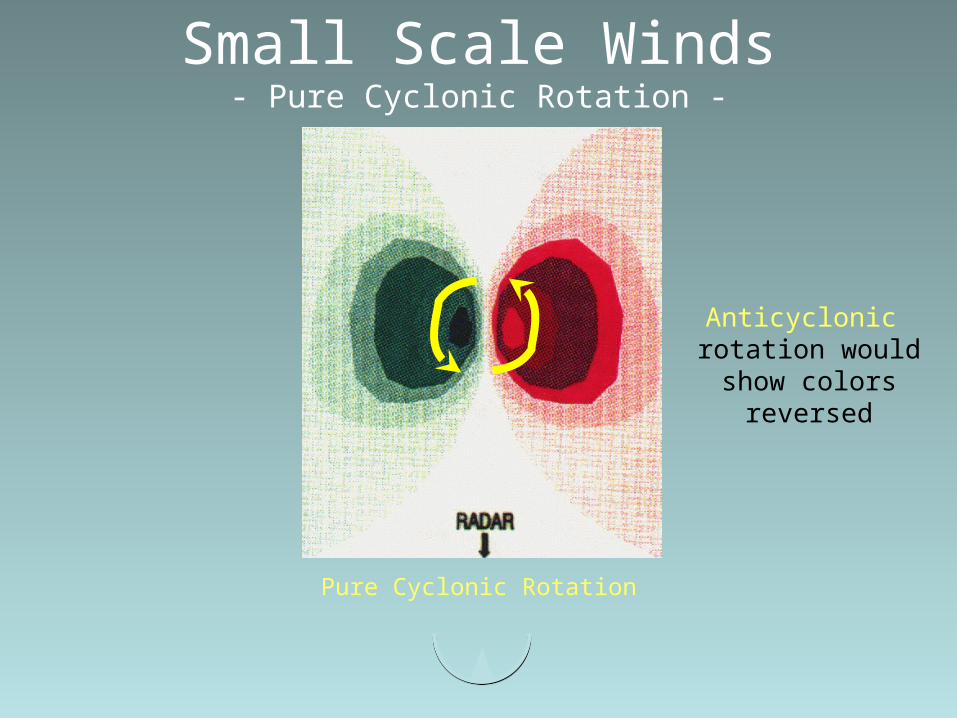
Small Scale Winds- Pure Cyclonic Rotation -
Pure Cyclonic Rotation
Anticyclonic rotation would show
colors reversed
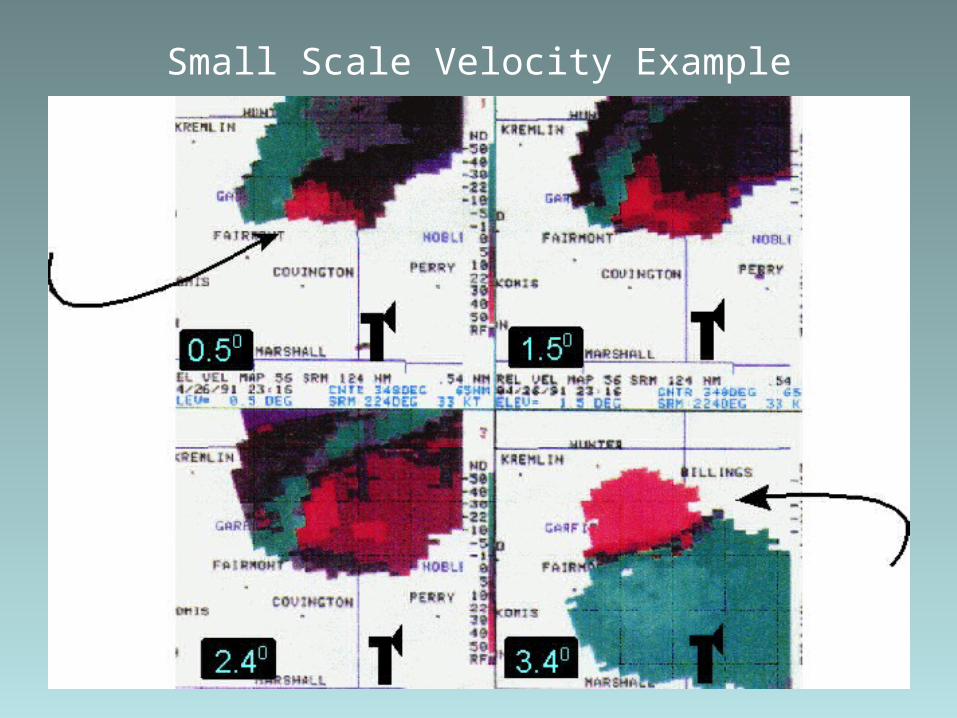
Small Scale Velocity Example
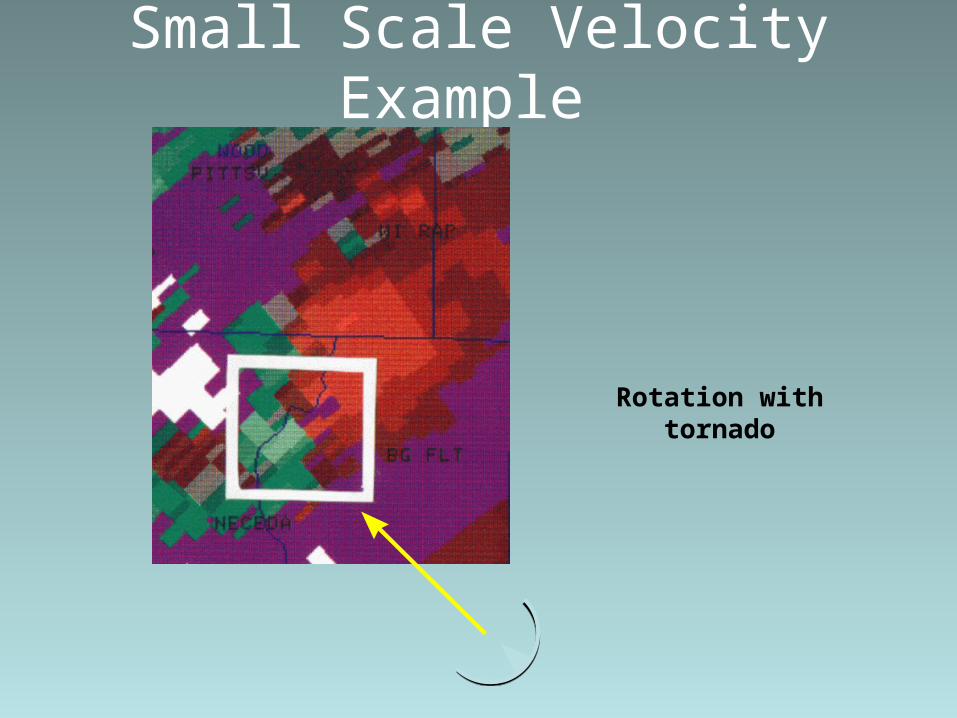
Small Scale Velocity Example
Rotation with tornado
Storm Relative Velocity - SRVvs
Base Velocity
SRV: Subtract estimated velocity of thunderstorm from the Doppler radial velocity– Make the storm stationary
When diagnosing rotational characteristics, use SRV
motion of the storm masks subtle rotations within the storm
When diagnosing Straight Line Winds (bow echo, microbursts), use Base Velocity
straight line winds are sum of the winds produced by the storms, plus storms movement
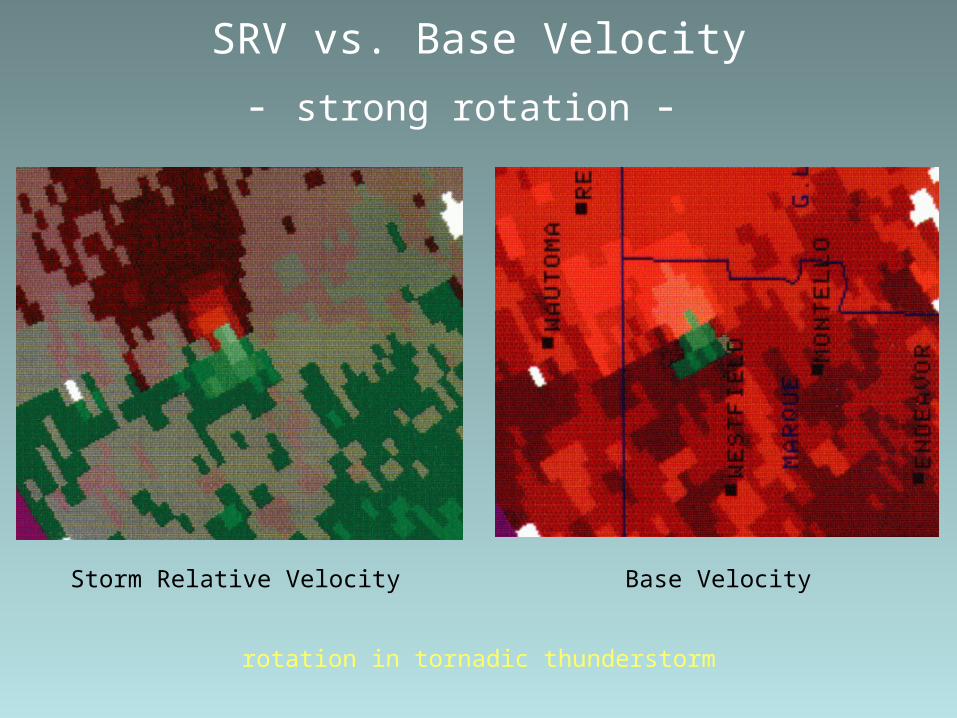
SRV vs. Base Velocity
- strong rotation -
Storm Relative Velocity Base Velocity
rotation in tornadic thunderstorm
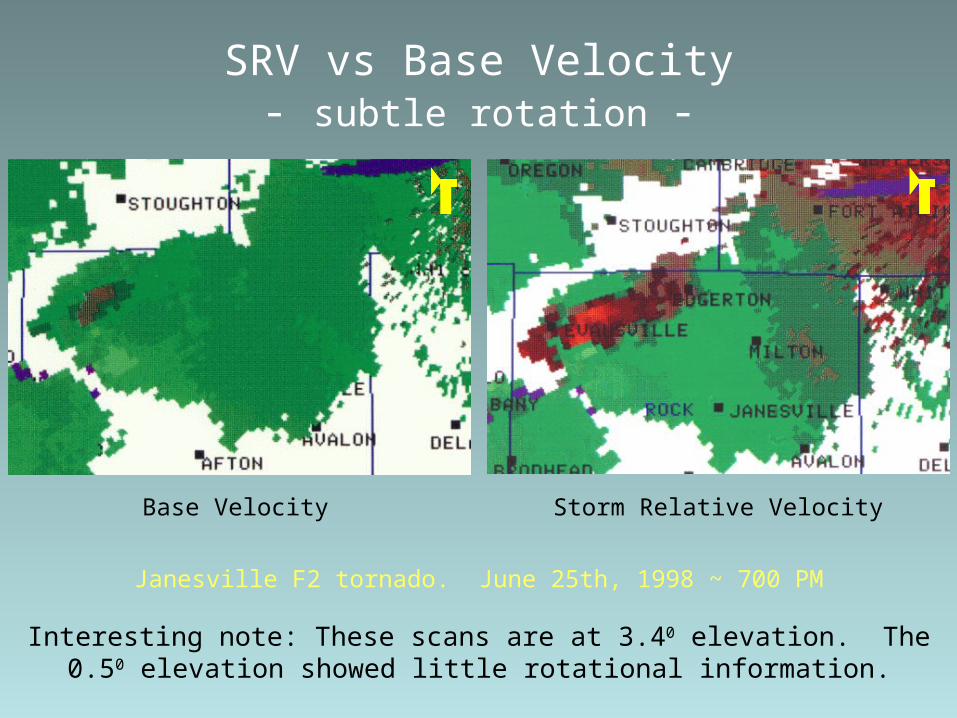
SRV vs Base Velocity- subtle rotation -
Base Velocity Storm Relative Velocity
Janesville F2 tornado. June 25th, 1998 ~ 700 PM
Interesting note: These scans are at 3.40 elevation. The 0.50 elevation showed little rotational information.
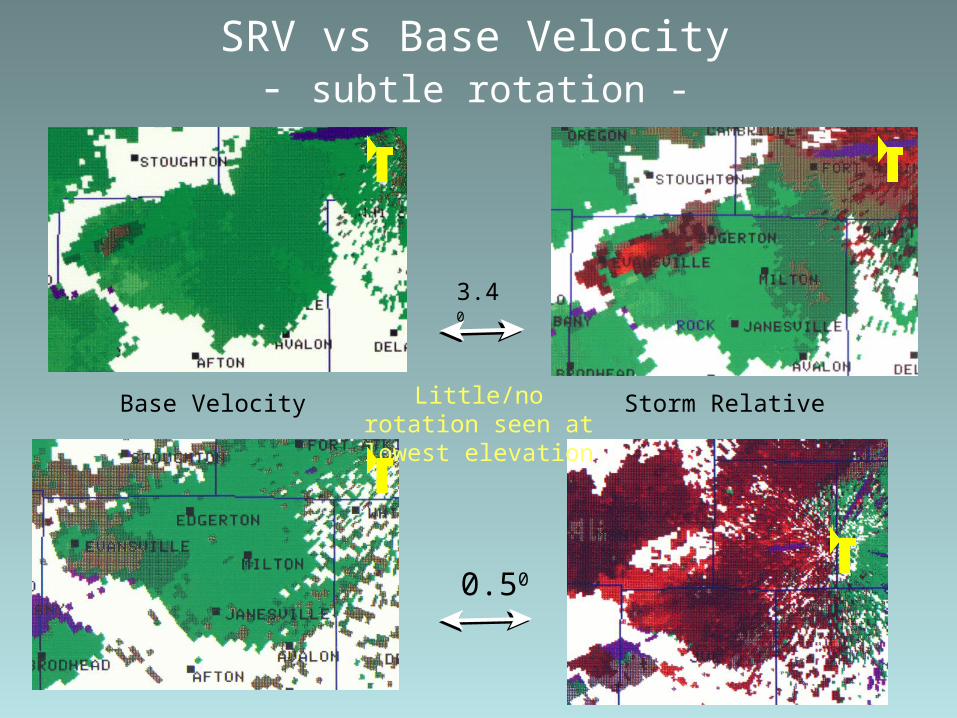
SRV vs Base Velocity- subtle rotation -
0.50
3.40
Base Velocity Storm RelativeLittle/no rotation seen at lowest
elevation
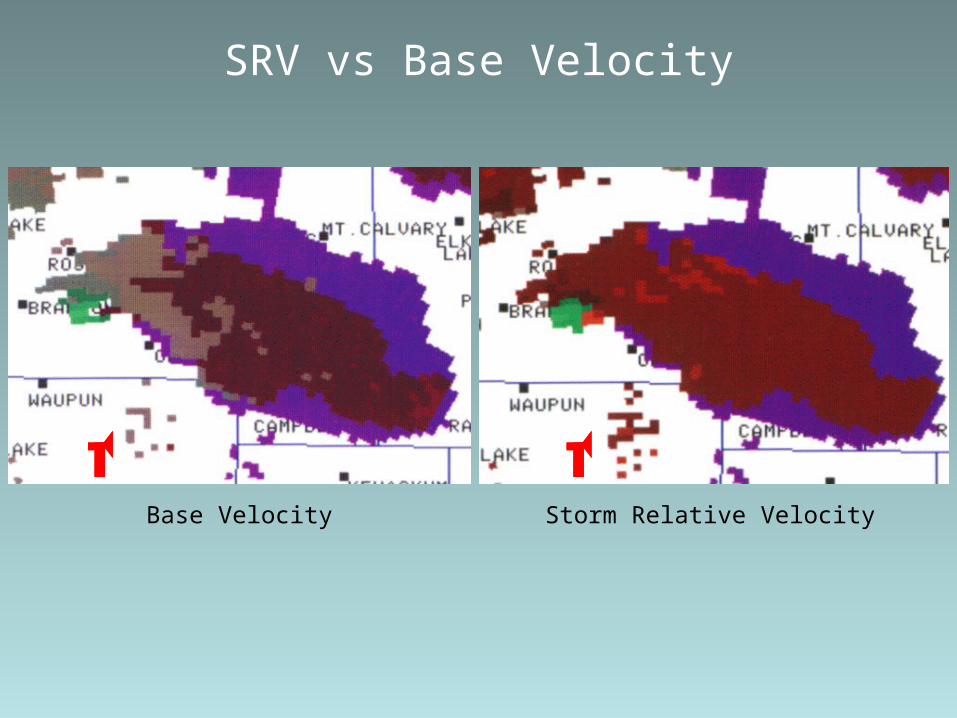
SRV vs Base Velocity
Base Velocity Storm Relative Velocity
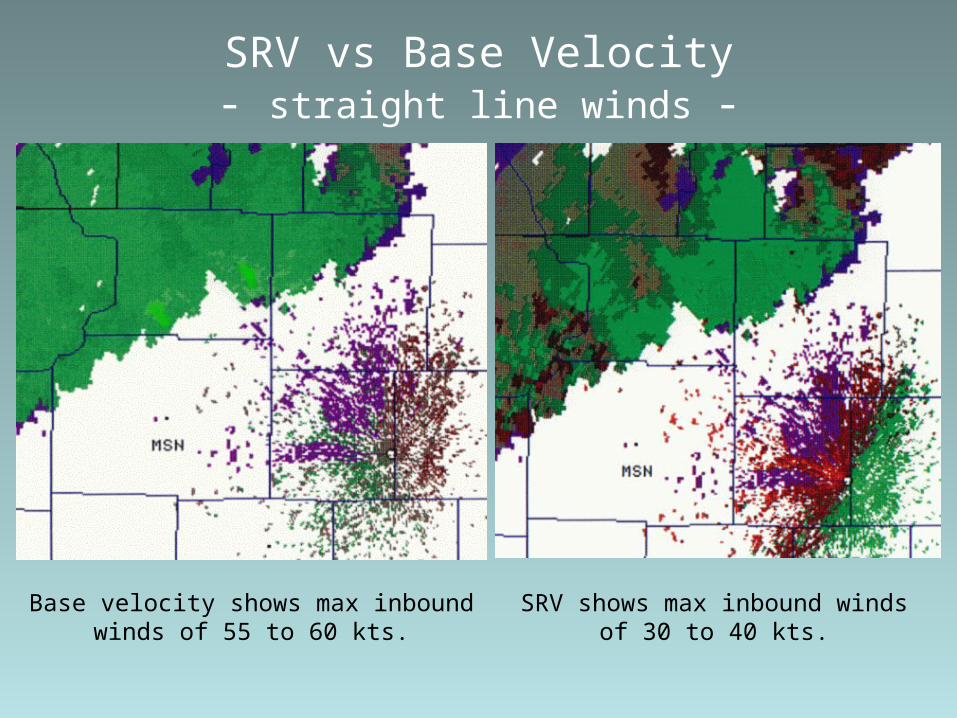
SRV vs Base Velocity- straight line winds -
Base velocity shows max inbound winds of 55 to 60 kts.
SRV shows max inbound winds of 30 to 40 kts.
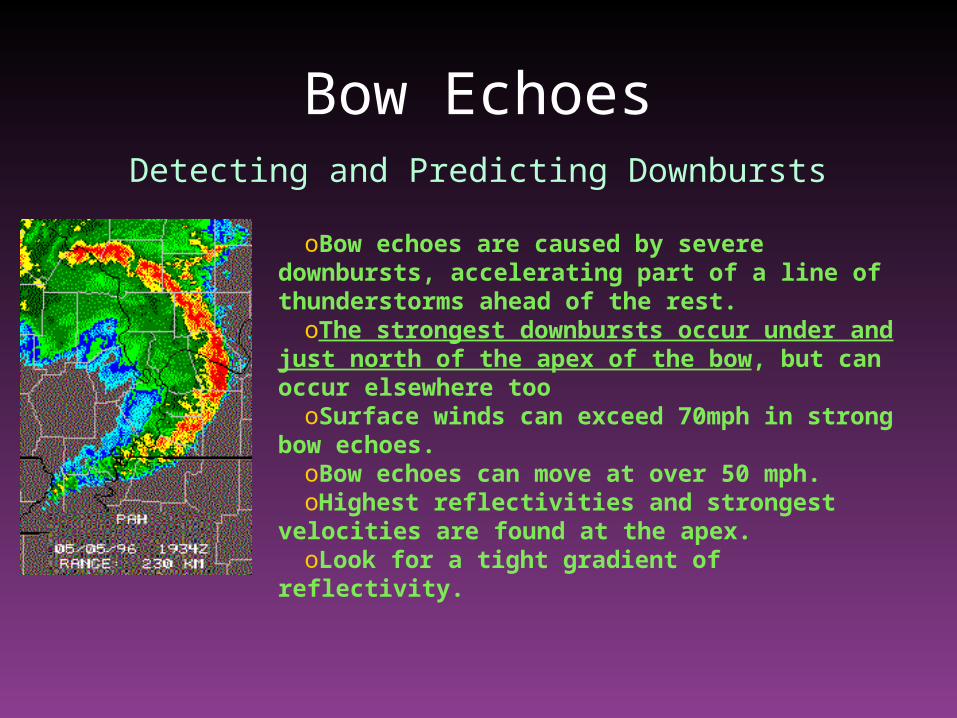
Bow EchoesDetecting and Predicting Downbursts
oBow echoes are caused by severe downbursts, accelerating part of a line of thunderstorms ahead of the rest.
oThe strongest downbursts occur under and just north of the apex of the bow, but can occur elsewhere too
oSurface winds can exceed 70mph in strong bow echoes.
oBow echoes can move at over 50 mph.oHighest reflectivities and strongest
velocities are found at the apex.oLook for a tight gradient of reflectivity.
Review Clear-Air Radar
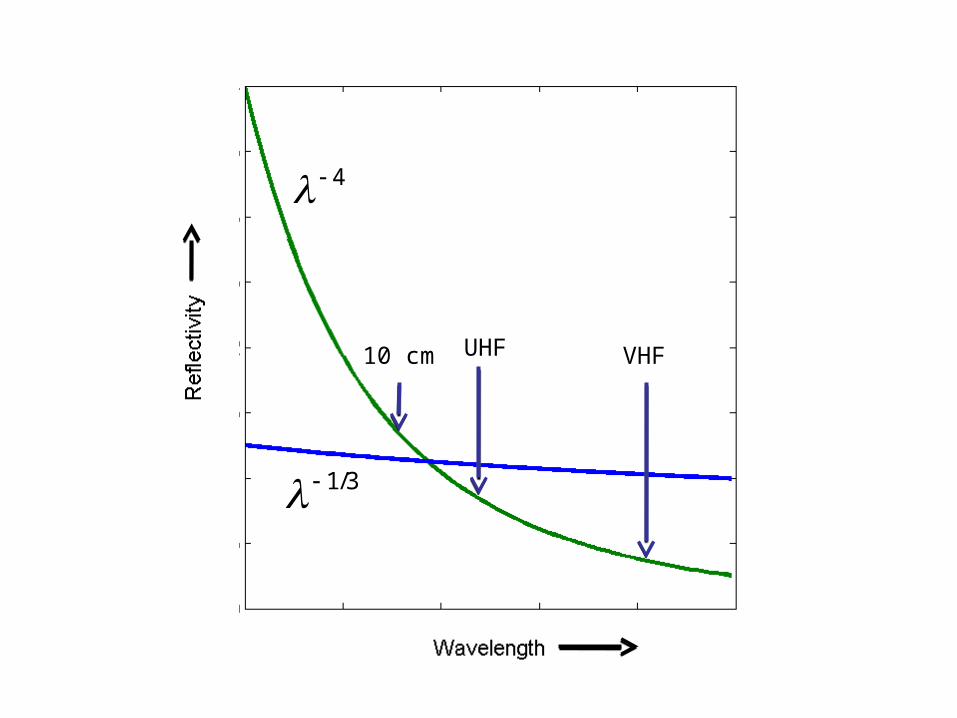
VHFUHF10 cm
1/3
4
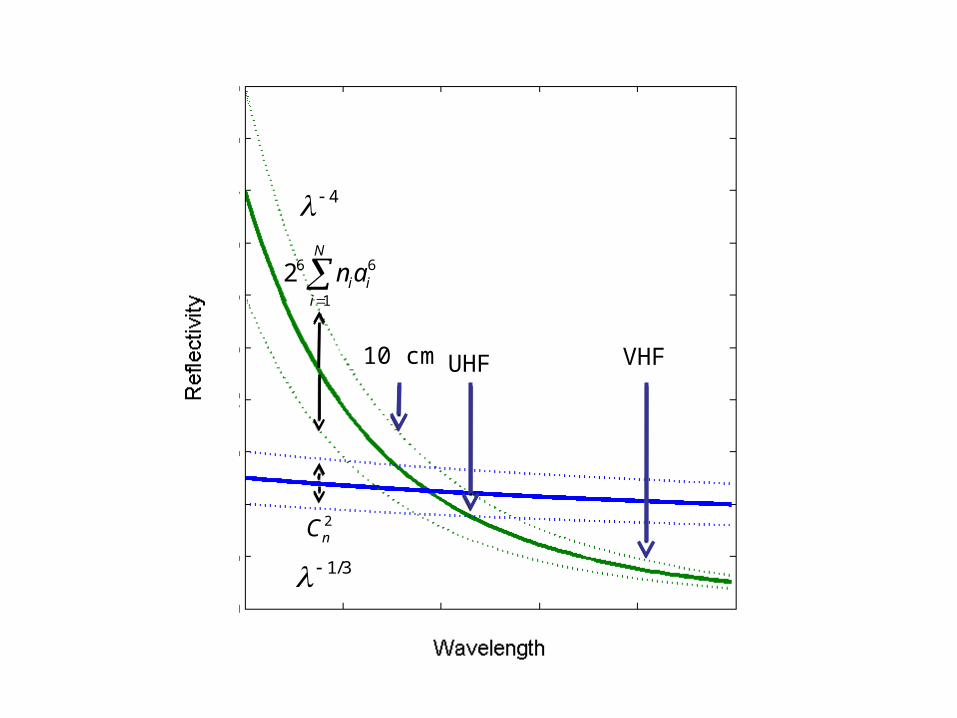
VHFUHF10 cm
1/3
4
6 6
1
2N
i ii
n a
2nC
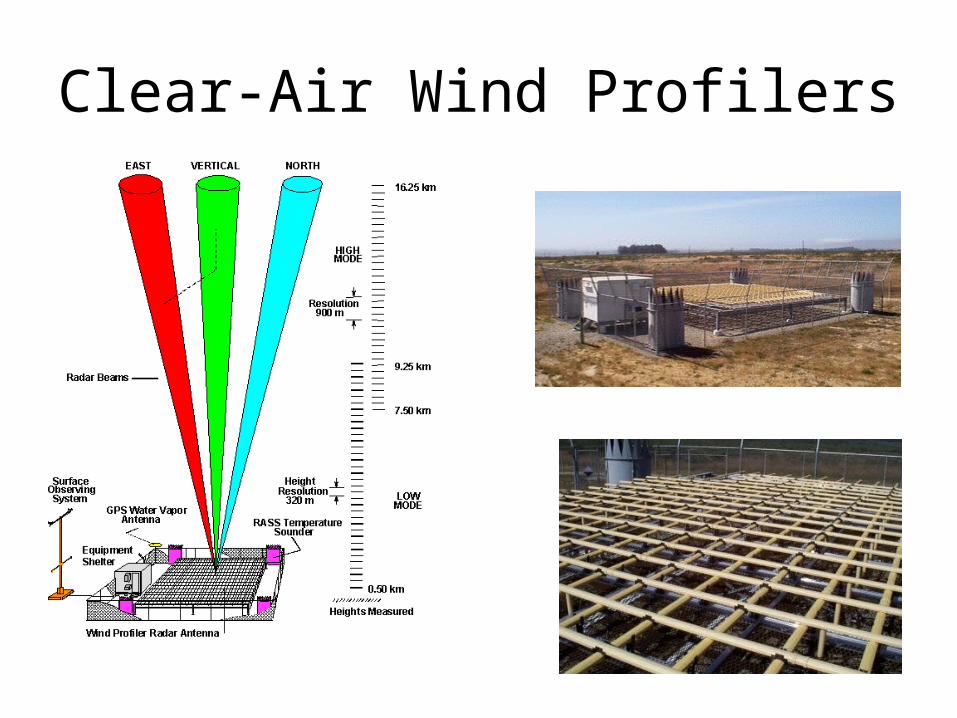
Clear-Air Wind Profilers
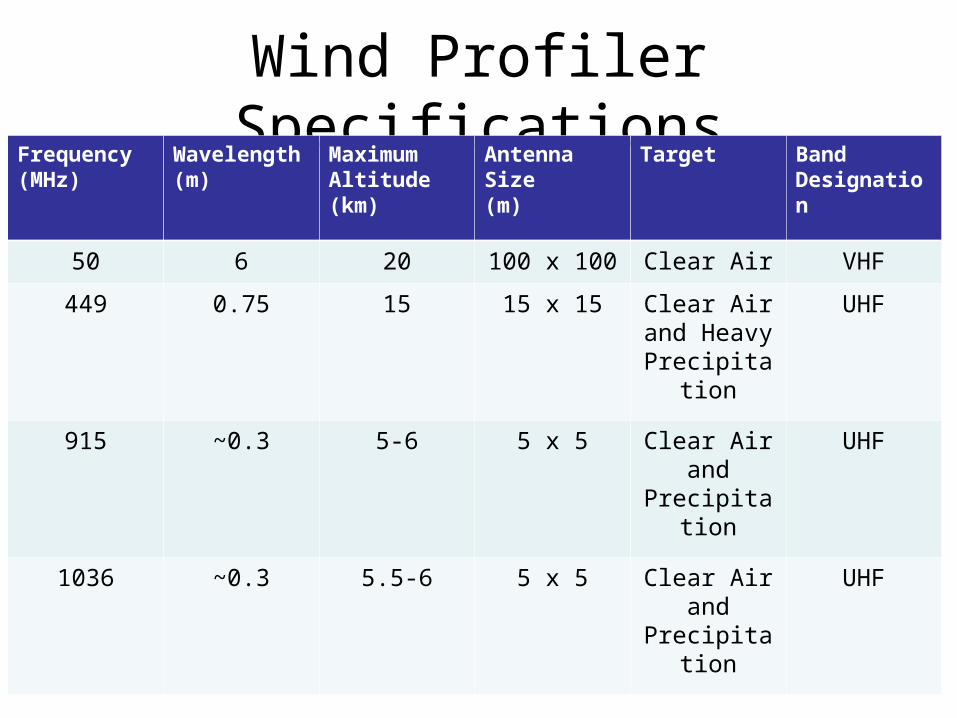
Wind Profiler SpecificationsFrequency (MHz)
Wavelength (m)
Maximum Altitude (km)
Antenna Size (m)
Target Band Designation
50 6 20 100 x 100 Clear Air VHF
449 0.75 15 15 x 15 Clear Air and Heavy
Precipitation
UHF
915 ~0.3 5-6 5 x 5 Clear Air and
Precipitation
UHF
1036 ~0.3 5.5-6 5 x 5 Clear Air and
Precipitation
UHF