Embed Size (px)
Citation preview

Echo Chambers in Science?
Lanu Kim, Jevin West, and Katherine Stovel
January 2016
N:B: This early draft presents the first findings from a new project that looksat the potential effects of technology and academic search engines on the focusand breadth of academic exploration, as reflected in citation patterns. Inspiredby Geertz’ distinction between intensive and extensive search, we investigatewhether citation patterns in two disciplines have become more concentrated ordistributed in the wake of the widespread use of new search technologies. The textof this draft is rough (and in places incomplete!!) since we have just completedour first set of analyses, but we are quite enthusiastic about the prospect ofsignificant insight coming out of this project in the coming months.
Abstract
This paper examines whether digitization and the rise of integratedacademic search engines have transformed how researchers engage withprevious literature, a critical component of modern scientific practice.Among technological advancements, we particularly focus on the recentemergence of academic search engines such as Google Scholar, becausethese services are provided based on proprietary algorithms that activelyinterfere in authors’ search process. While the impact of general recom-mender systems has been widely noted, the effect of academic recom-mender systems on scientific practice has not been fully examined. Usingthe comprehensive Web of Science database covering a wide range of publi-cations and the citation links between them, we focus on yearly changes inthe the citing behavior of researchers in two relatively similar disciplines,Sociology and Social Work, between 1998 to 2014. We document threetemporal changes in researchers’ behavior. First, researchers’ citations inboth disciplines have become more expansive since 2005 and stable after2010. Second, controlling for a measure of journal prestige, the impact of apaper-based popularity measure, the cumulative previous citation count,has increased in both Sociology and Social Work. Third, more paperspublished in lower-tier journals are now cited than prior to 2005, and thevariability of citation counts among papers published in the same journalhas also increased. Based on three findings, we see some evidence thatthe digitization of science has democratized the exposure of prior researchand weakened journals’ role as gatekeepers. Nevertheless, the increasingimportance of prior citations suggests a competing trend is also occurringthat may create an echo chamber centered on small numbers of highlycited papers.
1

1 Introduction
This article examines the impact of digitization and the proliferation of aca-demic search engines on the ways in which scholars engage with the literature.Accessing prior scientific knowledge is a critical component of modern scientificpractice, and technological developments over the past several decades haverevolutionized how scientists discover and cite past research [9]. Among thesetechnological developments, the recent emergence of academic search engine,such as Google Scholar and Microsoft Academic Search, are of particular in-terest because these services are powered by black-box, proprietary algorithmsthat attempt to actively anticipate users’ needs rather than simply listing papersindexed by keyword. The question motivating our research is, are these toolsenhancing scholars access to a wide range of potentially relevant prior work, orare they concentrating scholars’ gaze onto an ever smaller set of ”star” papers?Focusing on temporal changes in patterns of citation, we investigate whether thenew technologies are associated with an expansion or contraction in the corpusof prior research.
Most scientists now access their literature through online search engines anddigital libraries. Rare is the scientist who walks to the library and peruses thejournal shelves for new papers. Most researchers now rely on Google Scholar,PubMed, Web of Science, and various other search engines for finding and navi-gating the literature1. Collectively, are we reading more or less of the literaturein this new digital environment? Are the citation rich becoming more rich?Or are papers published in lower tier journals receiving more citations thanthey were prior to the digital divide? What impact is Google Scholar and rec-ommender systems, in general, having on what papers we find, read and cite?Ultimately, we will investigate these questions at the individual and populationlevel. For this paper, we focus on the population-level behavior via citationsbefore, during and after these digital transitions.
When using search engines, users tend to click on the top results and rarelymove to subsequent pages. A recent study2 showed that users click on thetop two positions more than 50% of the time when using Google. This searchbehavior is likely similar when using Google Scholar. Also, Lerman ([16]) foundthat the presentation order of search results greatly affect how users allocateattention due to human cognitive biases. Thus, if there exists algorithmic bias(or even just bugs in the retrieval code), this could have adverse affects on thesearch capacity, especially given the increased reliance on Google Scholar as theprimary way of accessing the literature. Depending on how the algorithms order
1There is a distinction between searching for a paper when one knows the title, author orDOI (Digatal Oject Identifier) and when one is ”navigating” the literature with no one paperin mind. The latter is the kind of search that motivates our research question. The nearlyinstantaneous access to millions of papers is without question a good thing for science. Whatis less clear is whether the current search engines, library portals and recommender systemsare good for science. We want to investigate the role these new technologies and recommendersystems are having on what is being read and subsequently cited.
2https://searchenginewatch.com/sew/study/2276184/no-1-position-in-google-gets-33-of-search-traffic-study
2

results, some papers will receive less than their ‘fair‘ share of hits and otherswill receive more than their ‘fair‘ share. Some perspectives and relevant findingswill go unnoticed, while ’top ten’ lists will echo louder the same highly citedpapers. In a classic ‘Matthew Effect,‘ scholars will cite the same papers thatshow up in the top ten lists and those papers will subsequently receive morecitations and then be weighted higher in the search results.
If researchers are finding (and subsequently citing) the same papers fromthe same search engines and the same recommender systems, this could haveadverse effects on what is read in the literature. Recent studies have pointedto the potential myopia of science [19]. Second and third tier journals may beaccessed less and less with sleeping beauties never waking up [14] (although thenegative effects could be balanced with search engines uncovering the less citedpapers). In addition, people’s careers depend on whether academic engines showtheir papers on the first page rather than the 10th page of search results. Thosein the first couple pages have a much greater chance of being cited, which couldlead to promotions.
Though the impact of academic recommender systems on the consumptionof scientific research has not been examined directly, the influence of the recom-mender system embedded in large online commercial websites such as Amazon,Target, Spotify, and Netflix on consumption patterns have been studied exten-sively. The results of these studies reveal complex and contradictory effects: onthe one hand, studies of online clothing markets [5] and the video rental mar-ket [26] have found that consumers’ use of recommendation engines increasesthe share of niche product consumption, while other studies suggest that onlinemarkets driven by recommender systems lead to convergence around a smallernumber of popular items [20, 8, 10].
Despite the significance of studying the rise of academic recommender sys-tems, there are methodological issues associated with using bibliographic anal-ysis to investigate the consequences of search engines on scientific practice. Thekey problem is that we do not observe scholars behavior directly, and thus donot know how, exactly, scientists locate the research cited in their bibliography– or whether this has changed in response to new technologies. Our strategyin this article is to attempt to isolate the effect of technology from other con-founding variables – such as the citation norm of fields or increased numberof publications – by comparing temporal changes in the relative influence ofjournal and paper. One of the characteristics of the new systems is that theyprovide paper-specific information such as the number of received citations andhyperlinks from and toward a paper. Therefore, if the impact of journal pres-tige on citation has declined while the impact of prior citations to a given paperincreased after the academic recommender system has been popularized, we canargue that this new system is changing the behavior of researchers. A secondaryproblem is that there is a great deal of variation in citation norms by discipline[12]. We control disciplinary norms by conducting our analyses separately fordifferent disciplines, and investigate whether the same behavior pattern is ob-served across fields.
In this paper, we also compare the relative influence of journals and papers.
3

This allows us to rethink the role of journals in the Google Scholar era. Prior tothe advent of digitization, journals played a central role in the scientific process,both evaluating research (through peer-review and the editorial process) andserving as an efficient filter for the search process. While the gatekeeping role ofjournals has been well documented, journals’ impact on the search process is lesswell appreciated. However, we believe that both the physical location of jour-nal archives on library shelves and personal subscriptions facilitated individualscholars being familiar with the research publish in a particular set of journals– all while increasing the difficulty of learning about, let alone gaining accessto, scholarship published in other outlets. Digitization made the process of ac-cessing a known paper far easier, but it initially did littler to improve search,and the curatorial role of journals remained. A consequence of the pre-academicrecommender systems era is that papers published in high profile or well dis-tributed journals were likely to be seen, and hence cited, more than paperspublished in journals with smaller subscription bases or lower reputations. Inthe Google Scholar era, however, papers’ positions in various electronic archives(and the algorithms used to access these archives) may be increasingly decou-pled from the journal they are published in, while paper specific features (suchas prior citation, or authorship) may play an increasing role in their visibilityto future scholars. Thus, comparing changes in journal-level and paper-levelmeasures enables us to separate two effects of technology, digitization and therise of academic recommender system.
2 Background/Literature review
Google Scholar was launched in November 2004 with a goal to create one effi-cient search engine where scholars as well as general public can find scholarlyinformation from all disciplines and languages [11]. Google Scholar begins withsearching keywords as well as showing citation counts in the search results.In a relatively short amount of time, it has become one of the most impor-tant search tools for researchers’ access to the literature. It has continued todevelop features, including author-level metrics and links to Web of Science ci-tations. Google Scholar has also created its own index for ’popular’ papers andrecently added an application to automatically search articles while browsingthe web. How Google Scholar ranks papers, however, has not been disclosed.This is a black box, but researchers have tried to reverse engineer the resultsbeel2009google. Based on these studies, there is evidence that it highly weightscitation counts, which means that highly cited papers are more likely to beshown in top positions. Beel and Gipp [3] concluded that Google Scholar ismore suitable ”when searching for standard literature rather than gems, thelatest trends, or article by authors advancing a different view from the main-stream”, and more susceptible to increasing the Matthew effect. Nevertheless,the consensus about how to construct search algorithms and how to evaluatethe performance of them (e.g., [25]) has not been reached yet [2]. Also, searchoutcomes are frequently changing in response to algorithmic updates or A-B
4

testing.As search engines become popularized, the necessity of a paper-level metric
instead of journal-based influence factor has increased as well. Limitations ofjournal-level metrics are well described in Lariviere et al.’s recent research [15];they found that even though journals have a different spectrum of journal influ-ences, the citation distributions of published papers largely overlap each otherindicating that the quality of a paper cannot be inferred from journal’s status.In line with this argument, Altmetric is an example of a new paper-level metricin the Web 2.0 era that counts things like tweets from social media [22].
Although there has been a lively discussion about how to construct effectiveand stable search algorithms and how to measure the significance of academicoutcome in the Web 2.0 era, assessing the impact of technological developmenton researchers’ behavior has been relatively neglected. Some have proposedexplanations about temporal changes in citation distributions that could bedriven by Google Scholar ([23, 21]), but the limitation is that the studies onlyinclude classic papers and does not appropriately control for the numerous con-founding variables that could be influencing citing behavior. In spite of theselimitations, these two analyses suggest a possibility that the development ofnew technology might bright about more concentrated citation distributions. Itis not only recommender systems, but the digitization of journals might alsocontribute to the convergence of citations by accelerating consensus throughquick communication [9]. In addition, research outside of academia shows thatconsumers’ choices are more likely to converge when preference of others is pro-vided ([20, 13]). In contrast, other research has shown that the emergence ofonline markets based on recommender systems promotes sales of commoditiesthat would not have been found without the new technology. Brynjolfsson etal. [5] argues that consumers’ usage of internet search and discovery tools areassociated with the increase of collective sales in niche products by comparingonline and offline clothing market. Similarly, Zentner et al. [26] also find thatthe effect of information technology boosts the sales of niche products in movieconsumption.
Both features (convergence and divergence) of new technology may be re-flected in new search engines – finding papers that would not have been foundotherwise and citing papers that everyone has already cited. In this study,we investigate how this new technology could be affecting the convergence anddivergence of citations in the fields of sociology and social work.
3 Data and methodology
3.1 Data Source and Coverage
For this study, we used Clarivate Analytics’ Web of Science (WoS) data forcalculating citation counts to/from papers and to/from journals. This includesthe Science Citation Index Expanded, the Social Sciences Citation Index andthe Arts and Humanities Citation Index. The full data set includes more than
5

100 million publications and over 1 billion links between papers from 1900 -2015. For this study, we isolated the paper counts and citation counts to thosepapers from the two categories, ”Sociology” and ”Social Work”. The citationcounts by year can be found in the appendix.
Since our main research question revolves around the effect of technologyon patterns of citation, it is necessary to control other factors such as citationnorms [12]. In this article we focus on two relatively similar disciplines in socialsciences: Sociology and Social Work, and limit our analysis to within-disciplinecitation.3 In the Web of Science Core Collection database, all journals areassigned to one or more subject classifications. While most journals are clas-sified into only one subject category, when a journal is classified in two sub-ject categories we use the first one. In some disciplines subject categorizationchanges over time; however, classification of journals was relatively stable inSocial Work(Last column in Table 5). Sociology experienced two big leaps ofjournal counts in 2004 and 2008-2009 (Last column in Table 1). The numberof papers in both disciplines begins to soar after 2005 and more than doubledby 2013.4 We believe this rapid increase in publication counts has two sources.First, some of the increase represent a real increase in the number of paperspublished over time. At the same time, some of the increase is also likely due toan increase in WoS coverage of social science disciplines.5 It is not clear whichfactor is more influential in explaining the rapid increase of publication countsafter 2005, thus we proceeded with all papers available in the data.
3.2 Data Structures
There are several ways to organize bibliographic data for analysis. Two of themost frequently used data structures are a bibliography-based data structureand a citation-based data structure. A bibliography-based data structure fo-cuses on outgoing ties, in the sense that it identifies all papers contained inthe bibliographies of a set or sample of papers; analyses typically focus on thedistribution and characteristics of the papers cited in these bibliographies. Acitation-based data structure is organized around in-coming ties, and selects aset of papers and the papers that cite them. In both cases, the challenge is toidentify the appropriate pool of potential targets (in the bibliographic case) orsenders (in the citation case). Lynn [17] solved this problem by identifying ar-ticles published in well-known journals in selected disciplines between 1985 and1986, and counting the citations these paper received in the 20 years followingtheir publication.
3We will add more disciplines applying more technology in their research such as computerscience or physics to compare the amount of change that they experience.
4The small decrease in the number of papers published in 2014 is due to the fact that ourdata ends in mid 2014.
5We are investigating the relative import of each of these sources of increase, and willaddress this in more detail in subsequent drafts.
6
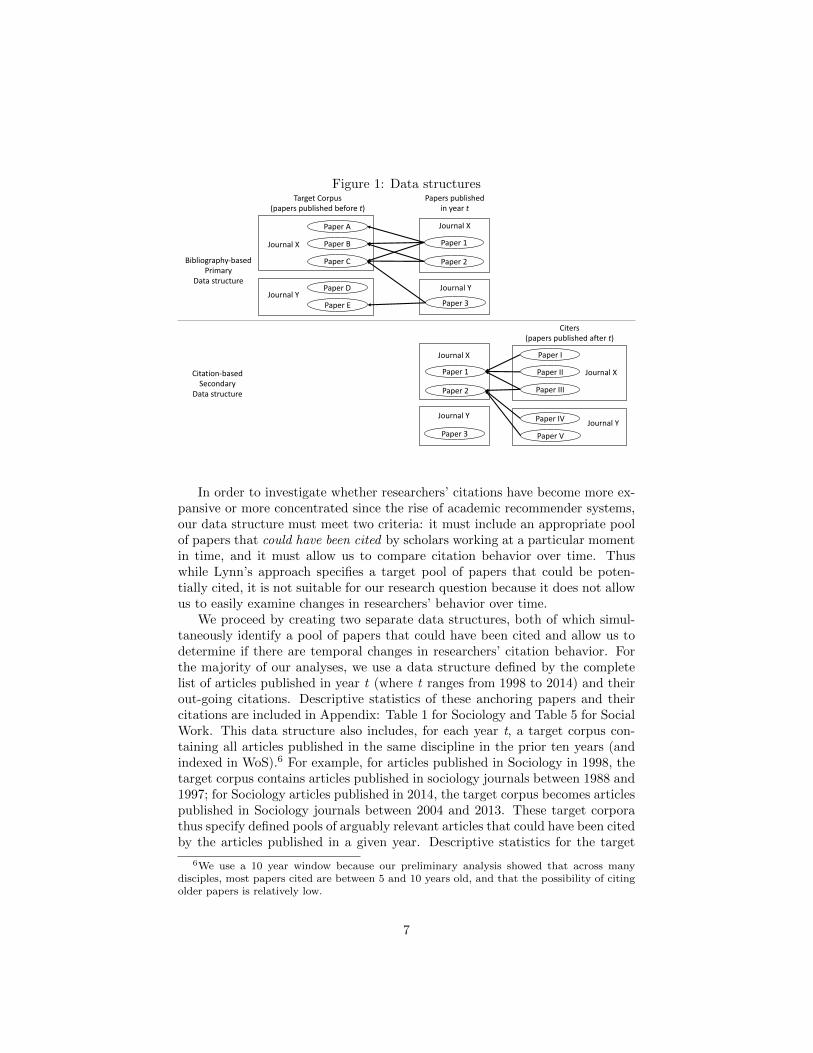
Figure 1: Data structures
Bibliography-basedPrimary
Datastructure
Paper1
Paper2
Paper3
PaperA
PaperB
PaperC
PaperD
PaperE
TargetCorpus(paperspublishedbeforet)
Paperspublishedinyeart
JournalX
JournalY
JournalX
JournalY
Paper1
Paper2
Paper3
PaperI
PaperII
PaperIII
PaperIV
PaperV
JournalX
JournalY
JournalX
JournalY
Citers(paperspublishedaftert)
Citation-basedSecondary
Datastructure
In order to investigate whether researchers’ citations have become more ex-pansive or more concentrated since the rise of academic recommender systems,our data structure must meet two criteria: it must include an appropriate poolof papers that could have been cited by scholars working at a particular momentin time, and it must allow us to compare citation behavior over time. Thuswhile Lynn’s approach specifies a target pool of papers that could be poten-tially cited, it is not suitable for our research question because it does not allowus to easily examine changes in researchers’ behavior over time.
We proceed by creating two separate data structures, both of which simul-taneously identify a pool of papers that could have been cited and allow us todetermine if there are temporal changes in researchers’ citation behavior. Forthe majority of our analyses, we use a data structure defined by the completelist of articles published in year t (where t ranges from 1998 to 2014) and theirout-going citations. Descriptive statistics of these anchoring papers and theircitations are included in Appendix: Table 1 for Sociology and Table 5 for SocialWork. This data structure also includes, for each year t, a target corpus con-taining all articles published in the same discipline in the prior ten years (andindexed in WoS).6 For example, for articles published in Sociology in 1998, thetarget corpus contains articles published in sociology journals between 1988 and1997; for Sociology articles published in 2014, the target corpus becomes articlespublished in Sociology journals between 2004 and 2013. These target corporathus specify defined pools of arguably relevant articles that could have been citedby the articles published in a given year. Descriptive statistics for the target
6We use a 10 year window because our preliminary analysis showed that across manydisciples, most papers cited are between 5 and 10 years old, and that the possibility of citingolder papers is relatively low.
7

corpora are attached in Appendix: Table 3 for Sociology and Table 7 for SocialWork. Linking outgoing citations from our lists of anchor articles to the associ-ated target corpora gives us the network of within-discipline out-going citationsfor a given publication year.7 Temporal changes in the pattern of citations tothe target corpora may reflect changes in scholars’ use of technology.
In addition to this primary data structure, we also create a second datastructure that allows us to approach the problem from the opposite perspective:what is the pattern of incoming citations received by a defined set of articlespublished in a given year? In order to maximize our temporal analyses, inthis data structure we limit the window of possible citation to two years, andexamine the incoming citations to papers published between 1998 and 2011.As for our prior data structure, we restrict our target papers (in this case,potentially citing papers) to papers indexed in WoS, and published in English,but in any disciplines. Analyses using this data structure are viewed primarilyas a check on the robustness our primary analyses and done only in sociology.8
3.3 Methodology
We begin by investigating the simple question of whether citation patterns havebecome more- or less- concentrated over time, and whether changes in the thesepatterns are temporally proximate to technological changes in how scholars ac-cess the literature. Using our primary data structure for each year and discipline,we compute a Gini coefficient for the distribution of citations received by papersin the appropriate target corpus. The Gini coefficient ranges from 0 to 1, withvalues closer to zero reflecting more equal distributions and values closer to onereflecting more unequal (or concentrated) distributions. The Gini coefficient hasbeen used frequently in bibliometrics to evaluate citation distribution [6, 4]. Inour context, when a relatively small number of articles receive the bulk of thecitations, the distribution of citations within the target corpus will be unequaland the Gini coefficient will be high, while if citations are distributed moreevenly across a larger group of target articles, there will be less inequality andthe Gini coefficient will be lower. While the Gini coefficient is not a perfectmeasure of the details of a distribution, it is a powerful and commonly usedsingle number that summarizes the level of relative inequality.
Next, in an effort to better understand factors that impact citation behavior,we estimate a statistical model that predicts the citation counts of papers ineach target corpus. Our primary interest here is in whether, in the wake of
7The percentage of citations made to the applicable target corpora is stable and low,ranging between 4 and 7 percent in both disciplines. Detailed analysis of citations outside thetarget corpora are provided in Appendix: Table 2 for Sociology and Table 6 for Social Work.Briefly, about half of all citations go to sources such as news articles, datasets, books, andinternet sources that are not indexed by the WoS database. Among those citations to sourcesthat are indexed in WoS, about 40% are to papers that are outside our 10-year window. Inaddition to these conditions, we also limit our target corpora to article format (which doesnot include conference proceedings or book reviews) written in English , and in the samediscipline.
8We plan to extend it to other disciplines as well.
8

new search technologies, there has been a decline in the impact of the journala paper is published in and an increase in the impact of the papers’ previousrecord of citations on the predicted number of citations that a paper will receivein a given year.
Our dependent variable, the number of citations received by paper j in yeart, contains a lot of zeros (see the last column in Table 3 and Table 7), so wespecify a zero-inflated negative binomial model. Because articles are nested injournals, we control this group-level variance with a random effect for journal.Our two main explanatory variables are the journal influence factor9 (JIF) andthe cumulative previous citations received by paper j in years prior to yeart. Following convention, JIF is measured by the average citations to articlespublished in a journal in the two years following publication. This measure,which includes all received citations regardless of disciplines, has previouslybeen computed for all years and all journals in WoS by one of the authors.10
JIFs are recalculated for each year, though empirically they are relatively stableyear over year. We use the year t influence factor of the journal paper j waspublished in (rather than the publication year) because we are modeling factorsthat influence the behavior of scholars making decisions in year t about whatliterature to cite. The cumulative previous citation is the total number of within-discipline citations to paper j through time t-1. Following Evans [9] and Lynn[17], we include three control variables, all measured on paper j : article age,page count, and the number of references in the paper’s bibliography. Basedon our expectation in the introduction, we hypothesize that the effect of JIFhas decreased while the effect of cumulative previous citations has increased inrecent time periods as the academic recommender system has been popularized.
Our final set of analyses uses our prospective data set to further investigatewhether there has been a change in the importance of journals as curators ofthe scientific literature. In these analyses we classify journals into tiers basedon their JIF (top, middle, bottom) and examine temporal changes in the distri-bution of subsequent citations to papers published in journals in different tiers.Here we are testing whether there has been an increase in the rate of citationfor articles published in lower tiered journals, and a decline in the fraction ofpapers cited in higher tier journals.
9We use the ArticleInfluence score for our journal influence measure. This is a network-based journal-level method for ranking journals[24]. It is based on the Eigenfactor algorithmand normalized by the size of the journal.
10However, this measure has a limit in that it ignores the distribution of citation acrosspapers within a journal, and thus can be influenced by a single paper that manages to garnera large number of citations. See Milojevic, Radicchi, and Bar-Ilan 2017 [18] for an alternatemeasure that incorporates within-journal variation in received citations.
9

4 Results
4.1 Time trend in Gini coefficients11
Figure 2 summarizes the Gini coefficients computed from papers that have beencited at least once from Sociology and Social Work. Higher Gini values indicateless parity, with a higher concentration of citation wealth to a small proportionof papers. The 95% confidence intervals are generated with 1000 simulationsthat randomly sample papers from the given citation distribution in year t withreplacement. We calculated this for a 3 and 5 year window and found similarresults. The Gini coefficients have increased over time, with a particularlysteep rise after 2005 in both disciplines. This indicates that citations haveconcentrated on a few star papers.12 This finding is consistent with previousobservations. For example, multiple studies have shown a Google scholar effect,where more citations go to old and popular articles [23, 21], which implies thatcitations concentrate on a few popular papers.
Figure 2: Gini coefficients for papers cited at least once between 1998 and2014. The shaded regions indicate 95% confidence intervals. Blue line representsSociology and red line represents Social Work.
Social w
orkS
ociology
2000 2005 2010
0.20
0.25
0.30
0.225
0.250
0.275
0.300
Year
Gin
i coe
ffici
ents
However, analyzing papers only papers that are cited might overlook the ef-
11We are continuing to do more robustness checks on our all findings to investigate whetherthis tendency is driven by actual behavior change of scholars or a natural outcome of publi-cation and citation count increase.
12We argue that this trend is independent from the rapid rise of the number of publicationssince 2005, because Gini coefficient is a relative inequality measure that accounts for the totalnumber of citations.
10

fect of technology in increasing access to the broader literature, including thosepapers from lower tier journals. Figure 3 shows the opposite pattern from Fig-ure 2; when we include all paper including those that have never been cited,the Gini coefficient decrease over time. This suggests a more equal distributionof citations. We call this decrease in Gini coefficients ’divergent’. In these twofields, the distribution of citations has been diverging since early 2000. Inter-estingly, the divergent trend begins to stagnate after 2010 in both disciplines.If technology had some effect on the divergence since 2000, what has been hap-pening since 2010? Technogical change may be having less of an effect to duebroad adoption. We plan to further investigate this stagnation.
Figure 3: Gini coefficients with all papers in corpus between 1998 and 2014. Theshaded regions indicate 95% confidence intervals. Blue line represents Sociologyand red line represents Social Work.
Social w
orkS
ociology
2000 2005 2010
0.82
0.84
0.86
0.84
0.86
0.88
Year
Gin
i coe
ffici
ents
Figure 4 partially explains the contrasting results Figure 2 (increases in theGini coefficients) and Figure 3 (decreases in the Gini coefficients). Figure 4shows the percentage of papers that are cited more than 0, 1, 3, and 5 timesbetween 1998 and 2014. The percentage of papers cited at least once and atleast twice was stable until about 2005 in both disciplines, but began to rapidlyincrease after 2005. The groups of papers cited more than three times has notbeen increasing at the same rate. In other words, about 50% more papers arecited at least once in 2010 than 2005. This increase seems to be driven mostlyby the expansion of once or twice cited papers rather than the highest citedpapers. We hypothesize that this change may be driven partly by digitizationand new search technologies for accessing this portion of the literature.
11

Figure 4: Proportion of cited papers for Sociology and Social Work. The redline indicates the proportion of papers that have been cited at least once. Thepurple line is the proportion of papers cited more than five times. The largestincrease occurs with the group cited at least once.
0.0
0.1
0.2
0.3
2000 2005 2010
Year
Pro
port
ion
of p
aper
s be
ing
cite
d
Number of citations
> 0
> 1
> 3
> 5
Sociology
0.0
0.1
0.2
0.3
2000 2005 2010
Year
Pro
port
ion
of p
aper
s be
ing
cite
d
Number of citations
> 0
> 1
> 3
> 5
Social work
4.2 The influence of journal influence factor and previouscitations
Through analyzing Gini coefficients over time, we find that citation distributionsshow more divergent rather than convergent behavior. One possible explanationis that technology might induce the citation distribution to be more divergentrather than convergent by facilitating search for papers that were not easily ac-cessible without technology. However, this analysis leaves two related questions.First, why does the potential role of technology in expanding search result instagnation after 2010? Second, is the reason for Gini coefficients becoming sta-ble after 2010 due to a cancelling out effect on the concentration of citationsdriven by popularized academic recommender system? In this section, we ex-plore whether the academic recommender system influences researchers to citepapers that have high previous citation counts rather than high status jour-nals by comparing the magnitude of coefficients of the two variables computedfrom the statistical model, JIF and paper’s previous cumulative citations, be-tween 1998 and 2014. All 17 models have Variance inflation factor specified forthis statistical model less than five, which suggests that there are no issues ofcollinearity.13
Figure 5 and Figure 6 illustrate the results of the negative binomial zero-inflated random effect model.14 In both figures, the top panel summarizes JIFcoefficients and the lower panel shows cumulative previous citations. Also, 95%confidence intervals are added to the estimated coefficients. In sociology results(Figure 5), while the estimated coefficients of JIF are around 0.3 and 0.9 and
13Correlation tables are attached in Appendices (Sociology for 4 and Social Work for 8).1434 full models will be provided as a supplementary document in future.
12

generally higher than cumulative previous citations, it is hard to argue that thecoefficients of JIF have changed during observed period due to its wide confi-dence interval. In contrast, the increase in cumulative previous citations standsout since 2009. Between 2003 and 2008, cumulative previous citations are notstatistically significant with .05 alpha level, but after 2009, it is statistically sig-nificant and the predicted coefficients have constantly increased. The increasedcoefficients after 2009 indicate that the effect of one citation increase in previouscitation counts is associated with more received citations by paper in year t.
Figure 5: Coefficients of journal influence factor and cumulative previous cita-tions (Sociology, 95% C.I)
●
●
●
● ● ●
●●
●
● ●
●
●
●
●
● ●
0.0
0.3
0.6
0.9
1.2
1998 1999 2000 2001 2002 2003 2004 2005 2006 2007 2008 2009 2010 2011 2012 2013 2014
Year
Bet
a of
jour
nal I
F
●●
●
●
●
●
●
●
●
●●
●
● ●
●
●
●
0.00
0.01
0.02
0.03
1998 1999 2000 2001 2002 2003 2004 2005 2006 2007 2008 2009 2010 2011 2012 2013 2014
Year
Bet
a of
cum
ulat
ive
cita
tions
Social Work results (Figure 615) show a similar pattern with sociology; whilecoefficients of JIF do not show statistically significant change, coefficients of cu-
15The result of 2005 for Social Work is not included because the model fails to converge.
13

mulative previous citations begin to increase after 2007. Consistently increas-ing effect of previous citation count in both disciplines after controlling JIFdemonstrates that the paper-based measure now has separate meanings fromJIF in predicting received citations. The increased trend cannot be attributedto changes in average cumulative citation count in corpora and average receivedcitations by papers in year t. First, averages have constantly fluctuated since1998. The effect of previous citation count only increases in the most recentperiod. Also, coefficients are associated with variance of independent and de-pendent variables, thus the increase in averages do not necessarily lead to theincrease in coefficients.
Figure 6: Coefficients of journal influence factor and cumulative previous cita-tions (Social Work, 95% C.I)
●
● ●
●
●
●
●
●
●
●
●
●
●
●
●
●
0
1
2
1998 1999 2000 2001 2002 2003 2004 2005 2006 2007 2008 2009 2010 2011 2012 2013 2014
Year
Bet
a of
jour
nal I
F
●
●
●
●
●
●●
●
●
●
●
●
●
● ●
●
0.00
0.02
0.04
1998 1999 2000 2001 2002 2003 2004 2005 2006 2007 2008 2009 2010 2011 2012 2013 2014
Year
Bet
a of
cum
ulat
ive
cita
tions
14

Figure 716 provides the predicted number of being cited in year t when thenumber of previous cumulative citations is 0, 15, or 30 after controlling othervariables. Other variables are set to age 5, published in a journal with influ-ence factor 1, and the average number of references and page counts in eachdiscipline. By simulating expected number of being cited based on the samehypothetical scenarios, the figure helps understand the meaning of increase incoefficients of previous citation counts. In the figure, red lines represent SocialWork and blue lines represent sociology. In both disciplines, the influence ofprevious cumulative citations becomes more significant since 2008 than before.Particularly, in sociology, previous cumulative citations do not make any dif-ferences in predicted outcome; however, in 2014, an article cited 30 times isexpected to receive .25 more citations than an article never cited. The differ-ence is larger in Social Work, in 2014, an article cited 30 times is expected tobe cited 1 time more than an article never cited.
Figure 7: Predicted number of being cited in year t
0.5
1.0
1.5
2000 2005 2010
Year
Pre
dict
ed c
itatio
ns in
yea
r t Major
Social work
Sociology
Previous citations
0
15
30
16This figure lacks the predicted number of being cited in year t since the model for SocialWork in 2005 fails to converge.
15

4.3 Journal variability
Until now, we illustrate two main findings: first, the distribution of citations hasbeen more equal after 2005 than before; second, the importance of the measureof paper-based popularity, previous cumulative citations, has been increased inexplaining the number of received citations in time t. What two findings imply isthat the development of search technology enables the articles - published in lowtier journals and thus not broadly exposed to researchers - to be now searchedif a research topic and typed keywords are well matched. However, resultsabove do not provide direct evidence that the exposure of low tier journals hasbroadened. Therefore, in this section, we seek whether the role of journal statushas changed in predicting incoming citations by using the second citation-baseddata structure.
Figure 8 summarizes the percentage of papers cited at least once between1998 and 2001. We sort journals by JIF and divide it into three equal parts.The blue line in the figure represents high JIF group, green means medium, andred means low. While the percentage of papers at least cited once in high JIFgroup stays around 75% in all years, both medium and low groups experience arapid increase during the time period. This trend indicates that not only articlespublished in high tier journals, but others in medium or low tier journals alsobecome more cited often in recent years, which implies that the advancement oftechnology might help articles not published in top journals be easily exposedto researchers. While journals are still an important signal of the quality of apaper, it is now possible for the papers to have a chance to be read and citedregardless of their JIF.
Figure 8: Percentage of papers cited at least once in two years after publishedbetween 1998 and 2011 (Sociology)
0.00
0.25
0.50
0.75
1.00
2000 2004 2008
Published year
% o
f pap
ers
at le
ast c
ited
once
JournalInfluence Factor
Low
Medium
High
16

However, Figure 8 has a limit because it shows how many papers have achance to be cited at least once, but does not explain whether received citationsare rather concentrated on a few star papers in journal or equally distributed.Figure 9 suggests one way to answer this question by plotting average receivedcitations and standard deviation of a journal in 1998 and 2011. We take asquare root in y-axis to simplify the graph. While it is not possible to assumethat publications from two years are in the exact same condition because theaverage received citations has increased following the increase of publicationsin recent years, there are more number of journals with very high standarddeviation in low or medium tier journals in 2011 than 1998.17 A few journals inlow or medium tier journals now have high variance of citations, which meansthat journal status might not be a decisive factor in predicting popularity ofpublished papers.
Figure 9: Standard deviation of the number of cited in two years after published(Sociology)
●
●
●●●
●
●
●
●●
●●
●
●
●
●
●●
●
●
●
●
●
●
●
●
●
●
●
●
●
●
●
●
●
●
●
●
●
●
●
●
●
●●
●
●
●
●
●●
●
●
●●●
●●
●
●
●
●
●
●
●
●
●
●
●
●
●
●
●
●●
●
●
●
●
●
●
●
●
●
●
●
●●
●●
●●
●●
●
●
●
●
●
●
●
●
●
●
●
●
●
●
●
●
●
●
●
●
●
●
●
●
●
●
●●
●
●
●
●
●
●●
●
● ●
●●
● ●
●
●
●
Low Medium High
0.0 2.5 5.0 7.5 0.0 2.5 5.0 7.5 0.0 2.5 5.0 7.5
5
10
Average Receivied Citations
Sta
ndar
d D
evia
tion
Published year●
●
1998
2011
5 Discussion and conclusion
When preparing this manuscript, we used various search engines, includingGoogle Scholar, to find appropriate citations – the very tools we aim to an-alyze in this paper. Sometimes we had a specific paper in mind; other times wehad to find papers to either support or refute a statement in our paper. Veryrarely did we move beyond the first page. If other researchers are following sim-ilar search behaviors, the effect on what is searched and found in the literature,
17While we compare only two years for simplicity, this pattern is consistent over time; thereare no journals having standard deviation greater than 4 before 2003 in low and medium tier.
17

we claim, is worthy of investigation.How we search papers is dramatically different than how we searched papers
just a couple decades ago. If we know the title or DOI, it is generally notdifficult to download the PDF within minutes. In this study, this is not thekind of search we are investigating. Instead, we are trying to access the effect ofnew digital technologies on literature we don’t know exists – when searching newdisciplines, concepts, or appropriate citations. Are these technologies helpingus, collectively, find more or less of the relevant literature? Our objetive in thispaper is to investigate the effect of digital technology, academic search enginesand recommender systems on what is being searched, people’s academic careers,and novel discovery.
To investigate these questions, we start by looking at citation patterns in thefields of Sociology and Social work. We find that more of the literature is beingcited (i.e., less zero cited papers) but higher concentration of citations towardsthe star papers. This is consistent with what others have found [7, 1]. We cannotanswer whether these patterns are being strictly driven by academic searchengines, but they are suggestive given the introduction of these technologies.More work will need to be done for teasing out these relationships. Other factorscould be driving these patterns. For example, conferences, twitter, facebook andrelated technologies may be highlighting papers forgotten in previous decades.
In our results, we find that the impact of previous cumulative citations repre-senting the influence of academic recommender system has been up from around2008 to 2014. The similar pattern has been observed from the second set of anal-ysis; recently, more papers published in low- or medium-tier journals are citedat least once in two years and the variance of the number of received citationsamong papers published in the same journal is generally higher in 2014 than1998. This finding is consistent with how Google Scholar is designed, whichsuggests that more scholars are using a sort of new search engines in makingbibliographies of their research. While all papers are prone to be exposed de-pending on keywords they have mostly in title, which was impossible whenpeople walked into the library and picked up renowned journals, but at thesame time, when two papers include the same keywords, previously highly citedpapers tend to be up first in search page.
Figure 3 shows an interesting pattern as well. Since 2000, the citation distri-bution has diverged – a higher proportion of papers have received at least onecitation. If new digital technologies have been driving this divergence what ishappening since 2010? Since then, the decrease has stabilized. We plan to lookinto this in more detail. It could be that these technologies have been broadlyadopted. Therefore, the changes in citation distribution are less dramatic.
A limitation of this study is that we might ignore classic papers in the anal-ysis such as works written by Karl Marx or Thomas Kuhn that have explosiveinfluential power. The preferential attachment mechanism might be a betterexplanation if we only look at papers that have received several thousand ofcitations. However, we decide to exclude them for two reasons. First, as weexplained in the data structures, it is necessary to identify a pool of papers thatwould have been cited; if we decided to include classic papers, a pool of papers
18

would have covered publications from early 20th century. Second, the intentionof researchers citing recent papers and classic foundational ones might be differ-ent; researchers might cite more foundational papers when they need to bringauthority in their research to persuade readers to emphasize the significance ofthe study ([12]). Thus, we believed that it is more important to separate twodifferent kinds of citations and isolate the effect of technology than include starpapers to answer our main research questions.
We do not make any judgements whether the transforming behavior of re-searchers is beneficial in sustaining the healthy academic environment or viceversa. The literature roughly doubles every 20 years, and as this expansion con-tinues, it will be more and more difficult for scholars to keep up with even theirown fields. Recommendation algorithms will be needed for assisting scholars inthe literature searches. However, we argue that it is important to understandand monitor how the recommender system changes the way of doing research,particularly, as these recommendation algorithms become more come for everyday research. Based on our findings so far, the new technology does not pas-sively assist researchers’ job in searching literature, but may actively interferein researchers’ evaluation of which papers are more important to be cited fortheir scientific work.
While we mainly argue that the development of technological developmentin search engine drives transformation of researchers’ behavior and it is sug-gested by changing citation distributions over time, this change cannot be solelyattributed to the effect of technology. There are other possible scenarios thatmight lead to researchers’ behavior change. First, self-citations made by authorsas well as journals might have been recently increased, which helps increase thepercentage of papers at least cited once in low- or medium-tier journals. Asmore journals and researchers are evaluated their performance by the numberof citations that they receive, editors of journal and researchers might try moreto cite papers from submitting journals or themselves in a working article. Sec-ond, topics inside of disciplines might have been specialized, which leads toresearchers to cite inside of a specialized discipline regardless of journal pres-tige. It might also broaden the percentage of papers ever cited from non-top,but specialized journals. We could not examine these possibilities in our currentanalyses, but we plan to investigate this as a next step.
6 Acknowledgments
We want to thank Clarivate Analytics for providing the Web of Science data.
References
[1] Reka Albert and Albert-Laszlo Barabasi. Topology of evolving networks:local events and universality. Physical review letters, 85(24):5234, 2000.
19
[2] Joeran Beel, Stefan Langer, Marcel Genzmehr, Bela Gipp, Corinna Bre-itinger, and Andreas Nurnberger. Research paper recommender systemevaluation: a quantitative literature survey. In Proceedings of the Interna-tional Workshop on Reproducibility and Replication in Recommender Sys-tems Evaluation, pages 15–22. ACM, 2013.
[3] Joran Beel and Bela Gipp. Google scholar’s ranking algorithm: an intro-ductory overview. In Proceedings of the 12th International Conference onScientometrics and Informetrics (ISSI’09), volume 1, pages 230–241. Riode Janeiro (Brazil), 2009.
[4] Lutz Bornmann, Rudiger Mutz, Christoph Neuhaus, and Hans-DieterDaniel. Citation counts for research evaluation: standards of good prac-tice for analyzing bibliometric data and presenting and interpreting results.Ethics in science and environmental politics, 8(1):93–102, 2008.
[5] Erik Brynjolfsson, Yu Hu, and Duncan Simester. Goodbye pareto principle,hello long tail: The effect of search costs on the concentration of productsales. Management Science, 57(8):1373–1386, 2011.
[6] Quentin L Burrell. The bradford distribution and the gini index. Sciento-metrics, 21(2):181–194, 1991.
[7] D. J. de Solla Price. Networks of scientific papers. Science, 149:510–515,1965.
[8] Anita Elberse. Should you invest in the long tail? Harvard business review,86(7/8):88, 2008.
[9] James A. Evans. Electronic publication and the narrowing of science andscholarship. Science, 321(5887):395–399, 2008.
[10] Daniel Fleder and Kartik Hosanagar. Blockbuster culture’s next rise orfall: The impact of recommender systems on sales diversity. Managementscience, 55(5):697–712, 2009.
[11] Jim Giles. Science in the web age: Start your engines. Nature,438(7068):554–555, 2005.
[12] Lowell L Hargens. Using the literature: Reference networks, reference con-texts, and the social structure of scholarship. American sociological review,pages 846–865, 2000.
[13] Tad Hogg and Kristina Lerman. Disentangling the effects of social signals.arXiv preprint arXiv:1410.6744, 2014.
[14] Qing Ke, Emilio Ferrara, Filippo Radicchi, and Alessandro Flammini.Defining and identifying sleeping beauties in science. Proceedings of theNational Academy of Sciences, 112(24):7426–7431, 2015.
20

[15] Vincent Lariviere, Veronique Kiermer, Catriona J MacCallum, Marcia Mc-Nutt, Mark Patterson, Bernd Pulverer, Sowmya Swaminathan, Stuart Tay-lor, and Stephen Curry. A simple proposal for the publication of journalcitation distributions. Biorxiv, page 062109, 2016.
[16] Kristina Lerman and Tad Hogg. Leveraging position bias to improve peerrecommendation. PloS one, 9(6):e98914, 2014.
[17] Freda B Lynn. Diffusing through disciplines: Insiders, outsiders, and so-cially influenced citation behavior. Social Forces, 93(1):355–382, 2014.
[18] Stasa Milojevic, Filippo Radicchi, and Judit Bar-Ilan. Citation successindex an intuitive pair-wise journal comparison metric. Journal of Infor-metrics, 11(1):223 – 231, 2017.
[19] Raj K Pan, Alexander M Petersen, Fabio Pammolli, and Santo Fortunato.The memory of science: Inflation, myopia, and the knowledge network.arXiv preprint arXiv:1607.05606, 2016.
[20] Matthew J Salganik, Peter Sheridan Dodds, and Duncan J Watts. Ex-perimental study of inequality and unpredictability in an artificial culturalmarket. science, 311(5762):854–856, 2006.
[21] Alexander Serenko and John Dumay. Citation classics published in knowl-edge management journals. part ii: studying research trends and dis-covering the google scholar effect. Journal of Knowledge Management,19(6):1335–1355, 2015.
[22] Daniel Torres-Salinas, Alvaro Cabezas-Clavijo, and Evaristo Jimenez-Contreras. Altmetrics: New indicators for scientific communication in web2.0. arXiv preprint arXiv:1306.6595, 2013.
[23] Alex Verstak, Anurag Acharya, Helder Suzuki, Sean Henderson, MikhailIakhiaev, Cliff Chiung Yu Lin, and Namit Shetty. On the shoulders of gi-ants: The growing impact of older articles. arXiv preprint arXiv:1411.0275,2014.
[24] J.D. West, T.C. Bergstrom, and C.T. Bergstrom. The eigenfactor metrics:A network approach to assessing scholarly journals. College and ResearchLibraries, 71(3):236–244, 2010.
[25] Jevin D West, Michael C Jensen, Ralph J Dandrea, Gregory J Gordon,and Carl T Bergstrom. Author-level eigenfactor metrics: Evaluating theinfluence of authors, institutions, and countries within the social scienceresearch network community. Journal of the American Society for Infor-mation Science and Technology, 64(4):787–801, 2013.
[26] Alejandro Zentner, Michael Smith, and Cuneyd Kaya. How videorental patterns change as consumers move online. Management Science,59(11):2622–2634, 2013.
21

Appendices
A Descriptive statistics (Sociology)
Year Totalpapers
published
Totalcitations
made
Averagecitations
Cites tocorpus
Percentof cites
to corpus
Totaljournals
1998 1577 62280 42 3743 6.0% 901999 1631 63712 42 3674 5.8% 912000 1744 70369 42 3920 5.6% 912001 1680 67862 42 3904 5.8% 912002 1620 69074 45 3533 5.1% 922003 1699 72842 44 3936 5.4% 922004 1674 72802 46 3679 5.0% 992005 1763 78314 45 3853 4.9% 1012006 1963 90863 47 4073 4.5% 1022007 2185 99823 47 4752 4.8% 1042008 2658 121584 47 5367 4.4% 1112009 2812 132025 48 5854 4.4% 1272010 3296 165696 51 7885 4.8% 1292011 3569 185759 53 8123 4.4% 1292012 3781 193628 52 8988 4.6% 1282013 4065 208501 52 10118 4.8% 1272014 3635 189883 53 9296 4.9% 123
Table 1: Bibliography (Sociology)
22

Year Totalcitations
WOS (%) WOS +10-year
(%)
WOS +10-year +English +
Article(%)
(Will beadded)
WOS +10-year +English +Article +Sociology
(%)
1998 65079 62.7 39.6 6.01999 68457 61.7 39.4 5.82000 72938 61.7 38.2 5.62001 70145 62.1 37.2 5.82002 70602 60.8 36.2 5.12003 74622 60.6 36.6 5.42004 74695 60.8 35.9 5.02005 82045 60.4 36.2 4.92006 92361 59.7 35.3 4.52007 102595 61.2 37.1 4.82008 124669 59.2 35.5 4.42009 134046 58.4 35.3 4.42010 168143 57.4 34.4 4.82011 189040 53.1 30.4 4.42012 195472 38.2 22.2 4.62013 210669 39.6 22.7 4.82014 193204 41.2 23.5 4.9
Table 2: Origin of citations (Sociology)
23

Year Yearwindow
Totalpapers in
corpus
Totalreceivedcitations
Paperscited
at leastonce
Percentageof papers
citedat least
once1998 1988-1997 16072 3743 2587 16%1999 1989-1998 15976 3674 2555 16%2000 1990-1999 15910 3920 2637 17%2001 1991-2000 16074 3904 2680 17%2002 1992-2001 16105 3533 2481 15%2003 1993-2002 16171 3936 2694 17%2004 1994-2003 16312 3679 2564 16%2005 1995-2004 16389 3853 2687 16%2006 1996-2005 16581 4073 2801 17%2007 1997-2006 16977 4752 3135 18%2008 1998-2007 17536 5367 3606 21%2009 1999-2008 18617 5854 3824 21%2010 2000-2009 19798 7885 4799 24%2011 2001-2010 21350 8123 4959 23%2012 2002-2011 23239 8988 5573 24%2013 2003-2012 25400 10118 6157 24%2014 2004-2013 27766 9296 5977 22%
Table 3: Target corpus (Sociology)
Age Pagecount
Referencecount
Previouscumula-
tivecita-tions
Journalinflu-ence
factor
Age 1.000 -0.062 0.019 0.130 0.054Page count 1.000 0.487 0.345 0.157
Reference count 1.000 0.626 0.228Previous cumulative citations 1.000 0.054
Journal influence factor 1.000
Table 4: Correlation of variables in 1998 (Sociology)
24

B Descriptive statistics (Social Work)
Year Totalpapers
published
Totalcitations
made
Averagecitations
Cites tocorpus
Percentof cites
to corpus
Totaljournals
1998 932 31364 34 2083 6.6% 361999 955 33838 36 2434 7.2% 362000 943 34548 37 2569 7.4% 362001 893 31908 36 2269 7.1% 362002 916 33462 37 2402 7.2% 362003 893 33223 37 2403 7.2% 362004 928 36731 40 2441 6.7% 342005 981 38859 40 2560 6.6% 352006 1106 42300 39 2643 6.2% 362007 1222 48427 40 2967 6.1% 362008 1344 55064 41 3484 6.3% 392009 1553 62728 41 4084 6.5% 422010 1694 74537 44 4873 6.5% 442011 1721 77208 45 5048 6.5% 422012 1771 80376 45 5344 6.7% 432013 1790 81789 46 5338 6.5% 412014 1691 78779 47 5876 7.5% 41
Table 5: Bibliography (Social Work)
25

Year Totalcitations
WOS (%) WOS +10-year
(%)
WOS +10-year +English +
Article(%)
(Will beadded)
WOS +10-year +English +
Article(%) +SocialWork
1998 31453 72.5 50.8 6.61999 34125 72.9 50.2 7.22000 35150 71.0 48.1 7.42001 31941 70.8 47.9 7.12002 33482 70.0 47.4 7.22003 33653 69.9 46.3 7.22004 36892 69.1 45.6 6.72005 39353 69.6 45.9 6.62006 42752 68.7 45.9 6.22007 48442 68.8 46.1 6.12008 55377 67.0 43.7 6.32009 63109 66.9 44.6 6.52010 75593 65.6 43.4 6.52011 77866 61.0 39.4 6.52012 80470 45.9 29.0 6.72013 81927 47.9 30.0 6.52014 79740 49.0 30.5 7.5
Table 6: Origin of citations (Social Work)
26

Year Yearwindow
Totalpapers in
corpus
Totalreceivedcitations
Paperscited
at leastonce
Percentageof papers
citedat least
once1998 1988-1997 8428 2083 1536 18%1999 1989-1998 8639 2434 1656 19%2000 1990-1999 8848 2569 1736 20%2001 1991-2000 9054 2269 1599 18%2002 1992-2001 9102 2402 1645 18%2003 1993-2002 9176 2403 1732 19%2004 1994-2003 9248 2441 1716 19%2005 1995-2004 9340 2560 1758 19%2006 1996-2005 9336 2643 1805 19%2007 1997-2006 9472 2967 1981 21%2008 1998-2007 9769 3484 2304 24%2009 1999-2008 10181 4084 2541 25%2010 2000-2009 10779 4873 2864 27%2011 2001-2010 11530 5048 3001 26%2012 2002-2011 12358 5344 3308 27%2013 2003-2012 13213 5338 3315 25%2014 2004-2013 14110 5876 3570 25%
Table 7: Target corpus (Social Work)
Age Pagecount
Referencecount
Previouscumula-
tivecita-tions
Journalinflu-ence
factor
Age 1.000 -0.110 -0.012 0.162 0.127Page count 1.000 0.294 0.250 -0.111
Reference count 1.000 0.557 0.151Previous cumulative citations 1.000 -0.032
Journal influence factor 1.000
Table 8: Correlation of variables in 1998 (Social Work)
27

C GLM (Binomial) results
Figure 10: Coefficients of journal influence of factor and cumulative citations(Sociology, Binomial model)
●
●
●
● ●
●
●
●
●
●
●
●
●
●
●
●●
0.00
0.25
0.50
0.75
1.00
1998 1999 2000 2001 2002 2003 2004 2005 2006 2007 2008 2009 2010 2011 2012 2013 2014
Year
Bet
a of
jour
nal I
F
●
●●
●
●
●
●
●
●
●
●
● ●
●
●
●
●
−0.01
0.00
0.01
0.02
1998 1999 2000 2001 2002 2003 2004 2005 2006 2007 2008 2009 2010 2011 2012 2013 2014
Year
Bet
a of
cum
ulat
ive
cita
tions
28

Figure 11: Coefficients of journal influence of factor and cumulative citations(Social Work, Binomial model)
●
●●
●
●
●
●
●
●
●
●
●
●
●
●
●
●
0
1
2
1998 1999 2000 2001 2002 2003 2004 2005 2006 2007 2008 2009 2010 2011 2012 2013 2014
Year
Bet
a of
jour
nal I
F
●
●
●
●
●
●
●
●
●
●
●
●
●
●
●
●
●
0.00
0.02
0.04
1998 1999 2000 2001 2002 2003 2004 2005 2006 2007 2008 2009 2010 2011 2012 2013 2014
Year
Bet
a of
cum
ulat
ive
cita
tions
29

Figure 12: Predicted probability of being cited in year t (Binomial model)
0.1
0.2
0.3
0.4
0.5
0.6
2000 2005 2010
Year
Pre
dict
ed n
umbe
r of
cita
tions
in y
ear
t
Cumulative citations
0
15
30
Major
Social work
Sociology
30