Embed Size (px)
Citation preview
Research ArticleECG Signal Detection and Classification of Heart RhythmDiseases Based on ResNet and LSTM
Qiyang Xie,1,2 Xingrui Wang,1 Hongyu Sun,1 Yongtao Zhang,3 and Xiang Lu 1
1College of Electronic and Information Engineering, Shandong University of Science and Technology, Qingdao 266590, China2School of Information and Communication Engineering, University of Electronic Science and Technology of China,Chengdu 610054, China3Department of Cardiology, Affiliated Hospital of Qingdao University, Qingdao, 266000 Shandong, China
Correspondence should be addressed to Xiang Lu; [email protected]
Received 1 September 2021; Accepted 25 October 2021; Published 10 November 2021
Academic Editor: Naixue Xiong
Copyright © 2021 Qiyang Xie et al. This is an open access article distributed under the Creative Commons Attribution License,which permits unrestricted use, distribution, and reproduction in any medium, provided the original work is properly cited.
Arrhythmia is one of the most threatening diseases in all kinds of cardiovascular diseases. It is important to achieve efficient andaccurate automatic detection of arrhythmias for clinical diagnosis and treatment of cardiovascular diseases. Based on previousresearch on electrocardiogram (ECG) automatic detection and classification algorithm, this paper uses the ResNet34 networkto learn the morphological characteristics of ECG signals and get the significant information of signals, then passes into athree-layer stacked long-term and short-term memory network to get the context dependency of the features. Finally, fourclassification tasks are implemented on the PhysioNet Challenge 2017 test dataset by using the softmax function. Theactivation function is changed from the ReLu function to the mish function in this model. Negative information of ECGsignals is considered in the training process, which makes the model have more stable and accurate classification ability. Inaddition, this paper calculates and compares the average information entropy of correctly classified samples and incorrectlyclassified samples in the test set. Moreover, it eliminates the impact of obvious signal abnormalities (redundancy or loss) onthe model classification results, to more comprehensively and accurately explain the classification effect and performance of themodel. After eliminating the possibility of abnormal signal, the ResNet34-LSTM3 model obtained an average F1 score of 0.861and an average area under the receiver operating characteristic curve (ROC) of 0.972 on the test dataset, which indicates thatthe model can effectively extract the characteristics of ECG signals and diagnose arrhythmia diseases. Comparing the results ofthe ResNet34 model and ResNet-18 model on the same test dataset, we can see that the improved model in this paper has abetter classification and recognition effect on ECG signals as a whole, which can identify atrial fibrillation diseases more effectively.
1. Introduction
With the increasing pressure on people’s lives and work, car-diovascular disease has gradually become one of the impor-tant diseases threatening human life and health. Accordingto the report of the World Health Organization, the mortal-ity of cardiovascular disease ranks first among all kinds ofdiseases, accounting for 33.3% of other diseases. Arrhythmiais a kind of cardiovascular disease with a high incidence rateand high risk in all cardiovascular diseases. Atrial fibrillation(AF) is the most common arrhythmia disease. The clinicalmanifestations of patients are atrial arrhythmia or ineffectivecontractions. These diseases often occur in the elderly popu-
lation and have a high incidence rate and long course. It iseasy to cause heart failure, stroke, and other complications,which pose a serious threat to the safety of patients. There-fore, early and accurate detection of this kind of arrhythmiais an important challenge in clinical work. At present, themain tool for arrhythmia diagnosis is the electrocardiogram(ECG). By analyzing the ECG signal of patients, medicalworkers can make an accurate diagnosis of different typesof arrhythmias. However, this kind of manual detectionmethod relying on the clinical experience and a lot of profes-sional knowledge of medical workers is often prone to makemistakes [1], and it also needs to invest a lot of manpowerand energy. With the continuous development and maturity
HindawiAdvances in Mathematical PhysicsVolume 2021, Article ID 5862017, 11 pageshttps://doi.org/10.1155/2021/5862017
of computer technology and electronic information technol-ogy, the task of using a computer to analyze ECG signals torealize automatic detection of arrhythmia has become aresearch hotspot at this stage, which can provide a moreeffective and reliable diagnosis basis for medical workers,thereby alleviating the investment in human resources [2].
The existing ECG classification algorithms usuallyinclude signal preprocessing, such as wavelet transformand manual feature extraction, but the amount of computa-tion will increase the delay of the real-time classification sys-tem. In recent years, deep learning algorithm with theiradvantages of automatic learning features is increasinglyused in the field of health care, such as medical image recog-nition and segmentation, time series data monitoring, andanalysis. At present, the outstanding algorithm can establishan end-to-end DNN network to learn the characteristics ofECG records by using the extensive digital characteristicsof ECG data, which saves a lot of signal preprocessing steps.Because the performance of DNN increases with the amountof training data, this method can make good use of theextensive digitization of ECG data.
The rest of this paper is organized as follows. The secondsection reviews the related research. Datasets and methodsare described in the third section. The fourth section intro-duces and analyzes the experimental results. The fifthsection summarizes the advantages and disadvantages of thismethod and puts forward the prospects.
2. Related Work
The common classification task of automatic detection ofECG signals usually has three steps, which are preprocess-ing, signal, feature extraction, and identification classifica-tion [3]. Since ECG signals are acquired using an ECGacquisition recorder, the original signal would be mixed withseveral noise and invalid signals. In general, low-pass filters,wavelet transform, and other relatively classical denoisingmethods are used in the preprocessing step. After signalpreprocessing, feature extraction of the signal is performed.The traditional feature extraction methods use the discreteFourier transform or wavelet transform to extract themorphological features of time series signals [4, 5], such asslope, amplitude, peaks, interval, and other characteristicinformation, and compose the feature vector addition to alltypes of traditional machine learning algorithms, such asprincipal component analysis and independent componentanalysis. More efficient, reliable, and compact eigenvectorscan be obtained from ECG signals. These traditional featureextraction algorithms need to provide hand-crafted orfeature-specific implications. However, the selection andcombination of features often require expertise, and theselection process is time consuming [6]. With the develop-ment of deep learning theory, researchers worldwide beganto use deep learning algorithms to automatically extractfeatures of interest from data.
In a deep learning-based arrhythmia detection study,Kiranyaz et al. [7] developed a convolutional neural network(CNN) classification algorithm based on one-dimensionalconvolution for the corresponding disease class of ECG,
which can accomplish the basic classification tasks but haslow sensitivity for arrhythmia classification of sveb type.Rajpurkar et al. [8] proposed a convolutional neural networkalgorithm with residual structure, which utilized the electro-cardiographic signal collected from a single-lead wearabledevice for the detection of arrhythmia information [9] andused the AlexNet network as input bispectral spectrum ofECG signal, and the experiment finally got an average accu-racy of 91.3%.Mostayed et al. [10] proposed a recurrentneural network algorithm; they trained the 12 lead ECG sig-nal inputs into a model composed of two bidirectional longshort-term memory (LSTM) networks to detect pathologiesin the signal. Yildirim [11] used wavelet transform todecompose the ECG signal into a wavelet sequence, thenentered into a two-way LSTM model for training and classi-fication, and obtained a recognition accuracy of 99.39%under ideal conditions. Subsequently, Saadatnejad et al.[12] proposed a lightweight feature automatic extractionmethod combining wavelet transform with LSTM network,which could realize continuous real-time classification ofelectrocardiographic signals. Feng et al. [13] proposed a16-layer convolutional neural network and combined it witha long-term memory network to realize multichannel classi-fication, which achieved 95.4% accuracy in classifying myo-cardial infarction disease in the PTB database.
In addition to the above deep learning algorithms thatdirectly utilize the one-dimensional ECG data for training,literature [14] transformed three adjacent beats in the ECGsignal into a two-dimensional coupling matrix, and thismatrix obtained the correlation between signal beat andmorphological information [15, 16] Jun et al. [17] convertedeach beat in the signal into a two-dimensional gray-scaleimage, which was then taken as input to a 2D convolutionalneural network. Then, such 2D methods need to convert 1Dcardioelectrical signals into 2D information, which alsooccupies harder disk space while increasing the computa-tional cost. In conclusion, many existing algorithms sufferfrom complicated preprocessing processes [18, 19] and hightime costs [17].
3. ECG Dataset Introduction and Resnet34-LSTM3 Classification and Detection Method
Based on the end-to-end network characteristics, this studytries to combine a 34-layer ResNet network (ResNet34) withthree stacked LSTM networks (LSTM-3) in combinationwith previous experience. Moreover, this model does notneed too complex procedures such as signal preprocessingand manual feature extraction, and it uses the ResNet34network to learn the morphological features of electrocar-diographic signals and acquire significant information ofthe signal (the features extracted by the network are mainlythe deep-level abnormal waveform feature information con-tained in the F wave, P wave, and QRS complex in the ECGsignal). The context dependence of features was thenacquired utilizing a three-layer stacked LSTM network.Finally, a multiclassification task on the PhysioNet challenge2017 (https://physionet.org/challenge/2017/) test dataset wasimplemented through the softmax function. This model
2 Advances in Mathematical Physics
utilizes the max pooling layer, dropout layer, and batch nor-malization layer several times to optimize the calculationsand improve the classification accuracy. At the same time,it is intended to change the activation function from theReLu function to the Mish function so that the model takesinto account the negative value information of the ECGsignal in the training process, while making the model morestable. In addition, this paper uses the model to classifyECG signals and calculates and compares the average infor-mation entropy of correctly classified samples and incor-rectly classified samples. It eliminates the impact ofobvious signal abnormalities (redundancy or loss) on themodel classification results later, to more comprehensivelyand accurately explain the classification effect and perfor-mance of the model.
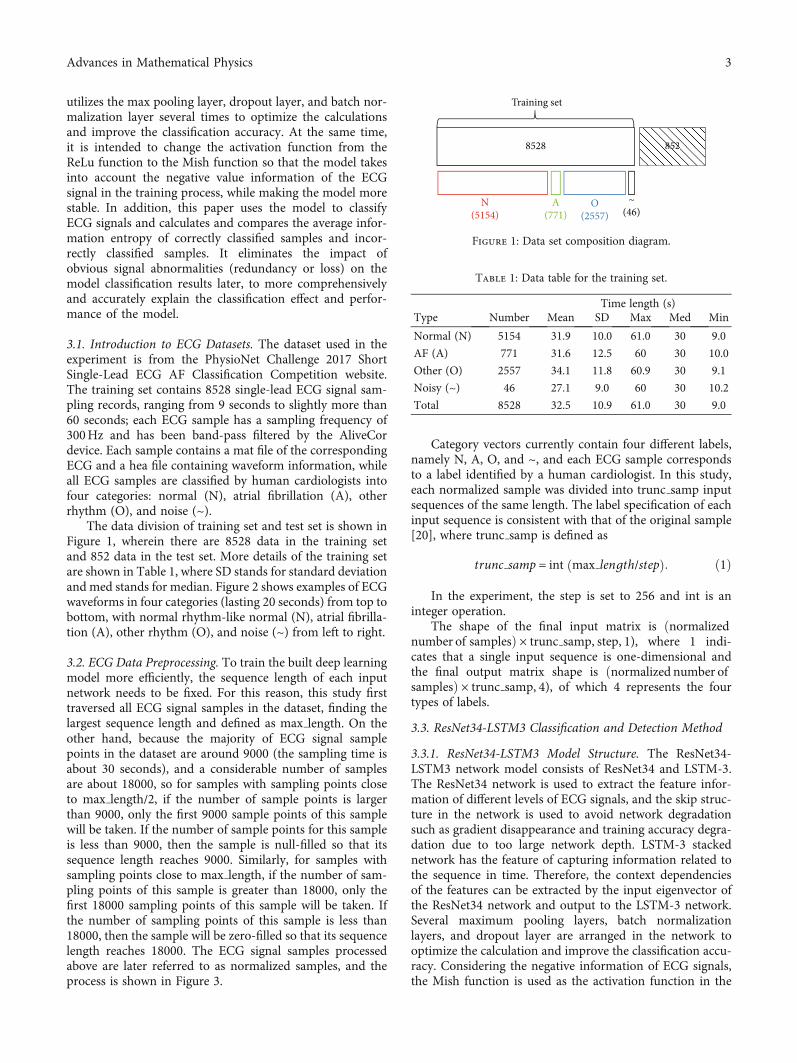
3.1. Introduction to ECG Datasets. The dataset used in theexperiment is from the PhysioNet Challenge 2017 ShortSingle-Lead ECG AF Classification Competition website.The training set contains 8528 single-lead ECG signal sam-pling records, ranging from 9 seconds to slightly more than60 seconds; each ECG sample has a sampling frequency of300Hz and has been band-pass filtered by the AliveCordevice. Each sample contains a mat file of the correspondingECG and a hea file containing waveform information, whileall ECG samples are classified by human cardiologists intofour categories: normal (N), atrial fibrillation (A), otherrhythm (O), and noise (~).
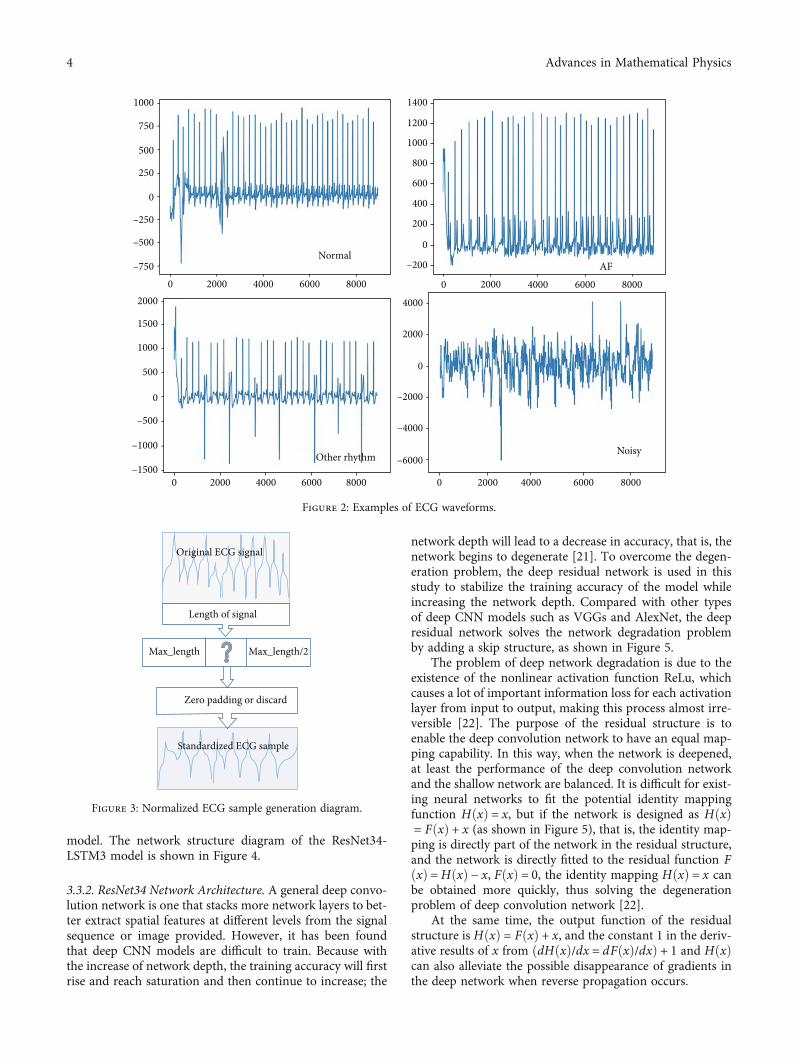
The data division of training set and test set is shown inFigure 1, wherein there are 8528 data in the training setand 852 data in the test set. More details of the training setare shown in Table 1, where SD stands for standard deviationand med stands for median. Figure 2 shows examples of ECGwaveforms in four categories (lasting 20 seconds) from top tobottom, with normal rhythm-like normal (N), atrial fibrilla-tion (A), other rhythm (O), and noise (~) from left to right.
3.2. ECG Data Preprocessing. To train the built deep learningmodel more efficiently, the sequence length of each inputnetwork needs to be fixed. For this reason, this study firsttraversed all ECG signal samples in the dataset, finding thelargest sequence length and defined as max length. On theother hand, because the majority of ECG signal samplepoints in the dataset are around 9000 (the sampling time isabout 30 seconds), and a considerable number of samplesare about 18000, so for samples with sampling points closeto max length/2, if the number of sample points is largerthan 9000, only the first 9000 sample points of this samplewill be taken. If the number of sample points for this sampleis less than 9000, then the sample is null-filled so that itssequence length reaches 9000. Similarly, for samples withsampling points close to max length, if the number of sam-pling points of this sample is greater than 18000, only thefirst 18000 sampling points of this sample will be taken. Ifthe number of sampling points of this sample is less than18000, then the sample will be zero-filled so that its sequencelength reaches 18000. The ECG signal samples processedabove are later referred to as normalized samples, and theprocess is shown in Figure 3.
Category vectors currently contain four different labels,namely N, A, O, and ~, and each ECG sample correspondsto a label identified by a human cardiologist. In this study,each normalized sample was divided into trunc samp inputsequences of the same length. The label specification of eachinput sequence is consistent with that of the original sample[20], where trunc samp is defined as
trunc samp = int max length/stepð Þ: ð1Þ
In the experiment, the step is set to 256 and int is aninteger operation.
The shape of the final input matrix is ðnormalizednumber of samplesÞ × trunc samp, step, 1), where 1 indi-cates that a single input sequence is one-dimensional andthe final output matrix shape is ðnormalized number ofsamplesÞ × trunc samp, 4), of which 4 represents the fourtypes of labels.
3.3. ResNet34-LSTM3 Classification and Detection Method
3.3.1. ResNet34-LSTM3 Model Structure. The ResNet34-LSTM3 network model consists of ResNet34 and LSTM-3.The ResNet34 network is used to extract the feature infor-mation of different levels of ECG signals, and the skip struc-ture in the network is used to avoid network degradationsuch as gradient disappearance and training accuracy degra-dation due to too large network depth. LSTM-3 stackednetwork has the feature of capturing information related tothe sequence in time. Therefore, the context dependenciesof the features can be extracted by the input eigenvector ofthe ResNet34 network and output to the LSTM-3 network.Several maximum pooling layers, batch normalizationlayers, and dropout layer are arranged in the network tooptimize the calculation and improve the classification accu-racy. Considering the negative information of ECG signals,the Mish function is used as the activation function in the
8528
Training set
852
~(46)
O(2557)
A(771)
N(5154)
852852852852852852
Figure 1: Data set composition diagram.
Table 1: Data table for the training set.
Time length (s)Type Number Mean SD Max Med Min
Normal (N) 5154 31.9 10.0 61.0 30 9.0
AF (A) 771 31.6 12.5 60 30 10.0
Other (O) 2557 34.1 11.8 60.9 30 9.1
Noisy (~) 46 27.1 9.0 60 30 10.2
Total 8528 32.5 10.9 61.0 30 9.0
3Advances in Mathematical Physics
model. The network structure diagram of the ResNet34-LSTM3 model is shown in Figure 4.
3.3.2. ResNet34 Network Architecture. A general deep convo-lution network is one that stacks more network layers to bet-ter extract spatial features at different levels from the signalsequence or image provided. However, it has been foundthat deep CNN models are difficult to train. Because withthe increase of network depth, the training accuracy will firstrise and reach saturation and then continue to increase; the
network depth will lead to a decrease in accuracy, that is, thenetwork begins to degenerate [21]. To overcome the degen-eration problem, the deep residual network is used in thisstudy to stabilize the training accuracy of the model whileincreasing the network depth. Compared with other typesof deep CNN models such as VGGs and AlexNet, the deepresidual network solves the network degradation problemby adding a skip structure, as shown in Figure 5.
The problem of deep network degradation is due to theexistence of the nonlinear activation function ReLu, whichcauses a lot of important information loss for each activationlayer from input to output, making this process almost irre-versible [22]. The purpose of the residual structure is toenable the deep convolution network to have an equal map-ping capability. In this way, when the network is deepened,at least the performance of the deep convolution networkand the shallow network are balanced. It is difficult for exist-ing neural networks to fit the potential identity mappingfunction HðxÞ = x, but if the network is designed as HðxÞ= FðxÞ + x (as shown in Figure 5), that is, the identity map-ping is directly part of the network in the residual structure,and the network is directly fitted to the residual function FðxÞ =HðxÞ − x, FðxÞ = 0, the identity mapping HðxÞ = x canbe obtained more quickly, thus solving the degenerationproblem of deep convolution network [22].
At the same time, the output function of the residualstructure is HðxÞ = FðxÞ + x, and the constant 1 in the deriv-ative results of x from ðdHðxÞ/dx = dFðxÞ/dxÞ + 1 and HðxÞcan also alleviate the possible disappearance of gradients inthe deep network when reverse propagation occurs.
1000
750
500
250
0
–250
–500
–7502000 4000 6000 8000
Normal
02000
1500
1000
500
0
–500
–1000
–15002000 4000 6000 80000
4000
2000
0
–4000
–2000
–6000
2000 4000 6000 80000
1400
1200
1000
800
600
400
200
–200
0
0 2000AF
4000 6000 8000
Other rhythm Noisy
Figure 2: Examples of ECG waveforms.
Original ECG signal
Length of signal
Max_length Max_length/2
Zero padding or discard
Standardized ECG sample
Figure 3: Normalized ECG sample generation diagram.
4 Advances in Mathematical Physics
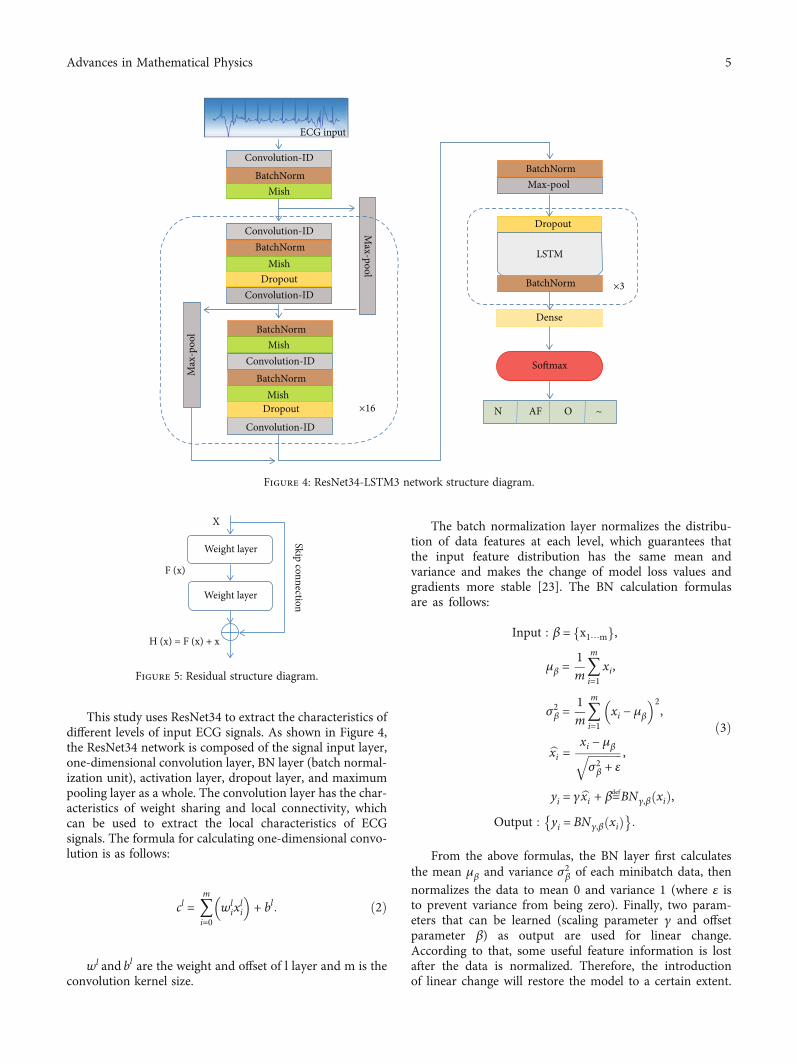
This study uses ResNet34 to extract the characteristics ofdifferent levels of input ECG signals. As shown in Figure 4,the ResNet34 network is composed of the signal input layer,one-dimensional convolution layer, BN layer (batch normal-ization unit), activation layer, dropout layer, and maximumpooling layer as a whole. The convolution layer has the char-acteristics of weight sharing and local connectivity, whichcan be used to extract the local characteristics of ECGsignals. The formula for calculating one-dimensional convo-lution is as follows:
cl = 〠m
i=0wl
ixli
� �+ bl: ð2Þ
wl and bl are the weight and offset of l layer and m is theconvolution kernel size.
The batch normalization layer normalizes the distribu-tion of data features at each level, which guarantees thatthe input feature distribution has the same mean andvariance and makes the change of model loss values andgradients more stable [23]. The BN calculation formulasare as follows:
Input : β = x1⋯mf g,
μβ =1m〠m
i=1xi,
σ2β =1m〠m
i=1xi − μβ
� �2,
bxi = xi − μβffiffiffiffiffiffiffiffiffiffiffiffiσ2β + ε
q ,
yi = γbxi + β≝BNγ,β xið Þ,Output : yi = BNγ,β xið Þ� �
:
ð3Þ
From the above formulas, the BN layer first calculatesthe mean μβ and variance σ2β of each minibatch data, thennormalizes the data to mean 0 and variance 1 (where ε isto prevent variance from being zero). Finally, two param-eters that can be learned (scaling parameter γ and offsetparameter β) as output are used for linear change.According to that, some useful feature information is lostafter the data is normalized. Therefore, the introductionof linear change will restore the model to a certain extent.
Convolution-ID
Convolution-ID
Convolution-ID
Convolution-ID
Convolution-ID
BatchNorm
BatchNorm
BatchNorm
BatchNorm
BatchNorm
BatchNorm
Mish
Mish
Mish
Mish
Dropout
Dropout
Dropout
Max
-poo
lMax-pool
Max-pool
LSTM
Dense
Softmax
N AF O ~
ECG input
×3
×16
Figure 4: ResNet34-LSTM3 network structure diagram.
Weight layer
Weight layer
X
F (x)
H (x) = F (x) + x
Skip connection
Figure 5: Residual structure diagram.
5Advances in Mathematical Physics
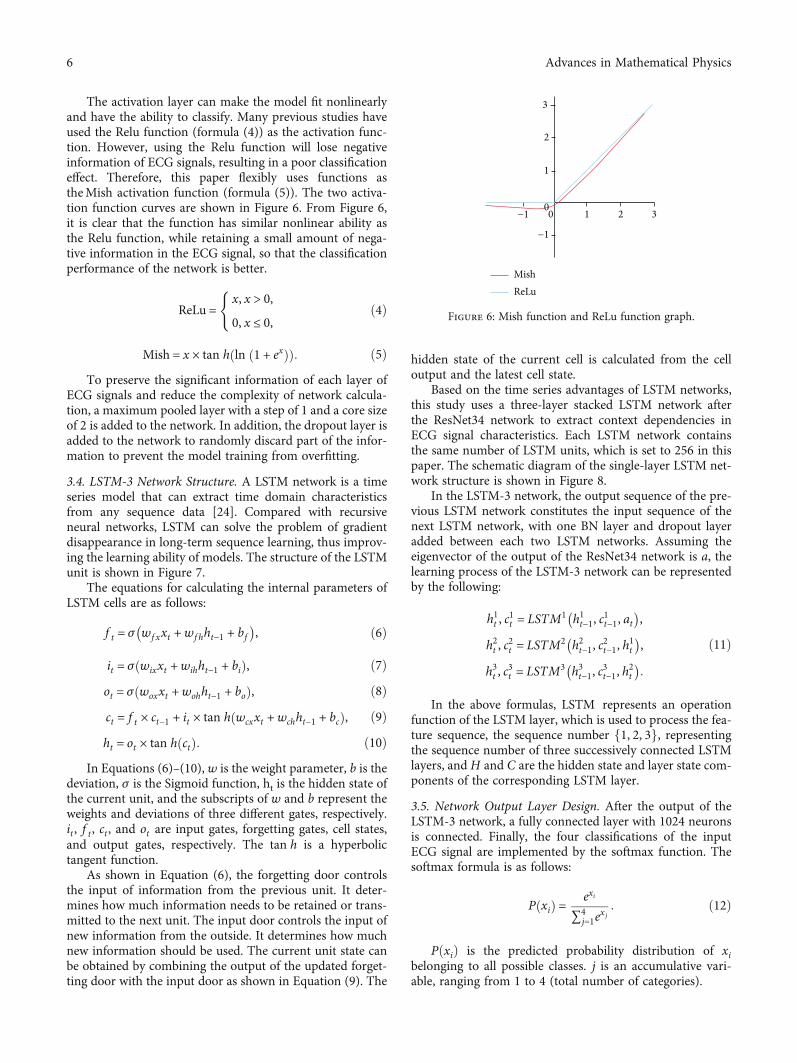
The activation layer can make the model fit nonlinearlyand have the ability to classify. Many previous studies haveused the Relu function (formula (4)) as the activation func-tion. However, using the Relu function will lose negativeinformation of ECG signals, resulting in a poor classificationeffect. Therefore, this paper flexibly uses functions astheMish activation function (formula (5)). The two activa-tion function curves are shown in Figure 6. From Figure 6,it is clear that the function has similar nonlinear ability asthe Relu function, while retaining a small amount of nega-tive information in the ECG signal, so that the classificationperformance of the network is better.
ReLu =x, x > 0,
0, x ≤ 0,
(ð4Þ
Mish = x × tan h ln 1 + exð Þð Þ: ð5ÞTo preserve the significant information of each layer of
ECG signals and reduce the complexity of network calcula-tion, a maximum pooled layer with a step of 1 and a core sizeof 2 is added to the network. In addition, the dropout layer isadded to the network to randomly discard part of the infor-mation to prevent the model training from overfitting.
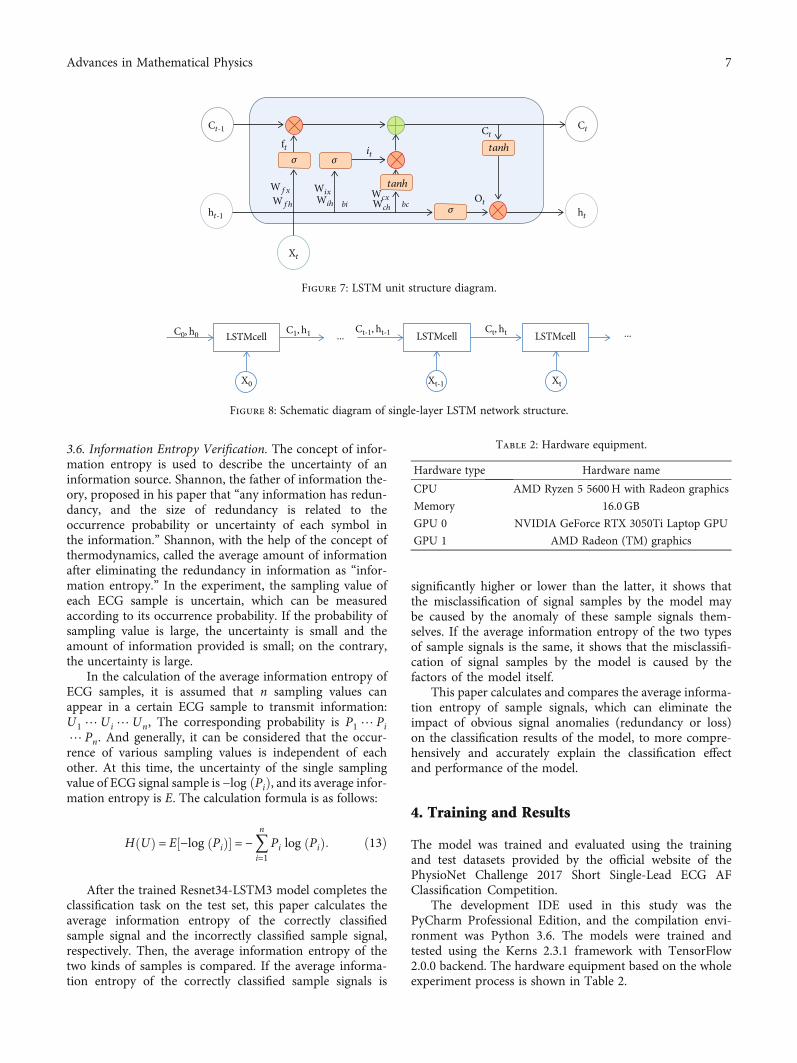
3.4. LSTM-3 Network Structure. A LSTM network is a timeseries model that can extract time domain characteristicsfrom any sequence data [24]. Compared with recursiveneural networks, LSTM can solve the problem of gradientdisappearance in long-term sequence learning, thus improv-ing the learning ability of models. The structure of the LSTMunit is shown in Figure 7.
The equations for calculating the internal parameters ofLSTM cells are as follows:
f t = σ wf xxt +wfhht−1 + bf� �
, ð6Þ
it = σ wixxt +wihht−1 + bið Þ, ð7Þot = σ woxxt +wohht−1 + boð Þ, ð8Þct = f t × ct−1 + it × tan h wcxxt +wchht−1 + bcð Þ, ð9Þht = ot × tan h ctð Þ: ð10Þ
In Equations (6)–(10), w is the weight parameter, b is thedeviation, σ is the Sigmoid function, ht is the hidden state ofthe current unit, and the subscripts of w and b represent theweights and deviations of three different gates, respectively.it , f t , ct , and ot are input gates, forgetting gates, cell states,and output gates, respectively. The tan h is a hyperbolictangent function.
As shown in Equation (6), the forgetting door controlsthe input of information from the previous unit. It deter-mines how much information needs to be retained or trans-mitted to the next unit. The input door controls the input ofnew information from the outside. It determines how muchnew information should be used. The current unit state canbe obtained by combining the output of the updated forget-ting door with the input door as shown in Equation (9). The
hidden state of the current cell is calculated from the celloutput and the latest cell state.
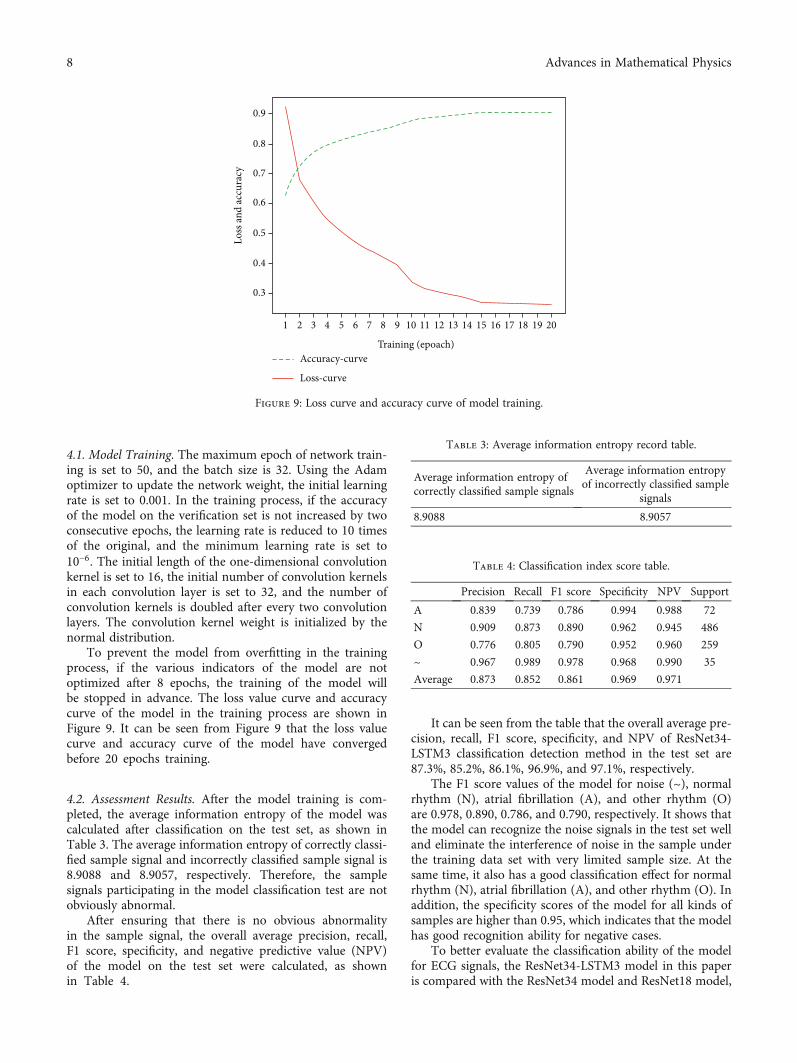
Based on the time series advantages of LSTM networks,this study uses a three-layer stacked LSTM network afterthe ResNet34 network to extract context dependencies inECG signal characteristics. Each LSTM network containsthe same number of LSTM units, which is set to 256 in thispaper. The schematic diagram of the single-layer LSTM net-work structure is shown in Figure 8.
In the LSTM-3 network, the output sequence of the pre-vious LSTM network constitutes the input sequence of thenext LSTM network, with one BN layer and dropout layeradded between each two LSTM networks. Assuming theeigenvector of the output of the ResNet34 network is a, thelearning process of the LSTM-3 network can be representedby the following:
h1t , c1t = LSTM1 h1t−1, c
1t−1, at
� �,
h2t , c2t = LSTM2 h2t−1, c
2t−1, h
1t
� �,
h3t , c3t = LSTM3 h3t−1, c
3t−1, h
2t
� �:
ð11Þ
In the above formulas, LSTM represents an operationfunction of the LSTM layer, which is used to process the fea-ture sequence, the sequence number f1, 2, 3g, representingthe sequence number of three successively connected LSTMlayers, and H and C are the hidden state and layer state com-ponents of the corresponding LSTM layer.
3.5. Network Output Layer Design. After the output of theLSTM-3 network, a fully connected layer with 1024 neuronsis connected. Finally, the four classifications of the inputECG signal are implemented by the softmax function. Thesoftmax formula is as follows:
P xið Þ = exi
∑4j=1e
xj: ð12Þ
PðxiÞ is the predicted probability distribution of xibelonging to all possible classes. j is an accumulative vari-able, ranging from 1 to 4 (total number of categories).
3
3
2
2
1
1−1
−1
00
MishReLu
Figure 6: Mish function and ReLu function graph.
6 Advances in Mathematical Physics
3.6. Information Entropy Verification. The concept of infor-mation entropy is used to describe the uncertainty of aninformation source. Shannon, the father of information the-ory, proposed in his paper that “any information has redun-dancy, and the size of redundancy is related to theoccurrence probability or uncertainty of each symbol inthe information.” Shannon, with the help of the concept ofthermodynamics, called the average amount of informationafter eliminating the redundancy in information as “infor-mation entropy.” In the experiment, the sampling value ofeach ECG sample is uncertain, which can be measuredaccording to its occurrence probability. If the probability ofsampling value is large, the uncertainty is small and theamount of information provided is small; on the contrary,the uncertainty is large.
In the calculation of the average information entropy ofECG samples, it is assumed that n sampling values canappear in a certain ECG sample to transmit information:U1 ⋯Ui ⋯Un, The corresponding probability is P1 ⋯ Pi⋯ Pn. And generally, it can be considered that the occur-rence of various sampling values is independent of eachother. At this time, the uncertainty of the single samplingvalue of ECG signal sample is −log ðPiÞ, and its average infor-mation entropy is E. The calculation formula is as follows:
H Uð Þ = E −log Pið Þ½ � = −〠n
i=1Pi log Pið Þ: ð13Þ
After the trained Resnet34-LSTM3 model completes theclassification task on the test set, this paper calculates theaverage information entropy of the correctly classifiedsample signal and the incorrectly classified sample signal,respectively. Then, the average information entropy of thetwo kinds of samples is compared. If the average informa-tion entropy of the correctly classified sample signals is
significantly higher or lower than the latter, it shows thatthe misclassification of signal samples by the model maybe caused by the anomaly of these sample signals them-selves. If the average information entropy of the two typesof sample signals is the same, it shows that the misclassifi-cation of signal samples by the model is caused by thefactors of the model itself.
This paper calculates and compares the average informa-tion entropy of sample signals, which can eliminate theimpact of obvious signal anomalies (redundancy or loss)on the classification results of the model, to more compre-hensively and accurately explain the classification effectand performance of the model.
4. Training and Results
The model was trained and evaluated using the trainingand test datasets provided by the official website of thePhysioNet Challenge 2017 Short Single-Lead ECG AFClassification Competition.
The development IDE used in this study was thePyCharm Professional Edition, and the compilation envi-ronment was Python 3.6. The models were trained andtested using the Kerns 2.3.1 framework with TensorFlow2.0.0 backend. The hardware equipment based on the wholeexperiment process is shown in Table 2.
ht-1
Wfx
Xt
ht
Ct
Wch
WcxWfh
WixWih
ft it
Ct
Ot
Ct-1
bcbi
tanh
tanh𝜎𝜎
𝜎
Figure 7: LSTM unit structure diagram.
C0, h0 C1, h1 Ct, htCt-1, ht-1... ...
X0 Xt-1 Xt
LSTMcellLSTMcellLSTMcell
Figure 8: Schematic diagram of single-layer LSTM network structure.
Table 2: Hardware equipment.
Hardware type Hardware name
CPU AMD Ryzen 5 5600H with Radeon graphics
Memory 16.0GB
GPU 0 NVIDIA GeForce RTX 3050Ti Laptop GPU
GPU 1 AMD Radeon (TM) graphics
7Advances in Mathematical Physics
4.1. Model Training. The maximum epoch of network train-ing is set to 50, and the batch size is 32. Using the Adamoptimizer to update the network weight, the initial learningrate is set to 0.001. In the training process, if the accuracyof the model on the verification set is not increased by twoconsecutive epochs, the learning rate is reduced to 10 timesof the original, and the minimum learning rate is set to10−6. The initial length of the one-dimensional convolutionkernel is set to 16, the initial number of convolution kernelsin each convolution layer is set to 32, and the number ofconvolution kernels is doubled after every two convolutionlayers. The convolution kernel weight is initialized by thenormal distribution.
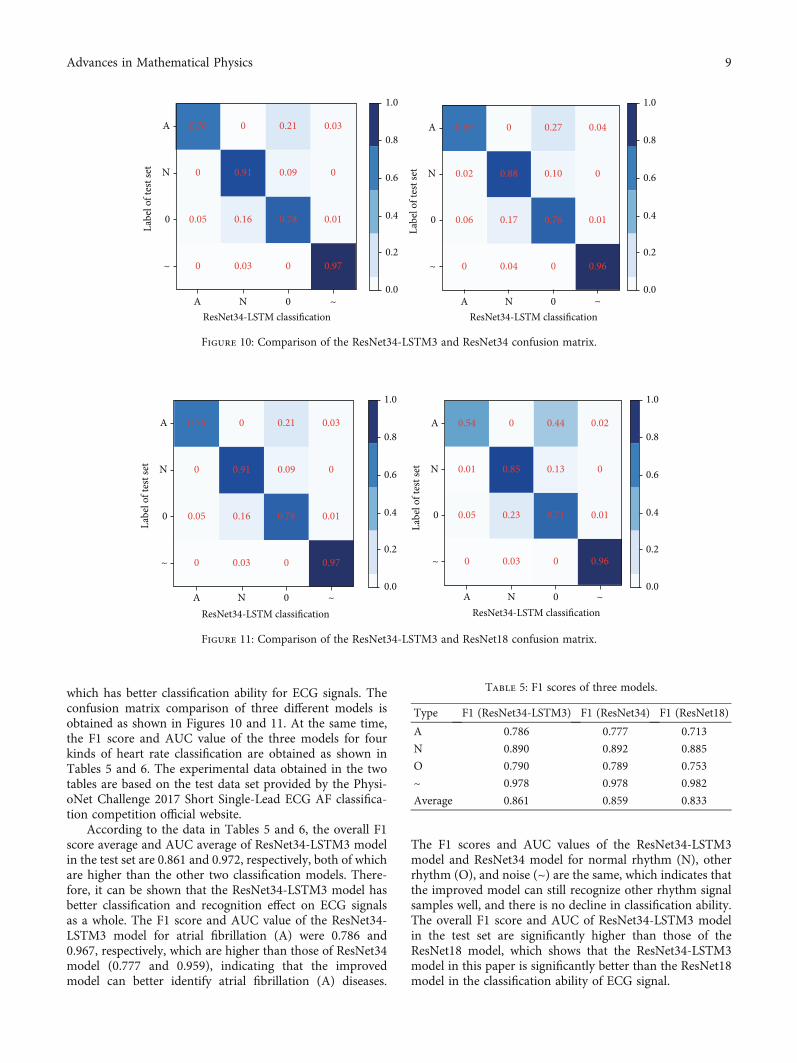
To prevent the model from overfitting in the trainingprocess, if the various indicators of the model are notoptimized after 8 epochs, the training of the model willbe stopped in advance. The loss value curve and accuracycurve of the model in the training process are shown inFigure 9. It can be seen from Figure 9 that the loss valuecurve and accuracy curve of the model have convergedbefore 20 epochs training.
4.2. Assessment Results. After the model training is com-pleted, the average information entropy of the model wascalculated after classification on the test set, as shown inTable 3. The average information entropy of correctly classi-fied sample signal and incorrectly classified sample signal is8.9088 and 8.9057, respectively. Therefore, the samplesignals participating in the model classification test are notobviously abnormal.
After ensuring that there is no obvious abnormalityin the sample signal, the overall average precision, recall,F1 score, specificity, and negative predictive value (NPV)of the model on the test set were calculated, as shownin Table 4.
It can be seen from the table that the overall average pre-cision, recall, F1 score, specificity, and NPV of ResNet34-LSTM3 classification detection method in the test set are87.3%, 85.2%, 86.1%, 96.9%, and 97.1%, respectively.
The F1 score values of the model for noise (~), normalrhythm (N), atrial fibrillation (A), and other rhythm (O)are 0.978, 0.890, 0.786, and 0.790, respectively. It shows thatthe model can recognize the noise signals in the test set welland eliminate the interference of noise in the sample underthe training data set with very limited sample size. At thesame time, it also has a good classification effect for normalrhythm (N), atrial fibrillation (A), and other rhythm (O). Inaddition, the specificity scores of the model for all kinds ofsamples are higher than 0.95, which indicates that the modelhas good recognition ability for negative cases.
To better evaluate the classification ability of the modelfor ECG signals, the ResNet34-LSTM3 model in this paperis compared with the ResNet34 model and ResNet18 model,
Accuracy-curve
Loss-curve
0.9
0.8
0.7
0.6
0.5
0.4
0.3
Loss
and
accu
racy
1 2 3 4 5 6 7 8 9 10 11 12 13 14 15 16 17 18 19 20
Training (epoach)
Figure 9: Loss curve and accuracy curve of model training.
Table 3: Average information entropy record table.
Average information entropy ofcorrectly classified sample signals
Average information entropyof incorrectly classified sample
signals
8.9088 8.9057
Table 4: Classification index score table.
Precision Recall F1 score Specificity NPV Support
A 0.839 0.739 0.786 0.994 0.988 72
N 0.909 0.873 0.890 0.962 0.945 486
O 0.776 0.805 0.790 0.952 0.960 259
~ 0.967 0.989 0.978 0.968 0.990 35
Average 0.873 0.852 0.861 0.969 0.971
8 Advances in Mathematical Physics
which has better classification ability for ECG signals. Theconfusion matrix comparison of three different models isobtained as shown in Figures 10 and 11. At the same time,the F1 score and AUC value of the three models for fourkinds of heart rate classification are obtained as shown inTables 5 and 6. The experimental data obtained in the twotables are based on the test data set provided by the Physi-oNet Challenge 2017 Short Single-Lead ECG AF classifica-tion competition official website.
According to the data in Tables 5 and 6, the overall F1score average and AUC average of ResNet34-LSTM3 modelin the test set are 0.861 and 0.972, respectively, both of whichare higher than the other two classification models. There-fore, it can be shown that the ResNet34-LSTM3 model hasbetter classification and recognition effect on ECG signalsas a whole. The F1 score and AUC value of the ResNet34-LSTM3 model for atrial fibrillation (A) were 0.786 and0.967, respectively, which are higher than those of ResNet34model (0.777 and 0.959), indicating that the improvedmodel can better identify atrial fibrillation (A) diseases.
The F1 scores and AUC values of the ResNet34-LSTM3model and ResNet34 model for normal rhythm (N), otherrhythm (O), and noise (~) are the same, which indicates thatthe improved model can still recognize other rhythm signalsamples well, and there is no decline in classification ability.The overall F1 score and AUC of ResNet34-LSTM3 modelin the test set are significantly higher than those of theResNet18 model, which shows that the ResNet34-LSTM3model in this paper is significantly better than the ResNet18model in the classification ability of ECG signal.
0.76 0.21
0.91
0.05 0.16 0.78 0.01
0.970.03
0.09
0.03 0.69 0.27
0.88 0.10
0.04
0.02
0.06 0.17
0.96
0.76 0.01
0.04
0
0
00
0 0
0 0
0A
N
0
~
A N ~0ResNet34-LSTM classification
A N ~0ResNet34-LSTM classification
1.0
0.8
0.6
0.4
0.2
0.0
1.0
0.8
0.6
0.4
0.2
0.0
Labe
l of t
est s
et
A
N
0
~
Labe
l of t
est s
et
Figure 10: Comparison of the ResNet34-LSTM3 and ResNet34 confusion matrix.
0.76 0.21
0.91
0.05 0.16 0.78 0.01
0.970.03
0.09
0.03
0 0
0 0
0A
N
0
~
A N ~0ResNet34-LSTM classification
1.0
0.8
0.6
0.4
0.2
0.0
Labe
l of t
est s
et
0.54 0.44
0.85 0.13
0.02
0.01
0.05 0.23
0.96
0.71 0.01
0.03
0
0
00
A N ~0ResNet34-LSTM classification
1.0
0.8
0.6
0.4
0.2
0.0
A
N
0
~
Labe
l of t
est s
et
Figure 11: Comparison of the ResNet34-LSTM3 and ResNet18 confusion matrix.
Table 5: F1 scores of three models.
Type F1 (ResNet34-LSTM3) F1 (ResNet34) F1 (ResNet18)
A 0.786 0.777 0.713
N 0.890 0.892 0.885
O 0.790 0.789 0.753
~ 0.978 0.978 0.982
Average 0.861 0.859 0.833
9Advances in Mathematical Physics
5. Conclusions
In this paper, based on the ResNet34 network, a three-layerstacked long-term and short-term memory networks areadded, and the Mish function is used as the activation func-tion. The final improved model can obtain the contextdependence of the feature and retain the negative informa-tion in the ECG signal. The average F1 score of 0.861 andthe average AUC value of 0.972 are obtained by the improvedResNet34-LSTM3 model on the PhysioNet challenge 2017test dataset, which shows that the model can effectivelyextract the characteristics of ECG signals and diagnosearrhythmia diseases. Comparing the evaluation results ofthe previous ResNet34 model and ResNet18 model on thesame test dataset, it can be seen that the improved modelhas a better classification and recognition effect on ECG sig-nals as a whole, and it can more effectively identify arrhyth-mias such as atrial fibrillation, which will provide a moreeffective and reliable diagnostic basis for medical workers.
There are some important limitations in this study. Theinput dataset of the experiment is PhysioNet challenge 2017Short Single-Lead ECG signal, which provides a limitedsignal compared with the standard 12 lead ECG signal.Therefore, whether the ResNet34-LSTM3 model classifica-tion performance is better in the 12 lead ECG signalsremains to be determined. In addition, when the algorithmis used clinically, it may be limited by the duration of ECGsignals, and the application of all kinds of algorithms,including the one presented algorithm, must eventually tai-lor specific ECG signal pretreatment methods for the targetclinical application. Therefore, in the next stage of the study,we consider segmenting the signal to supplement the signalsegment by copying other electrocardiogram signals in thesame category in order to maximize the use of information.In the future, we will conduct experiments with more typesof ECG data to prove the performance of our model.
In a word, the ResNet34-LSTM3 network model in thispaper can distinguish the signals with different concentriclaws in Short Single-Lead ECG signals, and its classifica-tion performance is also better than that of the predeces-sors in partial scores. If more tests are carried out in theclinical environment, this method may help medicalworkers improve the efficiency and accuracy of ECGclinical interpretation.
Data Availability
The data used to support the findings of this study areincluded within the article.
Conflicts of Interest
The authors declare that there is no conflict of interestregarding the publication of this paper.
Acknowledgments
This work is partially supported by the Shandong NaturalScience Foundation, China (No. ZR2020MF014). Theauthors would also like to thank the anonymous reviewersfor their valuable comments.
References
[1] Z. Golrizkhatami and A. Acan, “ECG classification usingthree-level fusion of different feature descriptors,” Expert Sys-tems with Applications, vol. 114, pp. 54–64, 2018.
[2] C. Chen, Z. Hua, R. Zhang, G. Liu, and W. Wen, “Automatedarrhythmia classification based on a combination network ofCNN and LSTM,” Biomedical Signal Processing and Control,vol. 57, article 101819, 2020.
[3] J. S. Huang, B. Q. Chen, N. Y. Zeng, X. C. Cao, and Y. Li,“Accurate classification of ECG arrhythmia using MOWPTenhanced fast compression deep learning networks,” Journalof Ambient Intelligence and Humanized Computing, vol. 2,2020.
[4] O. T. Inan, L. Giovangrandi, and G. Kovacs, “Robust neural-network-based classification of premature ventricular contrac-tions using wavelet transform and timing interval features,”IEEE Transactions on Bio-Medical Engineering, vol. 53,no. 12, pp. 2507–2515, 2006.
[5] Tran Hoai Linh, S. Osowski, and M. Stodolski, “On-line heartbeat recognition using Hermite polynomials and neuro-fuzzynetwork,” IEEE Transactions on Instrumentation and Mea-surement, vol. 52, no. 4, pp. 1224–1231, 2003.
[6] F. Murat, O. Yildirim, M. Talo, U. Baloglu, Y. Demir, andU. R. Acharya, “Application of deep learning techniquesfor heartbeats detection using ECG signals-analysis andreview,” Computers in Biology and Medicine, vol. 120, article103726, 2020.
[7] S. Kiranyaz, T. Ince, and M. Gabbouj, “Real-time patient-specific ECG classification by 1-D convolutional neural net-works,” IEEE Transactions on Biomedical Engineering,vol. 63, no. 3, pp. 664–675, 2016.
[8] P. Rajpurkar,A.Y.Hannun,M.Haghpanahi, C. Bourn, andA.Y.Ng, “Cardiologist-level arrhythmia detection with convolutionalneural networks,” 2017, https://arxiv.org/abs/1707.01836.
[9] H. Alquran, A. M. Alqudah, I. Abu-Qasmieh, A. al-Badarneh,and S. Almashaqbeh, “ECG classification using higher orderspectral estimation and deep learning techniques,”Neural Net-work World, vol. 29, no. 4, pp. 207–219, 2019.
Table 6: AUC scores of the three models.
Type AUC (ResNet34-LSTM3) AUC (ResNet34) AUC (ResNet18)
A 0.967 (0.962-0.972) 0.959 (0.954-0.965) 0.954 (0.949-0.959)
N 0.979 (0.978-0.981) 0.979 (0.978-0.981) 0.965 (0.963-0.967)
O 0.945 (0.942-0.949) 0.946 (0.943-0.949) 0.887 (0.883-0.892)
~ 0.998 (0.998-0.999) 0.999 (0.998-0.999) 0.998 (0.997-0.998)
Average 0.972 0.971 0.951
10 Advances in Mathematical Physics
[10] A. Mostayed, J. Luo, X. Shu, andW.Wee, “Classification of 12-lead ECG signals with bi-directional LSTM network,” 2018,https://arxiv.org/abs/1811.02090.
[11] Z. Yildirim, “A novel wavelet sequence based on deep bidirec-tional LSTM network model for ECG signal classification,”Computers in Biology & Medicine, vol. 96, pp. 189–202, 2018.
[12] S. Saadatnejad, M. Oveisi, and M. Hashemi, “LSTM-basedECG classification for continuous monitoring on personalwearable devices,” IEEE Journal of Biomedical & Health Infor-matics, vol. 24, no. 2, pp. 515–523, 2020.
[13] K. Feng, X. Pi, H. Liu, and K. Sun, “Myocardial infarction clas-sification based on convolutional neural network and recur-rent neural network,” Applied Sciences, vol. 9, no. 9, p. 1879,2019.
[14] X. Zhai and C. Tin, “Automated ECG classification using dualheartbeat coupling based on convolutional neural network,”IEEE Access, vol. 6, pp. 27465–27472, 2018.
[15] H. Li, J. Liu, R. Liu, N. Xiong, K. Wu, and T. H. Kim, “Adimensionality reduction-based multi-step clustering methodfor robust vessel trajectory analysis,” Sensors, vol. 17, no. 8,article 1792, 2017.
[16] H. Li, J. Liu, K. Wu, Z. Yang, R. W. Liu, and N. Xiong, “Spatio-temporal vessel trajectory clustering based on data mappingand density,” IEEE Access, vol. 6, pp. 58939–58954, 2018.
[17] T. J. Jun, H. M. Nguyen, D. Kang, D. Kim, D. Kim, andY.-H. Kim, “ECG arrhythmia classification using a 2-Dconvolutional neural network,” 2018, https://arxiv.org/abs/1804.06812.
[18] L. Dan, J. Zhang, Z. Qiang, and X. Wei, “Classification of ECGsignals based on 1D convolution neural network,” in 2017IEEE 19th International Conference on e-Health Networking,Applications and Services (Healthcom), Dalian, China, 2017.
[19] M. Jangra, S. K. Dhull, and K. K. Singh, “ECG arrhythmia clas-sification using modified visual geometry group network(mVGGNet),” Journal of Intelligent and Fuzzy Systems,vol. 38, no. 3, pp. 3151–3165, 2020.
[20] A. Krizhevsky, I. Sutskever, and G. E. Hinton, “Imagenet clas-sification with deep convolutional neural networks,” Advancesin neural information processing systems., vol. 60, pp. 84–90,2017.
[21] K. He, X. Zhang, S. Ren, and J. Sun, “Deep residual learning forimage recognition,” in Proceedings of the IEEE Conference onComputer Vision and Pattern Recognition (CVPR), pp. 770–778, Las Vegas, NV, USA, 2016.
[22] M. Sandler, A. Howard,M. Zhu, A. Zhmoginov, and L.-C. Chen,“MobileNetV2: inverted residuals and linear bottlenecks,” inProceedings of the IEEEConference onComputer Vision and Pat-tern Recognition (CVPR), pp. 4510–4520, Salt Lake City, UT,USA, 2018.
[23] Y. Li, N. Wang, J. Shi, X. Hou, and J. Liu, “Adaptive batch nor-malization for practical domain adaptation,” Pattern Recogni-tion, vol. 80, pp. 109–117, 2018.
[24] S. Hochreiter and J. Schmidhuber, “Long short-term mem-ory,” Neural Computation, vol. 9, no. 8, pp. 1735–1780, 1997.
11Advances in Mathematical Physics


![ECG Signal processing (2) ECE, UA. ECG signal processing - Case [1] Diagnosis of Cardiovascular Abnormalities From Compressed ECG: A Data Mining-Based](https://img.pdfslide.us/doc/110x75/56649dbf5503460f94ab3016/ecg-signal-processing-2-ece-ua-ecg-signal-processing-case-1-diagnosis.jpg)