Embed Size (px)
Citation preview

ECG Interpretation
Hina Shaikh
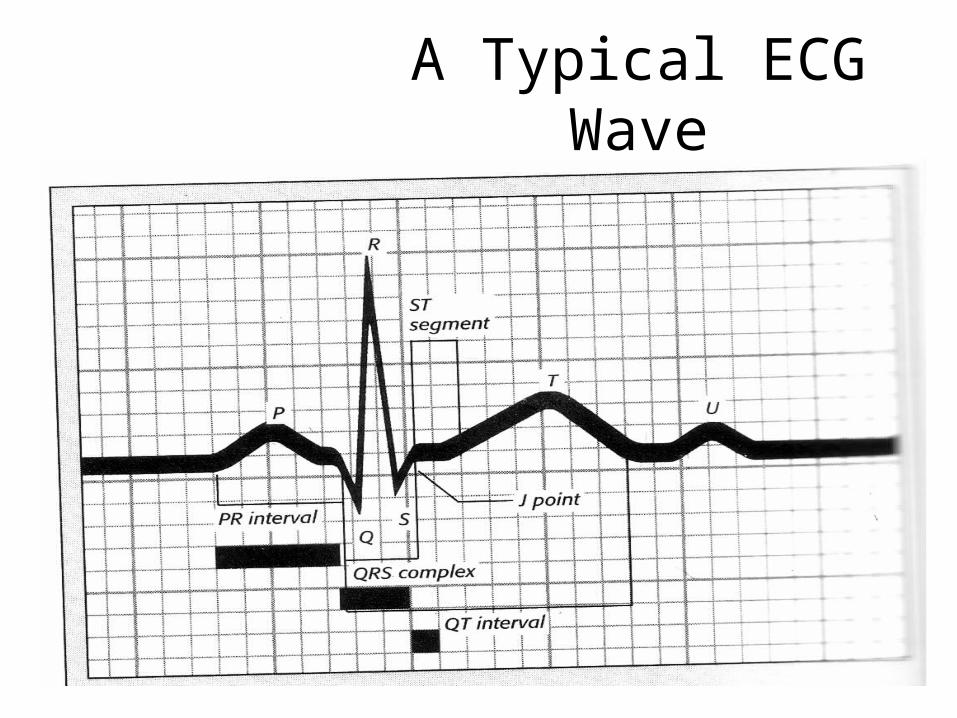
What is ECG?
• Graphical records of electrical current, that is generated by heart
• Basic equipment: electrodes, wires, amplifier, and strip chart recorder
• Evaluates cardiac status
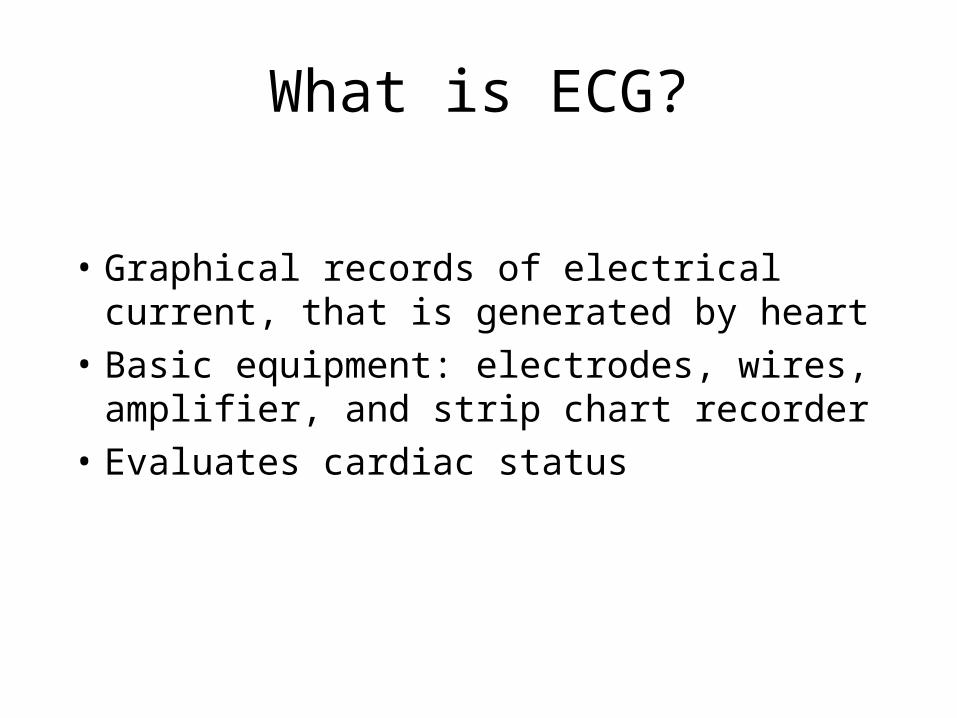
A Typical ECG Wave
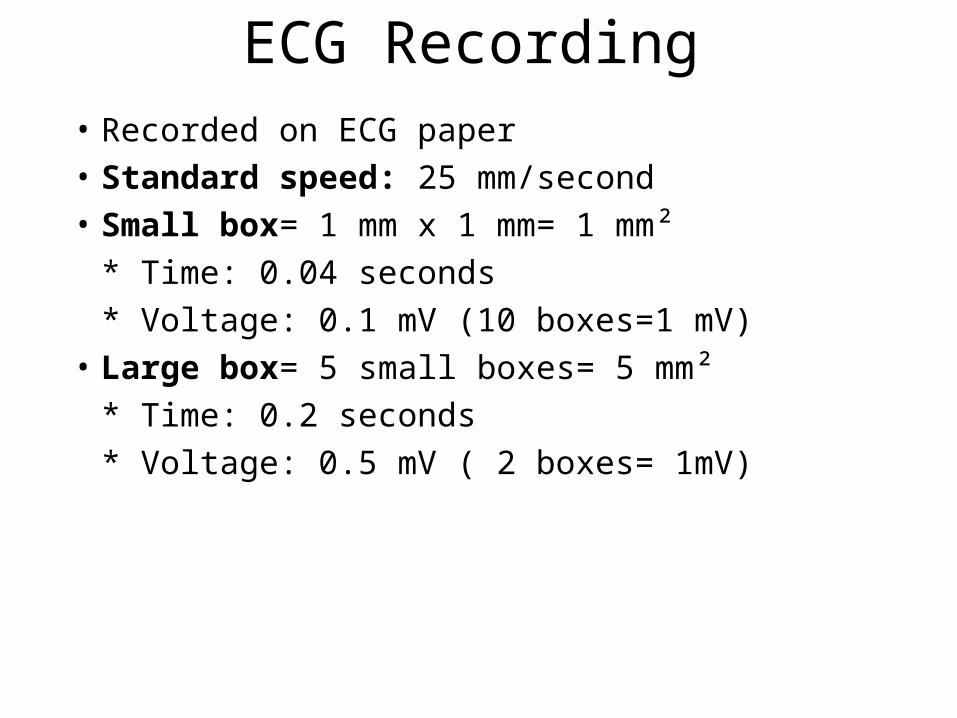
ECG Recording• Recorded on ECG paper• Standard speed: 25 mm/second• Small box= 1 mm x 1 mm= 1 mm²
* Time: 0.04 seconds
* Voltage: 0.1 mV (10 boxes=1 mV)• Large box= 5 small boxes= 5 mm²
* Time: 0.2 seconds
* Voltage: 0.5 mV ( 2 boxes= 1mV)
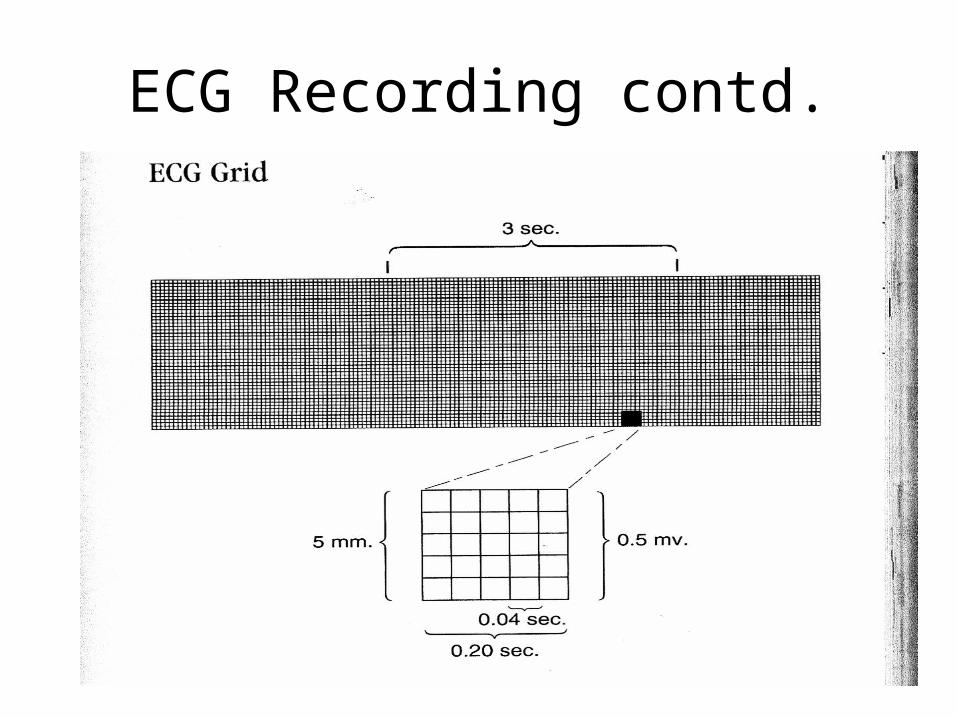
ECG Recording contd.
ECG Leads• Standard 12 Lead
- 6 limb leads- 6 chest leads-Allows to assess heart rate, heart rhythm, hypertrophy, and infarction
• Single lead ECG tracing- “Rhythm strip” - Assess heart rate, rhythm, and presence of arrythmias- Need a 12-lead to make a definitive diagnosis for hypertorphy, ischemia, or infarction
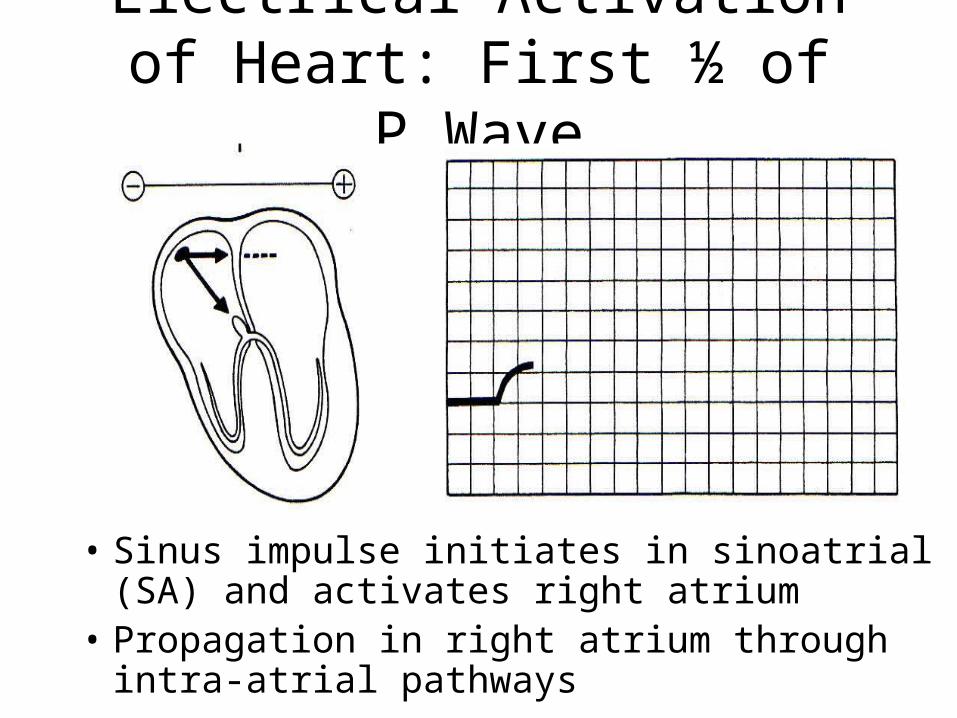
Electrical Activation of Heart: First ½ of P Wave
• Sinus impulse initiates in sinoatrial (SA) and activates right atrium
• Propagation in right atrium through intra-atrial pathways
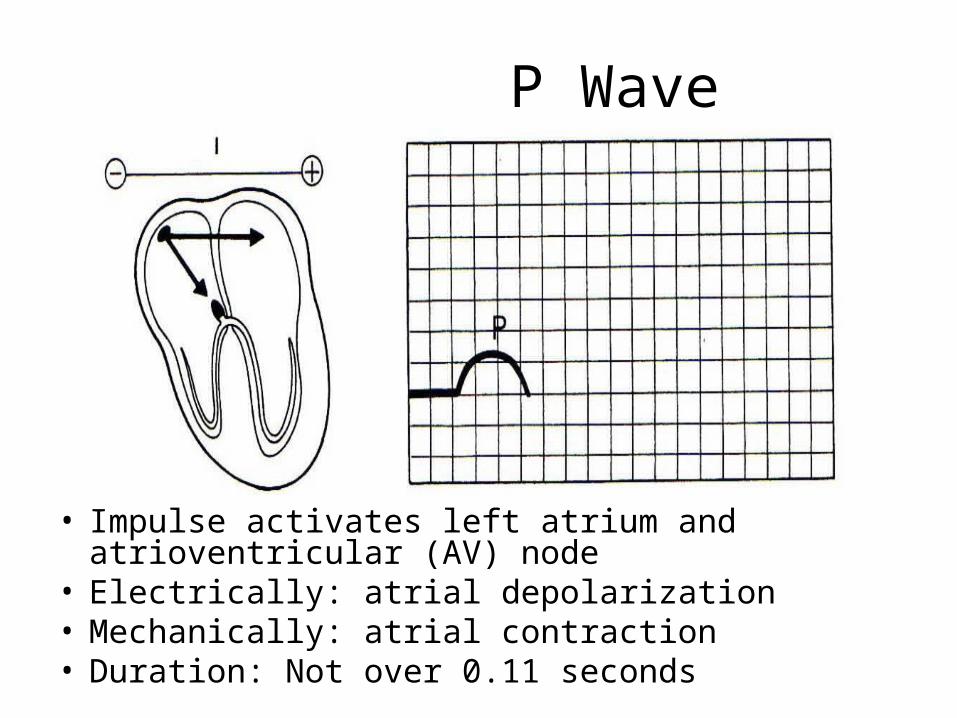
P Wave
• Impulse activates left atrium and atrioventricular (AV) node
• Electrically: atrial depolarization• Mechanically: atrial contraction• Duration: Not over 0.11 seconds
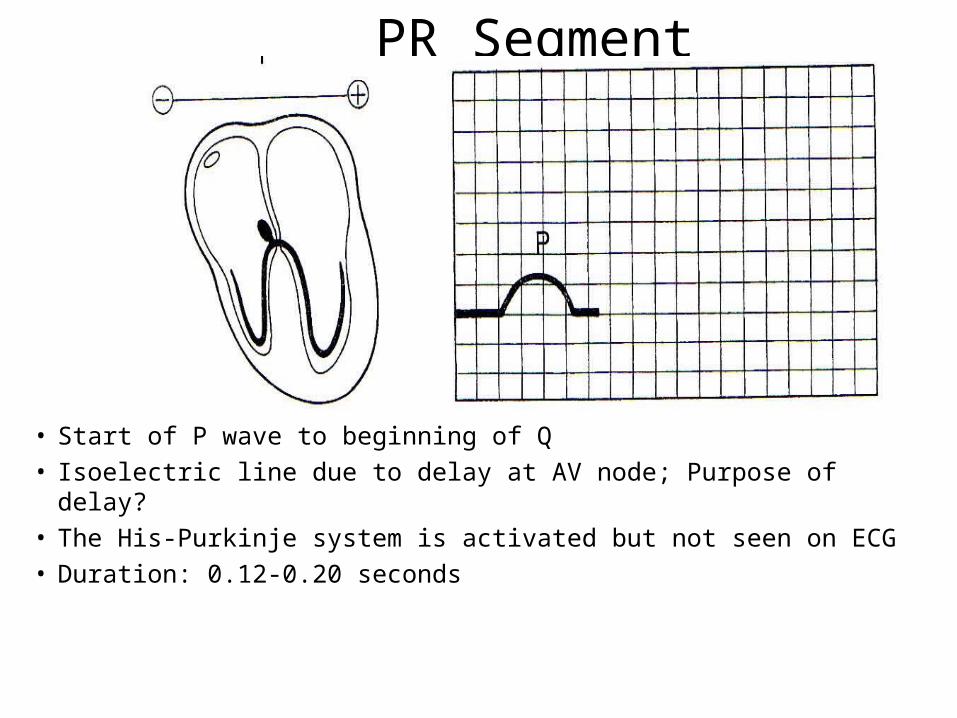
PR Segment
• Start of P wave to beginning of Q• Isoelectric line due to delay at AV node; Purpose of delay?• The His-Purkinje system is activated but not seen on ECG• Duration: 0.12-0.20 seconds
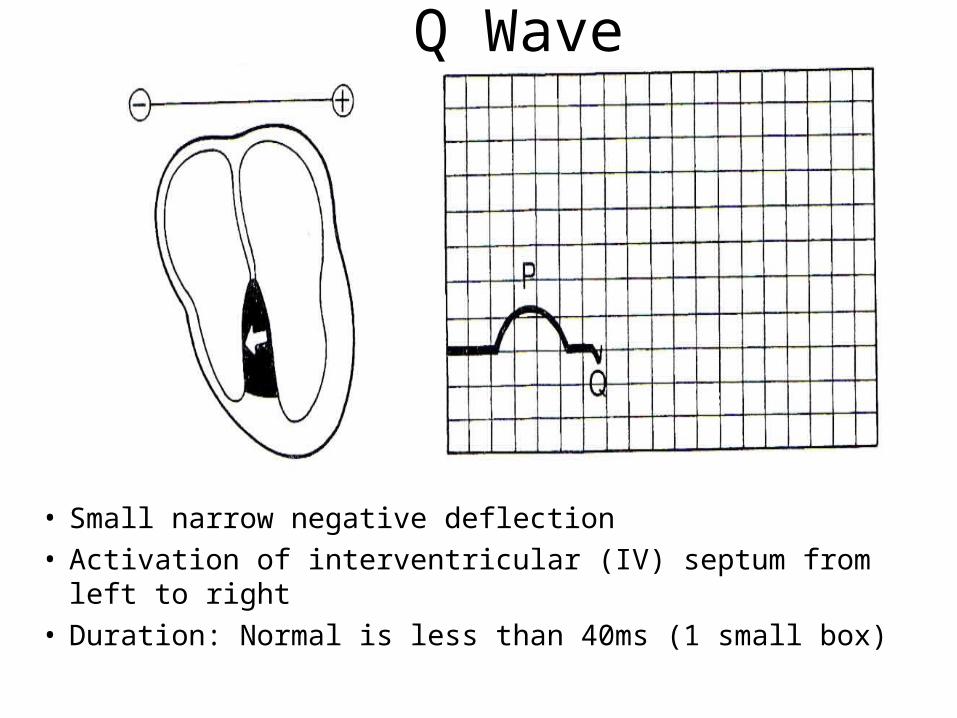
Q Wave
• Small narrow negative deflection
• Activation of interventricular (IV) septum from left to right
• Duration: Normal is less than 40ms (1 small box)
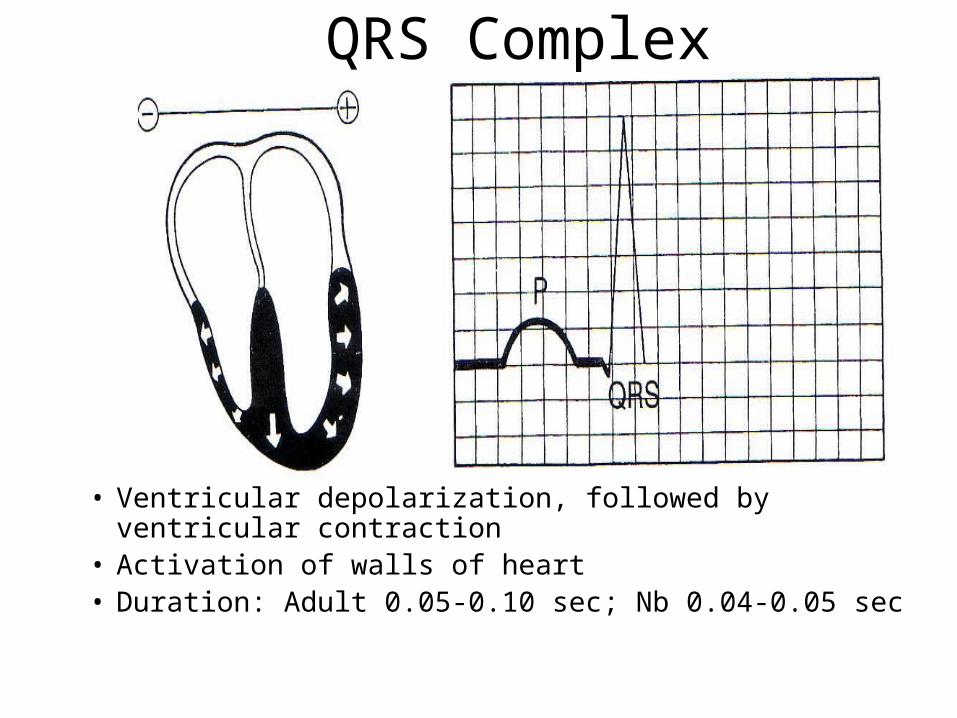
QRS Complex
• Ventricular depolarization, followed by ventricular contraction
• Activation of walls of heart• Duration: Adult 0.05-0.10 sec; Nb 0.04-0.05 sec
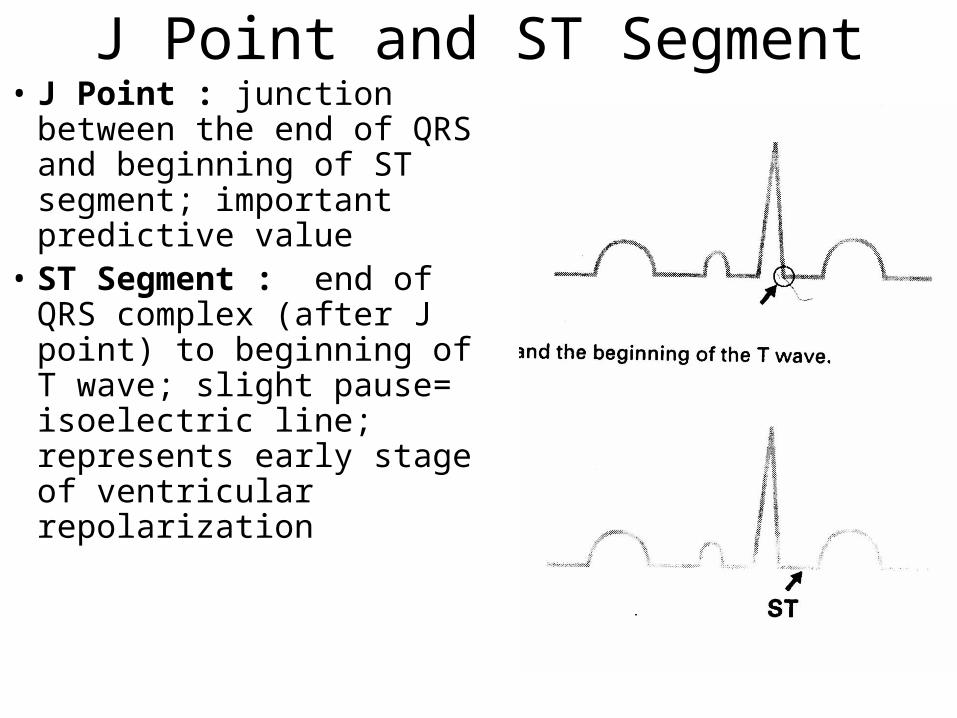
J Point and ST Segment• J Point : junction between
the end of QRS and beginning of ST segment; important predictive value
• ST Segment : end of QRS complex (after J point) to beginning of T wave; slight pause= isoelectric line; represents early stage of ventricular repolarization
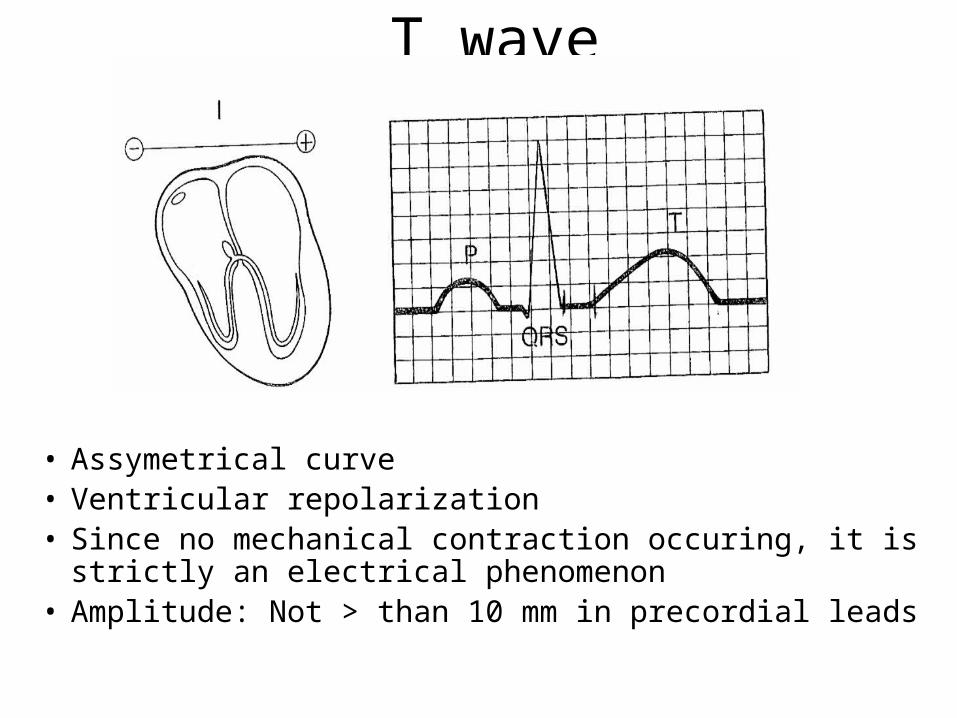
T wave
• Assymetrical curve• Ventricular repolarization• Since no mechanical contraction occuring, it is strictly
an electrical phenomenon • Amplitude: Not > than 10 mm in precordial leads
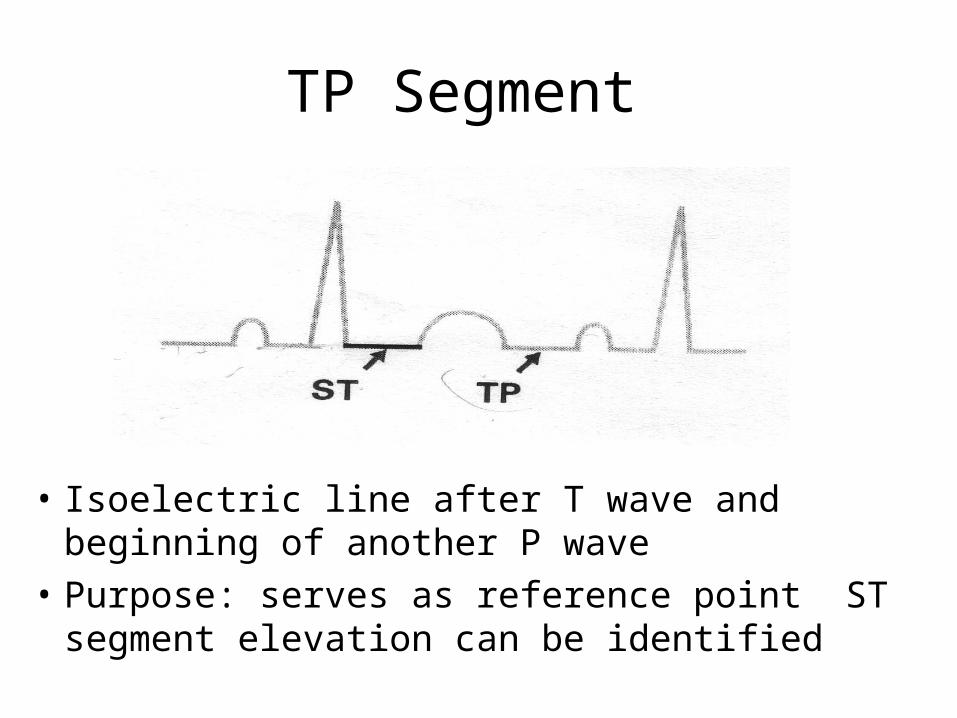
TP Segment
• Isoelectric line after T wave and beginning of another P wave
• Purpose: serves as reference point ST segment elevation can be identified
U Wave
• Rarely seen but just be aware of it• Occurs as a positive or negative wave
after T wave• Mechanism: Unknown• Amplitude: Low voltage• Clinical significance: hypokalemia,
myocardial ischemia, heart disease, hypertension, or acute myocardial ischemia
Reading an ECG
• Rate
• Rhythm
• Waveforms (PR, P, QRS, ST, T)
• Everything needs to be evaluated in terms of context. Need to ask if it has changed from normal.
Determining Heart Rate from ECG
• 6 second tracing:
- Obtain ECG recording that is 6 seconds in length
- Count the number of QRS complexes in six seconds
- Multiply the number of QRS complexes by 10 to determine the heart rate per minute (HR/min)
• Heart rate: < 60= Bradycardia and >100 tachycardia
Determing Rhythm
• Use calipers or small ruler to measure the R-R intervals
• Remember to place the calipers/ruler on the same point of QRS complex
• If R-R intervals remain consistent, the ventricular rhythm is regular
Determing Waveforms• P wave
1. Is there a P-wave?
2. Has the duration changed?• PR interval
1. Is the PR interval equal througout?
• QRS
1. Duration?
2. Height?
Determing Waveforms contd.
• ST Segment
1. Is it there?
2. Is it elevated or depressed?
• T Wave
1. What is its height?
2. Does it have a abnormal deflection?
Conclusion
• Evaluate case in terms of overall context• Compare ECG to normal, if available• Check the wires• Error on side of caution based on overall
case matter• Remember to treat the patient, not just the
monitor!