Embed Size (px)
Citation preview

2015
European Cystic Fibrosis Society
Kastanieparken 7
7470 Karup
Denmark
www.ecfs.eu/ecfspr
ECFS Patient Registry Annual Data Report

ECFS Patient Registry
Annual Data Report
2015 data
Published: November 2017

ECFSPR European Cystic Fibrosis Society Patient Registry
Annual data report (year 2015) version 1.2017
2
Table of contents
Preface .............................................................................................................................................. 3
To the people with cystic fibrosis ........................................................................................................ 4
List of centres and national registries that provided the data .............................................................. 5
Authors ............................................................................................................................................ 10
Introduction ..................................................................................................................................... 11
The European Cystic Fibrosis Society Patient Registry (ECFSPR) .............................................................. 11
General Considerations ............................................................................................................................ 11
Glossary and Abbreviations ...................................................................................................................... 12
Summary of data report ................................................................................................................... 14
Data report ...................................................................................................................................... 15
1. Demographics ....................................................................................................................................... 15
2. Diagnosis .............................................................................................................................................. 25
3. Genetics ................................................................................................................................................ 32
4. Lung function ........................................................................................................................................ 42
5. Microbiology ......................................................................................................................................... 53
6. Nutrition ............................................................................................................................................... 67
7. Complications and therapy ................................................................................................................... 94
8. Transplantation .................................................................................................................................. 111
9. Mortality ............................................................................................................................................. 114
Publications .................................................................................................................................... 116
Partners and Contributors ............................................................................................................... 117
Appendix 1: Technical notes ............................................................................................................ 118
Appendix 2: List of variables, inclusion criteria and definitions used by the ECFSPR ........................... 120
Appendix 3: Lung Function .............................................................................................................. 124

ECFSPR European Cystic Fibrosis Society Patient Registry
Annual data report (year 2015) version 1.2017
3
Preface
We are pleased to share with you the 2015 Annual Report from the European Cystic Fibrosis Society Patient
Registry (ECFSPR). This 11th report contains demographic and clinical data of 42,054 consenting CF patients
from 29 countries. The epidemiological data is provided by national cystic fibrosis (CF) registries and
individual CF centres throughout Europe and neighbouring countries.
The ECFSPR’s primary goal is to provide a clear picture of CF clinical outcomes across Europe. The analysis
presented in this report has been carried out by the ECFSPR statistician using all the raw data, in
anonymised form, submitted by the participating countries. In merging this data, the results of the analysis
for some countries as presented in the ECSFPR report may differ from the data published in their national
annual registry report. Differences can originate from variation in patient inclusion criteria, the definitions
used for disease complications, and the employment of different reference values. Further details on how
this occurs and is dealt with can be found in the report and in the List of ECFSPR Variables and Definitions
in Appendix 2 (page 120).
The management of the ECFSPR and the development of this report take a considerable amount of work.
I would like to thank the national registries and individual centres, as well as the country representatives,
for their participation in the ECFSPR, and the ECFSPR staff for their hard work in producing this report.
Through the commitment of the members of the individual centres and countries who volunteer so much
of their time, and the combined efforts of the ECFSPR staff and Executive Committee, serial data from
2011 to 2015 has been uploaded to the ECFSPR in the past two years. This is a considerable accomplish-
ment that has hugely improved the value of the Registry as an instrument for research and quality
improvement. For this, we at the ECFSPR are extremely grateful. Managing the Registry comes with a cost
and we are also indebted to our sponsors whose unrestricted grants have helped support the running and
expansion of the ECFSPR.
Finally, I would like to thank all the people with CF throughout Europe for their willingness to participate
in the ECFSPR. Without them, this Registry would not exist. We hope that the ECFSPR’s information is
useful for people with CF, their families and caregivers and that it will lead to improved CF care throughout
Europe.
Sincerely,
Lutz Naehrlich, MD
ECFSPR Director

ECFSPR European Cystic Fibrosis Society Patient Registry
Annual data report (year 2015) version 1.2017
4
To the people with cystic fibrosis
This report is about you and how cystic fibrosis (CF) affects you and other people all over Europe. The
report is based on information collected by individual CF centres and the national CF registries that
participate in the European Cystic Fibrosis Society Patient Registry (ECFSPR). We have tried to make the
presentation of this data as clear as possible and hope that you will find the report interesting and easy to
understand.
We will continue to publish a separate At-a-Glance report, containing key information from the ECFSPR
Report relevant for people with CF and their families, www.ecfs.eu/projects/ecfs-patient-registry/annual-
reports. Together with the patient organisations, we are developing new tools to increase awareness of
the Registry amongst patients, such as posters with information and basic statistics from the Registry for
display in CF-clinics, and an increased presence on social media. Last, but not least, from this year onwards,
interactive maps with country-relevant information will be available on our website www.ecfs.eu/ecfspr.
If you have any suggestions on how we can improve the information or if something is unclear you are
welcome to contact us by sending an email to: [email protected].
For discussions about the results in your country we encourage you to contact your CF centre.
For more detailed information about the ECFSPR we invite you to visit the patient-dedicated page on our
website: www.ecfs.eu/projects/ecfs-patient-registry/information-about-ecfspr-cf-patients.

ECFSPR European Cystic Fibrosis Society Patient Registry
Annual data report (year 2015) version 1.2017
5
List of centres and national registries that provided the data
List of individual centres and national registries that contributed to the ECFSPR.
In large print: the name of the country representative in the ECFSPR Steering Group;
Underlined: the name of the database manager for the national registry;
In Italics: new participants since the report with 2014 data.
Country Centre/National Registry name Contact
Austria 12 individual centres: Andreas Pfleger
Medizinische Universität Graz, Universitätsklinik für Kinder- und Jugendheilkunde, Klinische Abteilung für Pädiatrische Pulmonologie und Allergologie und CF Zentrum für Kinder, Jugendliche und Erwachsene, Graz
Ernst Eber Maria Wagenhofer
Medizinische Universität Innsbruck, Departement für Kinder- und Jugendheilkunde, CF Zentrum für Kinder, Jugendliche und Erwachsene, Innsbruck
Helmut Ellemunter Johannes Eder
Klinikum Klagenfurt am Wörthersee, Abteilung für Kinder- und Jugendheilkunde, Pädiatrische Pulmologie/ Allergologie, Klagenfurt
Franz Hubert Wadlegger
Kepler Universitätsklinikum, Kinder- und Jugendheilkunde, Abteilung Mucoviszidose, Linz
Maria Bauer
Kardinal Schwarzenberg’sches Krankenhaus, Abteiling für Kinder- und Jugendmedizin, Schwarzach
Christoph Seelbach
Landeskrankenhaus Steyr, Abteilung für Kinder- und Jugendheilkunde und Abteilung für Lungenheilkunde, Steyr
Josef Emhofer Alexander Ebner
Medizinische Universität, Allgemeines Krankenhaus Wien, Universitätsklinik für Chirurgie, Klinische Abteilung für Thoraxchirurgie, Vienna
Peter Jaksch Sabine Obermair Ramp
Universitätsklinik für Kinder- und Jugendheilkunde, Cystische Fibrose Ambulanz, Vienna
Sabine Renner Brigitte Mersi
Wilhelminenspital, Abteilung für Kinder- und Jugendheilkunde mit Ambulanz, Vienna
Thomas Frischer Kerstin Tiringer
Krankenhaus Hietzing, Abteilung für Atmungs- und Lungenerkrankungen, Vienna
Ingrid Kaluza Andreas Renner
Klinikum Wels-Grieskirchen, Abteilung für Kinder- und Jugendheilkunde, Wels
Vera Bauer Beatrix Wintersteiger Nadine Raffler
Klinikum Wels-Grieskirchen, Abteilung für Lungenkrankheiten, Wels
Helmut Feizelmeier
Bulgaria 1 Individual Centre Guergana Petrova
Alexansdrovska University Hospital, Pediatric Clinic, Sofia, Bulgaria
Guergana Petrova

ECFSPR European Cystic Fibrosis Society Patient Registry
Annual data report (year 2015) version 1.2017
6
Country Centre/National Registry name Contact
Czech Republic Cystic Fibrosis Registry of the Czech Republic Pavel Drevinek Milan Macek Alena Bilkova Marek Turnovec
Denmark Cystic Fibrosis Registry of Denmark Hanne Vebert Olesen Tania Pressler
France Registre Français de la Mucoviscidose Anne Farge Lydie Lemonnier Clémence Dehillotte
Germany Qualitätssicherung Mukoviszidose Lutz Naehrlich Birgitt Wiese
Greece 3 individual centres: Elpis Hatziagorou
Aghia Sophia Children's Hospital, CF Centre, Athens
Athanasios Kaditis Ioanna Loukou Argyri Petrocheilou Fotini Tsiakalou
Sismanoglio General Hospital of Attica, Adult Cystic Fibrosis Unit, Athens
Filia Diamantea Kostas Kotsifas
Aristotle University of Thessaloniki, Hippokration General Hospital, Cystic Fibrosis Centre, Thessaloniki
John Tsanakas Elpis Hatziagorou Maria Fotoulaki John Kioumis
Hungary Cystic Fibrosis Registry of Hungary Rita Ujhelyi Géza Marsal Attila Hornyák
Ireland Cystic Fibrosis Registry of Ireland Godfrey Fletcher Abaigeal Jackson Shijun Zhou
Israel Cystic Fibrosis Registry of Israel Meir Mei-Zahav
Italy Cystic Fibrosis Registry of Italy
Rita Padoan Gianluca Ferrari Annalisa Amato Patrizia Iansa Marco Salvatore
Latvia 1 individual centre: Zane Timpare
Rīga Stradinš University, Children’s Clinical University Hospital, Department of Pneumology, Riga
Vija Švabe Karina Mahlina Zane Timpare
Lithuania 1 individual centre: Kęstutis Malakauskas
Hospital of Lithuanian University of Health Sciences, Kaunas Clinics, Adult Cystic Fibrosis Centre, Kaunas
Kęstutis Malakauskas Virginija Kalinauskaite-Zukauske
Luxembourg 1 individual centre: Marc Schlesser
Centre Hospitalier de Luxembourg Marc Schlesser Inesse Denine

ECFSPR European Cystic Fibrosis Society Patient Registry
Annual data report (year 2015) version 1.2017
7
Country Centre/National Registry name Contact
Republic of Macedonia
1 individual centre: Stojka Fustik
University Children’s Hospital, Centre for Cystic Fibrosis, Skopje
Stojka Fustik
Republic of Moldova
Cystic Fibrosis Registry of Moldova Svetlana Sciuca Oxana Turcu (from April
2017)
Netherlands Dutch Cystic Fibrosis Registry Vincent Gulmans
Portugal Cystic Fibrosis Registry of Portugal Luísa Pereira
Romania 1 individual centre: Simona Mosescu
Clinical Children’s Hospital, Grigore Alexandrescu, Bukarest, Romania
Simona Mosescu
Russian Federation
Cystic Fibrosis Registry of the Russian Federation
Nataliya Kashirskaya
Elena Amelina Alexander Chernyak Stanislav Krasovskiy Elena Kondrtyeva Anna Voronkova Maria Usacheva
Serbia 1 individual centre: Milan Rodic
National Centre for Cystic Fibrosis, Mother and Child Health Institute of Serbia "Dr Vukan Cupic", Belgrade
Milan Rodic
Slovakia Cystic Fibrosis Registry of Slovakia Hana Kayserova
Slovenia 2 individual centres: Uroš Krivec
University Clinic of Pulmonary and Allergic Diseases, Golnik
Matjaž Fležar Andraz Jakelj
University Children`s Hospital, Pulmonary Department, Ljubljana
Uroš Krivec Ana Kotnik Pirs
Spain 19 individual centres: Carlos Vazquez-Cordero
Hospital de Sabadell, Corporació Sanitària Parc Taulí, Clinica Pediátrica, Unitat Clinica de Fibrosis Quística, Barcelona
Oscar Asensio de la Cruz Miguel Garcia Gonzalez
Hospital Sant Joan de Déu, Unitat de Pneumologia Pediátrica i Fibrosi Quística, Barcelona
Jordi Costa i Colomer
Hospital Vall d'Hebron, Unidad Fibrosis Quística e Neumologia Pediátrica, Barcelona
Silvia Gartner
Hospital Universitario La Paz, Unidad de Fibrosis Quìstica Adultos, Servicio de Neumología, Madrid
Concepcion Prados
Hospital Infantil La Paz, Unidad de Neumologìa Pediàtrica, Madrid
Maria Isabel Barrio Gomez de Agüero Marta Ruiz de Valbuena
Hospital Universitario La Princesa, Neumologia Adultos, Madrid
Rosa María Girón
ECFSPR European Cystic Fibrosis Society Patient Registry
Annual data report (year 2015) version 1.2017
8
Country Centre/National Registry name Contact
Hospital Niño Jesús, Sección de Neumologia Pediátrica/Unidad de Fibrosis Quística, Madrid
Jose R. Villa Asensi Maribel Gonzalez Alvarez
Hospital Universitario de Ramón y Cajal, Unidad de Fibrosis Quística, Madrid
Adelaida Lamas Ferreiro Alejandro Lopez Neyra Veronica Sanz Santiago
Hospital 12 de Octubre, Unidad de Fibrosis Quística, Madrid
Carmen Luna Paredes
Hospital Regional Universitario de Málaga, Unidad Fibrosis Quística Adultos, Málaga
Casilda Olveira Fuster Gabriel Maria Olveira Fuster Nuria Porras Pèrez
Hospital Regional Universitario de Málaga, Unidad de Fibrosis Quística Pediátrica, Málaga
Francisco Javier Perez-Frias Estela Perez-Ruiz
Hospital Universitario Virgen de la Arrixaca, Unidad de Fibrosis Quística, Murcia
Pedro Mondéjar-López
Hospital Universitario Central de Asturias, Unidad de Pediatría, Oviedo
Carlos Bousoňo-García Ramon Gutierrez
Hospital Universitario Virgen del Rocío, Unidad de Fibrosis Quística, Sevilla
Isabel Delgado Pecellín Esther Quintana Gallego
Hospital Universitario Nuestra Señora de Candelaria, Santa Cruz de Tenerife, Tenerife
Alicia Callejon
Hospital Clinico Universitario de Valencia, Unidad de Fibrosis Quística Pediátrica, Valencia
Amparo Escribano Montaner Silvia Castillo Corullon
Hospital Universitario y Politécnico La Fe, Unidad de Trasplante Pulmonar y Fibrosis Quística, Valencia
Amparo Solé Jover Carmen Inés Perez Munoz
Hospital Universitario de Cruces, Unidad de Fibrosis Quística, Vizkaya
Carlos Vazquez Cordero Maria Dolores Pastor
Hospital Universitario Miguel Servet, Unidad de Neumología Pediátrica y Fibrosis Quística, Zaragoza
Carlos Martín de Vicente
Sweden Cystic Fibrosis Registry of Sweden Isabelle de Monestrol Anders Lindblad
Switzerland 18 individual centres: Andreas Jung
Kantonsspital Aarau AG, Klinik für Kinder und Jugendliche, Abteilung pädiatrische Pneumologie, Allergologie und Immunologie, Klinik für Pneumologie und Schlafmedizin, Aarau
Dominik Müller-Suter Sarosh Irani
Universitätsspital Basel, Klinik für Pneumologie, Adulte Cystische Fibrose Basel
Michael Tamm Kathleen Jahn
UKBB Universitäts-Kinderspital beider Basel, Abteilung Intensivmedizin & Pneumologie, Basel
Jürg Hammer Daniel Trachsel
Inselspital, Universitätsklinik für Pneumologie, Abteilung Cystische Fibrose, Bern
Thomas Geiser Dagmar Lin
Lindenhofspital Bern, Praxis für Pneumologie "Quartier Bleu", Bern
Reta Fischer Carlo Mordasini
Universitätsklinik für Kinderheilkunde, Zentrum für Cystische Fibrose und Pulmonologie, Inselspital, Bern
Carmen Casaulta Philipp Latzin Romy Rodriguez

ECFSPR European Cystic Fibrosis Society Patient Registry
Annual data report (year 2015) version 1.2017
9
Country Centre/National Registry name Contact
Hôpital Cantonal Fribourg, Pädiatrie, Fribourg Denise Herzog Johannes Wildhaber
Hôpitaux Universitaires de Genève, Département de l’enfant et de l’adolescent, Unité de Pneumologie Pédiatrique, Genève
Constance Barazzone Anne Mornand
Hôpitaux Universitaires de Genève, Département des spécialités de médecine, Service de Pneumologie, Consultation de mucoviscidose adulte, Genève
Paola Gasche Jean-Marc Fellrath Jérôme Plojoux
Centre Hospitalier Universitaire Vaudois (CHUV), Départment Médico-Chirurgical de Pédiatrie, Pneumologie Pédiatrique et Mucoviscidose, Lausanne
Isabelle Rochat
Consultation adulte de Mucoviscidose Service de pneumologie, département de médecine, Centre Hospitalier Universitaire Vaudois (CHUV)
Laurent Nicod Marie Hofer
Luzerner Kantonsspital, Zentrum für Zystische Fibrose für Kinder und Erwachsene, Abteilungen für Pneumologie, pädiatrische Pneumologie und pädiatrische Gastroenterologie, Luzern
Nicolas Regamey Bernhard Schwizer Johannes Spalinger
Hôpital de Morges, Consultation de Mucoviscidose Adulte, Morges
Alain Sauty Marie Hofer
Ostschweizer Kinderspital, Pädiatrische Pneumologie und CF-Zentrum, St. Gallen
Jürg Barben
Kantonspital St Gallen, Klinik für Pneumologie und Schlafmedizin, Spezialsprechstunde für Adulte Cystische Fibrose, St. Gallen
Martin Brutsche Rebekka Kleiner
Kantonsspital Winterthur, Klinik für Pneumologie und Klinik für Innere Medizin, Adulte Cystische Fibrose Winterthur
Markus Hofer Thomas Hess
Universitäts-Kinderspital Zürich, Abteilung für Pneumologie, Zürich
Andreas Jung Romy Rodriguez Alexander Möller
Universitätsspital Zürich, Klinik für Pneumologie, Adultes CF Zentrum, Zürich
Christian Benden Thomas Kurowski
Turkey 1 Individual centre:
Marmara University Faculty of Medicine, Division of Pulmonology, Istanbul
Bülent Karadağ Yasemin Gökdemir Ela Eralp
Ukraine 1 individual centre: Halyna Makukh
SI “Institute of Hereditary Pathology of Ukranian National Medical Academy”, Lviv
Halyna Makukh Lyudmyla Bober
United Kingdom UK Cystic Fibrosis Registry Rebecca Cosgriff Elaine Gunn Siobhán Carr

ECFSPR European Cystic Fibrosis Society Patient Registry
Annual data report (year 2015) version 1.2017
10
Authors
For this report, the tables and graphs were written, commented and/or revised by:
Annalisa Orenti and Anna Zolin, Italy, ECFSPR Statisticians, Department of Clinical Sciences
and Community Health, University of Milan;
Jacqui van Rens, Belgium, ECFSPR Executive Coordinator;
Alice Fox and Patrizia Iansa, Italy, ECFSPR Service Desk;
Vincent Gulmans, The Netherlands, Andreas Jung, Switzerland, Rebecca Cosgriff, United Kingdom;
Ulrike Pypops, Belgium: CF Europe representative in the ECFSPR;
Contributing country managers and national representatives (the names are listed on page 4-8);
Lutz Naehrlich, Germany, ECFSPR Director.
Suggested citation for this report:
ECFSPR Annual Report 2015, Zolin A, Orenti A, Naehrlich L, van Rens J et al, 2017.

ECFSPR European Cystic Fibrosis Society Patient Registry
Annual data report (year 2015) version 1.2017
11
Introduction
The European Cystic Fibrosis Society Patient Registry (ECFSPR)
The ECFSPR collects demographic and clinical data of consenting cystic fibrosis (CF) patients from Europe
and neighbouring countries. Data is collected using a common set of variables and definitions, and is sent
to the ECFSPR in one of the following ways:
National CF registries (or individual centres with local databases) extract patient data from their
own database and import the data into the ECFSPR software;
Individual centres enter patient data directly into the ECFSPR software.
Collection of data at a local level must be approved by local data protection authorities in accordance with
European data protection legislation. Data stored in the central database is anonymous, and only year/
month of birth and randomised centre numbers are used as identifiers. Data is available for scientific
purposes on application. All requests are reviewed by the ECFSPR Scientific Committee and, based on their
recommendation, the country coordinators in the Steering Group (composed of national representatives
of the countries that contribute data to the ECFSPR) decide if the data request is approved or not; this
decision is final. Requests originating from the Industry are also reviewed by the ECFS Clinical Trials
Network. All applications must meet the European and individual country data protection legislation
regarding patient anonymity.
For more information, please visit our website www.ecfs.eu/ecfspr.
General Considerations
For the national registries it is possible that some of their definitions and data coding do not fully corres-
pond to those employed by the ECFSPR, either because some types of information are not collected, or
are collected by the national registry using a different method. When the national registries upload their
data, they are also asked to state in a document whether their variables definitions meet those of the
ECFSPR. Where major discrepancies between the definitions are present, those variables have been
omitted from the annual report, and in the case of minor discrepancies a footnote has been added to the
graphs and tables. For example, the ECFSPR collects information on the presence of chronic Pseudomonas
aeruginosa infection according to the modified Leeds criteria and/or the presence of elevated Pseudo-
monas antibodies (see Appendix 2 on page 120). If a national registry collects such information as “at least
one positive Pseudomonas aeruginosa culture this year”, this information would be too different from the
ECFSPR definition of chronic Pseudomonas aeruginosa, and we would set this variable to “missing” for that
particular country. If, instead, a country defines chronic Pseudomonas aeruginosa as “the presence of
more than four positive cultures in 6 months”, the data of this variable would be included in the annual
report since the definition is much closer to the ECFSPR definition. Where this is the case, a footnote has
been added to the relevant tables and graphs.
If a country does not collect a certain variable (or if it is completely different from the ECFSPR definitions
as described above), we have omitted that country from the relevant graphs in the report. The same
applies for countries where the information for a variable is missing for more than 10% of the patients. All
data, however, is presented in the tables. The number of missing values is important for the interpretation
of the results, since it is impossible to know if a patient with a missing value for a given complication has

ECFSPR European Cystic Fibrosis Society Patient Registry
Annual data report (year 2015) version 1.2017
12
this complication or not, which makes the given frequencies less accurate. For example, in a country where
7% of the patients have liver disease but 20% of patients have unknown/missing information on liver
disease, the true frequency of liver disease can be anything between 7 and 27%.
You will find some differences between the findings of the national registries’ own reports and the ECFSPR
report. This is because some variable values are recoded or computed in different ways. For example,
some national registries compute the age at the annual visit and consider 16 years as the cut-off for adult
age. The ECFSPR computes the age at FEV1/height/weight measurement and the age at follow-up (the end
of the year) and considers 18 years as the cut-off for adult age. Since clinical outcomes do not change very
much over a 12-month period, we do not consider this to be a serious obstacle to interpretation. Another
example: for lung function values such as FEV1 the raw data values, reported in litres, are not informative
unless they are expressed in relation to the age, sex and height of the patient. We therefore needed to
transform the raw values into new variables in order to compare lung function between patients and
countries. We used common reference populations for all data when calculating the values as a percentage
of predicted from the raw data. Slightly different values can be obtained when using another reference
population on the same raw data. It is important to use a common method of calculation when comparing
different countries, just as the national registries choose a common method of calculation when they
compare the individual centres in that country.
The estimated percentage of people with CF, per country, included in the national registry or national data
presented by the country, varies; see table 1.1, page 16. These differences can influence how the data is
interpreted, and we therefore advise comparisons to be made only between countries with a similar
percentage coverage.
Glossary and Abbreviations
Country codes:
AT: Austria
BG: Bulgaria
CH: Switzerland
CZ: Czech Republic
DE: Germany
DK: Denmark
ES: Spain
FR: France
GR: Greece
HU: Hungary
IE: Ireland
IL: Israel
IT: Italy
LT: Lithuania
LU: Luxembourg
LV: Latvia
MD: Republic of Moldova
MK: Republic of Macedonia
NL: The Netherlands
PT: Portugal
RO: Romania
RS: Serbia
RU: Russian Federation
SE: Sweden
SI: Slovenia
SK: Slovak Republic
TR: Turkey
UA: Ukraine
UK: United Kingdom

ECFSPR European Cystic Fibrosis Society Patient Registry
Annual data report (year 2015) version 1.2017
13
Explanation of terms:
ABPA: allergic bronchopulmonary aspergillosis, an allergic reaction to the mould Aspergillus fumigatus.
BMI: body mass index: weight (kg) / [height (m)]2.
Bronchodilator: medication that relaxes the muscles of the airways, used also for asthma.
CFRD: CF related diabetes.
CFTR: CF transmembrane conductance regulator, is a protein at the cell surface that controls the salt and water
balance across a cell. The gene that causes CF is the blueprint for the CFTR protein. Everyone has two copies of the
gene for CFTR, but to be born with CF, both CFTR genes must be affected by a CF-causing mutation.
FEV1: forced expiratory volume in one second (lung function parameter).
FEV1%: the FEV1 as a percentage of the average value for healthy people of the same age, height and sex.
Haemoptysis: coughing up blood. This happens frequently in small amounts in CF, so the complication we asked for
here is major bleeding (more than 250 ml).
Homozygous: CF is caused by mutations of the CFTR gene, one on each allele. One is inherited from the mother and
one from the father. If both mutations are the same, the person is said to be homozygous for this mutation.
Heterozygous: CF is caused by mutations of the CFTR gene, one on each allele. One is inherited from the mother and
one from the father. If these are two different mutations, the person is considered to be heterozygous.
Max: maximum. It is the highest value.
Mean: it is the average value of a set of measurements. For example, if the mean age at diagnosis is 3 years, it means
that, on average, the patients are diagnosed when they are 3 years old.
Meconium ileus: congenital obstruction of the gut with thick, sticky faeces.
Median: the value that separates the set of measurements in two halves, so that 50% of measurements are below
the median value and the other 50% of measurements are above the median value. For example, if median age at
diagnosis is 5 months, it means that half of the patients are diagnosed before 5 months of age, and the other half of
the patients are diagnosed after 5 months of age.
Min: minimum. It is the lowest value.
N: the number of patients in a group for whom the information is not missing.
N miss: number of missing values. It is the number of patients for whom the information was missing.
NaCl: sodium chloride. Here: inhaled hypertonic saline.
Pancreatic insufficiency: the absence of pancreatic enzymes in the gut leading to malnutrition if not treated
(pancreatic insufficiency is therefore defined as the use of pancreatic enzyme supplementation).
25th Pctl: 25th percentile, also called first quartile. It is the value that separates the set of measurements in two parts,
so that one quarter (25%) of the measurements is below it and the other three quarters are above it. For example, if
the 25th percentile for age at diagnosis is 1 month, it means that a quarter of the patients are diagnosed before 1
month of age, and the other three quarters are diagnosed after 1 month of age.
75th Pctl: 75th percentile, also called third quartile. It is the value that separates the set of measurements in two parts,
so that three quarters (75%) are below it and the other quarter is above it. For example, if the 75th percentile for age
at diagnosis is 3 years, it means that three quarters of the patients are diagnosed before 3 years, the other quarter
are diagnosed after 3 years.
Pneumothorax: collapsed lung, in CF usually because of severe lung damage.
Quartiles: The 25th Percentile, the median (the 50th Percentile) and the 75th percentile are collectively called quartiles,
because they divide the set of measurements into quarters.
rhDNase: recombinant human DNase – marketed as Pulmozyme®.
Z-score: it indicates how far a value is from the mean value of a reference population (see Appendix 1 for details).
Negative z-scores mean that the value is below the mean of values in the reference population, whereas positive z-
scores mean that the value is above the mean. For example, a z-score for weight of -2 means that the weight is 2
standard deviations below the mean of subjects of the same age and sex of the reference population. For example,
if the z-score for BMI of a 10 years old boy is -2, it means that the BMI for that boy is 2 standard deviations below the
mean BMI of 10 years old boys of the reference population.

ECFSPR European Cystic Fibrosis Society Patient Registry
Annual data report (year 2015) version 1.2017
14
Summary of data report
Outcome Females Males Total
Patients registered in
the ECFSPR
n
(%)
19958
(47.46)
22096
(52.54)
42054
Age at follow-up (in years;
patients alive on 31/12/2015)
mean
median
20.2
18.1
21.2
19.5
20.7
18.8
Patients ≥ 18 years
(patients alive on 1/12/2015)
% 50.3 53.7 52.1
Age at diagnosis* mean (years)
median (months)
4.2
4.6
4.0
4.2
4.1
4.3
Patients with at least one
F508del allele recorded*
% 82.1 81.9 82.0
Patients living with
lung transplant*
n
(%)
975
(5.2)
984
(4.7)
1959
(4.9)
Patients living with
liver transplant*
n
(%)
86
(0.5)
159
(0.8)
245
(0.6)
Patients deceased in 2015** n
(%)
228
(1.2)
200
(0.9)
428
(1.0)
Age at death (years)** mean
median
30.5
29
31.2
28
30.8
28
Only patients seen during the year are presented. The total number of patients presented is 40,098. Only patients seen during the year are presented. For the United Kingdom, all patients with confirmed diagnosis
of CF are included (N=10,810). The total number of patients presented is 41,321.

ECFSPR European Cystic Fibrosis Society Patient Registry
Annual data report (year 2015) version 1.2017
15
Data report
1. Demographics
Figure 1.1 Map of countries that contributed to the ECFSPR in year 2015.
Note: Belgium was in the process of adapting new local software and is therefore not included in the report.
Countries that contributed 2015 data are in blue.

ECFSPR European Cystic Fibrosis Society Patient Registry
Annual data report (year 2015) version 1.2017
16
Table 1.1 Number of patients in year 2015, by country.
Country Patients registered, not lost to follow-up
Patients seen Estimated coverage 2015
Austria 733 704 90%
Bulgaria 134 134 66%
Czech Republic* 590 571 >95%
Denmark* 496 467 >95%
France* 6553 6553 90%
Germany* 5363 5363 >90%
Greece** 590 561 >95%
Hungary* 558 558 >90%
Ireland* 1263 1060 >90%
Israel** 665 550 95%
Italy* 5222 5206 95%
Latvia 38 37 >90%
Lithuania¹ 14 14 20%1
Luxembourg 26 26 >80%
Rep of Macedonia 114 105 >90%
Rep of Moldova* 54 45 68-76%
The Netherlands* 1401 1367 98%
Portugal** 338 300 >95%
Romania² 46 44 10%2
Russian Federation* 2883 2875 83%
Serbia 180 180 >90%
Slovak Republic** 256 213 >90%
Slovenia 96 94 >95%
Spain 1854 1772 62-66%
Sweden* 645 645 >95%
Switzerland** 878 852 >95%
Turkey 95 93 3%
Ukraine 159 122 15-18%
United Kingdom* 10810 9587 99%
Total 42054 40098
Countries with an established national CF registry.42054
These countries have a national registry, but use the direct data-entry function of ECFSTracker. 1 Coverage is 100% for adults and 0% for children. 2 Coverage is 100% for children and 0% for adults.
The column “Patients registered, not lost to follow-up” shows the patients that attend centres, and
includes patients that have not been seen during the year but are known to be alive that year. The column
“patients seen” presents only the patients who have attended the clinic during the year. The column
“Estimated coverage 2015” shows the estimated percentage of CF patients living in that country who are
included in the national registry/national data collection as reported by the country. For some countries
one individual centre may include almost all patients, e.g. Latvia and Serbia.

ECFSPR European Cystic Fibrosis Society Patient Registry
Annual data report (year 2015) version 1.2017
17
Figure 1.2 Number of patients registered in the ECFSPR in year 2015, by country.
Each vertical bar shows the number of patients living in that country in 2015. Please refer to table 1.1 for the coverage in each country.
0
1000
2000
3000
4000
5000
6000
7000
8000
9000
10000
11000
LT LU LV RO MD TR SI MK BG UA RS SK PT DK HU CZ GR SE IL AT CH IE NL ES RU IT DE FR UK
nu
mb
er
of
pat
ien
ts

ECFSPR European Cystic Fibrosis Society Patient Registry
Annual data report (year 2015) version 1.2017
18
Figure 1.3 Age at follow-up distribution. Patients alive on 31/12/2015.
Each blue vertical bar represents the number of patients of that age alive in 2015. The cumulative
percentage (the dark blue line) describes how many patients (as a percentage) are below a certain age
(e.g. 50% of the patients are younger than 18.1 years of age).
0
10
20
30
40
50
60
70
80
90
100
0
200
400
600
800
1000
1200
0 5 10 15 20 25 30 35 40 45 50 55 60 65 70 75 80 85
cum
ulative
pe
rcen
tagenu
mb
er
of
pat
ien
ts
age
Number of patients Cumulative percentage

ECFSPR European Cystic Fibrosis Society Patient Registry
Annual data report (year 2015) version 1.2017
19
Figure 1.4 Age at follow-up distribution by sex. Patients alive on 31/12/2015.
The pyramid shows the percentage of patients of different ages as horizontal bars. The right side of the
pyramid (blue) shows, for males, how many patients (as a percentage) are a certain age, the left side (red)
shows the same for females. The lower percentage of patients at the bottom of the pyramid is a result of
the fact that some patients have not yet been diagnosed (mean age at diagnosis is 4.10 years, see table
2.1).
4 3 2 1 0 1 2 3 4
0
5
10
15
20
25
30
35
40
45
50
55
60
65
70
75
80
85
%
ageFemales Males

ECFSPR European Cystic Fibrosis Society Patient Registry
Annual data report (year 2015) version 1.2017
20
Table 1.2 Proportion of adults (≥18 years) and children (<18 years), by country.
Patients registered, alive on 31/12/2015. Country Children (<18 years)
number (%) Adults (≥18 years)
number (%)
Austria 374 348 (51.80) (48.20)
Bulgaria 76 58 (56.72) (43.28)
Czech Republic 324 257 (55.77) (44.23)
Denmark 187 303 (38.16) (61.84)
France 3035 3478 (46.60) (53.40)
Germany 2316 2964 (43.86) (56.14)
Greece 291 295 (49.66) (50.34)
Hungary 317 239 (57.01) (42.99)
Ireland 571 677 (45.75) (54.25)
Israel 279 383 (42.15) (57.85)
Italy 2272 2906 (43.88) (56.12)
Latvia 25 10 (71.43) (28.57)
Lithuania 0 13 (0) (100)
Luxembourg 11 15 (42.31) (57.69)
Rep of Macedonia 82 31 (72.57) (27.43)
Rep of Moldova 43 10 (81.13) (18.87)
The Netherlands 582 808 (41.87) (58.13)
Portugal 185 149 (55.39) (44.61)
Romania 43 3 (93.48) (6.52)
Russian Federation 2157 688 (75.82) (24.18)
Serbia 122 54 (69.32) (30.68)
Slovak Republic 125 130 (49.02) (50.98)
Slovenia 58 37 (61.05) (38.95)
Spain 1016 829 (55.07) (44.93)
Sweden 248 389 (38.93) (61.07)
Switzerland 410 465 (46.86) (53.14)
Turkey 89 6 (93.68) (6.32)
Ukraine 136 22 (86.08) (13.92)
United Kingdom 4578 6107 (42.85) (57.15)
Total 19952 21674 (47.93) (52.07)
Note: Lithuania has 100% coverage for adults and 0% coverage for children. Romania has 100% coverage for children and 0% coverage for adults.

ECFSPR European Cystic Fibrosis Society Patient Registry
Annual data report (year 2015) version 1.2017
21
Figure 1.5 Proportion of adults (≥18 years) and children (<18 years). Patients alive on
31/12/2015.
This graph shows the percentage of patients in each country who are adults (dark blue) or children (light
blue). The percentage of adult patients varies considerably between the different countries, but this is
partly an effect of the way the patients are included: for some countries only a few individual centres sent
data to the ECFSPR, and the proportion of children and adults may reflect the proportion of paediatric and
adult centres in that country who participate in the ECFSPR. Please refer to table 1.1, page 16, for national
coverage.
0
10
20
30
40
50
60
70
80
90
100
LT DK SE NL IL LU UK DE IT IE FR CH SK GR AT ES PT CZ BG HU SI RS LV MK RU MD UA RO TR Total
%
<18 years ≥18 years

ECFSPR European Cystic Fibrosis Society Patient Registry
Annual data report (year 2015) version 1.2017
22
Table 1.3 Age at follow-up: descriptive statistics, by country and overall. Patients alive on
31/12/2015.
Country N Mean
(average age)
Min
(age of the youngest patient)
25th pctl
(25% of the patients are
younger than this
age)
Median
(half the patients
are younger than this
age)
75th pctl
(75% of the patients
are younger than this
age)
Max
(age of the oldest
patient)
Austria 722 18.8 0.2 9.3 17.6 26.6 78.7
Bulgaria 134 17.1 0.3 8.1 15.9 25.0 60.3
Czech Republic 581 17.9 0.1 8.7 16.5 25.1 60.0
Denmark 490 24.0 0.3 12.3 22.6 35.1 66.0
France 6513 21.2 0.0 10.2 19.4 29.9 83.1
Germany 5280 21.7 0.1 11.0 20.0 30.3 77.5
Greece 586 19.3 0.5 9.9 18.1 27.0 68.8
Hungary 556 17.6 0.1 10.1 15.8 23.8 66.9
Ireland 1248 21.2 0.2 10.3 19.8 30.5 81.4
Israel 662 22.5 0.4 12.3 21.0 31.0 70.5
Italy 5178 22.6 0.1 10.6 20.5 33.0 83.1
Latvia 35 13.9 1.8 7.3 12.9 19.0 30.7
Lithuania 13 25.4 18.1 21.9 25.6 28.7 31.5
Luxembourg 26 20.2 0.8 8.3 19.0 31.2 51.5
Rep of Macedonia 113 13.3 0.4 6.4 12.1 18.8 38.8
Rep of Moldova 53 11.3 0.3 5.5 9.7 16.5 28.0
The Netherlands 1390 23.1 0.1 11.6 21.3 32.5 74.5
Portugal 334 18.8 0.0 9.2 16.3 26.7 62.0
Romania 46 8.5 0.4 3.6 8.1 11.4 20.4
Russian Federation 2845 12.0 0.0 4.7 9.5 17.7 66.0
Serbia 176 14.5 0.9 7.1 13.1 19.9 50.4
Slovak Republic 255 20.1 0.1 8.6 18.4 27.3 80.2
Slovenia 95 17.0 1.1 6.9 15.4 23.4 56.0
Spain 1845 18.9 0.0 8.4 16.4 27.3 80.2
Sweden 637 24.2 0.1 11.5 22.6 34.4 73.5
Switzerland 875 20.6 0.1 8.9 19.4 29.7 69.5
Turkey 95 7.1 0.1 2.5 4.8 9.5 40.8
Ukraine 158 10.4 0.3 4.9 10.3 14.1 32.5
United Kingdom 10685 22.0 0.0 10.2 20.6 31.1 86.4
Total 41616 20.7 0.0 9.4 18.8 29.5 86.4
Note: Lithuania has 100% coverage for adults and 0% coverage for children. Romania has 100% coverage for children and 0% coverage for adults.
This table shows the descriptive statistics for age at follow-up of the patients by country and overall. Only
patients who were alive on December 31st 2015 are included.

ECFSPR European Cystic Fibrosis Society Patient Registry
Annual data report (year 2015) version 1.2017
23
Figure 1.6 Age at follow-up: box-plot, by country and overall. Patients alive on 31/12/2015.
This box-plot is a graphic representation of the age detailed in table 1.2. For each country the dash (black
line crossing the blue box) is the median, the black dot is the mean and the whiskers (vertical lines with
a T-shaped end) are the minimum and the maximum. The following figure explains how to read the box.
Note: This is an example of how to read a boxplot. The numbers used in this figure are not real and do not refer to figure 1.6.
0
10
20
30
40
50
60
70
80
90
Total
age
The oldest patient is 79 years old
Half of the patients are between 9.5 and 26 years old
The youngest patient is 16 days old
Half of the patients are younger than 17 years(and half of the patients are older than 17 years)
The mean age is 19 years(on average, patients are 19 years old)
0
10
20
30
40
50
60
70
80
90
TR RO RU MD UA MK LV RS SI HU BG PT ES CZ AT GR SK LU CH FR IE DE IT UK IL NL DK SE LT Total
age

ECFSPR European Cystic Fibrosis Society Patient Registry
Annual data report (year 2015) version 1.2017
24
Figure 1.7 Sex distribution, by country and overall. Patients alive on 31/12/2015.
Sex distribution of all patients. Overall (see “Total”), in the ECFSPR there are more male than female
patients, which could reflect higher mortality in female CF patients.
Figure 1.8 Sex distribution, by country and overall. Patients alive on 31/12/2015 and aged 18
years or more.
Note: Romania has only 3 patients aged 18 years or more at 31/12/2015 and is excluded from the graph.
Sex distribution for adult patients. The total proportion of females in the adult group is similar to the
proportion of females in the whole population.
0
10
20
30
40
50
60
70
80
90
100
LV RO RS SK SI CZ PT GR AT IT DE RU DK FR ES NL HU UK CH LU SE UA BG MD IE IL TR MK LT Total
%
Males Females
0
10
20
30
40
50
60
70
80
90
100
TR SI BG CZ SK PT FR AT IT ES LU DE SE DK NL UK RS GR CH RU IL HU LV IE MK LT UA MD Total
%
Males Females

ECFSPR European Cystic Fibrosis Society Patient Registry
Annual data report (year 2015) version 1.2017
25
2. Diagnosis
Hereafter, only patients seen during the year are presented.
Table 2.1 Age at diagnosis (in years): descriptive statistics, by country and overall. All patients
seen in 2015.
Country N N miss Mean
(average age at
diagnosis)
Min
(lowest age at
diagnosis)
25th pctl
(25 % of the patients
were diagnosed before this
age)
Median
(half the patients
were diagnosed
before this age)
75th pctl
(75% of the patients
were diagnosed before this
age)
Max
(highest age at
diagnosis)
Austria 637 67 2.23 0.0 0.10 0.20 0.60 61.00
Bulgaria 129 5 3.80 0.0 0.40 1.00 3.90 49.60
Czech Republic 571 0 2.50 0.0 0.10 0.30 2.10 42.90
Denmark 467 0 2.44 0.0 0.17 0.50 2.00 42.67
France 6491 62 4.42 0.0 0.10 0.20 2.90 78.50
Germany 4744 619 3.54 0.0 0.17 0.67 3.00 69.42
Greece 548 13 2.85 0.0 0.25 0.50 2.19 53.00
Hungary 456 102 2.80 0.0 0.00 1.00 3.00 42.00
Ireland 1060 0 2.95 0.0 0.06 0.30 2.00 75.83
Israel 546 4 5.17 0.0 0.10 0.58 5.42 65.00
Italy 5147 59 5.96 0.0 0.11 0.36 5.31 74.15
Latvia 36 1 3.56 0.0 0.35 1.04 5.25 14.00
Lithuania 14 0 11.65 1.0 6.00 10.50 16.00 27.10
Luxembourg 26 0 4.82 0.0 0.30 0.70 5.00 22.90
Rep of Macedonia 105 0 1.84 0.0 0.20 0.30 0.80 29.00
Rep of Moldova 45 0 2.01 0.1 0.25 0.41 1.00 16.00
The Netherlands 1243 124 4.21 0.0 0.10 0.50 3.50 63.00
Portugal 290 10 6.21 0.0 0.30 1.50 8.00 58.00
Romania 44 0 1.22 0.2 0.23 0.30 0.50 16.50
Russian Federation 2838 37 3.22 0.0 0.17 0.60 3.67 58.95
Serbia 174 6 2.79 0.1 0.30 0.80 4.00 17.50
Slovak Republic 175 38 7.06 0.0 0.11 1.00 9.50 72.00
Slovenia 91 3 1.79 0.0 0.15 0.46 2.00 16.50
Spain 1725 47 4.46 0.0 0.15 0.50 3.00 77.00
Sweden 631 14 3.93 0.0 0.19 0.76 3.01 62.28
Switzerland 727 125 3.42 0.0 0.10 0.50 2.50 61.20
Turkey 93 0 2.68 0.1 0.30 0.50 1.00 28.00
Ukraine 122 0 3.19 0.0 0.40 1.75 4.50 27.40
United Kingdom 9464 123 3.89 0.0 0.06 0.24 2.00 79.30
Total 38639 1459 4.10 0.0 0.10 0.36 3.00 79.30
Note: For Austria, Hungary, Slovak Republic and Switzerland the information on age at diagnosis is missing for more than 10% of the patients.
This table shows the descriptive statistics for age at diagnosis by country and overall. For prenatal
diagnoses (children diagnosed before birth), the age at diagnosis has been set to 0.
ECFSPR European Cystic Fibrosis Society Patient Registry
Annual data report (year 2015) version 1.2017
26
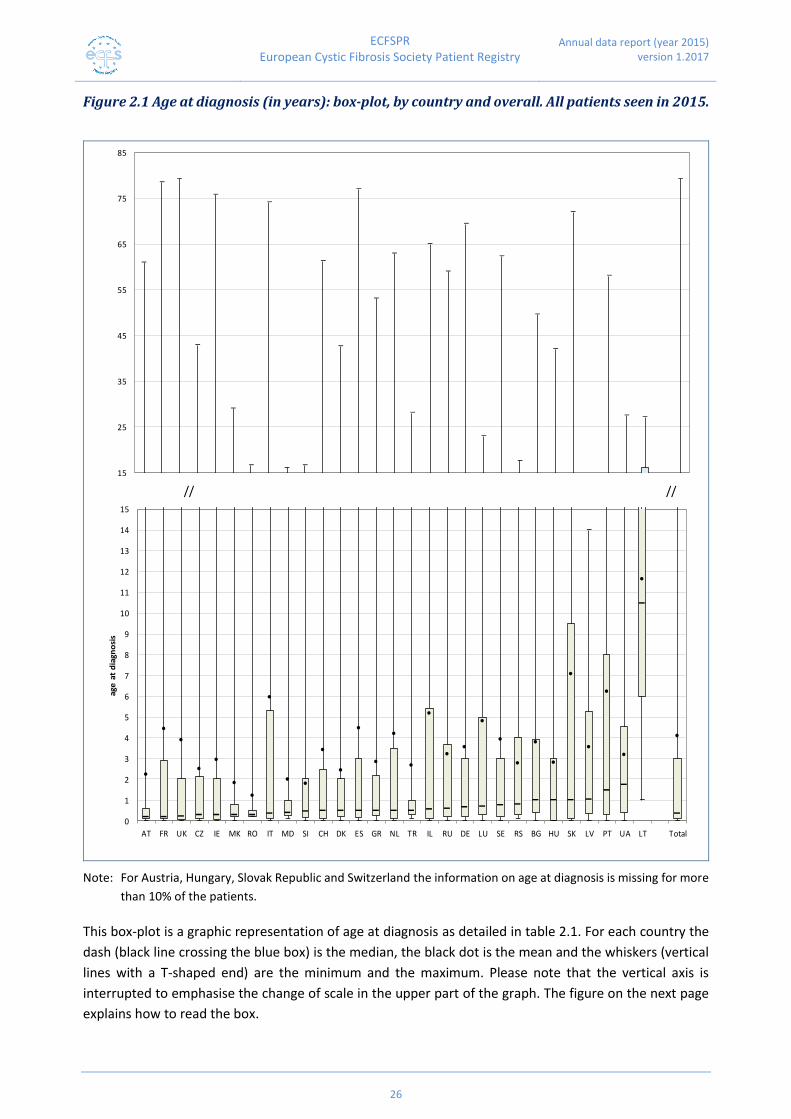
Figure 2.1 Age at diagnosis (in years): box-plot, by country and overall. All patients seen in 2015.
// //
Note: For Austria, Hungary, Slovak Republic and Switzerland the information on age at diagnosis is missing for more
than 10% of the patients.
This box-plot is a graphic representation of age at diagnosis as detailed in table 2.1. For each country the
dash (black line crossing the blue box) is the median, the black dot is the mean and the whiskers (vertical
lines with a T-shaped end) are the minimum and the maximum. Please note that the vertical axis is
interrupted to emphasise the change of scale in the upper part of the graph. The figure on the next page
explains how to read the box.
15
25
35
45
55
65
75
85
age
at
dia
gno
sis
(ye
ar)
0
1
2
3
4
5
6
7
8
9
10
11
12
13
14
15
AT FR UK CZ IE MK RO IT MD SI CH DK ES GR NL TR IL RU DE LU SE RS BG HU SK LV PT UA LT Total
age
at
dia
gno
sis

ECFSPR European Cystic Fibrosis Society Patient Registry
Annual data report (year 2015) version 1.2017
27
// //
Note: This is an example of how to read a boxplot. The numbers used in this figure are not real and do not refer to figure 2.1.
60
70
80
The patient with the highest age at diagnosis was diagnosed when he/she was 75 years old
age
0
1
2
3
4
5
Total
Half of the patients werediagnosed between 0.1 years
(36 days) and 3 years
The patient with the lowest age at diagnosis was diagnosed at birth
Half of the patients were diagnosed before 0.5 years (and half of the patients were diagnosed after 0.5 years)
The mean age at diagnosis is 3.6 years (patients on average are diagnosed at 3.6 years)

ECFSPR European Cystic Fibrosis Society Patient Registry
Annual data report (year 2015) version 1.2017
28
Figure 2.2 Proportion of patients diagnosed at age 1 month or younger, younger than 1 year and
older than 18 years, by country and overall. All patients seen in 2015.
Note: For Austria, Hungary, Slovak Republic and Switzerland the information on age at diagnosis is missing for more
than 10% of the patients.
This graph shows age at diagnosis in subgroups. The vertical bars represent how many patients (as a
percentage) were diagnosed within the first month of life (grey), within the first year of life (light green),
and after 18 years of age (dark green).
Note that the diagnoses included in the sub-group for within 1 month are also part of the diagnoses in the
sub-group for within the first year, and that diagnoses between 1 year and 18 years are not shown in the
graph; therefore the bars do not sum up to 100%.
0
10
20
30
40
50
60
70
80
HU UK IE DK IL IT SI FR NL CZ DE CH SE ES AT RU PT LU GR SK MK BG LV UA RO MD TR RS LT Total
%
≤1 month <1 year >18 years

ECFSPR European Cystic Fibrosis Society Patient Registry
Annual data report (year 2015) version 1.2017
29
Figure 2.3 Proportion of patients who underwent neonatal screening, by country and overall.
Patients 5 years old or younger seen in 2015.
Note: For Germany, Israel and Italy the information on neonatal screening is missing for more than 10% of the patients. Czech Republic: positive answers (“neonatal screening performed”) are reported when neonatal screening is one of the factors that led to CF diagnosis. France: neonatal screening is recorded only if it is part of the diagnosis. United Kingdom: diagnosis suggested by neonatal screening.
This graph shows the percentage of patients at the age of 5 years or younger in 2015 who were screened
at birth, (see country specific notes above). Dark green horizontal bars represent newborn screening
“performed”, light green ones “not performed”.
This graph shows that in some countries there is no newborn screening and that in others, in the five years
previous to 2015, almost all the CF patients underwent newborn screening. In total, 68% of all children of
5 years old or younger registered in the ECFSPR in 2015 underwent newborn screening, however, this
estimate reflects the fact that not all the countries perform newborn screening.
0 10 20 30 40 50 60 70 80 90 100
Total
SK
CZ
IT
FR
AT
RU
NL
ES
CH
IE
UK
DE
UA
PT
LU
IL
GR
TR
RS
BG
DK
HU
LV
MD
MK
RO
SE
SI
%
Performed Missing/Unknown Not performed
ECFSPR European Cystic Fibrosis Society Patient Registry
Annual data report (year 2015) version 1.2017
30
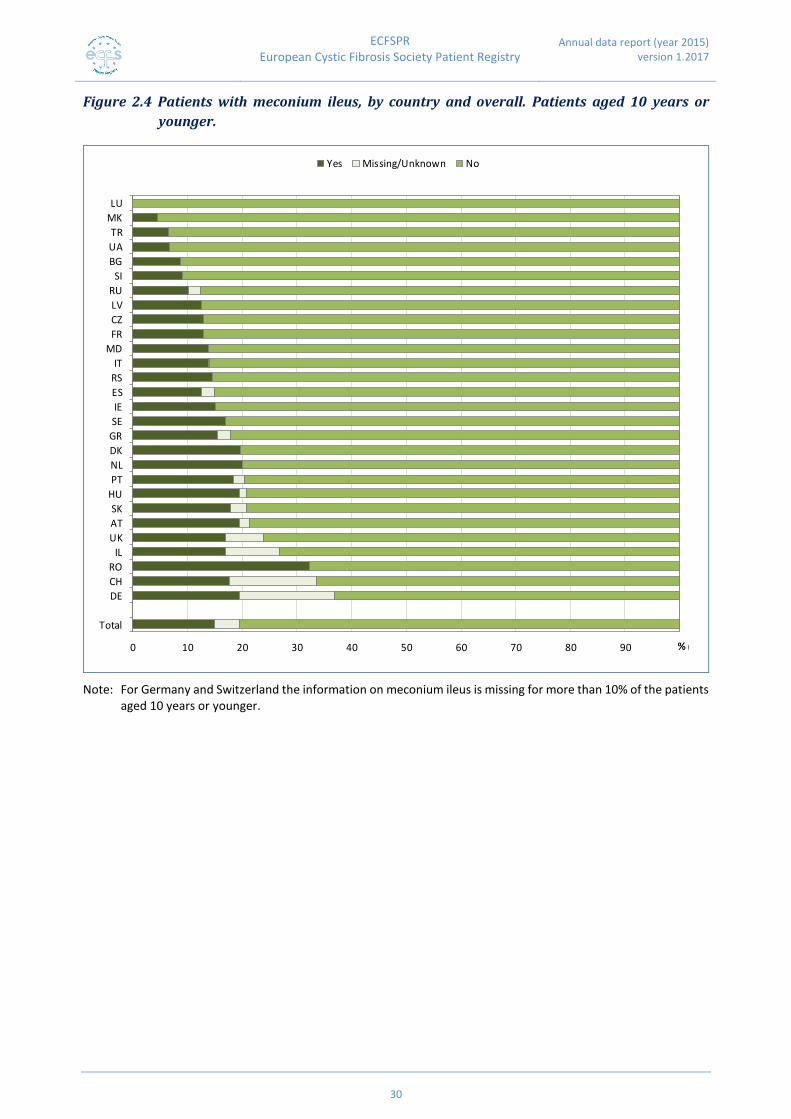
Figure 2.4 Patients with meconium ileus, by country and overall. Patients aged 10 years or
younger.
Note: For Germany and Switzerland the information on meconium ileus is missing for more than 10% of the patients aged 10 years or younger.
0 10 20 30 40 50 60 70 80 90 100
Total
DE
CH
RO
IL
UK
AT
SK
HU
PT
NL
DK
GR
SE
IE
ES
RS
IT
MD
FR
CZ
LV
RU
SI
BG
UA
TR
MK
LU
%
Yes Missing/Unknown No

ECFSPR European Cystic Fibrosis Society Patient Registry
Annual data report (year 2015) version 1.2017
31
Figure 2.5 Patients with meconium ileus, by country and overall. Patients aged 11 years or older.
Note: For Austria, Germany, Lithuania, Slovenia, Switzerland and United Kingdom the information on meconium ileus is missing for more than 10% of the patients aged 11 years or older.
These two graphs show the prevalence of meconium ileus (with or without surgical repair) at birth in two
age groups: 0 to 10 years (fig 2.4) and 11 years or older (fig 2.5). Overall, the proportion of younger patients
(≤10 years) with meconium ileus is higher compared to the older age group (>10 years). This difference is
not due to an increase in the prevalence of meconium ileus in the younger generations but could be due
to the fact that some older patients with meconium ileus have died, and are therefore not present in the
current data collection (which refers to patients seen in 2015). The graphs also show that the frequency
of reported meconium ileus varies between countries.
0 10 20 30 40 50 60 70 80 90 100
Total
LTDEUKCHATHU
ILSIIE
NLGRESPTDKCZIT
FRRSSELV
MKROSKRULUUABG
MDTR
%
Yes Missing/Unknown No

ECFSPR European Cystic Fibrosis Society Patient Registry
Annual data report (year 2015) version 1.2017
32
3. Genetics
Cystic fibrosis is caused by mutations of the ‘CFTR’ gene; one on each allele. One mutation is inherited
from the mother and one from the father. If both mutations are the same, the person is said to be
homozygous for this mutation. If these are two different mutations, the person is considered to be
heterozygous.
We supplied the countries with a list of the 1600 most common mutations based on the Cystic Fibrosis
Mutation database (CFTR1). If the patient had a mutation that was not present in the database, the country
had the possibility to enter the name of the mutation as free text. During the data cleaning process, the
genotypes not on our list were checked for obvious misspellings or alternative names and, if identified as
a known mutation, renamed. Although there are different naming conventions for mutations, we use the
original mutation name (legacy name) in this report, since more than 90% of the mutations in the database
use this nomenclature.
If DNA analysis to look for CFTR mutations was never carried out, we asked the countries to report “Not
done” in the genotype field. If DNA analysis was done, but only one or no mutations were found, we asked
the countries to write “Unknown” for the unidentified mutations. Please note that there are differences
from country to country in how DNA testing is carried out; some countries use standard kits that test only
a limited number of common mutations (e.g. 28), and other countries perform DNA analyses of the whole
gene until the mutation is identified.

ECFSPR European Cystic Fibrosis Society Patient Registry
Annual data report (year 2015) version 1.2017
33
Table 3.1 Proportion of patients with DNA analysis and the result of this, by country and overall.
All patients seen in 2015.
Country N Genotyping Among genotyping done
not done
number (%)
done
number (%)
unknown
number (%)
two mutations identified
number (%)
at least one mutation unknown
number (%)
Austria 704 2 702 0 621 81
(0.28) (99.72) (0) (88.46) (11.54)
Bulgaria 134 1 133 0 118 15 (0.75) (99.25) (0) (88.72) (11.28)
Czech Republic 571 1 570 0 564 6 (0.18) (99.82) (0) (98.95) (1.05)
Denmark 467 0 467 0 465 2 (0) (100) (0) (99.57) (0.43)
France 6553 0 6553 0 6297 256 (0) (100) (0) (96.09) (3.91)
Germany 5363 15 5348 0 4822 526 (0.28) (99.72) (0) (90.16) (9.84)
Greece 561 0 561 0 508 53 (0) (100) (0) (90.55) (9.45)
Hungary 558 10 548 0 396 152 (1.79) (98.21) (0) (72.26) (27.74)
Ireland 1060 0 1060 0 1010 50 (0) (100) (0) (95.28) (4.72)
Israel 550 1 549 0 441 108 (0.18) (99.82) (0) (80.33) (19.67)
Italy 5206 32 5173 1 4715 458 (0.61) (99.37) (0.02) (91.15) (8.85)
Latvia 37 0 37 0 27 10 (0) (100) (0) (72.97) (27.03)
Lithuania 14 0 14 0 13 1 (0) (100) (0) (92.86) (7.14)
Luxembourg 26 0 26 0 26 0 (0) (100) (0) (100) (0)
Rep of Macedonia 105 1 104 0 103 1 (0.95) (99.05) (0) (99.04) (0.96)
Rep of Moldova 45 0 45 0 33 12 (0) (100) (0) (73.33) (26.67)
The Netherlands 1367 15 1352 0 1329 23 (1.10) (98.90) (0) (98.30) (1.70)
Portugal 300 2 298 0 291 7 (0.67) (99.33) (0) (97.65) (2.35)
Romania 44 0 44 0 23 21 (0) (100) (0) (52.27) (47.73)
Russian Federation 2875 310 2565 0 1760 805 (10.78) (89.22) (0) (68.62) (31.38)
Serbia 180 7 173 0 140 33 (3.89) (96.11) (0) (80.92) (19.08)
Slovak Republic 213 0 213 0 168 45 (0) (100) (0) (78.87) (21.13)
Slovenia 94 2 92 0 87 5 (2.13) (97.87) (0) (94.57) (5.43)
Spain 1772 3 1769 0 1569 200 (0.17) (99.83) (0) (88.69) (11.31)
Sweden 645 0 645 0 639 6 (0) (100) (0) (99.07) (0.93)
Switzerland 852 7 845 0 801 44 (0.82) (99.18) (0) (94.79) (5.21)
Turkey 93 2 91 0 70 21 (2.15) (97.85) (0) (76.92) (23.08)
Ukraine 122 0 122 0 106 16 (0) (100) (0) (86.89) (13.11)
United Kingdom 9587 <5 9567 18 8849 718 (99.79) (0.19) (92.50) (7.50)
Total 40098 413 39666 19 35991 3675 (1.03) (98.92) (0.05) (90.74) (9.26)
Note: For United Kingdom, when the number of patients is less than 5 the information is suppressed.

ECFSPR European Cystic Fibrosis Society Patient Registry
Annual data report (year 2015) version 1.2017
34
The table shows how many patients underwent DNA analysis to identify the CFTR mutations (column
“genotyping done”) and, for those patients, how many patients had both mutations identified (column
“two mutations identified”) and for how many one or both mutations remained unidentified (column “at
least one mutation unknown”).
Figure 3.1 Proportion of identified mutations, by country and overall. Only patients with DNA
analysis.
This graph shows the percentage of mutations that are not identified (unknown in light pink) after DNA
analysis, by country and overall. One “allele” means one of the two CFTR genes. The number of non-
identified alleles varies greatly from country to country; this is partly due to the different approaches to
DNA testing. Overall, more than 5% of mutations remain unidentified after DNA analysis, leaving 9.26% of
the patients with at least one mutation unidentified.
0 10 20 30 40 50 60 70 80 90 100
Total
RO
RUTR
HU
MDIL
LV
SKRS
AT
UA
DEES
BG
GRIT
UK
CHLT
SI
IE
FRPT
NL
SECZ
MK
DKLU
%
Mutation identified Mutation unknown

ECFSPR European Cystic Fibrosis Society Patient Registry
Annual data report (year 2015) version 1.2017
35
Figure 3.2 Prevalence of F508del homozygous and heterozygous patients, by country and
overall. All patients seen in 2015.
F508del is the name of the most commonly occurring CFTR mutation in the world. Patients who carry two
F508del mutations are often described as having “classic CF”, but other combinations of mutations may
cause the same degree of disease. We have grouped the patients in F508del homozygous (patients who
have two F508del mutations), F508del heterozygous (patients who have one F508del mutation and
another mutation, different from F508del), and patients without F508del mutations. Only patients for
whom the genotype is known have been included in this graph. “Unknown” mutations have been classified
as “other”, since F508del is included in all genotyping kits and would have been identified. Please note
that the genotype grouping in this graph does not reflect the severity of the disease in the countries.
0
10
20
30
40
50
60
70
80
90
100
IL TR IT ES RU LT SK GR UA HU BG MD FR RO CZ SE CH DE AT UK PT IE MK RS SI NL LV LU DK Total
%
F508del homozygote F508del heterozygote Not F508del

ECFSPR European Cystic Fibrosis Society Patient Registry
Annual data report (year 2015) version 1.2017
36
Table 3.2 Allelic frequencies of the 16 most common mutations in the ECFSPR database.
Mutation name Number of alleles Percentage among tested
Country with highest allele frequency
F508del 48801 61.51 Denmark (82.01%)
G542X 2098 2.64 Spain (5.96%)
N1303K 1652 2.08 Turkey (7.14%)
G551D 1124 1.42 Ireland (8.77%)
W1282X 891 1.12 Israel (22.95%)
R117H 805 1.01 Ireland (2.64%)
2789+5G->A 752 0.95 Turkey (6.59%)
1717-1G->A 691 0.87 Switzerland (3.02%)
R553X 678 0.85 Lithuania (7.14%)
3849+10kbC->T 677 0.85 Lithuania (17.86%)
CFTRdele2,3 631 0.8 Czech Republic (6.40%)
621+1G->T 526 0.66 Greece (5.79%)
2183AA->G 458 0.58 Turkey (4.40%)
R1162X 426 0.54 Slovenia (4.35%)
D1152H 424 0.53 Israel (5.10%)
R347P 403 0.51 Luxembourg (3.85%)
This table presents the allele frequency of the 16 most commonly occurring mutations found in the ECFSPR
database. The last column reports in which country this particular mutation is most frequent. F508del is
by far the most frequent mutation. Additionally, since F508del is included in all genetic screening tests,
this is also the mutation with the highest detection rate.

ECFSPR European Cystic Fibrosis Society Patient Registry
Annual data report (year 2015) version 1.2017
37
Figure 3.3 Geographical distribution of mutation F508del.
Although this mutation is the most common in all countries, the allele frequency still varies from 24.23%
in Israel to 82.01% in Denmark.

ECFSPR European Cystic Fibrosis Society Patient Registry
Annual data report (year 2015) version 1.2017
38
Figure 3.4 Geographical distribution of mutation G542X.
This mutation is most frequent in Southern Europe, with the highest allele frequency in Spain (5.96%),
whereas it is very rarely found in Scandinavia (0.86% in Denmark and 0.85% in Sweden), Latvia (0%) and
Lithuania (0%).

ECFSPR European Cystic Fibrosis Society Patient Registry
Annual data report (year 2015) version 1.2017
39
Figure 3.5 Geographical distribution of mutation N1303K.
This mutation is most frequent in Turkey (7.14%) and other countries in Southern Europe and in Eastern
Europe, but rare in Northern Europe.

ECFSPR European Cystic Fibrosis Society Patient Registry
Annual data report (year 2015) version 1.2017
40
Figure 3.6 Geographical distribution of mutation G551D.
Note: Israel: G551D was not in the mutation panel for 2015, therefore the prevalence is unknown.
This mutation is most frequent in Ireland (8.77%), whereas it is very rare in Southern Europe (less than
0.5%).

ECFSPR European Cystic Fibrosis Society Patient Registry
Annual data report (year 2015) version 1.2017
41
Figure 3.7 Geographical distribution of mutation W1282X.
This mutation, of Middle-Eastern origin, is by far most frequent in Israel (22.95%) with a very high allele
frequency in Ashkenazi Jews.

ECFSPR European Cystic Fibrosis Society Patient Registry
Annual data report (year 2015) version 1.2017
42
4. Lung function
FEV1 is measured in litres but it is normally expressed as a percentage of the expected value (FEV1%). The
expected value is computed from healthy individuals of the same sex, height and age and is termed the
reference population.
We used the Global Lung Function Initiative equations described by Quanjer PH et al. for this report (for
full reference we refer you to Appendix 1, page 118). This is the global reference for spirometry and it has
been agreed, as part of the CF global harmonisation project, that this is the best way to present lung
function. In Appendix 3 (page 124) we have also included the outcomes based on the reference
populations and equations described by Wang et al. for children, and Hankinson et al. for adults (see
Appendix 1, page 118, for full reference).
A FEV1% of 100 means that the lung function measurement is equal to the mean lung function measure-
ment of people of the same age, sex and height of the healthy reference population.
Spirometry, the test that measures FEV1, requires a certain amount of coordination, and usually cannot be
performed reliably until a person with CF is about six years of age. We have therefore computed FEV1%
values only for patients aged 6 years or older.
We asked the countries to report the best FEV1 recorded throughout the year (according to the FEV1%
computed at the CF centres) to the ECFSPR. A few national registries do not record the best value, but
other FEV1 values that may not be the patient’s best that year, so we added a footnote to the tables and
graphs describing which FEV1 was reported from those countries. Research has shown that when
comparing groups of patients, the difference between the best FEV1% and a random value from the same
year can be up to 4.3% points1. This finding should be taken into consideration when comparing the results.
Likewise, as lung function in CF deteriorates with age, differences in FEV1 may reflect that the CF
population of a country is older.
We excluded patients from the analyses on FEV1 who have had one or more lung transplants, since their
lung function does not reflect the severity of their CF lung disease.
¹ Wanyama et al, JCF 2013; 9, S1:428.

ECFSPR European Cystic Fibrosis Society Patient Registry
Annual data report (year 2015) version 1.2017
43
Table 4.1 FEV1% of predicted: descriptive statistics, by country. Patients aged 6-17 years who
have never had a lung transplant.
Country N N Miss Mean
(average FEV1%)
Min 25th pctl
(25% of patients have FEV1% below
this value)
Median
(50% of patients have FEV1% below
this value)
75th pctl
(75% of patients have FEV1% below
this value)
Max
Austria 257 4 90.7 21.0 82.5 94.7 102.7 128.9
Bulgaria 48 2 77.4 29.0 62.7 76.9 93.8 124.5
Czech Republic 211 6 85.9 28.8 76.4 88.7 98.0 136.2
Denmark 138 0 95.0 42.0 87.5 98.2 105.4 127.7
France 2037 112 88.1 15.0 76.8 90.7 101.2 151.2
Germany 1711 30 89.0 19.3 78.1 91.8 102.1 147.9
Greece 194 9 94.8 18.4 87.1 97.6 106.9 136.0
Hungary 212 22 77.7 6.3 67.1 80.5 92.3 139.4
Ireland 364 1 88.7 21.3 77.4 90.6 101.4 135.2
Israel 183 1 90.1 28.2 80.8 93.7 101.8 120.6
Italy 1302 89 90.4 17.6 79.0 93.2 104.4 180.9
Latvia 17 0 93.4 64.4 84.3 93.6 103.6 119.6
Luxembourg <10 0 85.6 52.0 75.4 88.5 104.1 104.8
Rep of Macedonia 48 2 88.9 32.9 78.3 90.7 105.0 132.3
Rep of Moldova 17 0 84.6 49.2 70.7 83.1 103.9 124.6
The Netherlands 414 4 89.6 27.6 78.7 92.1 101.6 130.9
Portugal 104 8 83.9 22.9 65.1 88.6 104.8 130.0
Romania 26 0 94.9 72.7 86.8 96.1 100.8 113.3
Russian Federation 746 382 82.7 8.2 67.2 84.1 98.9 198.8
Serbia 74 1 81.6 25.9 69.4 83.5 96.7 132.2
Slovak Republic 69 1 82.0 30.5 72.1 85.6 92.7 108.8
Slovenia 38 0 82.1 38.2 70.5 85.2 100.6 112.1
Spain 594 14 89.0 22.0 77.5 91.3 102.9 136.2
Sweden1 176 5 92.7 22.4 81.7 95.4 105.1 137.8
Switzerland 236 5 88.4 35.3 78.1 89.8 99.9 130.0
Turkey 26 0 81.6 29.7 76.5 87.1 94.9 106.3
Ukraine 65 4 84.5 31.3 74.3 87.9 94.8 124.3
United Kingdom2 2267 563 87.1 23.5 77.5 88.6 98.2 158.6
1 Sweden reports FEV1 collected at the time of the annual review. 2 United Kingdom reports FEV1 collected at the time of the annual review. All analyses of FEV1 in the UK 2015 annual
report are restricted to those patients for whom prior annual surveys showed no prior lung transplants. Note: Lithuania has 0% coverage for children.
This table shows some descriptive statistics for FEV1 in children, expressed as % of predicted. Note that
patients who have had a lung transplant and children below 6 years of age have been excluded from the
analyses.

ECFSPR European Cystic Fibrosis Society Patient Registry
Annual data report (year 2015) version 1.2017
44
Figure 4.1 FEV1% of predicted: box-plot, by country and overall. Patients aged 6-17 years who
have never had a lung transplant.
Note: Sweden reports FEV1 collected at the time of the annual review. United Kingdom reports FEV1 collected at the time of the annual review. All analyses of FEV1 in the UK 2015 annual report are restricted to those patients for whom prior annual surveys showed no prior lung transplants.
This box-plot is a graphic representation of the FEV1 in children, expressed as % of predicted, detailed in
table 4.1. For each country the dash (black line crossing the blue box) is the median, the black dot is the
mean and the whiskers (vertical lines with a T-shaped end) are the minimum and the maximum.
0
20
40
60
80
100
120
140
160
180
200
BG HU MD RS RU SI SK TR UA LU PT UK CZ CH IE FR MK ES DE NL IT LV IL AT SE RO GR DK
FEV1%

ECFSPR European Cystic Fibrosis Society Patient Registry
Annual data report (year 2015) version 1.2017
45
Table 4.2 FEV1% of predicted: descriptive statistics, by country. Patients aged 18 years or older
who have never had a lung transplant.
Country N N Miss Mean
(average FEV1%)
Min 25th pctl
(25% of patients have FEV1% below
this value)
Median
(50% of patients have FEV1% below
this value)
75th pctl
(75% of patients have FEV1% below
this value)
Max
Austria 286 1 71.6 12.8 53.9 74.8 89.0 125.5
Bulgaria 51 0 53.1 14.5 37.8 47.4 73.4 99.8
Czech Republic 197 8 67.3 9.0 49.3 68.7 87.2 119.8
Denmark 225 1 72.5 15.1 54.7 74.2 91.5 129.8
France 2650 43 65.9 3.8 46.4 66.3 84.5 139.2
Germany 2599 92 63.9 11.2 43.5 62.8 82.6 146.5
Greece 216 5 66.2 18.4 43.3 67.7 90.0 125.0
Hungary 154 13 60.9 17.8 37.6 60.5 84.6 114.2
Ireland 453 0 64.5 13.8 46.5 65.9 82.5 128.8
Israel 293 0 70.0 19.7 53.8 71.7 86.8 125.0
Italy 2345 138 70.7 14.0 50.7 71.1 91.4 153.8
Latvia <10 1 44.1 21.1 29.7 33.7 49.3 97.2
Lithuania 11 0 68.6 24.9 44.2 74.8 89.8 122.9
Luxembourg 13 0 71.6 30.1 44.3 77.5 97.2 120.4
Rep of Macedonia 28 0 75.8 28.6 58.6 73.8 97.3 114.7
Rep of Moldova <10 0 67.9 17.4 43.5 79.1 97.0 106.4
The Netherlands 656 11 66.6 16.0 49.5 66.1 84.0 126.9
Portugal 94 1 67.0 23.0 50.0 66.7 81.0 135.8
Russian Federation 459 128 57.6 12.4 38.6 54.4 77.3 140.8
Serbia 41 0 56.7 19.4 44.2 53.6 69.1 94.9
Slovak Republic 91 0 64.0 12.7 44.6 68.1 80.7 109.3
Slovenia 27 1 57.2 19.8 37.6 58.6 72.7 105.8
Spain 587 11 68.1 16.2 50.6 68.5 86.5 128.2
Sweden1 305 16 72.4 21.8 56.6 72.1 92.0 131.7
Switzerland 384 2 64.9 14.3 47.8 63.2 81.8 122.4
Turkey <10 0 57.4 22.5 53.7 59.2 69.5 82.1
Ukraine 13 1 63.6 19.2 40.0 72.9 85.6 100.3
United Kingdom2 3723 1201 67.8 9.8 49.3 68.4 85.9 148.4
1 Sweden reports FEV1 collected at the time of the annual review. 2 United Kingdom reports FEV1 collected at the time of the annual review. All analyses of FEV1 in the UK 2015 annual
report are restricted to those patients for whom prior annual surveys showed no prior lung transplants. Note: Romania has 0% coverage for adults.
This table shows some descriptive statistics for FEV1 in adults, expressed as % of predicted. Note that
patients who have had a lung transplant have been excluded from the analyses.

ECFSPR European Cystic Fibrosis Society Patient Registry
Annual data report (year 2015) version 1.2017
46
Figure 4.2 FEV1% of predicted: box-plot, by country and overall. Patients aged 18 years or older
who have never had a lung transplant.
Note: Sweden reports FEV1 collected at the time of the annual review. United Kingdom reports FEV1 collected at the time of the annual review. All analyses of FEV1 in the UK 2015 annual report are restricted to those patients for whom prior annual surveys showed no prior lung transplants.
This box-plot is a graphic representation of the FEV1 in adults, expressed as % of predicted detailed in table
4.2. For each country the dash (black line crossing the blue box) is the median, the black dot is the mean
and the whiskers (vertical lines with a T-shaped end) are the minimum and the maximum.
0
20
40
60
80
100
120
140
160
LV BG RS RU SI TR HU DE CH IE NL FR PT GR SK UK ES CZ IT IL SE UA MK DK AT LT LU MD
FEV1%

ECFSPR European Cystic Fibrosis Society Patient Registry
Annual data report (year 2015) version 1.2017
47
Figure 4.3 Median FEV1% of predicted by age group and by country. Patients aged 6 years or
older who have never had a lung transplant.
Note: We excluded from the analyses those age groups with the number of patients <10. Note: Not all the countries reported the best FEV1 value of the year (see tables 4.1 and 4.2).
This graph shows the median FEV1% (the value that separates the highest and lowest half of the patients)
by age group. Each country is represented by a dot (in blue) and the overall estimate is in red. The general
pattern shows that the FEV1% slowly decreases until the age of 30-34, and then levels out. The patients in
the oldest age groups are patients that survived, and may therefore represent the patients with less
disease severity. There is considerable variability between countries.
Table 4.3 FEV1% of predicted: descriptive statistics by age group (patients aged 6 years or
older) who have never had a lung transplant.
Age at FEV1 measurement
N N Miss Mean
Min 25th pctl
Median
75th pctl
Max
6-9 3932 557 95.3 6.3 85.8 96.5 105.9 198.8
10-14 4782 455 86.9 17.1 76.1 89.0 99.4 152.8
15-19 4629 427 78.3 3.8 64.0 81.0 94.1 154.3
20-24 4002 391 71.1 10.0 53.9 73.0 89.5 148.4
25-29 3340 349 66.3 12.6 47.4 66.6 84.3 145.5
30-34 2373 253 62.2 9.8 42.7 60.1 80.7 141.2
35-39 1660 165 61.8 9.0 42.9 60.8 78.7 153.8
40-44 1125 118 62.7 13.5 43.0 60.6 81.0 130.2
45+ 1656 224 62.9 13.8 42.8 59.8 81.6 135.8
Note: Not every country reported the best FEV1 value of the year (see tables 4.1 and 4.2).
This table shows FEV1% by age group for the total data set. The median values reported in this table are
shown as red dots in fig 4.3.
30
40
50
60
70
80
90
100
110
6-9 10-14 15-19 20-24 25-29 30-34 35-39 40-44 45+
FEV1%
age

ECFSPR European Cystic Fibrosis Society Patient Registry
Annual data report (year 2015) version 1.2017
48
Figure 4.4 Quartiles of FEV1% of predicted by age group and by country. Patients aged 6 years
or older and who have never had a lung transplant.
The figures below show the FEV1% in different age groups, separately for each country. The dot shows the
median, and the whiskers show the 25th and 75th percentiles (the median, the 25th percentile and the 75th
percentile are collectively named “quartiles”). In blue are the quartiles for the country, in red are the
pooled quartiles computed on all other countries (i.e. excluding that country). We did not compute
quartiles where the number of patients is <10 in an age group, so there are no blue dots for those age
groups (the number of patients in each age group is shown below the horizontal axis). We therefore
excluded Latvia, Lithuania, Luxembourg and Republic of Moldova from the graphs because none of the age
groups had more than 10 patients.
Quartiles of FEV1%: Austria Quartiles of FEV1%: Bulgaria
Quartiles of FEV1%: Czech Republic Quartiles of FEV1%: Denmark
Quartiles of FEV1%: France Quartiles of FEV1%: Germany
Quartiles of FEV1%: Greece Quartiles of FEV1%: Hungary
20
40
60
80
100
120
agen
6-993
10-1496
15-19111
20-2483
25-2964
30-3445
35-3922
40-4411
45+18
FEV1%
20
40
60
80
100
120
agen
6-914
10-1418
15-1921
20-2417
25-2915
30-347
35-394
40-442
45+2
FEV1%
20
40
60
80
100
120
age
n
6-9
69
10-14
80
15-19
94
20-24
63
25-29
44
30-34
27
35-39
19
40-44
9
45+
3
FEV1%
20
40
60
80
100
120
agen
6-943
10-1458
15-1961
20-2455
25-2948
30-3426
35-3928
40-4422
45+22
FEV1%
20
40
60
80
100
120
agen
6-9686
10-14844
15-19805
20-24666
25-29596
30-34391
35-39260
40-44167
45+270
FEV1%
20
40
60
80
100
120
agen
6-9566
10-14677
15-19741
20-24608
25-29568
30-34405
35-39272
40-44187
45+286
FEV1%
20
40
60
80
100
120
age
n
6-9
66
10-14
85
15-19
79
20-24
67
25-29
42
30-34
27
35-39
22
40-44
11
45+
11
FEV1%
20
40
60
80
100
120
age
n
6-9
57
10-14
106
15-19
76
20-24
57
25-29
35
30-34
15
35-39
12
40-44
4
45+
4
FEV1%

ECFSPR European Cystic Fibrosis Society Patient Registry
Annual data report (year 2015) version 1.2017
49
[figure 4.4 continued]
Quartiles of FEV1%: Ireland Quartiles of FEV1%: Israel
Quartiles of FEV1%: Italy Quartiles of FEV1%: Rep of Macedonia
Quartiles of FEV1%: The Netherlands Quartiles of FEV1%: Portugal
Quartiles of FEV1%: Romania Quartiles of FEV1%: Russian Federation
Quartiles of FEV1%: Serbia Quartiles of FEV1%: Slovak Republic
20
40
60
80
100
120
age
n
6-9
130
10-14
138
15-19
147
20-24
108
25-29
114
30-34
79
35-39
47
40-44
23
45+
31
FEV1%
20
40
60
80
100
120
agen
6-962
10-1476
15-1975
20-2483
25-2954
30-3449
35-3933
40-4419
45+25
FEV1%
20
40
60
80
100
120
agen
6-9392
10-14576
15-19539
20-24492
25-29406
30-34362
35-39285
40-44261
45+334
FEV1%
20
40
60
80
100
120
age
n
6-9
14
10-14
24
15-19
17
20-24
9
25-29
9
30-34
2
35-39
1
40-44
0
45+
0
FEV1%
20
40
60
80
100
120
agen
6-9136
10-14153
15-19185
20-24169
25-29123
30-3482
35-3970
40-4455
45+97
FEV1%
20
40
60
80
100
120
agen
6-935
10-1444
15-1941
20-2422
25-2924
30-344
35-3912
40-4411
45+5
FEV1%
20
40
60
80
100
120
age
n6-9
1210-14
815-19
620-24
025-29
030-34
035-39
040-44
045+
FEV1%
20
40
60
80
100
120
agen
6-9294
10-14306
15-19220
20-24165
25-29136
30-3445
35-3923
40-443
45+13
FEV1%
20
40
60
80
100
120
age
n
6-9
24
10-14
41
15-19
17
20-24
11
25-29
12
30-34
4
35-39
4
40-44
2
45+
0
FEV1%
20
40
60
80
100
120
age
n
6-9
21
10-14
26
15-19
27
20-24
28
25-29
18
30-34
18
35-39
10
40-44
6
45+
6
FEV1%

ECFSPR European Cystic Fibrosis Society Patient Registry
Annual data report (year 2015) version 1.2017
50
[figure 4.4 continued]
Quartiles of FEV1%: Slovenia Quartiles of FEV1%: Spain
Quartiles of FEV1%: Sweden1 Quartiles of FEV1%: Switzerland
Quartiles of FEV1%: Turkey
Quartiles of FEV1%: Ukraine
Quartiles of FEV1%: United Kingdom2
1 Sweden reports FEV1 collected at the time of the annual review. 2 United Kingdom reports FEV1 collected at the time of the annual review. All analyses of FEV1 in the UK 2015 annual
report are restricted to those patients for whom prior annual surveys showed no prior lung transplants.
20
40
60
80
100
120
agen
6-910
10-1417
15-1916
20-2412
25-293
30-341
35-393
40-441
45+2
FEV1%
20
40
60
80
100
120
agen
6-9213
10-14242
15-19220
20-24146
25-2998
30-3484
35-3982
40-4441
45+55
FEV1%
20
40
60
80
100
120
agen
6-963
10-1475
15-1966
20-2475
25-2950
30-3449
35-3931
40-4431
45+41
FEV1%
20
40
60
80
100
120
age
n6-9
8310-14
9515-19
9820-24
11225-29
6630-34
5135-39
4940-44
2545+
41
FEV1%
20
40
60
80
100
120
agen
6-913
10-1410
15-196
20-241
25-291
30-340
35-390
40-440
45+0
FEV1%
20
40
60
80
100
120
age
n
6-9
18
10-14
35
15-19
18
20-24
5
25-29
2
30-34
0
35-39
0
40-44
0
45+
0
FEV1%
20
40
60
80
100
120
agen
6-9800
10-14939
15-19927
20-24935
25-29802
30-34594
35-39370
40-44233
45+390
FEV1%

ECFSPR European Cystic Fibrosis Society Patient Registry
Annual data report (year 2015) version 1.2017
51
Figure 4.5 FEV1% of predicted according to severity group and age group, by country and
overall. Patients aged 6-17 years who have never had a lung transplant.
Note: Not every country reported the best FEV1 value of the year. Sweden reports FEV1 collected at the time of the annual review. United Kingdom reports FEV1 collected at the time of the annual review. All analyses of FEV1 in the UK 2015 annual report are restricted to those patients for whom prior annual surveys showed no prior lung transplants.
Figures 4.5, 4.6 and 4.7 show the FEV1% by severity group, by country and overall. Patients with an FEV1%
higher than 80% are generally considered to have mild lung disease, patients with FEV1% between 80%
and 40% moderate lung disease, and patients with FEV1 <40% severe lung disease. However, since a 10
year old child with a lung function of 50% has considerably worse lung disease than a 50 year old patient
with the same FEV1%, and the age distribution is not the same in all countries, we have chosen to present
children (fig 4.5) and adults (fig 4.6 and 4.7) separately.
0
10
20
30
40
50
60
70
80
90
100
RO DK LV LU MD CH UK SE IE FR NL UA IL IT CZ GR DE ES SK AT MK PT SI RS RU HU TR BG Total
% o
f p
atie
nts
FEV1<40% FEV1 40-80% FEV1>80%

ECFSPR European Cystic Fibrosis Society Patient Registry
Annual data report (year 2015) version 1.2017
52
Figure 4.6 FEV1% of predicted according to severity group and age group, by country and
overall. Patients aged 18-29 years who have never had a lung transplant.
Note: Not every country reported the best FEV1 value of the year. Sweden reports FEV1 collected at the time of the annual review; United Kingdom reports FEV1 collected at the time of the annual review. All analyses of FEV1 in the UK 2015 annual report are restricted to those patients for whom prior annual surveys showed no prior lung transplants.
Figure 4.7 FEV1% of predicted according to severity group and age group, by country and
overall. Patients aged 30 years or older who have never had a lung transplant.
Note: Not every country reported the best FEV1 value of the year.
Sweden reports FEV1 collected at the time of the annual review; United Kingdom reports FEV1 collected at the time of the annual review. All analyses of FEV1 in the UK 2015 annual report are restricted to those patients for whom prior annual surveys showed no prior lung transplants.
Note: Latvia, Republic of Moldova, Romania, Turkey and Ukraine have no patients aged 30 years or older. Lithuania has only two patients aged 30 years or older and is excluded from the graph. Rep. of Macedonia has only three patients aged 30 years or older and is excluded from the graph.
0
10
20
30
40
50
60
70
80
90
100
LU MK SE NL RS CH ES IL IT AT DK LT UK CZ FR SK MD GR IE DE SI TR PT HU UA RU BG LV Total
% o
f p
atie
nts
FEV1<40% FEV1 40-80% FEV1>80%
0
10
20
30
40
50
60
70
80
90
100
PT IL SE AT IT ES DK SK UK NL CH BG IE FR CZ DE RU GR HU RS LU SI Total
% o
f p
atie
nts
FEV1<40% FEV1 40-80% FEV1>80%

ECFSPR European Cystic Fibrosis Society Patient Registry
Annual data report (year 2015) version 1.2017
53
5. Microbiology
We collect data on three chronic infections – Pseudomonas aeruginosa, Burkholderia cepacia complex
species and Staphylococcus aureus – as well as the occurrence of non-tuberculous mycobacteria (NTM)
and Stenotrophomonas maltophilia.
In the microbiology category discrepancies exist between the ECFSPR definitions and those of the national
registries. The ECFSPR definition of chronic infection (see Appendix 2, page 120) is:
Patient should be defined as chronically infected if he/she fulfils the criteria now or has done in recent
years and the physician has no reason to think the status has changed:
a. modified Leeds criteria, chronic infection: >50% of the sputum samples positive, collected
during the last 12 months. At least 4 sputum samples during that period;
b. and/or significantly raised bacteria-specific antibodies according to local laboratories.
When minor differences exist the alternative definition is in a footnote; when differences are major, or if
the variable is not collected at all, the variable has been set to missing for that country.

ECFSPR European Cystic Fibrosis Society Patient Registry
Annual data report (year 2015) version 1.2017
54
Table 5.1 Prevalence of chronic bacterial infection in all patients seen in 2015, by country.
Country Chronic Pseudomonas aeruginosa number (%)
Chronic Burkholderia cepacia complex species
number (%)
Chronic Staphylococcus aureus number (%)
Missing/ unknown
No Yes Missing/ unknown
No Yes Missing/ unknown
No Yes
Austria 11 498 195 7 673 24 6 312 386 (1.56) (70.74) (27.70) (0.99) (95.60) (3.41) (0.85) (44.32) (54.83)
Bulgaria 1 41 92 0 131 3 0 98 36 (0.74) (30.60) (68.66) (0) (97.76) (2.24) (0) (73.13) (26.87)
Czech Republic 12 431 128 12 506 53 14 290 267 (2.10) (75.48) (22.42) (2.10) (88.62) (9.28) (2.45) (50.79) (46.76)
Denmark 0 325 142 0 441 26 467 - - (0) (69.59) (30.41) (0) (94.43) (5.57) (100)
France 0 5169 1384 0 6487 66 6553 - - (0) (78.88) (21.12) (0) (98.99) (1.01) (100)
Germany 5363 - - 5363 - - 5363 - - (100) (100) (100)
Greece 50 262 249 52 509 0 48 392 121 (8.91) (46.70) (44.39) (9.27) (90.73) (0) (8.56) (69.87) (21.57)
Hungary 23 346 189 46 494 18 24 284 250 (4.12) (62.01) (33.87) (8.24) (88.53) (3.23) (4.30) (50.90) (44.80)
Ireland1 5 772 283 4 1034 22 4 625 431 (0.47) (72.83) (26.70) (0.38) (97.54) (2.08) (0.38) (58.96) (40.66)
Israel 27 296 227 22 523 5 26 333 191 (4.91) (53.82) (41.27) (4.00) (95.09) (0.91) (4.73) (60.54) (34.73)
Italy 297 3110 1799 298 4767 141 296 2306 2604 (5.70) (59.74) (34.56) (5.72) (91.57) (2.71) (5.69) (44.30) (50.01)
Latvia 12 14 11 9 28 0 12 5 20 (32.43) (37.84) (29.73) (24.32) (75.68) (0) (32.43) (13.51) (54.06)
Lithuania 0 12 2 0 12 2 0 6 8 (0) (85.71) (14.29) (0) (85.71) (14.29) (0) (42.86) (57.14)
Luxembourg 0 18 8 0 24 2 0 9 17 (0) (69.23) (30.77) (0) (92.31) (7.69) (0) (34.62) (65.38)
Rep of Macedonia 0 64 41 0 105 0 0 88 17 (0) (60.95) (39.05) (0) (100) (0) (0) (83.81) (16.19)
Rep of Moldova 0 16 29 2 42 1 0 15 30 (0) (35.56) (64.44) (4.44) (93.33) (2.22) (0) (33.33) (66.67)
The Netherlands 0 899 468 0 1339 28 0 844 523 (0) (65.76) (34.24) (0) (97.95) (2.05) (0) (61.74) (38.26)
Portugal 20 192 88 20 262 18 20 155 125 (6.67) (64.00) (29.33) (6.67) (87.33) (6.00) (6.67) (51.66) (41.67)
Romania 0 36 8 0 44 0 0 34 10 (0) (81.82) (18.18) (0) (100) (0) (0) (77.27) (22.73)
Russian Federation 157 1868 850 164 2532 179 163 1204 1508 (5.46) (64.97) (29.57) (5.70) (88.07) (6.23) (5.67) (41.88) (52.45)
Serbia 26 85 69 26 134 20 26 52 102 (14.44) (47.23) (38.33) (14.44) (74.45) (11.11) (14.44) (28.89) (56.67)
Slovak Republic 1 132 80 1 197 15 3 111 99 (0.47) (61.97) (37.56) (0.47) (92.49) (7.04) (1.41) (52.11) (46.48)
Slovenia 1 76 17 1 90 3 1 32 61 (1.06) (80.85) (18.09) (1.06) (95.75) (3.19) (1.06) (34.04) (64.90)
Spain 145 1167 460 148 1549 75 148 936 688 (8.18) (65.86) (25.96) (8.35) (87.42) (4.23) (8.35) (52.82) (38.83)
Sweden 0 372 273 0 628 17 645 - - (0) (57.67) (42.33) (0) (97.36) (2.64) (100)
Switzerland 38 522 292 33 800 19 40 386 426 (4.46) (61.27) (34.27) (3.87) (93.90) (2.23) (4.69) (45.31) (50.00)
Turkey 0 78 15 0 93 0 0 76 17 (0) (83.87) (16.13) (0) (100) (0) (0) (81.72) (18.28)
Ukraine 3 75 44 1 120 1 6 46 70 (2.46) (61.47) (36.07) (0.82) (98.36) (0.82) (4.92) (37.70) (57.38)
United Kingdom2 171 6557 2859 0 9245 342 181 7984 1422 (1.78) (68.40) (29.82) (0) (96.43) (3.57) (1.89) (83.28) (14.83)
1 Ireland: chronicity for Pseudomonas aeruginosa, Burkholderia and Staphylococcus aureus is defined as: at least 3 or more positive isolates during the last 12 months window preceding the last reported culture in 2015.
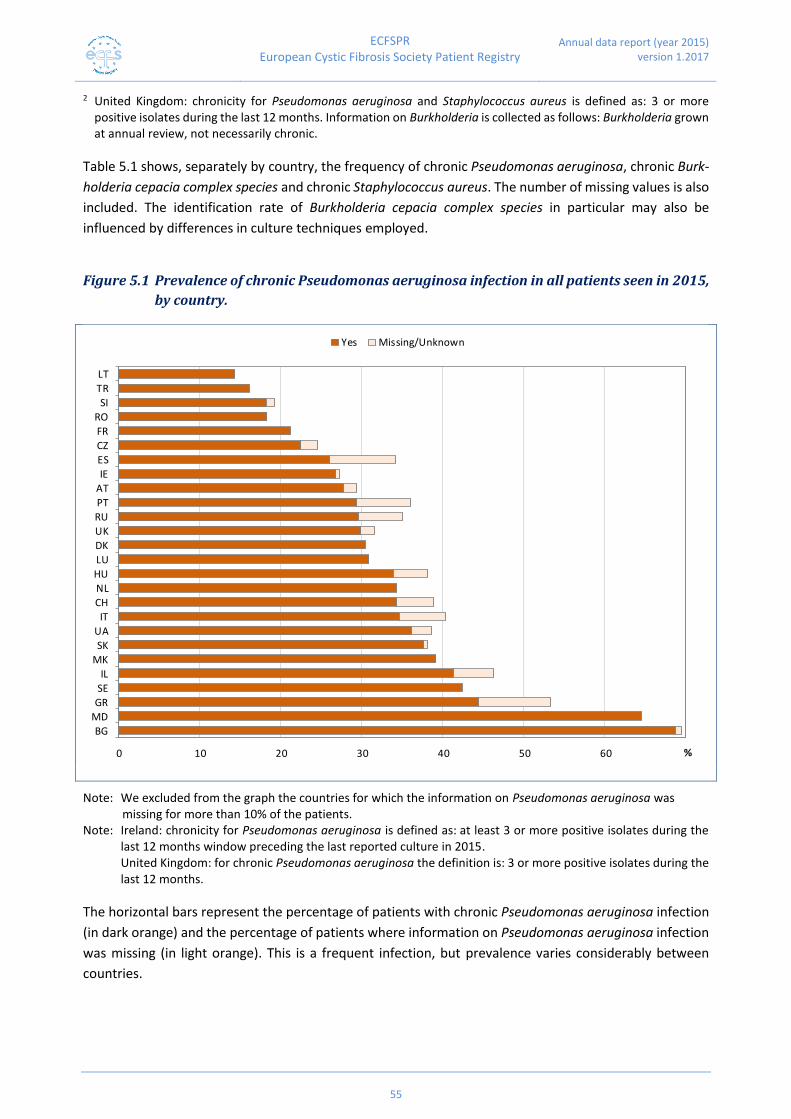
ECFSPR European Cystic Fibrosis Society Patient Registry
Annual data report (year 2015) version 1.2017
55
2 United Kingdom: chronicity for Pseudomonas aeruginosa and Staphylococcus aureus is defined as: 3 or more positive isolates during the last 12 months. Information on Burkholderia is collected as follows: Burkholderia grown at annual review, not necessarily chronic.
Table 5.1 shows, separately by country, the frequency of chronic Pseudomonas aeruginosa, chronic Burk-
holderia cepacia complex species and chronic Staphylococcus aureus. The number of missing values is also
included. The identification rate of Burkholderia cepacia complex species in particular may also be
influenced by differences in culture techniques employed.
Figure 5.1 Prevalence of chronic Pseudomonas aeruginosa infection in all patients seen in 2015,
by country.
Note: We excluded from the graph the countries for which the information on Pseudomonas aeruginosa was missing for more than 10% of the patients. Note: Ireland: chronicity for Pseudomonas aeruginosa is defined as: at least 3 or more positive isolates during the
last 12 months window preceding the last reported culture in 2015.
United Kingdom: for chronic Pseudomonas aeruginosa the definition is: 3 or more positive isolates during the last 12 months.
The horizontal bars represent the percentage of patients with chronic Pseudomonas aeruginosa infection
(in dark orange) and the percentage of patients where information on Pseudomonas aeruginosa infection
was missing (in light orange). This is a frequent infection, but prevalence varies considerably between
countries.
0 10 20 30 40 50 60 70
BG
MD
GR
SE
IL
MK
SK
UA
IT
CH
NL
HU
LU
DK
UK
RU
PT
AT
IE
ES
CZ
FR
RO
SI
TR
LT
%
Yes Missing/Unknown

ECFSPR European Cystic Fibrosis Society Patient Registry
Annual data report (year 2015) version 1.2017
56
Figure 5.2 Prevalence of chronic Burkholderia cepacia complex species infection in all patients
seen in 2015, by country.
Note: We excluded from the graph the countries for which the information on Burkholderia cepacia complex species was missing for more than 10% of the patients. Note: Ireland: chronicity for Burkholderia is defined as: at least 3 or more positive isolates during the last 12 months
window preceding the last reported culture in 2015.
United Kingdom: information on Burkholderia is collected as: Burkholderia grown at annual review, not necessarily chronic, and is excluded from the graph.
The horizontal bars represent the percentage of patients with chronic Burkholderia infection (in dark
orange) and the percentage of patients where information on Burkholderia infection was missing (in light
orange). This infection is much less frequent than Pseudomonas aeruginosa (note the different scale on
the horizontal axis), and there is also some variation.
0 2 4 6 8 10 12 14
LT
CZ
LU
SK
RU
PT
DK
ES
AT
HU
SI
IT
SE
BG
CH
MD
IE
NL
FR
IL
UA
GR
TR
RO
MK
%
Yes Missing/Unknown

ECFSPR European Cystic Fibrosis Society Patient Registry
Annual data report (year 2015) version 1.2017
57
Figure 5.3 Prevalence of chronic Staphylococcus aureus infection in all patients seen in 2015, by
country.
Note: We excluded from the graph the countries for which the information on Staphylococcus aureus was missing for more than 10% of the patients. Note: Ireland: chronicity for Pseudomonas aeruginosa is defined as: at least 3 or more positive isolates during the
last 12 months window preceding the last reported culture in 2015.
United Kingdom: for chronic Staphylococcus aureus the definition is: 3 or more positive isolates during the last 12 months.
The horizontal bars represent the percentage of patients with chronic Staphylococcus aureus infection (in
dark orange) and the percentage of patients where information on Staphylococcus aureus was missing (in
light orange). This infection is as frequent as chronic Pseudomonas aeruginosa infection and a similar
degree of variation between the countries can be observed.
0 10 20 30 40 50 60 70
MD
LU
SI
UA
LT
AT
RU
IT
CH
CZ
SK
HU
PT
IE
ES
NL
IL
BG
RO
GR
TR
MK
UK
%
Yes Missing/Unknown

ECFSPR European Cystic Fibrosis Society Patient Registry
Annual data report (year 2015) version 1.2017
58
Table 5.2 Prevalence of chronic bacterial infection in children seen in 2015, by country.
Country Chronic Pseudomonas aeruginosa number (%)
Chronic Burkholderia cepacia complex species
number (%)
Chronic Staphylococcus aureus number (%)
Missing/ unknown
No Yes Missing/ unknown
No Yes Missing/ unknown
No Yes
Austria 7 332 31 2 366 2 2 177 191 (1.89) (89.73) (8.38) (0.54) (98.92) (0.54) (0.54) (47.84) (51.62)
Bulgaria 1 37 38 0 76 0 0 54 22 (1.32) (48.68) (50.00) (0) (100) (0) (0) (71.05) (28.95)
Czech Republic 6 284 34 6 312 6 8 158 158 (1.85) (87.66) (10.49) (1.85) (96.30) (1.85) (2.46) (48.77) (48.77)
Denmark 0 175 13 0 187 1 188 - - (0) (93.09) (6.91) (0) (99.47) (0.53) (100)
France 0 2827 211 0 3026 12 3038 - - (0) (93.05) (6.95) (0) (99.61) (0.39) (100)
Germany 2320 - - 2320 - - 2320 - - (100) (100) (100)
Greece 4 194 76 5 269 0 3 235 36 (1.46) (70.80) (27.74) (1.82) (98.18) (0) (1.09) (85.77) (13.14)
Hungary 6 226 85 25 286 6 6 177 134 (1.89) (71.30) (26.81) (7.89) (90.22) (1.89) (1.89) (55.84) (42.27)
Ireland 0 480 46 0 521 5 0 266 260 (0) (91.25) (8.75) (0) (99.05) (0.95) (0) (50.57) (49.43)
Israel 14 179 48 12 228 1 14 131 96 (5.81) (74.27) (19.92) (4.98) (94.61) (0.41) (5.81) (54.36) (39.83)
Italy 140 1784 350 142 2127 5 140 1010 1124 (6.16) (78.45) (15.39) (6.24) (93.54) (0.22) (6.16) (44.42) (49.42)
Latvia 7 14 4 5 20 0 6 2 17 (28.00) (56.00) (16.00) (20.00) (80.00) (0) (24.00) (8.00) (68.00)
Luxembourg 0 9 2 0 11 0 0 7 4 (0) (81.82) (18.18) (0) (100) (0) (0) (63.64) (36.36)
Rep of Macedonia 0 54 22 0 76 0 0 66 10 (0) (71.05) (28.95) (0) (100) (0) (0) (86.84) (13.16)
Rep of Moldova 0 14 24 2 35 1 0 12 26 (0) (36.84) (63.16) (5.26) (92.11) (2.63) (0) (31.58) (68.42)
The Netherlands 0 502 77 0 571 8 0 353 226 (0) (86.7) (13.3) (0) (98.62) (1.38) (0) (60.97) (39.03)
Portugal 10 127 39 10 156 10 10 95 71 (5.68) (72.16) (22.16) (5.68) (88.64) (5.68) (5.68) (53.98) (40.34)
Romania 0 36 6 0 42 0 0 32 10 (0) (85.71) (14.29) (0) (100) (0) (0) (76.19) (23.81)
Russian Federation 93 1556 517 102 1968 96 101 869 1196 (4.29) (71.84) (23.87) (4.71) (90.86) (4.43) (4.66) (40.12) (55.22)
Serbia 15 75 35 15 97 13 15 33 77 (12.00) (60.00) (28.00) (12.00) (77.60) (10.40) (12.00) (26.40) (61.60)
Slovak Republic 1 83 28 1 110 1 2 52 58 (0.89) (74.11) (25.00) (0.89) (98.22) (0.89) (1.79) (46.43) (51.78)
Slovenia 0 53 6 0 58 1 0 21 38 (0) (89.83) (10.17) (0) (98.31) (1.69) (0) (35.59) (64.41)
Spain 70 786 136 71 895 26 70 555 367 (7.06) (79.23) (13.71) (7.16) (90.22) (2.62) (7.06) (55.94) (37.00)
Sweden 0 204 44 0 245 3 248 - - (0) (82.26) (17.74) (0) (98.79) (1.21) (100)
Switzerland 11 341 49 8 390 3 12 176 213 (2.74) (85.04) (12.22) (2.00) (97.25) (0.75) (2.99) (43.89) (53.12)
Turkey 0 75 12 0 87 0 0 72 15 (0) (86.21) (13.79) (0) (100) (0) (0) (82.76) (17.24)
Ukraine 3 73 31 1 105 1 6 43 58 (2.80) (68.23) (28.97) (0.93) (98.14) (0.93) (5.61) (40.19) (54.20)
United Kingdom1 78 3812 334 0 4166 58 79 3804 341 (1.85) (90.24) (7.91) (0) (98.63) (1.37) (1.87) (90.06) (8.07)
1 United Kingdom: chronicity for Pseudomonas aeruginosa and Staphylococcus aureus is defined as: 3 or more positive isolates during the last 12 months. Information on Burkholderia is collected as follows: Burkholderia grown at annual review, not necessarily chronic.
Note: Lithuania has 0% coverage for children.

ECFSPR European Cystic Fibrosis Society Patient Registry
Annual data report (year 2015) version 1.2017
59
Table 5.2 shows, separately by country, the frequency of chronic Pseudomonas aeruginosa, chronic
Burkholderia cepacia complex species and chronic Staphylococcus aureus in children. The number of
missing values is also included. The identification rate of Burkholderia cepacia complex species in particular
may also be influenced by differences in culture techniques employed.

ECFSPR European Cystic Fibrosis Society Patient Registry
Annual data report (year 2015) version 1.2017
60
Table 5.3 Prevalence of chronic bacterial infection in adults seen in 2015, by country.
Country Chronic Pseudomonas aeruginosa number (%)
Chronic Burkholderia cepacia complex species
number (%)
Chronic Staphylococcus aureus number (%)
Missing/ unknown
No Yes Missing/ unknown
No Yes Missing/ unknown
No Yes
Austria 4 166 164 5 307 22 4 135 195 (1.20) (49.70) (49.10) (1.50) (91.91) (6.59) (1.20) (40.42) (58.38)
Bulgaria 0 4 54 0 55 3 0 44 14 (0) (6.90) (93.10) (0) (94.83) (5.17) (0) (75.86) (24.14)
Czech Republic 6 147 94 6 194 47 6 132 109 (2.43) (59.51) (38.06) (2.43) (78.54) (19.03) (2.43) (53.44) (44.13)
Denmark 0 150 129 0 254 25 279 - - (0) (53.76) (46.24) (0) (91.04) (8.96) (100)
France 0 2342 1173 0 3461 54 3515 - - (0) (66.63) (33.37) (0) (98.46) (1.54) (100)
Germany 3040 - - 3040 - - 3040 - - (100) (100) (100)
Greece 46 68 173 47 240 0 45 157 85 (16.03) (23.69) (60.28) (16.38) (83.62) (0) (15.68) (54.70) (29.62)
Hungary 17 119 104 21 207 12 18 106 116 (7.08) (49.59) (43.33) (8.75) (86.25) (5.00) (7.50) (44.17) (48.33)
Ireland1 5 292 237 4 513 17 4 359 171 (0.94) (54.68) (44.38) (0.75) (96.07) (3.18) (0.75) (67.23) (32.02)
Israel 13 117 179 10 295 4 12 202 95 (4.21) (37.86) (57.93) (3.24) (95.47) (1.29) (3.88) (65.38) (30.74)
Italy 157 1326 1448 156 2640 135 156 1295 1480 (5.36) (45.24) (49.40) (5.32) (90.07) (4.61) (5.32) (44.18) (50.50)
Latvia 5 0 7 4 8 0 6 3 3 (41.67) (0) (58.33) (33.33) (66.67) (0) (50.00) (25.00) (25.00)
Lithuania 0 12 2 0 12 2 0 6 8 (0) (85.71) (14.29) (0) (85.71) (14.29) (0) (42.86) (57.14)
Luxembourg 0 9 6 0 13 2 0 2 13 (0) (60.00) (40.00) (0) (86.67) (13.33) (0) (13.33) (86.67)
Rep of Macedonia 0 10 19 0 29 0 0 22 7 (0) (34.48) (65.52) (0) (100) (0) (0) (75.86) (24.14)
Rep of Moldova 0 2 5 0 7 0 0 3 4 (0) (28.57) (71.43) (0) (100) (0) (0) (42.86) (57.14)
The Netherlands 0 397 391 0 768 20 0 491 297 (0) (50.38) (49.62) (0) (97.46) (2.54) (0) (62.31) (37.69)
Portugal 10 65 49 10 106 8 10 60 54 (8.06) (52.42) (39.52) (8.06) (85.49) (6.45) (8.06) (48.39) (43.55)
Romania 0 0 2 0 2 0 0 2 0 (0) (0) (100) (0) (100) (0) (0) (100) (0)
Russian Federation 64 312 333 62 564 83 62 335 312 (9.03) (44.01) (46.96) (8.74) (79.55) (11.71) (8.74) (47.25) (44.01)
Serbia 11 10 34 11 37 7 11 19 25 (20.00) (18.18) (61.82) (20.00) (67.27) (12.73) (20.00) (34.55) (45.45)
Slovak Republic 0 49 52 0 87 14 1 59 41 (0) (48.51) (51.49) (0) (86.14) (13.86) (0.99) (58.42) (40.59)
Slovenia 1 23 11 1 32 2 1 11 23 (2.86) (65.71) (31.43) (2.86) (91.43) (5.71) (2.86) (31.43) (65.71)
Spain 75 381 324 77 654 49 78 381 321 (9.62) (48.84) (41.54) (9.87) (83.85) (6.28) (10.00) (48.85) (41.15)
Sweden 0 168 229 0 383 14 397 - - (0) (42.32) (57.68) (0) (96.47) (3.53) (100)
Switzerland 27 181 243 25 410 16 28 210 213 (5.99) (40.13) (53.88) (5.54) (90.91) (3.55) (6.21) (46.56) (47.23)
Turkey 0 3 3 0 6 0 0 4 2 (0) (50.00) (50.00) (0) (100) (0) (0) (66.67) (33.33)
Ukraine 0 2 13 0 15 0 0 3 12 (0) (13.33) (86.67) (0) (100) (0) (0) (20.00) (80.00)
United Kingdom2 93 2745 2525 0 5079 284 102 4180 1081 (1.73) (51.19) (47.08) (0) (94.70) (5.30) (1.90) (77.94) (20.16)
1 Ireland: chronicity for Pseudomonas aeruginosa, Burkholderia and Staphylococcus aureus is defined as: at least 3 or more positive isolates during the last 12 months window preceding the last reported culture in 2015.

ECFSPR European Cystic Fibrosis Society Patient Registry
Annual data report (year 2015) version 1.2017
61
2 United Kingdom: chronicity for Pseudomonas aeruginosa and Staphylococcus aureus is defined as: 3 or more positive isolates during the last 12 months. Information on Burkholderia is collected as follows: Burkholderia grown at annual review, not necessarily chronic.
This table shows, separately by country, the frequency of chronic Pseudomonas aeruginosa, chronic Burk-
holderia cepacia complex species and chronic Staphylococcus aureus in adults. The number of missing
values is also included. The identification rate of Burkholderia cepacia complex species in particular may
also be influenced by differences in culture techniques employed.

ECFSPR European Cystic Fibrosis Society Patient Registry
Annual data report (year 2015) version 1.2017
62
Table 5.4 Prevalence of non-tuberculous mycobacteria and Stenotrophomonas maltophilia
infection in all patients seen in 2015, by country.
Country Non-tuberculous mycobacteria (NTM) infection this year
number (%)
Stenotrophomonas maltophilia infection this year
number (%)
Missing/ unknown
No Yes Missing/ unknown
No Yes
Austria 24 649 31 7 600 97 (3.41) (92.19) (4.40) (0.99) (85.23) (13.78)
Bulgaria 134 - - 0 131 3 (100) (0) (97.76) (2.24)
Czech Republic 323 238 10 5 511 55 (56.57) (41.68) (1.75) (0.88) (89.49) (9.63)
Denmark 1 442 24 467 - - (0.21) (94.65) (5.14) (100)
France 0 6410 143 0 5879 674 (0) (97.82) (2.18) (0) (89.71) (10.29)
Germany 5363 - - 5363 - - (100) (100)
Greece 363 196 2 50 472 39 (64.70) (34.94) (0.36) (8.91) (84.14) (6.95)
Hungary 135 420 3 20 519 19 (24.19) (75.27) (0.54) (3.58) (93.01) (3.41)
Ireland 4 1033 23 4 966 90 (0.38) (97.45) (2.17) (0.38) (91.13) (8.49)
Israel 22 487 41 23 490 37 (4.00) (88.55) (7.45) (4.18) (89.09) (6.73)
Italy 299 4865 42 299 4652 255 (5.74) (93.45) (0.81) (5.74) (89.36) (4.90)
Latvia 7 30 0 7 28 2 (18.92) (81.08) (0) (18.92) (75.67) (5.41)
Lithuania 0 14 0 0 12 2 (0) (100) (0) (0) (85.71) (14.29)
Luxembourg 0 24 2 0 25 1 (0) (92.31) (7.69) (0) (96.15) (3.85)
Rep of Macedonia 0 105 0 0 105 0 (0) (100) (0) (0) (100) (0)
Rep of Moldova 45 - - 2 43 0 (100) (4.44) (95.56) (0)
The Netherlands 0 1339 28 0 1213 154 (0) (97.95) (2.05) (0) (88.73) (11.27)
Portugal 20 272 8 20 246 34 (6.67) (90.66) (2.67) (6.67) (82.00) (11.33)
Romania 0 44 0 0 44 0 (0) (100) (0) (0) (100) (0)
Russian Federation 881 1976 18 122 2658 95 (30.64) (68.73) (0.63) (4.24) (92.46) (3.30)
Serbia 26 153 1 26 131 23 (14.44) (85.00) (0.56) (14.44) (72.78) (12.78)
Slovak Republic 1 210 2 1 202 10 (0.47) (98.59) (0.94) (0.47) (94.84) (4.69)
Slovenia 37 54 3 15 77 2 (39.36) (57.45) (3.19) (15.96) (81.91) (2.13)
Spain 428 1290 54 144 1481 147 (24.15) (72.80) (3.05) (8.13) (83.57) (8.30)
Sweden 0 610 35 0 591 54 (0) (94.57) (5.43) (0) (91.63) (8.37)
Switzerland 85 741 26 32 719 101 (9.98) (86.97) (3.05) (3.76) (84.39) (11.85)
Turkey 0 93 0 0 93 0 (0) (100) (0) (0) (100) (0)
Ukraine 122 - - 1 119 2 (100) (0.82) (97.54) (1.64)
United Kingdom 0 9051 536 0 9017 570 (0) (94.41) (5.59) (0) (94.05) (5.95)

ECFSPR European Cystic Fibrosis Society Patient Registry
Annual data report (year 2015) version 1.2017
63
Table 5.4 shows the frequency of two other infections, non-tuberculous mycobacteria (NTM) and Stenotro-
phomonas maltophilia. Both these infections seem to be relatively rare, in line with the frequencies of
Burkholderia infection. The identification rate of these bacteria may also be influenced by differences in
culture techniques employed.
Figure 5.4 Prevalence of non-tuberculous mycobacteria in all patients seen in 2015, by country.
Note: We excluded from the graph the countries for which the information on non-tuberculous mycobacteria was
missing for more than 10% of the patients.
The horizontal bars represent the percentage of patients with non-tuberculous mycobacteria infection (in
dark orange) and the percentage of patients where information on non-tuberculous mycobacteria
infection was missing (in light orange). Generally, infections from these bacteria are not very frequent in
any country.
0 2 4 6 8 10 12 14
LU
IL
UK
SE
DK
AT
CH
PT
FR
IE
NL
SK
IT
TR
RO
MK
LT
%
Yes Missing/Unknown

ECFSPR European Cystic Fibrosis Society Patient Registry
Annual data report (year 2015) version 1.2017
64
Figure 5.5 Prevalence of Stenotrophomonas maltophilia infection in all patients seen in 2015,
by country.
Note: We excluded from the graph the countries for which the information on Stenotrophomonas maltophilia was missing for more than 10% of the patients.
The horizontal bars represent the percentage of patients with Stenotrophomonas maltophilia infection (in
dark orange) and the percentage of patients where information on Stenotrophomonas maltophilia was
missing (light orange). The frequency varies considerably between countries.
0 2 4 6 8 10 12 14 16 18 20
LT
AT
CH
PT
NL
FR
CZ
IE
SE
ES
GR
IL
UK
IT
SK
LU
HU
RU
BG
UA
MD
TR
RO
MK
%
Yes Missing/Unknown

ECFSPR European Cystic Fibrosis Society Patient Registry
Annual data report (year 2015) version 1.2017
65
Table 5.5 Prevalence of non-tuberculous mycobacteria and Stenotrophomonas maltophilia
infection in children seen in 2015, by country.
Country Non-tuberculous mycobacteria (NTM) infection this year
number (%)
Stenotrophomonas maltophilia infection this year
number (%)
Missing/ unknown
No Yes Missing/ unknown
No Yes
Austria 13 348 9 1 321 48 (3.51) (94.06) (2.43) (0.27) (86.76) (12.97)
Bulgaria 76 - - 0 73 3 (100) (0) (96.05) (3.95)
Czech Republic 257 65 2 1 291 32 (79.32) (20.06) (0.62) (0.31) (89.81) (9.88)
Denmark 0 180 8 188 - - (0) (95.74) (4.26) (100)
France 0 2999 39 0 2690 348 (0) (98.72) (1.28) (0) (88.55) (11.45)
Germany 2320 - - 2320 - - (100) (100)
Greece 169 104 1 4 258 12 (61.68) (37.96) (0.36) (1.46) (94.16) (4.38)
Hungary 102 215 0 6 302 9 (32.18) (67.82) (0) (1.89) (95.27) (2.84)
Ireland 0 519 7 0 462 64 (0) (98.67) (1.33) (0) (87.83) (12.17)
Israel 12 218 11 13 207 21 (4.98) (90.46) (4.56) (5.39) (85.90) (8.71)
Italy 142 2121 11 142 2040 92 (6.24) (93.28) (0.48) (6.24) (89.71) (4.05)
Latvia 3 22 0 3 21 1 (12.00) (88.00) (0) (12.00) (84.00) (4.00)
Luxembourg 0 11 0 0 11 0 (0) (100) (0) (0) (100) (0)
Rep of Macedonia 0 76 0 0 76 0 (0) (100) (0) (0) (100) (0)
Rep of Moldova 38 - - 2 36 0 (100) (5.26) (94.74) (0)
The Netherlands 0 564 15 0 494 85 (0) (97.41) (2.59) (0) (85.32) (14.68)
Portugal 10 163 3 10 144 22 (5.68) (92.62) (1.70) (5.68) (81.82) (12.50)
Romania 0 42 0 0 42 0 (0) (100) (0) (0) (100) (0)
Russian Federation 618 1536 12 70 2026 70 (28.53) (70.92) (0.55) (3.23) (93.54) (3.23)
Serbia 15 109 1 15 90 20 (12.00) (87.20) (0.80) (12.00) (72.00) (16.00)
Slovak Republic 1 111 0 1 108 3 (0.89) (99.11) (0) (0.89) (96.43) (2.68)
Slovenia 23 34 2 0 58 1 (38.98) (57.63) (3.39) (0) (98.31) (1.69)
Spain 275 691 26 71 826 95 (27.72) (69.66) (2.62) (7.16) (83.26) (9.58)
Sweden 0 236 12 0 231 17 (0) (95.16) (4.84) (0) (93.15) (6.85)
Switzerland 14 384 3 7 356 38 (3.49) (95.76) (0.75) (1.75) (88.77) (9.48)
Turkey 0 87 0 0 87 0 (0) (100) (0) (0) (100) (0)
Ukraine 107 - - 1 104 2 (100) (0.93) (97.20) (1.87)
United Kingdom 0 4074 150 0 3987 237 (0) (96.45) (3.55) (0) (94.39) (5.61)
Note: Lithuania has 0% coverage for children.

ECFSPR European Cystic Fibrosis Society Patient Registry
Annual data report (year 2015) version 1.2017
66
Table 5.6 Prevalence of non-tuberculous mycobacteria and Stenotrophomonas maltophilia
infection in adults seen in 2015, by country.
Country Non-tuberculous mycobacteria (NTM) infection this year
number (%)
Stenotrophomonas maltophilia infection this year
number (%)
Missing/ unknown
No Yes Missing/ unknown
No Yes
Austria 11 301 22 6 279 49 (3.29) (90.12) (6.59) (1.80) (83.53) (14.67)
Bulgaria 58 - - 0 58 0 (100) (0) (100) (0)
Czech Republic 66 173 8 4 220 23 (26.72) (70.04) (3.24) (1.62) (89.07) (9.31)
Denmark 1 262 16 279 - - (0.36) (93.91) (5.73) (100)
France 0 3411 104 0 3189 326 (0) (97.04) (2.96) (0) (90.73) (9.27)
Germany 3040 - - 3040 - - (100) (100)
Greece 194 92 1 46 214 27 (67.59) (32.06) (0.35) (16.03) (74.56) (9.41)
Hungary 33 204 3 14 216 10 (13.75) (85.00) (1.25) (5.83) (90.00) (4.17)
Ireland 4 514 16 4 504 26 (0.75) (96.25) (3.00) (0.75) (94.38) (4.87)
Israel 10 269 30 10 283 16 (3.24) (87.05) (9.71) (3.24) (91.58) (5.18)
Italy 157 2743 31 157 2611 163 (5.36) (93.58) (1.06) (5.36) (89.08) (5.56)
Latvia 4 8 0 4 7 1 (33.33) (66.67) (0) (33.33) (58.34) (8.33)
Lithuania 0 14 0 0 12 2 (0) (100) (0) (0) (85.71) (14.29)
Luxembourg 0 13 2 0 14 1 (0) (86.67) (13.33) (0) (93.33) (6.67)
Rep of Macedonia 0 29 0 0 29 0 (0) (100) (0) (0) (100) (0)
Rep of Moldova 7 - - 0 7 0 (100) (0) (100) (0)
The Netherlands 0 775 13 0 719 69 (0) (98.35) (1.65) (0) (91.24) (8.76)
Portugal 10 109 5 10 102 12 (8.06) (87.91) (4.03) (8.06) (82.26) (9.68)
Romania 0 2 0 0 2 0 (0) (100) (0) (0) (100) (0)
Russian Federation 263 440 6 52 632 25 (37.09) (62.06) (0.85) (7.33) (89.14) (3.53)
Serbia 11 44 0 11 41 3 (20.00) (80.00) (0) (20.00) (74.55) (5.45)
Slovak Republic 0 99 2 0 94 7 (0) (98.02) (1.98) (0) (93.07) (6.93)
Slovenia 14 20 1 15 19 1 (40.00) (57.14) (2.86) (42.86) (54.28) (2.86)
Spain 153 599 28 73 655 52 (19.62) (76.79) (3.59) (9.36) (83.97) (6.67)
Sweden 0 374 23 0 360 37 (0) (94.21) (5.79) (0) (90.68) (9.32)
Switzerland 71 357 23 25 363 63 (15.74) (79.16) (5.10) (5.54) (80.49) (13.97)
Turkey 0 6 0 0 6 0 (0) (100) (0) (0) (100) (0)
Ukraine 15 - - 0 15 0 (100) (0) (100) (0)
United Kingdom 0 4977 386 0 5030 333 (0) (92.80) (7.20) (0) (93.79) (6.21)

ECFSPR European Cystic Fibrosis Society Patient Registry
Annual data report (year 2015) version 1.2017
67
6. Nutrition
Pancreatic insufficiency is usually defined as absence of pancreatic enzymes in two stool samples (or
elevated levels of fat in stools). Since information on both was rarely collected by the national registries,
we therefore applied the information on the use of pancreatic enzymes as an indicator of pancreatic
insufficiency.
We collected weight and height measured on the date the best FEV1 value was recorded and, for patients
that did not perform spirometry, the last measurements of the year were considered. From these raw
values we calculated body mass index (BMI). A patient with a low weight is not necessarily underweight if
the height is also low, and BMI may better illustrate the nutritional status; BMI describes the weight/height
relationship and is considered a good measure of nutritional status. The ECFS Standards of Care guidelines
recommend: for adults, a BMI of above 20 kg/m2; for older children and adolescents, the 50th percentile
for BMI; for infants and children up to 2 years of age, weight and height percentiles similar to those for the
non-CF population.2
Weight, height and BMI were then expressed in terms of so-called z-scores by using a reference population
of healthy individuals (in this case the US population with reference values issued by the Centre for Disease
Control, USA, see Appendix 1, page 118, for details).
A z-score of 0 means that the height/weight/BMI is equal to the mean height/weight/BMI of people of the
same age and sex of the reference population. A z-score of -2 means that the height/weight/BMI value is
2 standard deviations below the mean height/weight/BMI of people of the same age and sex of the
reference population; a z-score of +2 means that the value is 2 standard deviations above that mean. In
the reference population, 95% of all individuals have a z-score for weight between -2 and +2 (the same for
height) and it is expected that the same happens for approximately 95% of individuals of a population
without conditions that affect weight (or height). The average z-score for a largely healthy population
should be very close to zero.
2 A.R. Smyth et al, JCF 2014;13, S23–S42

ECFSPR European Cystic Fibrosis Society Patient Registry
Annual data report (year 2015) version 1.2017
68
Figure 6.1 Use of pancreatic enzymes in 2015 for all patients, by country and overall.
Note: For Germany and Serbia the information on use of pancreatic enzymes is missing for more than 10% of the
patients.
This graph shows the use of pancreatic enzymes by country. This can be seen as an informed estimate of
pancreatic insufficiency.
0 10 20 30 40 50 60 70 80 90 100
Total
ITIL
ESTRLTPTFRGRDERSUKSENLSKIE
CHCZLULVATHURU
SIRO
MDMKDKBGUA
%
Yes Missing/Unknown No

ECFSPR European Cystic Fibrosis Society Patient Registry
Annual data report (year 2015) version 1.2017
69
Table 6.1 Number of patients for whom height and weight measurements were available.
All patients seen in 2015.
Country Number of patients
Height Weight
N N miss N N miss
Austria 704 670 34 671 33
Bulgaria 134 109 25 108 26
Czech Republic 571 565 6 565 6
Denmark 467 458 9 458 9
France 6553 6384 169 6374 179
Germany 5363 5238 125 5133 230
Greece 561 514 47 514 47
Hungary 558 525 33 525 33
Ireland 1060 855 205 776 284
Israel 550 528 22 532 18
Italy 5206 4082 1124 4082 1124
Latvia 37 23 14 23 14
Lithuania 14 11 3 11 3
Luxembourg 26 23 3 23 3
Rep of Macedonia 105 105 0 105 0
Rep of Moldova 45 45 0 45 0
The Netherlands 1367 1364 3 1356 11
Portugal 300 257 43 257 43
Romania 44 44 0 44 0
Russian Federation 2875 2634 241 2656 219
Serbia 180 148 32 150 30
Slovak Republic 213 177 36 177 36
Slovenia 94 91 3 90 4
Spain 1772 1582 190 1586 186
Sweden 645 640 5 638 7
Switzerland 852 807 45 807 45
Turkey 93 35 58 35 58
Ukraine 122 121 1 121 1
United Kingdom 9587 9373 214 9475 112

ECFSPR European Cystic Fibrosis Society Patient Registry
Annual data report (year 2015) version 1.2017
70
Table 6.2 Z-scores for height: descriptive statistics by country. Patients aged 17 years or
younger.
Country N Mean Min 25th pctl
(25% of the patients are below this z-
score for height)
Median
(50% of the patients are below this z-
score for height)
75th pctl
(75% of the patients are below this z-
score for height)
Max
Austria 352 -0.1 -3.2 -0.7 -0.1 0.6 3.6
Bulgaria 58 -0.7 -3.8 -1.5 -0.7 0.0 2.5
Czech Republic 329 0.1 -5.8 -0.6 0.0 0.8 4.9
Denmark 191 0.0 -2.4 -0.6 0.0 0.7 2.9
France 3042 -0.5 -5.9 -1.1 -0.5 0.2 5.4
Germany 2372 -0.2 -9.1 -1.0 -0.2 0.5 8.1
Greece 277 -0.2 -4.2 -1.0 -0.2 0.5 2.8
Hungary 316 0.0 -3.9 -0.8 0.0 0.8 5.2
Ireland 370 -0.3 -3.6 -0.9 -0.2 0.4 2.2
Israel 230 -0.5 -3.5 -1.2 -0.5 0.2 2.9
Italy 1553 -0.3 -4.9 -0.9 -0.3 0.4 3.5
Latvia 17 0.4 -1.4 -0.3 0.6 0.9 1.9
Luxembourg <10 0.0 -2.7 -0.8 -0.3 1.0 2.5
Rep of Macedonia 77 -0.6 -4.2 -1.5 -0.7 0.5 2.8
Rep of Moldova 38 -1.0 -4.5 -1.9 -1.0 0.0 2.4
The Netherlands 601 0.2 -3.9 -0.4 0.3 0.9 3.3
Portugal 150 -0.7 -3.8 -1.3 -0.7 0.0 2.4
Romania 44 -0.5 -4.0 -1.5 -0.6 0.9 2.1
Russian Federation 2042 -0.5 -9.1 -1.3 -0.4 0.4 10.0
Serbia 107 -0.3 -3.6 -1.1 -0.3 0.5 2.6
Slovak Republic 82 0.3 -2.2 -0.5 0.2 1.3 2.4
Slovenia 57 0.1 -2.3 -0.6 -0.1 0.8 3.4
Spain 907 -0.3 -4.4 -1.0 -0.3 0.4 5.2
Sweden 253 -0.1 -3.5 -0.6 0.0 0.5 3.1
Switzerland 385 -0.3 -3.9 -0.9 -0.3 0.4 2.9
Turkey 30 -0.7 -3.4 -1.6 -0.7 0.0 1.7
Ukraine 107 -0.4 -2.9 -1.2 -0.4 0.3 2.6
United Kingdom 4248 -0.4 -7.6 -1.2 -0.4 0.3 5.1
Note: Lithuania has 0% coverage for children.
This table reports the median z-score for height (the value that separates the highest and lowest half of
the patients), the mean z-score for height (the average) and other descriptive statistics for children (17
years or younger).

ECFSPR European Cystic Fibrosis Society Patient Registry
Annual data report (year 2015) version 1.2017
71
Table 6.3 Z-scores for height: descriptive statistics by country. Patients aged 18 years or older.
Country N Mean Min 25th pctl
(25% of the patients are below this
z-score for height)
Median
(50% of the patients are below this
z-score for height)
75th pctl
(75% of the patients are below this
z-score for height)
Max
Austria 318 -0.2 -3.4 -0.8 -0.3 0.3 2.8
Bulgaria 51 -0.6 -2.6 -1.0 -0.5 -0.1 1.5
Czech Republic 236 -0.1 -3.2 -0.7 -0.1 0.6 3.1
Denmark 267 0.1 -3.4 -0.5 0.1 0.9 3.2
France 3342 -0.5 -5.7 -1.1 -0.5 0.1 3.0
Germany 2866 -0.1 -4.0 -0.8 -0.1 0.6 3.6
Greece 237 -0.6 -3.6 -1.1 -0.5 0.1 2.0
Hungary 209 -0.2 -3.4 -0.8 -0.1 0.6 2.6
Ireland 485 -0.4 -4.9 -1.0 -0.4 0.3 2.1
Israel 298 -0.6 -4.3 -1.4 -0.7 0.1 1.6
Italy 2529 -0.5 -4.4 -1.2 -0.5 0.2 3.7
Latvia <10 0.0 -1.3 -0.7 -0.2 0.9 1.4
Lithuania 11 0.9 -0.7 0.4 0.9 1.4 2.4
Luxembourg 14 -0.1 -2.6 -0.8 0.1 0.3 2.3
Rep of Macedonia 28 -0.5 -2.6 -1.1 -0.8 0.1 2.4
Rep of Moldova <10 -0.2 -2.6 -1.0 -0.3 1.0 1.7
The Netherlands 763 0.3 -3.4 -0.4 0.4 1.0 4.0
Portugal 107 -0.8 -3.3 -1.4 -1.0 -0.1 2.0
Russian Federation 592 -0.4 -9.5 -1.1 -0.4 0.4 3.4
Serbia 41 0.0 -1.5 -0.7 -0.1 0.4 2.4
Slovak Republic 95 0.1 -3.7 -0.4 0.1 0.9 2.4
Slovenia 34 -0.1 -1.7 -0.7 0.0 0.4 2.4
Spain 675 -0.7 -3.8 -1.3 -0.7 -0.1 2.1
Sweden 387 0.1 -2.8 -0.6 0.2 0.7 3.3
Switzerland 422 -0.2 -3.7 -0.8 -0.2 0.4 2.6
Turkey <10 -0.3 -1.0 -1.0 -0.7 0.2 0.7
Ukraine 14 -0.6 -2.8 -1.2 -0.6 0.0 0.7
United Kingdom 5125 -0.4 -6.0 -1.0 -0.4 0.3 5.1
Note: Romania has 0% coverage for adults.
This table reports the median z-score for height (the value that separates the highest and lowest half of
the patients), the mean z-score for height (the average) and other descriptive statistics for adults (18 years
or older).

ECFSPR European Cystic Fibrosis Society Patient Registry
Annual data report (year 2015) version 1.2017
72
Figure 6.2 Median z-scores for height by age group and by country. All patients seen in 2015.
Note: We excluded from the analyses those age groups where the number of patients was <10.
This graph shows the median z-scores for height by age group. Each country is represented by a dot (in
blue) and the overall median estimate is in red. The overall median z-scores for height tend to slowly
decrease up to the teenage years and then rise again before levelling out. The graph also shows that there
is large variability between countries.
Table 6.4 Z-scores for height: descriptive statistics by age group. All patients seen in 2015.
Age at height measurement
N Mean
Min 25th pctl
Median
75th pctl
Max
0-4 4337 -0.3 -9.1 -1.1 -0.3 0.5 10.0
5-9 5569 -0.2 -8.4 -0.9 -0.2 0.5 8.1
10-14 5204 -0.4 -6.4 -1.1 -0.4 0.3 5.2
15-19 5086 -0.4 -6.0 -1.1 -0.4 0.3 3.3
20-24 4558 -0.4 -4.6 -1.1 -0.4 0.3 5.1
25-29 3987 -0.4 -9.5 -1.0 -0.4 0.3 3.6
30-34 2936 -0.3 -5.7 -1.0 -0.4 0.4 3.1
35-39 2117 -0.2 -3.7 -1.0 -0.3 0.4 3.3
40-44 1470 -0.3 -3.7 -1.0 -0.3 0.4 2.7
45+ 2144 -0.3 -4.9 -1.0 -0.3 0.4 3.3
This table reports the median z-score for height and other descriptive statistics by age group for all the
patients seen in 2015. The median values reported in this table are shown as red dots in fig 6.2.
-1.5
-1.0
-0.5
0.0
0.5
1.0
0-4 5-9 10-14 15-19 20-24 25-29 30-34 35-39 40-44 45+
z-score
age

ECFSPR European Cystic Fibrosis Society Patient Registry
Annual data report (year 2015) version 1.2017
73
Figure 6.3 Quartiles of z-scores for height by age group and by country. All patients seen in 2015.
The figures below show the z-scores for height by country. The dot is the median and the whiskers show
the 25th and 75th percentiles. In blue are the quartiles for the country, in red are the pooled quartiles
computed on all other countries (i.e. excluding that country). We did not compute quartiles where the
number of patients in the age group is <10, therefore there are no blue dots for those age groups (the
number of patients in each age group is shown underneath the horizontal axis). We therefore excluded
Latvia, Lithuania and Luxembourg from the graphs because none of the age groups in these countries had
more than 10 patients.
Quartiles of z-scores for height: Austria Quartiles of z-scores for height: Bulgaria
Quartiles of z-scores for height: Czech Republic Quartiles of z-scores for height: Denmark
Quartiles of z-scores for height: France Quartiles of z-scores for height: Germany
Quartiles of z-scores for height: Greece Quartiles of z-scores for height: Hungary
-2.5
-2.0
-1.5
-1.0
-0.5
0.0
0.5
1.0
1.5
2.0
age
n
0-4
75
5-9
107
10-14
100
15-19
114
20-24
89
25-29
72
30-34
49
35-39
28
40-44
14
45+
22
z-score
-2.5
-2.0
-1.5
-1.0
-0.5
0.0
0.5
1.0
1.5
2.0
age
n
0-4
7
5-9
17
10-14
18
15-19
21
20-24
17
25-29
15
30-34
7
35-39
4
40-44
2
45+
1
z-score
-2.5
-2.0
-1.5
-1.0
-0.5
0.0
0.5
1.0
1.5
2.0
age
n
0-4
82
5-9
98
10-14
82
15-19
101
20-24
72
25-29
52
30-34
34
35-39
26
40-44
11
45+
7
z-score
-2.5
-2.0
-1.5
-1.0
-0.5
0.0
0.5
1.0
1.5
2.0
age
n
0-4
39
5-9
57
10-14
58
15-19
61
20-24
59
25-29
55
30-34
30
35-39
38
40-44
31
45+
30
z-score
-2.5
-2.0
-1.5
-1.0
-0.5
0.0
0.5
1.0
1.5
2.0
age
n
0-4
711
5-9
898
10-14
886
15-19
868
20-24
763
25-29
731
30-34
534
35-39
374
40-44
255
45+
364
z-score
-2.5
-2.0
-1.5
-1.0
-0.5
0.0
0.5
1.0
1.5
2.0
age
n
0-4
514
5-9
697
10-14
684
15-19
759
20-24
646
25-29
624
30-34
464
35-39
302
40-44
214
45+
334
z-score
-2.5
-2.0
-1.5
-1.0
-0.5
0.0
0.5
1.0
1.5
2.0
age
n0-4
605-9
8710-14
8715-19
8120-24
7225-29
4530-34
3435-39
2640-44
1145+
11
z-score
-2.5
-2.0
-1.5
-1.0
-0.5
0.0
0.5
1.0
1.5
2.0
age
n
0-4
69
5-9
75
10-14
119
15-19
83
20-24
69
25-29
48
30-34
24
35-39
21
40-44
9
45+
8
z-score
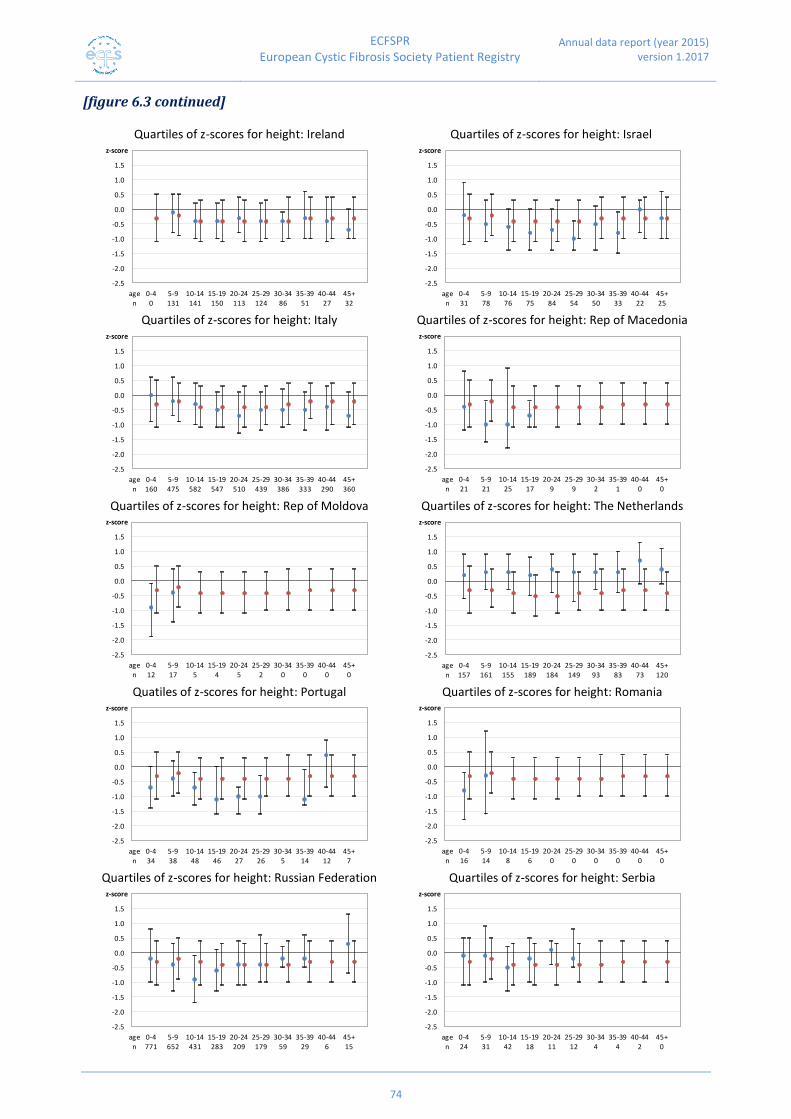
ECFSPR European Cystic Fibrosis Society Patient Registry
Annual data report (year 2015) version 1.2017
74
[figure 6.3 continued]
Quartiles of z-scores for height: Ireland Quartiles of z-scores for height: Israel
Quartiles of z-scores for height: Italy Quartiles of z-scores for height: Rep of Macedonia
Quartiles of z-scores for height: Rep of Moldova Quartiles of z-scores for height: The Netherlands
Quatiles of z-scores for height: Portugal Quartiles of z-scores for height: Romania
Quartiles of z-scores for height: Russian Federation Quartiles of z-scores for height: Serbia
-2.5
-2.0
-1.5
-1.0
-0.5
0.0
0.5
1.0
1.5
2.0
age
n
0-4
0
5-9
131
10-14
141
15-19
150
20-24
113
25-29
124
30-34
86
35-39
51
40-44
27
45+
32
z-score
-2.5
-2.0
-1.5
-1.0
-0.5
0.0
0.5
1.0
1.5
2.0
age
n
0-4
31
5-9
78
10-14
76
15-19
75
20-24
84
25-29
54
30-34
50
35-39
33
40-44
22
45+
25
z-score
-2.5
-2.0
-1.5
-1.0
-0.5
0.0
0.5
1.0
1.5
2.0
age
n
0-4
160
5-9
475
10-14
582
15-19
547
20-24
510
25-29
439
30-34
386
35-39
333
40-44
290
45+
360
z-score
-2.5
-2.0
-1.5
-1.0
-0.5
0.0
0.5
1.0
1.5
2.0
agen
0-421
5-921
10-1425
15-1917
20-249
25-299
30-342
35-391
40-440
45+0
z-score
-2.5
-2.0
-1.5
-1.0
-0.5
0.0
0.5
1.0
1.5
2.0
agen
0-412
5-917
10-145
15-194
20-245
25-292
30-340
35-390
40-440
45+0
z-score
-2.5
-2.0
-1.5
-1.0
-0.5
0.0
0.5
1.0
1.5
2.0
age
n
0-4
157
5-9
161
10-14
155
15-19
189
20-24
184
25-29
149
30-34
93
35-39
83
40-44
73
45+
120
z-score
-2.5
-2.0
-1.5
-1.0
-0.5
0.0
0.5
1.0
1.5
2.0
age
n
0-4
34
5-9
38
10-14
48
15-19
46
20-24
27
25-29
26
30-34
5
35-39
14
40-44
12
45+
7
z-score
-2.5
-2.0
-1.5
-1.0
-0.5
0.0
0.5
1.0
1.5
2.0
agen
0-416
5-914
10-148
15-196
20-240
25-290
30-340
35-390
40-440
45+0
z-score
-2.5
-2.0
-1.5
-1.0
-0.5
0.0
0.5
1.0
1.5
2.0
age
n
0-4
771
5-9
652
10-14
431
15-19
283
20-24
209
25-29
179
30-34
59
35-39
29
40-44
6
45+
15
z-score
-2.5
-2.0
-1.5
-1.0
-0.5
0.0
0.5
1.0
1.5
2.0
age
n
0-4
24
5-9
31
10-14
42
15-19
18
20-24
11
25-29
12
30-34
4
35-39
4
40-44
2
45+
0
z-score

ECFSPR European Cystic Fibrosis Society Patient Registry
Annual data report (year 2015) version 1.2017
75
[figure 6.3 continued]
Quartiles of z-scores for height: Slovak Republic Quartiles of z-scores for height: Slovenia
Quartiles of z-scores for height: Spain Quartiles of z-scores for height: Sweden
Quartiles of z-scores for height: Switzerland Quartiles of z-scores for height: Turkey
Quartiles of z-scores for height: Ukraine Quartiles of z-scores for height: United Kingdom
-2.5
-2.0
-1.5
-1.0
-0.5
0.0
0.5
1.0
1.5
2.0
agen
0-411
5-923
10-1426
15-1927
20-2428
25-2918
30-3419
35-3911
40-446
45+8
z-score
-2.5
-2.0
-1.5
-1.0
-0.5
0.0
0.5
1.0
1.5
2.0
agen
0-49
5-919
10-1417
15-1919
20-2413
25-294
30-342
35-394
40-441
45+3
z-score
-2.5
-2.0
-1.5
-1.0
-0.5
0.0
0.5
1.0
1.5
2.0
age
n
0-4
239
5-9
279
10-14
248
15-19
224
20-24
158
25-29
115
30-34
107
35-39
97
40-44
50
45+
65
z-score
-2.5
-2.0
-1.5
-1.0
-0.5
0.0
0.5
1.0
1.5
2.0
age
n
0-4
52
5-9
86
10-14
76
15-19
68
20-24
85
25-29
61
30-34
66
35-39
40
40-44
46
45+
60
z-score
-2.5
-2.0
-1.5
-1.0
-0.5
0.0
0.5
1.0
1.5
2.0
age
n
0-4
117
5-9
111
10-14
99
15-19
100
20-24
115
25-29
73
30-34
61
35-39
55
40-44
29
45+
47
z-score
-2.5
-2.0
-1.5
-1.0
-0.5
0.0
0.5
1.0
1.5
2.0
age
n
0-4
0
5-9
17
10-14
10
15-19
6
20-24
1
25-29
1
30-34
0
35-39
0
40-44
0
45+
0
z-score
-2.5
-2.0
-1.5
-1.0
-0.5
0.0
0.5
1.0
1.5
2.0
agen
0-432
5-925
10-1438
15-1918
20-245
25-292
30-341
35-390
40-440
45+0
z-score
-2.5
-2.0
-1.5
-1.0
-0.5
0.0
0.5
1.0
1.5
2.0
age
n
0-4
1092
5-9
1345
10-14
1136
15-19
1188
20-24
1206
25-29
1069
30-34
813
35-39
541
40-44
359
45+
624
z-score

ECFSPR European Cystic Fibrosis Society Patient Registry
Annual data report (year 2015) version 1.2017
76
Table 6.5 Z-scores for weight: descriptive statistics by country. Patients aged 17 years or
younger.
Country N Mean Min 25th pctl
(25% of the patients are below this z-score for
weight)
Median
(50% of the patients are below this z-score for
weight)
75th pctl
(75% of the patients are below this z-score for
weight)
Max
Austria 352 -0.4 -4.2 -1.1 -0.3 0.4 2.4
Bulgaria 57 -1.3 -6.2 -2.1 -1.2 -0.4 1.2
Czech Republic 329 -0.2 -5.8 -0.8 -0.1 0.6 7.4
Denmark 191 -0.3 -3.4 -0.8 -0.3 0.3 2.4
France 3046 -0.6 -5.5 -1.3 -0.6 0.1 3.8
Germany 2364 -0.5 -6.7 -1.1 -0.4 0.2 2.6
Greece 277 -0.1 -4.6 -0.8 0.0 0.7 2.7
Hungary 316 -0.6 -9.1 -1.4 -0.4 0.3 6.1
Ireland 359 -0.2 -4.5 -0.7 -0.1 0.6 2.5
Israel 234 -0.5 -4.9 -1.2 -0.4 0.3 2.7
Italy 1552 -0.3 -4.9 -1.0 -0.2 0.5 2.9
Latvia 17 -0.5 -1.9 -1.3 -0.3 0.1 1.1
Luxembourg <10 -0.8 -5.1 -1.0 -0.6 0.2 1.2
Rep of Macedonia 77 -0.4 -4.8 -1.4 -0.4 0.7 2.6
Rep of Moldova 38 -1.0 -4.7 -2.1 -0.5 0.2 1.5
The Netherlands 599 -0.1 -5.9 -0.6 0.0 0.5 2.6
Portugal 150 -0.8 -8.7 -1.4 -0.7 0.1 1.9
Romania 44 -0.8 -3.5 -1.6 -0.8 0.2 1.8
Russian Federation 2065 -0.9 -9.9 -1.7 -0.8 0.0 7.5
Serbia 109 -0.6 -6.7 -1.5 -0.5 0.2 2.4
Slovak Republic 82 -0.2 -2.9 -0.8 -0.2 0.4 2.1
Slovenia 56 -0.4 -3.6 -1.2 -0.4 0.4 2.0
Spain 910 -0.4 -4.8 -1.0 -0.4 0.3 2.5
Sweden 253 -0.2 -2.9 -0.7 -0.1 0.5 1.9
Switzerland 385 -0.4 -4.3 -1.0 -0.4 0.2 3.2
Turkey 30 -0.8 -4.6 -1.5 -0.7 0.3 1.7
Ukraine 107 -1.0 -4.4 -1.8 -1.0 -0.3 4.8
United Kingdom 4294 -0.3 -7.9 -0.9 -0.2 0.5 6.3
Note: Lithuania has 0% coverage for children.
This table reports the median z-score for weight (the value that separates the highest and lowest half of
the patients), the mean z-score for weight (the average) and other descriptive statistics for children (17
years or younger).

ECFSPR European Cystic Fibrosis Society Patient Registry
Annual data report (year 2015) version 1.2017
77
Table 6.6 Z-scores for weight: descriptive statistics by country. Patients aged 18 years or older.
Country N Mean Min 25th pctl
(25% of the patients are below this z-score for
weight)
Median
(50% of the patients are below this z-score for
weight)
75th pctl
(75% of the patients are below this z-score for
weight)
Max
Austria 319 -0.6 -6.1 -1.2 -0.5 0.2 2.3
Bulgaria 51 -1.3 -5.4 -1.9 -1.2 -0.5 2.3
Czech Republic 236 -0.6 -6.3 -1.3 -0.6 0.2 2.0
Denmark 267 -0.2 -4.4 -0.9 -0.1 0.6 2.2
France 3328 -0.8 -7.2 -1.5 -0.7 -0.1 2.9
Germany 2769 -0.5 -5.6 -1.1 -0.4 0.3 3.1
Greece 237 -0.5 -5.4 -1.2 -0.4 0.3 2.1
Hungary 209 -1.0 -7.0 -1.9 -0.9 -0.1 1.7
Ireland 417 -0.4 -5.0 -0.9 -0.3 0.3 2.2
Israel 298 -0.5 -4.0 -1.2 -0.4 0.4 2.3
Italy 2530 -0.5 -7.4 -1.2 -0.5 0.2 3.1
Latvia <10 -1.2 -2.5 -1.7 -1.5 0.0 0.1
Lithuania 11 -0.4 -3.0 -0.7 -0.1 0.0 1.2
Luxembourg 14 -0.3 -1.9 -1.1 -0.5 0.2 1.9
Rep of Macedonia 28 -0.7 -2.5 -1.4 -0.7 0.2 1.6
Rep of Moldova <10 -1.5 -3.5 -3.0 -1.4 0.2 0.5
The Netherlands 757 -0.1 -5.0 -0.6 0.0 0.5 2.5
Portugal 107 -0.7 -4.5 -1.3 -0.6 0.1 2.3
Russian Federation 591 -1.4 -7.3 -2.2 -1.3 -0.4 2.4
Serbia 41 -1.0 -4.2 -1.3 -0.9 -0.2 1.1
Slovak Republic 95 -0.5 -4.4 -1.2 -0.2 0.4 2.1
Slovenia 34 -0.8 -2.5 -1.6 -1.0 0.1 1.3
Spain 676 -0.5 -4.2 -1.2 -0.5 0.2 2.4
Sweden 385 -0.1 -4.6 -0.6 0.0 0.6 2.9
Switzerland 422 -0.6 -5.4 -1.2 -0.5 0.1 2.0
Turkey <10 -0.9 -3.9 -1.1 -0.1 0.0 0.8
Ukraine 14 -1.6 -4.1 -2.1 -1.3 -0.8 0.1
United Kingdom 5181 -0.2 -9.9 -0.9 -0.2 0.6 3.7
Note: Romania has 0% coverage for adults.
This table reports the median z-score for weight (the value that separates the highest and lowest half of
the patients), the mean z-score for weight (the average) and other descriptive statistics for adults (18 years
or older).

ECFSPR European Cystic Fibrosis Society Patient Registry
Annual data report (year 2015) version 1.2017
78
Figure 6.4 Median z-scores for weight by age group and by country. All patients seen in 2015.
Note: We excluded from the analyses those age groups where the number of patients was <10.
This graph shows the median z-scores for weight by age group. Each country is represented by a dot (in
blue) and the overall estimate is in red. Overall, the median z-scores for weight decrease from the third
youngest age group to the 20-24 years age group before they increase in the older age groups. Again, the
patients in the oldest age groups are patients that survived, and may therefore represent the patients with
less disease severity. There is considerable variability between countries.
Table 6.7 Z-scores for weight: descriptive statistics by age group. All patients seen in 2015.
Age at weight measurement
N Mean Min 25th pctl
Median 75th pctl Max
0-4 4389 -0.4 -9.4 -1.2 -0.3 0.4 7.5
5-9 5573 -0.3 -6.2 -0.9 -0.3 0.4 3.0
10-14 5212 -0.5 -9.9 -1.2 -0.5 0.3 2.7
15-19 5069 -0.7 -9.1 -1.4 -0.6 0.1 2.8
20-24 4540 -0.8 -9.6 -1.5 -0.7 0.0 3.1
25-29 3957 -0.6 -7.2 -1.2 -0.5 0.2 3.3
30-34 2914 -0.5 -9.9 -1.2 -0.4 0.3 2.9
35-39 2096 -0.3 -7.4 -1.0 -0.3 0.4 3.7
40-44 1453 -0.2 -5.0 -0.9 -0.1 0.6 3.1
45+ 2134 0.0 -5.0 -0.6 0.1 0.8 2.9
This table reports the median z-score for weight and other descriptive statistics by age group for all the
patients seen in 2015. The median values reported in this table are shown as red dots in fig 6.4.
-2.0
-1.5
-1.0
-0.5
0.0
0.5
1.0
0-4 5-9 10-14 15-19 20-24 25-29 30-34 35-39 40-44 45+
z-score
age

ECFSPR European Cystic Fibrosis Society Patient Registry
Annual data report (year 2015) version 1.2017
79
Figure 6.5 Quartiles of z-scores for weight by age group and by country. All patients seen in 2015.
The figures below show the z-scores for weight by country. The dot is the median, and the whiskers show
the 25th and 75th percentiles. In blue are the quartiles for the country, in red are the pooled quartiles
computed on all other countries (i.e. excluding that country). We did not compute quartiles where the
number of patients in the age group is <10. Therefore, there are no blue dots for those age groups (the
number of patients in each age group is shown underneath the horizontal axis). We therefore excluded
Latvia, Lithuania and Luxembourg from the graphs because none of the age groups in these countries had
more than 10 patients.
Quartiles of z-scores for weight: Austria Quartiles of z-scores for weight: Bulgaria
Quartiles of z-scores for weight: Czech Republic Quartiles of z-scores for weight: Denmark
Quartiles of z-scores for weight: France Quartiles of z-scores for weight: Germany
Quartiles of z-scores for weight: Greece Quartiles of z-scores for weight: Hungary
-3.0
-2.5
-2.0
-1.5
-1.0
-0.5
0.0
0.5
1.0
1.5
agen
0-475
5-9107
10-14100
15-19114
20-2489
25-2972
30-3450
35-3928
40-4414
45+22
z-score
-3.0
-2.5
-2.0
-1.5
-1.0
-0.5
0.0
0.5
1.0
1.5
agen
0-47
5-917
10-1418
15-1920
20-2417
25-2915
30-347
35-394
40-442
45+1
z-score
-3.0
-2.5
-2.0
-1.5
-1.0
-0.5
0.0
0.5
1.0
1.5
agen
0-482
5-998
10-1482
15-19101
20-2472
25-2952
30-3434
35-3926
40-4411
45+7
z-score
-3.0
-2.5
-2.0
-1.5
-1.0
-0.5
0.0
0.5
1.0
1.5
agen
0-439
5-957
10-1458
15-1961
20-2459
25-2955
30-3430
35-3938
40-4431
45+30
z-score
-3.0
-2.5
-2.0
-1.5
-1.0
-0.5
0.0
0.5
1.0
1.5
agen
0-4713
5-9898
10-14888
15-19867
20-24762
25-29728
30-34529
35-39371
40-44255
45+363
z-score
-3.0
-2.5
-2.0
-1.5
-1.0
-0.5
0.0
0.5
1.0
1.5
agen
0-4514
5-9692
10-14682
15-19755
20-24626
25-29602
30-34444
35-39293
40-44203
45+322
z-score
-3.0
-2.5
-2.0
-1.5
-1.0
-0.5
0.0
0.5
1.0
1.5
age
n0-4
605-9
8710-14
8715-19
8120-24
7225-29
4530-34
3435-39
2640-44
1145+
11
z-score
-3.0
-2.5
-2.0
-1.5
-1.0
-0.5
0.0
0.5
1.0
1.5
age
n
0-4
69
5-9
75
10-14
119
15-19
83
20-24
69
25-29
48
30-34
24
35-39
21
40-44
9
45+
8
z-score

ECFSPR European Cystic Fibrosis Society Patient Registry
Annual data report (year 2015) version 1.2017
80
[figure 6.5 continued]
Quartiles of z-scores for weight: Ireland Quartiles of z-scores for weight: Israel
Quartiles of z-scores for weight: Italy Quartiles of z-scores for weight: Rep of Macedonia
Quartiles of z-scores for weight: Rep of Moldova Quartiles of z-scores for weight: The Netherlands
Quartiles of z-scores for weight: Portugal Quartiles of z-scores for weight: Romania
Quartiles of z-scores for weight: Russian Federation Quartiles of z-scores for weight: Serbia
-3.0
-2.5
-2.0
-1.5
-1.0
-0.5
0.0
0.5
1.0
1.5
agen
0-40
5-9128
10-14136
15-19142
20-2496
25-29112
30-3475
35-3938
40-4423
45+26
z-score
-3.0
-2.5
-2.0
-1.5
-1.0
-0.5
0.0
0.5
1.0
1.5
agen
0-435
5-978
10-1476
15-1975
20-2484
25-2954
30-3450
35-3933
40-4422
45+25
z-score
-3.0
-2.5
-2.0
-1.5
-1.0
-0.5
0.0
0.5
1.0
1.5
agen
0-4160
5-9475
10-14582
15-19546
20-24511
25-29439
30-34386
35-39333
40-44290
45+360
z-score
-3.0
-2.5
-2.0
-1.5
-1.0
-0.5
0.0
0.5
1.0
1.5
age
n0-4
215-9
2110-14
2515-19
1720-24
925-29
930-34
235-39
140-44
045+
0
z-score
-3.0
-2.5
-2.0
-1.5
-1.0
-0.5
0.0
0.5
1.0
1.5
age
n0-4
125-9
1710-14
515-19
420-24
525-29
230-34
035-39
040-44
045+
0
z-score
-3.0
-2.5
-2.0
-1.5
-1.0
-0.5
0.0
0.5
1.0
1.5
agen
0-4157
5-9161
10-14155
15-19185
20-24184
25-29148
30-3493
35-3982
40-4472
45+119
z-score
-3.0
-2.5
-2.0
-1.5
-1.0
-0.5
0.0
0.5
1.0
1.5
agen
0-434
5-938
10-1448
15-1946
20-2427
25-2926
30-345
35-3914
40-4412
45+7
z-score
-3.0
-2.5
-2.0
-1.5
-1.0
-0.5
0.0
0.5
1.0
1.5
agen
0-416
5-914
10-148
15-196
20-240
25-290
30-340
35-390
40-440
45+0
z-score
-3.0
-2.5
-2.0
-1.5
-1.0
-0.5
0.0
0.5
1.0
1.5
agen
0-4787
5-9654
10-14437
15-19281
20-24210
25-29178
30-3459
35-3929
40-446
45+15
z-score
-3.0
-2.5
-2.0
-1.5
-1.0
-0.5
0.0
0.5
1.0
1.5
agen
0-426
5-931
10-1442
15-1918
20-2411
25-2912
30-344
35-394
40-442
45+0
z-score

ECFSPR European Cystic Fibrosis Society Patient Registry
Annual data report (year 2015) version 1.2017
81
[figure 6.5 continued]
Quartiles of z-scores for weight: Slovak Republic Quartiles of z-scores for weight: Slovenia
Quartiles of z-scores for weight: Spain Quartiles of z-scores for weight: Sweden
Quartiles of z-scores for weight: Switzerland Quartiles of z-scores for weight: Turkey
Quartiles of z-scores for weight: Ukraine Quartiles of z-scores for weight: United Kingdom
-3.0
-2.5
-2.0
-1.5
-1.0
-0.5
0.0
0.5
1.0
1.5
age
n0-4
115-9
2310-14
2615-19
2720-24
2825-29
1830-34
1935-39
1140-44
645+
8
z-score
-3.0
-2.5
-2.0
-1.5
-1.0
-0.5
0.0
0.5
1.0
1.5
age
n
0-4
9
5-9
19
10-14
17
15-19
18
20-24
13
25-29
4
30-34
2
35-39
4
40-44
1
45+
3
z-score
-3.0
-2.5
-2.0
-1.5
-1.0
-0.5
0.0
0.5
1.0
1.5
agen
0-4240
5-9279
10-14250
15-19225
20-24159
25-29115
30-34107
35-3997
40-4450
45+64
z-score
-3.0
-2.5
-2.0
-1.5
-1.0
-0.5
0.0
0.5
1.0
1.5
agen
0-452
5-986
10-1476
15-1968
20-2485
25-2960
30-3465
35-3940
40-4446
45+60
z-score
-3.0
-2.5
-2.0
-1.5
-1.0
-0.5
0.0
0.5
1.0
1.5
agen
0-4117
5-9111
10-1499
15-19100
20-24115
25-2973
30-3461
35-3955
40-4429
45+47
z-score
-3.0
-2.5
-2.0
-1.5
-1.0
-0.5
0.0
0.5
1.0
1.5
age
n0-4
05-9
1710-14
1015-19
620-24
125-29
130-34
035-39
040-44
045+
0
z-score
-3.0
-2.5
-2.0
-1.5
-1.0
-0.5
0.0
0.5
1.0
1.5
agen
0-432
5-925
10-1438
15-1918
20-245
25-292
30-341
35-390
40-440
45+0
z-score
-3.0
-2.5
-2.0
-1.5
-1.0
-0.5
0.0
0.5
1.0
1.5
agen
0-41119
5-91355
10-141141
15-191192
20-241223
25-291079
30-34827
35-39546
40-44358
45+635
z-score

ECFSPR European Cystic Fibrosis Society Patient Registry
Annual data report (year 2015) version 1.2017
82
Table 6.8 Z-scores for BMI: descriptive statistics by country. All patients seen in 2015 aged
2-17 years.
Country N N Miss Mean Min 25th pctl
(25% of the patients are below this z-score for
BMI)
Median
(50% of the patients are below this z-score for
BMI)
75th pctl
(75% of the patients are below this z-score for
BMI)
Max
Austria 323 0 -0.4 -4.4 -1.1 -0.3 0.3 1.8
Bulgaria 55 1 -1.4 -7.4 -1.9 -1.0 -0.4 1.5
Czech Republic 292 0 -0.3 -4.5 -0.9 -0.1 0.4 2.2
Denmark 181 0 -0.4 -3.8 -0.9 -0.4 0.3 1.9
France 2745 8 -0.4 -6.2 -1.1 -0.4 0.2 2.7
Germany 2183 12 -0.4 -5.1 -1.0 -0.3 0.3 2.6
Greece 258 0 0.2 -4.4 -0.5 0.3 0.9 2.4
Hungary 294 3 -0.9 -8.1 -1.6 -0.7 0.0 2.4
Ireland 359 11 0.0 -3.3 -0.5 0.0 0.6 2.3
Israel 223 1 -0.2 -3.9 -1.0 -0.1 0.6 2.5
Italy 1492 92 -0.1 -5.6 -0.8 -0.1 0.6 2.6
Latvia 17 0 -0.9 -3.2 -1.4 -0.9 0.0 0.4
Luxembourg <10 0 -1.0 -4.3 -1.0 -0.9 -0.4 0.3
Rep of Macedonia 67 0 0.0 -3.3 -0.9 -0.1 0.6 2.6
Rep of Moldova 33 0 -0.6 -4.7 -1.5 -0.3 0.3 1.2
The Netherlands 552 2 -0.2 -3.3 -0.8 -0.2 0.3 2.2
Portugal 134 0 -0.5 -7.2 -1.0 -0.4 0.2 1.9
Romania 39 0 -0.5 -2.5 -1.4 -0.6 0.2 1.6
Russian Federation 1737 18 -0.8 -8.9 -1.6 -0.7 0.1 3.6
Serbia 98 0 -0.5 -3.7 -1.2 -0.3 0.5 2.1
Slovak Republic 78 1 -0.5 -2.6 -1.2 -0.6 0.3 1.7
Slovenia 53 1 -0.6 -3.4 -1.2 -0.5 0.2 1.4
Spain 819 4 -0.2 -4.3 -0.8 -0.2 0.4 2.6
Sweden 239 0 -0.2 -3.8 -0.6 -0.1 0.4 2.0
Switzerland 345 0 -0.3 -4.2 -0.8 -0.2 0.3 2.9
Turkey 30 0 -0.5 -4.7 -1.2 -0.5 0.5 2.0
Ukraine 96 0 -1.1 -4.6 -1.9 -1.1 -0.5 3.7
United Kingdom 3994 43 0.1 -8.7 -0.5 0.1 0.7 4.6
Note: Lithuania has 0% coverage for children.
This table reports the median z-score for BMI, the mean z-score for BMI and other descriptive statistics for
children aged 2 to 17 years, by country.

ECFSPR European Cystic Fibrosis Society Patient Registry
Annual data report (year 2015) version 1.2017
83
Table 6.9 BMI: descriptive statistics by country. All patients seen in 2015 aged 18 years or older.
Country N N Miss Mean Min 25th pctl
(25% of the patients are below this
BMI)
Median
(50% of the patients are below this
BMI)
75th pctl
(75% of the patients are below this
BMI)
Max
Austria 318 1 21.4 14.1 19.1 21.1 23.2 35.5
Bulgaria 51 0 19.7 13.9 17.8 19.4 21.6 38.1
Czech Republic 236 1 20.9 12.3 18.6 20.4 22.7 33.6
Denmark 267 0 21.9 13.8 19.5 21.4 23.9 35.1
France 3322 38 21.1 12.0 18.9 20.7 22.7 47.9
Germany 2762 114 21.4 13.6 19.1 21.0 23.1 46.6
Greece 237 1 22.0 14.7 19.8 21.9 23.7 32.4
Hungary 209 4 20.1 13.1 17.6 19.6 22.0 31.1
Ireland 417 68 22.3 13.8 20.4 22.0 24.1 35.6
Israel 298 0 22.5 14.8 20.0 21.9 24.7 43.0
Italy 2529 123 21.9 12.7 19.7 21.5 23.7 44.1
Latvia <10 1 19.0 16.1 17.5 19.2 20.3 22.0
Lithuania 11 0 20.0 15.3 18.0 20.2 21.8 26.9
Luxembourg 14 0 21.8 19.1 20.2 20.7 22.0 33.5
Rep of Macedonia 28 0 21.2 16.4 19.6 20.6 22.9 25.9
Rep of Moldova <10 0 18.9 15.8 17.0 18.8 19.8 23.8
The Netherlands 757 7 22.0 14.5 20.0 21.5 23.5 39.7
Portugal 107 1 21.9 15.8 19.7 21.3 23.8 35.9
Russian Federation 590 10 19.4 11.8 17.3 19.1 21.2 35.3
Serbia 41 0 19.6 14.8 18.2 19.5 21.1 26.0
Slovak Republic 95 0 21.0 14.8 18.7 20.9 23.2 30.3
Slovenia 34 0 20.3 16.5 18.3 19.9 21.6 27.5
Spain 674 6 22.2 15.1 19.9 21.7 23.7 39.0
Sweden 385 2 22.3 14.5 20.1 21.9 24.1 36.3
Switzerland 422 2 21.3 14.9 19.4 21.2 22.6 36.2
Turkey <10 0 20.8 15.0 19.4 22.1 23.7 23.9
Ukraine 14 0 18.8 14.7 17.7 19.0 20.3 21.8
United Kingdom 5094 140 22.8 13.3 20.2 22.2 24.8 48.9
Note: Romania has 0% coverage for adults.
This table reports the median BMI (expressed as absolute values, not as z-scores), the mean BMI and other
descriptive statistics for patients aged 18 years or older, by country.

ECFSPR European Cystic Fibrosis Society Patient Registry
Annual data report (year 2015) version 1.2017
84
Table 6.10 BMI: descriptive statistics by country. All male patients seen in 2015 aged 18 years
or older.
Country N N Miss Mean Min 25th pctl
(25% of the patients are below this
BMI)
Median
(50% of the patients are below this
BMI)
75th pctl
(75% of the patients are below this
BMI)
Max
Austria 166 0 22.0 14.1 19.5 21.7 23.9 35.5
Bulgaria 23 0 20.6 15.6 17.8 20.5 21.7 38.1
Czech Republic 117 1 21.2 12.7 18.6 20.8 23.1 33.6
Denmark 136 0 22.6 14.8 20.1 22.2 24.8 34.3
France 1748 20 21.4 12.0 19.2 20.9 23.0 40.5
Germany 1479 61 21.8 13.7 19.5 21.5 23.7 46.6
Greece 132 0 22.4 14.7 19.9 22.3 24.6 31.2
Hungary 119 4 20.7 15.5 18.1 20.0 23.0 31.1
Ireland 252 36 22.7 15.8 20.8 22.4 24.4 34.4
Israel 171 0 22.9 15.4 20.5 22.7 25.0 36.8
Italy 1321 74 22.5 14.7 20.4 22.2 24.2 44.1
Latvia <10 1 20.2 18.6 19.2 20.0 21.2 22.0
Lithuania <10 0 21.6 18.0 20.2 21.0 22.3 26.9
Luxembourg <10 0 21.3 19.9 20.4 21.0 22.3 23.0
Rep of Macedonia 17 0 21.7 18.0 19.8 21.8 22.9 25.9
Rep of Moldova <10 0 19.3 17.0 18.0 18.8 19.2 23.8
The Netherlands 409 5 22.3 15.9 20.4 21.9 24.0 32.5
Portugal 57 1 21.4 16.2 19.4 20.9 23.5 29.3
Russian Federation 323 8 19.5 11.8 17.5 19.1 21.3 35.3
Serbia 26 0 20.1 15.0 18.2 20.2 21.8 26.0
Slovak Republic 46 0 21.6 15.7 18.9 21.4 23.8 30.3
Slovenia 14 0 21.7 17.8 19.5 20.6 24.3 27.5
Spain 365 2 22.6 15.1 20.7 22.3 24.2 38.8
Sweden 205 1 23.1 14.9 20.8 22.8 25.1 36.3
Switzerland 235 0 21.7 14.9 19.8 21.7 23.3 32.7
Turkey <10 0 23.0 22.1 22.1 23.0 23.9 23.9
Ukraine <10 0 18.1 14.7 16.1 18.6 19.6 21.4
United Kingdom 2760 81 23.1 13.4 20.7 22.8 25.2 47.4
Note: Romania has 0% coverage for adults.
This table reports the median BMI (expressed as absolute values, not as z-scores), the mean BMI and other
descriptive statistics for male patients aged 18 years or older, by country.

ECFSPR European Cystic Fibrosis Society Patient Registry
Annual data report (year 2015) version 1.2017
85
Table 6.11 BMI: descriptive statistics by country. All female patients seen in 2015 aged 18 years
or older.
Country N N Miss Mean Min 25th pctl
(25% of the patients are below this
BMI)
Median
(50% of the patients are below this
BMI)
75th pctl
(75% of the patients are below this
BMI)
Max
Austria 152 1 20.8 14.5 18.8 20.3 22.3 34.4
Bulgaria 28 0 19.0 13.9 18.0 19.0 19.8 27.7
Czech Republic 119 0 20.6 12.3 18.6 20.0 22.6 32.2
Denmark 131 0 21.1 13.8 19.0 20.5 22.9 35.1
France 1574 18 20.9 14.0 18.7 20.3 22.2 47.9
Germany 1283 53 20.9 13.6 18.8 20.4 22.3 39.2
Greece 105 1 21.5 15.4 19.7 21.3 23.1 32.4
Hungary 90 0 19.2 13.1 17.1 19.3 20.4 28.1
Ireland 165 32 21.7 13.8 20.1 21.4 23.1 35.6
Israel 127 0 22.0 14.8 19.4 21.1 24.3 43.0
Italy 1208 49 21.3 12.7 19.3 20.8 22.8 41.4
Latvia <10 0 16.8 16.1 16.1 16.8 17.5 17.5
Lithuania <10 0 18.0 15.3 15.8 18.3 18.9 21.8
Luxembourg <10 0 22.5 19.1 19.6 20.4 22.0 33.5
Macedonia 11 0 20.5 16.4 18.6 20.4 22.9 24.2
Moldova <10 0 17.8 15.8 15.8 17.8 19.8 19.8
Netherlands 348 2 21.7 14.5 19.7 21.2 22.9 39.7
Portugal 50 0 22.4 15.8 20.5 22.0 23.9 35.9
Russian Federation 267 2 19.2 12.8 17.1 19.0 21.2 34.3
Serbia 15 0 18.8 14.8 17.7 18.5 20.1 23.7
Slovak Republic 49 0 20.4 14.8 18.2 20.8 21.6 26.9
Slovenia 20 0 19.4 16.5 17.8 19.6 20.9 22.0
Spain 309 4 21.6 15.6 19.3 21.0 23.0 39.0
Sweden 180 1 21.4 14.5 19.3 21.2 22.7 34.3
Switzerland 187 2 20.8 15.3 18.8 20.3 22.1 36.2
Turkey <10 0 19.4 15.0 15.0 19.4 23.7 23.7
Ukraine <10 0 19.8 17.7 18.8 20.0 20.7 21.8
United Kingdom 2334 59 22.5 13.3 19.7 21.7 24.1 48.9
Note: Romania has 0% coverage for adults.
This table reports the median BMI (expressed as absolute values, not as z-scores), the mean BMI and other
descriptive statistics for female patients aged 18 years or older, by country.

ECFSPR European Cystic Fibrosis Society Patient Registry
Annual data report (year 2015) version 1.2017
86
Figure 6.6 Quartiles of z-scores for BMI by age group and country. Patients aged 2-17 years in
2015.
The figures below show the z-scores for weight by country. The dot is the median, and the whiskers show
the 25th and 75th percentiles. In blue are the quartiles for the country, in red are the pooled quartiles
computed on all other countries (i.e. excluding that country). We did not compute quartiles where the
number of patients in the age group is <10. Therefore, there are no blue dots for those age groups (the
number of patients in each age group is shown underneath the horizontal axis). We therefore excluded
Latvia, Lithuania and Luxembourg from the graphs because none of the age groups in these countries had
more than 10 patients.
Quartiles of z-scores for BMI: Austria Quartiles of z-scores for BMI: Bulgaria
Quartiles of z-scores for BMI: Czech Republic Quartiles of z-scores for BMI: Denmark
Quartiles of z-scores for BMI: France Quartiles of z-scores for BMI: Germany
Quartiles of z-scores for BMI: Greece Quartiles of z-scores for BMI: Hungary
-3.0
-2.5
-2.0
-1.5
-1.0
-0.5
0.0
0.5
1.0
1.5
age
n
2-7
112
8-11
92
12-17
119
z-score
-3.0
-2.5
-2.0
-1.5
-1.0
-0.5
0.0
0.5
1.0
1.5
age
n
2-7
13
8-11
15
12-17
27
z-score
-3.0
-2.5
-2.0
-1.5
-1.0
-0.5
0.0
0.5
1.0
1.5
age
n
2-7
103
8-11
73
12-17
116
z-score
-3.0
-2.5
-2.0
-1.5
-1.0
-0.5
0.0
0.5
1.0
1.5
age
n
2-7
65
8-11
49
12-17
67
z-score
-3.0
-2.5
-2.0
-1.5
-1.0
-0.5
0.0
0.5
1.0
1.5
age
n
2-7
946
8-11
744
12-17
1055
z-score
-3.0
-2.5
-2.0
-1.5
-1.0
-0.5
0.0
0.5
1.0
1.5
age
n
2-7
734
8-11
561
12-17
888
z-score
-3.0
-2.5
-2.0
-1.5
-1.0
-0.5
0.0
0.5
1.0
1.5
age
n
2-7
92
8-11
70
12-17
96
z-score
-3.0
-2.5
-2.0
-1.5
-1.0
-0.5
0.0
0.5
1.0
1.5
age
n
2-7
95
8-11
77
12-17
122
z-score

ECFSPR European Cystic Fibrosis Society Patient Registry
Annual data report (year 2015) version 1.2017
87
[figure 6.6 continued]
Quartiles of z-scores for BMI: Ireland Quartiles of z-scores for BMI: Israel
Quartiles of z-scores for BMI: Italy Quartiles of z-scores for BMI: Rep of Macedonia
Quartiles of z-scores for BMI: Rep of Moldova Quartiles of z-scores for BMI: The Netherlands
Quartiles of z-scores for BMI: Portugal Quartiles of z-scores for BMI: Romania
Quartiles of z-scores for BMI: Russian Federation Quartiles of z-scores for BMI: Serbia
-3.0
-2.5
-2.0
-1.5
-1.0
-0.5
0.0
0.5
1.0
1.5
age
n
2-7
79
8-11
107
12-17
173
z-score
-3.0
-2.5
-2.0
-1.5
-1.0
-0.5
0.0
0.5
1.0
1.5
age
n
2-7
62
8-11
61
12-17
100
z-score
-3.0
-2.5
-2.0
-1.5
-1.0
-0.5
0.0
0.5
1.0
1.5
age
n
2-7
365
8-11
439
12-17
688
z-score
-3.0
-2.5
-2.0
-1.5
-1.0
-0.5
0.0
0.5
1.0
1.5
age
n
2-7
25
8-11
18
12-17
24
z-score
-3.0
-2.5
-2.0
-1.5
-1.0
-0.5
0.0
0.5
1.0
1.5
age
n
2-7
17
8-11
9
12-17
7
z-score
-3.0
-2.5
-2.0
-1.5
-1.0
-0.5
0.0
0.5
1.0
1.5
age
n
2-7
199
8-11
122
12-17
231
z-score
-3.0
-2.5
-2.0
-1.5
-1.0
-0.5
0.0
0.5
1.0
1.5
age
n
2-7
38
8-11
32
12-17
64
z-score
-3.0
-2.5
-2.0
-1.5
-1.0
-0.5
0.0
0.5
1.0
1.5
age
n
2-7
20
8-11
11
12-17
8
z-score
-3.0
-2.5
-2.0
-1.5
-1.0
-0.5
0.0
0.5
1.0
1.5
age
n
2-7
886
8-11
432
12-17
419
z-score
-3.0
-2.5
-2.0
-1.5
-1.0
-0.5
0.0
0.5
1.0
1.5
age
n
2-7
36
8-11
23
12-17
39
z-score

ECFSPR European Cystic Fibrosis Society Patient Registry
Annual data report (year 2015) version 1.2017
88
[figure 6.6 continued]
Quartiles of z-scores for BMI: Slovak Republic Quartiles of z-scores for BMI: Slovenia
Quartiles of z-scores for BMI: Spain Quartiles of z-scores for BMI: Sweden
Quartiles of z-scores for BMI: Switzerland Quartiles of z-scores for BMI: Turkey
Quartiles of z-scores for BMI: Ukraine Quartiles of z-scores for BMI: United Kingdom
-3.0
-2.5
-2.0
-1.5
-1.0
-0.5
0.0
0.5
1.0
1.5
age
n
2-7
19
8-11
19
12-17
40
z-score
-3.0
-2.5
-2.0
-1.5
-1.0
-0.5
0.0
0.5
1.0
1.5
age
n
2-7
20
8-11
10
12-17
23
z-score
-3.0
-2.5
-2.0
-1.5
-1.0
-0.5
0.0
0.5
1.0
1.5
age
n
2-7
323
8-11
214
12-17
282
z-score
-3.0
-2.5
-2.0
-1.5
-1.0
-0.5
0.0
0.5
1.0
1.5
age
n
2-7
97
8-11
62
12-17
80
z-score
-3.0
-2.5
-2.0
-1.5
-1.0
-0.5
0.0
0.5
1.0
1.5
age
n
2-7
153
8-11
76
12-17
116
z-score
-3.0
-2.5
-2.0
-1.5
-1.0
-0.5
0.0
0.5
1.0
1.5
age
n
2-7
9
8-11
14
12-17
7
z-score
-3.0
-2.5
-2.0
-1.5
-1.0
-0.5
0.0
0.5
1.0
1.5
age
n
2-7
40
8-11
29
12-17
27
z-score
-3.0
-2.5
-2.0
-1.5
-1.0
-0.5
0.0
0.5
1.0
1.5
age
n
2-7
1720
8-11
936
12-17
1338
z-score

ECFSPR European Cystic Fibrosis Society Patient Registry
Annual data report (year 2015) version 1.2017
89
Figure 6.7 Proportion of child patients underweight (z-score of BMI<-2): age and sex pyramids,
by country and overall. Patients aged 2-17 years in 2015.
The coloured bars (red for females, blue for males) represent the percentage of underweight patients in
the selected country, whereas the non-coloured bars represent the percentage of underweight patients
in all the remaining countries (i.e. excluding that country). We excluded from the analyses those age groups
where the number of patients was <10. We therefore excluded from the graphs Latvia, Lithuania,
Luxembourg, Republic of Moldova, Romania and Turkey because some of the age groups in these countries
had fewer than 10 patients.
z-score of BMI <-2: Austria z-score of BMI <-2: Bulgaria
z-score of BMI <-2: Czech Republic z-score of BMI <-2: Denmark
z-score of BMI <-2: France z-score of BMI <-2: Germany
z-score of BMI <-2: Greece z-score of BMI <-2: Hungary
60 40 20 0 20 40 60
02-07
08-10
10-17
%
age
Other countries Austria (F) Austria (M)
60 40 20 0 20 40 60
02-07
08-10
10-17
%
age
Other countries Bulgaria (F) Bulgaria (M)
60 40 20 0 20 40 60
02-07
08-10
10-17
%
age
Other countries Czech Republic (F) Czech Republic (M)
60 40 20 0 20 40 60
02-07
08-10
10-17
%
age
Other countries Denmark (F) Denmark (M)
60 40 20 0 20 40 60
02-07
08-10
10-17
%
age
Other countries France (F) France (M)
60 40 20 0 20 40 60
02-07
08-10
10-17
%
age
Other countries Germany (F) Germany (M)
60 40 20 0 20 40 60
02-07
08-10
10-17
%
age
Other countries Greece (F) Greece (M)
60 40 20 0 20 40 60
02-07
08-10
10-17
%
age
Other countries Hungary (F) Hungary (M)

ECFSPR European Cystic Fibrosis Society Patient Registry
Annual data report (year 2015) version 1.2017
90
[figure 6.7 continued]
z-score of BMI <-2: Ireland z-score of BMI <-2: Israel
z-score of BMI <-2: Italy z-score of BMI <-2: Rep of Macedonia
z-score of BMI <-2: The Netherlands z-score of BMI <-2: Portugal
z-score of BMI <-2: Russian Federation z-score of BMI <-2: Serbia
60 40 20 0 20 40 60
02-07
08-10
10-17
%
age
Other countries Ireland (F) Ireland (M)
60 40 20 0 20 40 60
02-07
08-10
10-17
%
age
Other countries Israel (F) Israel (M)
60 40 20 0 20 40 60
02-07
08-10
10-17
%
age
Other countries Italy (F) Italy (M)
60 40 20 0 20 40 60
02-07
08-10
10-17
%
age
Other countries Macedonia (F) Macedonia (M)
60 40 20 0 20 40 60
02-07
08-10
10-17
%
age
Other countries The Netherlands (F) The Netherlands (M)
60 40 20 0 20 40 60
02-07
08-10
10-17
%
age
Other countries Portugal (F) Portugal (M)
60 40 20 0 20 40 60
02-07
08-10
10-17
%
age
Other countries Russia (F) Russia (M)
60 40 20 0 20 40 60
02-07
08-10
10-17
%
age
Other countries Serbia (F) Serbia (M)
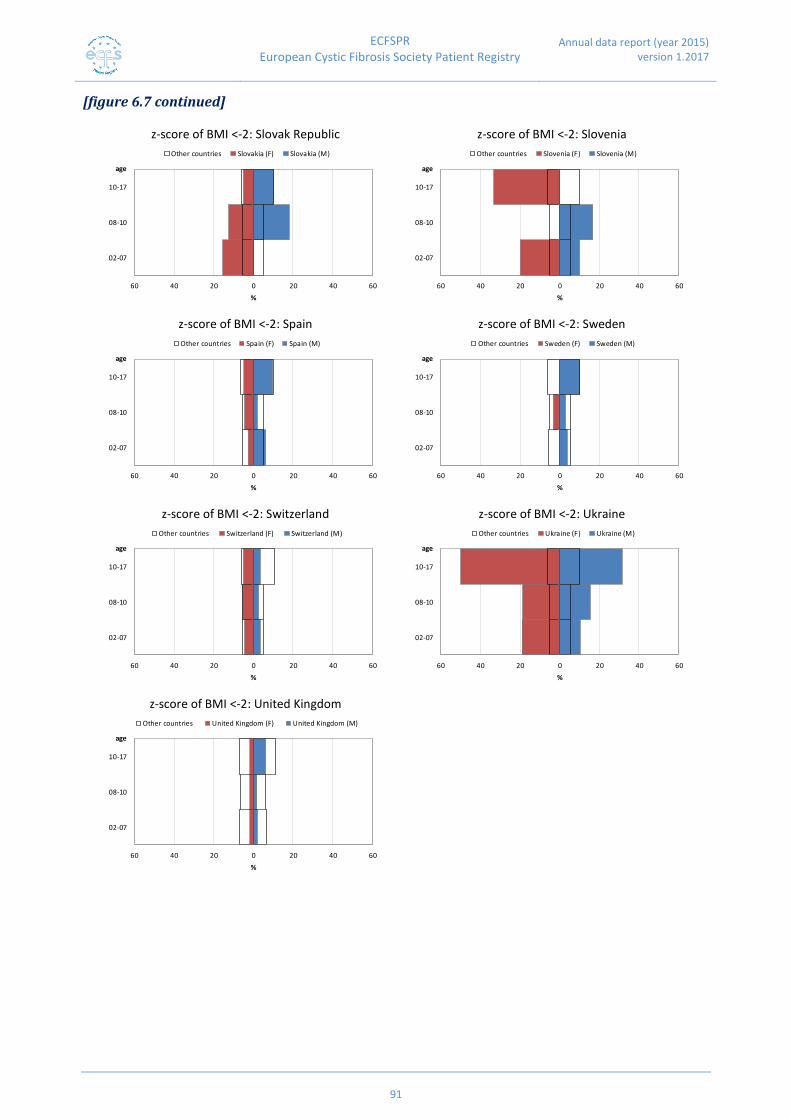
ECFSPR European Cystic Fibrosis Society Patient Registry
Annual data report (year 2015) version 1.2017
91
[figure 6.7 continued]
z-score of BMI <-2: Slovak Republic z-score of BMI <-2: Slovenia
z-score of BMI <-2: Spain z-score of BMI <-2: Sweden
z-score of BMI <-2: Switzerland z-score of BMI <-2: Ukraine
z-score of BMI <-2: United Kingdom
60 40 20 0 20 40 60
02-07
08-10
10-17
%
age
Other countries Slovakia (F) Slovakia (M)
60 40 20 0 20 40 60
02-07
08-10
10-17
%
age
Other countries Slovenia (F) Slovenia (M)
60 40 20 0 20 40 60
02-07
08-10
10-17
%
age
Other countries Spain (F) Spain (M)
60 40 20 0 20 40 60
02-07
08-10
10-17
%
age
Other countries Sweden (F) Sweden (M)
60 40 20 0 20 40 60
02-07
08-10
10-17
%
age
Other countries Switzerland (F) Switzerland (M)
60 40 20 0 20 40 60
02-07
08-10
10-17
%
age
Other countries Ukraine (F) Ukraine (M)
60 40 20 0 20 40 60
02-07
08-10
10-17
%
age
Other countries United Kingdom (F) United Kingdom (M)

ECFSPR European Cystic Fibrosis Society Patient Registry
Annual data report (year 2015) version 1.2017
92
Figure 6.8 Proportion of adult patients with BMI<20: age and sex pyramids, by country and
overall. Patients aged 18 years or older in 2015.
The coloured bars (red for females, blue for males) represent the percentage of underweight patients in
the selected country, whereas the non-coloured bars represent the percentage of underweight patients
in all the remaining countries (i.e. excluding that country). We excluded from the analyses those age groups
where the number of patients was <10. We therefore excluded from the graphs Bulgaria, Latvia, Lithuania,
Luxembourg, Republic of Moldova, Republic of Macedonia, Romania, Serbia, Slovak Republic, Slovenia,
Turkey and Ukraine because some of the age groups in these countries had fewer than 10 patients.
BMI<20 kg/m2: Austria BMI<20 kg/m2: Czech Republic
BMI<20 kg/m2: Denmark BMI<20 kg/m2: France
BMI<20 kg/m2: Germany BMI<20 kg/m2: Greece
BMI<20 kg/m2: Hungary BMI<20 kg/m2: Ireland
80 60 40 20 0 20 40 60 80
18-21
22-27
28-31
32-37
38+
%
age
Other countries Austria (F) Austria (M)
80 60 40 20 0 20 40 60 80
18-21
22-27
28-31
32-37
38+
%
age
Other countries Czech Republic (F) Czech Republic (M)
80 60 40 20 0 20 40 60 80
18-21
22-27
28-31
32-37
38+
%
age
Other countries Denmark (F) Denmark (M)
80 60 40 20 0 20 40 60 80
18-21
22-27
28-31
32-37
38+
%
age
Other countries France (F) France (M)
80 60 40 20 0 20 40 60 80
18-21
22-27
28-31
32-37
38+
%
age
Other countries Germany (F) Germany (M)
80 60 40 20 0 20 40 60 80
18-21
22-27
28-31
32-37
38+
%
age
Other countries Greece (F) Greece (M)
80 60 40 20 0 20 40 60 80
18-21
22-27
28-31
32-37
38+
%
age
Other countries Hungary (F) Hungary (M)
80 60 40 20 0 20 40 60 80
18-21
22-27
28-31
32-37
38+
%
age
Other countries Ireland (F) Ireland (M)

ECFSPR European Cystic Fibrosis Society Patient Registry
Annual data report (year 2015) version 1.2017
93
[figure 6.8 continued]
BMI<20 kg/m2: Israel BMI<20 kg/m2: Italy
BMI<20 kg/m2: The Netherlands BMI<20 kg/m2: Portugal
BMI<20 kg/m2: Russian Federation BMI<20 kg/m2: Spain
BMI<20 kg/m2: Sweden BMI<20 kg/m2: Switzerland
BMI<20 kg/m2: United Kingdom
80 60 40 20 0 20 40 60 80
18-21
22-27
28-31
32-37
38+
%
age
Other countries Israel (F) Israel (M)
80 60 40 20 0 20 40 60 80
18-21
22-27
28-31
32-37
38+
%
age
Other countries Italy (F) Italy (M)
80 60 40 20 0 20 40 60 80
18-21
22-27
28-31
32-37
38+
%
age
Other countries The Netherlands (F) The Netherlands (M)
80 60 40 20 0 20 40 60 80
18-21
22-27
28-31
32-37
38+
%
age
Other countries Portugal (F) Portugal (M)
80 60 40 20 0 20 40 60 80
18-21
22-27
28-31
32-37
38+
%
age
Other countries Russia (F) Russia (M)
80 60 40 20 0 20 40 60 80
18-21
22-27
28-31
32-37
38+
%
age
Other countries Spain (F) Spain (M)
80 60 40 20 0 20 40 60 80
18-21
22-27
28-31
32-37
38+
%
age
Other countries Sweden (F) Sweden (M)
80 60 40 20 0 20 40 60 80
18-21
22-27
28-31
32-37
38+
%
age
Other countries Switzerland (F) Switzerland (M)
80 60 40 20 0 20 40 60 80
18-21
22-27
28-31
32-37
38+
%
age
Other countries United Kingdom (F) United Kingdom (M)

ECFSPR European Cystic Fibrosis Society Patient Registry
Annual data report (year 2015) version 1.2017
94
7. Complications and therapy
The information in this section should not be considered complete for several reasons: national registries
may use a different definition, data about one or more complications is not collected, or the status of the
complication is truly unknown (e.g. liver disease, where the definition requires ultrasound examination).
In the tables, therefore, we show the number of missing values for the various complications, but in the
graphs we have included only countries where less than 10% of the data was missing. For a full list of
complications and definitions please see Appendix 2 on page 120.
In this section we also present data on selected therapies. We collected information on therapies using
the generic name of the drug, and not the brand name. For example, instead of naming individual
antibiotics, we ask whether the patient has been taking ”inhaled antibiotics for more than three months
this year”.

ECFSPR European Cystic Fibrosis Society Patient Registry
Annual data report (year 2015) version 1.2017
95
Table 7.1 Prevalence of allergic bronchopulmonary aspergillosis (all patients seen in 2015) and
CFRD treated with insulin in 2015 (patients aged 18 years or older), by country.
Country ABPA this year
number (%)
CF related diabetes with daily use of insulin this year
number (%)
Missing/ unknown
No Yes Missing/ unknown
No Yes
Austria 8 671 25 4 251 79 (1.14) (95.31) (3.55) (1.20) (75.15) (23.65)
Bulgaria 0 134 0 0 52 6 (0) (100) (0) (0) (89.66) (10.34)
Czech Republic 2 556 13 0 156 91 (0.35) (97.37) (2.28) (0) (63.16) (36.84)
Denmark 467 - - 0 163 116 (100) (0) (58.42) (41.58)
France1 0 5926 627 0 2629 886 (0) (90.43) (9.57) (0) (74.79) (25.21)
Germany 1758 3212 393 979 1183 878 (32.78) (59.89) (7.33) (32.20) (38.92) (28.88)
Greece 78 464 19 19 209 59 (13.90) (82.71) (3.39) (6.62) (72.82) (20.56)
Hungary 5 549 4 7 186 47 (0.90) (98.38) (0.72) (2.92) (77.50) (19.58)
Ireland 7 999 54 7 404 123 (0.66) (94.25) (5.09) (1.31) (75.66) (23.03)
Israel 4 511 35 2 212 95 (0.73) (92.91) (6.36) (0.65) (68.61) (30.74)
Italy 817 4259 130 30 2188 713 (15.69) (81.81) (2.50) (1.02) (74.65) (24.33)
Latvia 3 34 0 3 8 1 (8.11) (91.89) (0) (25.00) (66.67) (8.33)
Lithuania 0 14 0 0 13 1 (0) (100) (0) (0) (92.86) (7.14)
Luxembourg 0 24 2 0 11 4 (0) (92.31) (7.69) (0) (73.33) (26.67)
Rep of Macedonia 0 104 1 0 21 8 (0) (99.05) (0.95) (0) (72.41) (27.59)
Rep of Moldova 0 45 0 0 6 1 (0) (100) (0) (0) (85.71) (14.29)
The Netherlands 2 1287 78 0 508 280 (0.15) (94.14) (5.71) (0) (64.47) (35.53)
Portugal 12 283 5 5 104 15 (4.00) (94.33) (1.67) (4.03) (83.87) (12.10)
Romania 0 43 1 - - - (0) (97.73) (2.27)
Russian Federation 123 2713 39 32 630 47 (4.28) (94.36) (1.36) (4.51) (88.86) (6.63)
Serbia 26 151 3 11 34 10 (14.44) (83.89) (1.67) (20) (61.82) (18.18)
Slovak Republic 1 196 16 1 88 12 (0.47) (92.02) (7.51) (0.99) (87.13) (11.88)
Slovenia 1 92 1 0 27 8 (1.06) (97.87) (1.06) (0) (77.14) (22.86)
Spain 141 1563 68 53 535 192 (7.96) (88.20) (3.84) (6.79) (68.59) (24.62)
Sweden 0 637 8 0 290 107 (0) (98.76) (1.24) (0) (73.05) (26.95)
Switzerland 18 796 38 12 319 120 (2.11) (93.43) (4.46) (2.66) (70.73) (26.61)
Turkey 1 89 3 0 6 0 (1.08) (95.69) (3.23) (0) (100) (0)
Ukraine 1 121 0 0 14 1 (0.82) (99.18) (0) (0) (93.33) (6.67)
United Kingdom 0 8575 1012 0 3565 1798 (0) (89.44) (10.56) (0) (66.47) (33.53)
1 France: ABPA was collected as: Aspergillosis (ABPA and other) if treated.

ECFSPR European Cystic Fibrosis Society Patient Registry
Annual data report (year 2015) version 1.2017
96
Note: Romania has only 2 patients aged 18 years or older at 31/12/2015, therefore no information is included in
the table for CFRD.
Table 7.1 shows the frequency of allergic bronchopulmonary aspergillosis (see Appendix 2, page 119, for
ABPA definitions) and CF-related diabetes (CFRD) – defined here as treated daily with insulin – by country.
For CFRD only patients 18 years and older are included.
Figure 7.1 Prevalence of allergic bronchopulmonary aspergillosis in all patients seen in 2015, by
country.
Note: We excluded from the graph the countries for which the information on allergic bronchopulmonary aspergillosis (ABPA) was missing for more than 10% of the patients. Note: France collected ABPA as Aspergillosis (ABPA and other) if treated.
This graph shows the frequency of allergic bronchopulmonary aspergillosis by country. For the definition
of ABPA see Appendix 2, page 120. The dark green part of the bar shows the percentage of patients with
ABPA, the light green part shows the percentage of patients for which this information was missing.
0 1 2 3 4 5 6 7 8 9 10 11 12
UK
FR
LU
SK
IL
NL
IE
CH
ES
AT
TR
CZ
RO
PT
RU
SE
SI
MK
HU
LV
UA
MD
LT
BG
%
Yes Missing/Unknown

ECFSPR European Cystic Fibrosis Society Patient Registry
Annual data report (year 2015) version 1.2017
97
Figure 7.2 Prevalence of CFRD requiring daily insulin treatment, by country. All patients seen in
2015 aged 18 years or older.
Note: We excluded from the graph the countries for which the information on CFRD was missing for more than 10% of the patients.
This graph shows the prevalence of CF-related diabetes (CFRD) by country. CFRD is recorded differently
among the national registries. As a substitute marker of diabetes, we have collected data on the use of
insulin on a daily basis. The dark green part of the bar shows the percentage of patients who use insulin
daily, the light green part shows the percentage of patients for whom this information was missing. Only
patients aged 18 years or older were included in this graph.
0 5 10 15 20 25 30 35 40
DK
CZ
NL
UK
IL
MK
SE
LU
CH
FR
ES
IT
AT
IE
SI
GR
HU
MD
PT
SK
BG
LT
UA
RU
TR
RO
%
Yes Missing/Unknown

ECFSPR European Cystic Fibrosis Society Patient Registry
Annual data report (year 2015) version 1.2017
98
Table 7.2 Prevalence of pneumothorax, haemoptysis and malignancy in all patients seen in 2015, by country.
Country Pneumothorax requiring chest tube this year number (%)
Haemoptysis major over 250 ml this year number (%)
Malignancy occurred this year
number(%)
Missing/ unknown
No Yes Missing/ unknown
No Yes Missing/ unknown
No Yes
Austria 7 696 1 14 672 18 8 691 5 (1.00) (98.86) (0.14) (1.99) (95.45) (2.56) (1.14) (98.15) (0.71)
Bulgaria 0 132 2 1 106 27 0 134 0 (0) (98.51) (1.49) (0.75) (79.10) (20.15) (0) (100) (0)
Czech Republic 0 564 7 0 561 10 0 571 0 (0) (98.77) (1.23) (0) (98.25) (1.75) (0) (100) (0)
Denmark 0 465 2 467 0 0 0 466 1 (0) (99.57) (0.43) (100) (0) (0) (0) (99.79) (0.21)
France1 0 6525 28 0 6239 314 0 6516 37 (0) (99.57) (0.43) (0) (95.21) (4.79) (0) (99.44) (0.56)
Germany 1902 3403 58 1969 3387 7 1941 3371 51 (35.47) (63.45) (1.08) (36.71) (63.16) (0.13) (36.19) (62.86) (0.95)
Greece 12 546 3 16 538 7 12 548 1 (2.14) (97.33) (0.53) (2.85) (95.90) (1.25) (2.14) (97.68) (0.18)
Hungary 7 522 29 41 512 5 0 555 3 (1.25) (93.55) (5.20) (7.35) (91.75) (0.90) (0) (99.46) (0.54)
Ireland 7 1052 <5 7 1052 <5 7 1052 <5 (0.66) (99.25) (0.09) (0.66) (99.25) (0.09) (0.66) (99.25) (0.09)
Israel 5 543 2 8 531 11 3 547 0 (0.91) (98.73) (0.36) (1.45) (96.55) (2.00) (0.55) (99.45) (0)
Italy 48 5146 12 53 5093 60 49 5135 22 (0.92) (98.85) (0.23) (1.02) (97.83) (1.15) (0.94) (98.64) (0.42)
Latvia 3 34 0 3 33 1 3 34 0 (8.11) (91.89) (0) (8.11) (89.19) (2.70) (8.11) (91.89) (0)
Lithuania 0 14 0 0 13 1 0 14 0 (0) (100) (0) (0) (92.86) (7.14) (0) (100) (0)
Luxembourg 0 26 0 0 25 1 0 26 0 (0) (100) (0) (0) (96.15) (3.85) (0) (100) (0)
Rep of Macedonia 0 105 0 0 100 5 0 105 0 (0) (100) (0) (0) (95.24) (4.76) (0) (100) (0)
Rep of Moldova 0 45 0 0 41 4 0 45 0 (0) (100) (0) (0) (91.11) (8.89) (0) (100) (0)
The Netherlands2 2 1357 8 2 1296 69 0 1353 14 (0.15) (99.26) (0.59) (0.15) (94.80) (5.05) (0) (98.98) (1.02)
Portugal 13 283 4 17 251 32 15 285 0 (4.33) (94.34) (1.33) (5.67) (83.66) (10.67) (5.00) (95.00) (0)
Romania 0 44 0 0 42 2 0 44 0 (0) (100) (0) (0) (95.45) (4.55) (0) (100) (0)
Russian Federation 113 2739 23 121 2716 38 113 2753 9 (3.93) (95.27) (0.80) (4.21) (94.47) (1.32) (3.93) (95.76) (0.31)
Serbia 26 154 0 26 150 4 27 153 0 (14.44) (85.56) (0) (14.44) (83.34) (2.22) (15.00) (85.00) (0)
Slovak Republic 1 212 0 1 200 12 1 211 1 (0.47) (99.53) (0) (0.47) (93.90) (5.63) (0.47) (99.06) (0.47)
Slovenia 0 92 2 13 80 1 1 93 0 (0) (97.87) (2.13) (13.83) (85.11) (1.06) (1.06) (98.94) (0)
Spain 125 1640 7 134 1568 70 119 1642 11 (7.05) (92.55) (0.40) (7.56) (88.49) (3.95) (6.72) (92.66) (0.62)
Sweden 0 644 1 0 645 0 0 643 2 (0) (99.84) (0.16) (0) (100) (0) (0) (99.69) (0.31)
Switzerland 14 836 2 20 793 39 15 832 5 (1.64) (98.13) (0.23) (2.35) (93.07) (4.58) (1.76) (97.65) (0.59)
Turkey 0 93 0 0 88 5 0 93 0 (0) (100) (0) (0) (94.62) (5.38) (0) (100) (0)
Ukraine 1 120 1 2 115 5 1 121 0 (0.82) (98.36) (0.82) (1.64) (94.26) (4.10) (0.82) (99.18) (0)
United Kingdom 0 9528 59 0 9558 29 0 9556 31 (0) (99.38) (0.62) (0) (99.70) (0.30) (0) (99.68) (0.32)
1 France: pneumothorax only; haemoptysis, no quantification. 2 The Netherlands: malignancy diagnosed this year/before.
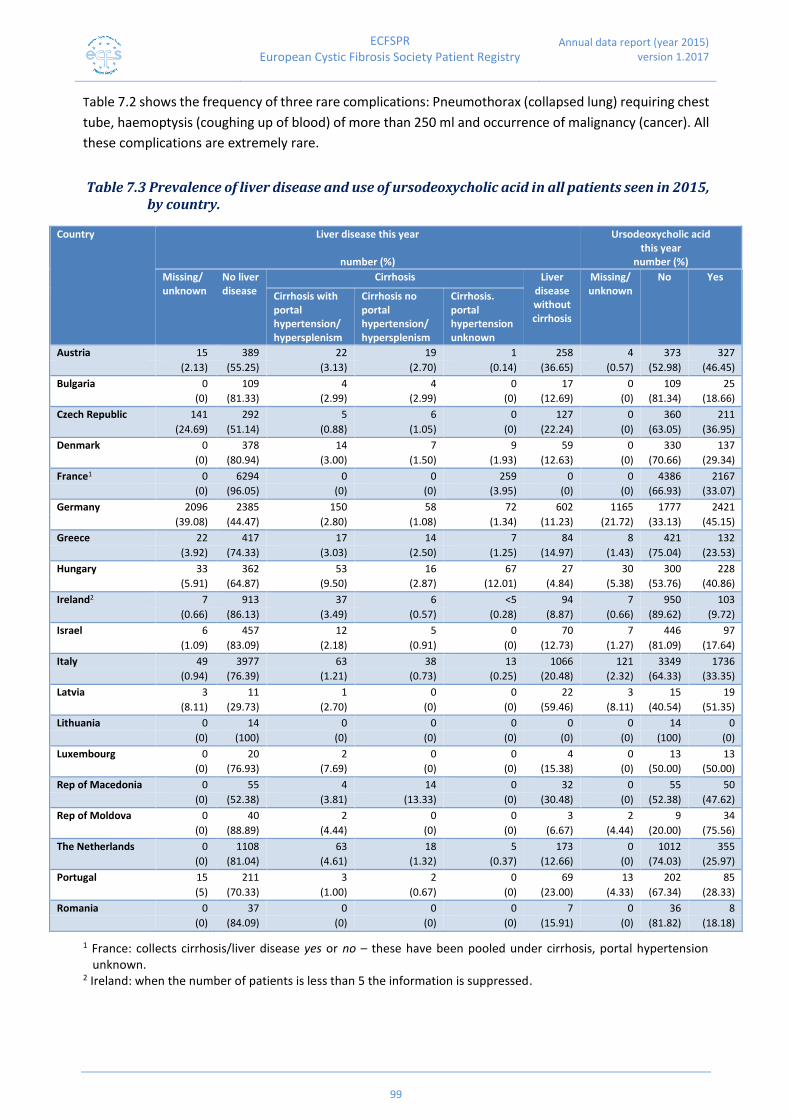
ECFSPR European Cystic Fibrosis Society Patient Registry
Annual data report (year 2015) version 1.2017
99
Table 7.2 shows the frequency of three rare complications: Pneumothorax (collapsed lung) requiring chest
tube, haemoptysis (coughing up of blood) of more than 250 ml and occurrence of malignancy (cancer). All
these complications are extremely rare.
Table 7.3 Prevalence of liver disease and use of ursodeoxycholic acid in all patients seen in 2015, by country.
Country Liver disease this year
number (%)
Ursodeoxycholic acid this year
number (%)
Missing/ unknown
No liver disease
Cirrhosis Liver disease without cirrhosis
Missing/ unknown
No Yes
Cirrhosis with portal hypertension/ hypersplenism
Cirrhosis no portal hypertension/ hypersplenism
Cirrhosis. portal hypertension unknown
Austria 15 389 22 19 1 258 4 373 327
(2.13) (55.25) (3.13) (2.70) (0.14) (36.65) (0.57) (52.98) (46.45)
Bulgaria 0 109 4 4 0 17 0 109 25
(0) (81.33) (2.99) (2.99) (0) (12.69) (0) (81.34) (18.66)
Czech Republic 141 292 5 6 0 127 0 360 211
(24.69) (51.14) (0.88) (1.05) (0) (22.24) (0) (63.05) (36.95)
Denmark 0 378 14 7 9 59 0 330 137
(0) (80.94) (3.00) (1.50) (1.93) (12.63) (0) (70.66) (29.34)
France1 0 6294 0 0 259 0 0 4386 2167
(0) (96.05) (0) (0) (3.95) (0) (0) (66.93) (33.07)
Germany 2096 2385 150 58 72 602 1165 1777 2421
(39.08) (44.47) (2.80) (1.08) (1.34) (11.23) (21.72) (33.13) (45.15)
Greece 22 417 17 14 7 84 8 421 132
(3.92) (74.33) (3.03) (2.50) (1.25) (14.97) (1.43) (75.04) (23.53)
Hungary 33 362 53 16 67 27 30 300 228
(5.91) (64.87) (9.50) (2.87) (12.01) (4.84) (5.38) (53.76) (40.86)
Ireland2 7 913 37 6 <5 94 7 950 103
(0.66) (86.13) (3.49) (0.57) (0.28) (8.87) (0.66) (89.62) (9.72)
Israel 6 457 12 5 0 70 7 446 97
(1.09) (83.09) (2.18) (0.91) (0) (12.73) (1.27) (81.09) (17.64)
Italy 49 3977 63 38 13 1066 121 3349 1736
(0.94) (76.39) (1.21) (0.73) (0.25) (20.48) (2.32) (64.33) (33.35)
Latvia 3 11 1 0 0 22 3 15 19
(8.11) (29.73) (2.70) (0) (0) (59.46) (8.11) (40.54) (51.35)
Lithuania 0 14 0 0 0 0 0 14 0
(0) (100) (0) (0) (0) (0) (0) (100) (0)
Luxembourg 0 20 2 0 0 4 0 13 13
(0) (76.93) (7.69) (0) (0) (15.38) (0) (50.00) (50.00)
Rep of Macedonia 0 55 4 14 0 32 0 55 50
(0) (52.38) (3.81) (13.33) (0) (30.48) (0) (52.38) (47.62)
Rep of Moldova 0 40 2 0 0 3 2 9 34
(0) (88.89) (4.44) (0) (0) (6.67) (4.44) (20.00) (75.56)
The Netherlands 0 1108 63 18 5 173 0 1012 355
(0) (81.04) (4.61) (1.32) (0.37) (12.66) (0) (74.03) (25.97)
Portugal 15 211 3 2 0 69 13 202 85
(5) (70.33) (1.00) (0.67) (0) (23.00) (4.33) (67.34) (28.33)
Romania 0 37 0 0 0 7 0 36 8
(0) (84.09) (0) (0) (0) (15.91) (0) (81.82) (18.18)
1 France: collects cirrhosis/liver disease yes or no – these have been pooled under cirrhosis, portal hypertension unknown.
2 Ireland: when the number of patients is less than 5 the information is suppressed.
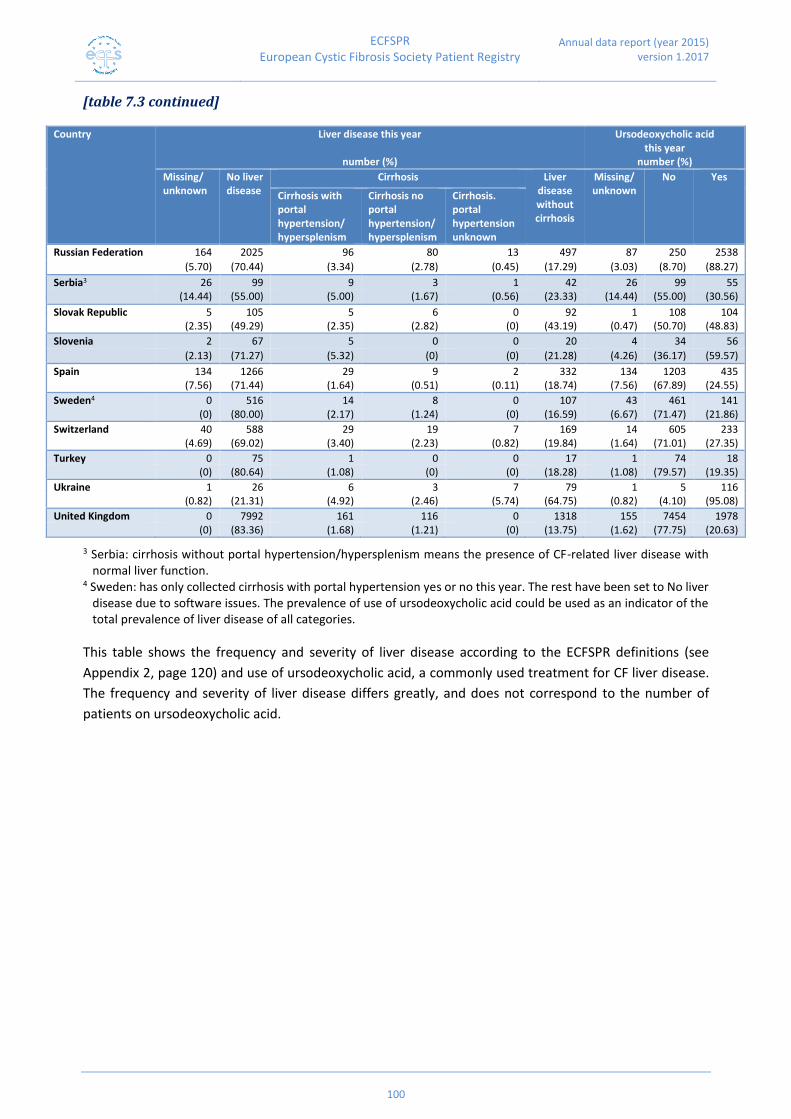
ECFSPR European Cystic Fibrosis Society Patient Registry
Annual data report (year 2015) version 1.2017
100
[table 7.3 continued]
Country Liver disease this year
number (%)
Ursodeoxycholic acid this year
number (%)
Missing/ unknown
No liver disease
Cirrhosis Liver disease without cirrhosis
Missing/ unknown
No Yes
Cirrhosis with portal hypertension/ hypersplenism
Cirrhosis no portal hypertension/ hypersplenism
Cirrhosis. portal hypertension unknown
Russian Federation 164 2025 96 80 13 497 87 250 2538
(5.70) (70.44) (3.34) (2.78) (0.45) (17.29) (3.03) (8.70) (88.27)
Serbia3 26 99 9 3 1 42 26 99 55 (14.44) (55.00) (5.00) (1.67) (0.56) (23.33) (14.44) (55.00) (30.56)
Slovak Republic 5 105 5 6 0 92 1 108 104 (2.35) (49.29) (2.35) (2.82) (0) (43.19) (0.47) (50.70) (48.83)
Slovenia 2 67 5 0 0 20 4 34 56
(2.13) (71.27) (5.32) (0) (0) (21.28) (4.26) (36.17) (59.57)
Spain 134 1266 29 9 2 332 134 1203 435 (7.56) (71.44) (1.64) (0.51) (0.11) (18.74) (7.56) (67.89) (24.55)
Sweden4 0 516 14 8 0 107 43 461 141 (0) (80.00) (2.17) (1.24) (0) (16.59) (6.67) (71.47) (21.86)
Switzerland 40 588 29 19 7 169 14 605 233 (4.69) (69.02) (3.40) (2.23) (0.82) (19.84) (1.64) (71.01) (27.35)
Turkey 0 75 1 0 0 17 1 74 18 (0) (80.64) (1.08) (0) (0) (18.28) (1.08) (79.57) (19.35)
Ukraine 1 26 6 3 7 79 1 5 116 (0.82) (21.31) (4.92) (2.46) (5.74) (64.75) (0.82) (4.10) (95.08)
United Kingdom 0 7992 161 116 0 1318 155 7454 1978 (0) (83.36) (1.68) (1.21) (0) (13.75) (1.62) (77.75) (20.63)
3 Serbia: cirrhosis without portal hypertension/hypersplenism means the presence of CF-related liver disease with normal liver function.
4 Sweden: has only collected cirrhosis with portal hypertension yes or no this year. The rest have been set to No liver disease due to software issues. The prevalence of use of ursodeoxycholic acid could be used as an indicator of the total prevalence of liver disease of all categories.
This table shows the frequency and severity of liver disease according to the ECFSPR definitions (see
Appendix 2, page 120) and use of ursodeoxycholic acid, a commonly used treatment for CF liver disease.
The frequency and severity of liver disease differs greatly, and does not correspond to the number of
patients on ursodeoxycholic acid.

ECFSPR European Cystic Fibrosis Society Patient Registry
Annual data report (year 2015) version 1.2017
101
Figure 7.3 Prevalence and severity of liver disease in all patients seen in 2015, by country.
Note: We excluded from the graph the countries for which the information on liver disease was missing for more than 10% of the patients. Note: France: collects cirrhosis/liver disease yes or no – these have been pooled under cirrhosis, portal hypertension
unknown. Serbia: cirrhosis without portal hypertension/hypersplenism means the presence of CF-related disease with normal liver function. Sweden: has only collected cirrhosis with portal hypertension yes or no this year. The rest have been set to “No liver disease” due to software issues. The prevalence of use of ursodeoxycholic acid could be used as an indicator of the total amount of liver disease of all categories.
This graph shows the frequency of liver disease by country. Liver disease is defined according to severity
of portal hypertension (increased blood pressure in the liver veins, often resulting in blood shunting past
the cirrhotic liver), divided into five categories, including no liver disease (see Appendix 2, page 120).
This graph emphasises better than the table the vast differences in frequency and severity, which may be
due to problems in definitions and diagnostic tools.
0
10
20
30
40
50
60
70
cir.
Y
cir.
N
cirr.
Y
cirr.
N
cirr.
Y
cirr.
N
cirr.
Y
cirr.
N
cirr.
Y
cirr.
N
cirr.
Y
cirr.
N
cirr.
Y
cirr.
N
cirr.
Y
cirr.
N
cirr.
Y
cirr.
N
cirr.
Y
cirr.
N
cirr.
Y
cirr.
N
cirr.
Y
cirr.
N
cirr.
Y
cirr.
N
cirr.
Y
cirr.
N
cirr.
Y
cirr.
N
cirr.
Y
cirr.
N
cirr.
Y
cirr.
N
cirr.
Y
cirr.
N
cirr.
Y
cirr.
N
cirr.
Y
cirr.
N
cirr.
Y
cirr.
N
cirr.
Y
cirr.
N
cirr.
Y
cirr.
N
cirr.
Y
cirr.
N
cirr.
Y
cirr.
N
cirr.
Y
cirr.
N
UA LV SK AT MK PT SI IT CH ES TR RU SE RO LU GR UK IL BG NL DK IE MD HU FR LT
%
Cirrhosis with hypertension/hypersplenism Cirrhosis, hypertension unknown Cirrhosis without hypertension/hypersplenism Liver disease without cirrhosis

ECFSPR European Cystic Fibrosis Society Patient Registry
Annual data report (year 2015) version 1.2017
102
Figure 7.4 Use of ursodeoxycholic acid in all patients seen in 2015, by country.
Note: We excluded from the graph the countries for which the information on ursodeoxycholic acid was missing for more than 10% of the patients.
This graph shows how many patients used ursodeoxycholic acid during the survey year. Ursodeoxycholic
acid is used as a treatment for CF liver disease. The dark green part of the bar indicates the percentage of
patients taking this drug, the light green part shows the percentage of patients for whom this information
is missing.
0 10 20 30 40 50 60 70 80 90 100
UA
RU
MD
SI
LV
LU
SK
MK
AT
HU
CZ
IT
FR
DK
PT
CH
NL
ES
GR
SE
UK
TR
BG
RO
IL
IE
LT
%
Yes Missing/Unknown

ECFSPR European Cystic Fibrosis Society Patient Registry
Annual data report (year 2015) version 1.2017
103
Table 7.4 Use of hypertonic saline, rhDNase and bronchodilators in all patients seen in 2015, by
country.
Country Hypertonic saline (NaCl) inhaled > 3 months this year
number (%)
rhDNase inhaled > 3 months this year
number (%)
Bronchodilators inhaled > 3 months this year
number (%)
Missing/ unknown
No Yes Missing/ unknown
No Yes Missing/ unknown
No Yes
Austria 4 315 385 4 350 350 4 65 635 (0.57) (44.74) (54.69) (0.57) (49.72) (49.72) (0.57) (9.23) (90.20)
Bulgaria 0 51 83 0 24 110 0 93 41 (0) (38.06) (61.94) (0) (17.91) (82.09) (0) (69.40) (30.60)
Czech Republic 0 351 220 0 213 358 0 262 309 (0) (61.47) (38.53) (0) (37.30) (62.70) (0) (45.88) (54.12)
Denmark 467 - - 0 66 401 467 - - (100) (0) (14.13) (85.87) (100)
France 0 6110 443 0 3634 2919 0 3508 3045 (0) (93.24) (6.76) (0) (55.46) (44.54) (0) (53.53) (46.47)
Germany 5363 - - 1548 1278 2537 5363 - - (100) (28.86) (23.83) (47.31) (100)
Greece 8 411 142 11 222 328 9 339 213 (1.43) (73.26) (25.31) (1.96) (39.57) (58.47) (1.60) (60.43) (37.97)
Hungary 29 180 349 40 217 301 30 245 283 (5.20) (32.26) (62.54) (7.17) (38.89) (53.94) (5.38) (43.91) (50.71)
Ireland 7 509 544 7 521 532 7 392 661 (0.66) (48.02) (51.32) (0.66) (49.15) (50.19) (0.66) (36.98) (62.36)
Israel 9 180 361 6 176 368 8 197 345 (1.64) (32.73) (65.63) (1.09) (32.00) (66.91) (1.45) (35.82) (62.73)
Italy 868 2588 1750 119 3554 1533 869 1280 3057 (16.67) (49.71) (33.62) (2.29) (68.26) (29.45) (16.69) (24.59) (58.72)
Latvia 3 2 32 3 12 22 3 1 33 (8.11) (5.41) (86.48) (8.11) (32.43) (59.46) (8.11) (2.70) (89.19)
Lithuania 0 14 0 0 3 11 0 3 11 (0) (100) (0) (0) (21.43) (78.57) (0) (21.43) (78.57)
Luxembourg 0 7 19 0 7 19 0 8 18 (0) (26.92) (73.08) (0) (26.92) (73.08) (0) (30.77) (69.23)
Rep of Macedonia 0 61 44 0 30 75 0 7 98 (0) (58.10) (41.90) (0) (28.57) (71.43) (0) (6.67) (93.33)
Rep of Moldova 2 1 42 2 41 2 2 1 42 (4.44) (2.22) (93.34) (4.44) (91.12) (4.44) (4.44) (2.22) (93.34)
The Netherlands 0 1006 361 0 498 869 0 764 603 (0) (73.59) (26.41) (0) (36.43) (63.57) (0) (55.89) (44.11)
Portugal 13 238 49 12 74 214 12 142 146 (4.33) (79.34) (16.33) (4.00) (24.67) (71.33) (4.00) (47.33) (48.67)
Romania 0 4 40 0 10 34 0 2 42 (0) (9.09) (90.91) (0) (22.73) (77.27) (0) (4.55) (95.45)
Russian Federation 105 1382 1388 70 180 2625 112 1077 1686 (3.65) (48.07) (48.28) (2.43) (6.26) (91.31) (3.90) (37.46) (58.64)
Serbia 26 14 140 26 79 75 26 2 152 (14.44) (7.78) (77.78) (14.44) (43.89) (41.67) (14.44) (1.11) (84.45)
Slovak Republic 0 188 25 1 84 128 0 105 108 (0) (88.26) (11.74) (0.47) (39.44) (60.09) (0) (49.30) (50.70)
Slovenia 2 7 85 3 53 38 3 76 15 (2.13) (7.45) (90.42) (3.19) (56.38) (40.43) (3.19) (80.85) (15.96)
Spain 132 661 979 131 1246 395 132 521 1119 (7.45) (37.30) (55.25) (7.39) (70.32) (22.29) (7.45) (29.40) (63.15)
Sweden 43 188 414 41 459 145 46 68 531 (6.67) (29.15) (64.18) (6.36) (71.16) (22.48) (7.13) (10.54) (82.33)
Switzerland 16 305 531 15 509 328 14 116 722 (1.88) (35.80) (62.32) (1.76) (59.74) (38.50) (1.64) (13.62) (84.74)
Turkey 1 85 7 2 9 82 1 9 83 (1.08) (91.39) (7.53) (2.15) (9.68) (88.17) (1.08) (9.68) (89.24)
Ukraine 1 2 119 8 49 65 1 27 94 (0.82) (1.64) (97.54) (6.56) (40.16) (53.28) (0.82) (22.13) (77.05)
United Kingdom1 0 7008 2579 0 4092 5495 0 4511 5076 (0) (73.10) (26.90) (0) (42.68) (57.32) (0) (47.05) (52.95)
1 United Kingdom: the duration of use of inhaled hypertonic saline and of bronchodilators is not specified.

ECFSPR European Cystic Fibrosis Society Patient Registry
Annual data report (year 2015) version 1.2017
104
Table 7.4 shows the use of three different inhaled medications: hypertonic saline, rhDNase (Pulmozyme®)
and bronchodilators (see page 12 for abbreviations).
Figure 7.5 Use of inhaled hypertonic saline in all patients seen in 2015, by country.
Note: We excluded from the graph the countries for which the information on inhaled hypertonic saline was missing for more than 10% of the patients. Note: United Kingdom: the duration of use of inhaled hypertonic saline is not specified.
This table shows the use of inhaled hypertonic saline for more than three months during the survey year.
The dark green part of the bar indicates the percentage of patients taking the medication, the light green
part shows the percentage of patients for whom this information is missing.
0 10 20 30 40 50 60 70 80 90 100
UA
MD
RO
SI
LV
LU
IL
SE
HU
CH
BG
ES
AT
IE
RU
MK
CZ
UK
NL
GR
PT
SK
TR
FR
LT
%
Yes Missing/Unknown

ECFSPR European Cystic Fibrosis Society Patient Registry
Annual data report (year 2015) version 1.2017
105
Figure 7.6 Use of rhDNase in all patients seen in 2015, by country.
Note: We excluded from the graph the countries for which the information on rhDNase was missing for more than
10% of the patients.
This graph shows the use of rhDNase (marketed as Pulmozyme®) as inhalations for more than 3 months
during the survey year. The dark green part of the bar indicates the percentage of patients taking this drug,
the light green part shows the percentage of patients for whom this information is missing.
0 10 20 30 40 50 60 70 80 90 100
RU
TR
DK
BG
LT
RO
LU
MK
PT
IL
NL
CZ
SK
LV
GR
UK
HU
UA
IE
AT
FR
SI
CH
IT
SE
ES
MD
%
Yes Missing/Unknown

ECFSPR European Cystic Fibrosis Society Patient Registry
Annual data report (year 2015) version 1.2017
106
Figure 7.7 Use of bronchodilators in all patients seen in 2015, by country.
Note: We excluded from the graph the countries for which the information on use of bronchodilators was missing for more than 10% of the patients.
Note: United Kingdom: the duration of use of bronchodilators is not specified.
This graph shows the use of bronchodilators for more than three months during the survey year. This is
the most widely used inhaled medication, but still there are significant differences in frequency of use
between countries. The dark green part of the bar indicates the percentage of patients taking this drug,
the light green part shows the percentage of patients for whom this information is missing.
0 10 20 30 40 50 60 70 80 90 100
RO
MD
MK
AT
TR
LV
CH
SE
LT
UA
LU
ES
IL
IE
RU
CZ
UK
HU
SK
PT
FR
NL
GR
BG
SI
%
Yes Missing/Unknown

ECFSPR European Cystic Fibrosis Society Patient Registry
Annual data report (year 2015) version 1.2017
107
Table 7.5 Use of inhaled antibiotics, macrolides and oxygen in all patients seen in 2015, by country.
Country Inhaled antibiotics inhaled > 3 months this year
number (%)
Oxygen therapy this year
number (%)
Macrolides > 3 months this year
number (%)
Missing/ unknown
No Yes Missing/ unknown
No Yes Missing/ unknown
No Yes
Austria 6 440 258 5 671 28 5 640 59 (0.85) (62.50) (36.65) (0.71) (95.31) (3.98) (0.71) (90.91) (8.38)
Bulgaria 0 52 82 0 125 9 0 124 10 (0) (38.81) (61.19) (0) (93.28) (6.72) (0) (92.54) (7.46)
Czech Republic 0 424 147 0 542 29 0 486 85 (0) (74.26) (25.74) (0) (94.92) (5.08) (0) (85.11) (14.89)
Denmark 467 - - 467 - - 467 - - (100) (100) (100)
France1 0 4261 2292 0 6234 319 0 3741 2812 (0) (65.02) (34.98) (0) (95.13) (4.87) (0) (57.09) (42.91)
Germany 1374 1911 2078 5025 6 332 5363 - - (25.62) (35.63) (38.75) (93.70) (0.11) (6.19) (100)
Greece 8 244 309 9 529 23 9 444 108 (1.43) (43.49) (55.08) (1.60) (94.30) (4.10) (1.61) (79.14) (19.25)
Hungary 37 301 220 40 467 51 38 402 118 (6.63) (53.94) (39.43) (7.17) (83.69) (9.14) (6.81) (72.04) (21.15)
Ireland 7 594 459 7 1010 43 7 578 475 (0.66) (56.04) (43.30) (0.66) (95.28) (4.06) (0.66) (54.53) (44.81)
Israel 7 253 290 7 529 14 8 248 294 (1.27) (46.00) (52.73) (1.27) (96.18) (2.55) (1.45) (45.09) (53.46)
Italy 119 3376 1711 118 4825 263 120 3484 1602 (2.29) (64.84) (32.87) (2.27) (92.68) (5.05) (2.31) (66.92) (30.77)
Latvia 3 19 15 3 33 1 3 25 9 (8.11) (51.35) (40.54) (8.11) (89.19) (2.70) (8.11) (67.57) (24.32)
Lithuania 0 13 1 0 12 2 0 14 0 (0) (92.86) (7.14) (0) (85.71) (14.29) (0) (100) (0)
Luxembourg 0 11 15 0 25 1 0 11 15 (0) (42.31) (57.69) (0) (96.15) (3.85) (0) (42.31) (57.69)
Rep of Macedonia 0 62 43 0 102 3 0 85 20 (0) (59.05) (40.95) (0) (97.14) (2.86) (0) (80.95) (19.05)
Rep of Moldova 2 14 29 2 41 2 2 21 22 (4.44) (31.11) (64.45) (4.44) (91.12) (4.44) (4.44) (46.67) (48.89)
The Netherlands 0 784 583 0 1320 47 0 779 588 (0) (57.35) (42.65) (0) (96.56) (3.44) (0) (56.99) (43.01)
Portugal 13 141 146 12 266 22 12 187 101 (4.33) (47.00) (48.67) (4.00) (88.67) (7.33) (4.00) (62.33) (33.67)
Romania 0 24 20 0 44 0 0 37 7 (0) (54.55) (45.45) (0) (100) (0) (0) (84.09) (15.91)
Russian Federation 104 1594 1177 84 2654 137 103 1867 905 (3.62) (55.44) (40.94) (2.92) (92.31) (4.77) (3.58) (64.94) (31.48)
Serbia 26 95 59 26 150 4 26 141 13 (14.44) (52.78) (32.78) (14.44) (83.34) (2.22) (14.44) (78.34) (7.22)
Slovak Republic 0 109 104 0 207 6 0 160 53 (0) (51.17) (48.83) (0) (97.18) (2.82) (0) (75.12) (24.88)
Slovenia 3 79 12 1 89 4 4 85 5 (3.19) (84.04) (12.77) (1.06) (94.68) (4.26) (4.26) (90.42) (5.32)
Spain 135 750 887 125 1579 68 133 979 660 (7.62) (42.33) (50.05) (7.05) (89.11) (3.84) (7.51) (55.24) (37.25)
Sweden 55 531 59 42 588 15 47 404 194 (8.53) (82.32) (9.15) (6.51) (91.16) (2.33) (7.29) (62.63) (30.08)
Switzerland 27 506 319 14 810 28 15 586 251 (3.17) (59.39) (37.44) (1.64) (95.07) (3.29) (1.76) (68.78) (29.46)
Turkey 1 70 22 1 90 2 1 90 2 (1.08) (75.26) (23.66) (1.08) (96.77) (2.15) (1.08) (96.77) (2.15)
Ukraine 2 83 37 2 116 4 1 3 118 (1.64) (68.03) (30.33) (1.64) (95.08) (3.28) (0.82) (2.46) (96.72)
United Kingdom2 0 4633 4954 36 8865 686 0 5797 3790 (0) (48.33) (51.67) (0.38) (92.46) (7.16) (0) (60.47) (39.53)
1 France: collects only use of azithromycin for macrolides. 2 United Kingdom: the duration of use of macrolides is not specified.

ECFSPR European Cystic Fibrosis Society Patient Registry
Annual data report (year 2015) version 1.2017
108
This table shows the use of three treatments: inhaled antibiotics for more than 3 months during the survey
year (any kind); macrolides (e.g. azithromycin) for more than three months; oxygen for home treatment.
Both inhaled antibiotics and macrolides are frequently used but with marked differences between
countries. Oxygen is used less frequently (severe lung disease).
Figure 7.8 Use of inhaled antibiotics in all patients seen in 2015, by country.
Note: We excluded from the graph the countries for which the information on inhaled antibiotics was missing for
more than 10% of the patients.
This graph shows the use of inhaled antibiotics (of any kind) for more than three months during the survey
year. The frequency varies considerably, from 5 to 60%. The dark green part of the bar shows the
percentage of patients taking this drug, the light green part shows the percentage of patients for whom
this information is missing.
0 5 10 15 20 25 30 35 40 45 50 55 60 65 70
MD
BG
LU
GR
IL
UK
ES
SK
PT
RO
IE
NL
MK
RU
LV
HU
CH
AT
FR
IT
UA
CZ
TR
SI
SE
LT
%
Yes Missing/Unknown
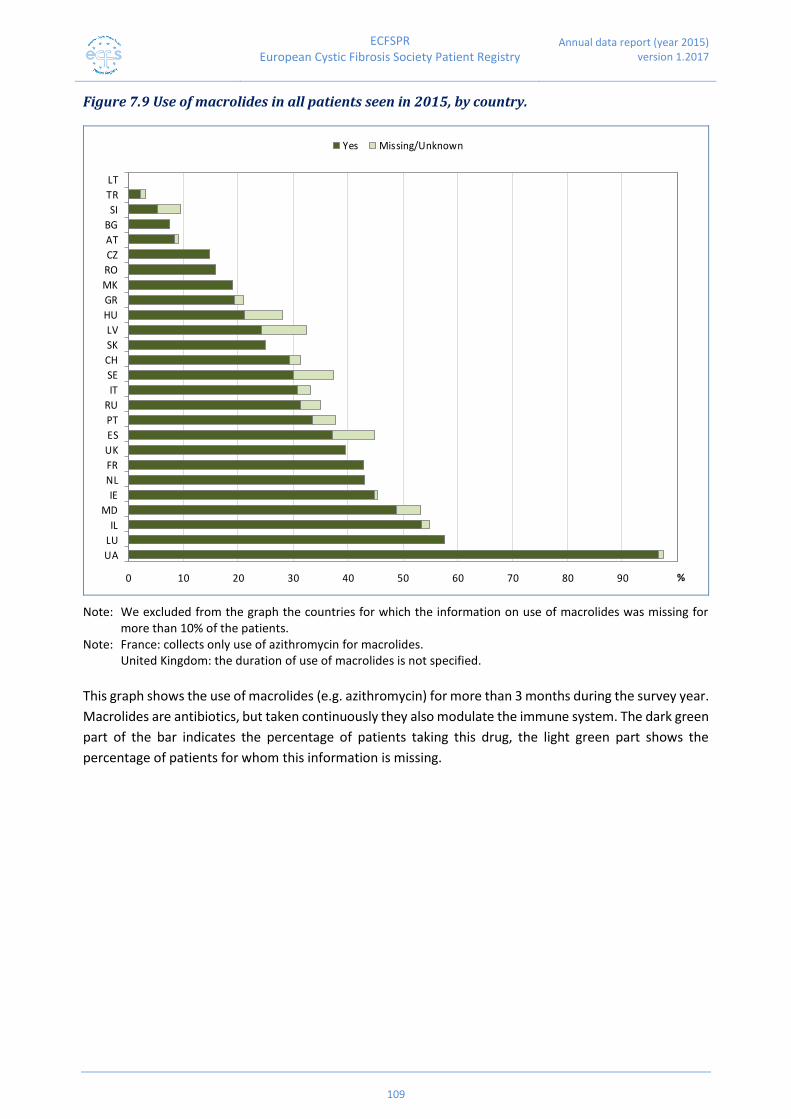
ECFSPR European Cystic Fibrosis Society Patient Registry
Annual data report (year 2015) version 1.2017
109
Figure 7.9 Use of macrolides in all patients seen in 2015, by country.
Note: We excluded from the graph the countries for which the information on use of macrolides was missing for more than 10% of the patients.
Note: France: collects only use of azithromycin for macrolides. United Kingdom: the duration of use of macrolides is not specified.
This graph shows the use of macrolides (e.g. azithromycin) for more than 3 months during the survey year.
Macrolides are antibiotics, but taken continuously they also modulate the immune system. The dark green
part of the bar indicates the percentage of patients taking this drug, the light green part shows the
percentage of patients for whom this information is missing.
0 10 20 30 40 50 60 70 80 90 100
UA
LU
IL
MD
IE
NL
FR
UK
ES
PT
RU
IT
SE
CH
SK
LV
HU
GR
MK
RO
CZ
AT
BG
SI
TR
LT
%
Yes Missing/Unknown

ECFSPR European Cystic Fibrosis Society Patient Registry
Annual data report (year 2015) version 1.2017
110
Figure 7.10 Use of oxygen in all patients seen in 2015, by country.
Note: We excluded from the graph the countries for which the information on the use of oxygen was missing for
more than 10% of the patients.
This graph shows the use of oxygen at home during the survey year. Oxygen is used for severe lung disease.
The dark green part of the bar indicates the percentage of patients using oxygen supplementation, the
light green part shows the percentage of patients for whom this information is missing.
0 2 4 6 8 10 12 14 16 18
LT
HU
PT
UK
BG
CZ
IT
FR
RU
MD
SI
GR
IE
AT
LU
ES
NL
CH
UA
MK
SK
LV
IL
SE
TR
RO
%
Yes Missing/Unknown

ECFSPR European Cystic Fibrosis Society Patient Registry
Annual data report (year 2015) version 1.2017
111
8. Transplantation
We ask the countries whether their patients are transplanted or not, and if they are, in which year they
had their (latest) transplant.
In some countries transplanted patients are no longer registered in the CF centres’ database and the CF
national registry, because the patients have been transferred to a transplant centre. For this reason, the
figures below may report a lower number of transplanted patients than the true number, but it has not
been possible to acquire more accurate data.
Table 8.1 Number of patients living in 2015 with transplanted lungs, by age and sex.
Age Males Females Total Transplants performed during the survey year
10-14 9 13 22 5
15-19 38 36 74 21
20-24 85 122 207 50
25-29 150 192 342 56
30-34 201 184 385 33
35-39 171 165 336 25
40-44 141 127 268 18
45+ 189 136 325 18
Total 984 975 1959 226
This table shows the number of patients alive in 2015 who have had a lung transplant at some time in their
life, by age group, as well as the number of patients transplanted during 2015.
Table 8.2 Number of patients living in 2015 with transplanted liver, by age and sex.
Age Males Females Total Transplants performed during the survey year
0-4 0 1 1 1
5-9 2 2 4 0
10-14 14 9 23 8
15-19 29 12 41 7
20-24 30 18 48 5
25-29 27 18 45 2
30-34 27 11 38 1
35-39 11 6 17 1
40-44 11 5 16 0
45+ 8 4 12 0
Total 159 86 245 25
This table shows the number of patients alive in 2015 who have had a liver transplant at some time in their
life, by age group, as well as the number of patients transplanted during 2015.

ECFSPR European Cystic Fibrosis Society Patient Registry
Annual data report (year 2015) version 1.2017
112
Figure 8.1 Number of patients living in 2015 with transplanted lungs, by country.
This graph shows the number of patients alive in 2015 who have had a lung transplant (orange bars) at
some point in their life. The red dots (right axis) show the percentage of patients that are living with lung
transplant in 2015 among the patients that were seen in 2015.
0
2
4
6
8
10
12
0
100
200
300
400
500
600
700
LT LV RO TR MK UA BG MD RU IL SK RS UK DE IE LU IT GR CH AT PT SI CZ ES NL DK HU SE FR
% o
f pa
tients tra
nsp
lan
ted a
mo
ng th
ose seen
in th
e survey yea
rn
of
pa
tien
ts li
vin
g w
ith
tra
nsp
lan
t du
rin
g th
esu
rvey
yea
r

ECFSPR European Cystic Fibrosis Society Patient Registry
Annual data report (year 2015) version 1.2017
113
Figure 8.2 Number of patients living in 2015 with transplanted liver, by country.
This graph shows the number of patients alive in 2015 who have had a liver transplant (green bars) at some
point in their life. The dark green dots (right axis) show the percentage of patients that are living with liver
transplant in 2015 among the patients that were seen in 2015.
Note that on the vertical axis the number of patients with liver transplant is much lower than the number
with lung transplant. The main reason for this is that liver disease is only found in a subset of CF patients,
whereas lung disease affects almost all patients.
0.0
0.2
0.4
0.6
0.8
1.0
1.2
1.4
1.6
0
10
20
30
40
50
60
BG LT LU LV MK RO RS SI SK TR UA MD RU HU PT GR NL IT CH CZ IE UK FR DE DK SE IL ES AT
% o
f pa
tients tra
nsp
lan
ted a
mo
ng th
ose seen
in th
e survey yea
r
n o
f p
ati
ents
livi
ng
wit
h tr
an
spla
nt d
uri
ng
thes
urv
ey y
ear

ECFSPR European Cystic Fibrosis Society Patient Registry
Annual data report (year 2015) version 1.2017
114
9. Mortality
Table 9.1 Number of deaths in 2015, by age and sex.
Age at death
Number of male patients
% of deaths in this age group
of all male deaths
Number of female
patients
% of deaths in this age group of all female
deaths
Total % Total
0-5 6 3.06 5 2.20 11 2.60
6-10 4 2.04 7 3.08 11 2.60
11-20 24 12.24 44 19.38 68 16.08
21-30 76 38.78 74 32.61 150 35.45
31-40 40 20.41 52 22.91 92 21.75
41-50 29 14.80 25 11.01 54 12.77
51+ 17 8.67 20 8.81 37 8.75
Total 196 100 227 100 423 100
Note: For the United Kingdom, all patients with confirmed diagnosis of CF were included (N=10,810). The total number of patients presented is 41,321.
Note: For 5 patients (4 male and 1 female) date at death, and thereby age at death, is unknown.
This table shows the number of deaths in 2015 by age group and sex. Death in small children is very rare,
and the most frequent range of age of death for both sexes is 21-30 years.
Please note: it is possible that the number of deceased patients is under reported because some of the
patients were not seen at the centre during the year, and therefore the information may not have been
recorded.

ECFSPR European Cystic Fibrosis Society Patient Registry
Annual data report (year 2015) version 1.2017
115
Figure 9.1 Age at death distribution of patients deceased in 2015, by sex.
Note: For the United Kingdom, all patients with confirmed diagnosis of CF were included (N=10,810). The total number of patients presented is 41,321.
Note: For 5 patients (4 male and 1 female) date at death, and thereby age at death, was unknown.
This graph shows the distribution of age at death of patients who died in 2015, separately by males (yellow)
and females (red).
Table 9.2 Cause of death distribution of deaths in 2015.
Cause of death Number of deaths Percentage of all deaths
Respiratory disease 274 64.02
Transplantation related 62 14.49
Non-CF related 35 8.18
Liver-GI related 8 1.87
Suicide 2 0.47
Trauma 3 0.70
Unknown 44 10.27
Total 428 100
Note: United Kingdom collects cause of death “respiratory disease” as “cardio/respiratory”.
This table shows cause of death for the deceased patients. The most frequent cause of death is respiratory
disease. Please note that only a limited number of causes of death are collected, therefore if some deaths
are due to rare complications of CF, they may have been classified as “Unknown”.
0
10
20
30
40
50
60
70
80
0-5 6-10 11-20 21-30 31-40 41-50 51+
nu
mb
er o
f p
ati
ents
age
Number of deaths (males) Number of deaths (females)

ECFSPR European Cystic Fibrosis Society Patient Registry
Annual data report (year 2015) version 1.2017
116
Publications
The ECFSPR data has been actively used for research. Data applications are handled in accordance with
the ECFSPR guidelines, for more information we refer you to the webpage www.ecfs.eu/projects/ecfs-
patient-registry/data-request-application.
In the period 2011-2016 we received 46 applications for data. The majority of these requests originated
from researchers (76%), from within and outside of the European Cystic Fibrosis Society; and 24% of the
applications derived from the Industry.
Several of these research projects have resulted in publications and others are in the pipeline. Brief
synopses and links to the published articles you will find on the website www.ecfs.eu/projects/ecfs-
patient-registry/articles.
An overview of the approved applications for data so far unrelated to any publications can also be found
on the website www.ecfs.eu/projects/ecfs-patient-registry/overview-data-applications.

ECFSPR European Cystic Fibrosis Society Patient Registry
Annual data report (year 2015) version 1.2017
117
Partners and Contributors

ECFSPR European Cystic Fibrosis Society Patient Registry
Annual data report (year 2015) version 1.2017
118
Appendix 1: Technical notes
Patient inclusion criteria
The ECFSPR registers patients diagnosed with CF in accordance with agreed definitions (see Appendix 2).
Data of patients with a diagnosis that does not meet the agreed definitions are accepted in the database
but not included in the analyses.
Data manipulation
To ensure that data was anonymous, we collected only year and month of birth and the day of birth was
set to the 15th of the month.
Unknown dates of lung function tests and of height/weight measurements were set to July 1st of the survey
year.
For pre-natal diagnoses, we set age at diagnosis equal to 0.
We checked for outliers and, whenever possible, we corrected the values according to the national
registries’/individual centres’ instructions. If, after the data quality controls, aberrant values were still
present in the database, we set them to missing for the purposes of this report.
Reference populations used for computing z-scores
The value of a z-score depends on the reference anthropometric chart: if different reference values are
used, the same value of height (or weight or BMI) will result in different values of z-scores, and these
differences might be of clinical importance. To compare the nutritional status of CF patients with that of
healthy individuals an appropriate reference population must be used: ideally, a fair comparison requires
that CF patients and healthy individuals belong to the same population. This implies the availability of a
national reference.
The lack of a national reference for most countries participating in the ECFSPR obliged us to use an inter-
national reference to compute z-scores for height, weight and BMI. We decided to use the CDC 2000
reference charts (Kuczmarski RJ, Ogden CL, Guo SS et al. 2000 CDC Growth Charts for the United States:
Methods and Development. National Centre for Health Statistics. Vital Health Stat 2002; 11(246):1-190.),
which were derived from samples of U.S. healthy individuals1. The choice of CDC charts as a reference,
although not the most suitable to assess the nutritional status of European CF patients, is justified by the
widespread use of these charts at international level.
Reference populations used for computing FEV1 predicted values
We computed the percent of predicted values for FEV1 and FVC using:
The multi-ethnic reference values for spirometry for the 3-95-yr age range: the global lung function 2012
equations. Eur Respir J 2012; 40: 1324–1343).
In the addendum this year we have included the computations based on the references:
for male children (6-17 years) and female children (6-15 years):
Wang X, Dockery DW, Wypij D, Fay ME, Ferris BG. Pulmonary function between 6 and 18 years of
age. Pediatr Pulmonol 1993; 15:75-88.
for male adults (≥18 years) and female adults (≥16 years):
Hankinson JL, Odencrantz RJ, Fedan KB. Spirometric reference values from a sample of the general
U.S. population. Am J Respr Crit Care Med 1999; 159:179-87.
1 For details on the target population, please see www.cdc.gov/growthcharts/2000growthchart-us.pdf.
ECFSPR European Cystic Fibrosis Society Patient Registry
Annual data report (year 2015) version 1.2017
119
Software used for data management and statistical analyses
SAS software, Version 9.2. Copyright, SAS Institute Inc. SAS and all other SAS Institute Inc. product or
service names are registered trademarks or trademarks of SAS Institute Inc., Cary, NC, USA.

ECFSPR European Cystic Fibrosis Society Patient Registry
Annual data report (year 2015) version 1.2017
120
Appendix 2: List of variables, inclusion criteria and
definitions used by the ECFSPR
List of variables
Demographics Therapy
CF centre code
Patient code
Year of follow-up
Date of birth (year and month)
Gender
Status of patient
Cause of death
Date of death
Inhaled continuous hypertonic NaCl this year
Inhaled continuous antibiotic this year
Inhaled continuous bronchodilators this year
In Oxygen therapy this year
Use of rhDNase this year
Use of continuous azithromycin (or other macrolide)
this year
Use of ursodeoxycholic acid this year
Use of pancreatic enzymes this year
Diagnosis Complications
Diagnosis confirmed
Age at diagnosis
Type of sweat test
Electrolytes
Chloride value
Meconium Ileus
Neonatal screening
Allergic bronchopulmonary aspergillosis this year
Diabetes: daily insulin treated this year
Pneumothorax requiring chest drain this year
Liver disease this year
Haemoptysis major over 250 ml this year
Pancreatic status: faecal elastase
Pancreatic status: faecal fat
Occurrence of malignancy this year
Genotype Microbiology
First mutation
Second mutation
Chronic Burkholderia cepacia complex
Nontuberculous mycobacteria this year
Chronic Pseudomonas aeruginosa
Chronic Staphylococcus aureus
Stenotrophomonas maltophilia this year
Follow-up Transplant
Date of best FEV1 recorded this year
Value of best FEV1 recorded this year
Value of best FVC recorded this year
Height measured at date of best FEV1 (or in case
of no FEV1 last height of the year)
Weight measured at date of best FEV1 (or in case
of no FEV1 last height of the year)
Liver transplant
Year of latest liver transplant (if occurred before or
during this year)
Lung transplant
Year of latest lung transplant (if occurred before or
during this year)

ECFSPR European Cystic Fibrosis Society Patient Registry
Annual data report (year 2015) version 1.2017
121
Inclusion criteria
Only patients who fulfil the diagnostic criteria below should be included in the registry. a. Two sweat tests value > 60 mmol/L chloride: CF diagnosis accepted b. One sweat test value > 60 mmol/L chloride and DNA Analysis/Genotyping – two identified disease
causing CF mutations: CF diagnosis accepted c. Sweat value less than or equal to 60 mmol/L chloride: if the sweat value is less than or equal to 60
mmol/L chloride, then at least 2 of these should be met: i. DNA Analysis/Genotyping – two identified disease causing CF mutations.
ii. Transepithelial (Nasal) Potential Difference – study consistent with a diagnosis of CF. iii. Clinical Presentation – typical features of CF.
d. Diagnosis reversal: if the patient’s CF diagnosis reversed during the year, identify the reason from the following options:
i. DNA Analysis – unable to identify two disease causing CF mutations. ii. Transepithelial (Nasal) Potential Difference – study not consistent with a diagnosis of CF.
iii. Repeat normal sweat testing – confirm with clinical team.
Definitions for EFCSPR
SWEAT TEST
If a sweat test was not performed on a patient, record “not done”. If a sweat test is “not done” then two known genotype mutations must be reported.
i. Sweat Test: record the patient's sweat test. ii. Electrolytes: Chloride concentration measurement is the preferred analysis.
iii. Chloride value: report the Chloride value in millimols per litre (mmol/L). If duplicate tests were completed on the same day, report the highest positive value.
NOTE: The acceptable range for Chloride values is 1-160 mmol/L. Anyone who has a Chloride value above 160 mmol/L must be re-tested.
SPIROMETRY
The purpose of recording data on spirometry values for the ECFS Patient Registry is to obtain standardised comparable data for comparison with other centres/countries and for use in specific epidemiological studies. Some of the conditions for this (see below) may not be met at every clinic visit for all patients. Therefore, for the purpose of the registry, only the spirometry tests fulfilling the criteria should be recorded/extracted for the ECFS Patient Registry. For all tests the spirometry should be performed according to the common ATS/ERS guidelines: (www.thoracic.org/statements/resources/pfet/PFT2.pdf). Furthermore for the values reported to the registry the following criteria should be met 1. Pre-test:
a. date of birth, gender and height should be recorded for calculation of predicted values b. all recorded spirometry tests should be pre-bronchodilator* values
i. short-acting bronchodilators: at least 4 hours pre-test ii. long-acting bronchodilators: at least 12 hours pre-test
*This was decided according to the PortCF official definitions.
2. Reported values: a. for values reported to national registries or to centres and extracted to the ECFS Patient Registry, the
value in litres of the highest available value of FEV1% of predicted (according to local references) of the year should be extracted
b. each patient's FVC and FEV1 measurement must be reported in litres (L), with up to two places to the right of the decimal
c. the FVC measurement must be greater than or equal to the FEV1 measurement d. for each reported spirometry value, the date of the test and the patient’s height at that date should
be reported in order to perform the calculation of percent of predicted values e. only tests deemed valid according to ATS/ERS guidelines should be reported
3. Calculation of percent of predicted values: A common set of reference values is used: Global Lung Function Initiative equations described by Quanjer PH et al. (Multi-ethnic reference values for spirometry for the 3-95-yr age range: the global lung function 2012 equations. Eur Respir J 2012; 40: 1324–1343).

ECFSPR European Cystic Fibrosis Society Patient Registry
Annual data report (year 2015) version 1.2017
122
In previous reports and presented in Appendix 3 (page 124) of this report, calculations are based on the reference values:
a. for male children 6-17 yrs and female children 6-15 yrs: Wang et al (1993) b. for male adults ≥ 18 yrs and females ≥ 16 yrs: Hankinson et al (1999) c. for children < 6 yrs no calculation of percent of predicted values will be performed because of lack of
valid reference values
The ECFSPR Definition Group considered the issue of race-specific reference values and decided not to do this calculation and not to record race for European patients.
References: a) Miller et al. Standardisation of spirometry. Eur Respir J 2005; 26: 319–338 b) Miller et al. General considerations for lung function testing. Eur Respir J 2005; 26: 153–161 c) Cystic Fibrosis Foundation Patient Registry User’s Guide, Version 4.0. 2006 d) Rosenfeld et al. Task Force to Evaluate Choice of Spirometric Reference Equations for the National Patient Registry: Summary and
Recommendations. Cystic Fibrosis Foundation Registry Committee; 2005 e) Hankinson JL, Odencrantz RJ, Fedan KB. Spirometric reference values from a sample of the general U.S. population. Am J Respr Crit Care
Med 1999;159:179-87 f) Wang X, Dockery DW, Wypij D, Fay ME, Ferris BG. Pulmonary function between 6 and 18 years of age. Pediatr Pulmonol 1993;15:75-88.
NUTRITION
Measurements: weight and height are measured according to EuroCareCF guidelines a. weight: removal of outer clothing, shoes and socks b. height: without shoes and socks - stadiometer - top of head in contact with head board, slight
pressure c. it should be the value at the day of the recorded FEV1 z-scores for height, weight and BMI will be calculated using the CDC reference values [Kuczmarski et al (2002)]
References: a) Kromeyer-Hauschild K, Wabitsch M, Kunze D, Geller F, Geiss HC, Hesse V et al. Percentiles of body mass index in children and
adolescents evaluated from different regional German studies. Monatsschr Kinderheilkd 2001; 149:807-818 b) Lai H-C, Corey M, FitzSimmons S, Kosorok MR, Farrell M. Comparision of growth status of patients with cystic fibrosis between the
United States and Canada. Am J Clin Nutr 1999; 69:531-538 c) Public Use File BGS98, German National Health Interview and Examination Survey 1998, Robert-Koch-Institut, Berlin, Germany, 2000 d) Wiedemann B, Paul KD, Stern M, Wagner TO, Hirche TO, on behalf of the German CFQA Group. Evaluation of body mass index
percentiles for assessment of malnutrition in children with cystic fibrosis. Eur J Clin Nutr 2007; 61, 759-768 e) Kuczmarski RJ, Ogden CL, Guo SS et al. 2000 CDC Growth Charts for the United States: methods and development. Vital Health Stat
2002; 11(246): 1-190.
DEFINITION OF CHRONIC INFECTION IN THE LOWER AIRWAYS
1. Chronic PA infection should be defined by local physician according to modified Leeds criteriaa and/or anti-pseudomonas antibodiesb. Patient should be defined as chronically infected if he/she fulfils the criteria now or has done so in recent years and the physician has no reason to think the status has changed
a. modified Leeds criteria, chronic infection: >50% of the sputum samples, collected during the last 12 months were positive. At least 4 sputum samples during that period
b. and/or significantly raised anti-pseudomonas antibodies according to local laboratories 2. Chronic infection with other gram-negative bacteria should be recorded by the same criteria as above
References: a) Lee TWR, Brownlee KG, Conway SP, Denton M, Littlewood JM. Evaluation of a new definition for chronic Pseudomonas aeruginosa in
cystic fibrosis patients. J Cystic Fibrosis b) Proesmans M, Balinska-Miskiewiscz, Dupont L et al. Evaluating the ”Leeds criteria” for Pseudomonas aeruginosa infection in a cystic
fibrosis centre. Eur Resp J 2006;27:937-943. c) Doring G, Conway SP, Heijerman HG, et al. Antibiotic therapy against Pseudomonas aeruginosa in cystic fibrosis: a European
consensus. Eur Respir J 2000;16:749-767.
ALLERGIC BRONCHOPULMONARY ASPERGILLOSIS (ABPA)
Diagnostic criteria: 1. Acute or subacute clinical deterioration (cough, wheeze, exercise intolerance, exercise-induced asthma,
change in pulmonary function, or increased sputum production) not attributable to another etiology. 2. Total IgE > 500 IU/ml. 3. Positive skin prick test for Aspergillus antigen (> 3 mm) or positive specific IgE for A. fumigatus.
4. Either:

ECFSPR European Cystic Fibrosis Society Patient Registry
Annual data report (year 2015) version 1.2017
123
a. precipitins to A. fumigatus or in vitro demonstration of IgG antibody to A. fumigatus; b. or new or recent abnormalities on chest radiography (infiltrates or mucus plugging) or chest CT
(characteristic changes) that have not cleared with antibiotics and standard physiotherapy.
References: Stevens DA, Moss RB, Kurup VP, Knutsen AP, Greenberger P, Judson MA, Denning DW, Crameri R, Brody AS, Light M, Skov M, Maish W, Mastella G; Participants in the Cystic Fibrosis Foundation Consensus Conference. Allergic bronchopulmonary aspergillosis in cystic fibrosis--state of the art: Cystic Fibrosis Foundation Consensus Conference. Clin Infect Dis. 2003 Oct 1;37 Suppl 3:S225-64.
LIVER DISEASE
We adopt the definitions for Liver Disease used by the UK Registry. These definitions discriminate patients with severe liver disease (with portal hypertension) from milder cases (cirrhosis without portal hypertension).
Cirrhosis with Hypertension: scaring of the liver related to underlying CF, typically in a biliary pattern. Severe liver disease may include portal hypertension and/or hypersplenism.
Cirrhosis without Hypertension: scaring of the liver relating to underlying CF. Liver disease without cirrhosis: this includes fatty liver or viral hepatitis but not biliary cirrhosis.
PANCREATIC STATUS
Definition: Stool fat (van de Kamer) > 4-5 g/d in young children, > 7g/d in children above 10 yrs and adults and/or faecal pancreatic elastase-1 < 200 ug/g. Two determinations are mandatory. Faecal fat excretion values of infants below 3 months are contradictory. Other than pancreatic causes of steatorrhoea must have been excluded. Pancreatic status will be assessed at the registry level, according to the following:
Pancreatic insufficiency Faecal elastase <200 µg/g (twice) and Faecal fat high* (twice)
Pancreatic sufficiency Faecal elastase ≥200 µg/g (twice) and Faecal fat normal* (twice)
*according to definition above
References: a) Sinaasappel M, Stern M, Littlewood J, Wolfe S, Steinkamp G, Heijerman HGM, Robberecht E, Döring G. Nutrition in patients with cystic
fibrosis. A European consensus. J Cystic Fibrosis 2002; 1:51-75. b) Walkowiak J, Nousia-Arvanitakis S, Henker J, Stern M, Sinaasappel M, Dodge JA. Invited review: Indirect pancreatic function tests in
children. J Pediatr Gastroenterol Nutr 2005; 40:107-114.

ECFSPR European Cystic Fibrosis Society Patient Registry
Annual data report (year 2015) version 1.2017
124
Appendix 3: Lung Function In this report we have used the computations based on the Global Lung Function Initiative equations,
described by Quanjer PH et al (see page 42).
In this appendix graphs and tables of lung function are also presented based on the reference populations
and the equations described by Wang et al. for children and Hankinson et al. for adults (see Appendix 1,
page 118, for full reference), used in the reports of 2008 to 2013.
Table 10.1 FEV1% of predicted: descriptive statistics, by country. Patients aged 6-17 years who
have never had a lung transplant.
Country N N Miss Mean
(average FEV1%)
Min 25th pctl
(25% of patients have FEV1% below
this value)
Median
(50% of patients have FEV1% below
this value)
75th pctl
(75% of patients have FEV1% below
this value)
Max
Austria 257 4 93.3 20.2 84.3 97.3 106.4 131.9
Bulgaria 48 2 80.7 30.3 65.3 84.0 98.0 128.5
Czech Republic 211 6 88.5 30.7 78.9 91.8 101.9 139.6
Denmark 138 0 98.2 45.6 90.4 101.5 110.2 129.1
France 2037 112 91.3 15.1 79.9 93.8 104.8 154.5
Germany 1711 30 92.1 20.0 81.1 94.9 105.6 149.6
Greece 194 9 98.2 17.9 89.8 100.3 111.0 138.7
Hungary 212 22 80.6 6.6 68.0 83.3 96.0 148.8
Ireland 364 1 91.7 25.6 80.5 93.2 104.9 136.0
Israel 183 1 93.9 30.0 85.2 97.3 105.5 134.4
Italy 1302 89 93.7 17.1 82.0 96.8 107.9 182.7
Latvia 17 0 95.3 65.0 84.9 95.1 109.7 121.6
Luxembourg 6 0 89.1 55.5 80.7 89.4 104.8 114.7
Rep of Macedonia 48 2 92.8 34.4 80.7 96.1 109.6 134.3
Rep of Moldova 17 0 87.8 52.1 70.2 86.5 104.3 128.3
The Netherlands 414 4 92.4 29.2 81.0 95.3 105.0 131.1
Portugal 104 8 87.4 22.2 68.7 91.4 106.8 130.8
Romania 26 0 97.0 75.0 87.1 98.1 105.3 115.8
Russian Federation 746 382 85.9 7.7 69.9 86.9 102.8 198.7
Serbia 74 1 85.1 29.9 74.2 88.9 98.7 141.2
Slovak Republic 69 1 83.9 31.7 73.4 88.2 96.9 110.2
Slovenia 38 0 84.5 39.5 74.1 90.5 100.8 112.0
Spain 594 14 92.0 22.7 80.5 95.0 105.8 141.6
Sweden1 176 5 96.0 23.1 86.6 97.4 109.0 139.5
Switzerland 236 5 91.5 36.5 80.7 92.9 105.1 131.3
Turkey 26 0 84.0 30.9 79.5 89.8 97.6 108.2
Ukraine 65 4 88.6 32.7 79.1 92.1 101.5 132.8
United Kingdom2 2267 563 90.1 24.4 80.9 91.6 101.3 159.8
1 Sweden reports FEV1 collected at the time of the annual review. 2 United Kingdom reports FEV1 collected at the time of the annual review. All analyses of FEV1 in the UK 2015 annual
report are restricted to those patients for whom prior annual surveys showed no prior lung transplants. Note: Lithuania has 0% coverage for children.

ECFSPR European Cystic Fibrosis Society Patient Registry
Annual data report (year 2015) version 1.2017
125
Table 10.1 shows some descriptive statistics for FEV1 in children, expressed as % of predicted. Note that
patients who have had a lung transplant and children below 6 years of age have been excluded from the
analyses.
Figure 10.1 FEV1% of predicted: box-plot, by country and overall. Patients aged 6-17 years who have
never had a lung transplant.
Note: Sweden reports FEV1 collected at the time of the annual review. United Kingdom reports FEV1 collected at the time of the annual review. All analyses of FEV1 in the UK 2015 annual report are restricted to those patients for whom prior annual surveys showed no prior lung transplants.
Note: Lithuania has 0% coverage for children.
This box-plot is a graphic representation of the FEV1 in children, expressed as % of predicted detailed in
table 10.1. For each country the dash (black line crossing the blue box) is the median, the black dot is the
mean and the whiskers (vertical lines with a T-shaped end) are the minimum and the maximum.
0
20
40
60
80
100
120
140
160
180
200
HU BG MD RU SK RS LU TR SI PT UK CZ UA CH IE FR DE ES LV NL MK IT AT IL SE RO GR DK
FEV1%

ECFSPR European Cystic Fibrosis Society Patient Registry
Annual data report (year 2015) version 1.2017
126
Table 10.2 FEV1% of predicted: descriptive statistics, by country. Patients aged 18 years or older who
have never had a lung transplant.
Country N N Miss Mean
(average FEV1%)
Min 25th pctl
(25% of patients have FEV1% below
this value)
Median
(50% of patients have FEV1% below
this value)
75th pctl
(75% of patients have FEV1% below
this value)
Max
Austria 286 1 71.7 12.6 53.3 73.8 89.0 124.8
Bulgaria 51 0 53.1 14.7 37.9 46.9 72.5 100.1
Czech Republic 197 8 67.4 9.1 49.7 68.8 87.0 121.0
Denmark 225 1 72.7 15.3 54.9 75.5 91.0 131.2
France 2650 43 65.7 3.7 46.4 66.1 84.2 137.1
Germany 2599 92 63.9 11.3 43.5 62.8 82.7 145.9
Greece 216 5 65.9 18.4 43.1 68.1 89.6 125.1
Hungary 154 13 60.9 17.8 38.0 60.9 84.3 113.3
Ireland 453 0 64.5 13.8 46.3 65.7 82.8 124.5
Israel 293 0 69.7 19.6 53.5 71.4 86.4 124.5
Italy 2345 138 70.6 14.0 50.6 71.0 91.4 154.5
Latvia 6 1 43.8 21.1 29.6 33.7 50.5 94.1
Lithuania 11 0 69.4 25.3 45.1 77.2 88.9 124.2
Luxembourg 13 0 71.1 29.6 44.6 78.3 93.2 120.3
Rep of Macedonia 28 0 75.2 28.4 57.8 74.1 97.2 114.7
Rep of Moldova 7 0 67.9 17.5 43.5 80.0 96.6 103.7
The Netherlands 656 11 66.9 16.2 49.5 66.2 84.5 126.2
Portugal 94 1 66.5 22.9 49.4 66.7 79.9 137.3
Russian Federation 459 128 57.6 12.2 38.8 54.3 76.5 141.1
Serbia 41 0 56.6 19.6 44.4 53.7 68.6 95.6
Slovak Republic 91 0 64.5 12.7 44.6 68.5 82.6 112.0
Slovenia 27 1 57.4 19.9 37.6 59.1 71.3 106.9
Spain 587 11 67.9 15.9 50.2 68.2 86.6 128.8
Sweden1 305 16 72.6 21.7 56.0 72.9 91.7 132.3
Switzerland 384 2 64.9 14.5 47.8 62.9 82.3 122.5
Turkey 5 0 57.2 22.5 53.5 58.8 68.4 83.0
Ukraine 13 1 62.8 19.2 39.0 73.3 84.7 100.2
United Kingdom2 3723 1201 67.7 9.8 49.3 68.4 85.9 146.7
1 Sweden reports FEV1 collected at the time of the annual review. 2 United Kingdom reports FEV1 collected at the time of the annual review. All analyses of FEV1 in the UK 2015 annual
report are restricted to those patients for whom prior annual surveys showed no prior lung transplants. Note: Romania has 0% coverage for adults.
This table shows some descriptive statistics for FEV1 in adults, expressed as % of predicted. Note that
patients who have had a lung transplantation have been excluded from the analyses.

ECFSPR European Cystic Fibrosis Society Patient Registry
Annual data report (year 2015) version 1.2017
127
Figure 10.2 FEV1% of predicted: box-plot, by country and overall. Patients aged 18 years or older who
have never had a lung transplant.
Note: Sweden reports FEV1 collected at the time of the annual review. United Kingdom reports FEV1 collected at the time of the annual review. All analyses of FEV1 in the UK 2015 annual report are restricted to those patients for whom prior annual surveys showed no prior lung transplants.
Note: Romania has 0% coverage for adults.
This box-plot is a graphic representation of the FEV1 in adults, expressed as % of predicted detailed in table
10.2. For each country the dash (black line crossing the blue box) is the median, the black dot is the mean
and the whiskers (vertical lines with a T-shaped end) are the minimum and the maximum.
0
20
40
60
80
100
120
140
160
LV BG RS RU TR SI HU DE CH IE FR NL PT GR ES UK SK CZ IT IL SE UA AT MK DK LT LU MD
FEV1%

ECFSPR European Cystic Fibrosis Society Patient Registry
Annual data report (year 2015) version 1.2017
128
Figure 10.3 Median FEV1% of predicted by age group and by country. Patients aged 6 years or older who
have never had a lung transplant.
Note: We excluded from the analyses those age groups wherein the number of patients was <10. Note: Not all the countries reported the best FEV1 value of the year (see tables 4.1 and 4.2).
This graph shows the median FEV1% (the value that separates the highest and lowest half of the patients)
by age group. Each country is represented by a dot (in blue) and the overall estimate is in red. The general
pattern shows that the FEV1% slowly decreases until the age of 30-34, and then levels out. The patients in
the oldest age groups are patients who survived, and may therefore represent the patients with less
disease severity. There is considerable variability between countries.
Table 10.3 FEV1% of predicted: descriptive statistics by age group (patients aged 6 years or older) who
have never had a lung transplant.
Age at FEV1 measurement
N N Miss Mean
Min 25th pctl
Median
75th pctl
Max
6-9 3932 557 96.6 6.6 87.1 97.8 107.3 198.7
10-14 4782 455 92.0 19.2 81.3 94.4 104.9 156.7
15-19 4629 427 79.0 3.7 64.4 81.5 94.9 164.6
20-24 4002 391 71.2 9.9 53.9 73.1 89.6 146.7
25-29 3340 349 66.6 12.5 47.5 67.0 84.7 145.6
30-34 2373 253 62.4 9.8 42.7 60.3 80.9 141.8
35-39 1660 165 61.9 9.1 43.1 61.1 79.0 154.5
40-44 1125 118 62.7 13.5 42.9 60.5 80.9 130.4
45+ 1656 224 62.6 13.7 42.5 59.5 81.1 137.3
Note: Not every country reported the best FEV1 value of the year (see tables 4.1 and 4.2).
This table shows FEV1% by age group for the total data set. The median values reported in this table are
shown as red dots in fig 10.3.
30
40
50
60
70
80
90
100
110
6-9 10-14 15-19 20-24 25-29 30-34 35-39 40-44 45+
FEV1%
age

ECFSPR European Cystic Fibrosis Society Patient Registry
Annual data report (year 2015) version 1.2017
129
Figure 10.4 Quartiles of FEV1% of predicted by age group and by country. Patients aged 6 years or
older and who have never had a lung transplant.
The figures below show the FEV1% in different age groups, separately for each country. The dot shows the
median, and the whiskers show the 25th and 75th percentiles (the median, the 25th percentile and the 75th
percentile are collectively named “quartiles”). In blue are the quartiles for the country, in red are the
pooled quartiles computed on all other countries (i.e. excluding that country). We did not compute
quartiles where the number of patients is <10 in an age group, so there are no blue dots for those age
groups (the number of patients in each age group is shown below the horizontal axis). We therefore
excluded Latvia, Lithuania and Luxembourg from the graphs because none of the age groups had more
than 10 patients.
Quartiles of FEV1%: Austria Quartiles of FEV1%: Bulgaria
Quartiles of FEV1%: Czech Republic Quartiles of FEV1%: Denmark
Quartiles of FEV1%: France Quartiles of FEV1%: Germany
Quartiles of FEV1%: Greece Quartiles of FEV1%: Hungary
20
40
60
80
100
120
agen
6-993
10-1496
15-19111
20-2483
25-2964
30-3445
35-3922
40-4411
45+18
FEV1%
20
40
60
80
100
120
age
n
6-9
14
10-14
18
15-19
21
20-24
17
25-29
15
30-34
7
35-39
4
40-44
2
45+
1
FEV1%
20
40
60
80
100
120
age
n
6-9
69
10-14
80
15-19
94
20-24
63
25-29
44
30-34
27
35-39
19
40-44
9
45+
3
FEV1%
20
40
60
80
100
120
age
n
6-9
43
10-14
58
15-19
61
20-24
55
25-29
48
30-34
26
35-39
28
40-44
22
45+
22
FEV1%
20
40
60
80
100
120
age
n
6-9
686
10-14
845
15-19
805
20-24
666
25-29
596
30-34
391
35-39
260
40-44
168
45+
270
FEV1%
20
40
60
80
100
120
age
n
6-9
566
10-14
677
15-19
741
20-24
608
25-29
568
30-34
405
35-39
272
40-44
187
45+
286
FEV1%
20
40
60
80
100
120
age
n
6-9
66
10-14
85
15-19
79
20-24
67
25-29
42
30-34
27
35-39
22
40-44
11
45+
11
FEV1%
20
40
60
80
100
120
age
n
6-9
57
10-14
106
15-19
76
20-24
57
25-29
35
30-34
15
35-39
12
40-44
4
45+
4
FEV1%

ECFSPR European Cystic Fibrosis Society Patient Registry
Annual data report (year 2015) version 1.2017
130
[figure 10.4 continued]
Quartiles of FEV1%: Ireland Quartiles of FEV1%: Israel
Quartiles of FEV1%: Italy Quartiles of FEV1%: Rep of Macedonia
Quartiles of FEV1%: The Netherlands Quartiles of FEV1%: Portugal
Quartiles of FEV1%: Romania Quartiles of FEV1%: Russian Federation
Quartiles of FEV1%: Serbia Quartiles of FEV1%: Slovak Republic
20
40
60
80
100
120
age
n
6-9
130
10-14
138
15-19
147
20-24
108
25-29
114
30-34
79
35-39
47
40-44
23
45+
31
FEV1%
20
40
60
80
100
120
age
n
6-9
62
10-14
76
15-19
75
20-24
83
25-29
54
30-34
49
35-39
33
40-44
19
45+
25
FEV1%
20
40
60
80
100
120
age
n
6-9
392
10-14
576
15-19
539
20-24
492
25-29
406
30-34
362
35-39
285
40-44
261
45+
334
FEV1%
20
40
60
80
100
120
age
n
6-9
14
10-14
24
15-19
17
20-24
9
25-29
9
30-34
2
35-39
1
40-44
0
45+
0
FEV1%
20
40
60
80
100
120
age
n
6-9
136
10-14
153
15-19
185
20-24
169
25-29
123
30-34
82
35-39
70
40-44
55
45+
97
FEV1%
20
40
60
80
100
120
age
n
6-9
35
10-14
44
15-19
41
20-24
22
25-29
24
30-34
4
35-39
12
40-44
11
45+
5
FEV1%
20
40
60
80
100
120
age
n
6-9
12
10-14
8
15-19
6
20-24
0
25-29
0
30-34
0
35-39
0
40-44
0
45+
0
FEV1%
20
40
60
80
100
120
age
n
6-9
294
10-14
306
15-19
220
20-24
165
25-29
136
30-34
45
35-39
23
40-44
3
45+
13
FEV1%
20
40
60
80
100
120
age
n
6-9
24
10-14
41
15-19
17
20-24
11
25-29
12
30-34
4
35-39
4
40-44
2
45+
0
FEV1%
20
40
60
80
100
120
age
n
6-9
21
10-14
26
15-19
27
20-24
28
25-29
18
30-34
18
35-39
10
40-44
6
45+
6
FEV1%

ECFSPR European Cystic Fibrosis Society Patient Registry
Annual data report (year 2015) version 1.2017
131
[figure 10.4 continued]
Quartiles of FEV1%: Slovenia Quartiles of FEV1%: Spain
Quartiles of FEV1%: Sweden1 Quartiles of FEV1%: Switzerland
Quartiles of FEV1%: Turkey Quartiles of FEV1%: Ukraine
Quartiles of FEV1%: United Kingdom2
1 Sweden reports FEV1 collected at the time of the annual review. 2 United Kingdom reports FEV1 collected at the time of the annual review. All analyses of FEV1 in the UK 2015 annual
report are restricted to those patients for whom prior annual surveys showed no prior lung transplants.
20
40
60
80
100
120
age
n
6-9
10
10-14
17
15-19
16
20-24
12
25-29
3
30-34
1
35-39
3
40-44
1
45+
2
FEV1%
20
40
60
80
100
120
age
n
6-9
213
10-14
242
15-19
220
20-24
146
25-29
98
30-34
84
35-39
82
40-44
41
45+
55
FEV1%
20
40
60
80
100
120
age
n
6-9
63
10-14
75
15-19
66
20-24
75
25-29
50
30-34
49
35-39
31
40-44
31
45+
41
FEV1%
20
40
60
80
100
120
age
n6-9
8310-14
9515-19
9820-24
11225-29
6630-34
5135-39
4940-44
2545+
41
FEV1%
20
40
60
80
100
120
age
n
6-9
13
10-14
10
15-19
6
20-24
1
25-29
1
30-34
0
35-39
0
40-44
0
45+
0
FEV1%
20
40
60
80
100
120
age
n
6-9
18
10-14
35
15-19
18
20-24
5
25-29
2
30-34
0
35-39
0
40-44
0
45+
0
FEV1%
20
40
60
80
100
120
age
n
6-9
800
10-14
939
15-19
927
20-24
935
25-29
802
30-34
594
35-39
370
40-44
233
45+
390
FEV1%

ECFSPR European Cystic Fibrosis Society Patient Registry
Annual data report (year 2015) version 1.2017
132
Figure 10.5 FEV1% of predicted according to severity group and age group, by country and overall.
Patients aged 6-17 years who have never had a lung transplant.
Note: Not every country reported the best FEV1 value of the year: Sweden reports FEV1 collected at the time of the annual review; United Kingdom reports FEV1 collected at the time of the annual review. All analyses of FEV1 in the UK 2015 annual report are restricted to those patients for whom prior annual surveys showed no prior lung transplants.
Note: Lithuania has 0% coverage for children.
Figures 10.5, 10.6 and 10.7 show the FEV1% by severity group, by country and overall. Patients with a
FEV1% higher than 80% are generally considered to have mild lung disease, patients with FEV1% between
80% and 40% moderate lung disease, and patients with FEV1 <40% severe lung disease. However, since a
10 year old child with a lung function of 50% has considerably worse lung disease than a 50 year old patient
with the same FEV1%, and the age distribution is not the same in all countries, we have chosen to present
children (fig 10.5) and adults (fig 10.6 and 10.7) separately.
0
10
20
30
40
50
60
70
80
90
100
RO LV DK LU MD SE UK IE CH FR NL IT UA IL DE CZ GR ES SI SK AT MK PT RS RU HU TR BG Totale
% o
f p
atie
nts
FEV1<40% FEV1 40-80% FEV1>80%
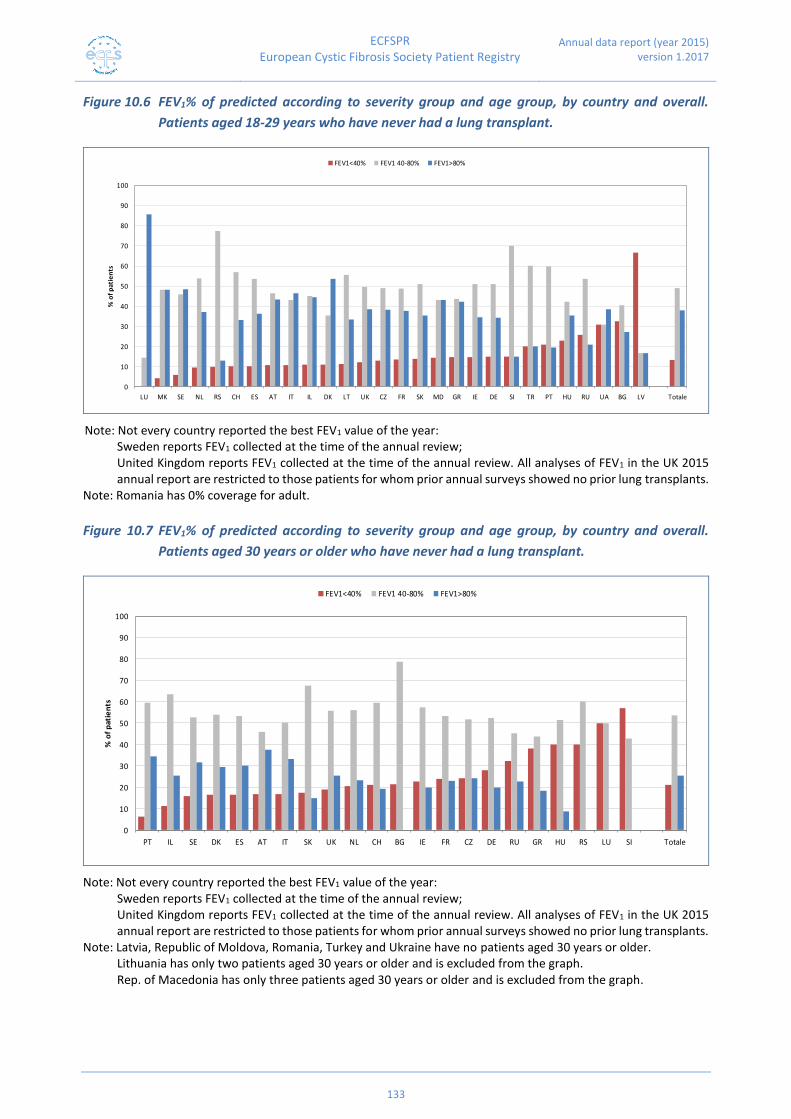
ECFSPR European Cystic Fibrosis Society Patient Registry
Annual data report (year 2015) version 1.2017
133
Figure 10.6 FEV1% of predicted according to severity group and age group, by country and overall.
Patients aged 18-29 years who have never had a lung transplant.
Note: Not every country reported the best FEV1 value of the year: Sweden reports FEV1 collected at the time of the annual review; United Kingdom reports FEV1 collected at the time of the annual review. All analyses of FEV1 in the UK 2015 annual report are restricted to those patients for whom prior annual surveys showed no prior lung transplants.
Note: Romania has 0% coverage for adult.
Figure 10.7 FEV1% of predicted according to severity group and age group, by country and overall.
Patients aged 30 years or older who have never had a lung transplant.
Note: Not every country reported the best FEV1 value of the year:
Sweden reports FEV1 collected at the time of the annual review; United Kingdom reports FEV1 collected at the time of the annual review. All analyses of FEV1 in the UK 2015 annual report are restricted to those patients for whom prior annual surveys showed no prior lung transplants.
Note: Latvia, Republic of Moldova, Romania, Turkey and Ukraine have no patients aged 30 years or older. Lithuania has only two patients aged 30 years or older and is excluded from the graph. Rep. of Macedonia has only three patients aged 30 years or older and is excluded from the graph.
0
10
20
30
40
50
60
70
80
90
100
LU MK SE NL RS CH ES AT IT IL DK LT UK CZ FR SK MD GR IE DE SI TR PT HU RU UA BG LV Totale
% o
f p
atie
nts
FEV1<40% FEV1 40-80% FEV1>80%
0
10
20
30
40
50
60
70
80
90
100
PT IL SE DK ES AT IT SK UK NL CH BG IE FR CZ DE RU GR HU RS LU SI Totale
% o
f p
atie
nts
FEV1<40% FEV1 40-80% FEV1>80%