Embed Size (px)
Citation preview
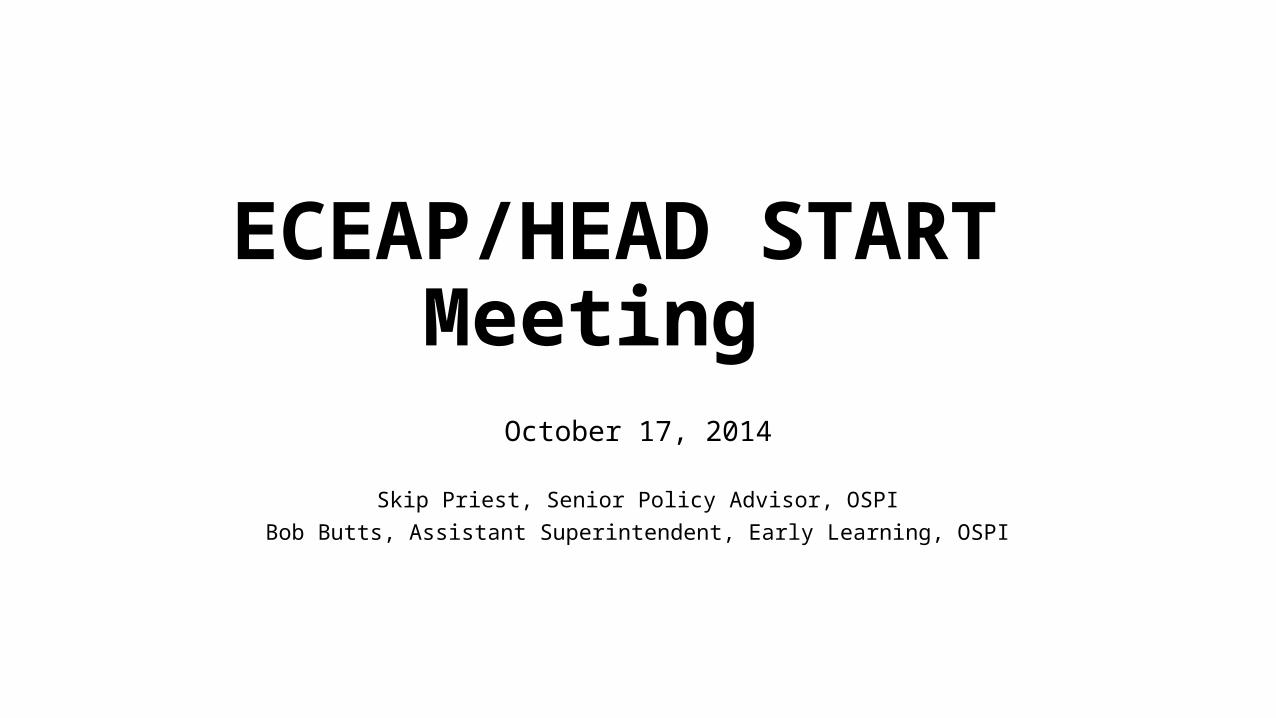
ECEAP/HEAD START Meeting
October 17, 2014
Skip Priest, Senior Policy Advisor, OSPIBob Butts, Assistant Superintendent, Early Learning, OSPI
Education is the most powerful weapon which you can use to change the world.
~ Nelson Mandela
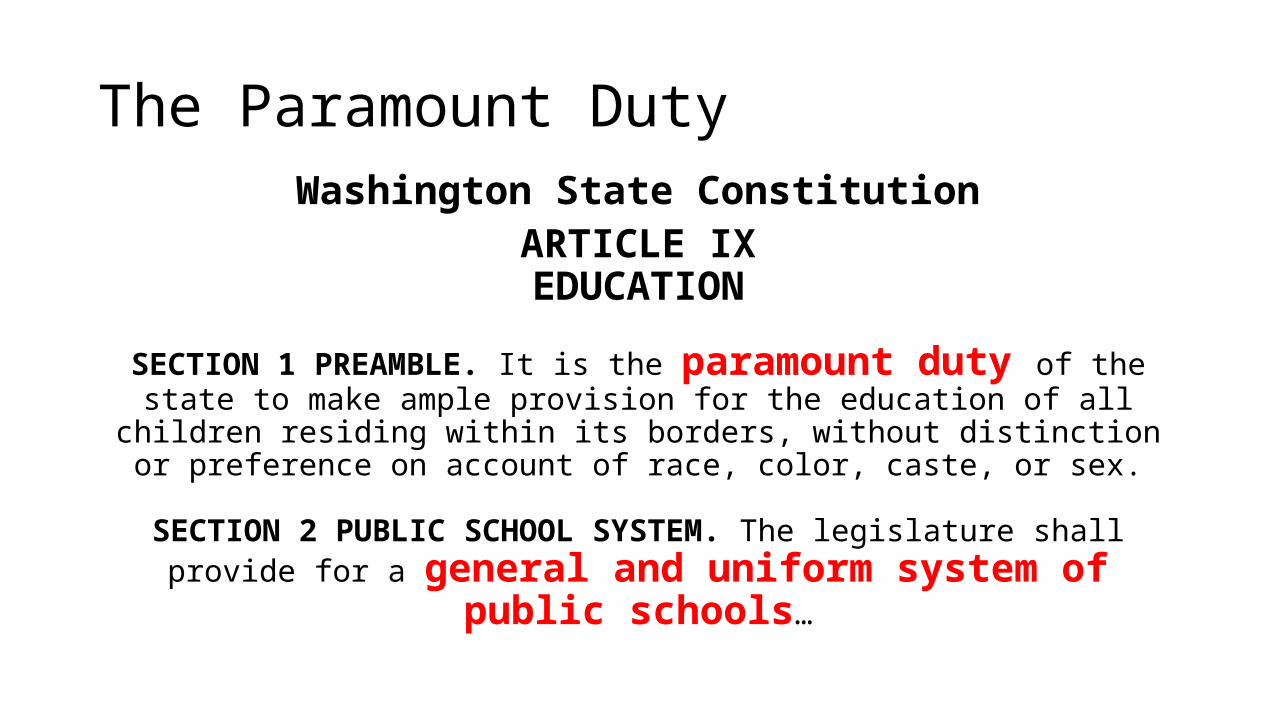
The Paramount DutyWashington State Constitution
ARTICLE IXEDUCATION
SECTION 1 PREAMBLE. It is the paramount duty of the state to make ample provision for the education of all children residing within
its borders, without distinction or preference on account of race, color, caste, or sex.
SECTION 2 PUBLIC SCHOOL SYSTEM. The legislature shall provide for a general and uniform system of public schools…
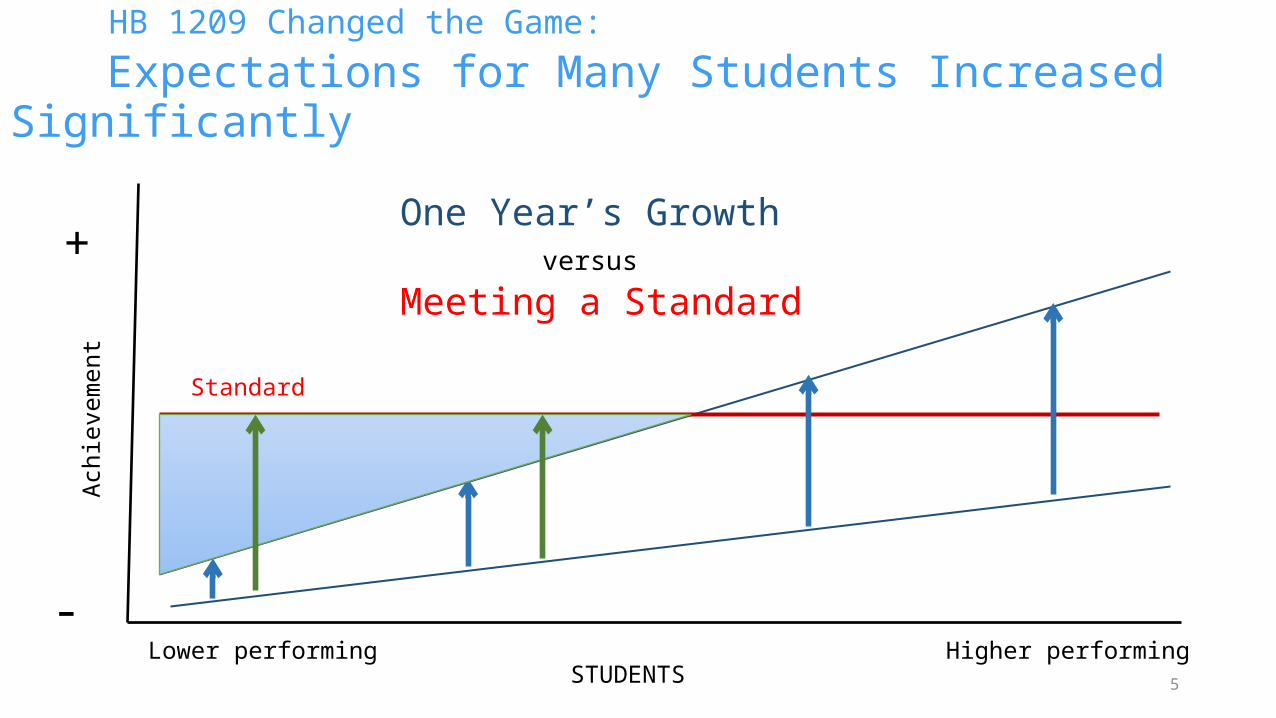
HB 1209 Changed the Game:
Expectations for Many Students Increased Significantly
One Year’s Growth versus
Meeting a Standard
Ach
ievem
ent
+
-Lower performing Higher performing
STUDENTS
Standard
5
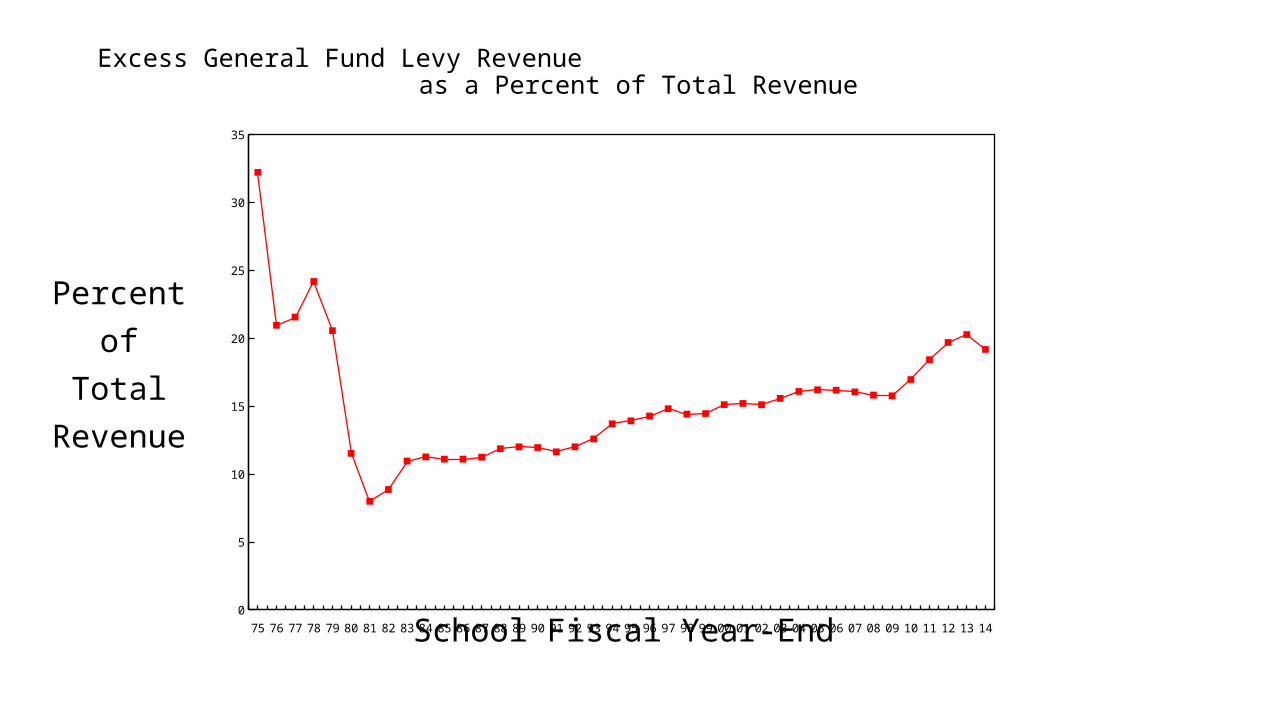
75 76 77 78 79 80 81 82 83 84 85 86 87 88 89 90 91 92 93 94 95 96 97 98 99 00 01 02 03 04 05 06 07 08 09 10 11 12 13 140
5
10
15
20
25
30
35
Excess General Fund Levy Revenueas a Percent of Total Revenue
Percentof
TotalRevenue
School Fiscal Year-End
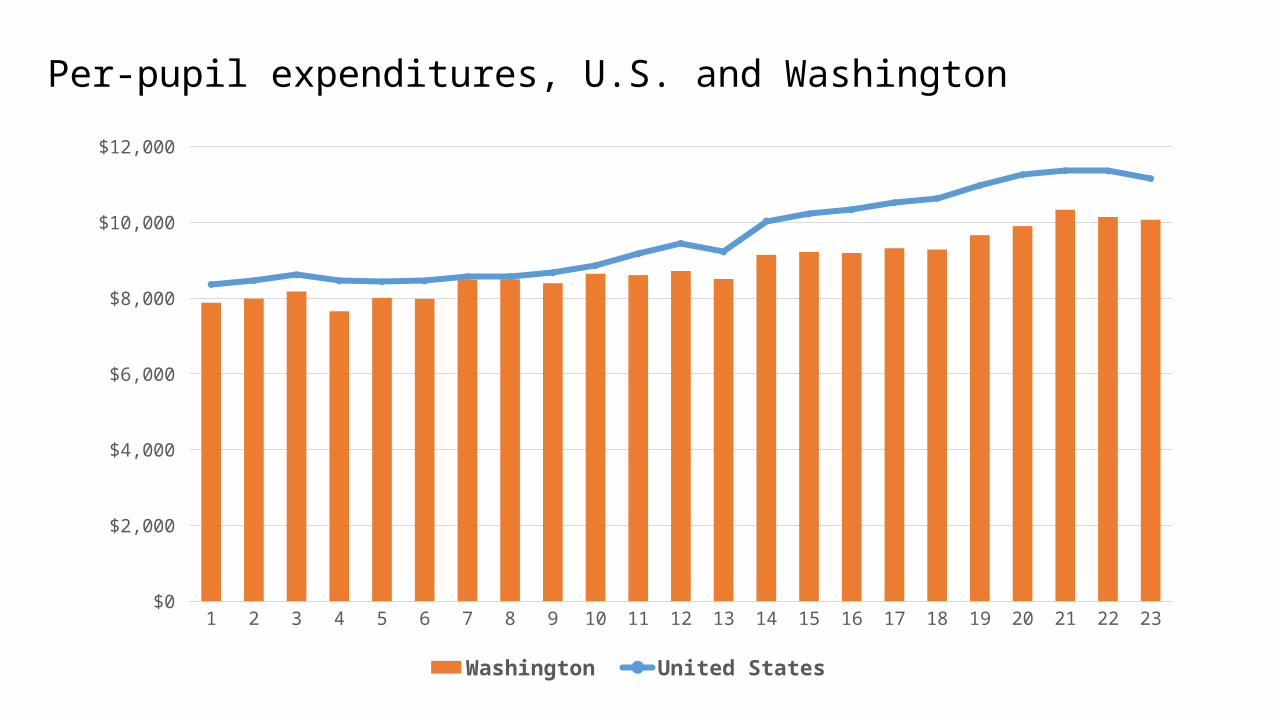
Per-pupil expenditures, U.S. and Washington
1 2 3 4 5 6 7 8 9 10 11 12 13 14 15 16 17 18 19 20 21 22 23$0
$2,000
$4,000
$6,000
$8,000
$10,000
$12,000
Washington United States
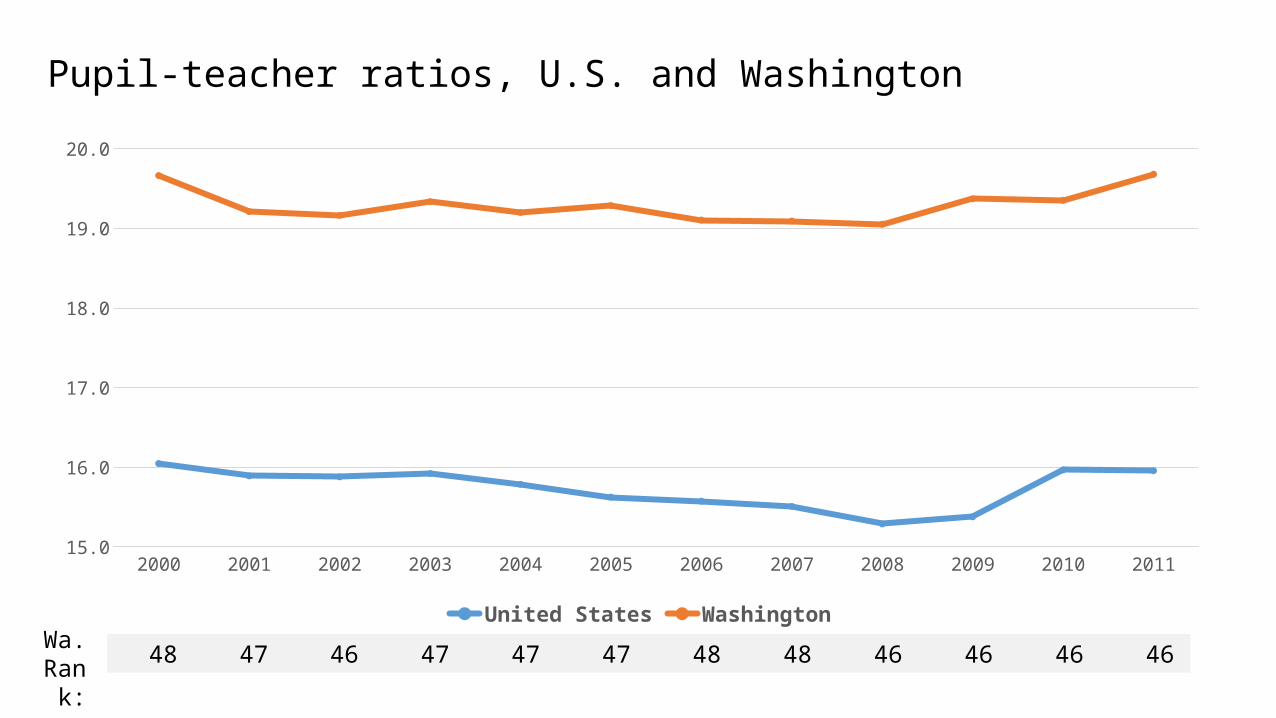
Pupil-teacher ratios, U.S. and Washington
2000 2001 2002 2003 2004 2005 2006 2007 2008 2009 2010 201115.0
16.0
17.0
18.0
19.0
20.0
United States WashingtonWa.
Rank: 48 47 46 47 47 47 48 48 46 46 46 46
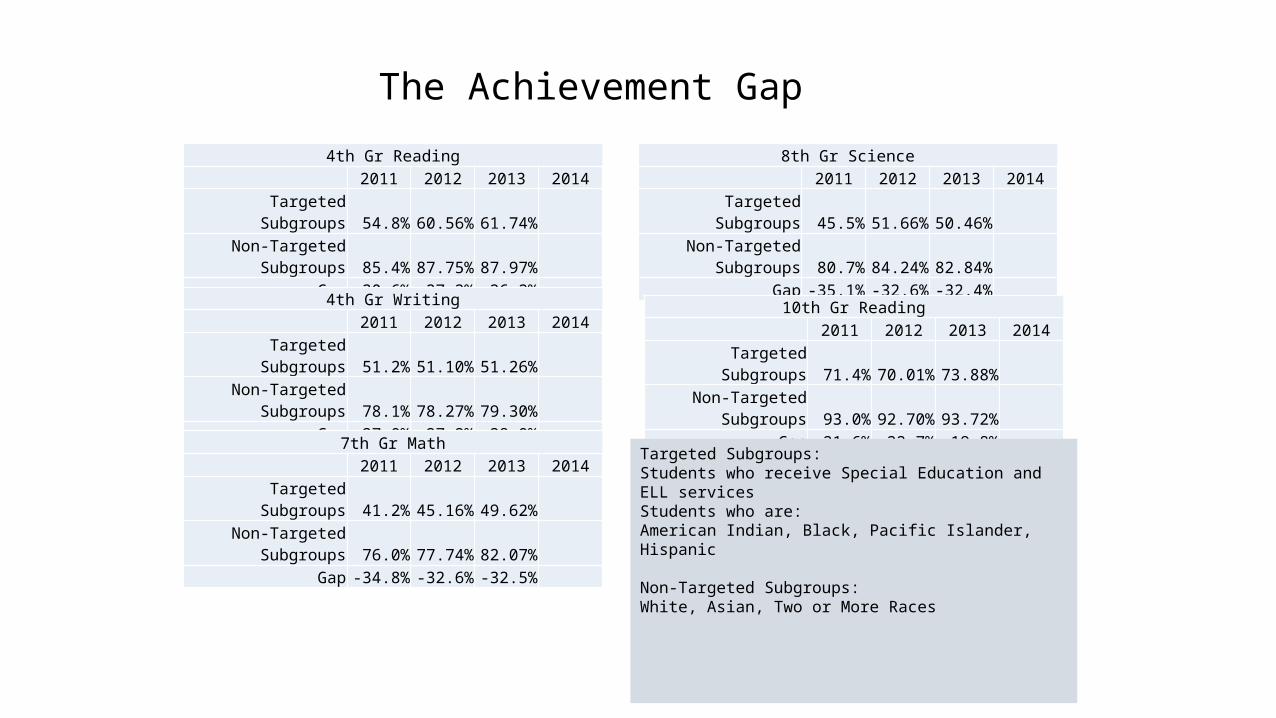
The Achievement Gap
4th Gr Reading 2011 2012 2013 2014
Targeted Subgroups 54.8% 60.56% 61.74% Non-Targeted Subgroups 85.4% 87.75% 87.97%
Gap -30.6% -27.2% -26.2%
4th Gr Writing 2011 2012 2013 2014
Targeted Subgroups 51.2% 51.10% 51.26% Non-Targeted Subgroups 78.1% 78.27% 79.30%
Gap -27.0% -27.2% -28.0%
7th Gr Math 2011 2012 2013 2014
Targeted Subgroups 41.2% 45.16% 49.62% Non-Targeted Subgroups 76.0% 77.74% 82.07%
Gap -34.8% -32.6% -32.5%
8th Gr Science 2011 2012 2013 2014
Targeted Subgroups 45.5% 51.66% 50.46% Non-Targeted Subgroups 80.7% 84.24% 82.84%
Gap -35.1% -32.6% -32.4%
10th Gr Reading 2011 2012 2013 2014
Targeted Subgroups 71.4% 70.01% 73.88% Non-Targeted Subgroups 93.0% 92.70% 93.72%
Gap -21.6% -22.7% -19.8%
Targeted Subgroups:Students who receive Special Education and ELL servicesStudents who are:American Indian, Black, Pacific Islander, Hispanic
Non-Targeted Subgroups:White, Asian, Two or More Races
10
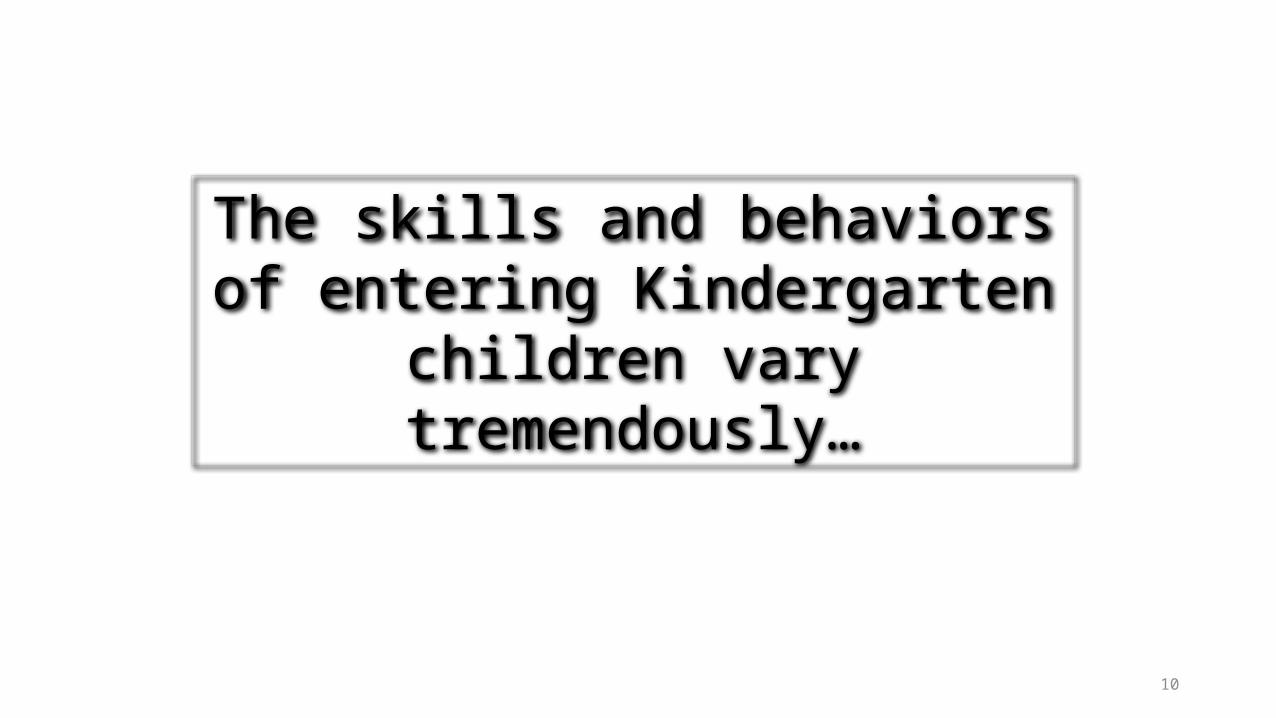
The skills and behaviors of entering Kindergarten children vary
tremendously…
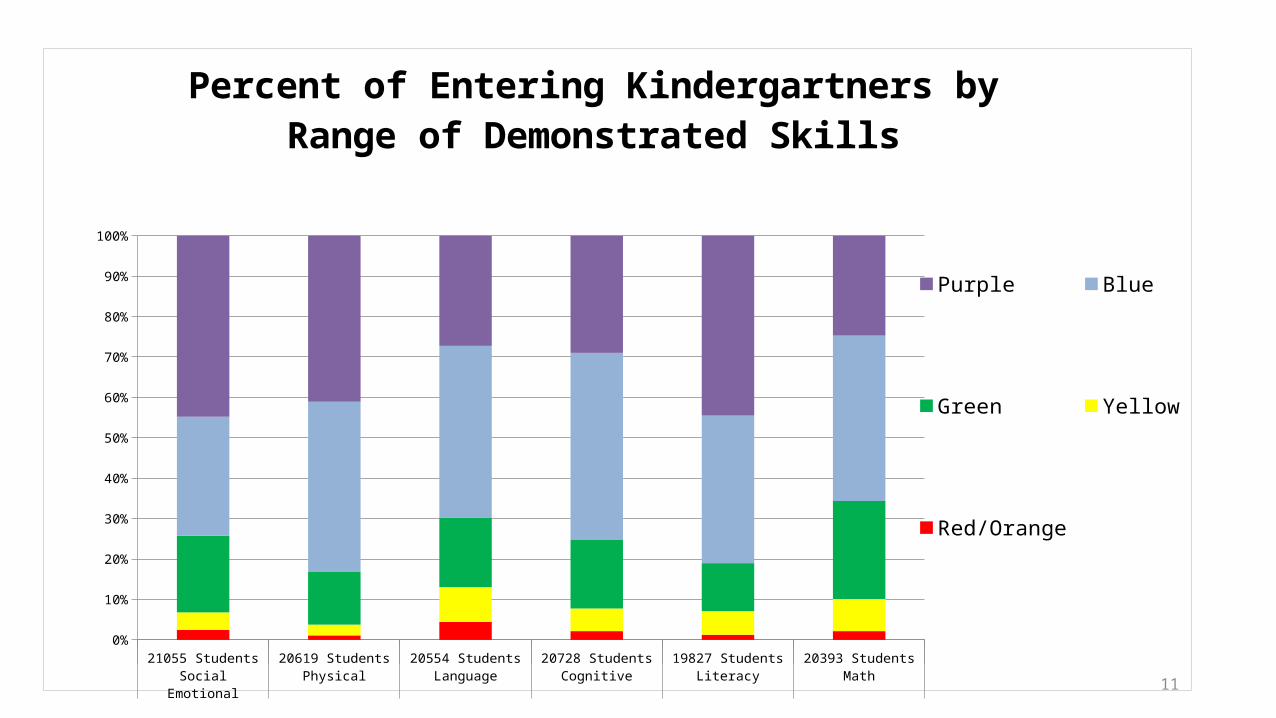
1121055 Students 20619 Students 20554 Students 20728 Students 19827 Students 20393 StudentsSocial Emotional Physical Language Cognitive Literacy Math
0%
10%
20%
30%
40%
50%
60%
70%
80%
90%
100%
Percent of Entering Kindergartners by Range of Demonstrated Skills
Purple Blue Green
Yellow Red/Orange
12
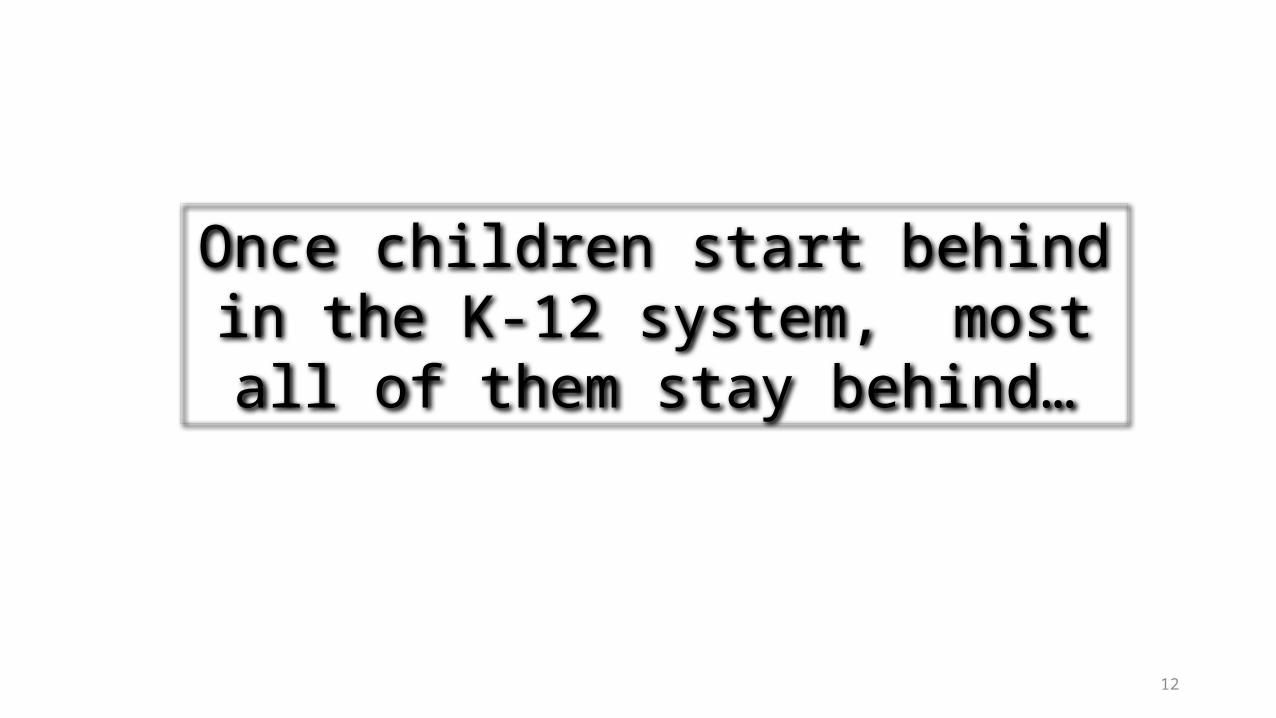
Once children start behind in the K-12 system, most all of them stay behind…
13
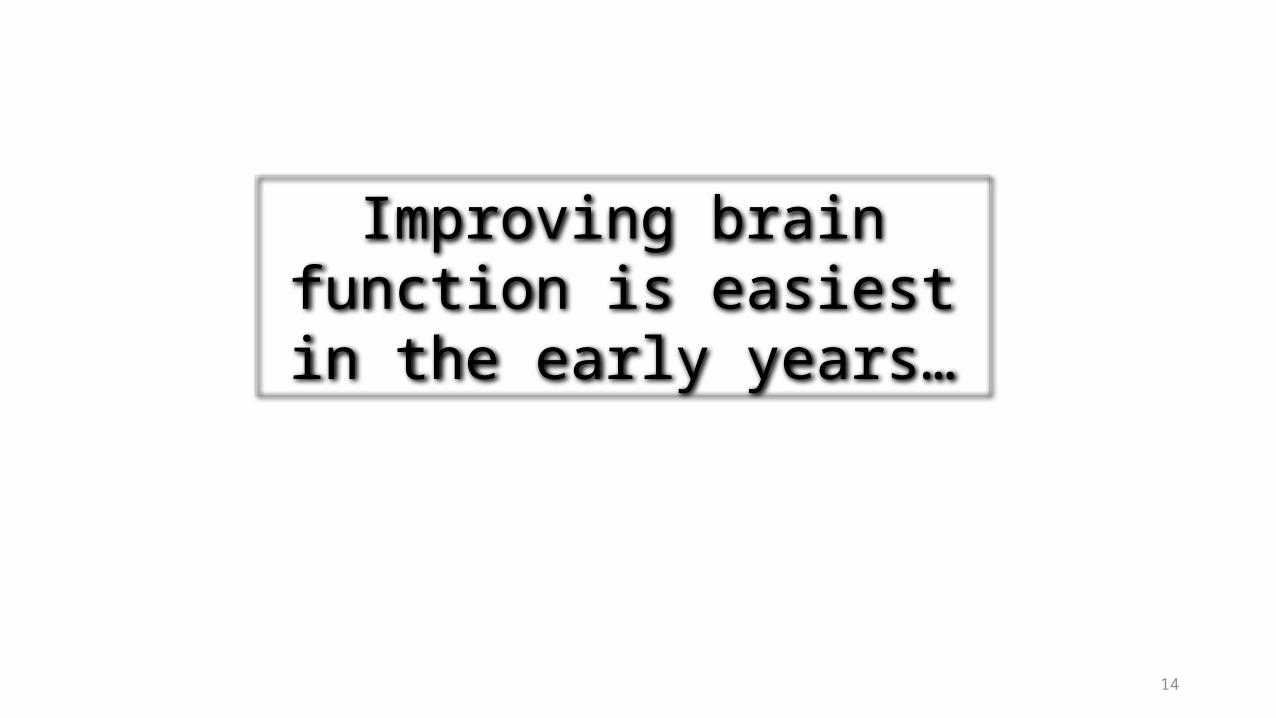
14
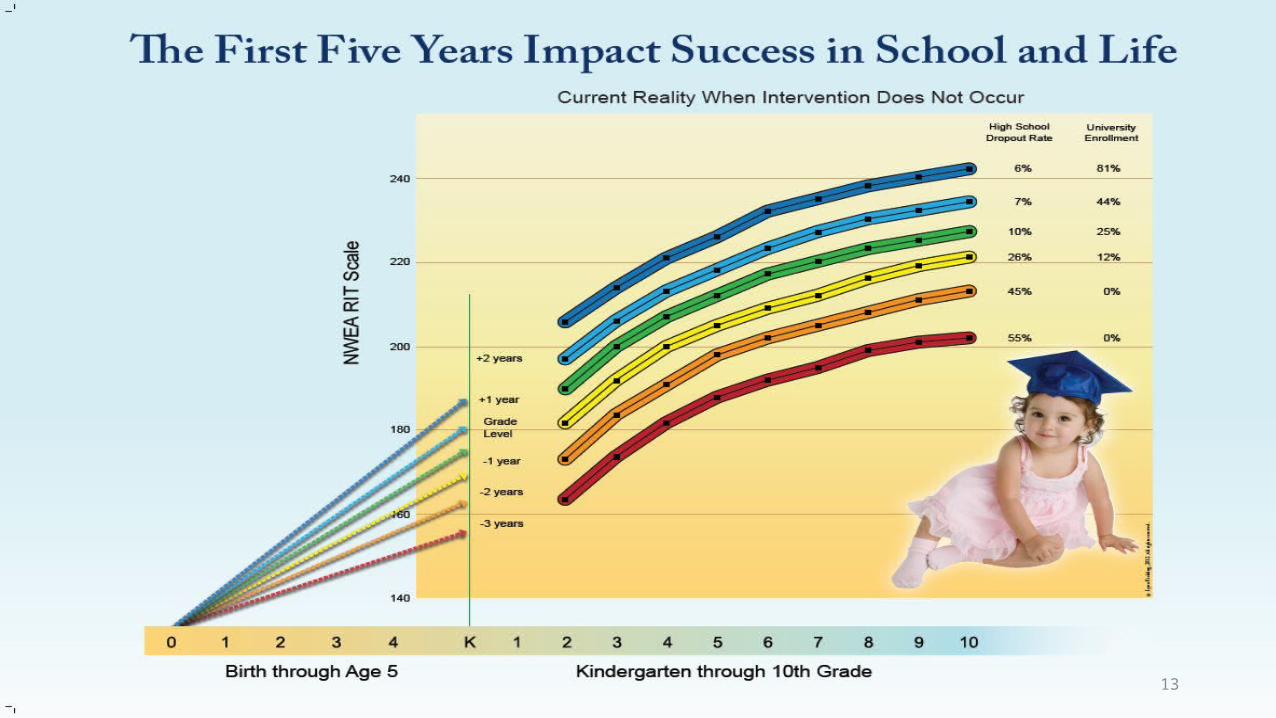
Improving brain function is easiest in the early years…
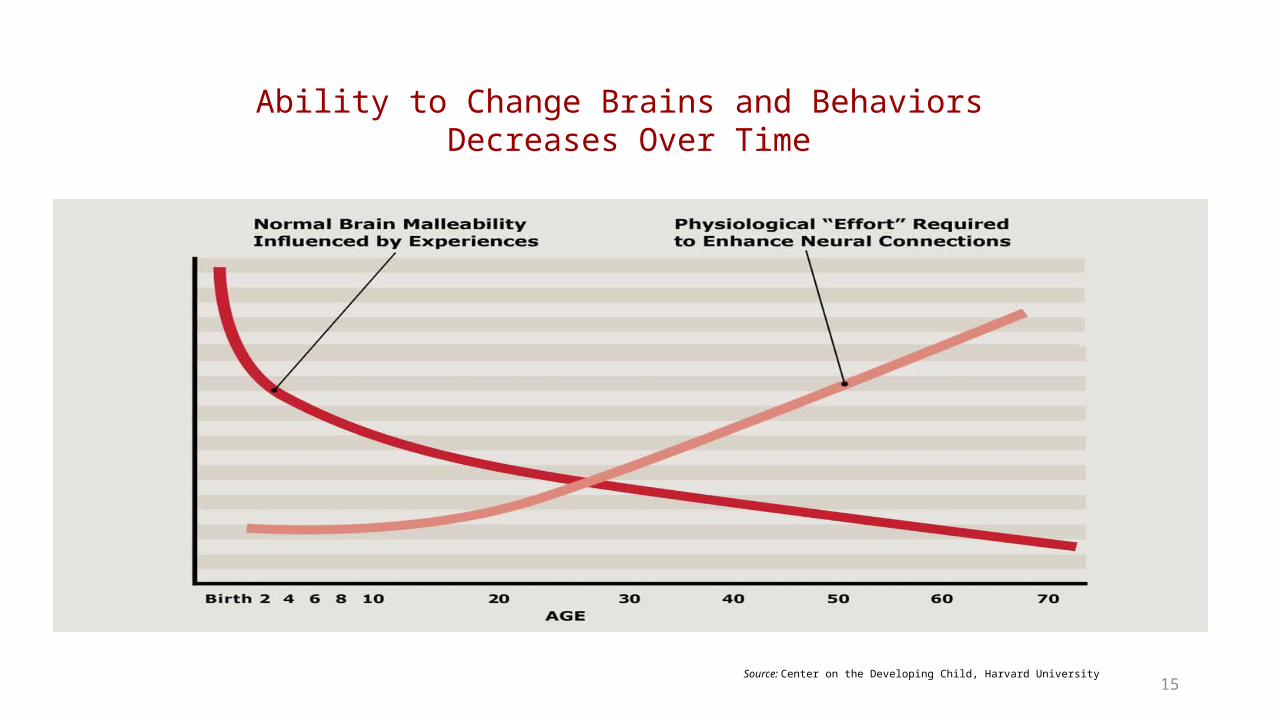
15
Ability to Change Brains and Behaviors Decreases Over Time
Source: Center on the Developing Child, Harvard University
•In light of what you just heard, what actions should Early Learning
Advocates take this session to increase opportunities for children
birth through 3rd grade???