Embed Size (px)
Citation preview

ECE680: Physical VLSI DesignECE680: Physical VLSI DesignECE680: Physical VLSI DesignECE680: Physical VLSI DesignLecturer: Qiliang LiLecturer: Qiliang LiTextBook:
Di it l I t t d Ci it A D i P tiDigital Integrated Circuit: A Design Perspective2nd Ed. By Rabaey, Chandrakasan and Nikolic
Prerequisites:Prerequisites: ECE586 Digital Integrated Circuit Analysis and Design.
Knowledge of MOSFET and CMOS inverter is required.
(Significant material is from the notes of Rabaey, Chandrakasan, and Nikolić)C a d a asa , a d o ć)
1

IntroductionIntroductionIntroductionIntroductionThe Progress of IC Design and CMOS scaling issues
Cellular phone
2
Baseband SOC

The First ComputerThe First Computere st Co putee st Co pute
The BabbageDifference Engine(1832)(1832)25,000 partscost: £17,470
3

The Transistor RevolutionThe Transistor Revolution
First transistorBell Labs, 1948
4

The First Integrated Circuits The First Integrated Circuits e st teg ated C cu tse st teg ated C cu ts
Bipolar logic1960’s
ECL 3-input GateMotorola 1966
5

Intel 4004 Intel 4004 MicroprocessorMicroprocessorpp
Intel's first microprocessor197119712,300 transistors, 10 umSpeed: 108 kHz
Intel 8088 MicroprocessorIntel 8088 Microprocessor
Intel's “Best” microprocessor
Intel 8088 MicroprocessorIntel 8088 Microprocessor
p197829,000 transistors, 3 umSpeed: 5 MHz
6
Speed: 5 MHz

Intel Pentium (IV) microprocessorIntel Pentium (IV) microprocessorP 4 (2000)P –4 (2000)42 million transistors1.5 GHz0.18 um
P –M (2002)55 million transistors1.7 GHz1.7 GHz90 nm
P –D (2005)291 million transistors3.2 GHz
7
3.2 GHz65 nm

Moore’s LawMoore’s LawMoore s LawMoore s Law
In 1965, Gordon Moore noted that the number of transistors on a chip doubled pevery 18 to 24 months.
He made a prediction that psemiconductor technology will double its effectiveness every 18 monthsy
Quad-Core Xeon (2007)820 million transistors>3 GHz
Most recent
8
>3 GHz45 nm

Moore’s LawMoore’s LawMoore s LawMoore s Law16161514131211R
OF
ED F
UN
CTI
ON
1110
9876F
THE
NU
MB
ERER
INTE
GR
ATE
654321
LOG
2 OF
OM
PON
ENTS
P
0
1959
1960
1961
1962
1963
1964
1965
1966
1967
1968
1969
1970
1971
1972
1973
1974
1975
CO
9
Electronics, April 19, 1965.

Evolution in ComplexityEvolution in Complexityp yp y
10

Transistor CountsTransistor CountsTransistor CountsTransistor CountsK
1 Billion 1 Billion T i tT i t
1,000,000
100,000
K TransistorsTransistors
10,000
1,000i486
Pentium®Pentium® Pro
Pentium® IIPentium® III
,
10
100
808680286
i386i486
10
11975 1980 1985 1990 1995 2000 2005 2010
8086Source: IntelSource: Intel
11
ProjectedProjected
Courtesy, Intel

Moore’s law in MicroprocessorsMoore’s law in Microprocessorspp
1000
P610
100
(MT)
2X growth in 1.96 years!
286386
486 Pentium® procP6
0 1
1
10
ansi
stor
s
400480088080
8085 8086286
0 001
0.01
0.1
Tra
40040.0011970 1980 1990 2000 2010
Year
12
Transistors on Lead Microprocessors double every 2 years
Courtesy, Intel

Die Size GrowthDie Size Growthe S e G o te S e G o t100
486 Pentium ® procP6
e (m
m)
80088080
80858086
286386
486 p10
Die
siz
e
~7% growth per year2X gro th in 10 ears4004
11970 1980 1990 2000 2010
~2X growth in 10 years
1970 1980 1990 2000 2010Year
Die size grows by 14% to satisfy Moore’s Law
13Courtesy, Intel

FrequencyFrequencyFrequencyFrequency10000
Doubles every
P6Pentium ® proc
100
1000
cy (M
hz)
y2 years
Pentium ® proc486
38628680868085
80801
10
Freq
uenc
8080800840040.1
1
1970 1980 1990 2000 20101970 1980 1990 2000 2010Year
Lead Microprocessors frequency doubles every 2 years
14Courtesy, Intel

Power DissipationPower Dissipationo e ss pat oo e ss pat oP6
100
Pentium ® proc
486386
2868086
10
(Wat
ts)
3868085
808080084004
1Pow
er
4004
0.11971 1974 1978 1985 1992 20001971 1974 1978 1985 1992 2000
Year
Lead Microprocessors power continues to increase
15Courtesy, Intel

Power will be a major problemPower will be a major problemj pj p5KW
18KW
1 5KW10000
100000
1.5KW 500W
Pentium® proc100
1000
r (W
atts
)
8008808080858086
286386
486
1
10
100
Pow
er
4004
0.1
1
1971 1974 1978 1985 1992 2000 2004 2008Year
Power delivery and dissipation will be prohibitive
16Courtesy, Intel

Power densityPower densityyy10000
m2) Rocket
Nozzle
100
1000
sity
(W/c
m
NuclearReactor
Nozzle
40048086
P610
100
ower
Den
s
Hot Plate80088080
8085286 386486
Pentium® proc
11970 1980 1990 2000 2010
Po
1970 1980 1990 2000 2010Year
Power density too high to keep junctions at low temp
17
y g p j p
Courtesy, Intel

Not Only MicroprocessorsNot Only Microprocessorsy py p
CellPhone
Digital Cellular Market(Phones Shipped) Power
Small Signal RF
PowerRF
( pp )
1996 1997 1998 1999 2000
Units 48M 86M 162M 260M 435M Analog Baseband
PowerManagement
Digital Baseband
(DSP + MCU)
(data from Texas Instruments)(data from Texas Instruments)
18
(data from Texas Instruments)(data from Texas Instruments)

Challenges in Digital DesignChallenges in Digital DesignChallenges in Digital DesignChallenges in Digital Design
“Microscopic Problems” “Macroscopic Issues”
∝ DSM ∝ 1/DSM
Microscopic Problems• Ultra-high speed design• Interconnect• Noise, Crosstalk
R li bilit M f t bilit
p• Time-to-Market• Millions of Gates• High-Level Abstractions• Reuse & IP: Portability• Reliability, Manufacturability
• Power Dissipation• Clock distribution.
• Reuse & IP: Portability• Predictability• etc.
Everything Looks a Little Different…and There’s a Lot of Them!?
19

Productivity TrendsProductivity Trendsoduct ty e dsoduct ty e ds
1 000 000
10,000,000
10 000 000
100,000,000Logic Tr /Chip
10,000
1 000hip
(M)
10 000
100,000
10,000
100,000
1,000,000
100,000
1,000,000
10,000,000Logic Tr./ChipTr./Staff Month.
58%/Yr. compoundedComplexity growth rate
1,000
100
10
sist
or p
er C
h
100
1,000
10,000
ctiv
ity/S
taff
-Mo.
mpl
exity
10
100
1,000
100
1,000
10,000
xxxx
xx
x21%/Yr. compound
Productivity growth rate
x
p y g
1
0.1
0 01Logi
c Tr
ans
0 1
1
10
Prod
u(K
) Tra
ns. /
Com
1
10
2003
1981
1983
1985
1987
1989
1991
1993
1995
1997
1999
2001
2005
2007
2009
10
1000.01
0.001 0.01
0.1
21 1 1 1 1 1 1 1 1 1 2 2 2 2
Source: Sematech
Complexity outpaces design productivity
20Courtesy, ITRS Roadmap

Why Scaling?Why Scaling?y Sca gy Sca gTechnology shrinks by 0.7/generationWith ti i t t 2With every generation can integrate 2x more functions per chip; chip cost does not increase significantlysignificantlyCost of a function decreases by 2xBut …
How to design chips with more and more functions?Design engineering population does not double every two yearstwo years…
Hence, a need for more efficient design methodsExploit different levels of abstraction
21
Exploit different levels of abstraction
Design Abstraction LevelsDesign Abstraction LevelsSYSTEM
+
MODULE
+
GATE
DEVICE
CIRCUIT
n+n+S
GD
DEVICE
22

Design MetricsDesign MetricsDesign MetricsDesign Metrics
How to evaluate performance of aHow to evaluate performance of a digital circuit (gate, block, …)?
CostReliabilityScalabilityySpeed (delay, operating frequency) Power dissipationEnergy to perform a function
23

Cost of Integrated CircuitsCost of Integrated CircuitsCost of Integrated CircuitsCost of Integrated Circuits
NRE ( t i i ) tNRE (non-recurrent engineering) costsdesign time and effort, mask generationone-time cost factor
Recurrent costssilicon processing, packaging, testproportional to volumep pproportional to chip area
24

NRE Cost is IncreasingNRE Cost is Increasinggg
25

Die CostDie CostDie CostDie Cost
Single die
Wafer
Going up to 12” (30cm)
26From http://www.amd.com

Cost per TransistorCost per TransistorCost per TransistorCost per Transistor
0 10 111
cost: cost: ¢¢--perper--transistortransistor
Fabrication capital cost per transistor (Moore’s law)
0.0010.001
0.010.01
0.10.1 Fabrication capital cost per transistor (Moore s law)
0 0000010 000001
0.000010.00001
0.00010.0001
0.00000010.0000001
0.0000010.000001
19821982 19851985 19881988 19911991 19941994 19971997 20002000 20032003 20062006 20092009 20122012
27

YieldYield%100
per wafer chips ofnumber Totalper waferchipsgoodof No.
×=Y
tW fyield Dieper wafer Dies
costWafer cost Die×
=
( ) diameterwaferdiameter/2wafer 2 ×π×π ( )area die2
diameterwafer area die
diameter/2wafer per wafer Dies×
×π−
×π=
28
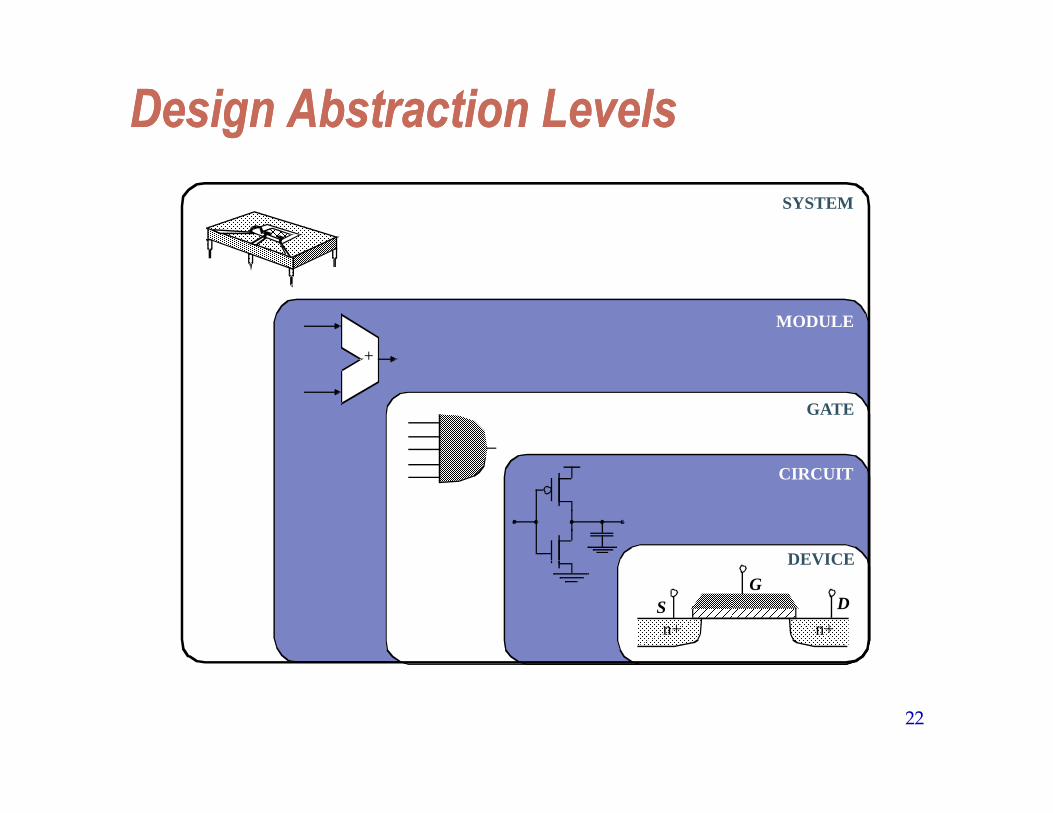
DefectsDefectse ectse ects
α−⎟⎠⎞
⎜⎝⎛
α×
+=area dieareaunit per defects1yield die
α is approximately 3
4)(didi f29
4area)(diecost die f=

Some Examples (1994)Some Examples (1994)p ( )p ( )Chip Metal
layersLine width
Wafer cost
Def./ cm2
Area mm2
Dies/wafer
Yield Die cost
386DX 2 0.90 $900 1.0 43 360 71% $4
486 DX2 3 0.80 $1200 1.0 81 181 54% $12
Power PC 601
4 0.80 $1700 1.3 121 115 28% $53
HP PA 7100 3 0 80 $1300 1 0 196 66 27% $73HP PA 7100 3 0.80 $1300 1.0 196 66 27% $73
DEC Alpha 3 0.70 $1500 1.2 234 53 19% $149
Super Sparc 3 0.70 $1700 1.6 256 48 13% $272
Pentium 3 0.80 $1500 1.5 296 40 9% $417
30

Reliability―Reliability―N i i Di it l I t t d Ci itN i i Di it l I t t d Ci itNoise in Digital Integrated CircuitsNoise in Digital Integrated Circuits
i(t)v(t) VDD
Inductive coupling Capacitive coupling Power and groundnoise
31

DC OperationDC OperationVoltage Transfer CharacteristicVoltage Transfer CharacteristicVoltage Transfer CharacteristicVoltage Transfer Characteristic
V(y)
VOH fV(y)=V(x)
VOH = f(VOL)VOL = f(VOH)VM f(VM)
VMSwitching Threshold
VM = f(VM)
VOL
M
V(x)VOHVOL
32
Nominal Voltage Levels

Mapping between analog and digital signalsMapping between analog and digital signals
VoutVSlope = -1V OH
out
VIH
VOH“ 1”
UndefinedRegion
Slope = -1VIL
V IL V IH V in
V OL“ 0” VOL
33

Definition of Noise MarginsDefinition of Noise Marginsgg
Noise margin high
"1"
VOH NMH Noise margin highVIH
UndefinedRegion
NMH
Noise margin lowVIL
g
VOLNML
"0"
Gate Output Gate Input
34

Noise BudgetNoise BudgetNoise BudgetNoise Budget
All t i i tAllocates gross noise margin to expected sources of noiseSources: supply noise, cross talk, interference, offsetDifferentiate between fixed and proportional noise sourcesp p
35

Key Reliability PropertiesKey Reliability PropertiesKey Reliability PropertiesKey Reliability PropertiesAbsolute noise margin values are deceptiveAbsolute noise margin values are deceptive
a floating node is more easily disturbed than a node driven by a low impedance (in terms of y p (voltage)
Noise immunity is the more important metric –the capability to suppress noise sourcesKey metrics: Noise transfer functions, Output
i d f th d i d i t i d f thimpedance of the driver and input impedance of the receiver;
36

Regenerative PropertyRegenerative PropertyRegenerative PropertyRegenerative Property
outout
finv(v)v3
out
f (v)v3
out
v1
v3 f (v)
v1
finv(v)
v0 v2 in
Regenerative Non-Regenerativev2 v0 in
37

Regenerative PropertyRegenerative Propertyg p yg p y
A chain of inverters
v0 v1 v2 v3 v4 v5 v6
5V
(Vol
t) v0
v11
3
2 4
v1v2
02 1
1
6 8 10Simulated response
38
t (nsec)Simulated response

FanFan--in and Fanin and Fan--outout
NM
Fan-out N Fan-in M
39

The Ideal GateThe Ideal Gate
V out
Ri = ∞
out
i
Ro = 0Fanout = ∞NMH = NML = VDD/2 g = ∞
V in
40

An OldAn Old--time Invertertime Inverter
NM
5.0
NM L
3.0
4.0
out(V)
V2.0
3.0
NM HVout V M
1.0
V (V)0.0 1.0 2.0 3.0 4.0 5.0
41
V in (V)

Delay DefinitionsDelay DefinitionsVin
t
50%
Vout
tpHL tpLH
t
90%
50%
tf trt10%
%
42
f r

Ring OscillatorRing Oscillatorgg
v1 v2v0 v3 v4 v5
v0 v1 v5
T = 2 × t × N43
T = 2 × tp × N

A FirstA First Order RC NetworkOrder RC NetworkA FirstA First--Order RC NetworkOrder RC Network
voutR
vin C
tp = ln (2) τ = 0.69 RC
Important model matches delay of inverter44
Important model – matches delay of inverter

Power DissipationPower DissipationPower DissipationPower Dissipation
Instantaneous power: p(t) = v(t)i(t) = Vsupplyi(t)
Peak power: P = V iPpeak = Vsupplyipeak
Average power: g p
( )∫ ∫+ +
==Tt
tTt
t supplysupply
ave dttiT
Vdttp
TP )(1
45
TT

Energy and EnergyEnergy and Energy DelayDelayEnergy and EnergyEnergy and Energy--DelayDelay
Power-Delay Product (PDP) =
E = Energy per operation = Pav × tpgy p p av p
Energy-Delay Product (EDP) =
quality metric of gate = E × tpq y g p
46

A FirstA First Order RC NetworkOrder RC NetworkA FirstA First--Order RC NetworkOrder RC NetworkR
vout
vin CL
R
vin CL
E0 1→ P t( )dt0
T∫ Vdd isupply t( )dt
0
T∫ Vdd CLdVout
0
Vdd
∫ CL Vdd• 2= = = =
Ecap Pcap t( )dt0
T∫ Vouticap t( )dt
0
T∫ CLVoutdVout
0
Vdd∫
12---C
LVdd•
2= = = =
47

SummarySummaryyyDigital integrated circuits have come a long way and still have quite some potential left forway and still have quite some potential left for the coming decadesSome interesting challenges aheadSome interesting challenges ahead
Getting a clear perspective on the challenges and potential solutions is the purpose of this book
Understanding the design metrics that govern digital design is crucial
Cost reliability speed power and energyCost, reliability, speed, power and energy dissipation
48


![ffisfr.r{Knbr.gov.bd/uploads/transfer-posting/IMG_20190325_0007_compressed.pdfrr€q]qfr qli.,rrffi ']{rq-f,](https://img.pdfslide.us/doc/110x75/5f9636c2d478b3751f26929d/ffisfrrknbrgovbduploadstransfer-postingimg201903250007-rraqqfr-qlirrffi.jpg)