Embed Size (px)
Citation preview
ECE 671 – Computer Networks Fall 2011 – Lab 1-Solution
Topology
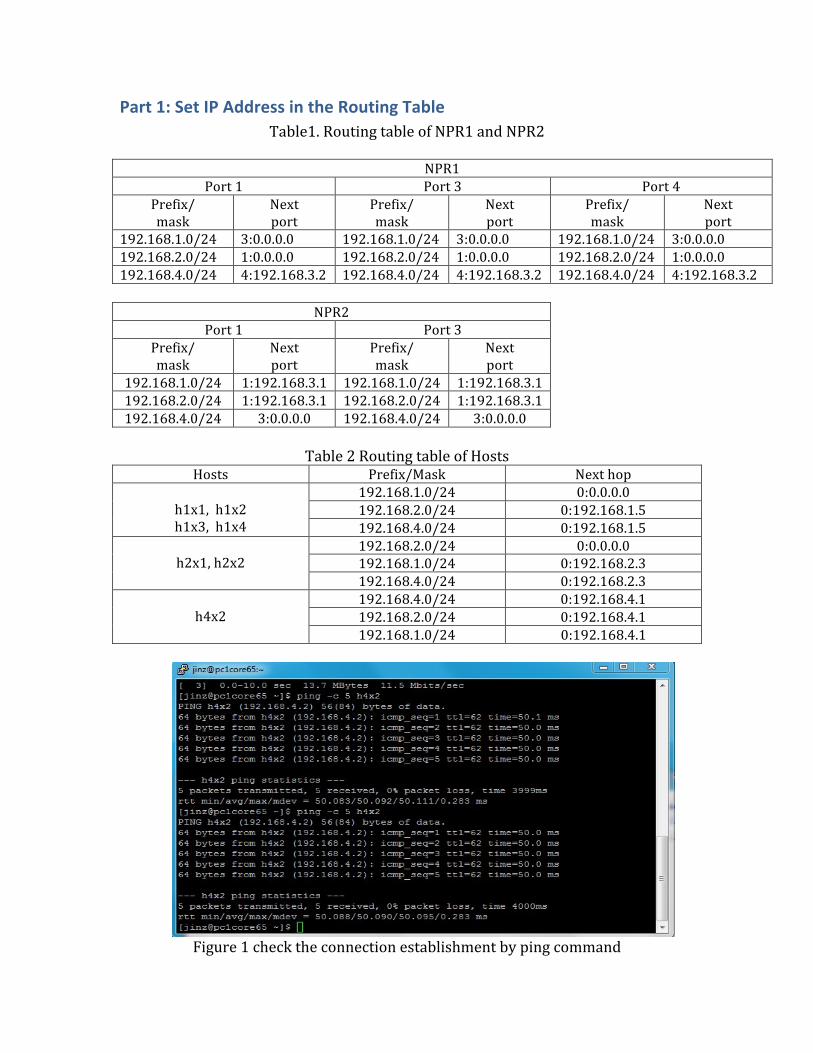
Part 1: Set IP Address in the Routing Table Table1. Routing table of NPR1 and NPR2
NPR1
Port 1 Port 3 Port 4 Prefix/ mask
Next port
Prefix/ mask
Next port
Prefix/ mask
Next port
192.168.1.0/24 3:0.0.0.0 192.168.1.0/24 3:0.0.0.0 192.168.1.0/24 3:0.0.0.0 192.168.2.0/24 1:0.0.0.0 192.168.2.0/24 1:0.0.0.0 192.168.2.0/24 1:0.0.0.0 192.168.4.0/24 4:192.168.3.2 192.168.4.0/24 4:192.168.3.2 192.168.4.0/24 4:192.168.3.2
NPR2 Port 1 Port 3
Prefix/ mask
Next port
Prefix/ mask
Next port
192.168.1.0/24 1:192.168.3.1 192.168.1.0/24 1:192.168.3.1 192.168.2.0/24 1:192.168.3.1 192.168.2.0/24 1:192.168.3.1 192.168.4.0/24 3:0.0.0.0 192.168.4.0/24 3:0.0.0.0
Table 2 Routing table of Hosts Hosts Prefix/Mask Next hop
h1x1, h1x2 h1x3, h1x4
192.168.1.0/24 0:0.0.0.0 192.168.2.0/24 0:192.168.1.5 192.168.4.0/24 0:192.168.1.5
h2x1, h2x2
192.168.2.0/24 0:0.0.0.0 192.168.1.0/24 0:192.168.2.3 192.168.4.0/24 0:192.168.2.3
h4x2
192.168.4.0/24 0:192.168.4.1 192.168.2.0/24 0:192.168.4.1 192.168.1.0/24 0:192.168.4.1
Figure 1 check the connection establishment by ping command
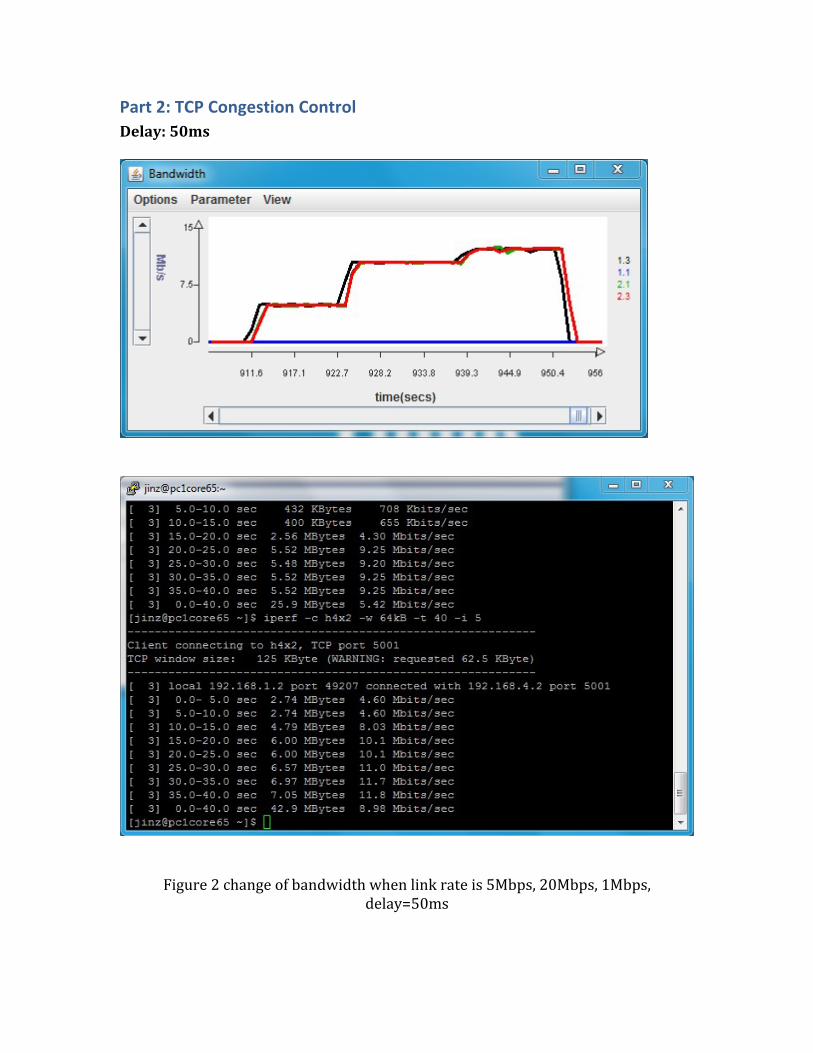
Part 2: TCP Congestion Control Delay: 50ms
Figure 2 change of bandwidth when link rate is 5Mbps, 20Mbps, 1Mbps,
delay=50ms
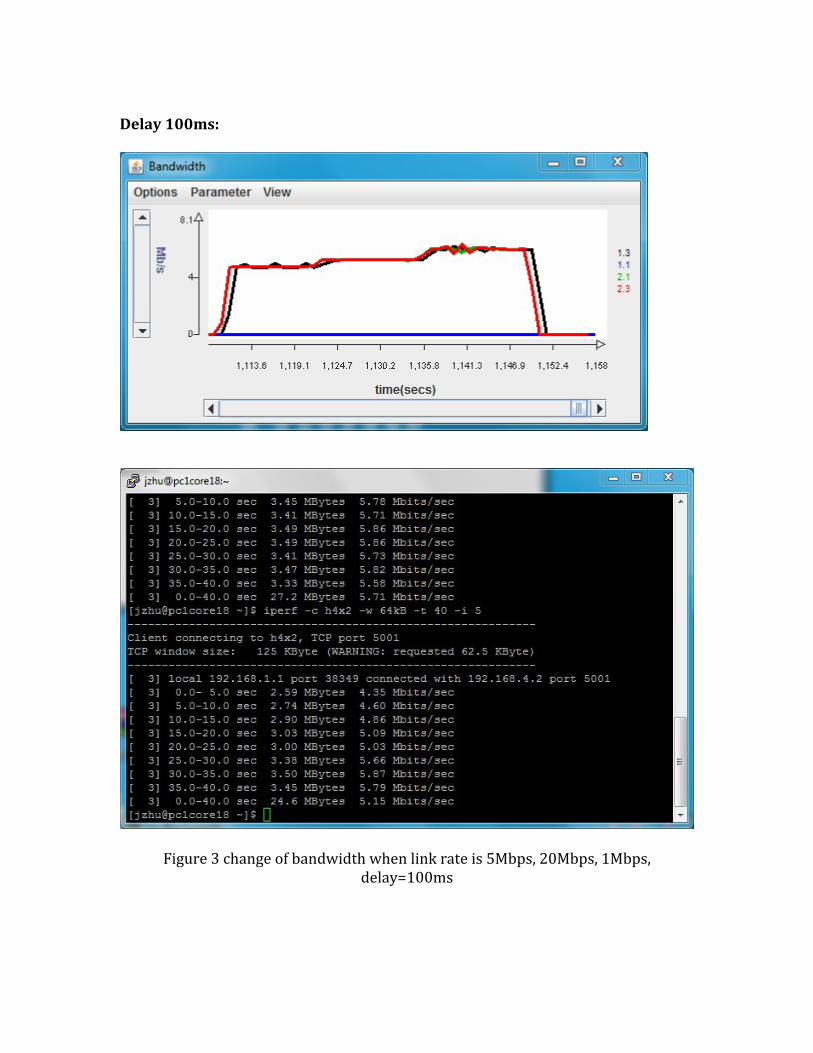
Delay 100ms:
Figure 3 change of bandwidth when link rate is 5Mbps, 20Mbps, 1Mbps, delay=100ms
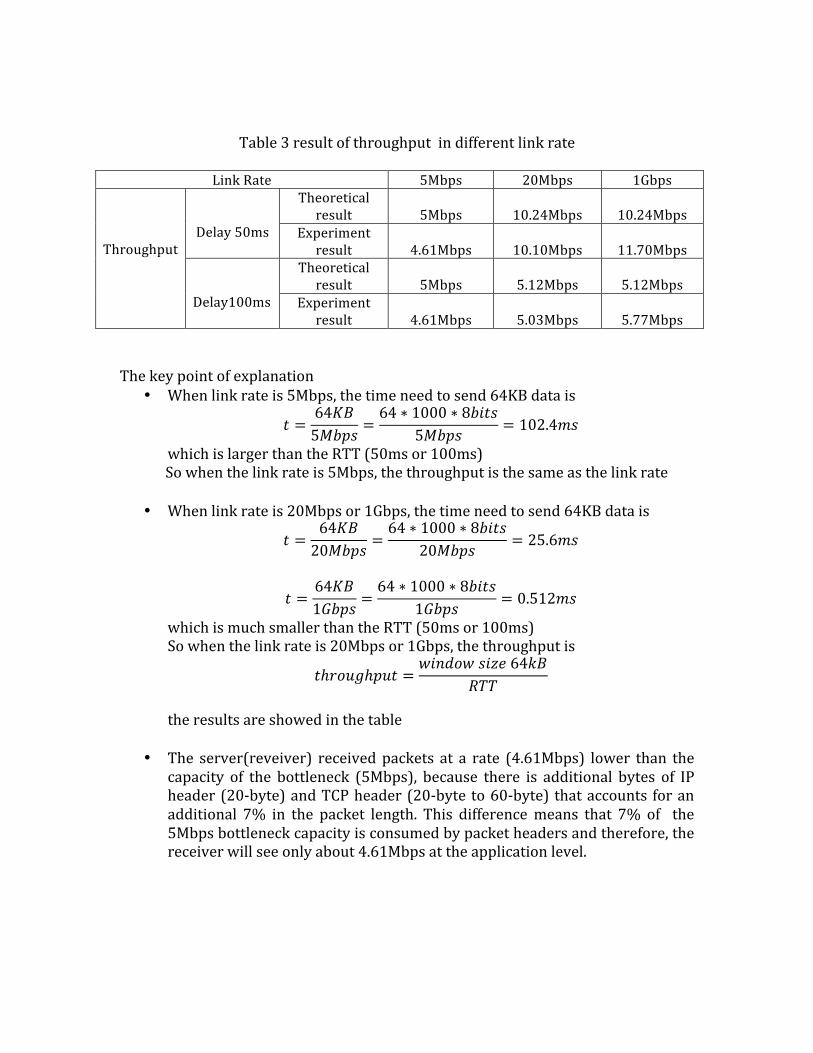
Table 3 result of throughput in different link rate
Link Rate 5Mbps 20Mbps 1Gbps
Throughput
Delay 50ms
Theoretical result
5Mbps
10.24Mbps
10.24Mbps
Experiment result
4.61Mbps
10.10Mbps
11.70Mbps
Delay100ms
Theoretical result
5Mbps
5.12Mbps
5.12Mbps
Experiment result
4.61Mbps
5.03Mbps
5.77Mbps
The key point of explanation
• When link rate is 5Mbps, the time need to send 64KB data is
! =64!"5!"#$ =
64 ∗ 1000 ∗ 8!"#$5!"#$ = 102.4!"
which is larger than the RTT (50ms or 100ms) So when the link rate is 5Mbps, the throughput is the same as the link rate
• When link rate is 20Mbps or 1Gbps, the time need to send 64KB data is
! =64!"20!"#$ =
64 ∗ 1000 ∗ 8!"#$20!"#$ = 25.6!"
! =64!"1!"#$ =
64 ∗ 1000 ∗ 8!"#$1!"#$ = 0.512!"
which is much smaller than the RTT (50ms or 100ms) So when the link rate is 20Mbps or 1Gbps, the throughput is
!ℎ!"#$ℎ!"# =!"#$%! !"#$ 64!"
!""
the results are showed in the table
• The server(reveiver) received packets at a rate (4.61Mbps) lower than the capacity of the bottleneck (5Mbps), because there is additional bytes of IP header (20-‐byte) and TCP header (20-‐byte to 60-‐byte) that accounts for an additional 7% in the packet length. This difference means that 7% of the 5Mbps bottleneck capacity is consumed by packet headers and therefore, the receiver will see only about 4.61Mbps at the application level.