Embed Size (px)
Citation preview

ECE 260B – CSE 241A Power Consumption 1 http://vlsicad.ucsd.edu
ECE260B – CSE241A
Winter 2005
Power Consumption
Website: http://vlsicad.ucsd.edu/courses/ece260b-w05

ECE 260B – CSE 241A Power Consumption 2 http://vlsicad.ucsd.edu
VLSI Design Metrics
Area / cost
Performance
Power consumption
Reliability
Figure courtesy, D. Singh
Manufacturing yield Signal integrity (e.g., crosstalk, supply voltage drop, etc.) Logic correctness / acceptable performance variation under
process, operating condition variations Expected lifetime (due to eletromigration, soft-error, peak current,
etc.)

ECE 260B – CSE 241A Power Consumption 3 http://vlsicad.ucsd.edu
Power Dissipation
P6Pentium ® proc
486
3862868086
80858080
80084004
0.1
1
10
100
1971 1974 1978 1985 1992 2000Year
Po
wer
(W
atts
)Lead Microprocessor’s power continues to increaseLead Microprocessor’s power continues to increase
Courtesy, Intel
Power delivery and dissipation will be prohibitive(?)Power delivery and dissipation will be prohibitive(?)
ECE 260B – CSE 241A Power Consumption 4 http://vlsicad.ucsd.edu
Power Density
40048008
80808085
8086
286386
486Pentium® proc
P6
1
10
100
1000
10000
1970 1980 1990 2000 2010
Year
Po
wer
Den
sity
(W
/cm
2)
Hot Plate
NuclearReactor
RocketNozzle
Power density too high to keep junctions at low temp(?)Power density too high to keep junctions at low temp(?)
Courtesy, Intel

ECE 260B – CSE 241A Power Consumption 5 http://vlsicad.ucsd.edu
Low Power Design Drivers Consumer products
Affects expected battery lifetime Slow development of battery technology (90-110 Watt-hrs/Kg) Low power reducing energy consumption
High performance designs Increasingly expensive packaging and cooling strategies
- Size, weight, heat sinks,
- Air, liquid cooling mechanism Supply voltage drop Temperature
- Every 10OC increase in operating temperature roughly doubles a component’s failure rate
Low power reducing peak power consumption for less thermal effects, better signal integrity and reliability
- Signal integrity / logic correctness / acceptable performance variation / design lifetime

ECE 260B – CSE 241A Power Consumption 6 http://vlsicad.ucsd.edu
Low Power Design Metrics
Energy efficiency in Joules Energy = power * delay (Joules = Watts * seconds) Affects battery lifetime
Average power consumption in Watts Results in thermal effects Sets packaging limits (50W / cm2 ? 120W total ?) ($1/Watt ?)
Worst case supply current Simultaneous transistor switching Supply voltage drop performance degradation Maximum device current device lifetime Electromigration wire lifetime

ECE 260B – CSE 241A Power Consumption 7 http://vlsicad.ucsd.edu
Power Versus Energy
Watts
time
Power is height of curve
Watts
time
Approach 1
Approach 2
Approach 2
Approach 1
Energy is area under curve
Lower power design could simply be slower
Two approaches require the same energy
Slide courtesy of Mary Jane Irwin, PSU

ECE 260B – CSE 241A Power Consumption 8 http://vlsicad.ucsd.edu
Low Power Design Objectives
Worst case supply current I
Average power P = I V Maximum cycle power Maximum N-cycle power Maximum sustainable power
Energy E = P dt
Energy-delay products Simultaneous power reduction and performance optimization
Usually to reduce average power under timing constraints

ECE 260B – CSE 241A Power Consumption 9 http://vlsicad.ucsd.edu
Outline
Problem statement
Power dissipation components
Power estimation
Optimization techniques

ECE 260B – CSE 241A Power Consumption 10 http://vlsicad.ucsd.edu
Static CMOS Gate Power
Power dissipation in static CMOS gate: 3 components
Dynamic capacitive (switching, “useful”) power Still dominant component in current technology Charging and discharging the capacitor
Crowbar current (short-circuit power) During a transition, current flows through both P and N
transistors simultaneously for a SHORT period of time Slow transitions worsen short-circuit power
Leakage (“useless power”) current Even when a device is nominally OFF (VGS=0), a small amount
of current is still flowing With many devices, can add up to hundreds of mW
Slide courtesy of Mary Jane Irwin, PSU

ECE 260B – CSE 241A Power Consumption 11 http://vlsicad.ucsd.edu
Reducing Dynamic Capacitive (Switching) Power
Pdyn = CL VDD2 P01 f
Capacitance:Function of fan-out, wire length, transistor sizes
Supply Voltage:Has been dropping with successive generations
Clock frequency:Increasing…
Activity factor:How often, on average, do wires switch?
Slide courtesy of Mary Jane Irwin, PSU

ECE 260B – CSE 241A Power Consumption 12 http://vlsicad.ucsd.edu
Crowbar (Short-Circuit) Current
Finite slope of the input signal causes a direct current path between VDD and GND for a short period of time during switching when both the NMOS and PMOS transistors are conducting
When VTN < VIN < VDD+VTP Both transistors are ON Current flowing directly from
VDD to VGND is crowbar current
Usually not a problem, e.g., P is ON strongly (LIN but with
small VDS if at all) N is barely ON
time
V ITransition
RN
CL
RP
Slide courtesy of Ken Yang, UCLA

ECE 260B – CSE 241A Power Consumption 13 http://vlsicad.ucsd.edu
Leakage (Inactive, “Useless”) Power
Three sources of leakage
The dominant is the Source-to-Drain leakage current Even when VGS = 0, a small amount of charge is still present
under the gate Exponentially related to the gate (and S/D) voltage
Source/Drain are junctions and some amount of reverse bias, IS is present
Typically much smaller than S/D leakage
Gate tunneling leakage When tox is only 5-10atoms, easy for tunneling current to flow More of an issue sub 0.10-m technology
)/)(exp( nkTVVqL
WI TGSD
Slide courtesy of Ken Yang, UCLA

ECE 260B – CSE 241A Power Consumption 14 http://vlsicad.ucsd.edu
2001 ITRS Projections of 1/and Isd,leak for HP, LP Logic
100
1000
10000
2001 2003 2005 2007 2009 2011 2013 2015
Year
1/
(G
Hz)
1.E-06
1.E-05
1.E-04
1.E-03
1.E-02
1.E-01
1.E+00
1.E+01
Isd
,leak (µ
A/µ
m)
`
Isd,leak—Low pwr
Isd,leak—High Perf.
1/—High Perf.
1/—Low Pwr

ECE 260B – CSE 241A Power Consumption 15 http://vlsicad.ucsd.edu
Projections for Low Power Gate Leakage
•Need for high K driven by Low Power, not High Performance
0.0001
0.001
0.01
0.1
1
10
100
1000
10000
100000
2001 2002 2003 2004 2005 2006 2007 2010 2013 2016
Year
Jg
ate (
no
rma
lize
d)
0.00
0.10
0.20
0.30
0.40
0.50
0.60
0.70
0.80
0.90
1.00
To
x (no
rma
lized
)
Simulated Igate, oxy-nitride
Igate spec. from ITRS
Oxy-nitride no longer adequate: high K needed
Tox
ECE 260B – CSE 241A Power Consumption 16 http://vlsicad.ucsd.edu
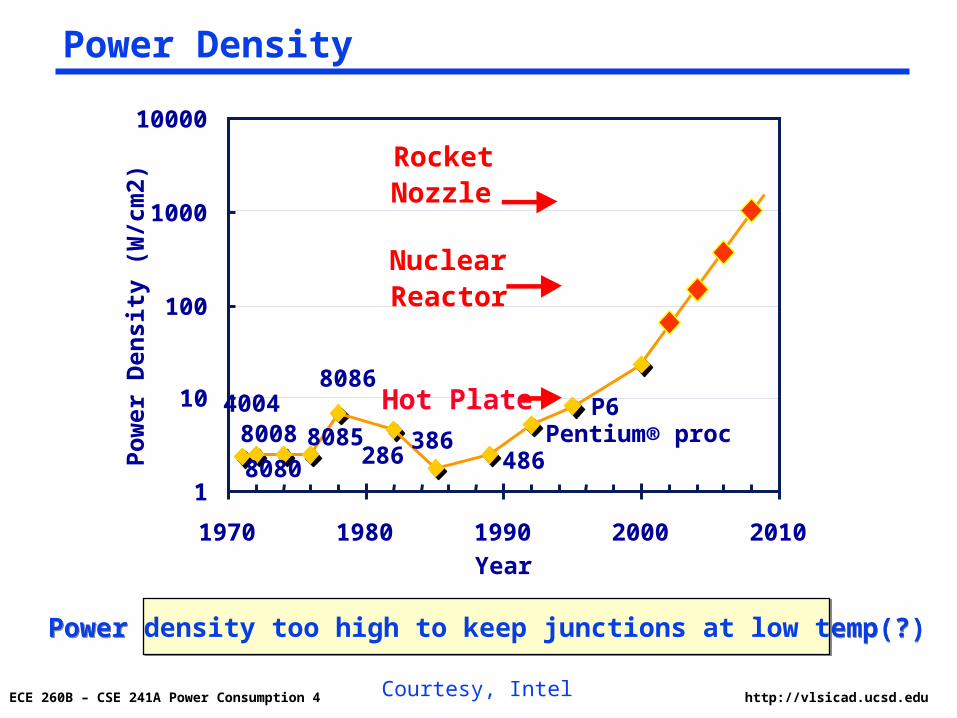
Summary: Power and Energy Equations
E = CL VDD2 P01 + tsc VDD Ipeak P01 + VDD Ileakage
P = CL VDD2 f01 + tscVDD Ipeak f01 + VDD Ileakage
Dynamic power(~90% today and
decreasing relatively)
Short-circuit power
(~8% today and decreasing absolutely)
Leakage power(~2% today and
increasing relatively)
f01 = P01 * fclock
Slide courtesy of Mary Jane Irwin, PSU
•Designers need to comprehend issues of memory and logic power, speed/power tradeoffs at the process (HiPerf vs. LowPower) level,
ECE 260B – CSE 241A Power Consumption 17 http://vlsicad.ucsd.edu
Outline
Problem statement
Power dissipation components
Power estimation
Optimization techniques

ECE 260B – CSE 241A Power Consumption 18 http://vlsicad.ucsd.edu
Design Abstraction Levels
BehavioralSynthesis
RTLSynthesis
LogicOptimization
TransistorOptimization
Place & Route
HDL
PowerAnalysis
PowerAnalysis
PowerAnalysis
PowerAnalysis
Slide courtesy, Prof. J. Rabaey, UCB

ECE 260B – CSE 241A Power Consumption 19 http://vlsicad.ucsd.edu
Transistor Level Power Estimation
BehavioralSynthesis
RTLSynthesis
LogicOptimization
TransistorOptimization
Place & Route
HDL
Power Analysis
Current Flows
Circuit Simulation
Slide courtesy, Prof. J. Rabaey, UCB

ECE 260B – CSE 241A Power Consumption 20 http://vlsicad.ucsd.edu
Power EstimationDynamic Analysis
Simulation requires representative simulation vectors
- Derived by designer
- Automatic (Monte Carlo)
Transitor level (PowerMill) Very accurate Much faster than SPICE
Gate level (Powergate, DesignPower) Faster than transistor level Still very accurate due to good modeling of power dissipation at
cell-level

ECE 260B – CSE 241A Power Consumption 21 http://vlsicad.ucsd.edu
Power Ingredients
VDD
In Out
CL
• Dynamic Dissipation
• Short-Circuit Currents
• Static Dissipation
Pdyn = CLVDDVswf 01
Psc = VDDIsc
Pstat = VDDIleakISC
Slide courtesy, Prof. J. Rabaey, UCB

ECE 260B – CSE 241A Power Consumption 22 http://vlsicad.ucsd.edu
Transistor-Level Power Estimation
Spice is the reference, but too slow
Commercial tools claim to be within 10% of SPICE accuracy and up to 1000X faster
I
t
PTi t v t dt
T
1
0
( ) ( )
Slide courtesy, Prof. J. Rabaey, UCB

ECE 260B – CSE 241A Power Consumption 23 http://vlsicad.ucsd.edu
Timing Simulation
Vdd
out1 out2in
out3
i(Vdd)
in
out1
out2
out3
Vdd-Vth
• Uses simplified (table-lookup) transistor model• Handles leakage, direct path, and reduced swing
• Up to 2 orders of magnitude faster than SPICE
Slide courtesy, Prof. J. Rabaey, UCB

ECE 260B – CSE 241A Power Consumption 24 http://vlsicad.ucsd.edu
Switch-Level Simulation
A
B
X
F
Cap
(fF
/bit)
Sample
0102030405060708090
100
0 10 20 30 40 50 60
IRSIMSPICE
Up to 3 Orders of Magnitude Faster than Circuit
• Accurate for Dynamic Power
• Unreliable on leakage and direct path currents
Slide courtesy, Prof. J. Rabaey, UCB
ECE 260B – CSE 241A Power Consumption 25 http://vlsicad.ucsd.edu
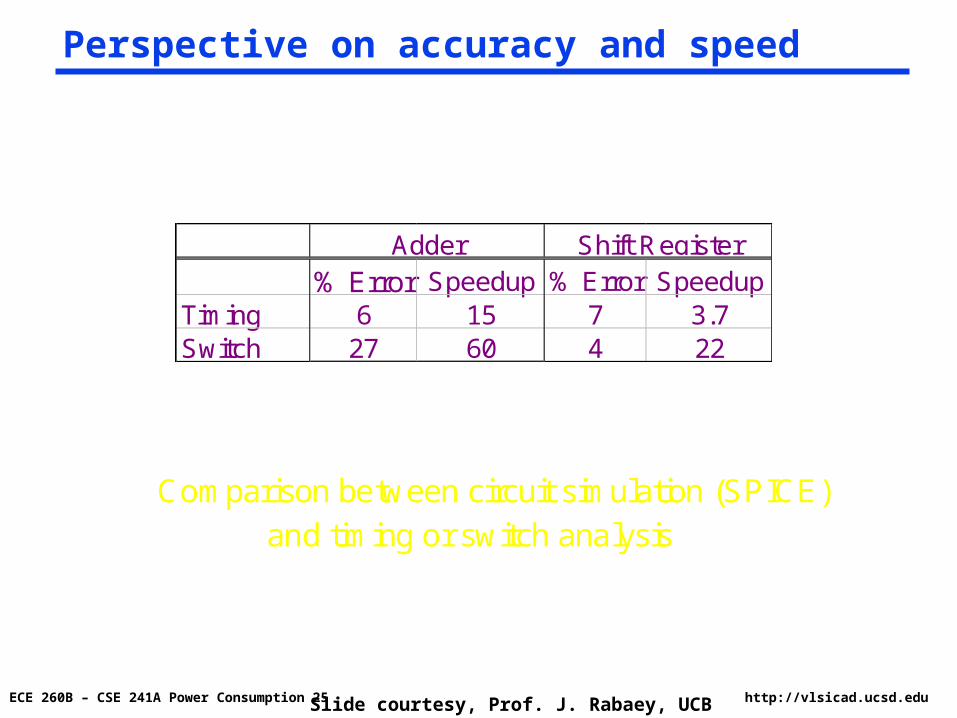
Perspective on accuracy and speed
Comparison between circuit simulation (SPICE)and timing or switch analysis
% Error Speedup % Error SpeedupTiming 6 15 7 3.7Switch 27 60 4 22
Adder Shift Register
Slide courtesy, Prof. J. Rabaey, UCB

ECE 260B – CSE 241A Power Consumption 26 http://vlsicad.ucsd.edu
Transistor Level Power Estimation Tools
PowerMill Epic
Star-ADM Avant!
LSIMAnalyst
MentorGraphics
• Mixed analog/digital simulation• Analytic closed-form model
• Mixed transistor/gate simulation• Series-Parallel Switch algorithm
• Mixed transistor/gate simulation• Piecewise linear model
Slide courtesy, Prof. J. Rabaey, UCB

ECE 260B – CSE 241A Power Consumption 27 http://vlsicad.ucsd.edu
Design Abstraction Levels
BehavioralSynthesis
RTLSynthesis
LogicOptimization
TransistorOptimization
Place & Route
HDL
PowerAnalysis
PowerAnalysis
PowerAnalysis
PowerAnalysis
Slide courtesy, Prof. J. Rabaey, UCB

ECE 260B – CSE 241A Power Consumption 28 http://vlsicad.ucsd.edu
Gate-Level Power Estimation
Dynamic Switching Power (Isw) [70-90%]
Also referred to as capacitive power
Internal (Short-Circuit) Power (Iint) [10-30%] Also referred to as short circuit power
Static Leakage Power (Ileak) [< 1%]
Sub-threshold leakage dominates, some due to leakage substrate
InputTransition
V
IntISWI
N
LeakIiC
GND
Complete power model provides infrastructure for analysis and optimizationComplete power model provides infrastructure for analysis and optimization
Slide courtesy, Prof. J. Rabaey, UCB

ECE 260B – CSE 241A Power Consumption 29 http://vlsicad.ucsd.edu
Gate-Level Power Estimation
• state of the gate• input slope • output load• temperature• fabrication process
• toggle rate
Slide courtesy, Prof. J. Rabaey, UCB

ECE 260B – CSE 241A Power Consumption 30 http://vlsicad.ucsd.edu
Design Abstraction Levels
ToggleRates
BehavioralSynthesis
RTLSynthesis
LogicOptimization
TransistorOptimization
Place & Route
HDL
ProbabilisticAnalysis
Simulation
PowerAnalysis
Simulationwith integratedPower Analysis
Slide courtesy, Prof. J. Rabaey, UCB
ECE 260B – CSE 241A Power Consumption 31 http://vlsicad.ucsd.edu
Simulation Based Power Estimation
Problems: The relationship of power versus primary input probabilities and activities is a
complicated surface. The existing methods use discrete points to approximate such a surface.
- The effectiveness strongly depends on the density of the chosen points.- The more points one chooses, the more accurate results.- More points directly translate to longer CPU time.
Slide courtesy, Z. Chen, K. Roy

ECE 260B – CSE 241A Power Consumption 32 http://vlsicad.ucsd.edu
Toggle Rate Estimation
Probabilistic Propagation no input vectors needed much faster than simulation less accurate than simulation glitches?
Simulation requires representative simulation vectors
- derived by designer
- automatic (Monte Carlo)
Slide courtesy, Prof. J. Rabaey, UCB
ECE 260B – CSE 241A Power Consumption 33 http://vlsicad.ucsd.edu
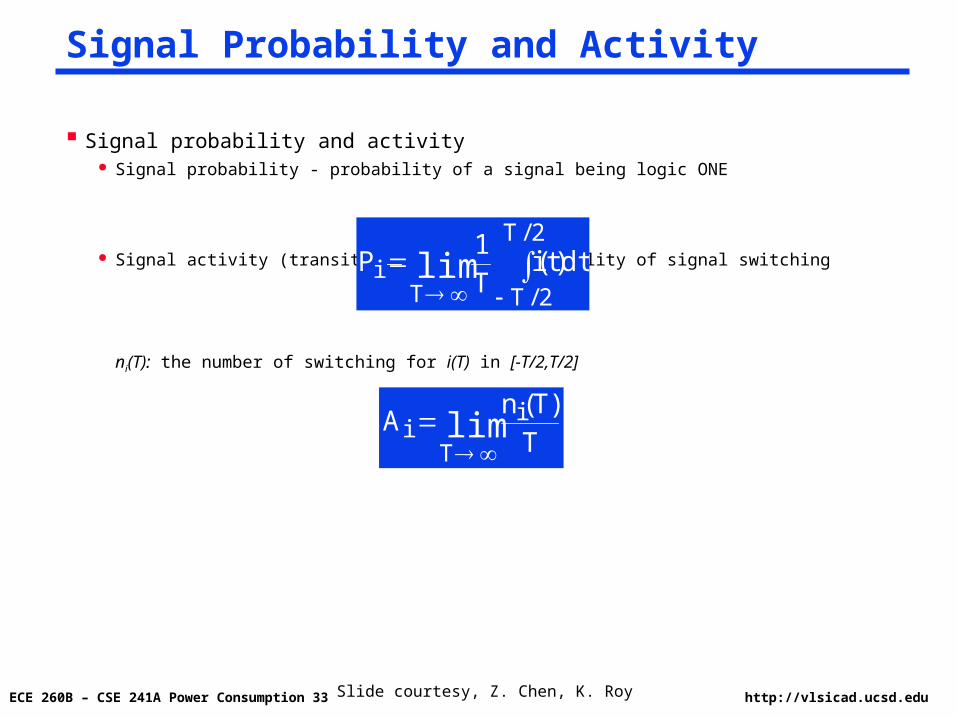
Signal probability and activity Signal probability - probability of a signal being logic ONE
Signal activity (transition density) - probability of signal switching
ni(T): the number of switching for i(T) in [-T/2,T/2]
dt)t(iT
1P
2/T
2/TTi lim
T
)T(nA i
Ti lim
Signal Probability and Activity
Slide courtesy, Z. Chen, K. Roy

ECE 260B – CSE 241A Power Consumption 34 http://vlsicad.ucsd.edu
Normalized activityf : clock frequency
Normalized power dissipation measure Approximated power dissipation
Cj : node capacitance Aj : node activity Normalized power dissipation measure
fanout(j) : fanout number at node j
f
Aa i
i
nodesallj
jj2ddavg ACV
21
P
nodesallj
janout a)j(f
Power Dissipation in terms of Activity
Slide courtesy, Z. Chen, K. Roy

ECE 260B – CSE 241A Power Consumption 35 http://vlsicad.ucsd.edu
Probability Propagation
Let y = f(x1, …, xn) be a Boolean function with independent variables xi, the signal probability of f can be obtained in linear time as follows.
where
are the cofactors of f with respect to x1.
Improve runtime by using a BDD
)()()()()(11 11 xx fPxPfPxPyP
),...,,0(),,...,,1( 22 11 nxnx xxffxxff

ECE 260B – CSE 241A Power Consumption 36 http://vlsicad.ucsd.edu
Activity Propagation Let y = f(x1, …, xn) be a Boolean function with independent variables xi, the signal activity of f can be obtained in linear time as follows.
where Boolean difference
where is the exclusive-or operation.
n
ii
i
xAx
yPyA
1
)()()(
01 ||
xx yyx
y

ECE 260B – CSE 241A Power Consumption 37 http://vlsicad.ucsd.edu
AND gate
sp(1) = sp1 * sp2
tp(01) = sp * (1 - sp)
Example
sp = 0.5 * 0.5 = 0.25
tp = 0.25 * (1 - 0.25) = 0.1875
Probability Propagation
1/2
1/2
1/2
1/2
1/4
1/4
7/16
Propagate
Slide courtesy, Prof. J. Rabaey, UCB

ECE 260B – CSE 241A Power Consumption 38 http://vlsicad.ucsd.edu
Probability Propagation for Basic Gates
Ignores Temporal and Spatial Correlations
Slide courtesy, Prof. J. Rabaey, UCB

ECE 260B – CSE 241A Power Consumption 39 http://vlsicad.ucsd.edu
Probability Propagation Problems
0.5
0.5
0.75 0.375?0.5!
Problem: Reconvergent Fan-out:
Creates spatial correlation between signals
Becomes complex and untractable real fast
P(X) = P(B=1).(P(X=1 | B = 1)
Slide courtesy, Prof. J. Rabaey, UCB
ECE 260B – CSE 241A Power Consumption 40 http://vlsicad.ucsd.edu
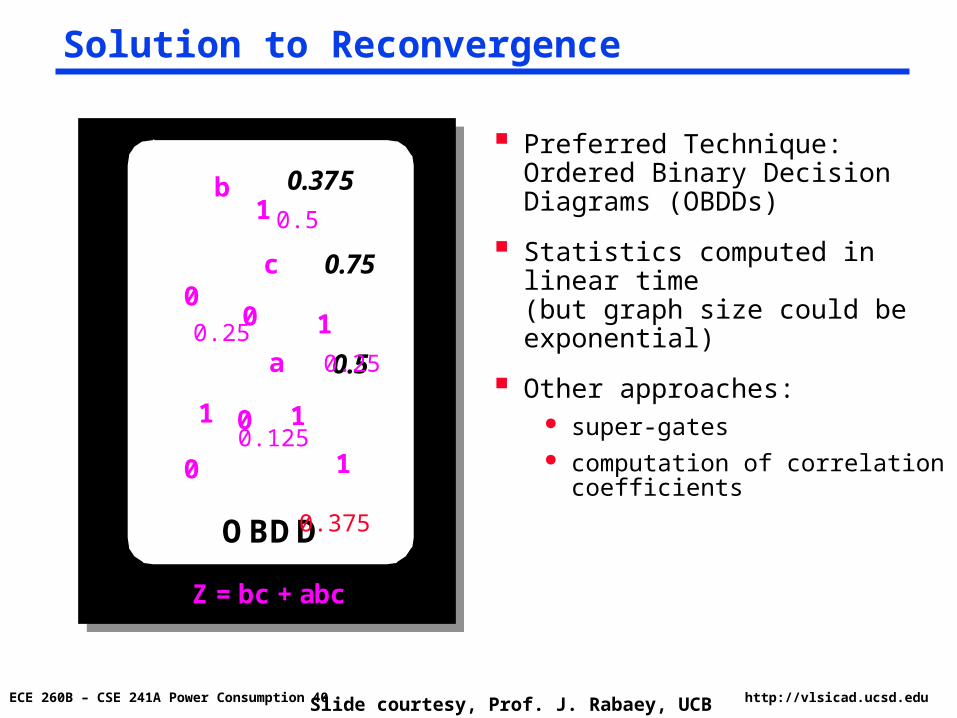
Solution to Reconvergence
b
c
a
0 1
1 0
10
1
0
0.5
0.75
0.375
OBDD
Z = bc + abc
1
0.5
0.250.25
0.125
0.375
Preferred Technique:Ordered Binary Decision Diagrams (OBDDs)
Statistics computed in linear time(but graph size could be exponential)
Other approaches: super-gates computation of correlation
coefficients
Slide courtesy, Prof. J. Rabaey, UCB

ECE 260B – CSE 241A Power Consumption 41 http://vlsicad.ucsd.edu
How to introduce time?
And include glitching effects …
TOUGH! If one also wants to include spatial effects or be general
Example: Symbolic Simulation Approach (for unit delay)
Slide courtesy, Prof. J. Rabaey, UCB

ECE 260B – CSE 241A Power Consumption 42 http://vlsicad.ucsd.edu
Symbolic Network
Transition Counters
Value of d at time t=0
Problem: Network can be huge and BDD cannot be created!
Slide courtesy, Prof. J. Rabaey, UCB

ECE 260B – CSE 241A Power Consumption 43 http://vlsicad.ucsd.edu
Probability Simulation User specifies typical signal behavior at the circuit inputs using probability
waveforms, which is a sequence of values indicating the probability that the signal is high for a certain time intervals, and the probability that the signal takes transition from low to high.
Propagation is very similar to event driven logic simulation
0.5
0.25
0.75
0.0
t1 t2 t3
0.2 0.6 0.01

ECE 260B – CSE 241A Power Consumption 44 http://vlsicad.ucsd.edu
How about sequential circuits?
NextState
Comb.Logic
I0
PS0
PSt
It
• Next State Logic introduces temporal correlations between subsequent samples
• Either assume that all states have equal probability, or use statistical Markov chains
Slide courtesy, Prof. J. Rabaey, UCB
ECE 260B – CSE 241A Power Consumption 45 http://vlsicad.ucsd.edu
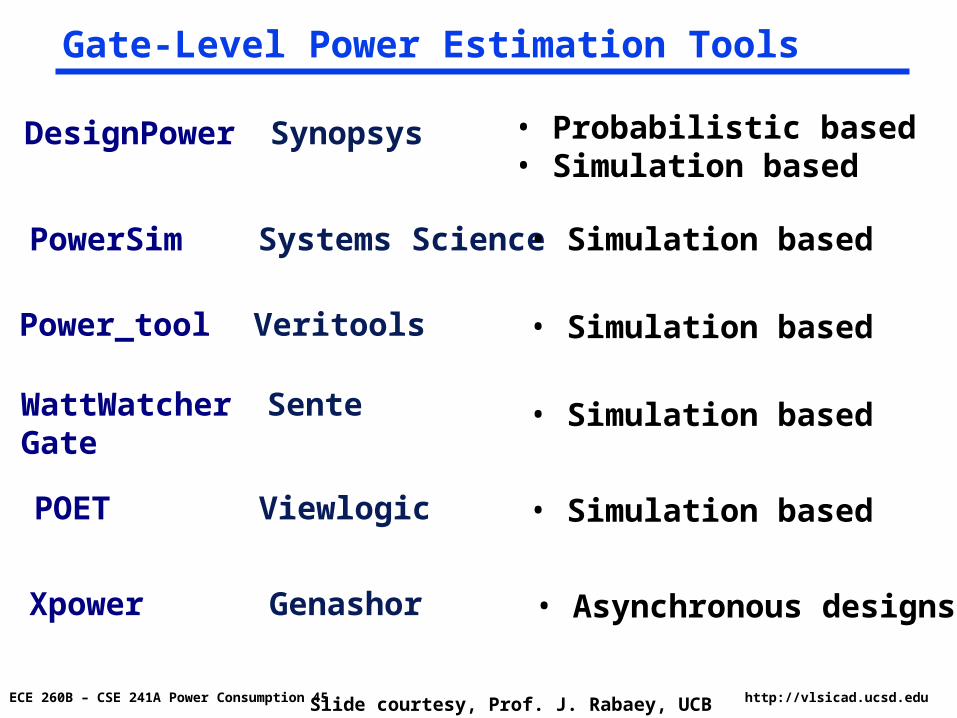
Gate-Level Power Estimation Tools
DesignPower Synopsys
PowerSim Systems Science
Power_tool Veritools
WattWatcherGate
Sente
Viewlogic
GenashorXpower
POET
• Probabilistic based• Simulation based
• Asynchronous designs
• Simulation based
• Simulation based
• Simulation based
• Simulation based
Slide courtesy, Prof. J. Rabaey, UCB

ECE 260B – CSE 241A Power Consumption 46 http://vlsicad.ucsd.edu
Design Abstraction Levels
BehavioralSynthesis
RTLSynthesis
LogicOptimization
TransistorOptimization
Place & Route
HDL
PowerAnalysis
PowerAnalysis
PowerAnalysis
PowerAnalysis
Slide courtesy, Prof. J. Rabaey, UCB

ECE 260B – CSE 241A Power Consumption 47 http://vlsicad.ucsd.edu
Power Estimation
Simulation Monte-Carlo technique PowerMill at transistor level Verilog-XL at gate level
Hierarchical simulation Architectural/gate/transistor-level Parameterized power model for each module
Statistical estimation Signal probability propagation

ECE 260B – CSE 241A Power Consumption 48 http://vlsicad.ucsd.edu
Power Estimation Methodology
RTL library Synthesiscondition
Synthesis P&R
Post-layoutnetlist
PowerCharacterization
PowerMacro-model
database
Power model library generator
Powerlib.vhd Powerlib.v Powerlib.c
RTL design
RTL planning/ mapping
Structure(macro)netlist
Power model inference &Estimation code generation
Enhanced RTL
RTL simulation
Powerreport
Testbenchstimuli
Power waveform / profile

ECE 260B – CSE 241A Power Consumption 49 http://vlsicad.ucsd.edu
Inaccuracies in Power Estimation
In increasing order:
The number of input stimuli did not cause any error above the 10% mark if we considered at least 10 input patterns
Using a gate-level simulator as opposed to a circuit simulator caused an error of about +/-15%
Repowering and physical design introduced inaccuracies below 20%
Glitch power varied between 7%-43%
Internal gate capacitances, which are a function of the target library, accounted for about half the power
Optimization and technology mapping may cause power estimates to be off by an order of magnitude

ECE 260B – CSE 241A Power Consumption 50 http://vlsicad.ucsd.edu
Power and Synthesis Flow
Accuracy of Power Estimation
Po
ten
tial
fo
r P
ow
er S
avin
gs
Behavioral
RTL
Gate
Switch
20%
400%
50%
10%
Slide courtesy, Prof. J. Rabaey, UCB

ECE 260B – CSE 241A Power Consumption 51 http://vlsicad.ucsd.edu
Expectations
Algorithmic
Behavioral
RT Level
Tech. indep.
Tech dep.
Layout
Power manage
Algorithm selection
ConcurrencyMemory
Clock ctrl
Structural transform.
Extr/decomp
Tech. mappingGate sizing
Placement
orders of magnitude
several times
10-90%
10-15%
15%
20%20%
20%
Slide courtesy, Prof. J. Rabaey, UCB

ECE 260B – CSE 241A Power Consumption 52 http://vlsicad.ucsd.edu
Power Estimation / Improving Guidelines
Before technology mapping, the accuracy levels are unacceptable
It is necessary to take into account internal gate capacitances as well as wire capacitances
Gate-level estimation implies >15% error
Simulation with as few as 10 patterns from typical inputs for a typical starting state is often sufficient to reach confidence levels matching those of gate-level simulation
Power improving transformations should be run in late design stages, they should be applied only if they can predict significant power improvement, and
should be applied many times (hundreds) to maximize the confidence of
positively impacting the design

ECE 260B – CSE 241A Power Consumption 53 http://vlsicad.ucsd.edu
Outline
Problem statement
Power dissipation components
Power estimation
Optimization techniques

ECE 260B – CSE 241A Power Consumption 54 http://vlsicad.ucsd.edu
Low Power Design Techniques
Reducing chip and package capacitance
Scaling the supply / threshold voltages
Using power management strategies
Employing better design techniques
ECE 260B – CSE 241A Power Consumption 55 http://vlsicad.ucsd.edu
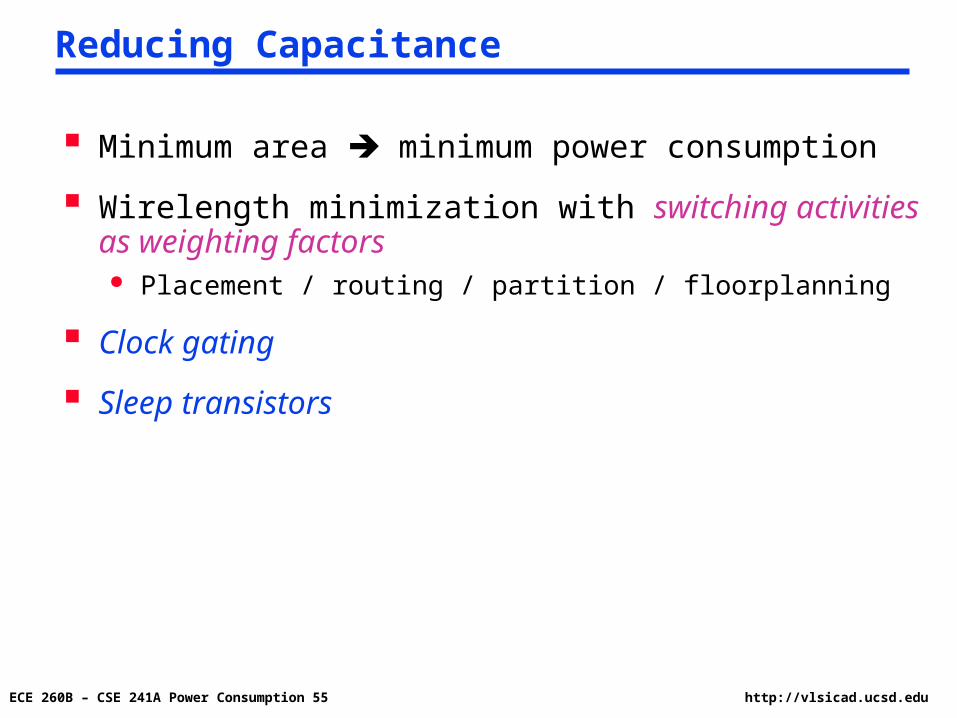
Reducing Capacitance
Minimum area minimum power consumption
Wirelength minimization with switching activities as weighting factors
Placement / routing / partition / floorplanning
Clock gating
Sleep transistors
ECE 260B – CSE 241A Power Consumption 56 http://vlsicad.ucsd.edu
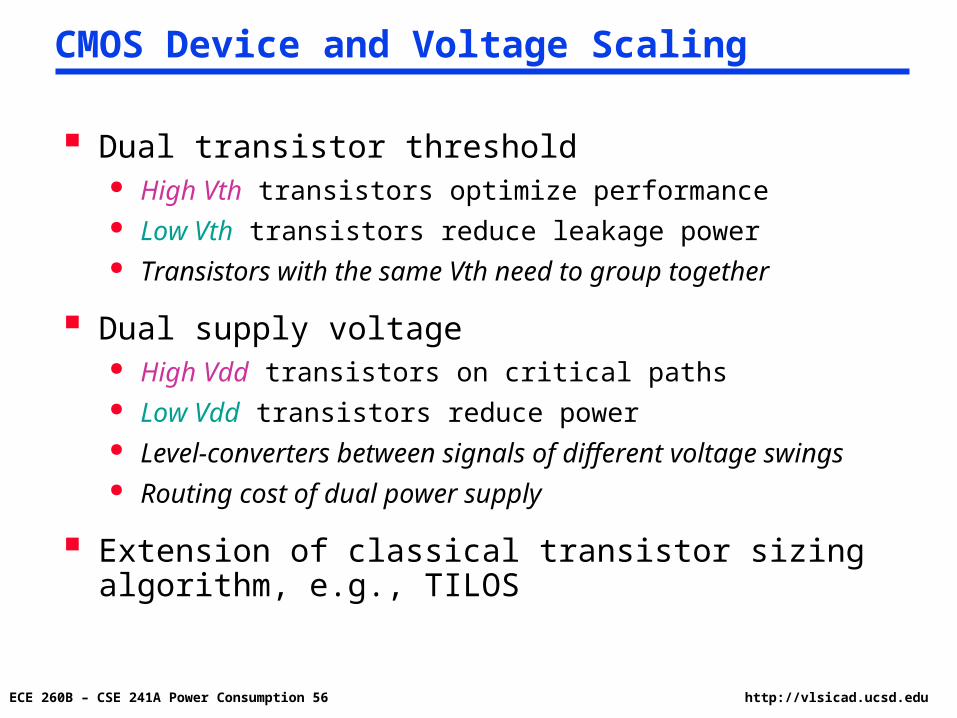
CMOS Device and Voltage Scaling
Dual transistor threshold High Vth transistors optimize performance Low Vth transistors reduce leakage power Transistors with the same Vth need to group together
Dual supply voltage High Vdd transistors on critical paths Low Vdd transistors reduce power Level-converters between signals of different voltage swings Routing cost of dual power supply
Extension of classical transistor sizing algorithm, e.g., TILOS

ECE 260B – CSE 241A Power Consumption 57 http://vlsicad.ucsd.edu
Power Management Strategies
Inactive hardware modules are automatically turned off to save power (for example, monitors, laptops, etc.)
Transistors on non-critical data paths are slowed down, e.g., by dynamically scaling down their supply voltages (for example, in Transmeta microprocessors)
Sleep transistors Power gating (controllable power supply mechanism)

ECE 260B – CSE 241A Power Consumption 58 http://vlsicad.ucsd.edu
Design Abstraction Levels
BehavioralSynthesis
RTLSynthesis
LogicOptimization
TransistorOptimization
Place & Route
HDL
PowerAnalysis
PowerAnalysis
PowerAnalysis
PowerAnalysis
Slide courtesy, Prof. J. Rabaey, UCB

ECE 260B – CSE 241A Power Consumption 59 http://vlsicad.ucsd.edu
Transistor-Level Power Optimization
Optimizes up to 30,000 transistors at a time
Starts from three initial solutions: initial sizes, all transistors sized up with constant factor, and all transistor identical size
Optimization modes: individual transistor sizing retain ratios between connected NMOS and
PMOS devices pseudo-NMOS
Optimization Goals Delay Power Slack
AMPS - Epic
Slide courtesy, Prof. J. Rabaey, UCB

ECE 260B – CSE 241A Power Consumption 60 http://vlsicad.ucsd.edu
Design Abstraction Levels
BehavioralSynthesis
RTLSynthesis
LogicOptimization
TransistorOptimization
Place & Route
HDL
PowerAnalysis
PowerAnalysis
PowerAnalysis
PowerAnalysis
Slide courtesy, Prof. J. Rabaey, UCB
ECE 260B – CSE 241A Power Consumption 61 http://vlsicad.ucsd.edu
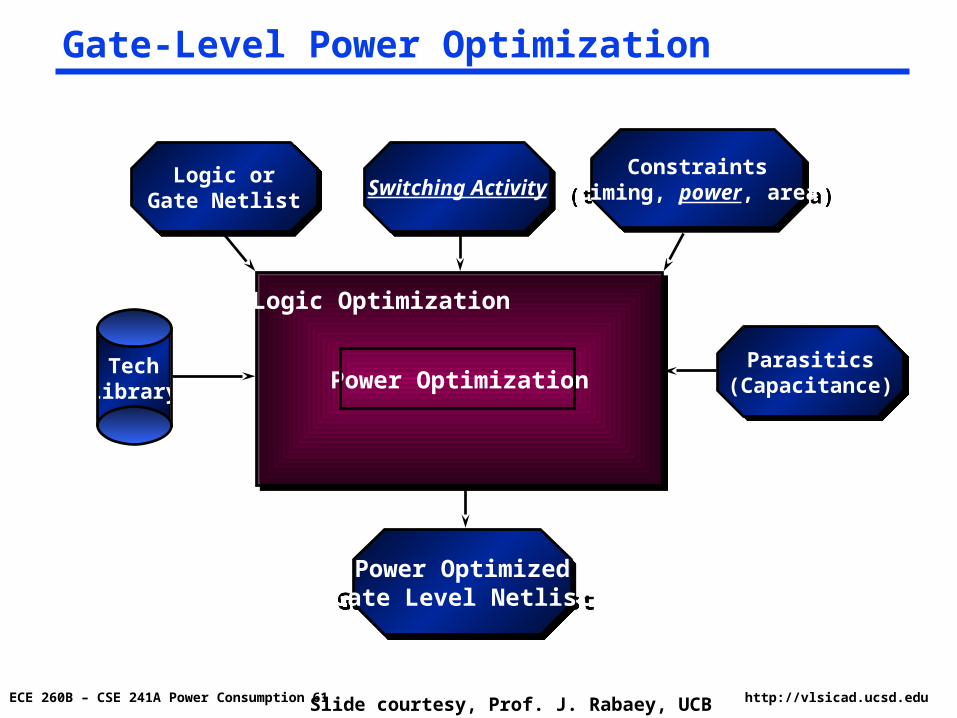
Gate-Level Power Optimization
TechLibrary Power OptimizationPower Optimization
Logic orGate Netlist
Logic orGate Netlist Switching ActivitySwitching Activity
Constraints(timing, power, area)
Constraints(timing, power, area)
Parasitics(Capacitance)
Parasitics(Capacitance)
Power OptimizedGate Level NetlistPower OptimizedGate Level Netlist
Logic Optimization
Slide courtesy, Prof. J. Rabaey, UCB

ECE 260B – CSE 241A Power Consumption 62 http://vlsicad.ucsd.edu
Gate-Level Tradeoffs for Power
Factoring
Structuring
Buffer insertion/deletion
Don’t care optimization
Technology mapping
Sizing
Pin assignment
Slide courtesy, Prof. J. Rabaey, UCB

ECE 260B – CSE 241A Power Consumption 63 http://vlsicad.ucsd.edu
Factoring
Idea: Remove common expressions to reduce capacitance
Caveat: This may increase activity!
Pa = 0.1
Pb = 0.5
Pc = 0.5
Slide courtesy, Prof. J. Rabaey, UCB

ECE 260B – CSE 241A Power Consumption 64 http://vlsicad.ucsd.edu
Logic Restructuring
Logic restructuring to minimize spurious transitions
Buffer insertion for path balancing
Slide courtesy, Prof. J. Rabaey, UCB
ECE 260B – CSE 241A Power Consumption 65 http://vlsicad.ucsd.edu
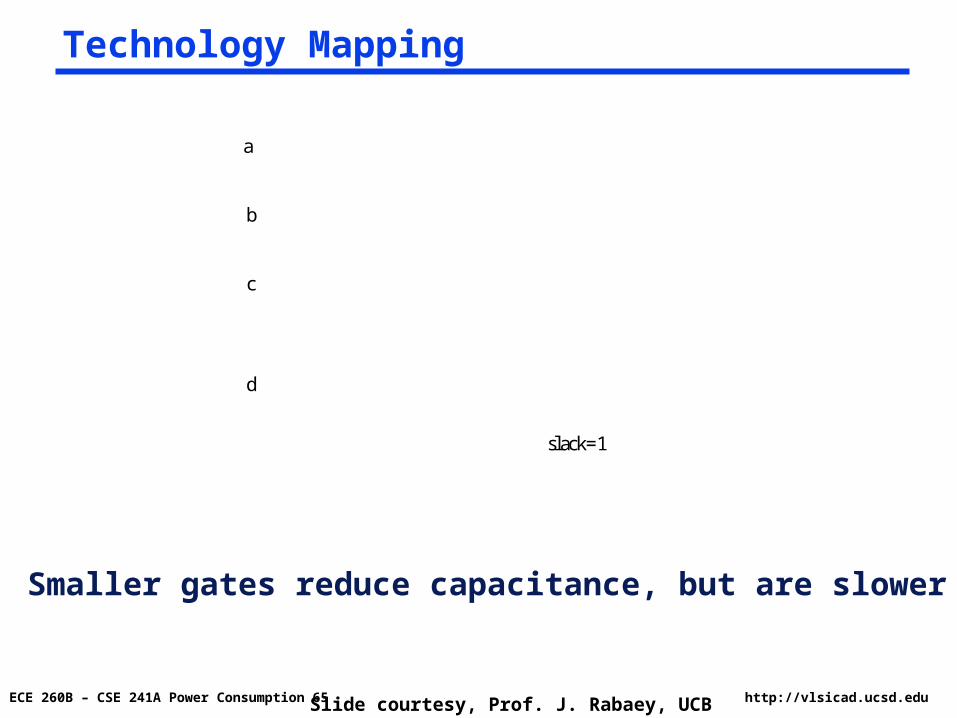
Technology Mapping
a
b
c
d
slack=1
Smaller gates reduce capacitance, but are slower
Slide courtesy, Prof. J. Rabaey, UCB

ECE 260B – CSE 241A Power Consumption 66 http://vlsicad.ucsd.edu
Technology Mapping
Example: 6-input AND
Implemented using 6 input NAND, 3 input NAND, and 2-input NAND [Bellaouar, ElMasry]
Library 1: High-Speed
Library 2: Low-Area
Slide courtesy, Prof. J. Rabaey, UCB

ECE 260B – CSE 241A Power Consumption 67 http://vlsicad.ucsd.edu
Technology Mapping — Example
6-input 3-input 2-inputArea 9 11 13Delay (ns) 1.1 0.86 0.83Energy (fF) 6.7 42.5 89.4
6-input 3-input 2-inputArea 9 11 13Delay (ns) 1.1 0.86 0.83Energy (fF) 6.7 42.5 89.4
6-input 3-input 2-inputLibrary 1 6.7 42.5 89.4Library 2 3.5 19.5 43.7
6-input 3-input 2-inputLibrary 1 6.7 42.5 89.4Library 2 3.5 19.5 43.7
Mapping results for high speed-library
Energy comparison between libraries
Slide courtesy, Prof. J. Rabaey, UCB
ECE 260B – CSE 241A Power Consumption 68 http://vlsicad.ucsd.edu
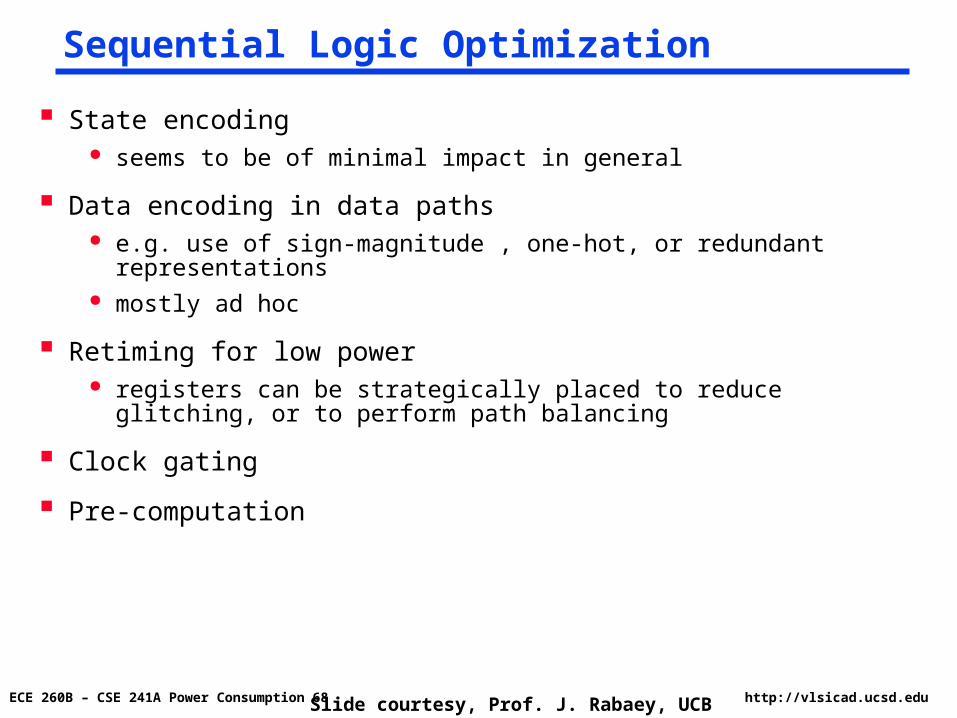
Sequential Logic Optimization
State encoding seems to be of minimal impact in general
Data encoding in data paths e.g. use of sign-magnitude , one-hot, or redundant representations mostly ad hoc
Retiming for low power registers can be strategically placed to reduce glitching, or to perform path
balancing
Clock gating
Pre-computation
Slide courtesy, Prof. J. Rabaey, UCB

ECE 260B – CSE 241A Power Consumption 69 http://vlsicad.ucsd.edu
Clock gating
Requires careful skew control ...Scary in current logic synthesis world!
Slide courtesy, Prof. J. Rabaey, UCB

ECE 260B – CSE 241A Power Consumption 70 http://vlsicad.ucsd.edu
Pre-computation
Other options:• guarded evaluation• set output directly
Inputs xi … xn are not appliedif pre-computing holds
Slide courtesy, Prof. J. Rabaey, UCB

ECE 260B – CSE 241A Power Consumption 71 http://vlsicad.ucsd.edu
Power Compiler
Results: design dependent library dependent average 15-20% push-
button reduction in power
Slide courtesy, Prof. J. Rabaey, UCB
ECE 260B – CSE 241A Power Consumption 72 http://vlsicad.ucsd.edu
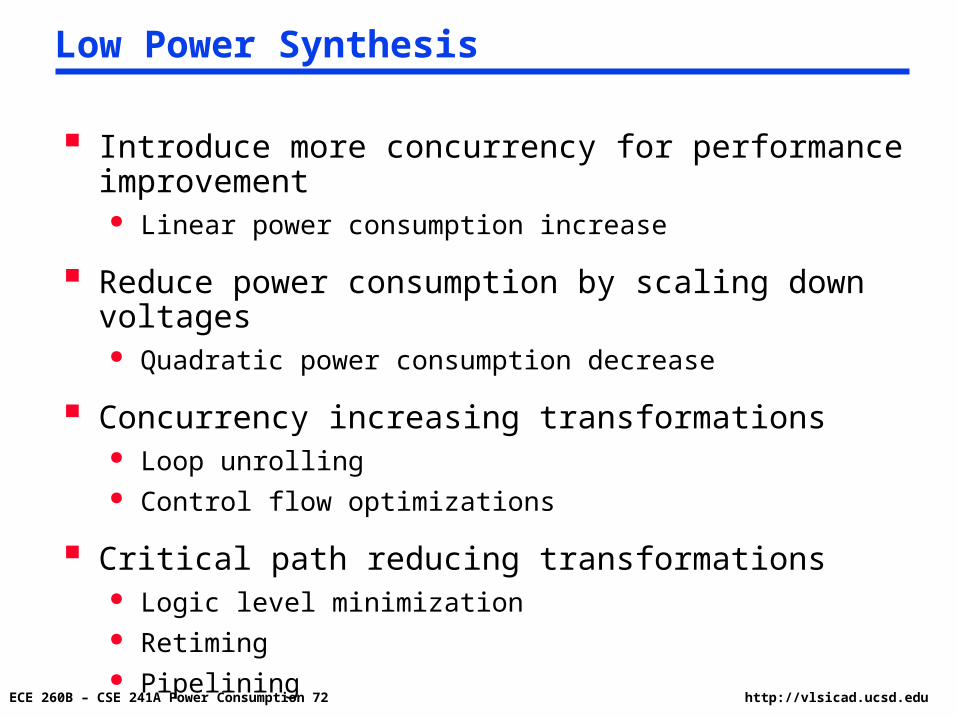
Low Power Synthesis
Introduce more concurrency for performance improvement Linear power consumption increase
Reduce power consumption by scaling down voltages Quadratic power consumption decrease
Concurrency increasing transformations Loop unrolling Control flow optimizations
Critical path reducing transformations Logic level minimization Retiming Pipelining

ECE 260B – CSE 241A Power Consumption 73 http://vlsicad.ucsd.edu
Summary
Design Flow for Power well covered at circuit and gate level
Most emphasis on analysis — not much on optimization
Overall optimization results are mixed
Plenty of room at the physical end transistor sizing, circuit style selection, synthesis for pass-transistor
networks, threshold selection
Slide courtesy, Prof. J. Rabaey, UCB