Embed Size (px)
Citation preview

p.m.
Total earmarked other non-EU EU-15 BE BG CZ DK DE EE IE EL ES FR IT CY LV LT LU HU MT NL AT PL PT RO SI SK FI SE UK HR
1. AGRICULTURE 40,505.9 0.0 24.9 4.7 40,476.2 957.3 0.0 0.0 1,309.1 5,674.9 0.0 1,681.3 2,598.2 5,484.8 9,005.8 5,042.7 0.0 0.0 0.0 21.2 0.0 0.0 1,441.9 1,018.7 0.0 652.7 0.0 0.0 0.0 727.8 798.1 4,061.6 0.0 Direct Aid 25,499.4 0.0 0.0 0.0 25,499.4 264.6 0.0 0.0 705.4 3,687.4 0.0 775.7 1,749.0 3,760.6 6,102.0 3,373.2 0.0 0.0 0.0 15.8 0.0 0.0 223.7 432.3 0.0 413.0 0.0 0.0 0.0 272.3 512.9 3,211.6 0.0 Export refunds 5,646.3 0.0 0.0 0.0 5,646.3 535.8 0.0 0.0 494.9 776.7 0.0 509.6 32.5 211.0 1,340.2 311.1 0.0 0.0 0.0 0.0 0.0 0.0 730.7 71.0 0.0 32.1 0.0 0.0 0.0 107.5 84.4 408.7 0.0 Storage 960.0 0.0 0.0 0.0 960.0 21.2 0.0 0.0 48.2 273.3 0.0 -50.1 8.4 81.7 370.8 216.0 0.0 0.0 0.0 -0.1 0.0 0.0 41.5 24.3 0.0 1.6 0.0 0.0 0.0 2.2 1.8 -80.7 0.0 Rural development 4,176.4 0.0 0.0 0.0 4,176.4 25.4 0.0 0.0 34.2 681.6 0.0 344.4 146.8 395.4 474.1 757.3 0.0 0.0 0.0 6.7 0.0 0.0 59.6 459.0 0.0 132.1 0.0 0.0 0.0 332.5 175.6 151.8 0.0 Other 4,223.7 0.0 24.9 4.7 4,194.0 110.3 0.0 0.0 26.5 256.0 0.0 101.7 661.5 1,036.2 718.7 385.1 0.0 0.0 0.0 -1.2 0.0 0.0 386.3 32.0 0.0 73.9 0.0 0.0 0.0 13.3 23.5 370.3 0.02. STRUCTURAL ACTIONS 27,590.8 2.2 278.6 0.6 27,309.4 379.6 0.0 0.0 125.4 3,745.6 0.0 828.1 2,745.8 5,027.4 2,496.2 5,122.7 0.0 0.0 0.0 10.3 0.0 0.0 477.2 259.6 0.0 2,363.8 0.0 0.0 0.0 542.3 230.3 2,955.3 0.0 Structural funds 25,905.6 2.2 277.5 0.6 25,625.3 379.6 0.0 0.0 125.4 3,745.6 0.0 700.6 2,443.0 3,890.0 2,496.2 5,122.7 0.0 0.0 0.0 10.3 0.0 0.0 477.2 259.6 0.0 2,247.3 0.0 0.0 0.0 542.3 230.3 2,955.3 0.0 Objective 1 15,485.2 0.0 0.0 0.0 15,485.2 122.2 0.0 0.0 0.0 2,389.8 0.0 653.9 2,180.6 2,933.2 457.4 3,425.4 0.0 0.0 0.0 0.0 0.0 0.0 23.5 41.6 0.0 2,062.5 0.0 0.0 0.0 181.7 111.1 902.3 0.0 of which EAGGF 1,940.8 0.0 0.0 0.0 1,940.8 2.9 0.0 0.0 0.0 541.1 0.0 46.0 115.7 99.1 53.4 665.0 0.0 0.0 0.0 0.0 0.0 0.0 0.7 2.9 0.0 309.9 0.0 0.0 0.0 56.0 27.6 20.4 0.0 of which FIFG 306.0 0.0 0.0 0.0 306.0 0.1 0.0 0.0 0.0 7.4 0.0 2.0 5.6 145.4 4.1 90.7 0.0 0.0 0.0 0.0 0.0 0.0 3.5 0.1 0.0 33.5 0.0 0.0 0.0 1.4 2.3 10.1 0.0 of which ERDF 9,760.0 0.0 0.0 0.0 9,760.0 85.2 0.0 0.0 0.0 1,181.8 0.0 372.2 1,660.0 2,191.3 314.3 2,012.4 0.0 0.0 0.0 0.0 0.0 0.0 5.4 34.8 0.0 1,150.5 0.0 0.0 0.0 81.7 70.0 600.4 0.0 of which ESF 3,478.4 0.0 0.0 0.0 3,478.4 33.9 0.0 0.0 0.0 659.6 0.0 233.7 399.4 497.4 85.7 657.3 0.0 0.0 0.0 0.0 0.0 0.0 13.9 3.9 0.0 568.6 0.0 0.0 0.0 42.6 11.1 271.3 0.0 Objective 2 3,859.5 2.2 0.0 0.0 3,857.4 119.5 0.0 0.0 46.5 333.0 0.0 0.0 0.0 233.0 952.7 762.1 0.0 0.0 0.0 1.3 0.0 0.0 150.0 102.5 0.0 0.0 0.0 0.0 0.0 159.2 31.2 966.3 0.0 of which EAGGF 629.9 0.0 0.0 0.0 629.9 6.8 0.0 0.0 0.0 64.9 0.0 0.0 0.0 32.2 158.5 192.5 0.0 0.0 0.0 1.0 0.0 0.0 15.5 50.7 0.0 0.0 0.0 0.0 0.0 41.1 8.6 58.0 0.0 of which ERDF 2,684.0 2.2 0.0 0.0 2,681.8 104.2 0.0 0.0 37.2 135.5 0.0 0.0 0.0 133.6 702.3 503.9 0.0 0.0 0.0 0.3 0.0 0.0 126.7 50.0 0.0 0.0 0.0 0.0 0.0 84.6 16.6 786.8 0.0 of which ESF 545.7 0.0 0.0 0.0 545.7 8.5 0.0 0.0 9.4 132.6 0.0 0.0 0.0 67.2 91.9 65.7 0.0 0.0 0.0 0.0 0.0 0.0 7.8 1.9 0.0 0.0 0.0 0.0 0.0 33.4 6.1 121.4 0.0 Objective 3 (ESF) 3,094.1 0.0 0.0 0.0 3,094.1 78.7 0.0 0.0 26.8 484.8 0.0 0.0 0.0 122.1 767.2 521.9 0.0 0.0 0.0 3.8 0.0 0.0 240.4 59.3 0.0 0.0 0.0 0.0 0.0 67.4 55.5 666.1 0.0 Other Structural measures 980.6 0.0 0.0 0.0 980.6 26.7 0.0 0.0 39.9 271.8 0.0 0.1 0.0 148.4 71.2 169.3 0.0 0.0 0.0 4.7 0.0 0.0 19.7 38.3 0.0 0.1 0.0 0.0 0.0 115.8 16.1 58.5 0.0 of which EAGGF 803.1 0.0 0.0 0.0 803.1 25.4 0.0 0.0 21.3 248.1 0.0 0.0 0.0 128.8 15.8 119.1 0.0 0.0 0.0 4.7 0.0 0.0 19.3 37.6 0.0 0.0 0.0 0.0 0.0 113.5 11.8 57.7 0.0 of which FIFG 177.5 0.0 0.0 0.0 177.5 1.2 0.0 0.0 18.6 23.8 0.0 0.1 0.0 19.6 55.4 50.2 0.0 0.0 0.0 0.0 0.0 0.0 0.3 0.7 0.0 0.1 0.0 0.0 0.0 2.2 4.4 0.8 0.0 Community initiatives 2,301.4 0.0 248.3 0.0 2,053.1 17.1 0.0 0.0 6.1 253.5 0.0 42.1 256.0 401.3 234.4 229.2 0.0 0.0 0.0 0.3 0.0 0.0 41.7 13.9 0.0 181.5 0.0 0.0 0.0 15.3 10.0 350.8 0.0 of which EAGGF 178.4 0.0 0.0 0.0 178.4 6.7 0.0 0.0 0.0 23.2 0.0 2.4 38.3 37.4 21.0 20.9 0.0 0.0 0.0 0.0 0.0 0.0 0.0 1.1 0.0 21.3 0.0 0.0 0.0 1.0 2.8 2.3 0.0 of which FIFG 20.5 0.0 0.0 0.0 20.5 0.1 0.0 0.0 0.0 0.0 0.0 1.2 0.1 0.1 0.4 0.0 0.0 0.0 0.0 0.0 0.0 0.0 1.3 0.0 0.0 14.1 0.0 0.0 0.0 1.0 1.3 1.0 0.0 of which ERDF 1,219.1 0.0 248.3 0.0 970.8 9.1 0.0 0.0 3.4 62.1 0.0 16.3 181.9 296.0 100.3 123.4 0.0 0.0 0.0 0.3 0.0 0.0 3.0 5.3 0.0 135.1 0.0 0.0 0.0 0.1 2.5 32.0 0.0 of which ESF 883.3 0.0 0.0 0.0 883.3 1.2 0.0 0.0 2.7 168.2 0.0 22.2 35.8 67.8 112.7 84.8 0.0 0.0 0.0 0.0 0.0 0.0 37.4 7.5 0.0 11.0 0.0 0.0 0.0 13.2 3.3 315.5 0.0 Innovatory measures and Technical assistance 184.7 0.0 29.2 0.6 155.0 15.4 0.0 0.0 6.0 12.7 0.0 4.4 6.3 52.0 13.4 14.9 0.0 0.0 0.0 0.2 0.0 0.0 1.9 4.0 0.0 3.2 0.0 0.0 0.0 2.9 6.3 11.3 0.0 of which EAGGF 6.5 0.0 0.0 0.0 6.5 1.1 0.0 0.0 0.0 0.1 0.0 0.0 0.1 0.4 0.2 3.4 0.0 0.0 0.0 0.0 0.0 0.0 0.0 0.1 0.0 0.5 0.0 0.0 0.0 0.3 0.2 0.0 0.0 of which FIFG 22.0 0.0 0.3 0.0 21.8 0.2 0.0 0.0 2.9 0.3 0.0 1.2 1.8 4.9 2.5 1.1 0.0 0.0 0.0 0.0 0.0 0.0 1.2 0.0 0.0 1.2 0.0 0.0 0.0 0.2 0.4 4.0 0.0 of which ERDF 120.8 0.0 28.9 0.0 91.8 1.2 0.0 0.0 1.7 6.8 0.0 2.1 3.4 44.7 7.0 8.2 0.0 0.0 0.0 0.0 0.0 0.0 0.3 3.3 0.0 1.1 0.0 0.0 0.0 1.1 4.6 6.3 0.0 of which ESF 35.5 0.0 0.0 0.6 34.9 12.9 0.0 0.0 1.4 5.5 0.0 1.1 1.0 2.1 3.7 2.2 0.0 0.0 0.0 0.2 0.0 0.0 0.4 0.6 0.0 0.4 0.0 0.0 0.0 1.3 1.1 1.0 0.0 Structural funds - Total EAGGF 3,558.6 0.0 0.0 0.0 3,558.6 43.0 0.0 0.0 21.3 877.4 0.0 48.5 154.1 297.9 248.9 1,000.9 0.0 0.0 0.0 5.7 0.0 0.0 35.6 92.3 0.0 331.7 0.0 0.0 0.0 212.0 50.9 138.5 0.0 Structural funds - Total FIFG 526.1 0.0 0.3 0.0 525.8 1.7 0.0 0.0 21.4 31.4 0.0 4.5 7.4 169.9 62.4 141.9 0.0 0.0 0.0 0.0 0.0 0.0 6.2 0.7 0.0 48.9 0.0 0.0 0.0 4.9 8.5 15.9 0.0 Structural funds - Total ERDF 13,783.9 2.2 277.2 0.0 13,504.5 199.7 0.0 0.0 42.3 1,386.2 0.0 390.7 1,845.3 2,665.6 1,123.9 2,648.0 0.0 0.0 0.0 0.6 0.0 0.0 135.5 93.4 0.0 1,286.7 0.0 0.0 0.0 167.5 93.8 1,425.5 0.0 Structural funds - Total ESF 8,037.0 0.0 0.0 0.6 8,036.4 135.3 0.0 0.0 40.3 1,450.6 0.0 257.0 436.2 756.6 1,061.1 1,331.9 0.0 0.0 0.0 4.0 0.0 0.0 299.9 73.2 0.0 580.0 0.0 0.0 0.0 157.9 77.1 1,375.4 0.0 Other specific structural operations 0.0 0.0 0.0 0.0 0.0 0.0 0.0 0.0 0.0 0.0 0.0 0.0 0.0 0.0 0.0 0.0 0.0 0.0 0.0 0.0 0.0 0.0 0.0 0.0 0.0 0.0 0.0 0.0 0.0 0.0 0.0 0.0 0.0 Cohesion Fund 1,685.2 0.0 1.1 0.0 1,684.1 0.0 0.0 0.0 0.0 0.0 0.0 127.5 302.8 1,137.4 0.0 0.0 0.0 0.0 0.0 0.0 0.0 0.0 0.0 0.0 0.0 116.5 0.0 0.0 0.0 0.0 0.0 0.0 0.03. INTERNAL POLICIES 5,370.8 112.2 464.4 137.1 4,657.1 494.1 2.1 3.8 168.4 704.5 1.3 82.2 164.7 259.2 641.5 547.7 1.6 0.7 0.4 74.7 5.5 0.3 272.8 103.3 5.9 179.7 1.0 2.4 1.7 102.2 148.2 713.9 0.7 Training, youth, culture, audiovisual, media, information & 769.4 21.9 73.5 14.6 659.3 109.0 0.1 0.0 11.0 100.3 0.0 26.8 32.9 58.9 88.0 67.1 0.1 0.0 0.0 8.8 0.2 0.0 24.9 15.8 0.2 21.1 0.0 0.0 0.0 16.3 18.3 60.0 0.0 Education, vocational training and youth 483.7 19.4 27.0 9.5 427.9 52.7 0.0 0.0 7.7 64.3 0.0 8.5 27.3 42.8 56.9 51.5 0.1 0.0 0.0 2.9 0.0 0.0 17.0 11.3 0.0 15.3 0.0 0.0 0.0 11.1 12.0 46.7 0.0 Other 285.7 2.6 46.5 5.1 231.5 56.3 0.1 0.0 3.2 36.1 0.0 18.3 5.6 16.1 31.1 15.6 0.1 0.0 0.0 5.9 0.2 0.0 7.9 4.6 0.1 5.8 0.0 0.0 0.0 5.3 6.3 13.3 0.0 Energy, Euratom nuclear safeguards and environment 151.5 1.6 0.9 5.1 144.0 17.1 0.2 0.1 21.5 12.2 0.0 1.6 8.2 9.5 16.6 11.6 0.0 0.0 0.0 4.9 0.1 0.0 6.7 3.0 0.2 3.2 0.1 0.0 0.0 4.8 6.3 16.5 0.0 Energy, Euratom nuclear safeguards 47.4 0.3 0.5 4.6 42.1 6.4 0.2 0.1 1.1 4.5 0.0 0.7 2.0 2.1 7.1 2.4 0.0 0.0 0.0 3.7 0.0 0.0 1.2 1.4 0.2 1.3 0.1 0.0 0.0 0.5 1.0 6.8 0.0 Environment 104.1 1.3 0.4 0.5 101.9 10.8 0.0 0.0 20.5 7.8 0.0 0.9 6.2 7.4 9.5 9.2 0.0 0.0 0.0 1.3 0.1 0.0 5.5 1.7 0.0 1.9 0.0 0.0 0.0 4.3 5.3 9.7 0.0 Consumer protection, internal market, industry and trans 894.6 5.3 17.3 4.9 867.0 150.1 0.0 0.0 63.5 98.1 0.1 6.8 23.4 28.6 82.8 60.0 0.1 0.0 0.0 45.2 0.0 0.0 37.4 26.9 0.0 122.9 0.0 0.0 0.0 25.1 29.3 66.8 0.0 Trans-European networks 507.6 0.0 12.2 0.0 495.4 80.6 0.0 0.0 58.6 78.4 0.0 3.6 10.7 20.4 58.4 45.1 0.0 0.0 0.0 4.1 0.0 0.0 29.5 16.4 0.0 9.0 0.0 0.0 0.0 20.4 25.3 34.9 0.0 Other 386.9 5.3 5.2 4.9 371.5 69.5 0.0 0.0 4.9 19.7 0.1 3.2 12.7 8.2 24.4 14.9 0.1 0.0 0.0 41.1 0.0 0.0 7.9 10.5 0.0 113.9 0.0 0.0 0.0 4.6 4.0 31.9 0.0 Research and technological development 3,408.9 83.3 361.6 111.9 2,852.2 211.7 1.8 3.7 70.5 473.6 1.2 38.1 90.7 146.4 443.4 391.0 1.4 0.6 0.4 15.3 5.1 0.2 195.9 56.1 5.5 27.0 0.9 2.3 1.6 53.6 92.3 546.6 0.7 Other internal policies 146.4 0.1 11.1 0.6 134.7 6.1 0.0 0.0 1.8 20.1 0.0 8.8 9.4 15.8 10.7 18.0 0.0 0.0 0.0 0.5 0.0 0.1 7.9 1.4 0.0 5.5 0.0 0.0 0.0 2.3 2.1 24.1 0.04. EXTERNAL ACTIONS 3,841.4 3.5 1,214.6 2,623.2 0.0 0.0 0.6 0.6 0.0 0.0 0.6 0.0 0.0 0.0 0.0 0.0 2.1 0.3 0.8 0.0 0.6 1.7 0.0 0.0 0.1 0.0 0.6 0.0 0.0 0.0 0.0 0.0 12.95. ADMINISTRATION 4,751.1 111.9 436.3 182.8 4,020.1 2,408.2 1.1 1.7 39.9 131.5 0.8 25.6 19.8 32.3 234.3 98.5 0.7 1.0 0.7 778.9 2.4 0.6 49.3 16.8 2.9 13.8 2.1 1.0 1.1 20.5 24.3 126.4 0.36. RESERVES 186.3 0.0 186.3 0.0 0.0 0.0 0.0 0.0 0.0 0.0 0.0 0.0 0.0 0.0 0.0 0.0 0.0 0.0 0.0 0.0 0.0 0.0 0.0 0.0 0.0 0.0 0.0 0.0 0.0 0.0 0.0 0.0 0.07. PRE-ACCESSION STRATEGY 1,203.7 0.3 253.4 950.0 0.0 0.0 86.5 94.1 0.0 0.0 41.9 0.0 0.0 0.0 0.0 0.0 0.0 49.0 46.3 0.0 147.3 0.0 0.0 0.0 239.2 0.0 154.6 30.8 59.0 0.0 0.0 0.0 0.08. COMPENSATIONS 0.0 0.0 0.0 0.0 0.0 0.0 0.0 0.0 0.0 0.0 0.0 0.0 0.0 0.0 0.0 0.0 0.0 0.0 0.0 0.0 0.0 0.0 0.0 0.0 0.0 0.0 0.0 0.0 0.0 0.0 0.0 0.0 0.0TOTAL EXPENDITURE 83,450.0 230.1 2,858.6 3,898.4 76,462.9 4,239.2 90.2 100.3 1,642.8 10,256.5 44.6 2,617.2 5,528.6 10,803.7 12,377.8 10,811.6 4.4 50.9 48.2 885.2 155.7 2.5 2,241.2 1,398.4 248.0 3,210.1 158.3 34.2 61.8 1,392.7 1,200.9 7,857.2 14.0
VAT-based own resource 35,192.5 922.7 0.0 0.0 557.5 8,794.5 0.0 405.3 527.8 2,584.5 6,077.2 3,840.1 0.0 0.0 0.0 74.6 0.0 0.0 1,743.6 818.1 0.0 505.0 0.0 0.0 0.0 474.4 964.1 6,902.9 0.0GNP-based own resource 37,580.5 1,103.4 0.0 0.0 719.3 8,927.2 0.0 413.4 534.9 2,638.8 6,034.1 5,039.1 0.0 0.0 0.0 75.9 0.0 0.0 1,795.6 894.1 0.0 505.7 0.0 0.0 0.0 554.7 1,143.7 7,200.5 0.0UK correction -70.9 135.8 0.0 0.0 91.4 701.4 0.0 56.5 69.4 304.3 754.6 636.6 0.0 0.0 0.0 10.9 0.0 0.0 209.9 111.4 0.0 61.1 0.0 0.0 0.0 71.0 135.5 -3,420.8 0.0Restitutions EL, ES & PT 0.0 0.0 0.0 0.0 0.0 0.0 0.0 0.0 0.0 0.0 0.0 0.0 0.0 0.0 0.0 0.0 0.0 0.0 0.0 0.0 0.0 0.0 0.0 0.0 0.0 0.0 0.0 0.0 0.0
TOTAL national contribution 72,702.0 2,161.9 0.0 0.0 1,368.2 18,423.1 0.0 875.2 1,132.1 5,527.5 12,866.0 9,515.9 0.0 0.0 0.0 161.4 0.0 0.0 3,749.1 1,823.6 0.0 1,071.9 0.0 0.0 0.0 1,100.2 2,243.3 10,682.6 0.0Traditional own resources (TOR) (90%) 15,267.1 1,226.8 0.0 0.0 316.7 3,351.8 0.0 199.2 201.7 917.8 1,644.9 1,484.1 0.0 0.0 0.0 24.1 0.0 0.0 1,747.6 270.0 0.0 183.1 0.0 0.0 0.0 125.5 389.6 3,184.3 0.0Agricultural duties (100%) 1,198.4 28.5 0.0 0.0 9.5 188.6 0.0 1.4 8.8 41.2 59.3 87.9 0.0 0.0 0.0 0.3 0.0 0.0 222.8 12.8 0.0 29.1 0.0 0.0 0.0 7.3 18.7 482.1 0.0Sugar levies (100%) 1,196.8 75.4 0.0 0.0 42.3 351.4 0.0 12.1 11.1 49.2 342.5 125.2 0.0 0.0 0.0 0.0 0.0 0.0 46.4 34.5 0.0 4.5 0.0 0.0 0.0 9.1 22.1 71.0 0.0Customs duties (100%) 14,568.3 1,259.1 0.0 0.0 300.1 3,184.2 0.0 207.9 204.2 929.4 1,425.8 1,435.9 0.0 0.0 0.0 26.4 0.0 0.0 1,672.6 252.8 0.0 169.8 0.0 0.0 0.0 123.0 392.1 2,985.1 0.0
Amounts (10%) retained as TOR collection costs -1,696.3 -136.3 0.0 0.0 -35.2 -372.4 0.0 -22.1 -22.4 -102.0 -182.8 -164.9 0.0 0.0 0.0 -2.7 0.0 0.0 -194.2 -30.0 0.0 -20.3 0.0 0.0 0.0 -13.9 -43.3 -353.8 0.0TOTAL own resources 87,969.2 3,388.6 0.0 0.0 1,684.8 21,774.9 0.0 1,074.4 1,333.8 6,445.4 14,510.9 10,999.9 0.0 0.0 0.0 185.4 0.0 0.0 5,496.7 2,093.6 0.0 1,255.0 0.0 0.0 0.0 1,225.7 2,632.9 13,867.0 0.0Surplus from previous year 3,209.1Surplus from EAGGF-Guarantee 0.0 p.m. amount of the 1999
UK correction: 4,922.5Other revenue 1,546.1TOTAL REVENUE 92,724.4
Gross National Income (GNI), EUR million* 9,085,290.6 264,204.4 14,189.5 65,425.2 174,375.0 2,099,048.0 5,938.9 93,727.0 144,330.5 643,849.0 1,513,097.0 1,234,822.2 9,668.8 8,508.1 12,226.1 17,170.3 48,661.5 4,259.4 457,356.0 211,027.9 185,705.7 126,019.3 40,458.1 21,966.1 22,226.4 135,412.0 281,897.6 1,688,954.5 23,098.7
Operating budgetary balance (EUR million) 0.00 -323.2 n.a. n.a. +239.6 -8,232.4 n.a. +1,719.5 +4,380.6 +5,263.6 -676.6 +1,231.2 n.a. n.a. n.a. -54.6 n.a. n.a. -1,543.9 -435.5 n.a. +2,128.2 n.a. n.a. n.a. +275.9 -1,058.7 -2,913.7 +13.7Operating budgetary balance (% GNI) 0.00% -0.12% n.a. n.a. +0.14% -0.39% n.a. +1.83% +3.04% +0.82% -0.04% +0.10% n.a. n.a. n.a. -0.32% n.a. n.a. -0.34% -0.21% n.a. +1.69% n.a. n.a. n.a. +0.20% -0.38% -0.17% +0.06%
2000 (EUR million)

p.m.
Total earmarked other non-EU EU-15 BE BG CZ DK DE EE IE EL ES FR IT CY LV LT LU HU MT NL AT PL PT RO SI SK FI SE UK HR
1. AGRICULTURE 41,533.9 0.0 0.0 1.0 41,532.9 937.9 0.0 0.0 1,112.0 5,861.7 0.0 1,584.5 2,613.5 6,184.5 9,230.1 5,343.8 0.0 0.0 0.0 30.8 0.0 0.0 1,111.8 1,052.6 0.0 875.0 0.0 0.0 0.0 815.8 780.1 3,998.8 0.0 Direct Aid 28,027.3 0.0 0.0 0.0 28,027.3 321.0 0.0 0.0 754.6 4,107.5 0.0 869.9 1,845.7 4,304.9 6,785.3 3,583.3 0.0 0.0 0.0 19.0 0.0 0.0 298.9 525.6 0.0 514.1 0.0 0.0 0.0 398.9 533.6 3,165.0 0.0
Export refunds 3,409.1 0.0 0.0 0.0 3,409.1 419.3 0.0 0.0 263.4 568.9 0.0 177.7 36.9 161.8 657.8 240.1 0.0 0.0 0.0 0.0 0.0 0.0 445.9 48.8 0.0 26.1 0.0 0.0 0.0 79.4 69.0 214.1 0.0
Storage 1,126.6 0.0 0.0 0.0 1,126.6 25.7 0.0 0.0 13.2 263.3 0.0 18.0 10.3 217.2 303.8 199.2 0.0 0.0 0.0 0.1 0.0 0.0 24.5 23.2 0.0 -3.1 0.0 0.0 0.0 2.1 7.1 22.0 0.0
Rural development 4,363.8 0.0 0.0 0.0 4,363.8 32.0 0.0 0.0 35.4 709.4 0.0 326.6 75.5 540.9 609.5 658.3 0.0 0.0 0.0 9.6 0.0 0.0 55.1 453.2 0.0 197.3 0.0 0.0 0.0 326.7 150.8 183.7 0.0
Other 4,607.1 0.0 0.0 1.0 4,606.1 139.9 0.0 0.0 45.4 212.6 0.0 192.4 645.2 959.7 873.8 662.9 0.0 0.0 0.0 2.1 0.0 0.0 287.5 1.8 0.0 140.7 0.0 0.0 0.0 8.7 19.6 414.1 0.0
2. STRUCTURAL ACTIONS 22,455.8 0.0 365.3 0.5 22,090.0 154.4 0.0 0.0 40.3 3,573.6 0.0 617.5 2,928.4 7,060.8 1,426.7 2,652.7 0.0 0.0 0.0 4.6 0.0 0.0 220.8 198.3 0.0 1,949.4 0.0 0.0 0.0 80.4 132.6 1,049.3 0.0
Structural funds 20,472.4 0.0 364.9 0.5 20,107.0 154.4 0.0 0.0 40.3 3,573.6 0.0 306.3 2,671.7 6,081.3 1,426.7 2,652.6 0.0 0.0 0.0 4.6 0.0 0.0 220.8 198.3 0.0 1,514.3 0.0 0.0 0.0 80.4 132.6 1,049.1 0.0
Objective 1 13,789.4 0.0 20.5 0.0 13,768.9 45.9 0.0 0.0 0.0 2,305.8 0.0 274.2 2,602.8 4,847.6 315.2 1,693.7 0.0 0.0 0.0 0.0 0.0 0.0 0.7 23.7 0.0 1,435.6 0.0 0.0 0.0 27.5 17.0 179.2 0.0
of which EAGGF 1,765.2 0.0 0.0 0.0 1,765.2 0.0 0.0 0.0 0.0 327.8 0.0 4.2 261.1 604.1 62.1 401.2 0.0 0.0 0.0 0.0 0.0 0.0 0.0 1.8 0.0 62.0 0.0 0.0 0.0 17.7 5.8 17.5 0.0
of which FIFG 159.5 0.0 0.0 0.0 159.5 0.0 0.0 0.0 0.0 0.0 0.0 2.9 15.6 116.5 3.8 11.2 0.0 0.0 0.0 0.0 0.0 0.0 0.0 0.0 0.0 6.9 0.0 0.0 0.0 0.4 0.1 2.1 0.0
of which ERDF 8,844.3 0.0 20.5 0.0 8,823.8 36.3 0.0 0.0 0.0 1,017.5 0.0 173.2 1,733.8 3,409.1 182.4 1,102.9 0.0 0.0 0.0 0.0 0.0 0.0 0.0 14.2 0.0 997.0 0.0 0.0 0.0 8.1 9.2 140.0 0.0
of which ESF 3,020.4 0.0 0.0 0.0 3,020.4 9.6 0.0 0.0 0.0 960.5 0.0 93.9 592.2 717.9 66.8 178.4 0.0 0.0 0.0 0.0 0.0 0.0 0.7 7.7 0.0 369.8 0.0 0.0 0.0 1.4 1.9 19.6 0.0
Objective 2 3,137.9 0.0 0.0 0.0 3,137.9 28.6 0.0 0.0 2.3 540.7 0.0 0.0 0.0 759.6 618.4 338.6 0.0 0.0 0.0 1.3 0.0 0.0 104.1 86.1 0.0 0.0 0.0 0.0 0.0 22.0 29.6 606.6 0.0
of which EAGGF 142.9 0.0 0.0 0.0 142.9 4.0 0.0 0.0 0.0 25.6 0.0 0.0 0.0 0.0 26.8 73.3 0.0 0.0 0.0 0.4 0.0 0.0 0.8 0.1 0.0 0.0 0.0 0.0 0.0 0.0 0.0 11.9 0.0
of which ERDF 2,700.4 0.0 0.0 0.0 2,700.4 18.3 0.0 0.0 2.1 454.9 0.0 0.0 0.0 683.8 509.9 255.9 0.0 0.0 0.0 0.9 0.0 0.0 103.2 83.8 0.0 0.0 0.0 0.0 0.0 21.8 26.1 539.6 0.0
of which ESF 294.6 0.0 0.0 0.0 294.6 6.3 0.0 0.0 0.2 60.1 0.0 0.0 0.0 75.7 81.8 9.4 0.0 0.0 0.0 0.0 0.0 0.0 0.0 2.2 0.0 0.0 0.0 0.0 0.0 0.2 3.5 55.1 0.0
Objective 3 (ESF) 1,630.3 0.0 0.0 0.0 1,630.3 42.3 0.0 0.0 13.7 541.2 0.0 0.0 0.0 163.3 309.6 247.6 0.0 0.0 0.0 0.0 0.0 0.0 61.3 64.2 0.0 0.0 0.0 0.0 0.0 17.0 71.0 99.2 0.0
Other Structural measures 115.6 0.0 0.0 0.0 115.6 4.8 0.0 0.0 17.3 4.2 0.0 0.1 0.0 12.5 0.2 34.7 0.0 0.0 0.0 2.1 0.0 0.0 20.6 0.4 0.0 0.0 0.0 0.0 0.0 0.0 0.0 18.6 0.0
of which EAGGF 69.4 0.0 0.0 0.0 69.4 2.2 0.0 0.0 17.3 0.0 0.0 0.0 0.0 0.0 0.0 21.8 0.0 0.0 0.0 2.1 0.0 0.0 16.4 0.0 0.0 0.0 0.0 0.0 0.0 0.0 0.0 9.6 0.0
of which FIFG 46.2 0.0 0.0 0.0 46.2 2.6 0.0 0.0 0.0 4.2 0.0 0.1 0.0 12.5 0.2 12.9 0.0 0.0 0.0 0.0 0.0 0.0 4.2 0.4 0.0 0.0 0.0 0.0 0.0 0.0 0.0 9.0 0.0
Community initiatives 1,701.4 0.0 329.0 0.0 1,372.4 17.6 0.0 0.0 4.7 170.6 0.0 30.8 63.1 289.7 177.7 327.5 0.0 0.0 0.0 0.0 0.0 0.0 33.0 22.5 0.0 72.7 0.0 0.0 0.0 12.3 11.9 138.3 0.0
of which EAGGF 161.7 0.0 0.0 0.0 161.7 1.6 0.0 0.0 1.2 11.3 0.0 5.8 12.8 14.9 43.3 26.8 0.0 0.0 0.0 0.0 0.0 0.0 5.8 5.9 0.0 19.8 0.0 0.0 0.0 3.9 2.8 5.9 0.0
of which FIFG 11.9 0.0 0.0 0.0 11.9 0.1 0.0 0.0 0.0 0.0 0.0 0.0 0.0 6.3 0.2 5.3 0.0 0.0 0.0 0.0 0.0 0.0 0.0 0.0 0.0 0.0 0.0 0.0 0.0 0.0 0.0 0.1 0.0
of which ERDF 1,023.3 0.0 329.0 0.0 694.3 4.8 0.0 0.0 1.3 113.8 0.0 6.9 24.7 178.9 109.6 121.4 0.0 0.0 0.0 0.0 0.0 0.0 12.6 9.5 0.0 44.4 0.0 0.0 0.0 3.3 3.1 60.0 0.0
of which ESF 504.4 0.0 0.0 0.0 504.4 11.1 0.0 0.0 2.2 45.5 0.0 18.1 25.7 89.6 24.6 174.0 0.0 0.0 0.0 0.0 0.0 0.0 14.6 7.2 0.0 8.4 0.0 0.0 0.0 5.1 6.0 72.3 0.0
Innovatory measures and Technical assistance 97.9 0.0 15.4 0.5 81.9 15.2 0.0 0.0 2.3 11.1 0.0 1.2 5.7 8.7 5.7 10.4 0.0 0.0 0.0 1.2 0.0 0.0 1.2 1.4 0.0 6.0 0.0 0.0 0.0 1.7 3.0 7.2 0.0
of which EAGGF 5.8 0.0 0.0 0.0 5.8 0.3 0.0 0.0 0.0 4.0 0.0 0.0 0.0 0.4 0.5 0.1 0.0 0.0 0.0 0.0 0.0 0.0 0.1 0.0 0.0 0.0 0.0 0.0 0.0 0.2 0.1 0.0 0.0
of which FIFG 11.5 0.0 0.0 0.0 11.5 0.6 0.0 0.0 0.9 0.2 0.0 0.4 1.1 3.1 0.9 0.8 0.0 0.0 0.0 0.2 0.0 0.0 0.8 0.0 0.0 0.9 0.0 0.0 0.0 0.1 0.0 1.5 0.0
of which ERDF 55.2 0.0 15.3 0.0 39.8 6.1 0.0 0.0 0.4 4.6 0.0 0.3 3.2 2.8 3.3 6.4 0.0 0.0 0.0 0.9 0.0 0.0 0.3 0.8 0.0 3.5 0.0 0.0 0.0 1.1 2.4 3.6 0.0
of which ESF 25.3 0.0 0.1 0.5 24.8 8.2 0.0 0.0 1.0 2.3 0.0 0.4 1.3 2.5 1.0 3.1 0.0 0.0 0.0 0.1 0.0 0.0 0.0 0.5 0.0 1.5 0.0 0.0 0.0 0.2 0.5 2.1 0.0
Structural funds - Total EAGGF 2,145.0 0.0 0.0 0.0 2,145.0 8.1 0.0 0.0 18.5 368.7 0.0 10.0 273.9 619.4 132.7 523.2 0.0 0.0 0.0 2.5 0.0 0.0 23.2 7.9 0.0 81.8 0.0 0.0 0.0 21.7 8.8 44.8 0.0
Structural funds - Total FIFG 229.1 0.0 0.0 0.0 229.1 3.2 0.0 0.0 0.9 4.5 0.0 3.4 16.7 138.4 5.0 30.2 0.0 0.0 0.0 0.2 0.0 0.0 5.0 0.4 0.0 7.8 0.0 0.0 0.0 0.5 0.1 12.6 0.0
Structural funds - Total ERDF 12,623.2 0.0 364.8 0.0 12,258.4 65.5 0.0 0.0 3.8 1,590.8 0.0 180.5 1,761.8 4,274.6 805.2 1,486.7 0.0 0.0 0.0 1.9 0.0 0.0 116.1 108.2 0.0 1,044.9 0.0 0.0 0.0 34.4 40.8 743.3 0.0
Structural funds - Total ESF 5,475.0 0.0 0.1 0.5 5,474.5 77.5 0.0 0.0 17.1 1,609.7 0.0 112.4 619.2 1,049.0 483.7 612.5 0.0 0.0 0.0 0.1 0.0 0.0 76.6 81.8 0.0 379.8 0.0 0.0 0.0 23.8 82.9 248.4 0.0
Other specific structural operations 0.0 0.0 0.0 0.0 0.0 0.0 0.0 0.0 0.0 0.0 0.0 0.0 0.0 0.0 0.0 0.0 0.0 0.0 0.0 0.0 0.0 0.0 0.0 0.0 0.0 0.0 0.0 0.0 0.0 0.0 0.0 0.0 0.0
Cohesion Fund 1,983.4 0.0 0.4 0.0 1,983.0 0.0 0.0 0.0 0.0 0.0 0.0 311.2 256.8 979.5 0.0 0.1 0.0 0.0 0.0 0.0 0.0 0.0 0.0 0.0 0.0 435.2 0.0 0.0 0.0 0.0 0.0 0.2 0.0
3. INTERNAL POLICIES 5,303.1 201.5 412.8 162.9 4,525.9 516.9 2.9 8.2 156.8 678.1 1.9 79.6 165.4 276.5 657.7 498.2 2.6 1.9 1.6 68.4 6.5 0.4 293.9 125.9 8.3 83.3 2.0 3.5 2.0 99.7 142.3 683.3 0.6
Training, youth, culture, audiovisual, media, information & 880.6 96.2 7.7 28.2 748.6 115.7 0.9 0.5 16.7 102.4 0.1 26.2 34.4 77.7 103.9 82.7 0.2 0.4 0.3 9.0 1.0 0.2 28.8 22.0 0.5 20.3 0.8 0.5 0.1 19.4 22.2 67.0 0.0
Education, vocational training and youth 567.6 85.9 2.8 19.0 460.0 60.1 0.8 0.2 10.7 65.3 0.1 7.1 27.3 49.3 55.3 56.0 0.2 0.3 0.3 3.7 0.8 0.2 15.8 15.5 0.1 13.9 0.7 0.5 0.1 12.9 14.7 52.5 0.0
Other 313.0 10.3 4.9 9.2 288.6 55.6 0.0 0.3 6.0 37.1 0.1 19.2 7.1 28.5 48.6 26.7 0.0 0.1 0.0 5.3 0.2 0.0 13.0 6.5 0.3 6.4 0.0 0.0 0.0 6.5 7.5 14.5 0.0
Energy, Euratom nuclear safeguards and environment 208.0 1.7 2.4 7.2 196.7 19.5 0.0 0.1 23.6 23.6 0.5 2.2 9.5 20.4 20.5 16.6 0.0 0.3 0.1 4.2 0.1 0.0 9.8 8.7 0.2 5.1 0.1 0.3 0.0 8.3 7.2 17.5 0.0
Energy, Euratom nuclear safeguards 52.2 0.4 0.3 5.4 46.1 5.8 0.0 0.1 1.3 5.5 0.0 0.9 2.7 3.0 7.5 2.3 0.0 0.0 0.0 3.3 0.0 0.0 1.5 1.8 0.2 1.4 0.1 0.0 0.0 0.8 1.3 7.0 0.0
Environment 155.8 1.3 2.2 1.8 150.6 13.7 0.0 0.0 22.3 18.1 0.5 1.3 6.8 17.4 13.0 14.2 0.0 0.3 0.1 0.9 0.1 0.0 8.4 7.0 0.0 3.7 0.0 0.3 0.0 7.4 5.9 10.5 0.0
Consumer protection, internal market, industry and trans 863.3 3.9 84.7 4.0 770.7 124.6 0.0 0.0 45.4 72.5 0.0 8.7 27.4 28.9 138.0 39.3 0.1 0.0 0.0 42.9 0.0 0.0 59.7 35.6 0.0 17.2 0.0 0.0 0.0 16.4 18.8 95.4 0.0
Trans-European networks 482.1 0.0 13.5 0.0 468.6 51.7 0.0 0.0 41.6 49.5 0.0 5.4 14.7 19.1 110.1 22.0 0.0 0.0 0.0 4.3 0.0 0.0 49.8 22.7 0.0 3.5 0.0 0.0 0.0 11.3 10.0 52.8 0.0
Other 381.2 3.9 71.2 4.0 302.1 72.9 0.0 0.0 3.8 23.1 0.0 3.3 12.6 9.8 27.9 17.3 0.1 0.0 0.0 38.6 0.0 0.0 9.9 12.8 0.0 13.7 0.0 0.0 0.0 5.0 8.8 42.7 0.0
Research and technological development 3,195.9 97.2 288.5 122.2 2,688.0 250.8 2.0 7.5 69.4 471.7 1.2 32.2 83.9 139.9 383.4 344.0 2.2 1.2 1.1 11.5 5.3 0.2 187.9 58.3 7.6 27.1 1.2 2.6 1.9 53.8 91.9 482.2 0.6
Other internal policies 155.3 2.5 29.5 1.3 122.0 6.3 0.0 0.0 1.7 7.8 0.0 10.2 10.2 9.6 11.8 15.6 0.0 0.0 0.0 0.8 0.0 0.0 7.7 1.2 0.0 13.7 0.0 0.0 0.0 1.9 2.2 21.2 0.0
4. EXTERNAL ACTIONS 4,230.6 7.2 1,161.1 3,062.3 0.0 0.0 0.2 0.8 0.0 0.0 0.4 0.0 0.0 0.0 0.0 0.0 4.8 0.3 0.6 0.0 0.4 4.0 0.0 0.0 0.1 0.0 1.0 0.1 0.1 0.0 0.0 0.0 14.9
5. ADMINISTRATION 4,855.1 104.4 419.0 177.0 4,154.7 2,378.9 1.4 1.5 41.3 133.5 0.7 28.9 20.5 36.2 360.0 104.1 0.8 0.9 0.5 785.9 2.3 0.7 49.8 17.6 4.5 15.3 1.5 1.1 1.1 23.3 27.0 132.2 0.7
6. RESERVES 207.2 0.0 207.2 0.0 0.0 0.0 0.0 0.0 0.0 0.0 0.0 0.0 0.0 0.0 0.0 0.0 0.0 0.0 0.0 0.0 0.0 0.0 0.0 0.0 0.0 0.0 0.0 0.0 0.0 0.0 0.0 0.0 0.0
7. PRE-ACCESSION STRATEGY 1,401.7 0.4 144.4 1,256.9 0.0 0.0 155.1 88.7 0.0 0.0 30.1 0.0 0.0 0.0 0.0 0.0 0.0 53.6 67.7 0.0 185.9 0.0 0.0 0.0 315.4 0.0 243.0 51.0 66.0 0.0 0.0 0.0 0.0
8. COMPENSATIONS 0.0 0.0 0.0 0.0 0.0 0.0 0.0 0.0 0.0 0.0 0.0 0.0 0.0 0.0 0.0 0.0 0.0 0.0 0.0 0.0 0.0 0.0 0.0 0.0 0.0 0.0 0.0 0.0 0.0 0.0 0.0 0.0 0.0
TOTAL EXPENDITURE 79,987.3 313.5 2,709.7 4,660.7 72,303.5 3,988.0 159.5 99.1 1,350.5 10,246.9 33.2 2,310.5 5,727.9 13,557.9 11,674.5 8,598.8 8.2 56.6 70.4 889.7 195.2 5.1 1,676.4 1,394.4 328.3 2,923.1 247.5 55.7 69.1 1,019.2 1,082.0 5,863.6 16.2
VAT-based own resource 31,320.3 862.9 0.0 0.0 572.2 7,089.4 0.0 453.2 499.3 2,408.0 5,610.0 3,918.0 0.0 0.0 0.0 104.3 0.0 0.0 1,599.4 762.1 0.0 467.0 0.0 0.0 0.0 427.5 783.7 5,763.3 0.0
GNP-based own resource 34,878.8 1,117.7 0.0 0.0 719.6 8,037.2 0.0 482.0 521.8 2,568.7 5,687.0 4,923.8 0.0 0.0 0.0 109.4 0.0 0.0 1,690.9 848.4 0.0 497.7 0.0 0.0 0.0 534.6 926.3 6,213.7 0.0
UK correction -70.3 304.0 0.0 0.0 195.0 1,451.8 0.0 116.0 147.0 710.2 1,664.9 1,371.8 0.0 0.0 0.0 22.8 0.0 0.0 480.9 251.8 0.0 135.6 0.0 0.0 0.0 152.7 267.6 -7,342.5 0.0
Restitutions EL, ES & PT 0.0 0.0 0.0 0.0 0.0 0.0 0.0 0.0 0.0 0.0 0.0 0.0 0.0 0.0 0.0 0.0 0.0 0.0 0.0 0.0 0.0 0.0 0.0 0.0 0.0 0.0 0.0 0.0 0.0
TOTAL national contribution 66,128.8 2,284.5 0.0 0.0 1,486.8 16,578.5 0.0 1,051.2 1,168.0 5,686.9 12,961.9 10,213.6 0.0 0.0 0.0 236.5 0.0 0.0 3,771.3 1,862.3 0.0 1,100.4 0.0 0.0 0.0 1,114.8 1,977.6 4,634.4 0.0
Traditional own resources (TOR) (90%) 14,589.2 1,247.1 0.0 0.0 290.9 3,148.7 0.0 160.1 182.0 904.6 1,509.4 1,398.9 0.0 0.0 0.0 20.0 0.0 0.0 1,745.7 228.7 0.0 165.6 0.0 0.0 0.0 118.3 360.2 3,109.0 0.0
Agricultural duties (100%) 1,132.9 24.8 0.0 0.0 5.9 153.2 0.0 0.8 10.1 36.8 103.3 57.4 0.0 0.0 0.0 0.2 0.0 0.0 204.4 8.7 0.0 32.6 0.0 0.0 0.0 6.3 16.9 471.4 0.0
Sugar levies (100%) 840.0 49.3 0.0 0.0 26.7 218.4 0.0 9.0 13.7 35.7 215.1 79.8 0.0 0.0 0.0 0.0 0.0 0.0 90.1 22.8 0.0 2.0 0.0 0.0 0.0 6.8 16.6 54.1 0.0
Customs duties (100%) 14,237.4 1,311.6 0.0 0.0 290.6 3,127.0 0.0 168.1 178.5 932.7 1,358.7 1,417.1 0.0 0.0 0.0 22.0 0.0 0.0 1,645.1 222.6 0.0 149.4 0.0 0.0 0.0 118.4 366.7 2,928.9 0.0
Amounts (10%) retained as TOR collection costs -1,621.0 -138.6 0.0 0.0 -32.3 -349.9 0.0 -17.8 -20.2 -100.5 -167.7 -155.4 0.0 0.0 0.0 -2.2 0.0 0.0 -194.0 -25.4 0.0 -18.4 0.0 0.0 0.0 -13.1 -40.0 -345.4 0.0
TOTAL own resources 80,718.1 3,531.6 0.0 0.0 1,777.7 19,727.2 0.0 1,211.3 1,350.1 6,591.5 14,471.3 11,612.5 0.0 0.0 0.0 256.5 0.0 0.0 5,517.0 2,091.0 0.0 1,266.0 0.0 0.0 0.0 1,233.2 2,337.7 7,743.4 0.0
Surplus from previous year 11,612.7
Surplus from EAGGF-Guarantee 0.0 p.m. amount of the 2000
UK correction: 4,132.6
Other revenue 1,958.5
TOTAL REVENUE 94,289.3
Gross National Income (GNI), EUR million* 9,403,852.7 270,112.6 16,077.8 73,169.5 181,477.3 2,157,979.0 6,644.4 103,570.0 153,437.0 692,127.0 1,572,414.1 1,295,155.1 10,566.1 9,354.7 13,458.2 18,237.6 56,847.5 4,561.9 473,075.0 217,184.5 211,881.6 133,102.2 45,160.5 23,322.7 23,875.2 144,379.0 267,846.4 1,723,755.9 25,449.9
Operating budgetary balance (EUR million) 0.00 -745.2 n.a. n.a. -223.1 -6,971.5 n.a. +1,198.3 +4,503.6 +7,661.2 -2,043.4 -2,030.9 n.a. n.a. n.a. -140.0 n.a. n.a. -2,259.9 -542.4 n.a. +1,773.8 n.a. n.a. n.a. -153.0 -982.9 +955.4 +15.6
Operating budgetary balance (% GNI) 0.00% -0.28% n.a. n.a. -0.12% -0.32% n.a. +1.16% +2.94% +1.11% -0.13% -0.16% n.a. n.a. n.a. -0.77% n.a. n.a. -0.48% -0.25% n.a. +1.33% n.a. n.a. n.a. -0.11% -0.37% +0.06% +0.06%
2001 (EUR million)

p.m.
Total earmarked other non-EU EU-15 BE BG CZ DK DE EE IE EL ES FR IT CY LV LT LU HU MT NL AT PL PT RO SI SK FI SE UK HR
1. AGRICULTURE 43,520.6 0.0 0.0 1.0 43,519.5 949.0 0.0 0.0 1,223.4 6,812.7 0.0 1,724.4 2,637.2 5,959.7 9,781.5 5,695.1 0.0 0.0 0.0 38.3 0.0 0.0 1,177.5 1,092.1 0.0 768.6 0.0 0.0 0.0 838.8 817.6 4,003.3 0.0 Direct Aid 28,836.0 0.0 0.0 0.0 28,836.0 374.2 0.0 0.0 825.1 5,041.0 0.0 890.7 1,789.4 3,834.8 7,108.7 3,785.3 0.0 0.0 0.0 23.0 0.0 0.0 353.3 577.3 0.0 389.8 0.0 0.0 0.0 437.7 586.6 2,819.1 0.0
Export refunds 3,444.7 0.0 0.0 0.0 3,444.7 390.3 0.0 0.0 298.3 480.8 0.0 176.8 38.8 148.2 729.5 264.1 0.0 0.0 0.0 0.0 0.0 0.0 460.6 59.4 0.0 27.6 0.0 0.0 0.0 78.8 43.5 248.1 0.0
Storage 1,173.2 0.0 0.0 0.0 1,173.2 12.5 0.0 0.0 4.7 286.7 0.0 135.4 4.3 194.1 211.6 170.8 0.0 0.0 0.0 0.1 0.0 0.0 63.4 5.6 0.0 19.2 0.0 0.0 0.0 10.1 6.2 48.5 0.0
Rural development 4,349.4 0.0 0.0 0.0 4,349.4 44.2 0.0 0.0 49.6 730.7 0.0 329.5 147.4 445.0 656.8 652.5 0.0 0.0 0.0 11.2 0.0 0.0 50.6 440.4 0.0 160.4 0.0 0.0 0.0 320.1 163.1 147.8 0.0
Other 5,717.3 0.0 0.0 1.0 5,716.3 127.8 0.0 0.0 45.7 273.6 0.0 191.9 657.3 1,337.6 1,075.0 822.5 0.0 0.0 0.0 4.0 0.0 0.0 249.6 9.4 0.0 171.5 0.0 0.0 0.0 -8.0 18.3 740.0 0.0
2. STRUCTURAL ACTIONS 23,499.0 0.0 252.2 0.5 23,246.4 245.3 0.0 0.0 60.3 3,413.8 0.0 757.4 1,825.4 8,832.2 1,273.7 1,813.7 0.0 0.0 0.0 9.5 0.0 0.0 55.0 185.9 0.0 2,993.8 0.0 0.0 0.0 222.6 237.9 1,320.0 0.0
Structural funds 20,312.0 0.0 252.0 0.5 20,059.5 245.3 0.0 0.0 60.3 3,413.8 0.0 565.2 1,348.6 6,723.6 1,273.7 1,813.7 0.0 0.0 0.0 9.5 0.0 0.0 55.0 185.9 0.0 2,584.6 0.0 0.0 0.0 222.6 237.9 1,320.0 0.0
Objective 1 15,369.1 0.0 0.0 0.0 15,369.1 131.4 0.0 0.0 0.0 2,499.3 0.0 560.7 1,259.8 5,834.4 319.9 1,347.3 0.0 0.0 0.0 0.0 0.0 0.0 1.9 38.0 0.0 2,561.9 0.0 0.0 0.0 114.8 100.5 599.2 0.0
of which EAGGF 1,479.8 0.0 0.0 0.0 1,479.8 4.6 0.0 0.0 0.0 409.5 0.0 11.4 86.3 611.7 44.8 33.7 0.0 0.0 0.0 0.0 0.0 0.0 0.1 7.3 0.0 234.9 0.0 0.0 0.0 14.4 11.6 9.4 0.0
of which FIFG 242.0 0.0 0.0 0.0 242.0 0.0 0.0 0.0 0.0 12.9 0.0 1.7 0.0 172.8 1.8 24.4 0.0 0.0 0.0 0.0 0.0 0.0 0.0 0.0 0.0 25.0 0.0 0.0 0.0 0.0 0.2 3.0 0.0
of which ERDF 9,522.2 0.0 0.0 0.0 9,522.2 114.8 0.0 0.0 0.0 1,163.3 0.0 440.3 876.7 3,517.5 157.6 1,114.4 0.0 0.0 0.0 0.0 0.0 0.0 1.8 24.3 0.0 1,630.1 0.0 0.0 0.0 73.9 69.2 338.3 0.0
of which ESF 4,125.2 0.0 0.0 0.0 4,125.2 11.9 0.0 0.0 0.0 913.6 0.0 107.3 296.8 1,532.4 115.7 174.8 0.0 0.0 0.0 0.0 0.0 0.0 0.0 6.3 0.0 672.0 0.0 0.0 0.0 26.5 19.5 248.4 0.0
Objective 2 1,641.2 0.0 0.0 0.0 1,641.2 31.4 0.0 0.0 16.8 389.9 0.0 0.0 0.0 424.0 409.2 18.6 0.0 0.0 0.0 3.5 0.0 0.0 40.4 48.3 0.0 0.0 0.0 0.0 0.0 52.1 65.5 141.5 0.0
of which EAGGF 26.1 0.0 0.0 0.0 26.1 0.0 0.0 0.0 0.0 24.6 0.0 0.0 0.0 0.0 1.5 0.0 0.0 0.0 0.0 0.0 0.0 0.0 0.0 0.0 0.0 0.0 0.0 0.0 0.0 0.0 0.0 0.0 0.0
of which ERDF 1,477.2 0.0 0.0 0.0 1,477.2 28.9 0.0 0.0 12.7 310.6 0.0 0.0 0.0 402.7 369.6 18.6 0.0 0.0 0.0 3.5 0.0 0.0 40.4 47.8 0.0 0.0 0.0 0.0 0.0 42.2 59.8 140.4 0.0
of which ESF 137.9 0.0 0.0 0.0 137.9 2.5 0.0 0.0 4.1 54.7 0.0 0.0 0.0 21.3 38.1 0.0 0.0 0.0 0.0 0.0 0.0 0.0 0.0 0.5 0.0 0.0 0.0 0.0 0.0 9.9 5.7 1.1 0.0
Objective 3 (ESF) 2,404.4 0.0 0.0 0.0 2,404.4 58.1 0.0 0.0 22.1 484.9 0.0 0.0 0.0 361.9 422.3 335.5 0.0 0.0 0.0 4.1 0.0 0.0 0.6 87.5 0.0 0.0 0.0 0.0 0.0 40.9 57.0 529.4 0.0
Other Structural measures 155.0 0.0 0.0 0.0 155.0 1.9 0.0 0.0 16.5 1.9 0.0 0.1 0.1 18.5 76.3 26.2 0.0 0.0 0.0 0.0 0.0 0.0 2.2 0.9 0.0 0.0 0.0 0.0 0.0 1.4 3.4 5.7 0.0
of which EAGGF 79.2 0.0 0.0 0.0 79.2 1.0 0.0 0.0 0.0 0.0 0.0 0.0 0.0 0.0 65.1 13.1 0.0 0.0 0.0 0.0 0.0 0.0 0.0 0.0 0.0 0.0 0.0 0.0 0.0 0.0 0.0 0.0 0.0
of which FIFG 75.8 0.0 0.0 0.0 75.8 0.9 0.0 0.0 16.5 1.9 0.0 0.1 0.1 18.5 11.2 13.2 0.0 0.0 0.0 0.0 0.0 0.0 2.2 0.9 0.0 0.0 0.0 0.0 0.0 1.4 3.4 5.7 0.0
Community initiatives 556.5 0.0 237.1 0.0 319.4 9.2 0.0 0.0 1.2 23.6 0.0 0.6 72.7 56.3 32.6 60.3 0.0 0.0 0.0 0.5 0.0 0.0 4.3 2.4 0.0 15.2 0.0 0.0 0.0 9.0 1.4 30.0 0.0
of which EAGGF 85.2 0.0 0.0 0.0 85.2 2.2 0.0 0.0 0.0 16.9 0.0 0.0 0.0 34.0 2.2 17.6 0.0 0.0 0.0 0.1 0.0 0.0 0.8 1.6 0.0 5.8 0.0 0.0 0.0 1.9 0.0 2.0 0.0
of which FIFG 0.2 0.0 0.0 0.0 0.2 0.0 0.0 0.0 0.0 0.0 0.0 0.0 0.0 0.1 0.0 0.0 0.0 0.0 0.0 0.0 0.0 0.0 0.0 0.0 0.0 0.0 0.0 0.0 0.0 0.0 0.0 0.0 0.0
of which ERDF 450.5 0.0 237.1 0.0 213.4 6.2 0.0 0.0 0.4 4.0 0.0 0.4 72.6 21.5 27.2 42.2 0.0 0.0 0.0 0.0 0.0 0.0 3.5 0.8 0.0 3.6 0.0 0.0 0.0 6.5 0.5 24.2 0.0
of which ESF 20.6 0.0 0.0 0.0 20.6 0.8 0.0 0.0 0.8 2.8 0.0 0.2 0.1 0.8 3.1 0.6 0.0 0.0 0.0 0.4 0.0 0.0 0.0 0.0 0.0 5.8 0.0 0.0 0.0 0.5 0.9 3.9 0.0
Innovatory measures and Technical assistance 185.8 0.0 14.9 0.5 170.4 13.3 0.0 0.0 3.7 14.2 0.0 3.8 16.1 28.5 13.3 25.7 0.0 0.0 0.0 1.3 0.0 0.0 5.4 8.8 0.0 7.5 0.0 0.0 0.0 4.4 10.1 14.3 0.0
of which EAGGF 1.8 0.0 0.0 0.0 1.8 0.3 0.0 0.0 0.2 0.2 0.0 0.0 0.0 0.1 0.1 0.3 0.0 0.0 0.0 0.0 0.0 0.0 0.0 0.1 0.0 0.0 0.0 0.0 0.0 0.1 0.1 0.4 0.0
of which FIFG 7.2 0.0 0.0 0.0 7.2 0.3 0.0 0.0 1.6 0.0 0.0 0.1 0.6 0.4 0.8 0.4 0.0 0.0 0.0 0.1 0.0 0.0 0.6 0.0 0.0 0.4 0.0 0.0 0.0 0.1 0.1 1.6 0.0
of which ERDF 139.6 0.0 14.9 0.0 124.7 2.0 0.0 0.0 0.0 11.4 0.0 2.6 13.0 22.3 10.3 20.9 0.0 0.0 0.0 1.1 0.0 0.0 4.2 8.0 0.0 5.0 0.0 0.0 0.0 3.6 9.1 11.3 0.0
of which ESF 37.1 0.0 0.0 0.5 36.6 10.8 0.0 0.0 1.8 2.6 0.0 1.2 2.4 5.7 2.1 4.0 0.0 0.0 0.0 0.1 0.0 0.0 0.6 0.7 0.0 2.1 0.0 0.0 0.0 0.7 0.8 1.0 0.0
Structural funds - Total EAGGF 1,672.1 0.0 0.0 0.0 1,672.1 8.1 0.0 0.0 0.2 451.2 0.0 11.4 86.3 645.7 113.8 64.6 0.0 0.0 0.0 0.1 0.0 0.0 0.9 9.0 0.0 240.7 0.0 0.0 0.0 16.5 11.7 11.8 0.0
Structural funds - Total FIFG 325.2 0.0 0.0 0.0 325.1 1.2 0.0 0.0 18.2 14.8 0.0 1.9 0.8 191.7 13.9 38.0 0.0 0.0 0.0 0.1 0.0 0.0 2.9 0.9 0.0 25.4 0.0 0.0 0.0 1.4 3.7 10.3 0.0
Structural funds - Total ERDF 11,589.5 0.0 252.0 0.0 11,337.5 151.9 0.0 0.0 13.1 1,489.2 0.0 443.2 962.3 3,964.0 564.7 1,196.1 0.0 0.0 0.0 4.6 0.0 0.0 49.9 80.9 0.0 1,638.6 0.0 0.0 0.0 126.1 138.6 514.1 0.0
Structural funds - Total ESF 6,725.2 0.0 0.0 0.5 6,724.7 84.1 0.0 0.0 28.8 1,458.5 0.0 108.7 299.2 1,922.1 581.3 515.0 0.0 0.0 0.0 4.7 0.0 0.0 1.2 95.0 0.0 679.9 0.0 0.0 0.0 78.6 83.8 783.8 0.0
Other specific structural operations 39.0 0.0 0.0 0.0 39.0 0.0 0.0 0.0 0.0 0.0 0.0 0.0 0.0 36.9 0.0 0.0 0.0 0.0 0.0 0.0 0.0 0.0 0.0 0.0 0.0 2.1 0.0 0.0 0.0 0.0 0.0 0.0 0.0
Cohesion Fund 3,148.0 0.0 0.2 0.0 3,147.8 0.0 0.0 0.0 0.0 0.0 0.0 192.2 476.8 2,071.7 0.0 0.0 0.0 0.0 0.0 0.0 0.0 0.0 0.0 0.0 0.0 407.1 0.0 0.0 0.0 0.0 0.0 0.0 0.0
3. INTERNAL POLICIES 6,566.7 280.8 429.8 234.8 5,621.3 538.7 4.9 10.1 140.5 1,327.2 4.5 79.3 198.3 373.4 681.6 578.9 4.8 3.9 1.8 87.7 13.5 0.8 302.4 262.1 18.1 84.9 4.6 6.7 4.0 117.8 153.7 694.8 0.2
Training, youth, culture, audiovisual, media, information & 930.1 97.4 6.8 30.8 795.2 100.3 1.1 1.2 19.9 117.9 0.4 31.0 39.7 88.9 107.4 82.2 0.2 0.1 0.4 8.7 2.2 0.3 34.9 23.7 1.3 23.1 1.0 0.6 0.3 22.0 22.2 73.1 0.0
Education, vocational training and youth 592.4 93.8 2.4 20.1 476.1 41.4 1.0 0.9 10.6 75.2 0.4 10.0 30.3 53.8 58.8 53.4 0.2 0.1 0.3 3.0 0.8 0.3 19.9 16.1 0.9 17.2 0.8 0.5 0.2 15.3 13.5 57.6 0.0
Other 337.7 3.6 4.4 10.6 319.1 58.9 0.1 0.2 9.3 42.7 0.1 21.0 9.4 35.1 48.7 28.8 0.0 0.1 0.1 5.7 1.5 0.0 15.0 7.6 0.4 5.9 0.1 0.0 0.1 6.7 8.7 15.6 0.0
Energy, Euratom nuclear safeguards and environment 197.5 4.9 3.1 7.1 182.4 20.6 0.0 0.0 26.4 17.7 0.2 2.0 10.1 19.1 14.8 18.7 0.0 1.5 0.0 5.3 0.0 0.0 9.6 6.3 0.0 3.0 0.3 0.0 0.0 5.2 7.4 16.4 0.0
Energy, Euratom nuclear safeguards 45.6 0.5 0.0 4.8 40.4 4.3 0.0 0.0 0.7 4.1 0.0 0.5 3.3 3.8 6.6 2.1 0.0 0.0 0.0 4.5 0.0 0.0 1.6 1.0 0.0 1.0 0.0 0.0 0.0 0.5 0.7 5.7 0.0
Environment 151.9 4.4 3.1 2.4 142.0 16.3 0.0 0.0 25.6 13.6 0.2 1.5 6.8 15.2 8.1 16.6 0.0 1.5 0.0 0.8 0.0 0.0 8.0 5.2 0.0 2.1 0.3 0.0 0.0 4.7 6.8 10.6 0.0
Consumer protection, internal market, industry and trans 1,039.6 5.2 219.8 5.1 809.5 137.9 0.0 0.0 10.4 151.6 0.0 6.2 32.2 52.0 110.9 66.1 0.0 0.0 0.0 53.0 0.0 0.0 28.0 22.8 0.0 24.9 0.0 0.0 0.0 24.3 23.8 65.5 0.0
Trans-European networks 656.3 0.0 141.3 0.0 515.0 68.2 0.0 0.0 6.0 131.6 0.0 2.6 21.9 41.7 82.1 51.4 0.0 0.0 0.0 7.8 0.0 0.0 17.8 12.4 0.0 11.3 0.0 0.0 0.0 20.4 16.3 23.5 0.0
Other 383.3 5.2 78.5 5.1 294.5 69.7 0.0 0.0 4.4 19.9 0.0 3.6 10.3 10.2 28.8 14.8 0.0 0.0 0.0 45.1 0.0 0.0 10.2 10.5 0.0 13.7 0.0 0.0 0.0 3.9 7.4 42.0 0.0
Research and technological development 3,667.2 173.3 198.0 191.0 3,104.9 273.3 3.7 9.0 80.2 589.1 3.8 33.9 103.9 189.2 419.0 393.8 4.6 2.3 1.3 19.5 11.3 0.4 223.1 73.9 16.8 28.9 3.3 6.1 3.7 64.1 97.3 515.8 0.2
Other internal policies 732.2 0.0 2.3 0.7 729.3 6.7 0.0 0.0 3.6 451.0 0.0 6.2 12.4 24.2 29.5 18.1 0.0 0.0 0.0 1.2 0.0 0.0 6.7 135.4 0.0 5.0 0.0 0.0 0.0 2.3 2.9 24.0 0.0
4. EXTERNAL ACTIONS 4,423.7 0.4 1,190.5 3,232.8 0.0 0.0 0.7 1.3 0.0 0.0 0.3 0.0 0.0 0.0 0.0 0.0 11.6 0.3 0.6 0.0 0.4 12.2 0.0 0.0 0.2 0.0 0.4 1.3 0.2 0.0 0.0 0.0 8.3
5. ADMINISTRATION 5,211.6 133.2 368.5 172.6 4,537.3 2,605.7 1.2 1.3 44.7 143.6 0.7 36.4 22.5 45.6 418.9 112.4 0.9 1.2 0.9 818.6 2.2 0.8 50.6 20.1 2.5 19.1 1.6 1.1 1.1 28.8 27.3 142.9 0.8
6. RESERVES 170.5 0.0 170.5 0.0 0.0 0.0 0.0 0.0 0.0 0.0 0.0 0.0 0.0 0.0 0.0 0.0 0.0 0.0 0.0 0.0 0.0 0.0 0.0 0.0 0.0 0.0 0.0 0.0 0.0 0.0 0.0 0.0 0.0
7. PRE-ACCESSION STRATEGY 1,752.4 1.6 146.1 1,604.8 0.0 0.0 136.3 241.7 0.0 0.0 37.8 0.0 0.0 0.0 0.0 0.0 0.0 48.6 96.7 0.0 123.6 0.0 0.0 0.0 511.6 0.0 233.3 58.5 116.4 0.0 0.0 0.0 0.0
8. COMPENSATIONS 0.0 0.0 0.0 0.0 0.0 0.0 0.0 0.0 0.0 0.0 0.0 0.0 0.0 0.0 0.0 0.0 0.0 0.0 0.0 0.0 0.0 0.0 0.0 0.0 0.0 0.0 0.0 0.0 0.0 0.0 0.0 0.0 0.0
TOTAL EXPENDITURE 85,144.5 416.0 2,557.6 5,246.5 76,924.4 4,338.8 143.1 254.4 1,469.0 11,697.3 43.2 2,597.5 4,683.3 15,210.9 12,155.7 8,200.0 17.4 54.0 100.0 954.1 139.8 13.9 1,585.5 1,560.2 532.4 3,866.5 239.9 67.6 121.7 1,208.1 1,236.5 6,161.0 9.3
VAT-based own resource 22,388.2 513.6 0.0 0.0 418.2 4,760.1 0.0 281.6 365.6 1,829.3 4,012.1 2,719.0 0.0 0.0 0.0 51.8 0.0 0.0 1,155.2 553.7 0.0 335.1 0.0 0.0 0.0 289.1 565.0 4,538.7 0.0
GNI-based own resource 45,947.6 1,335.7 0.0 0.0 893.1 10,504.5 0.0 537.5 704.8 3,430.7 7,684.7 6,390.4 0.0 0.0 0.0 100.7 0.0 0.0 2,264.9 1,070.0 0.0 635.9 0.0 0.0 0.0 693.5 1,220.7 8,480.5 0.0
UK correction 148.2 280.0 0.0 0.0 196.2 353.0 0.0 114.6 145.5 705.8 1,505.9 1,301.9 0.0 0.0 0.0 21.3 0.0 0.0 86.3 34.5 0.0 130.8 0.0 0.0 0.0 137.8 68.1 -4,933.5 0.0
TOTAL national contribution 68,484.0 2,129.4 0.0 0.0 1,507.5 15,617.6 0.0 933.8 1,215.9 5,965.9 13,202.7 10,411.3 0.0 0.0 0.0 173.7 0.0 0.0 3,506.3 1,658.2 0.0 1,101.8 0.0 0.0 0.0 1,120.3 1,853.9 8,085.7 0.0
Traditional own resources (TOR) (75%) 9,214.0 888.5 0.0 0.0 180.4 1,964.6 0.0 85.1 121.6 585.3 949.6 868.1 0.0 0.0 0.0 10.1 0.0 0.0 961.1 150.5 0.0 85.5 0.0 0.0 0.0 64.2 232.3 2,067.1 0.0
Agricultural duties (100%) 1,180.2 22.9 0.0 0.0 7.4 144.2 0.0 0.7 12.0 38.1 132.6 72.6 0.0 0.0 0.0 0.2 0.0 0.0 201.8 10.8 0.0 20.4 0.0 0.0 0.0 3.7 14.7 498.2 0.0
Sugar levies (100%) 864.8 50.4 0.0 0.0 29.4 311.6 0.0 6.9 11.4 23.0 234.3 59.1 0.0 0.0 0.0 0.0 0.0 0.0 57.0 23.3 0.0 0.9 0.0 0.0 0.0 5.3 13.1 39.2 0.0
Customs duties (100%) 12,917.5 1,346.2 0.0 0.0 258.5 2,743.2 0.0 135.4 173.2 887.7 1,178.1 1,290.7 0.0 0.0 0.0 16.7 0.0 0.0 1,340.5 208.9 0.0 123.0 0.0 0.0 0.0 98.7 348.0 2,768.7 0.0
15% of 2001 amounts retained as TOR collection costs -2,023.0 -176.1 0.0 0.0 -41.1 -434.6 0.0 -22.2 -25.8 -126.3 -209.2 -198.6 0.0 0.0 0.0 -2.6 0.0 0.0 -238.6 -31.8 0.0 -22.7 0.0 0.0 0.0 -16.7 -49.3 -427.5 0.0
Amounts (25%) retained as TOR collection costs -3,725.6 -354.9 0.0 0.0 -73.8 -799.7 0.0 -35.8 -49.2 -237.2 -386.2 -355.6 0.0 0.0 0.0 -4.2 0.0 0.0 -399.5 -60.7 0.0 -36.1 0.0 0.0 0.0 -26.9 -94.2 -811.4 0.0
TOTAL own resources 77,698.0 3,017.9 0.0 0.0 1,687.9 17,582.2 0.0 1,018.8 1,337.5 6,551.2 14,152.3 11,279.5 0.0 0.0 0.0 183.8 0.0 0.0 4,467.4 1,808.7 0.0 1,187.3 0.0 0.0 0.0 1,184.5 2,086.2 10,152.8 0.0
Surplus from previous year 15,002.5
Surplus from EAGGF-Guarantee 372.5 p.m. amount of the 2001
UK correction: 4,896.3
Other revenue 2,361.4
TOTAL REVENUE 95,434.4
Gross National Income (GNI), EUR million* 9,727,482.6 279,097.6 17,815.1 83,811.5 187,565.7 2,180,217.0 7,409.4 113,201.0 163,244.1 740,968.0 1,610,451.8 1,340,097.2 11,242.8 10,150.7 14,977.5 20,208.8 67,893.5 4,732.5 493,219.0 225,205.2 209,435.7 140,137.0 48,298.3 24,927.7 26,267.0 148,731.0 281,132.6 1,804,006.7 28,046.5
Operating budgetary balance (EUR million) 0.00 -517.7 n.a. n.a. -169.1 -4,954.0 n.a. +1,574.1 +3,375.7 +8,859.4 -2,218.4 -2,917.1 n.a. n.a. n.a. -48.1 n.a. n.a. -2,171.3 -212.6 n.a. +2,682.7 n.a. n.a. n.a. -4.9 -750.4 -2,528.4 +8.5
Operating budgetary balance (% GNI) 0.00% -0.19% n.a. n.a. -0.09% -0.23% n.a. +1.39% +2.07% +1.20% -0.14% -0.22% n.a. n.a. n.a. -0.24% n.a. n.a. -0.44% -0.09% n.a. +1.91% n.a. n.a. n.a. -0.00% -0.27% -0.14% +0.03%
2002 (EUR million)

p.m.
Total earmarked other non-EU EU-15 BE BG CZ DK DE EE IE EL ES FR IT CY LV LT LU HU MT NL AT PL PT RO SI SK FI SE UK HR
1. AGRICULTURE 44,379.2 0.0 0.7 0.4 44,378.1 1,025.3 0.0 0.0 1,223.8 5,876.9 0.0 1,965.2 2,762.1 6,485.4 10,464.1 5,393.4 0.0 0.0 0.0 44.3 0.0 0.0 1,397.3 1,128.1 0.0 855.9 0.0 0.0 0.0 876.1 866.5 4,013.8 0.0 Direct Aid 29,697.6 0.0 0.0 0.0 29,697.6 419.4 0.0 0.0 842.3 4,024.3 0.0 1,102.2 1,882.3 4,528.5 7,640.9 3,466.9 0.0 0.0 0.0 25.9 0.0 0.0 410.3 606.4 0.0 527.6 0.0 0.0 0.0 445.9 625.0 3,149.5 0.0
Export refunds 3,729.6 0.0 0.0 0.0 3,729.6 429.6 0.0 0.0 267.6 499.2 0.0 225.7 27.8 123.1 795.8 289.9 0.0 0.0 0.0 0.0 0.0 0.0 567.0 50.0 0.0 23.4 0.0 0.0 0.0 84.5 43.8 302.3 0.0
Storage 928.1 0.0 0.0 0.0 928.1 14.6 0.0 0.0 16.5 249.1 0.0 85.0 8.9 112.6 152.9 218.7 0.0 0.0 0.0 0.1 0.0 0.0 15.8 1.9 0.0 7.2 0.0 0.0 0.0 2.8 9.2 32.8 0.0
Rural development 4,679.6 0.0 0.0 0.0 4,679.6 46.7 0.0 0.0 46.4 799.0 0.0 341.9 136.4 495.4 824.7 641.1 0.0 0.0 0.0 16.8 0.0 0.0 67.7 458.1 0.0 152.3 0.0 0.0 0.0 337.0 165.8 150.4 0.0
Other 5,344.3 0.0 0.7 0.4 5,343.1 115.1 0.0 0.0 50.9 305.2 0.0 210.4 706.6 1,225.8 1,049.8 776.7 0.0 0.0 0.0 1.5 0.0 0.0 336.5 11.8 0.0 145.4 0.0 0.0 0.0 5.9 22.6 378.8 0.0
2. STRUCTURAL ACTIONS 28,527.6 0.0 64.9 0.4 28,462.3 118.4 0.0 0.0 105.5 3,788.1 0.0 603.9 1,908.3 9,036.5 1,978.2 4,542.3 0.0 0.0 0.0 6.4 0.1 0.0 218.0 299.9 0.0 3,741.3 0.0 0.0 0.0 327.6 395.7 1,392.1 0.0
Structural funds 26,243.5 0.0 64.9 0.4 26,178.2 118.4 0.0 0.0 105.5 3,788.1 0.0 431.8 1,868.3 7,226.3 1,978.2 4,542.3 0.0 0.0 0.0 6.4 0.1 0.0 218.0 299.9 0.0 3,479.7 0.0 0.0 0.0 327.6 395.7 1,392.1 0.0
Objective 1 18,986.0 0.0 0.6 0.0 18,985.4 33.1 0.0 0.0 0.0 2,564.5 0.0 423.9 1,811.4 6,202.8 418.5 3,378.2 0.0 0.0 0.0 0.0 0.0 0.0 15.7 41.3 0.0 3,381.9 0.0 0.0 0.0 130.7 138.9 444.7 0.0
of which EAGGF 2,343.4 0.0 0.0 0.0 2,343.4 14.0 0.0 0.0 0.0 477.8 0.0 14.5 129.3 792.8 91.3 485.0 0.0 0.0 0.0 0.0 0.0 0.0 0.6 6.5 0.0 265.0 0.0 0.0 0.0 18.3 14.7 33.7 0.0
of which FIFG 401.7 0.0 0.0 0.0 401.7 0.0 0.0 0.0 0.0 29.3 0.0 6.8 41.4 261.3 4.0 8.7 0.0 0.0 0.0 0.0 0.0 0.0 1.6 0.0 0.0 36.6 0.0 0.0 0.0 2.0 0.5 9.5 0.0
of which ERDF 12,048.7 0.0 0.6 0.0 12,048.1 19.0 0.0 0.0 0.0 1,353.7 0.0 293.2 972.0 3,812.5 278.5 2,413.2 0.0 0.0 0.0 0.0 0.0 0.0 12.4 30.4 0.0 2,358.0 0.0 0.0 0.0 65.0 97.7 342.7 0.0
of which ESF 4,192.2 0.0 0.0 0.0 4,192.2 0.1 0.0 0.0 0.0 703.7 0.0 109.4 668.7 1,336.2 44.8 471.3 0.0 0.0 0.0 0.0 0.0 0.0 1.1 4.4 0.0 722.3 0.0 0.0 0.0 45.4 26.1 58.8 0.0
Objective 2 3,587.0 0.0 0.0 0.0 3,587.0 40.4 0.0 0.0 27.7 437.5 0.0 0.0 0.0 536.6 1,031.7 486.2 0.0 0.0 0.0 0.0 0.0 0.0 93.8 116.2 0.0 0.0 0.0 0.0 0.0 64.3 104.5 648.1 0.0
of which EAGGF 66.2 0.0 0.0 0.0 66.2 0.0 0.0 0.0 0.0 5.8 0.0 0.0 0.0 0.6 0.0 54.6 0.0 0.0 0.0 0.0 0.0 0.0 0.0 5.3 0.0 0.0 0.0 0.0 0.0 0.0 0.0 0.0 0.0
of which ERDF 3,223.0 0.0 0.0 0.0 3,223.0 39.3 0.0 0.0 23.2 364.4 0.0 0.0 0.0 502.7 956.2 400.3 0.0 0.0 0.0 0.0 0.0 0.0 93.5 103.0 0.0 0.0 0.0 0.0 0.0 42.2 88.5 609.5 0.0
of which ESF 297.8 0.0 0.0 0.0 297.8 1.0 0.0 0.0 4.5 67.3 0.0 0.0 0.0 33.2 75.5 31.3 0.0 0.0 0.0 0.0 0.0 0.0 0.3 7.9 0.0 0.0 0.0 0.0 0.0 22.1 16.0 38.6 0.0
Objective 3 (ESF) 2,548.3 0.0 0.0 0.0 2,548.3 17.4 0.0 0.0 28.5 567.5 0.0 0.0 0.0 333.9 440.3 550.8 0.0 0.0 0.0 4.7 0.0 0.0 73.4 94.9 0.0 0.0 0.0 0.0 0.0 88.6 109.6 238.6 0.0
Other Structural measures 175.9 0.0 0.0 0.0 175.9 1.9 0.0 0.0 25.3 56.9 0.0 0.0 0.0 18.3 14.7 30.6 0.0 0.0 0.0 0.0 0.0 0.0 8.2 7.2 0.0 0.0 0.0 0.0 0.0 6.7 6.1 0.0 0.0
of which EAGGF 89.2 0.0 0.0 0.0 89.2 1.1 0.0 0.0 0.0 51.4 0.0 0.0 0.0 0.0 0.0 26.8 0.0 0.0 0.0 0.0 0.0 0.0 0.0 7.0 0.0 0.0 0.0 0.0 0.0 0.0 2.9 0.0 0.0
of which FIFG 86.6 0.0 0.0 0.0 86.6 0.8 0.0 0.0 25.3 5.4 0.0 0.0 0.0 18.3 14.7 3.8 0.0 0.0 0.0 0.0 0.0 0.0 8.2 0.2 0.0 0.0 0.0 0.0 0.0 6.7 3.3 0.0 0.0
Community initiatives 801.0 0.0 58.4 0.0 742.6 9.5 0.0 0.0 20.3 144.6 0.0 6.6 43.1 116.6 59.7 82.8 0.0 0.0 0.0 0.6 0.0 0.0 20.9 35.8 0.0 93.0 0.0 0.0 0.0 33.1 30.2 45.9 0.0
of which EAGGF 104.8 0.0 0.0 0.0 104.8 0.2 0.0 0.0 1.0 4.7 0.0 2.1 7.0 16.7 10.6 11.3 0.0 0.0 0.0 0.1 0.0 0.0 3.6 6.4 0.0 29.1 0.0 0.0 0.0 4.9 4.3 2.9 0.0
of which FIFG 0.3 0.0 0.0 0.0 0.3 0.0 0.0 0.0 0.0 0.0 0.0 0.0 0.0 0.0 0.2 0.0 0.0 0.0 0.0 0.0 0.0 0.0 0.0 0.0 0.0 0.0 0.0 0.0 0.0 0.1 0.0 0.0 0.0
of which ERDF 463.7 0.0 58.4 0.0 405.3 4.0 0.0 0.0 9.7 88.8 0.0 0.3 22.4 67.7 30.0 50.0 0.0 0.0 0.0 0.0 0.0 0.0 14.9 23.6 0.0 47.4 0.0 0.0 0.0 12.9 11.2 22.6 0.0
of which ESF 232.2 0.0 0.0 0.0 232.2 5.3 0.0 0.0 9.6 51.2 0.0 4.2 13.7 32.2 19.0 21.5 0.0 0.0 0.0 0.5 0.0 0.0 2.4 5.8 0.0 16.5 0.0 0.0 0.0 15.2 14.7 20.4 0.0
Innovatory measures and Technical assistance 145.4 0.0 5.9 0.4 139.0 16.1 0.0 0.0 3.7 17.2 0.0 1.3 13.8 18.2 13.3 13.8 0.0 0.0 0.0 1.1 0.1 0.0 6.0 4.5 0.0 4.7 0.0 0.0 0.0 4.3 6.2 14.8 0.0
of which EAGGF 9.2 0.0 0.0 0.0 9.2 0.9 0.0 0.0 0.0 5.7 0.0 0.0 0.0 0.0 0.5 0.1 0.0 0.0 0.0 0.0 0.0 0.0 0.0 0.8 0.0 0.1 0.0 0.0 0.0 0.2 0.4 0.4 0.0
of which FIFG 6.3 0.0 0.0 0.0 6.3 0.7 0.0 0.0 0.2 0.1 0.0 0.1 0.6 2.1 0.5 0.2 0.0 0.0 0.0 0.2 0.0 0.0 0.3 0.0 0.0 0.3 0.0 0.0 0.0 0.2 0.1 0.6 0.0
of which ERDF 101.6 0.0 5.9 0.2 95.5 5.3 0.0 0.0 1.6 8.5 0.0 1.0 11.2 13.4 11.8 9.5 0.0 0.0 0.0 0.9 0.1 0.0 5.2 3.7 0.0 2.8 0.0 0.0 0.0 3.2 4.9 12.5 0.0
of which ESF 28.3 0.0 0.0 0.2 28.1 9.3 0.0 0.0 1.9 2.8 0.0 0.2 2.0 2.7 0.4 3.9 0.0 0.0 0.0 0.1 0.0 0.0 0.5 0.0 0.0 1.5 0.0 0.0 0.0 0.7 0.8 1.2 0.0
Structural funds - Total EAGGF 2,612.8 0.0 0.0 0.0 2,612.8 16.2 0.0 0.0 1.0 545.4 0.0 16.6 136.3 810.1 102.4 577.8 0.0 0.0 0.0 0.1 0.0 0.0 4.2 25.9 0.0 294.2 0.0 0.0 0.0 23.4 22.2 37.0 0.0
Structural funds - Total FIFG 495.0 0.0 0.0 0.0 494.9 1.5 0.0 0.0 25.5 34.8 0.0 6.9 42.0 281.7 19.4 12.7 0.0 0.0 0.0 0.2 0.0 0.0 10.1 0.2 0.0 37.0 0.0 0.0 0.0 8.9 3.8 10.2 0.0
Structural funds - Total ERDF 15,836.9 0.0 64.8 0.2 15,771.9 67.6 0.0 0.0 34.5 1,815.5 0.0 294.4 1,005.6 4,396.3 1,276.4 2,873.1 0.0 0.0 0.0 0.9 0.1 0.0 126.0 160.8 0.0 2,408.3 0.0 0.0 0.0 123.2 202.3 987.2 0.0
Structural funds - Total ESF 7,298.7 0.0 0.0 0.2 7,298.5 33.1 0.0 0.0 44.5 1,392.4 0.0 113.9 684.4 1,738.3 580.0 1,078.7 0.0 0.0 0.0 5.3 0.0 0.0 77.7 112.9 0.0 740.3 0.0 0.0 0.0 172.1 167.3 357.7 0.0
Other specific structural operations 89.0 0.0 0.0 0.0 89.0 0.0 0.0 0.0 0.0 0.0 0.0 0.0 0.0 85.5 0.0 0.0 0.0 0.0 0.0 0.0 0.0 0.0 0.0 0.0 0.0 3.5 0.0 0.0 0.0 0.0 0.0 0.0 0.0
Cohesion Fund 2,195.1 0.0 0.1 0.0 2,195.1 0.0 0.0 0.0 0.0 0.0 0.0 172.1 40.1 1,724.7 0.0 0.0 0.0 0.0 0.0 0.0 0.0 0.0 0.0 0.0 0.0 258.1 0.0 0.0 0.0 0.0 0.0 0.0 0.0
3. INTERNAL POLICIES 5,671.8 299.5 295.8 257.7 4,818.8 554.7 6.1 12.2 115.1 780.1 5.0 81.6 158.8 307.2 642.6 568.4 4.6 3.3 3.0 97.1 15.3 1.3 322.5 129.0 23.5 154.5 5.6 7.6 6.8 116.0 161.7 629.6 0.4
Training, youth, culture, audiovisual, media, information & 943.3 88.7 8.8 36.5 809.3 108.3 1.5 1.1 19.3 109.5 1.0 34.0 43.8 87.5 108.7 94.2 0.8 0.6 0.9 9.7 2.2 0.7 32.4 26.4 2.7 22.1 1.1 0.7 0.4 21.4 23.1 69.0 0.1
Education, vocational training and youth 607.6 82.8 1.7 22.7 500.3 37.3 1.1 0.6 10.6 76.0 0.2 10.1 34.6 58.8 60.6 68.3 0.7 0.3 0.7 3.0 0.6 0.6 20.6 16.9 1.3 17.5 0.9 0.6 0.3 14.9 15.9 55.1 0.0
Other 335.7 5.9 7.0 13.8 309.0 71.0 0.4 0.5 8.7 33.4 0.7 23.9 9.1 28.7 48.1 25.9 0.1 0.3 0.2 6.7 1.7 0.1 11.7 9.5 1.4 4.7 0.2 0.1 0.1 6.6 7.2 13.9 0.1
Energy, Euratom nuclear safeguards and environment 211.7 10.8 0.2 6.8 193.9 21.0 0.0 0.1 26.9 18.6 0.8 2.9 10.2 15.7 13.9 23.7 0.0 0.5 0.0 4.8 0.4 0.0 10.9 5.9 0.0 4.9 0.4 0.6 0.9 6.9 8.8 18.9 0.0
Energy, Euratom nuclear safeguards 41.9 1.8 0.0 2.8 37.4 3.0 0.0 0.1 1.6 4.9 0.0 0.8 1.6 2.3 5.4 1.8 0.0 0.0 0.0 4.1 0.0 0.0 3.5 1.7 0.0 0.7 0.0 0.0 0.1 0.6 1.1 4.2 0.0
Environment 169.8 9.0 0.2 4.0 156.6 18.0 0.0 0.0 25.3 13.6 0.8 2.2 8.6 13.4 8.4 21.9 0.0 0.5 0.0 0.7 0.4 0.0 7.4 4.2 0.0 4.1 0.4 0.6 0.8 6.3 7.7 14.8 0.0
Consumer protection, internal market, industry and trans 1,079.2 20.6 110.4 14.1 934.0 137.6 0.8 0.7 10.0 156.9 0.2 8.4 14.3 46.2 106.6 104.4 0.1 0.2 0.2 60.1 0.7 0.1 60.9 31.9 1.2 44.3 0.5 0.3 0.2 25.3 38.4 88.8 0.0
Trans-European networks 631.5 2.3 19.8 0.1 609.3 69.0 0.0 0.0 5.0 126.5 0.0 4.5 3.1 36.6 83.5 89.0 0.0 0.0 0.0 28.9 0.0 0.0 42.3 17.9 0.0 6.3 0.0 0.0 0.0 20.6 31.9 44.1 0.0
Other 447.7 18.4 90.6 14.0 324.7 68.6 0.8 0.7 5.0 30.4 0.2 3.8 11.1 9.6 23.1 15.4 0.1 0.2 0.2 31.1 0.7 0.0 18.6 14.0 1.2 38.0 0.5 0.3 0.2 4.7 6.5 44.6 0.0
Research and technological development 3,279.6 179.3 173.8 199.6 2,726.8 272.0 3.8 10.3 55.7 490.0 3.0 31.8 82.0 145.6 404.9 328.2 3.7 2.0 1.9 21.5 12.0 0.6 213.3 63.4 19.6 31.4 3.6 6.0 5.3 60.9 89.1 436.9 0.3
Other internal policies 158.0 0.0 2.7 0.7 154.7 15.8 0.0 0.0 3.2 5.1 0.0 4.5 8.5 12.2 8.5 17.9 0.0 0.0 0.0 1.0 0.0 0.0 4.9 1.5 0.0 51.7 0.0 0.0 0.0 1.5 2.3 15.9 0.0
4. EXTERNAL ACTIONS 4,285.8 6.3 831.2 3,448.4 0.0 0.0 0.9 0.9 0.0 0.0 0.3 0.0 0.0 0.0 0.0 0.0 11.3 0.2 0.4 0.0 0.7 8.2 0.0 0.0 0.6 0.0 0.1 0.0 0.0 0.0 0.0 0.0 26.4
5. ADMINISTRATION 5,305.2 135.3 308.5 150.4 4,711.0 2,778.7 1.1 1.6 45.3 149.8 0.8 39.5 20.8 45.9 274.2 121.7 1.0 1.1 1.0 948.0 2.3 0.9 53.9 20.3 2.3 18.1 2.1 1.2 1.1 28.3 27.3 139.1 0.8
6. RESERVES 147.9 0.0 147.9 0.0 0.0 0.0 0.0 0.0 0.0 0.0 0.0 0.0 0.0 0.0 0.0 0.0 0.0 0.0 0.0 0.0 0.0 0.0 0.0 0.0 0.0 0.0 0.0 0.0 0.0 0.0 0.0 0.0 0.0
7. PRE-ACCESSION STRATEGY 2,239.8 4.3 137.4 2,098.1 0.0 0.0 167.8 213.4 0.0 0.0 69.0 0.0 0.0 0.0 0.0 0.0 0.0 74.7 302.9 0.0 171.1 0.0 0.0 0.0 657.7 0.0 295.3 49.7 96.0 0.0 0.0 0.0 0.0
8. COMPENSATIONS 0.0 0.0 0.0 0.0 0.0 0.0 0.0 0.0 0.0 0.0 0.0 0.0 0.0 0.0 0.0 0.0 0.0 0.0 0.0 0.0 0.0 0.0 0.0 0.0 0.0 0.0 0.0 0.0 0.0 0.0 0.0 0.0 0.0
TOTAL EXPENDITURE 90,557.5 445.3 1,786.6 5,955.4 82,370.2 4,477.1 175.9 228.1 1,489.8 10,594.9 75.2 2,690.2 4,850.0 15,875.1 13,359.1 10,625.9 17.0 79.3 307.3 1,095.8 189.7 10.4 1,991.6 1,577.3 684.1 4,769.8 303.0 58.6 104.0 1,348.0 1,451.2 6,174.5 27.6
VAT-based own resource 21,260.1 562.7 0.0 0.0 380.7 4,773.9 0.0 289.9 387.5 1,880.7 3,684.2 2,369.7 0.0 0.0 0.0 54.9 0.0 0.0 1,110.2 511.6 0.0 334.2 0.0 0.0 0.0 317.9 594.9 4,006.9 0.0
GNI-based own resource 51,235.2 1,464.5 0.0 0.0 988.5 11,706.1 0.0 604.2 829.7 4,007.7 8,787.1 6,945.3 0.0 0.0 0.0 113.9 0.0 0.0 2,439.3 1,211.8 0.0 717.0 0.0 0.0 0.0 787.7 1,582.7 9,049.8 0.0
UK correction 280.1 295.0 0.0 0.0 192.5 434.9 0.0 128.9 161.1 787.7 1,642.2 1,324.6 0.0 0.0 0.0 23.3 0.0 0.0 86.3 45.8 0.0 143.8 0.0 0.0 0.0 156.2 42.7 -5,184.9 0.0
JHA adjustment for Denmark -0.1 0.1 0.0 0.0 -1.9 0.5 0.0 0.0 0.0 0.1 0.3 0.3 0.0 0.0 0.0 0.0 0.0 0.0 0.1 0.0 0.0 0.0 0.0 0.0 0.0 0.0 0.1 0.3 0.0
TOTAL national contribution 72,775.3 2,322.3 0.0 0.0 1,559.8 16,915.4 0.0 1,023.0 1,378.4 6,676.2 14,113.8 10,639.9 0.0 0.0 0.0 192.1 0.0 0.0 3,635.9 1,769.2 0.0 1,195.1 0.0 0.0 0.0 1,261.8 2,220.4 7,872.1 0.0
Traditional own resources (TOR) (75%) 10,857.2 1,163.8 0.0 0.0 216.0 2,287.7 0.0 104.5 155.4 753.3 1,040.3 1,118.9 0.0 0.0 0.0 12.5 0.0 0.0 1,283.7 166.8 0.0 97.8 0.0 0.0 0.0 76.2 280.9 2,099.5 0.0
Agricultural duties (100%) 1,349.1 26.9 0.0 0.0 16.8 194.5 0.0 0.8 15.0 39.2 143.9 96.7 0.0 0.0 0.0 0.3 0.0 0.0 295.4 8.8 0.0 21.5 0.0 0.0 0.0 3.3 17.0 469.0 0.0
Sugar levies (100%) 510.9 30.0 0.0 0.0 16.2 175.3 0.0 4.6 7.6 18.0 130.8 44.0 0.0 0.0 0.0 0.0 0.0 0.0 32.2 13.3 0.0 1.8 0.0 0.0 0.0 3.5 8.6 25.1 0.0
Customs duties (100%) 12,616.2 1,494.8 0.0 0.0 255.0 2,680.5 0.0 133.9 184.6 947.2 1,112.3 1,351.1 0.0 0.0 0.0 16.4 0.0 0.0 1,384.0 200.3 0.0 107.1 0.0 0.0 0.0 94.8 348.9 2,305.1 0.0
Amounts (25%) retained as TOR collection costs -3,619.1 -387.9 0.0 0.0 -72.0 -762.6 0.0 -34.8 -51.8 -251.1 -346.8 -373.0 0.0 0.0 0.0 -4.2 0.0 0.0 -427.9 -55.6 0.0 -32.6 0.0 0.0 0.0 -25.4 -93.6 -699.8 0.0
TOTAL own resources 83,632.5 3,486.1 0.0 0.0 1,775.8 19,203.1 0.0 1,127.6 1,533.7 7,429.6 15,154.1 11,758.8 0.0 0.0 0.0 204.5 0.0 0.0 4,919.6 1,936.0 0.0 1,293.0 0.0 0.0 0.0 1,337.9 2,501.3 9,971.5 0.0
Surplus from previous year 7,413.5
Surplus from EAGGF-Guarantee 263.3 p.m. amount of the 2002
UK correction: 5,613.1
Other revenue 2,159.3
TOTAL REVENUE 93,468.6
Gross National Income (GNI), EUR million* 9,923,915.6 287,291.7 19,060.8 85,038.9 192,161.8 2,198,493.0 8,237.2 124,765.0 178,159.1 796,978.0 1,657,927.0 1,384,179.6 12,111.7 10,426.2 16,160.7 20,425.3 71,580.3 4,737.6 511,897.0 230,556.8 190,415.1 144,323.8 51,714.2 26,116.8 28,657.8 150,671.0 298,376.1 1,747,710.5 29,677.8
Operating budgetary balance (EUR million) 0.00 -779.7 n.a. n.a. -220.0 -7,605.4 n.a. +1,559.0 +3,358.3 +8,704.9 -1,976.1 -849.8 n.a. n.a. n.a. -57.2 n.a. n.a. -1,942.2 -330.9 n.a. +3,476.3 n.a. n.a. n.a. -26.7 -945.6 -2,364.9 +26.7
Operating budgetary balance (% GNI) 0.00% -0.27% n.a. n.a. -0.11% -0.35% n.a. +1.25% +1.89% +1.09% -0.12% -0.06% n.a. n.a. n.a. -0.28% n.a. n.a. -0.38% -0.14% n.a. +2.41% n.a. n.a. n.a. -0.02% -0.32% -0.14% +0.09%
2003 (EUR million)

p.m.
Total earmarked other non-EU EU-25 BE BG CZ DK DE EE IE EL ES FR IT CY LV LT LU HU MT NL AT PL PT RO SI SK FI SE UK HR
1. AGRICULTURE 43,579.4 0.0 0.0 0.3 43,579.2 1,083.6 0.1 90.8 1,221.6 6,064.7 15.6 1,845.8 2,779.8 6,345.4 9,429.4 5,040.4 7.5 32.8 49.5 38.9 60.7 2.7 1,332.9 1,144.8 297.4 828.0 0.0 49.4 41.1 870.4 849.8 4,056.0 0.0 Direct Aid 29,826.8 0.0 0.0 0.0 29,826.8 413.5 0.0 0.0 851.4 4,573.5 0.0 1,106.5 1,890.7 4,356.3 7,199.8 3,606.3 0.0 0.0 0.0 23.4 0.0 0.0 402.9 603.0 0.0 477.1 0.0 0.0 0.0 443.5 615.0 3,263.9 0.0
Export refunds 3,384.2 0.0 0.0 0.0 3,384.2 485.3 0.0 3.0 257.7 470.1 0.5 223.6 18.2 125.5 567.1 175.0 0.0 0.0 0.1 0.0 0.2 0.0 518.7 41.6 10.8 26.5 0.0 0.1 0.0 83.5 51.2 325.4 0.0
Storage 322.4 0.0 0.0 0.0 322.4 21.7 0.0 0.0 7.7 50.4 0.0 32.5 10.6 106.2 41.4 80.7 0.0 0.0 0.0 -0.1 0.0 0.0 -9.4 0.4 -24.3 1.9 0.0 0.0 0.0 2.8 0.5 -0.7 0.0
Rural development 5,357.9 0.0 0.0 0.0 5,357.9 48.9 0.0 86.0 43.8 799.9 15.1 350.1 125.6 515.3 839.2 615.7 7.5 32.8 49.0 16.2 60.2 2.7 67.7 468.7 286.6 193.3 0.0 49.3 39.7 329.7 163.8 151.2 0.0
Other 4,688.1 0.0 0.0 0.3 4,687.8 114.2 0.1 1.7 61.1 170.8 0.0 133.1 734.7 1,242.1 781.8 562.7 0.1 0.0 0.5 -0.6 0.3 0.0 353.0 31.1 24.3 129.1 0.0 0.0 1.4 11.0 19.3 316.2 0.0
2. STRUCTURAL ACTIONS 34,198.3 0.0 88.2 0.0 34,110.1 351.4 0.0 161.7 183.4 4,636.7 37.5 839.1 2,843.1 9,627.0 2,402.5 4,518.6 5.3 64.9 94.4 29.0 203.1 6.4 355.3 314.9 843.5 3,471.7 0.0 24.4 116.1 361.9 408.6 2,209.4 0.0
Structural funds 31,516.0 0.0 87.7 0.0 31,428.3 350.9 0.0 161.7 182.9 4,636.7 37.5 813.2 2,492.3 7,651.4 2,402.5 4,518.6 5.3 64.9 90.7 28.9 203.1 6.4 354.8 314.9 841.0 3,151.5 0.0 24.4 114.5 361.9 408.6 2,209.4 0.0
Objective 1 22,004.2 0.0 0.0 0.0 22,004.2 82.3 0.0 145.4 0.0 3,214.4 37.1 771.8 2,367.1 6,541.2 629.5 2,934.2 0.0 64.1 89.5 0.0 200.1 6.3 13.5 40.9 827.6 2,940.8 0.0 23.8 104.1 164.9 147.6 657.9 0.0
of which EAGGF 2,959.1 0.0 0.0 0.0 2,959.1 3.4 0.0 16.7 0.0 646.5 5.7 61.1 274.2 766.6 83.6 462.9 0.0 10.7 12.3 0.0 31.3 0.4 2.1 6.0 119.3 334.9 0.0 2.4 18.1 42.3 13.1 45.6 0.0
of which FIFG 342.7 0.0 0.0 0.0 342.7 0.0 0.0 0.7 0.0 13.4 1.2 7.6 29.8 187.6 3.8 23.7 0.0 2.7 1.2 0.0 0.4 0.3 2.8 0.1 20.2 34.1 0.0 0.2 0.2 1.6 0.9 10.1 0.0
of which ERDF 13,660.9 0.0 0.0 0.0 13,660.9 60.6 0.0 91.4 0.0 1,810.1 22.6 429.5 1,554.1 4,395.5 333.4 1,657.8 0.0 36.9 58.4 0.0 124.4 4.7 2.8 25.9 497.3 1,844.6 0.0 13.7 57.4 69.7 74.9 495.1 0.0
of which ESF 5,041.5 0.0 0.0 0.0 5,041.5 18.4 0.0 36.6 0.0 744.4 7.6 273.5 509.0 1,191.4 208.7 789.9 0.0 13.9 17.6 0.0 43.9 0.9 5.8 9.0 190.9 727.2 0.0 7.6 28.4 51.3 58.8 106.9 0.0
Objective 2 4,310.7 0.0 0.0 0.0 4,310.7 86.5 0.0 7.1 23.2 551.2 0.0 0.0 0.0 427.1 1,189.5 476.8 2.8 0.0 0.0 11.5 0.0 0.0 146.3 114.3 0.0 0.0 0.0 0.0 3.7 90.1 85.5 1,095.0 0.0
of which EAGGF 53.6 0.0 0.0 0.0 53.6 0.0 0.0 0.0 0.0 4.2 0.0 0.0 0.0 3.9 2.1 39.2 0.0 0.0 0.0 0.0 0.0 0.0 0.0 0.0 0.0 0.0 0.0 0.0 0.0 0.0 4.1 0.0 0.0
of which ERDF 3,689.2 0.0 0.0 0.0 3,689.2 79.3 0.0 7.1 16.6 471.8 0.0 0.0 0.0 358.8 1,050.0 397.6 2.8 0.0 0.0 11.5 0.0 0.0 101.8 106.2 0.0 0.0 0.0 0.0 3.7 70.7 58.6 952.6 0.0
of which ESF 567.9 0.0 0.0 0.0 567.9 7.3 0.0 0.0 6.6 75.1 0.0 0.0 0.0 64.5 137.3 40.0 0.0 0.0 0.0 0.0 0.0 0.0 44.5 8.1 0.0 0.0 0.0 0.0 0.0 19.3 22.8 142.4 0.0
Objective 3 (ESF) 2,919.1 0.0 0.0 0.0 2,919.1 132.4 0.0 5.9 99.1 525.8 0.0 0.0 0.0 310.8 325.0 798.4 2.2 0.0 0.0 6.5 0.0 0.0 128.0 86.4 0.0 0.0 0.0 0.0 4.5 55.2 125.3 313.6 0.0
Other Structural measures 220.6 0.0 0.0 0.0 220.6 1.3 0.0 0.0 24.9 3.7 0.0 0.0 0.0 34.0 77.0 19.7 0.1 0.0 0.0 0.0 0.0 0.0 6.3 13.6 0.0 0.0 0.0 0.0 0.0 12.5 6.7 21.0 0.0
of which EAGGF 67.7 0.0 0.0 0.0 67.7 0.2 0.0 0.0 11.5 0.2 0.0 0.0 0.0 0.0 26.7 10.4 0.0 0.0 0.0 0.0 0.0 0.0 0.0 12.9 0.0 0.0 0.0 0.0 0.0 5.7 0.0 0.0 0.0
of which FIFG 152.9 0.0 0.0 0.0 152.9 1.0 0.0 0.0 13.3 3.5 0.0 0.0 0.0 34.0 50.3 9.4 0.1 0.0 0.0 0.0 0.0 0.0 6.3 0.6 0.0 0.0 0.0 0.0 0.0 6.8 6.7 21.0 0.0
Community initiatives 1,964.7 0.0 84.9 0.0 1,879.8 32.6 0.0 3.2 33.9 336.8 0.4 40.4 119.1 320.5 175.3 279.9 0.2 0.8 1.2 9.8 3.0 0.1 53.6 55.3 13.4 207.5 0.0 0.6 2.2 36.2 36.8 116.9 0.0
of which EAGGF 345.5 0.0 0.0 0.0 345.5 0.1 0.0 0.0 1.7 40.1 0.0 13.8 22.4 101.6 38.8 37.1 0.0 0.0 0.0 0.2 0.0 0.0 16.7 7.4 0.0 27.3 0.0 0.0 0.0 9.9 7.3 20.9 0.0
of which FIFG 0.6 0.0 0.0 0.0 0.6 0.0 0.0 0.0 0.0 0.0 0.0 0.2 0.4 0.0 0.0 0.0 0.0 0.0 0.0 0.0 0.0 0.0 0.0 0.0 0.0 0.0 0.0 0.0 0.0 0.0 0.0 0.0 0.0
of which ERDF 1,099.4 0.0 84.9 0.0 1,014.5 14.8 0.0 0.0 27.4 196.6 0.0 19.0 72.8 148.9 96.3 136.5 0.0 0.0 0.0 7.6 0.0 0.0 22.6 25.6 0.0 157.2 0.0 0.0 0.0 17.3 16.4 55.6 0.0
of which ESF 519.2 0.0 0.0 0.0 519.2 17.7 0.0 3.2 4.8 100.1 0.4 7.4 23.5 70.0 40.2 106.4 0.2 0.8 1.2 2.0 3.0 0.1 14.3 22.2 13.4 23.0 0.0 0.6 2.2 9.1 13.1 40.3 0.0
Innovatory measures and Technical assistance 96.8 0.0 2.8 0.0 93.9 15.8 0.0 0.0 1.8 4.8 0.0 1.1 6.2 17.7 6.2 9.4 0.0 0.0 0.0 1.1 0.0 0.0 7.1 4.4 0.0 3.3 0.0 0.0 0.0 3.0 6.8 5.1 0.0
of which EAGGF 1.4 0.0 0.0 0.0 1.4 0.6 0.0 0.0 0.0 0.0 0.0 0.0 0.1 0.2 0.0 0.1 0.0 0.0 0.0 0.0 0.0 0.0 0.0 0.1 0.0 0.0 0.0 0.0 0.0 0.0 0.0 0.2 0.0
of which FIFG 2.7 0.0 0.0 0.0 2.7 0.6 0.0 0.0 0.0 0.0 0.0 0.2 0.2 0.3 0.5 0.1 0.0 0.0 0.0 0.3 0.0 0.0 0.0 0.0 0.0 0.0 0.0 0.0 0.0 0.0 0.0 0.5 0.0
of which ERDF 61.5 0.0 2.8 0.0 58.7 6.7 0.0 0.0 0.4 1.8 0.0 0.9 3.2 11.9 4.5 5.0 0.0 0.0 0.0 0.8 0.0 0.0 6.6 4.0 0.0 3.0 0.0 0.0 0.0 1.7 5.0 3.3 0.0
of which ESF 31.1 0.0 0.0 0.0 31.1 7.9 0.0 0.0 1.4 3.0 0.0 0.0 2.6 5.4 1.1 4.2 0.0 0.0 0.0 0.0 0.0 0.0 0.5 0.3 0.0 0.3 0.0 0.0 0.0 1.3 1.7 1.2 0.0
Structural funds - Total EAGGF 3,427.3 0.0 0.0 0.0 3,427.3 4.3 0.0 16.7 13.3 691.0 5.7 75.0 296.7 872.4 151.3 549.6 0.0 10.7 12.3 0.2 31.3 0.4 18.8 26.5 119.3 362.2 0.0 2.4 18.1 57.9 24.6 66.8 0.0
Structural funds - Total FIFG 498.9 0.0 0.0 0.0 498.9 1.6 0.0 0.7 13.3 17.0 1.2 7.9 30.4 221.9 54.6 33.1 0.1 2.7 1.2 0.3 0.4 0.3 9.1 0.7 20.2 34.1 0.0 0.2 0.2 8.4 7.5 31.6 0.0
Structural funds - Total ERDF 18,511.0 0.0 87.7 0.0 18,423.3 161.4 0.0 98.6 44.4 2,480.4 22.6 449.4 1,630.1 4,915.0 1,484.3 2,196.9 2.8 36.9 58.4 19.9 124.4 4.7 133.8 161.7 497.3 2,004.8 0.0 13.7 61.1 159.4 154.9 1,506.7 0.0
Structural funds - Total ESF 9,078.8 0.0 0.0 0.0 9,078.8 183.6 0.0 45.7 112.0 1,448.4 8.0 280.9 535.1 1,642.1 712.3 1,738.9 2.4 14.7 18.8 8.5 46.9 1.1 193.1 126.0 204.2 750.4 0.0 8.2 35.2 136.2 221.6 604.4 0.0
Other specific structural operations 39.6 0.0 0.0 0.0 39.6 0.0 0.0 0.0 0.0 0.0 0.0 0.0 0.0 35.9 0.0 0.0 0.0 0.0 0.0 0.0 0.0 0.0 0.0 0.0 0.0 3.7 0.0 0.0 0.0 0.0 0.0 0.0 0.0
Cohesion Fund 2,642.8 0.0 0.5 0.0 2,642.2 0.5 0.0 0.0 0.4 0.0 0.0 25.8 350.8 1,939.7 0.0 0.0 0.0 0.0 3.7 0.1 0.0 0.0 0.5 0.0 2.5 316.5 0.0 0.0 1.6 0.0 0.0 0.0 0.0
3. INTERNAL POLICIES 7,255.2 364.1 655.2 196.8 6,039.2 729.4 6.8 26.9 138.4 885.6 34.5 87.9 164.6 335.6 750.7 680.2 11.1 37.1 114.0 68.2 92.2 4.3 366.0 140.6 176.6 96.4 7.0 57.9 34.2 115.1 167.1 724.4 0.7
Training, youth, culture, audiovisual, media, information & 1,071.4 91.4 3.9 24.8 951.2 122.8 1.5 11.4 19.8 118.9 4.5 36.5 42.0 82.3 104.7 99.8 4.3 5.3 7.9 13.5 14.1 2.7 33.5 28.0 38.9 22.8 1.5 6.0 7.6 22.3 25.7 76.1 0.0
Education, vocational training and youth 727.3 77.9 1.2 19.0 629.2 40.2 1.1 10.1 11.8 82.1 4.1 11.4 34.2 56.3 64.3 75.5 3.5 4.8 7.3 4.9 12.2 2.4 22.8 19.1 36.7 18.5 1.1 5.2 7.1 16.4 17.3 60.8 0.0
Other 344.1 13.6 2.7 5.8 322.0 82.7 0.4 1.3 8.0 36.8 0.4 25.1 7.8 26.0 40.5 24.2 0.8 0.5 0.5 8.7 1.9 0.3 10.7 8.9 2.2 4.3 0.4 0.7 0.5 5.8 8.3 15.2 0.0
Energy, Euratom nuclear safeguards and environment 266.6 5.2 0.1 4.6 256.7 19.9 0.0 0.6 35.3 15.8 0.5 2.6 8.1 17.5 15.4 32.5 0.6 1.5 47.5 3.6 2.6 0.0 11.2 7.7 0.3 2.1 0.8 0.6 3.9 5.6 7.1 13.9 0.0
Energy, Euratom nuclear safeguards 80.5 0.8 0.1 3.5 76.1 4.4 0.0 0.1 0.4 3.1 0.0 0.4 1.5 1.6 4.2 0.9 0.0 0.0 47.5 3.1 0.0 0.0 1.4 0.6 0.0 0.5 0.0 0.0 3.4 0.1 0.4 2.4 0.0
Environment 186.1 4.4 0.0 1.0 180.6 15.5 0.0 0.5 34.9 12.8 0.5 2.3 6.6 15.9 11.2 31.6 0.6 1.5 0.0 0.4 2.6 0.0 9.8 7.1 0.3 1.7 0.7 0.6 0.5 5.5 6.7 11.5 0.0
Consumer protection, internal market, industry and trans 1,326.1 46.6 283.6 8.5 987.4 110.8 0.2 2.5 6.3 80.1 25.6 8.3 13.7 24.0 110.6 91.9 0.9 27.2 49.9 33.2 58.1 0.6 42.1 17.5 104.0 15.9 0.1 42.6 17.9 4.1 12.8 86.6 0.0
Trans-European networks 648.2 1.2 174.2 0.0 472.7 61.1 0.0 2.0 4.2 66.6 0.0 6.4 7.0 19.3 95.3 82.9 0.7 0.7 0.0 3.6 3.0 0.4 34.7 13.2 0.0 11.6 0.0 2.7 0.0 2.3 9.0 46.1 0.0
Other 677.9 45.3 109.4 8.4 514.7 49.7 0.2 0.5 2.1 13.5 25.6 2.0 6.7 4.7 15.3 9.0 0.2 26.5 49.9 29.7 55.1 0.2 7.4 4.3 104.0 4.3 0.1 39.9 17.9 1.8 3.8 40.5 0.0
Research and technological development 4,244.5 220.3 363.8 157.3 3,503.1 428.0 5.2 12.3 73.2 647.4 3.6 30.6 94.4 184.2 483.3 386.2 5.0 3.0 1.7 16.0 16.6 0.8 256.0 75.2 31.3 38.2 4.6 8.5 4.5 78.4 114.8 510.2 0.7
Other internal policies 346.5 0.6 3.7 1.5 340.7 47.8 0.0 0.2 3.8 23.4 0.3 9.9 6.3 27.6 36.7 69.9 0.4 0.1 7.2 1.9 0.7 0.2 23.2 12.2 2.1 17.3 0.0 0.2 0.3 4.8 6.7 37.6 0.0
4. EXTERNAL ACTIONS 4,605.8 70.0 912.3 3,606.5 17.0 0.0 0.2 0.0 0.0 0.0 0.0 0.0 0.0 0.0 0.0 0.0 12.4 0.0 0.0 0.0 0.0 4.6 0.0 0.0 0.0 0.0 0.2 0.0 0.0 0.0 0.0 0.0 22.6
5. ADMINISTRATION 5,856.4 127.3 411.9 128.8 5,188.4 2,999.2 1.2 13.1 47.6 158.4 6.3 42.0 20.7 48.6 362.3 127.8 4.1 6.7 8.1 995.8 12.7 4.4 61.6 20.2 23.2 18.4 1.4 6.1 8.3 27.3 25.3 140.3 1.0
6. RESERVES 181.9 0.0 181.9 0.0 0.0 0.0 0.0 0.0 0.0 0.0 0.0 0.0 0.0 0.0 0.0 0.0 0.0 0.0 0.0 0.0 0.0 0.0 0.0 0.0 0.0 0.0 0.0 0.0 0.0 0.0 0.0 0.0 0.0
7. PRE-ACCESSION STRATEGY 3,052.9 68.4 172.1 1,023.6 1,788.9 0.0 283.6 191.0 0.0 0.0 90.6 0.0 0.0 0.0 0.0 0.0 0.0 103.9 183.0 0.0 172.7 1.0 0.0 0.0 889.3 0.0 563.6 39.1 118.3 0.0 0.0 0.0 0.0
8. COMPENSATIONS 1,409.5 0.0 0.0 0.0 1,409.5 0.0 0.0 332.3 0.0 0.0 17.5 0.0 0.0 0.0 0.0 0.0 107.0 21.6 38.5 0.0 172.0 55.4 0.0 0.0 490.3 0.0 0.0 105.1 70.0 0.0 0.0 0.0 0.0
TOTAL EXPENDITURE 100,139.4 629.7 2,421.5 4,956.0 92,132.3 5,163.6 292.0 815.7 1,591.0 11,745.5 202.0 2,814.8 5,808.1 16,356.7 12,944.9 10,367.0 147.5 267.0 487.6 1,132.0 713.4 78.7 2,115.8 1,620.5 2,720.3 4,414.4 572.2 282.0 388.1 1,374.8 1,450.8 7,130.2 24.3
VAT-based own resource 13,912.2 338.5 0.0 80.1 210.5 2,633.9 7.7 181.7 247.9 1,201.7 2,233.3 2,072.5 12.1 8.5 15.3 36.6 76.6 4.4 666.2 248.3 190.0 188.9 0.0 25.1 29.2 203.8 375.7 2,623.9 0.0
GNI-based own resource 68,982.0 1,975.4 0.0 373.0 1,312.0 14,837.9 35.7 833.7 1,148.4 5,511.0 11,149.8 9,257.4 56.2 45.0 78.8 162.0 356.7 20.7 3,178.5 1,596.9 884.9 902.0 0.0 116.9 150.4 1,012.1 1,959.7 12,027.0 0.0
UK correction -148.0 256.2 0.0 51.6 160.8 351.3 4.9 106.7 149.5 716.2 1,495.3 1,219.5 7.8 6.2 10.9 20.0 49.4 2.9 47.0 25.4 123.1 119.7 0.0 16.1 20.8 132.8 30.0 -5,272.1 0.0
JHA adjustment for Denmark 0.0 0.0 0.0 0.0 -0.7 0.2 0.0 0.0 0.0 0.1 0.1 0.1 0.0 0.0 0.0 0.0 0.0 0.0 0.0 0.0 0.0 0.0 0.0 0.0 0.0 0.0 0.0 0.1 0.0
TOTAL national contribution 82,746.2 2,570.1 0.0 504.8 1,682.6 17,823.3 48.3 1,122.1 1,545.8 7,428.9 14,878.6 12,549.5 76.0 59.6 104.9 218.7 482.8 27.9 3,891.8 1,870.5 1,198.0 1,210.6 0.0 158.1 200.4 1,348.7 2,365.4 9,378.9 0.0
Traditional own resources (TOR) (75%) 12,307.1 1,278.9 0.0 60.4 257.5 2,406.5 7.1 128.4 196.5 954.7 1,134.9 1,236.6 19.0 7.8 14.4 12.6 54.3 5.1 1,377.0 176.0 112.8 121.7 0.0 12.3 19.1 94.6 315.2 2,303.6 0.0
Agricultural duties (100%) 1,751.2 25.3 0.0 3.0 36.9 270.8 0.5 0.9 17.1 89.1 137.9 138.1 2.2 0.4 1.5 0.3 3.7 1.4 398.4 9.4 24.5 46.6 0.0 0.1 0.7 7.0 20.5 514.6 0.0
Sugar levies (100%) 535.5 39.1 0.0 0.0 21.3 153.9 0.0 5.6 3.4 20.3 171.3 12.4 0.0 0.0 0.0 0.0 0.0 0.0 42.0 17.2 0.0 2.1 0.0 0.0 0.0 4.1 10.4 32.4 0.0
Customs duties (100%) 14,122.8 1,640.8 0.0 77.5 285.1 2,784.0 9.0 164.7 241.5 1,163.6 1,204.0 1,498.2 23.1 10.0 17.7 16.5 68.7 5.4 1,395.7 208.1 125.9 113.5 0.0 16.3 24.8 115.0 389.4 2,524.4 0.0
Amounts (25%) retained as TOR collection costs -4,102.4 -426.3 0.0 -20.1 -85.8 -802.2 -2.4 -42.8 -65.5 -318.2 -378.3 -412.2 -6.3 -2.6 -4.8 -4.2 -18.1 -1.7 -459.0 -58.7 -37.6 -40.6 0.0 -4.1 -6.4 -31.5 -105.1 -767.9 0.0
TOTAL own resources 95,053.3 3,848.9 0.0 565.2 1,940.1 20,229.8 55.4 1,250.5 1,742.3 8,383.6 16,013.5 13,786.0 95.0 67.5 119.3 231.3 537.1 33.0 5,268.8 2,046.6 1,310.7 1,332.3 0.0 170.4 219.6 1,443.3 2,680.6 11,682.5 0.0
Surplus from previous year 5,469.8
Surplus from EAGGF-Guarantee 223.2 p.m. amount of the 2003
UK correction: 5,285.1
Other revenue 2,765.7
TOTAL REVENUE 103,511.9
Gross National Income (GNI), EUR million* 10,933,761.5 302,066.1 21,176.9 91,463.1 203,200.4 2,284,712.0 9,229.4 134,084.0 192,354.8 853,508.0 1,735,638.9 1,446,114.4 13,053.5 11,493.2 17,882.3 22,450.5 78,985.7 4,850.3 531,282.0 241,143.6 199,055.6 150,089.6 58,845.6 27,480.3 33,423.5 159,592.0 309,122.0 1,881,486.3 32,903.6
Operating budgetary balance (EUR million) 0.00 -536.1 n.a. +272.2 -224.6 -7,140.4 +145.0 +1,593.8 +4,163.3 +8,502.3 -3,050.7 -2,946.9 +63.5 +197.7 +369.3 -93.6 +193.4 +45.0 -2,034.9 -365.1 +1,438.3 +3,124.0 n.a. +109.7 +169.2 -69.6 -1,059.8 -2,864.9 +23.3
Operating budgetary balance (% GNI) 0.00% -0.18% n.a. +0.30% -0.11% -0.31% +1.57% +1.19% +2.16% +1.00% -0.18% -0.20% +0.49% +1.72% +2.06% -0.42% +0.24% +0.93% -0.38% -0.15% +0.72% +2.08% n.a. +0.40% +0.51% -0.04% -0.34% -0.15% +0.07%
2004 (EUR million)
p.m.
Total earmarked other non-EU EU-25 BE BG CZ DK DE EE IE EL ES FR IT CY LV LT LU HU MT NL AT PL PT RO SI SK FI SE UK HR
1. AGRICULTURE 48,465.8 0.0 3.5 0.3 48,462.0 1,047.7 0.0 428.5 1,228.3 6,522.3 76.5 1,821.5 2,755.7 6,432.0 10,011.5 5,528.1 44.5 118.4 265.6 45.4 651.5 9.0 1,268.3 1,237.3 1,542.1 896.5 0.0 102.6 220.6 904.1 956.9 4,347.2 0.0 Direct Aid 33,700.8 0.0 0.0 0.0 33,700.8 457.5 0.0 212.4 918.2 5,014.0 21.2 1,209.2 1,819.8 4,666.6 7,707.9 4,015.2 7.9 25.1 81.8 28.1 316.0 0.3 554.1 651.4 702.0 553.6 0.0 24.7 82.8 483.3 668.7 3,479.0 0.0
Export refunds 3,051.9 0.0 0.0 0.0 3,051.9 388.0 0.0 26.9 204.4 433.2 3.7 178.1 8.6 107.6 524.8 88.8 0.5 0.8 38.3 0.0 29.7 0.0 429.5 43.9 99.3 15.0 0.0 4.8 6.3 66.2 73.3 280.3 0.0
Storage 851.5 0.0 0.0 0.0 851.5 44.8 0.0 33.5 6.7 174.2 1.7 37.0 8.1 103.8 154.2 93.3 0.0 1.4 5.9 0.0 143.0 -0.2 -4.6 9.3 26.1 1.6 0.0 0.0 12.3 3.4 25.6 -29.8 0.0
Rural development 6,310.9 0.0 0.0 0.0 6,310.9 55.8 0.0 146.0 46.1 803.6 49.3 357.4 157.3 533.8 860.0 679.6 9.3 90.9 138.2 15.9 136.4 8.1 63.4 479.1 662.1 179.5 0.0 69.4 105.1 336.9 170.7 157.3 0.0
Other 4,550.6 0.0 3.5 0.3 4,546.9 101.7 0.0 9.7 52.9 97.2 0.6 39.8 761.9 1,020.3 764.5 651.2 26.9 0.3 1.4 1.4 26.4 0.7 225.8 53.5 52.6 146.9 0.0 3.7 14.1 14.3 18.6 460.4 0.0
2. STRUCTURAL ACTIONS 32,763.2 7.8 60.6 2.2 32,692.6 373.4 0.0 151.6 122.7 4,597.2 72.0 531.4 2,652.0 7,973.7 2,541.2 4,325.3 8.9 107.3 158.2 11.1 338.1 5.4 411.6 337.7 787.0 2,873.3 0.0 53.5 157.3 290.9 369.9 3,442.0 0.0
Structural funds 30,526.9 0.4 60.0 2.2 30,464.3 371.2 0.0 136.2 122.7 4,597.2 68.2 515.0 2,341.3 6,587.0 2,541.1 4,325.2 3.8 86.8 109.4 11.0 259.9 5.4 411.3 337.7 769.5 2,602.6 0.0 45.0 113.8 290.9 369.9 3,442.0 0.0
Objective 1 20,573.4 0.0 0.0 0.0 20,573.4 125.0 0.0 120.9 0.0 3,102.6 67.9 497.8 2,201.6 5,583.0 526.8 2,992.0 0.0 86.2 102.3 0.0 250.3 5.3 28.4 36.5 755.8 2,367.8 0.0 41.3 104.5 123.9 112.1 1,341.4 0.0
of which EAGGF 2,986.0 0.0 0.0 0.0 2,986.0 5.0 0.0 16.5 0.0 525.9 21.0 34.4 336.0 828.2 103.6 481.7 0.0 32.4 7.5 0.0 42.8 0.3 1.3 8.6 137.0 229.7 0.0 1.6 31.2 21.8 15.8 103.7 0.0
of which FIFG 406.3 0.0 0.0 0.0 406.3 0.1 0.0 0.6 0.0 4.6 2.1 19.9 21.8 245.1 7.9 21.4 0.0 7.9 4.2 0.0 0.4 0.2 0.0 0.1 32.4 17.6 0.0 0.1 0.1 0.9 1.5 17.4 0.0
of which ERDF 12,236.5 0.0 0.0 0.0 12,236.5 77.5 0.0 79.7 0.0 1,681.1 40.2 230.6 1,277.0 3,127.6 344.6 2,084.4 0.0 34.6 79.5 0.0 159.5 3.5 20.4 17.2 422.1 1,439.7 0.0 29.9 36.1 65.2 72.3 913.8 0.0
of which ESF 4,944.7 0.0 0.0 0.0 4,944.7 42.4 0.0 24.1 0.0 890.9 4.6 212.9 566.8 1,382.2 70.7 404.5 0.0 11.4 11.0 0.0 47.6 1.4 6.7 10.6 164.2 680.8 0.0 9.7 37.2 36.0 22.5 306.4 0.0
Objective 2 3,901.3 0.0 0.0 2.2 3,899.2 55.4 0.0 4.3 34.0 528.4 0.0 0.0 0.0 342.0 965.1 495.5 1.7 0.0 0.0 6.3 0.0 0.0 135.6 105.4 0.0 0.0 0.0 0.0 2.3 62.9 72.7 1,087.6 0.0
of which EAGGF 17.5 0.0 0.0 0.0 17.5 0.0 0.0 0.0 6.9 0.0 0.0 0.0 0.0 0.0 1.4 6.8 0.0 0.0 0.0 0.0 0.0 0.0 2.3 0.0 0.0 0.0 0.0 0.0 0.0 0.0 0.0 0.0 0.0
of which ERDF 3,475.1 0.0 0.0 2.2 3,472.9 47.5 0.0 4.3 16.5 445.3 0.0 0.0 0.0 304.2 857.4 488.2 1.7 0.0 0.0 6.3 0.0 0.0 131.6 98.5 0.0 0.0 0.0 0.0 2.3 51.0 61.4 956.8 0.0
of which ESF 408.8 0.0 0.0 0.0 408.8 7.8 0.0 0.0 10.7 83.1 0.0 0.0 0.0 37.8 106.3 0.5 0.0 0.0 0.0 0.0 0.0 0.0 1.7 6.9 0.0 0.0 0.0 0.0 0.0 11.9 11.3 130.8 0.0
Objective 3 (ESF) 3,540.2 0.0 0.0 0.0 3,540.2 138.7 0.0 3.5 24.0 622.8 0.0 0.0 0.0 332.0 578.4 561.0 1.4 0.0 0.0 1.9 0.0 0.0 196.9 108.9 0.0 0.0 0.0 0.0 3.4 53.4 137.3 776.6 0.0
Other Structural measures 299.3 0.0 0.0 0.0 299.3 5.6 0.0 0.0 11.5 40.5 0.0 0.0 0.0 34.6 185.0 2.9 0.6 0.0 0.0 0.4 0.0 0.0 0.9 0.9 0.0 0.0 0.0 0.0 0.0 5.6 5.7 5.1 0.0
of which EAGGF 190.2 0.0 0.0 0.0 190.2 0.0 0.0 0.0 0.0 35.3 0.0 0.0 0.0 4.4 147.3 2.9 0.0 0.0 0.0 0.4 0.0 0.0 0.0 0.0 0.0 0.0 0.0 0.0 0.0 0.0 0.0 0.0 0.0
of which FIFG 109.1 0.0 0.0 0.0 109.1 5.6 0.0 0.0 11.5 5.2 0.0 0.0 0.0 30.2 37.7 0.0 0.6 0.0 0.0 0.0 0.0 0.0 0.9 0.9 0.0 0.0 0.0 0.0 0.0 5.6 5.7 5.1 0.0
Community initiatives 2,109.6 0.3 57.5 0.0 2,051.7 31.4 0.0 7.5 51.1 289.7 0.2 15.6 130.3 286.4 277.6 262.1 0.1 0.6 7.1 2.0 9.5 0.1 45.3 81.2 13.7 231.0 0.0 3.7 3.7 41.4 37.7 222.7 0.0
of which EAGGF 392.8 0.3 0.0 0.0 392.5 2.9 0.0 0.0 4.2 49.5 0.0 6.1 40.6 116.5 37.0 53.5 0.0 0.0 0.0 0.2 0.0 0.0 10.0 12.2 0.0 22.2 0.0 0.0 0.0 6.8 6.8 23.8 0.0
of which FIFG 0.6 0.0 0.0 0.0 0.6 0.0 0.0 0.0 0.0 0.0 0.0 0.2 0.0 0.0 0.0 0.0 0.0 0.0 0.0 0.0 0.0 0.0 0.0 0.0 0.0 0.0 0.0 0.0 0.0 0.0 0.0 0.4 0.0
of which ERDF 1,130.2 0.0 57.5 0.0 1,072.7 15.6 0.0 5.5 37.4 140.7 0.0 1.3 74.8 80.1 199.8 121.4 0.0 0.0 6.0 1.1 7.6 0.0 12.8 47.3 3.2 194.0 0.0 3.3 2.2 20.9 14.3 83.4 0.0
of which ESF 586.0 0.0 0.0 0.0 586.0 12.9 0.0 1.9 9.5 99.5 0.2 8.0 15.0 89.8 40.8 87.2 0.1 0.6 1.1 0.7 1.8 0.1 22.4 21.8 10.5 14.8 0.0 0.4 1.5 13.8 16.6 115.0 0.0
Innovatory measures and Technical assistance 103.1 0.1 2.5 0.0 100.5 15.1 0.0 0.0 2.1 13.3 0.1 1.6 9.4 8.9 8.2 11.8 0.0 0.0 0.0 0.4 0.1 0.0 4.2 4.7 0.0 3.8 0.0 0.0 0.0 3.6 4.4 8.6 0.0
of which EAGGF 1.8 0.0 0.1 0.0 1.7 1.0 0.0 0.0 0.0 0.0 0.0 0.0 0.0 0.0 0.0 0.0 0.0 0.0 0.0 0.0 0.0 0.0 0.0 0.0 0.0 0.0 0.0 0.0 0.0 0.0 0.0 0.7 0.0
of which FIFG 1.6 0.0 0.0 0.0 1.5 0.5 0.0 0.0 0.0 0.0 0.1 0.1 0.1 0.1 0.3 0.1 0.0 0.0 0.0 0.1 0.0 0.0 0.1 0.0 0.0 0.0 0.0 0.0 0.0 0.1 0.0 0.0 0.0
of which ERDF 63.1 0.0 2.2 0.0 60.9 5.5 0.0 0.0 1.0 7.5 0.0 1.5 6.2 4.2 6.1 5.8 0.0 0.0 0.0 0.2 0.1 0.0 4.1 4.1 0.0 3.1 0.0 0.0 0.0 2.1 3.9 5.5 0.0
of which ESF 36.7 0.1 0.2 0.0 36.3 8.3 0.0 0.0 1.1 5.8 0.0 0.1 3.1 4.6 1.8 5.9 0.0 0.0 0.0 0.1 0.0 0.0 0.0 0.6 0.0 0.7 0.0 0.0 0.0 1.5 0.5 2.4 0.0
Structural funds - Total EAGGF 3,588.2 0.3 0.1 0.0 3,587.9 8.8 0.0 16.5 11.1 610.8 21.0 40.5 376.6 949.1 289.3 544.9 0.0 32.4 7.6 0.6 42.8 0.3 13.6 20.8 137.0 251.9 0.0 1.6 31.2 28.6 22.5 128.3 0.0
Structural funds - Total FIFG 517.5 0.0 0.0 0.0 517.5 6.2 0.0 0.6 11.5 9.7 2.2 20.1 21.9 275.4 45.9 21.5 0.6 7.9 4.2 0.1 0.4 0.2 1.0 1.0 32.4 17.6 0.0 0.1 0.1 6.5 7.2 23.0 0.0
Structural funds - Total ERDF 16,904.9 0.0 59.7 2.2 16,843.0 146.1 0.0 89.5 54.8 2,274.6 40.2 233.4 1,357.9 3,516.2 1,407.8 2,699.7 1.7 34.6 85.5 7.7 167.2 3.5 168.9 167.1 425.4 1,636.8 0.0 33.2 40.6 139.2 151.9 1,959.5 0.0
Structural funds - Total ESF 9,516.3 0.1 0.2 0.0 9,515.9 210.1 0.0 29.6 45.2 1,702.1 4.9 221.0 584.9 1,846.3 797.9 1,059.1 1.5 12.0 12.1 2.7 49.5 1.5 227.8 148.9 174.7 696.3 0.0 10.1 42.0 116.5 188.3 1,331.2 0.0
Other specific structural operations 0.0 0.0 0.0 0.0 0.0 0.0 0.0 0.0 0.0 0.0 0.0 0.0 0.0 0.0 0.0 0.0 0.0 0.0 0.0 0.0 0.0 0.0 0.0 0.0 0.0 0.0 0.0 0.0 0.0 0.0 0.0 0.0 0.0
Cohesion Fund 2,236.3 7.4 0.6 0.0 2,228.3 2.1 0.0 15.3 0.0 0.0 3.8 16.4 310.7 1,386.7 0.1 0.1 5.1 20.4 48.9 0.1 78.2 0.0 0.3 0.0 17.5 270.7 0.0 8.5 43.4 0.0 0.0 0.0 0.0
3. INTERNAL POLICIES 7,972.1 451.3 638.5 315.0 6,567.3 741.9 9.0 48.6 150.9 1,016.0 41.9 100.9 167.2 368.2 782.7 704.6 13.4 45.6 145.5 77.5 102.0 8.0 348.2 191.0 210.6 91.4 10.7 65.9 50.3 133.6 213.7 747.7 0.8
Training, youth, culture, audiovisual, media, information & 1,238.5 124.9 32.7 58.3 1,022.6 111.6 1.9 17.1 20.1 133.9 7.1 36.1 45.0 88.6 115.4 98.4 4.7 8.0 10.7 11.6 17.2 3.5 38.7 29.8 47.7 23.5 2.0 7.4 8.8 24.3 28.9 84.7 0.0
Education, vocational training and youth 817.6 85.2 15.2 20.6 696.6 42.4 1.3 15.2 12.4 87.9 6.4 11.8 38.4 63.5 71.7 76.3 4.0 6.9 9.7 4.4 15.5 3.0 24.9 19.8 43.6 19.8 1.7 6.2 7.9 18.0 18.0 68.9 0.0
Other 420.9 39.6 17.5 37.7 326.1 69.2 0.6 1.8 7.8 45.9 0.7 24.3 6.7 25.1 43.7 22.2 0.7 1.1 1.0 7.2 1.8 0.5 13.8 10.0 4.1 3.6 0.3 1.2 0.9 6.3 10.9 15.8 0.0
Energy, Euratom nuclear safeguards and environment 297.5 15.5 2.2 11.7 268.1 24.9 0.0 0.6 37.9 25.3 0.6 2.5 6.7 13.2 18.6 28.6 0.1 1.3 48.6 4.8 1.1 0.0 9.3 7.9 0.6 2.4 0.6 0.3 4.3 5.4 8.0 15.1 0.0
Energy, Euratom nuclear safeguards 89.9 1.7 1.9 3.8 82.5 5.3 0.0 0.0 1.1 4.1 0.0 0.3 1.2 1.1 5.2 1.5 0.0 0.0 48.0 3.8 0.0 0.0 1.6 1.6 0.0 0.3 0.0 0.0 3.5 0.5 1.1 2.2 0.0
Environment 207.6 13.9 0.3 7.9 185.6 19.7 0.0 0.6 36.8 21.2 0.6 2.2 5.6 12.1 13.4 27.1 0.1 1.2 0.6 1.0 1.1 0.0 7.7 6.3 0.6 2.1 0.6 0.3 0.9 4.9 7.0 12.8 0.0
Consumer protection, internal market, industry and trans 1,568.8 66.2 269.7 17.2 1,215.6 113.4 0.6 1.7 8.4 120.9 26.3 10.6 9.0 49.0 133.5 101.6 0.9 28.4 68.8 43.4 58.1 0.5 47.2 47.3 110.5 15.6 0.4 42.5 22.1 33.3 39.7 83.2 0.0
Trans-European networks 816.4 0.3 162.7 0.1 653.2 61.2 0.0 0.7 5.6 108.0 0.1 8.3 3.6 43.5 117.4 87.8 0.0 1.4 0.0 3.4 2.1 0.0 42.9 43.4 2.6 13.3 0.0 1.9 2.6 30.7 36.1 36.5 0.0
Other 752.4 65.9 107.0 17.1 562.4 52.1 0.6 1.1 2.7 12.9 26.2 2.2 5.4 5.5 16.1 13.8 0.8 27.0 68.7 40.1 56.0 0.5 4.3 3.9 107.9 2.3 0.4 40.7 19.4 2.6 3.6 46.7 0.0
Research and technological development 4,508.7 241.1 319.8 224.5 3,723.4 446.6 6.4 16.9 79.3 693.7 4.6 39.8 99.9 197.6 497.9 454.7 4.1 3.0 3.7 15.4 19.8 1.3 228.7 92.9 35.7 31.3 7.4 11.3 5.4 68.1 133.0 538.6 0.7
Other internal policies 358.6 3.6 14.2 3.3 337.6 45.4 0.1 12.3 5.2 42.2 3.4 12.0 6.6 19.8 17.4 21.3 3.6 4.9 13.7 2.3 5.8 2.7 24.2 13.1 16.1 18.7 0.2 4.3 9.7 2.5 4.1 26.2 0.0
4. EXTERNAL ACTIONS 5,013.1 135.1 831.9 4,036.3 9.7 0.0 0.2 0.0 0.0 0.0 0.0 0.0 0.0 0.0 0.0 0.0 5.3 0.0 0.0 0.0 0.0 4.4 0.0 0.0 0.0 0.0 0.6 0.0 0.0 0.0 0.0 0.0 43.3
5. ADMINISTRATION 6,191.4 135.0 413.2 137.8 5,505.4 3,412.9 1.3 14.6 50.4 148.7 7.0 39.7 21.4 49.7 285.1 138.3 5.0 6.8 8.5 971.7 14.4 4.7 65.5 20.2 27.8 19.5 1.4 6.8 9.4 22.0 22.1 133.4 1.1
6. RESERVES 140.1 0.0 140.1 0.0 0.0 0.0 0.0 0.0 0.0 0.0 0.0 0.0 0.0 0.0 0.0 0.0 0.0 0.0 0.0 0.0 0.0 0.0 0.0 0.0 0.0 0.0 0.0 0.0 0.0 0.0 0.0 0.0 0.0
7. PRE-ACCESSION STRATEGY 2,984.6 88.4 120.7 1,139.5 1,636.1 0.0 275.5 131.6 0.0 0.0 48.1 0.0 0.0 0.0 0.0 0.0 0.0 103.1 80.8 0.0 219.9 0.0 0.0 0.0 849.7 0.0 621.9 43.6 159.3 0.0 0.0 0.0 0.0
8. COMPENSATIONS 1,305.0 0.0 0.0 0.0 1,305.0 0.0 0.0 300.0 0.0 0.0 3.2 0.0 0.0 0.0 0.0 0.0 138.3 3.8 7.0 0.0 31.1 103.2 0.0 0.0 612.0 0.0 0.0 93.8 12.6 0.0 0.0 0.0 0.0
TOTAL EXPENDITURE 104,835.2 817.6 2,208.5 5,631.0 96,178.1 5,575.9 286.0 1,074.9 1,552.4 12,284.1 248.7 2,493.6 5,596.3 14,823.6 13,620.5 10,696.3 215.3 385.0 665.6 1,105.8 1,357.0 134.7 2,093.5 1,786.2 4,029.2 3,880.6 634.5 366.1 609.5 1,350.7 1,562.6 8,670.4 45.2
VAT-based own resource 16,018.0 422.8 0.0 150.6 253.1 2,888.3 14.9 229.7 286.1 1,616.6 2,655.5 2,003.8 20.5 17.1 29.8 37.7 108.5 6.8 758.0 326.3 366.1 283.7 0.0 43.9 45.3 214.1 338.2 2,900.6 0.0
GNI-based own resource 70,860.6 2,000.1 0.0 614.6 1,290.0 14,153.6 61.2 923.5 1,173.6 6,075.3 11,431.3 9,092.9 83.4 82.3 126.9 153.6 540.8 27.7 3,649.7 1,588.9 1,495.7 1,025.3 0.0 179.5 238.8 1,011.4 1,925.1 11,915.3 0.0
UK correction -130.7 227.6 0.0 78.8 148.5 369.9 7.6 107.0 142.2 685.1 1,429.9 1,108.0 10.9 10.0 16.2 19.9 70.6 3.7 55.1 40.3 193.4 110.0 0.0 23.2 30.8 126.7 39.9 -5,185.8 0.0
JHA adjustment for Denmark 0.0 0.0 0.0 0.0 -0.7 0.2 0.0 0.0 0.0 0.1 0.1 0.1 0.0 0.0 0.0 0.0 0.0 0.0 0.0 0.0 0.0 0.0 0.0 0.0 0.0 0.0 0.0 0.1 0.0
TOTAL national contribution 86,748.0 2,650.6 0.0 844.1 1,690.8 17,411.9 83.7 1,260.2 1,601.9 8,377.1 15,516.8 12,204.8 114.8 109.4 172.9 211.2 719.9 38.2 4,462.7 1,955.5 2,055.2 1,419.0 0.0 246.6 314.9 1,352.2 2,303.2 9,630.2 0.0
Traditional own resources (TOR) (75%) 14,063.1 1,373.2 0.0 146.1 298.2 2,724.4 16.0 182.2 199.6 1,097.8 1,337.3 1,341.9 35.2 20.4 34.1 15.8 113.3 11.9 1,484.3 188.5 272.0 108.0 0.0 28.1 44.1 112.7 351.0 2,526.8 0.0
Agricultural duties (100%) 1,801.0 16.3 0.0 8.3 47.8 296.5 1.0 0.7 12.4 86.0 139.7 134.5 6.8 1.7 2.9 0.5 6.1 2.2 337.0 6.0 51.1 25.9 0.0 0.1 1.8 8.6 22.7 584.4 0.0
Sugar levies (100%) 926.8 57.0 0.0 11.6 32.4 272.1 0.0 7.9 4.1 27.0 260.0 17.4 0.0 1.1 1.7 0.0 8.2 0.0 63.3 25.8 57.9 3.1 0.0 0.6 9.8 5.9 14.2 45.8 0.0
Customs duties (100%) 16,023.0 1,757.6 0.0 174.9 317.4 3,064.0 20.3 234.4 249.7 1,350.8 1,383.3 1,637.3 40.2 24.3 40.9 20.6 136.8 13.6 1,578.8 219.5 253.7 115.1 0.0 36.8 47.2 135.8 431.2 2,738.9 0.0
Amounts (25%) retained as TOR collection costs -4,687.7 -457.7 0.0 -48.7 -99.4 -908.1 -5.3 -60.7 -66.5 -365.9 -445.8 -447.3 -11.7 -6.8 -11.4 -5.3 -37.8 -4.0 -494.8 -62.8 -90.7 -36.0 0.0 -9.4 -14.7 -37.6 -117.0 -842.3 0.0
TOTAL own resources 100,811.1 4,023.8 0.0 990.2 1,989.0 20,136.3 99.7 1,442.5 1,801.6 9,474.9 16,854.1 13,546.7 150.0 129.8 207.0 227.0 833.2 50.1 5,947.1 2,144.0 2,327.2 1,527.0 0.0 274.7 359.0 1,464.9 2,654.3 12,157.1 0.0
Surplus from previous year 2,736.7
Surplus from EAGGF-Guarantee 0.0 p.m. amount of the 2004
Surplus external aid guarantee fund 526.0 UK correction: 5,547.9
Other revenue 3,016.9
TOTAL REVENUE 107,090.6
Gross National Income (GNI), EUR million* 11,409,673.0 313,966.2 23,558.6 104,447.1 214,524.0 2,320,730.0 10,821.3 146,752.0 196,750.5 917,108.0 1,802,959.6 1,492,063.4 14,125.4 13,590.9 20,721.5 26,262.2 85,434.7 4,959.2 541,050.0 252,213.7 240,036.5 156,209.3 77,880.7 29,096.1 38,302.7 165,075.0 317,451.2 1,985,022.4 35,675.0
Operating budgetary balance (EUR million) 0.00 -607.5 n.a. +178.0 -265.3 -6,064.3 +154.3 +1,136.6 +3,900.5 +6,017.8 -2,883.5 -2,199.0 +90.3 +263.9 +476.4 -86.8 +590.1 +90.0 -2,636.6 -277.9 +1,853.2 +2,378.0 n.a. +101.5 +270.9 -84.8 -866.9 -1,529.0 +44.0
Operating budgetary balance (% GNI) 0.00% -0.19% n.a. +0.17% -0.12% -0.26% +1.43% +0.77% +1.98% +0.66% -0.16% -0.15% +0.64% +1.94% +2.30% -0.33% +0.69% +1.82% -0.49% -0.11% +0.77% +1.52% n.a. +0.35% +0.71% -0.05% -0.27% -0.08% +0.12%
2005 (EUR million)

p.m.
Total earmarked other non-EU EU-25 BE BG CZ DK DE EE IE EL ES FR IT CY LV LT LU HU MT NL AT PL PT RO SI SK FI SE UK HR
1. AGRICULTURE 49,798.8 0.0 0.1 0.9 49,797.7 956.1 0.0 498.3 1,164.8 6,566.9 75.6 1,736.4 3,071.2 6,681.4 10,091.7 5,486.0 51.4 136.6 308.8 46.3 840.9 9.4 1,220.1 1,274.9 2,141.6 951.3 0.0 159.9 277.5 818.2 924.6 4,307.8 0.0 Direct Aid 34,051.3 0.0 0.0 0.0 34,051.3 470.2 0.0 255.5 923.5 5,082.3 27.6 1,202.7 1,924.9 4,616.4 7,732.4 3,749.1 13.5 38.3 102.5 32.3 373.4 0.8 658.8 665.3 807.0 550.5 0.0 30.1 102.2 502.4 669.0 3,520.6 0.0
Export refunds 2,493.6 0.0 0.0 0.0 2,493.6 348.5 0.0 18.0 133.1 233.4 3.7 111.2 74.7 68.8 403.9 89.2 1.6 1.5 59.6 0.0 31.2 0.0 308.1 37.9 140.6 21.2 0.0 4.5 14.5 45.4 64.3 278.6 0.0
Storage 756.9 0.0 0.0 0.0 756.9 -21.5 0.0 38.0 4.7 106.3 1.1 21.1 8.2 114.0 56.8 243.1 0.2 0.6 2.3 0.0 147.4 -0.3 6.8 10.0 -13.3 -6.5 0.0 1.7 18.9 10.0 8.0 -0.7 0.0
Rural development 7,709.6 0.0 0.0 0.0 7,709.6 74.4 0.0 176.3 74.3 940.4 42.4 378.3 213.3 682.2 1,183.8 587.3 25.1 95.2 140.0 11.9 233.1 7.9 68.2 499.4 1,149.6 234.0 0.0 118.9 127.1 246.3 165.3 234.9 0.0
Other 4,787.3 0.0 0.1 0.9 4,786.3 84.5 0.0 10.4 29.3 204.5 0.8 23.2 850.2 1,200.0 714.8 817.2 10.9 0.9 4.4 2.1 55.8 1.0 178.3 62.2 57.7 152.0 0.0 4.7 14.7 14.1 18.0 274.5 0.0
2. STRUCTURAL ACTIONS 32,399.3 18.9 15.8 1.6 32,363.0 310.4 0.0 463.6 124.9 4,388.3 142.5 475.5 3,590.5 5,767.0 2,235.4 4,531.0 14.7 140.6 191.8 20.8 691.2 16.3 463.9 304.5 1,950.8 2,533.9 0.0 91.0 268.0 316.7 308.3 3,021.4 0.0
Structural funds 29,381.3 4.1 15.8 1.6 29,359.8 306.7 0.0 247.5 124.4 4,388.3 87.6 436.0 3,107.3 4,484.0 2,235.2 4,531.0 8.7 65.6 139.4 20.7 553.9 13.7 463.9 304.5 1,613.4 2,330.4 0.0 60.5 190.9 316.7 308.3 3,021.3 0.0
Objective 1 20,418.9 0.0 0.0 0.0 20,418.9 87.7 0.0 229.5 0.0 2,854.9 86.3 419.6 3,009.9 3,705.9 551.0 3,412.5 0.0 63.8 137.4 0.0 547.4 13.5 31.2 25.5 1,591.9 2,184.2 0.0 59.2 189.5 139.6 102.9 975.6 0.0
of which EAGGF 3,203.8 0.0 0.0 0.0 3,203.8 6.8 0.0 39.5 0.0 473.1 13.6 43.0 353.1 790.5 84.8 513.5 0.0 24.8 35.7 0.0 146.1 0.9 2.4 4.9 292.4 215.6 0.0 5.2 56.4 37.6 15.9 48.0 0.0
of which FIFG 359.3 0.0 0.0 0.0 359.3 0.3 0.0 0.5 0.0 11.1 4.9 12.3 18.1 150.3 5.3 53.6 0.0 3.5 1.5 0.0 0.5 0.7 3.2 0.0 39.0 38.3 0.0 0.2 0.3 1.3 0.9 13.5 0.0
of which ERDF 12,233.4 0.0 0.0 0.0 12,233.4 53.9 0.0 167.1 0.0 1,681.5 52.4 183.3 2,100.8 1,910.7 316.9 2,393.2 0.0 31.7 87.2 0.0 308.0 8.9 17.0 14.5 974.0 1,195.6 0.0 42.9 78.5 63.5 63.0 488.9 0.0
of which ESF 4,622.4 0.0 0.0 0.0 4,622.4 26.8 0.0 22.5 0.0 689.1 15.3 181.1 537.9 854.3 144.0 452.1 0.0 3.9 12.9 0.0 92.9 3.0 8.6 6.1 286.4 734.7 0.0 11.0 54.4 37.1 23.1 425.1 0.0
Objective 2 3,112.0 2.9 0.0 1.6 3,107.5 62.0 0.0 7.0 14.5 525.3 0.0 0.0 0.0 296.3 771.6 469.1 5.2 0.0 0.0 7.3 0.0 0.0 156.1 102.1 0.0 0.0 0.0 0.0 0.0 70.5 60.3 560.3 0.0
of which EAGGF 6.2 2.9 0.0 0.0 3.3 0.0 0.0 0.0 0.0 0.0 0.0 0.0 0.0 0.0 0.0 0.0 0.0 0.0 0.0 0.0 0.0 0.0 0.0 0.0 0.0 0.0 0.0 0.0 0.0 0.0 0.0 3.3 0.0
of which ERDF 2,754.9 0.0 0.0 1.6 2,753.2 55.5 0.0 7.0 10.9 490.1 0.0 0.0 0.0 260.0 659.0 469.1 5.2 0.0 0.0 7.3 0.0 0.0 156.1 99.4 0.0 0.0 0.0 0.0 0.0 53.3 54.0 426.5 0.0
of which ESF 350.9 0.0 0.0 0.0 350.9 6.4 0.0 0.0 3.6 35.2 0.0 0.0 0.0 36.3 112.7 0.0 0.0 0.0 0.0 0.0 0.0 0.0 0.0 2.6 0.0 0.0 0.0 0.0 0.0 17.2 6.3 130.5 0.0
Objective 3 (ESF) 3,908.3 0.0 0.0 0.0 3,908.3 99.8 0.0 4.6 32.5 661.3 0.0 0.0 0.0 259.1 628.1 386.0 2.5 0.0 0.0 1.7 0.0 0.0 212.9 81.2 0.0 0.0 0.0 0.0 0.0 59.5 97.5 1,381.4 0.0
Other Structural measures 144.2 1.1 0.0 0.0 143.1 2.2 0.0 0.0 37.0 7.6 0.0 0.0 0.0 13.4 27.8 27.8 0.9 0.0 0.0 2.6 0.0 0.0 1.4 0.5 0.0 0.0 0.0 0.0 0.0 0.0 7.6 14.1 0.0
of which EAGGF 14.2 1.1 0.0 0.0 13.1 0.8 0.0 0.0 0.0 0.8 0.0 0.0 0.0 0.0 0.0 5.1 0.0 0.0 0.0 2.6 0.0 0.0 0.1 0.0 0.0 0.0 0.0 0.0 0.0 0.0 0.0 3.7 0.0
of which FIFG 130.0 0.0 0.0 0.0 130.0 1.5 0.0 0.0 37.0 6.8 0.0 0.0 0.0 13.4 27.8 22.8 0.9 0.0 0.0 0.0 0.0 0.0 1.3 0.5 0.0 0.0 0.0 0.0 0.0 0.0 7.6 10.4 0.0
Community initiatives 1,681.0 0.1 15.0 0.0 1,665.9 34.6 0.0 6.3 39.3 329.4 1.3 15.5 89.8 188.7 248.5 219.4 0.0 1.8 2.0 2.1 6.3 0.1 59.6 90.2 21.4 143.1 0.0 1.2 1.4 43.5 35.5 85.1 0.0
of which EAGGF 364.8 0.1 0.0 0.0 364.8 2.8 0.0 0.0 3.0 52.8 0.0 3.5 30.2 92.9 39.6 64.3 0.0 0.0 0.0 0.3 0.0 0.0 12.7 11.9 0.0 18.3 0.0 0.0 0.0 11.3 3.1 18.0 0.0
of which FIFG 4.8 0.0 0.0 0.0 4.8 0.0 0.0 0.0 0.1 0.0 0.0 0.0 0.0 0.0 0.0 0.0 0.0 0.0 0.0 0.0 0.0 0.0 0.0 0.0 0.0 4.6 0.0 0.0 0.0 0.0 0.0 0.0 0.0
of which ERDF 904.3 0.0 15.0 0.0 889.2 20.1 0.0 1.7 36.2 170.1 0.0 6.2 50.8 41.3 173.6 103.5 0.0 0.0 0.4 1.4 2.1 0.0 13.1 56.4 6.8 101.0 0.0 1.1 1.4 21.0 18.9 62.2 0.0
of which ESF 407.1 0.0 0.0 0.0 407.1 11.7 0.0 4.5 0.0 106.5 1.3 5.7 8.8 54.6 35.3 51.7 0.0 1.8 1.6 0.4 4.1 0.1 33.8 21.9 14.6 19.1 0.0 0.0 0.0 11.3 13.5 4.9 0.0
Innovatory measures and Technical assistance 117.0 0.0 0.8 0.0 116.2 20.5 0.0 0.1 1.1 9.9 0.1 0.8 7.5 20.6 8.2 16.2 0.1 0.0 0.0 7.0 0.2 0.1 2.6 4.9 0.1 3.2 0.0 0.1 0.0 3.6 4.5 4.8 0.0
of which EAGGF 2.3 0.0 0.0 0.0 2.3 1.9 0.0 0.0 0.0 0.0 0.0 0.0 0.0 0.0 0.0 0.0 0.0 0.0 0.0 0.0 0.0 0.0 0.0 0.3 0.0 0.0 0.0 0.0 0.0 0.0 0.0 0.1 0.0
of which FIFG 1.7 0.0 0.1 0.0 1.6 0.4 0.0 0.0 0.0 0.0 0.1 0.0 0.0 0.1 0.7 0.1 0.0 0.0 0.0 0.1 0.0 0.0 0.1 0.0 0.0 0.0 0.0 0.0 0.0 0.0 0.0 0.1 0.0
of which ERDF 80.3 0.0 0.6 0.0 79.7 10.1 0.0 0.1 0.2 5.8 0.0 0.6 3.1 17.4 4.9 11.6 0.1 0.0 0.0 6.7 0.2 0.1 2.1 3.8 0.1 2.9 0.0 0.1 0.0 2.9 3.3 3.5 0.0
of which ESF 32.6 0.0 0.0 0.0 32.6 8.1 0.0 0.0 0.9 4.1 0.0 0.2 4.4 3.1 2.6 4.5 0.0 0.0 0.0 0.2 0.0 0.0 0.4 0.8 0.0 0.2 0.0 0.0 0.0 0.7 1.2 1.1 0.0
Structural funds - Total EAGGF 3,591.4 4.1 0.0 0.0 3,587.3 12.2 0.0 39.5 3.0 526.7 13.6 46.5 383.4 883.3 124.3 582.8 0.0 24.8 35.7 2.9 146.1 0.9 15.2 17.2 292.5 233.9 0.0 5.2 56.4 48.9 19.0 73.2 0.0
Structural funds - Total FIFG 495.7 0.0 0.1 0.0 495.6 2.1 0.0 0.5 37.1 18.0 5.0 12.3 18.1 163.8 33.8 76.4 0.9 3.5 1.5 0.1 0.5 0.7 4.6 0.5 39.0 42.9 0.0 0.2 0.3 1.3 8.5 24.0 0.0
Structural funds - Total ERDF 15,972.9 0.0 15.6 1.6 15,955.6 139.6 0.0 175.9 47.3 2,347.5 52.5 190.1 2,154.7 2,229.5 1,154.3 2,977.4 5.3 31.7 87.6 15.3 310.4 9.0 188.3 174.1 980.9 1,299.5 0.0 44.1 79.9 140.7 139.1 981.0 0.0
Structural funds - Total ESF 9,321.4 0.0 0.0 0.0 9,321.3 152.8 0.0 31.6 37.0 1,496.1 16.6 187.1 551.1 1,207.4 922.7 894.3 2.5 5.6 14.5 2.3 97.0 3.1 255.8 112.7 301.0 754.0 0.0 11.0 54.4 125.9 141.5 1,943.0 0.0
Other specific structural operations 0.0 0.0 0.0 0.0 0.0 0.0 0.0 0.0 0.0 0.0 0.0 0.0 0.0 0.0 0.0 0.0 0.0 0.0 0.0 0.0 0.0 0.0 0.0 0.0 0.0 0.0 0.0 0.0 0.0 0.0 0.0 0.0 0.0
Cohesion Fund 3,018.0 14.8 0.0 0.0 3,003.2 3.7 0.0 216.1 0.5 0.0 54.8 39.5 483.2 1,283.0 0.2 0.0 6.0 75.1 52.4 0.1 137.3 2.6 0.0 0.0 337.4 203.5 0.0 30.5 77.1 0.0 0.0 0.1 0.0
3. INTERNAL POLICIES 9,013.7 477.3 749.3 371.3 7,415.8 784.4 9.4 55.9 163.8 1,130.6 50.5 209.4 148.0 375.3 745.5 753.5 22.3 61.5 227.5 80.4 128.1 10.4 429.4 229.0 275.0 127.2 11.0 78.5 60.5 121.9 317.9 829.3 2.4
Training, youth, culture, audiovisual, media, information & 1,361.7 127.9 35.5 56.5 1,141.9 117.4 2.6 17.7 20.1 133.1 8.0 36.7 44.5 101.7 133.8 119.2 6.6 8.9 12.0 11.9 22.6 3.9 45.7 32.0 59.6 21.6 2.5 9.8 11.3 25.0 44.7 94.1 0.1
Education, vocational training and youth 895.1 116.7 5.1 22.5 750.8 37.6 1.4 14.3 13.7 94.0 6.7 12.9 37.7 73.2 81.6 75.8 5.3 7.4 10.0 4.6 18.1 3.1 29.4 23.0 54.3 17.4 2.0 7.8 9.9 17.6 19.5 75.7 0.0
Other 466.6 11.1 30.4 34.0 391.1 79.8 1.2 3.4 6.4 39.1 1.3 23.7 6.8 28.5 52.2 43.4 1.2 1.4 2.0 7.3 4.6 0.8 16.3 9.0 5.3 4.1 0.6 2.0 1.4 7.4 25.2 18.4 0.0
Energy, Euratom nuclear safeguards and environment 431.8 9.4 8.2 10.6 403.6 27.6 0.3 1.7 39.1 34.9 0.8 1.1 6.0 19.1 17.8 32.2 0.6 1.2 146.6 4.9 3.8 0.2 16.3 9.6 3.1 4.6 0.5 1.5 1.5 6.0 8.3 15.0 0.0
Energy, Euratom nuclear safeguards 208.7 1.2 7.4 2.6 197.6 5.3 0.1 0.2 1.9 8.9 0.0 0.6 2.0 3.0 6.9 2.8 0.0 0.0 146.5 3.2 0.1 0.0 6.0 2.0 0.1 0.7 0.0 0.1 0.2 0.4 1.7 5.0 0.0
Environment 223.0 8.3 0.8 8.0 206.0 22.3 0.2 1.5 37.3 26.1 0.8 0.5 4.0 16.1 10.9 29.4 0.6 1.1 0.1 1.7 3.7 0.2 10.3 7.6 3.0 3.8 0.5 1.4 1.3 5.6 6.6 9.9 0.0
Consumer protection, internal market, industry and tran 1,473.9 52.4 358.4 10.2 1,052.9 111.9 0.1 5.3 8.3 97.6 27.5 8.8 21.1 39.2 65.4 88.6 0.8 30.5 34.9 38.4 62.4 1.0 40.4 41.7 120.3 11.0 0.1 44.9 29.9 15.7 28.6 79.1 0.0
Trans-European networks 746.1 0.5 233.8 5.4 506.3 47.1 0.0 4.2 4.4 82.8 0.7 6.9 13.8 36.1 47.0 78.1 0.1 2.0 0.1 3.7 4.7 0.5 35.2 36.0 11.8 9.1 0.0 2.9 11.2 12.4 25.8 29.9 0.0
Other 727.8 51.8 124.6 4.8 546.6 64.8 0.1 1.1 3.9 14.8 26.8 1.8 7.3 3.1 18.3 10.6 0.7 28.5 34.8 34.7 57.7 0.5 5.2 5.7 108.5 1.9 0.1 42.0 18.7 3.3 2.8 49.1 0.0
Research and technological development 5,112.2 277.8 330.2 291.2 4,213.0 475.7 6.4 23.8 91.4 803.7 5.2 157.5 69.4 199.1 488.2 495.7 6.5 2.9 4.6 22.1 27.3 1.6 294.9 115.2 45.2 39.9 7.9 13.2 6.6 71.2 145.6 606.6 2.3
Other internal policies 634.2 9.8 17.1 2.9 604.4 51.8 0.0 7.4 4.9 61.2 9.0 5.3 7.1 16.2 40.4 17.7 7.9 18.1 29.4 3.1 11.9 3.7 32.1 30.5 46.9 50.3 0.0 9.1 11.2 4.0 90.6 34.6 0.0
4. EXTERNAL ACTIONS 5,186.2 141.8 819.9 4,217.3 7.2 0.0 0.0 0.0 0.0 0.0 0.0 0.0 0.0 0.0 0.0 0.0 3.9 0.0 0.0 0.0 0.0 3.3 0.0 0.0 0.0 0.0 0.0 0.0 0.0 0.0 0.0 0.0 76.6
5. ADMINISTRATION 6,699.7 128.5 505.6 137.7 5,928.0 3,574.2 1.9 15.2 48.3 156.6 7.3 40.5 24.0 59.4 423.6 151.8 10.7 8.1 9.3 1,017.2 16.4 14.8 77.0 21.7 29.8 22.3 2.0 7.8 10.0 23.6 22.7 135.6 1.1
6. RESERVES 127.6 0.0 127.6 0.0 0.0 0.0 0.0 0.0 0.0 0.0 0.0 0.0 0.0 0.0 0.0 0.0 0.0 0.0 0.0 0.0 0.0 0.0 0.0 0.0 0.0 0.0 0.0 0.0 0.0 0.0 0.0 0.0 0.0
7. PRE-ACCESSION STRATEGY 2,276.7 33.8 63.0 1,351.8 828.1 0.0 349.3 95.2 0.0 0.0 20.8 0.0 0.0 0.0 0.0 0.0 2.4 51.9 55.2 0.0 133.5 0.0 0.0 0.0 394.0 0.0 680.2 7.9 67.3 0.0 0.0 0.0 23.4
8. COMPENSATIONS 1,073.5 0.0 0.0 0.0 1,073.5 0.0 0.0 201.9 0.0 0.0 3.3 0.0 0.0 0.0 0.0 0.0 134.1 3.9 7.2 0.0 31.9 102.9 0.0 0.0 514.3 0.0 0.0 61.0 13.0 0.0 0.0 0.0 0.0
TOTAL EXPENDITURE 106,575.5 800.2 2,281.4 6,080.6 97,413.4 5,625.1 360.6 1,330.0 1,501.9 12,242.4 300.0 2,461.8 6,833.7 12,883.0 13,496.2 10,922.3 239.6 402.6 799.8 1,164.7 1,842.2 157.0 2,190.4 1,830.1 5,305.6 3,634.8 693.1 406.0 696.2 1,280.4 1,573.4 8,294.2 103.5
VAT-based own resource 17,206.2 453.4 0.0 173.7 301.6 3,296.4 21.5 245.1 317.9 1,668.7 2,906.8 1,679.8 23.6 25.3 29.3 36.9 115.7 7.7 887.1 385.4 414.9 226.4 0.0 47.8 58.6 246.8 456.9 3,178.8 0.0
GNI-based own resource 70,132.1 1,932.6 0.0 632.5 1,399.5 13,896.2 80.3 914.1 1,162.8 6,127.7 11,026.2 9,247.2 86.5 95.7 145.1 142.5 501.3 28.3 3,497.1 1,557.1 1,563.4 909.4 0.0 174.6 254.8 1,071.2 1,812.7 11,873.5 0.0
UK correction -15.3 249.2 0.0 80.1 168.7 380.5 9.2 120.7 149.0 805.3 1,420.1 1,006.3 10.7 11.6 21.4 18.9 61.3 3.4 102.8 71.4 196.2 124.8 0.0 21.4 33.1 111.7 28.1 -5,221.4 0.0
JHA adjustment for Denmark, Ireland and the United Kingdom 0.0 0.0 0.0 0.0 -0.2 0.3 0.0 -0.1 0.0 0.1 0.2 0.2 0.0 0.0 0.0 0.0 0.0 0.0 0.1 0.0 0.0 0.0 0.0 0.0 0.0 0.0 0.0 -0.8 0.0
TOTAL national contribution 87,322.9 2,635.2 0.0 886.3 1,869.7 17,573.3 111.0 1,279.7 1,629.7 8,601.9 15,353.2 11,933.5 120.7 132.7 195.8 198.3 678.3 39.4 4,487.1 2,013.9 2,174.6 1,260.7 0.0 243.8 346.5 1,429.6 2,297.7 9,830.2 0.0
Traditional own resources (TOR) (75%) 15,028.3 1,520.9 0.0 149.0 323.3 2,927.9 19.3 202.3 204.4 1,197.9 1,282.6 1,573.3 32.6 22.5 38.0 18.9 104.2 10.8 1,644.4 195.3 272.0 117.8 0.0 35.3 55.0 130.3 399.9 2,550.5 0.0
Agricultural duties (100%) 1,722.4 19.3 0.0 7.0 42.9 232.2 0.9 0.8 11.5 61.6 132.0 182.0 4.5 1.3 2.7 0.8 5.1 1.5 313.1 4.6 49.1 29.3 0.0 0.3 1.5 7.8 20.8 589.9 0.0
Sugar levies (100%) 202.1 12.4 0.0 3.7 5.8 48.0 0.0 1.9 3.0 7.9 47.0 18.3 0.0 0.4 0.6 0.0 3.1 0.0 11.8 4.9 13.8 0.7 0.0 0.5 2.1 1.4 3.6 11.2 0.0
Customs duties (100%) 18,113.1 1,996.2 0.0 187.9 382.4 3,623.6 24.8 267.0 258.0 1,527.7 1,531.1 1,897.4 39.0 28.2 47.4 24.5 130.8 13.0 1,867.6 250.9 299.8 127.0 0.0 46.2 69.8 164.5 508.9 2,799.6 0.0
Amounts (25%) retained as TOR collection costs -5,009.4 -507.0 0.0 -49.7 -107.8 -976.0 -6.4 -67.4 -68.1 -399.3 -427.5 -524.4 -10.9 -7.5 -12.7 -6.3 -34.7 -3.6 -548.1 -65.1 -90.7 -39.3 0.0 -11.8 -18.3 -43.4 -133.3 -850.2 0.0
TOTAL own resources 102,351.2 4,156.1 0.0 1,035.3 2,193.0 20,501.2 130.3 1,482.0 1,834.1 9,799.7 16,635.9 13,506.8 153.3 155.1 233.8 217.2 782.5 50.2 6,131.5 2,209.2 2,446.6 1,378.4 0.0 279.1 401.6 1,559.9 2,697.7 12,380.6 0.0
Surplus from previous year 2,410.1
Surplus from EAGGF-Guarantee 0.0 p.m. amount of the 2005
Surplus external aid guarantee fund 92.7 UK correction: 4,841.0
Other revenue 3,569.0
TOTAL REVENUE 108,423.0
Gross National Income (GNI), EUR million* 12,054,393.8 330,595.8 26,154.7 116,236.1 228,323.9 2,435,124.0 12,819.1 161,794.0 213,486.7 990,424.0 1,890,540.5 1,554,509.7 15,193.0 16,804.8 23,619.7 24,196.1 86,382.7 5,170.0 581,675.0 267,201.7 266,501.4 160,967.3 95,145.6 31,314.8 44,137.1 174,238.0 342,807.2 2,080,331.2 39,194.1
Operating budgetary balance (EUR million) 0.00 -709.9 n.a. +386.2 -505.2 -6,325.2 +176.4 +1,080.5 +5,102.3 +3,811.7 -3,012.5 -1,731.8 +102.4 +255.5 +585.3 -60.2 +1,115.0 +101.0 -2,587.6 -301.5 +2,997.6 +2,291.7 n.a. +142.8 +323.2 -241.0 -856.6 -2,140.2 +102.4
Operating budgetary balance (% GNI) 0.00% -0.21% n.a. +0.33% -0.22% -0.26% +1.38% +0.67% +2.39% +0.38% -0.16% -0.11% +0.67% +1.52% +2.48% -0.25% +1.29% +1.95% -0.44% -0.11% +1.12% +1.42% n.a. +0.46% +0.73% -0.14% -0.25% -0.10% +0.26%
2006 (EUR million)

p.m.
Total earmarked other non-EU EU-27 BE BG CZ DK DE EE IE EL ES FR IT CY LV LT LU HU MT NL AT PL PT RO SI SK FI SE UK HR
1 SUSTAINABLE GROWTH 43,713.0 427.5 593.8 235.5 42,456.3 1,014.4 162.2 955.8 224.3 5,177.4 229.5 345.1 4,736.4 5,728.1 3,168.1 5,089.2 43.4 450.4 508.4 88.2 1,357.6 54.3 590.7 423.0 4,331.3 2,563.0 451.0 186.4 669.0 416.7 486.2 3,006.2 2.41.1 Competitiveness for growth and employ 6,738.2 422.5 569.3 235.2 5,511.2 667.6 17.3 37.7 95.0 865.7 12.8 81.4 145.3 298.5 718.9 636.7 9.0 13.1 42.9 74.7 53.5 5.1 339.2 158.3 114.2 107.0 29.6 27.4 33.7 94.6 182.7 649.3 2.4
1.1.1 Seventh Research framework programme (incl. 4,059.4 262.3 328.5 183.8 3,284.8 416.4 5.5 13.8 56.2 561.4 3.6 33.2 72.8 159.1 481.2 452.9 4.2 2.6 3.3 27.8 16.7 1.2 216.8 80.7 29.2 27.2 6.5 9.6 4.4 57.8 118.4 422.4 2.3
1.1.2 Decommissioning (Direct research) 31.7 0.0 0.0 10.8 20.9 0.3 0.0 0.0 0.0 6.3 0.0 0.0 0.0 1.3 1.4 6.7 0.0 0.0 0.0 0.1 0.0 0.0 4.5 0.0 0.0 0.0 0.0 0.0 0.0 0.0 0.0 0.3 0.0
1.1.3 Ten 371.5 0.0 0.5 0.0 370.9 24.7 0.0 6.3 2.5 74.3 0.0 3.4 0.0 25.3 31.3 38.6 0.0 0.6 2.2 2.0 4.4 0.5 29.2 39.2 12.4 12.2 0.0 6.0 0.9 5.8 26.7 22.5 0.0
1.1.4 Galileo 0.0 0.0 0.0 0.0 0.0 0.0 0.0 0.0 0.0 0.0 0.0 0.0 0.0 0.0 0.0 0.0 0.0 0.0 0.0 0.0 0.0 0.0 0.0 0.0 0.0 0.0 0.0 0.0 0.0 0.0 0.0 0.0 0.0
1.1.5 Marco Polo 9.5 0.0 0.0 0.3 9.2 0.4 0.0 0.0 0.1 0.7 0.0 0.3 0.0 0.7 2.9 2.3 0.0 0.0 0.0 0.0 0.0 0.0 0.0 1.1 0.0 0.0 0.0 0.0 0.0 0.0 0.8 0.0 0.0
1.1.6 Lifelong Learning 958.8 63.9 17.6 17.0 860.3 38.9 9.7 13.1 16.6 112.4 6.5 11.9 24.4 67.8 113.1 89.9 3.4 8.1 11.5 3.5 24.6 2.3 40.4 18.6 66.6 20.4 21.1 8.6 11.7 16.1 18.6 80.8 0.0
1.1.7 Competitiveness and innovation framework p 267.4 9.6 161.5 3.7 92.6 15.8 0.4 0.9 2.2 13.3 0.1 1.5 4.4 7.3 7.5 11.5 0.1 0.3 0.2 0.7 2.5 0.1 5.4 4.4 0.6 1.3 0.4 0.3 0.2 1.2 2.3 7.8 0.0
1.1.71 CIP Entrepreneurship and innovation 181.8 9.1 137.3 3.3 32.2 9.6 0.3 0.4 0.5 3.6 0.1 0.3 1.1 2.9 1.8 1.5 0.1 0.1 0.2 0.5 2.3 0.1 0.5 1.5 0.5 0.6 0.3 0.1 0.1 0.2 0.5 2.5 0.0
1.1.72 CIP ICT policy support 37.4 0.5 19.0 0.1 17.8 1.6 0.0 0.0 0.4 2.1 0.0 0.8 1.2 2.0 1.2 5.8 0.1 0.1 0.1 0.0 0.1 0.0 0.5 0.4 0.0 0.2 0.1 0.1 0.0 0.1 0.3 0.5 0.0
1.1.73 CIP Intelligent energy 48.2 0.0 5.2 0.3 42.7 4.6 0.1 0.5 1.2 7.6 0.0 0.4 2.1 2.5 4.4 4.2 0.0 0.1 0.0 0.1 0.1 0.0 4.4 2.5 0.1 0.5 0.0 0.0 0.0 0.9 1.5 4.8 0.0
1.1.8 Social policy agenda 119.6 2.3 0.0 2.6 114.7 36.8 1.0 0.9 2.4 18.2 0.3 1.6 1.8 3.4 6.4 6.7 0.5 0.6 0.7 3.0 1.4 0.6 5.7 4.3 1.6 3.5 0.7 1.6 1.0 1.2 1.6 7.1 0.0
1.1.9 Customs 2013 and Fiscalis 2013 35.2 0.5 7.9 0.1 26.7 12.4 0.3 0.4 0.3 0.6 0.3 0.3 3.0 0.4 0.4 0.4 0.3 0.4 0.3 1.7 0.5 0.2 0.5 0.5 0.5 0.5 0.3 0.3 0.3 0.5 0.6 0.5 0.0
1.1.10 Nuclear decommissioning 37.9 0.0 0.0 0.0 37.9 0.0 0.0 0.0 0.1 0.0 0.0 0.0 0.0 0.0 0.0 0.0 0.0 0.0 23.8 0.0 0.0 0.0 0.0 0.0 0.0 0.0 0.0 0.0 14.0 0.0 0.0 0.0 0.0
1.1.11 European Global Adjustment Funds 18.6 0.0 0.0 0.0 18.6 0.0 0.0 0.0 0.0 12.8 0.0 0.0 0.0 0.0 3.8 0.0 0.0 0.0 0.0 0.0 0.0 0.0 0.0 0.0 0.0 0.0 0.0 0.0 0.0 2.0 0.0 0.0 0.0
1.1.DAG Decentralised agencies 198.5 6.9 4.5 0.0 187.0 32.9 0.0 0.0 0.0 0.0 0.0 19.6 24.2 13.0 17.0 0.0 0.0 0.0 0.0 0.0 0.0 0.0 0.0 0.0 0.0 37.3 0.0 0.0 0.0 2.3 0.0 40.7 0.0
1.1.OTH Other actions and programmes 630.2 77.0 48.7 17.0 487.5 88.9 0.4 2.1 14.6 65.7 2.0 9.6 14.5 20.2 53.9 27.7 0.4 0.7 1.0 35.9 3.5 0.3 36.8 9.6 3.3 4.6 0.6 1.1 1.3 7.7 13.7 67.3 0.1
1.2 Cohesion for growth and employment 36,974.8 5.0 24.4 0.2 36,945.1 346.8 144.9 918.1 129.3 4,311.8 216.8 263.7 4,591.0 5,429.6 2,449.3 4,452.5 34.4 437.2 465.5 13.5 1,304.2 49.1 251.4 264.7 4,217.1 2,456.0 421.4 158.9 635.2 322.0 303.5 2,357.0 0.0
1.2.1 Structural funds 32,699.6 0.1 23.3 0.2 32,676.0 344.2 87.8 686.0 129.1 4,311.8 136.6 263.7 4,176.1 4,616.0 2,449.2 4,452.4 17.3 283.5 315.3 13.4 933.9 32.3 251.4 264.7 3,150.5 1,965.5 257.6 103.3 451.9 322.0 303.5 2,357.0 0.0
1.2.11 Convergence objective 23,521.6 0.0 0.0 0.0 23,521.6 90.8 87.8 624.7 0.0 2,599.2 134.9 240.2 4,054.8 3,776.5 484.7 3,204.4 0.0 277.7 307.3 0.0 853.2 31.6 11.7 28.0 3,081.6 1,752.1 253.2 96.5 406.7 114.6 72.8 936.7 0.0
1.2.12 Regional competitiveness and employment obj 7,835.2 0.0 0.0 0.2 7,835.0 213.4 0.0 49.7 106.8 1,496.7 0.9 22.0 37.1 697.2 1,773.4 1,095.3 17.3 4.5 3.4 9.8 50.2 0.7 225.0 146.2 47.7 40.0 0.0 1.2 38.9 183.5 206.1 1,367.9 0.0
1.2.13 European territorial cooperation objective 1,297.8 0.0 21.6 0.0 1,276.2 23.8 0.0 11.5 21.9 213.4 0.8 1.4 81.2 140.6 187.2 146.0 0.0 1.3 4.6 2.2 30.0 0.0 12.6 89.9 21.2 172.8 4.4 5.6 6.3 23.9 24.5 49.2 0.0
1.2.14 Technical assistance 44.9 0.0 1.7 0.0 43.2 16.3 0.0 0.0 0.4 2.5 0.0 0.1 3.0 1.7 3.8 6.7 0.0 0.0 0.1 1.3 0.5 0.0 2.0 0.6 0.0 0.7 0.0 0.0 0.0 0.0 0.1 3.3 0.0
1.2.2 Cohesion Fund 4,275.2 5.0 1.1 0.0 4,269.1 2.6 57.1 232.1 0.2 0.0 80.2 0.0 414.9 813.6 0.0 0.1 17.1 153.8 150.2 0.2 370.2 16.8 0.0 0.0 1,066.7 490.5 163.8 55.7 183.3 0.0 0.0 0.0 0.0
1.2.DAG Decentralised agencies 0.0 0.0 0.0 0.0 0.0 0.0 0.0 0.0 0.0 0.0 0.0 0.0 0.0 0.0 0.0 0.0 0.0 0.0 0.0 0.0 0.0 0.0 0.0 0.0 0.0 0.0 0.0 0.0 0.0 0.0 0.0 0.0 0.0
1.2.OTH Other actions and programmes 0.0 0.0 0.0 0.0 0.0 0.0 0.0 0.0 0.0 0.0 0.0 0.0 0.0 0.0 0.0 0.0 0.0 0.0 0.0 0.0 0.0 0.0 0.0 0.0 0.0 0.0 0.0 0.0 0.0 0.0 0.0 0.0 0.0
2 PRESERVATION AND MANAGEMENT OF N 54,648.4 631.3 5.7 157.6 53,853.9 879.9 6.6 717.1 1,168.8 6,905.7 121.2 1,762.7 3,644.4 6,973.4 10,360.1 5,913.3 61.0 186.2 483.0 55.2 956.2 8.7 1,211.3 1,130.0 3,114.3 1,299.7 23.9 179.5 380.5 972.8 1,104.8 4,233.7 0.02.0.1 Market related expenditure and direct aids 42,650.1 553.7 1.7 0.4 42,094.3 785.6 0.9 353.6 1,089.9 5,678.2 39.8 1,330.8 2,685.8 5,928.5 9,241.0 4,835.4 30.4 55.9 169.2 36.3 476.9 2.1 1,124.5 754.9 1,216.2 720.7 8.4 49.9 159.1 587.3 761.1 3,971.8 0.0
2.0.11 Agriculture markets 42,413.2 553.1 0.8 0.0 41,859.3 777.3 0.9 351.8 1,087.0 5,653.9 38.5 1,320.2 2,684.9 5,883.4 9,184.6 4,817.7 27.8 54.9 168.4 35.9 474.9 2.0 1,109.2 752.7 1,211.4 706.9 8.4 49.1 158.3 586.3 759.5 3,953.5 0.0
Direct Aid 37,045.9 1.2 0.0 0.0 37,044.7 551.5 0.0 328.6 979.6 5,495.0 35.1 1,275.7 2,472.2 4,869.5 8,073.3 3,820.4 16.9 52.6 134.7 35.1 471.5 1.1 800.8 709.0 1,076.5 562.4 0.0 42.8 133.8 547.9 726.3 3,832.4 0.0
Export refunds 1,444.7 0.0 0.0 0.0 1,444.7 155.6 0.0 12.8 100.3 154.1 3.9 64.2 30.4 38.6 281.8 60.4 1.1 3.2 33.1 0.0 12.2 0.2 197.8 18.9 89.2 12.0 0.0 3.3 4.7 32.8 27.2 107.0 0.0
Storage -106.7 0.0 0.0 0.0 -106.7 -2.6 0.0 1.4 -6.8 -122.7 -1.2 -25.9 13.3 28.6 61.4 16.4 0.2 -1.6 -3.6 0.0 -51.1 -0.2 5.1 4.7 -20.0 -2.7 0.0 -1.6 16.1 -5.1 -8.7 -0.1 0.0
Other 4,029.4 551.9 0.8 0.0 3,476.7 72.8 0.9 9.0 13.9 127.4 0.7 6.2 169.0 946.6 768.1 920.5 9.6 0.8 4.2 0.8 42.3 0.9 105.5 20.2 65.8 135.2 8.4 4.6 3.7 10.7 14.7 14.2 0.0
2.0.12 Fisheries market 24.7 0.0 0.0 0.0 24.7 0.1 0.0 0.0 0.1 0.0 0.1 0.0 0.0 11.7 6.8 0.0 0.0 0.1 0.1 0.1 0.0 0.0 0.1 0.0 0.0 5.4 0.0 0.0 0.0 0.0 0.1 0.0 0.0
2.0.13 Animal and plant health 212.3 0.6 0.9 0.4 210.3 8.2 0.0 1.8 2.8 24.3 1.3 10.7 0.9 33.3 49.6 17.8 2.6 0.9 0.7 0.3 2.0 0.0 15.3 2.2 4.8 8.3 0.0 0.8 0.9 1.0 1.6 18.3 0.0
2.0.2 Rural development 10,874.3 68.2 0.0 0.0 10,806.1 66.2 0.0 359.1 0.6 1,189.6 71.5 425.6 908.0 690.8 1,052.2 960.7 29.2 112.3 308.2 16.1 476.0 5.2 62.9 370.8 1,897.3 536.9 0.0 129.0 219.3 372.1 321.1 225.4 0.0
2.0.3 European fisheries fund 749.7 0.0 0.1 0.0 749.6 4.9 5.6 3.0 35.8 26.0 9.3 3.7 45.1 334.1 54.8 92.5 0.8 16.8 5.3 0.3 1.6 1.0 14.3 0.7 0.0 36.1 15.1 0.2 1.6 8.5 18.6 13.9 0.0
2.0.4 Fisheries governance and international agree 217.8 0.0 1.5 156.7 59.6 3.3 0.0 0.0 6.7 3.4 0.4 1.6 1.8 8.6 3.7 8.1 0.2 0.2 0.2 1.1 0.0 0.4 1.7 0.0 0.6 3.4 0.0 0.1 0.0 0.9 1.6 11.6 0.0
2.0.5 Life+ 114.4 5.0 0.9 0.4 108.1 17.2 0.0 1.3 3.7 8.5 0.2 1.0 3.7 11.4 8.4 15.7 0.4 1.0 0.2 1.3 1.6 0.0 7.9 3.6 0.2 2.2 0.4 0.4 0.5 3.9 2.3 11.0 0.0
2.0.DAG Decentralised agencies 40.8 4.4 1.5 0.0 34.9 2.8 0.0 0.0 32.1 0.0 0.0 0.0 0.0 0.0 0.0 0.0 0.0 0.0 0.0 0.0 0.0 0.0 0.0 0.0 0.0 0.0 0.0 0.0 0.0 0.0 0.0 0.0 0.0
2.0.OTH Other actions and programmes 1.3 0.0 0.0 0.0 1.3 0.0 0.0 0.0 0.0 0.0 0.0 0.0 0.0 0.0 0.0 0.9 0.0 0.0 0.0 0.0 0.0 0.0 0.0 0.0 0.0 0.4 0.0 0.0 0.0 0.0 0.0 0.0 0.0
3 CITIZENSHIP, FREEDOM, SECURITY AND J 1,049.8 31.0 24.4 14.1 980.4 90.3 3.1 17.8 8.5 233.3 9.3 7.2 19.1 26.7 98.4 83.4 8.9 10.0 15.8 10.4 36.9 11.4 36.8 25.4 86.5 16.9 4.3 9.2 13.7 10.9 44.0 42.4 0.13.1 Freedom, security and justice 212.2 12.5 0.9 0.1 198.6 19.4 0.2 1.1 0.5 15.5 0.5 1.6 1.3 5.9 24.6 7.8 0.9 0.5 5.5 0.6 1.3 0.7 19.5 16.5 40.3 10.2 0.2 0.9 1.4 2.1 4.3 15.4 0.0
3.1.1 Solidarity and management of migration flows 68.7 1.4 0.0 0.0 67.3 7.5 0.2 0.8 0.4 10.6 0.5 1.3 1.1 3.3 7.4 4.0 0.8 0.4 5.4 0.4 0.6 0.7 2.8 3.1 1.3 0.9 0.2 0.6 1.3 1.7 3.6 6.3 0.0
3.1.2 Security and safeguarding liberties 5.1 0.0 0.8 0.0 4.3 0.8 0.0 0.0 0.0 1.5 0.0 0.0 0.0 0.3 0.1 0.3 0.0 0.0 0.0 0.0 0.0 0.0 0.2 0.1 0.0 0.0 0.0 0.0 0.0 0.1 0.2 0.7 0.0
3.1.3 Fundamental rights and justice 2.3 0.0 0.0 0.0 2.3 1.2 0.0 0.2 0.0 0.0 0.0 0.0 0.0 0.0 0.0 0.0 0.1 0.1 0.1 0.0 0.3 0.0 0.0 0.0 0.1 0.0 0.0 0.0 0.1 0.0 0.0 0.0 0.0
3.1.DAG Decentralised agencies 93.4 10.2 0.0 0.0 83.1 0.0 0.0 0.0 0.0 0.0 0.0 0.0 0.0 0.0 0.0 0.0 0.0 0.0 0.0 0.0 0.0 0.0 16.1 12.6 38.7 9.1 0.0 0.0 0.0 0.0 0.0 6.5 0.0
3.1.OTH Other actions and programmes 42.7 0.9 0.2 0.1 41.6 9.8 0.0 0.1 0.1 3.4 0.0 0.3 0.2 2.2 17.1 3.5 0.0 0.0 0.0 0.1 0.4 0.0 0.4 0.7 0.1 0.1 0.0 0.2 0.0 0.3 0.5 1.9 0.0
3.2 Citizenship 837.6 18.4 23.5 13.9 781.8 71.0 2.8 16.7 8.1 217.8 8.8 5.6 17.8 20.8 73.8 75.6 8.0 9.5 10.3 9.9 35.5 10.7 17.3 8.9 46.2 6.7 4.1 8.3 12.3 8.8 39.7 27.1 0.1
3.2.1 Public health and consumer protection progr 70.8 0.4 2.2 4.0 64.3 14.8 0.1 0.4 1.7 5.9 0.2 0.8 1.4 2.1 4.8 4.0 0.5 0.2 0.2 4.9 1.5 0.1 5.3 1.9 0.6 0.5 0.2 0.7 0.2 3.1 2.5 5.9 0.0
3.2.2 Culture 2007-2013 38.1 1.8 0.0 1.4 34.9 4.7 0.1 0.8 0.8 4.1 0.1 0.4 0.9 1.3 4.9 3.4 0.0 0.5 0.3 1.1 0.2 0.0 1.3 2.1 0.3 0.5 1.1 0.2 0.1 0.4 0.6 4.5 0.0
3.2.3 Youth in action 124.7 7.6 0.0 4.1 113.0 6.8 1.7 2.8 1.7 15.8 1.9 2.2 3.2 7.6 15.1 6.6 1.2 2.0 2.6 1.2 4.1 0.9 3.5 2.5 7.0 2.8 2.4 2.3 2.3 2.3 2.8 7.8 0.1
3.2.4 Media 2007 98.2 2.7 0.0 3.3 92.0 13.2 0.5 0.8 2.7 13.2 0.3 0.7 1.2 5.7 22.5 7.4 0.0 0.3 0.3 0.9 0.9 0.0 5.2 1.2 2.5 0.8 0.1 0.3 0.2 1.4 3.9 5.5 0.0
3.2.5 Europe for Citizens 18.6 0.3 0.0 0.0 18.3 2.8 0.2 0.2 0.0 3.2 0.1 0.1 0.2 0.5 4.3 2.1 0.0 0.1 0.0 0.0 1.3 0.0 0.2 0.3 0.8 0.1 0.2 0.1 0.1 0.1 0.1 1.3 0.0
3.2.6 Civil protection Financial instrument 8.3 0.1 0.1 0.1 8.0 0.2 0.1 0.0 0.5 1.7 0.0 0.0 0.4 0.1 0.8 2.4 0.0 0.1 0.0 0.0 0.3 0.0 0.0 0.0 0.0 0.2 0.0 0.0 0.0 0.0 0.7 0.4 0.0
3.2.7 Communication actions 75.2 0.3 0.0 1.0 74.0 24.2 0.1 0.5 0.6 5.4 0.4 1.3 1.1 2.8 15.6 5.5 0.4 0.7 0.4 1.6 2.2 0.4 1.7 0.7 1.0 1.9 0.1 0.8 0.4 1.3 1.3 1.6 0.0
3.2.8 European Solidarity Fund 196.6 0.0 0.0 0.0 196.6 0.0 0.0 0.0 0.0 166.9 0.0 0.0 9.3 0.0 5.3 0.0 0.0 0.0 0.0 0.0 15.1 0.0 0.0 0.0 0.0 0.0 0.0 0.0 0.0 0.0 0.0 0.0 0.0
3.2.DAG Decentralised agencies 76.6 4.9 0.0 0.0 71.7 0.0 0.0 0.0 0.0 0.0 0.0 0.0 0.0 0.0 0.0 43.8 0.0 0.0 0.0 0.0 0.0 0.0 0.0 0.0 0.0 0.0 0.0 0.0 0.0 0.0 27.8 0.0 0.0
3.2.OTH Other actions and programmes 130.5 0.3 21.1 0.0 109.1 4.3 0.0 11.2 0.0 1.7 5.8 0.0 0.0 0.6 0.5 0.4 5.9 5.7 6.5 0.1 10.0 9.2 0.1 0.1 34.0 0.0 0.0 3.8 9.0 0.2 0.0 0.0 0.0
4 THE EU AS A GLOBAL PARTNER 7,291.8 200.7 1,081.1 4,557.5 1,452.4 0.0 278.2 15.2 0.0 0.0 8.3 0.0 0.0 0.0 0.0 0.0 7.7 20.7 25.4 0.0 61.6 1.7 0.0 0.0 227.1 0.0 789.1 7.5 9.9 0.0 0.0 0.0 73.84.0.1 Instrument for Preaccession (IPA) 2,510.5 51.5 188.4 818.1 1,452.4 0.0 278.2 15.2 0.0 0.0 8.3 0.0 0.0 0.0 0.0 0.0 7.7 20.7 25.4 0.0 61.6 1.7 0.0 0.0 227.1 0.0 789.1 7.5 9.9 0.0 0.0 0.0 72.6
Other actions and programmes 4,781.3 149.2 892.7 3,739.4 0.0 0.0 0.0 0.0 0.0 0.0 0.0 0.0 0.0 0.0 0.0 0.0 0.0 0.0 0.0 0.0 0.0 0.0 0.0 0.0 0.0 0.0 0.0 0.0 0.0 0.0 0.0 0.0 1.2
5 ADMINISTRATION 6,805.6 163.2 354.7 175.9 6,111.8 3,694.1 12.2 15.1 47.6 167.2 8.6 41.7 29.2 67.8 270.6 229.4 5.7 7.7 11.1 1,102.1 15.4 13.2 77.7 20.0 27.2 24.8 18.8 7.5 9.6 23.1 24.0 140.5 1.26 COMPENSATIONS 444.6 0.0 0.0 0.0 444.6 0.0 129.3 0.0 0.0 0.0 0.0 0.0 0.0 0.0 0.0 0.0 0.0 0.0 0.0 0.0 0.0 0.0 0.0 0.0 0.0 0.0 315.4 0.0 0.0 0.0 0.0 0.0 0.0TOTAL EXPENDITURE 113,953.3 1,453.6 2,059.6 5,140.5 105,299.5 5,678.8 591.5 1,721.0 1,449.2 12,483.6 376.9 2,156.7 8,429.1 12,795.9 13,897.2 11,315.3 126.8 675.0 1,043.8 1,255.9 2,427.6 89.3 1,916.4 1,598.4 7,786.4 3,904.4 1,602.4 390.1 1,082.6 1,423.4 1,659.0 7,422.9 77.5
VAT-based own resource 19,440.8 468.5 46.3 199.9 332.8 3,635.2 26.8 276.4 697.9 1,722.8 3,113.8 2,030.1 25.0 35.2 47.1 53.2 137.8 9.1 936.3 409.0 508.7 269.4 162.1 55.9 84.6 260.7 486.6 3,409.6 0.0GNI-based own resource 73,914.7 1,985.7 163.0 703.8 1,394.8 14,652.9 95.8 972.4 1,946.5 6,073.0 11,214.9 9,143.0 88.2 118.0 158.2 202.2 546.6 32.5 3,400.3 1,564.8 1,745.5 940.0 681.7 198.3 302.5 1,087.7 1,948.8 12,553.6 0.0UK correction 58.9 232.5 20.8 84.4 162.9 294.2 11.2 119.6 145.8 751.7 1,326.9 1,163.2 10.7 14.9 20.1 21.2 74.9 3.6 92.4 43.0 215.8 113.9 86.4 22.6 41.6 132.0 41.3 -5,188.9 0.0
JHA adjustment for Denmark, Ireland and the United Kingdom 0.1 0.1 0.0 0.0 -1.2 1.0 0.0 -0.2 0.1 0.4 0.8 0.6 0.0 0.0 0.0 0.0 0.0 0.0 0.2 0.1 0.1 0.1 0.0 0.0 0.0 0.1 0.1 -2.4 0.0
TOTAL national contribution 93,414.5 2,686.8 230.0 988.2 1,889.2 18,583.2 133.8 1,368.3 2,790.3 8,548.0 15,656.4 12,336.9 123.9 168.1 225.5 276.6 759.4 45.2 4,429.3 2,017.0 2,470.1 1,323.3 930.3 276.8 428.7 1,480.5 2,476.7 10,771.9 0.0Traditional own resources (TOR) (75%) 16,573.0 1,685.1 60.8 178.8 329.8 3,126.8 42.8 218.0 229.6 1,290.1 1,332.5 1,687.2 46.4 30.9 45.4 19.2 110.9 11.8 1,873.5 201.1 338.4 137.1 159.2 82.5 90.5 148.9 438.4 2,657.0 0.0Agricultural duties (100%) 1,872.1 22.8 18.9 5.2 46.4 230.6 1.3 1.0 11.1 50.7 151.8 202.3 5.5 1.9 4.1 0.9 6.8 2.0 334.4 3.4 55.4 28.5 39.2 0.7 1.7 11.3 30.1 603.8 0.0Sugar levies (100%) -40.9 -6.5 0.0 10.1 -3.5 -29.3 22.8 -0.7 -1.1 -1.7 -26.4 -9.4 10.0 2.2 0.0 0.0 -0.3 0.6 2.0 -2.8 -3.8 -0.3 0.0 -0.2 3.5 -0.5 -1.4 -4.3 0.0Customs duties (100%) 20,266.2 2,230.4 62.1 223.1 396.8 3,967.8 33.0 290.4 296.2 1,671.2 1,651.3 2,056.8 46.3 37.0 56.5 24.7 141.3 13.2 2,161.5 267.5 399.7 154.5 173.0 109.6 115.5 187.8 555.8 2,943.2 0.0
Amounts (25%) retained as TOR collection costs -5,524.3 -561.7 -20.3 -59.6 -109.9 -1,042.3 -14.3 -72.7 -76.5 -430.0 -444.2 -562.4 -15.5 -10.3 -15.1 -6.4 -37.0 -3.9 -624.5 -67.0 -112.8 -45.7 -53.1 -27.5 -30.2 -49.6 -146.1 -885.7 0.0
TOTAL own resources 109,987.5 4,371.9 290.8 1,167.0 2,219.0 21,710.0 176.7 1,586.4 3,019.9 9,838.2 16,988.9 14,024.2 170.3 199.0 271.0 295.8 870.2 57.0 6,302.8 2,218.1 2,808.6 1,460.4 1,089.4 359.4 519.2 1,629.4 2,915.2 13,429.0 0.0Surplus from previous year 1,847.6Surplus from EAGGF-Guarantee 0.0 p.m. amount of the 2006Surplus external aid guarantee fund 260.9 UK correction: 5,385.2Other revenue 5,467.0
TOTAL REVENUE 117,563.0
Gross National Income (GNI), EUR million* 12,872,042.3 349,103.5 29,635.6 129,177.2 234,629.6 2,551,867.0 15,128.3 170,923.0 226,583.8 1,054,673.0 1,986,162.7 1,611,053.2 16,288.7 21,947.9 27,947.3 29,176.5 94,625.7 5,600.7 612,501.0 281,791.1 302,543.9 169,874.2 120,928.4 34,515.8 54,460.8 187,173.0 369,097.0 2,184,633.4 42,978.9
Operating budgetary balance (EUR million) 0.00 -868.2 +335.1 +656.7 -604.4 -7,415.2 +226.2 +662.1 +5,437.2 +3,651.8 -2,997.3 -2,013.5 -10.5 +488.8 +793.2 -139.8 +1,605.9 +28.1 -2,864.3 -563.2 +5,136.4 +2,474.4 +595.8 +88.6 +617.8 -171.6 -994.8 -4,155.3 +76.3
Operating budgetary balance (% GNI) 0.00% -0.25% +1.13% +0.51% -0.26% -0.29% +1.50% +0.39% +2.40% +0.35% -0.15% -0.12% -0.06% +2.23% +2.84% -0.48% +1.70% +0.50% -0.47% -0.20% +1.70% +1.46% +0.49% +0.26% +1.13% -0.09% -0.27% -0.19% +0.18%
2007 (EUR million)

p.m.
Total earmarked other non-EU EU-27 BE BG CZ DK DE EE IE EL ES FR IT CY LV LT LU HU MT NL AT PL PT RO SI SK FI SE UK HR
1 SUSTAINABLE GROWTH 45,611.4 378.8 998.1 452.5 43,782.0 1,296.8 270.9 1,752.1 264.1 4,340.7 252.7 309.7 4,918.0 4,878.4 3,290.8 4,524.1 60.9 399.6 810.4 170.5 1,263.5 51.3 1,171.3 485.0 4,749.2 2,692.3 684.8 279.3 852.8 448.8 429.7 3,134.4 5.61.1 Competitiveness for growth and 10,056.6 378.8 922.2 452.4 8,303.3 899.4 47.8 72.7 166.1 1,258.6 15.7 96.1 205.7 631.8 978.1 835.4 13.6 16.2 180.1 116.7 74.9 7.4 500.5 253.1 140.5 123.4 36.4 44.6 43.3 235.1 276.0 1,034.1 5.6
1.1.1 Seventh Research framework programm 6,471.3 221.6 426.5 405.7 5,417.5 519.9 11.4 31.1 116.8 953.9 7.9 54.3 137.4 422.8 645.3 546.9 7.8 5.3 5.6 32.3 40.7 2.0 411.9 152.8 58.6 44.3 22.9 27.1 8.8 117.3 206.4 826.1 4.7
1.1.2 Decommissioning (Direct research) 22.8 0.0 0.0 0.3 22.6 0.2 0.0 0.9 0.0 8.6 0.0 0.0 0.0 1.5 1.2 7.3 0.0 0.0 0.0 0.0 0.0 0.0 2.1 0.0 0.0 0.0 0.0 0.0 0.0 0.0 0.0 0.8 0.0
1.1.3 Ten 897.9 0.2 96.0 0.0 801.7 131.3 1.8 15.9 22.1 90.5 0.0 3.4 2.9 57.7 165.2 84.8 0.6 3.1 1.1 46.3 5.1 0.0 11.4 62.0 4.2 3.7 0.6 2.9 1.2 27.4 30.7 25.6 0.0
1.1.4 Galileo 150.0 0.0 150.0 0.0 0.0 0.0 0.0 0.0 0.0 0.0 0.0 0.0 0.0 0.0 0.0 0.0 0.0 0.0 0.0 0.0 0.0 0.0 0.0 0.0 0.0 0.0 0.0 0.0 0.0 0.0 0.0 0.0 0.0
1.1.5 Marco Polo 18.4 0.0 0.0 0.2 18.1 2.2 0.0 0.0 0.0 3.6 0.0 0.0 0.0 0.1 0.0 3.3 1.6 0.0 0.0 0.0 0.0 0.0 4.8 0.0 0.0 0.3 0.0 0.6 0.0 0.3 0.2 1.2 0.0
1.1.6 Lifelong Learning 1,052.6 67.9 17.8 20.6 946.4 45.7 14.6 21.0 13.5 130.6 6.2 13.5 26.2 99.9 90.9 119.9 1.4 5.9 12.7 4.5 20.3 2.9 30.7 22.8 69.3 26.4 10.1 8.6 8.4 20.3 28.9 91.1 0.1
1.1.7 Competitiveness and innovation fra 363.9 8.0 186.4 4.7 164.7 25.6 1.1 1.3 3.3 28.5 0.2 2.0 5.8 11.5 16.5 15.9 0.3 0.5 0.5 0.6 2.5 0.2 13.2 6.1 4.3 4.0 1.5 1.3 0.4 2.4 1.9 13.3 0.6
1.1.71 CIP Entrepreneurship and innovation 232.1 5.9 138.9 2.6 84.8 14.5 1.0 1.2 1.1 13.3 0.2 0.7 2.8 6.2 9.8 7.6 0.2 0.5 0.4 0.4 1.6 0.2 3.9 2.1 3.8 1.6 1.4 0.7 0.4 0.8 1.1 7.4 0.4
1.1.72 CIP ICT policy support 60.6 0.2 45.2 0.1 15.0 1.7 0.0 0.1 0.6 1.6 0.0 0.4 0.9 1.6 1.0 1.3 0.1 0.1 0.1 0.2 0.8 0.0 1.3 0.3 0.2 0.3 0.0 0.4 0.1 0.1 0.0 1.9 0.0
1.1.73 CIP Intelligent energy 71.2 1.9 2.4 2.0 64.9 9.3 0.1 0.1 1.6 13.5 0.0 0.9 2.1 3.7 5.7 7.0 0.0 0.0 0.0 0.0 0.1 0.0 8.1 3.7 0.4 2.1 0.0 0.2 0.0 1.5 0.8 4.1 0.2
1.1.8 Social policy agenda 131.7 1.3 0.2 4.0 126.3 51.4 1.1 0.9 1.7 13.1 0.2 1.3 2.4 3.5 10.4 6.9 0.6 0.5 0.6 1.8 2.0 0.6 7.2 4.6 1.6 2.1 0.2 1.8 0.5 1.0 1.3 6.9 0.2
1.1.9 Customs 2013 and Fiscalis 2013 50.2 0.6 11.5 4.0 34.1 17.2 0.4 0.5 0.4 0.8 0.5 0.3 1.1 0.5 0.3 0.5 0.4 0.5 0.4 3.9 0.7 0.4 0.6 0.4 0.6 0.6 0.4 0.4 0.3 0.6 0.7 0.6 0.0
1.1.10 Nuclear decommissioning 197.5 0.0 0.0 0.0 197.5 0.0 16.9 0.0 0.0 0.0 0.0 0.0 0.0 0.0 0.0 0.0 0.0 0.0 158.6 0.0 0.0 0.0 0.0 0.0 0.0 0.0 0.0 0.0 22.0 0.0 0.0 0.0 0.0
1.1.11 European Global Adjustment Funds 49.0 0.0 0.0 0.0 49.0 0.0 0.0 0.0 0.0 0.0 0.0 0.0 0.0 10.5 0.0 35.2 0.0 0.0 0.3 0.0 0.0 0.7 0.0 0.0 0.0 2.4 0.0 0.0 0.0 0.0 0.0 0.0 0.0
1.1.DAG Decentralised agencies 265.5 21.4 0.3 0.0 243.9 33.7 0.0 0.0 0.0 0.0 0.0 20.0 21.8 13.8 17.0 0.0 0.0 0.0 0.0 0.0 0.0 0.0 0.0 0.0 0.0 37.7 0.0 0.0 0.0 61.0 0.0 38.9 0.0
1.1.OTH Other actions and programmes 385.7 57.8 33.5 12.9 281.5 72.4 0.5 0.9 8.2 29.0 0.6 1.4 8.0 10.2 31.2 14.6 0.9 0.4 0.4 27.5 3.5 0.5 18.6 4.4 1.8 1.9 0.7 1.9 1.6 4.8 6.0 29.5 0.0
1.2 Cohesion for growth and employ 35,554.8 0.0 76.0 0.1 35,478.8 397.4 223.0 1,679.4 98.0 3,082.1 237.0 213.6 4,712.4 4,246.7 2,312.6 3,688.7 47.3 383.4 630.2 53.7 1,188.6 43.9 670.8 231.9 4,608.7 2,568.9 648.5 234.6 809.5 213.7 153.7 2,100.3 0.0
1.2.1 Structural funds 30,264.5 0.0 74.5 0.1 30,189.9 394.9 131.7 1,054.9 98.0 3,082.0 124.0 213.6 4,401.8 3,495.8 2,312.3 3,688.7 29.8 225.4 382.5 45.0 774.8 27.3 670.8 231.9 3,026.1 2,282.6 386.4 131.8 510.1 213.7 153.5 2,100.3 0.0
1.2.11 Convergence objective 21,400.3 0.0 22.9 0.0 21,377.4 106.8 131.7 957.5 0.0 1,615.8 121.7 138.9 4,229.4 2,801.6 521.5 2,670.0 0.0 223.4 371.7 0.0 670.0 27.2 8.2 33.3 2,951.8 2,087.6 379.8 117.4 456.2 50.1 4.6 701.0 0.0
1.2.12 Regional competitiveness and employ 7,395.2 0.0 0.0 0.0 7,395.2 238.5 0.0 80.1 75.6 1,219.6 1.1 72.2 38.9 590.0 1,599.8 884.9 29.6 0.0 4.0 7.1 70.1 0.1 641.9 98.3 41.2 38.9 0.0 1.2 47.7 136.3 126.3 1,351.8 0.0
1.2.13 European territorial cooperation objec 1,361.4 0.0 49.7 0.1 1,311.7 27.6 0.0 17.2 22.0 243.5 1.1 1.6 127.4 98.7 182.9 130.2 0.0 1.9 6.6 2.4 34.6 0.0 13.6 95.6 33.2 155.9 6.5 12.9 6.1 24.6 21.5 43.9 0.0
1.2.14 Technical assistance 107.5 0.0 1.9 0.0 105.5 22.0 0.0 0.0 0.4 3.1 0.0 0.9 6.1 5.6 8.0 3.5 0.2 0.0 0.1 35.5 0.2 0.0 7.0 4.7 0.1 0.2 0.0 0.3 0.0 2.7 1.1 3.6 0.0
1.2.2 Cohesion Fund 5,290.4 0.0 1.5 0.0 5,288.9 2.5 91.3 624.5 0.0 0.1 112.9 0.0 310.5 750.8 0.3 0.0 17.5 158.1 247.8 8.7 413.8 16.6 0.0 0.0 1,582.6 286.3 262.1 102.8 299.4 0.0 0.1 0.0 0.0
1.2.DAG Decentralised agencies 0.0 0.0 0.0 0.0 0.0 0.0 0.0 0.0 0.0 0.0 0.0 0.0 0.0 0.0 0.0 0.0 0.0 0.0 0.0 0.0 0.0 0.0 0.0 0.0 0.0 0.0 0.0 0.0 0.0 0.0 0.0 0.0 0.0
1.2.OTH Other actions and programmes 0.0 0.0 0.0 0.0 0.0 0.0 0.0 0.0 0.0 0.0 0.0 0.0 0.0 0.0 0.0 0.0 0.0 0.0 0.0 0.0 0.0 0.0 0.0 0.0 0.0 0.0 0.0 0.0 0.0 0.0 0.0 0.0 0.0
2 PRESERVATION AND MANAGEMEN 54,812.7 2,545.0 6.3 167.0 52,094.4 818.6 420.1 655.1 1,234.9 6,606.4 97.4 1,692.1 3,444.7 7,083.3 10,014.2 5,407.3 54.9 190.2 253.0 53.0 681.1 11.9 963.6 1,217.8 2,658.0 1,373.4 1,060.1 143.0 357.0 839.8 959.4 3,803.9 0.02.0.1 Market related expenditure and direct 43,288.6 2,536.0 0.7 0.1 40,751.7 706.5 178.6 404.7 1,057.8 5,707.3 43.3 1,308.2 2,534.8 5,734.4 8,935.4 4,271.8 29.2 65.0 175.4 36.4 515.5 1.0 916.5 743.9 1,460.8 699.9 480.3 47.6 166.7 559.4 744.7 3,226.5 0.0
2.0.11 Agriculture markets 43,008.8 2,531.1 0.2 0.1 40,477.3 696.5 178.4 401.5 1,054.1 5,673.0 41.8 1,298.9 2,533.8 5,687.9 8,859.3 4,256.0 27.4 63.8 174.2 35.9 513.4 1.0 903.1 743.7 1,450.9 682.4 474.1 47.0 165.1 558.6 742.6 3,212.9 0.0
Direct Aid 37,568.6 796.9 0.0 0.0 36,771.7 559.7 166.4 380.4 969.8 5,490.6 40.9 1,271.5 2,390.5 4,816.9 8,072.2 3,492.6 19.4 61.8 158.4 34.5 542.8 0.0 768.0 708.6 1,247.6 538.7 422.3 41.1 156.0 543.4 716.9 3,160.8 0.0
Export refunds 925.4 22.5 0.0 0.0 903.0 121.8 0.8 1.6 67.4 92.7 0.2 16.6 3.1 30.2 218.4 45.7 0.2 0.7 11.3 0.0 17.4 0.0 89.2 21.7 114.3 12.2 0.0 0.7 1.4 6.6 10.9 18.0 0.0
Storage 147.9 0.0 0.0 0.0 147.9 4.0 0.0 2.2 4.7 9.5 0.0 1.9 3.7 75.5 56.2 81.3 0.3 0.0 -1.2 0.0 -100.3 -0.2 6.4 1.4 -4.1 6.0 -6.9 -0.4 4.7 0.0 2.6 0.6 0.0
Other 4,366.9 1,711.8 0.2 0.1 2,654.7 11.0 11.3 17.2 12.2 80.2 0.8 9.0 136.6 765.3 512.5 636.4 7.5 1.3 5.7 1.4 53.5 1.1 39.5 11.9 93.1 125.5 58.7 5.5 2.9 8.6 12.3 33.4 0.0
2.0.12 Fisheries market 26.3 0.0 0.0 0.0 26.3 0.1 0.0 0.0 0.1 0.0 0.4 1.2 0.0 8.2 11.2 0.1 0.0 0.1 0.1 0.1 0.0 0.0 0.0 0.0 0.2 3.9 0.0 0.0 0.0 0.0 0.2 0.5 0.0
2.0.13 Animal and plant health 253.5 4.9 0.5 0.0 248.1 9.9 0.2 3.3 3.6 34.3 1.1 8.1 1.0 38.4 64.9 15.7 1.8 1.2 1.0 0.5 2.1 0.0 13.4 0.2 9.7 13.7 6.2 0.6 1.6 0.9 1.9 13.1 0.0
2.0.2 Rural development 10,529.1 0.0 0.2 0.0 10,528.9 74.2 240.8 246.6 110.8 872.5 52.4 364.0 858.7 1,182.0 1,005.0 1,047.8 21.8 123.5 73.7 12.9 160.3 9.4 35.9 469.7 1,084.4 634.9 561.6 92.5 188.2 273.8 202.6 528.6 0.0
2.0.3 European fisheries fund 572.1 0.0 0.2 0.0 572.0 5.2 0.0 2.9 20.5 10.0 0.3 14.5 43.2 141.4 55.6 65.8 3.5 1.0 3.1 0.4 3.4 1.1 2.8 0.3 111.6 34.1 17.2 2.5 1.5 1.4 6.2 22.4 0.0
2.0.4 Fisheries governance and internation 232.7 0.0 2.2 166.7 63.8 4.1 0.1 0.0 5.7 3.0 1.0 4.1 1.0 11.1 6.5 3.3 0.2 0.2 0.3 1.1 0.0 0.2 1.6 0.0 0.4 1.8 0.1 0.2 0.0 1.0 1.7 15.1 0.0
2.0.5 Life+ 145.4 5.9 2.0 0.1 137.4 23.5 0.6 0.9 7.6 13.7 0.4 1.3 7.0 12.4 11.6 18.0 0.1 0.5 0.5 2.1 1.9 0.1 6.8 3.9 0.9 2.3 0.9 0.2 0.7 4.1 4.2 11.4 0.0
2.0.DAG Decentralised agencies 42.3 2.9 0.0 0.0 39.5 5.0 0.0 0.0 32.4 0.0 0.0 0.0 0.0 2.0 0.0 0.0 0.0 0.0 0.0 0.0 0.0 0.0 0.0 0.0 0.0 0.0 0.0 0.0 0.0 0.0 0.0 0.0 0.0
2.0.OTH Other actions and programmes 2.3 0.2 1.1 0.0 1.1 0.2 0.0 0.0 0.0 0.0 0.0 0.0 0.0 0.0 0.0 0.6 0.0 0.0 0.0 0.0 0.0 0.0 0.0 0.0 0.0 0.3 0.0 0.0 0.0 0.0 0.0 0.0 0.0
3 CITIZENSHIP, FREEDOM, SECURIT 1,310.6 40.1 16.3 15.0 1,239.2 112.0 4.2 12.0 11.0 78.4 7.4 7.0 116.7 56.3 112.3 121.9 7.9 9.2 26.9 11.0 26.8 16.6 49.1 30.9 80.0 26.2 15.9 22.4 11.1 11.5 51.6 202.9 0.33.1 Freedom, security and justice 389.7 9.7 0.3 0.3 379.4 43.1 1.0 3.7 1.3 28.8 3.3 0.3 17.2 33.7 27.9 28.9 2.5 3.0 15.0 1.1 11.2 9.6 31.3 19.8 49.4 17.2 1.7 7.3 2.7 4.9 4.5 9.2 0.0
3.1.1 Solidarity and management of migrati 194.6 3.9 0.1 0.3 190.2 5.9 0.6 3.2 0.9 23.9 3.0 0.1 16.4 27.6 16.8 21.4 2.0 2.2 13.6 0.9 7.9 9.1 5.7 3.4 5.5 3.3 1.5 6.6 2.4 3.9 2.1 0.5 0.0
3.1.2 Security and safeguarding liberties 24.8 0.4 0.0 0.0 24.4 3.9 0.0 0.0 0.0 2.9 0.2 0.0 0.0 1.3 1.2 4.6 0.0 0.1 0.0 0.1 0.8 0.0 2.3 1.1 0.4 0.1 0.2 0.0 0.0 0.4 0.7 4.1 0.0
3.1.3 Fundamental rights and justice 29.5 0.1 0.1 0.0 29.4 9.1 0.4 0.5 0.4 1.8 0.1 0.2 0.6 1.9 1.8 2.2 0.5 0.7 1.4 0.1 1.9 0.4 0.9 0.5 0.5 0.4 0.0 0.6 0.2 0.6 0.0 1.8 0.0
3.1.DAG Decentralised agencies 99.5 4.5 0.0 0.0 95.0 0.0 0.0 0.0 0.0 0.0 0.0 0.0 0.0 0.0 0.0 0.0 0.0 0.0 0.0 0.0 0.0 0.0 22.2 14.4 42.6 13.4 0.0 0.0 0.0 0.0 0.0 2.3 0.0
3.1.OTH Other actions and programmes 41.3 0.8 0.1 0.0 40.4 24.2 0.0 0.0 0.0 0.2 0.0 0.0 0.2 3.0 8.0 0.8 0.0 0.0 0.0 0.0 0.6 0.2 0.1 0.5 0.4 0.0 0.0 0.0 0.0 0.0 1.7 0.4 0.0
3.2 Citizenship 920.9 30.4 16.0 14.8 859.8 68.9 3.2 8.3 9.7 49.7 4.1 6.7 99.5 22.6 84.4 93.0 5.4 6.2 11.9 9.9 15.6 7.0 17.8 11.0 30.6 9.0 14.3 15.1 8.4 6.6 47.2 193.7 0.3
3.2.1 Public health and consumer protecti 64.0 7.5 1.5 3.5 51.5 11.3 0.2 0.2 1.7 4.1 0.3 0.6 1.2 1.8 4.1 3.1 0.5 0.3 0.3 5.1 1.8 0.0 4.3 1.0 0.5 0.4 0.3 0.6 0.1 0.6 0.8 6.1 0.0
3.2.2 Culture 2007-2013 43.2 1.4 0.0 2.0 39.8 4.0 0.1 0.6 0.7 3.8 0.0 0.1 0.8 0.9 5.7 5.0 0.3 0.2 0.2 0.4 0.6 0.0 1.9 2.9 0.6 1.4 0.5 1.5 0.1 0.7 1.0 5.8 0.2
3.2.3 Youth in action 135.3 10.0 0.0 4.3 121.0 7.2 1.8 3.5 2.2 13.9 1.9 2.2 3.8 9.3 14.0 7.9 0.1 1.9 2.0 1.7 2.9 1.2 4.3 3.8 8.0 5.3 3.0 2.4 1.8 2.7 3.5 8.7 0.1
3.2.4 Media 2007 111.8 7.4 0.0 4.7 99.7 13.4 0.5 1.1 3.0 14.9 0.3 1.9 1.4 5.6 27.1 6.5 0.1 0.4 0.2 0.7 0.8 0.0 4.5 1.7 2.6 0.8 0.1 0.3 0.2 1.6 3.4 6.6 0.0
3.2.5 Europe for Citizens 19.3 0.3 0.0 0.1 18.9 3.2 0.1 0.4 0.1 3.4 0.0 0.1 0.2 0.4 4.7 1.7 0.1 0.1 0.1 0.0 1.4 0.0 0.2 0.4 0.7 0.0 0.2 0.1 0.1 0.1 0.1 0.9 0.1
3.2.6 Civil protection Financial instrument 8.5 0.0 0.1 0.2 8.1 0.1 0.0 0.0 1.0 1.8 0.0 0.0 0.3 0.0 0.4 1.1 0.0 0.0 0.0 0.7 0.5 0.0 0.6 0.2 0.0 0.2 0.2 0.0 0.0 0.0 0.2 0.9 0.0
3.2.7 Communication actions 77.2 0.6 0.0 0.0 76.6 25.9 0.6 0.7 1.1 5.0 0.3 1.7 1.4 4.5 15.1 4.5 0.2 0.9 0.8 1.3 1.3 0.4 1.7 0.8 1.2 0.8 0.6 1.0 0.6 1.0 1.3 2.1 0.0
3.2.8 European Solidarity Fund 273.2 0.0 0.0 0.0 273.2 0.0 0.0 0.0 0.0 0.0 0.0 0.0 89.8 0.0 12.8 0.0 0.0 0.0 0.0 0.0 0.0 0.0 0.0 0.0 0.0 0.0 0.0 8.3 0.0 0.0 0.0 162.4 0.0
3.2.DAG Decentralised agencies 102.3 2.8 0.0 0.0 99.5 0.0 0.0 0.0 0.0 0.0 0.0 0.0 0.0 0.0 0.0 62.6 0.0 0.0 0.0 0.0 0.0 0.0 0.0 0.0 0.0 0.0 0.0 0.0 0.0 0.0 36.9 0.0 0.0
3.2.OTH Other actions and programmes 86.1 0.4 14.3 0.0 71.5 3.7 0.1 1.7 0.0 2.8 1.1 0.0 0.8 0.2 0.5 0.6 4.1 2.4 8.2 0.1 6.3 5.3 0.3 0.2 16.9 0.1 9.4 1.0 5.5 0.0 0.1 0.2 0.0
4 THE EU AS A GLOBAL PARTNER 7,310.7 120.1 1,265.1 4,778.5 1,147.0 0.0 201.4 5.9 0.0 0.0 3.4 0.0 0.0 0.0 0.0 0.0 0.0 3.6 34.6 0.0 14.7 0.0 0.0 0.0 123.9 0.0 744.8 3.2 11.5 0.0 0.0 0.0 127.94.0.1 Instrument for Preaccession (IPA) 2,126.7 12.7 292.0 675.0 1,147.0 0.0 201.4 5.9 0.0 0.0 3.4 0.0 0.0 0.0 0.0 0.0 0.0 3.6 34.6 0.0 14.7 0.0 0.0 0.0 123.9 0.0 744.8 3.2 11.5 0.0 0.0 0.0 127.3
Other actions and programmes 5,184.0 107.3 973.1 4,103.5 0.0 0.0 0.0 0.0 0.0 0.0 0.0 0.0 0.0 0.0 0.0 0.0 0.0 0.0 0.0 0.0 0.0 0.0 0.0 0.0 0.0 0.0 0.0 0.0 0.0 0.0 0.0 0.0 0.6
5 ADMINISTRATION 7,292.5 207.4 401.5 190.8 6,492.7 3,880.2 11.0 16.0 47.2 168.2 7.4 42.8 34.6 75.8 304.6 253.1 6.4 7.8 9.6 1,175.3 16.5 7.6 83.0 43.7 28.3 24.7 17.8 8.6 9.4 21.1 23.2 168.7 1.36 COMPENSATIONS 206.6 0.0 0.0 0.0 206.6 0.0 64.0 0.0 0.0 0.0 0.0 0.0 0.0 0.0 0.0 0.0 0.0 0.0 0.0 0.0 0.0 0.0 0.0 0.0 0.0 0.0 142.7 0.0 0.0 0.0 0.0 0.0 0.0TOTAL EXPENDITURE 116,544.5 3,291.3 2,687.4 5,603.9 104,962.0 6,107.6 971.6 2,441.1 1,557.2 11,193.8 368.3 2,051.6 8,514.0 12,093.8 13,721.8 10,306.4 130.1 610.4 1,134.5 1,409.8 2,002.6 87.4 2,267.0 1,777.3 7,639.5 4,116.6 2,666.2 456.4 1,241.8 1,321.3 1,464.0 7,309.9 135.1
VAT-based own resource 19,007.7 465.9 52.5 221.4 322.3 3,336.3 23.7 260.1 394.5 1,655.0 2,991.6 2,907.1 25.5 35.3 53.1 44.8 152.8 9.0 910.6 389.4 562.9 251.5 168.5 60.6 72.8 246.1 453.8 2,940.5 0.0GNI-based own resource 74,477.3 2,041.2 196.2 843.8 1,421.4 15,138.0 89.0 974.9 1,481.8 6,189.0 11,740.9 9,184.9 95.1 131.8 190.2 172.0 591.6 33.6 3,643.0 1,567.3 2,157.6 940.0 741.1 226.5 360.7 1,126.6 2,268.8 10,930.4 0.0UK correction 400.0 303.4 28.6 123.7 214.7 402.1 14.7 141.0 220.8 931.7 1,722.6 1,402.6 14.2 19.3 25.8 27.8 89.3 4.9 81.9 36.0 301.2 140.2 108.1 31.4 49.8 170.4 45.9 -6,252.0 0.0
JHA adjustment for Denmark, Ireland and the United Kingdom 1.2 0.3 0.0 0.1 -0.7 1.9 0.0 -0.5 0.2 0.8 1.5 1.2 0.0 0.0 0.0 0.0 0.1 0.0 0.4 0.2 0.2 0.1 0.1 0.0 0.0 0.1 0.2 -5.1 0.0
TOTAL national contribution 93,886.2 2,810.8 277.4 1,189.1 1,957.6 18,878.3 127.3 1,375.5 2,097.3 8,776.4 16,456.5 13,495.9 134.8 186.5 269.2 244.6 833.7 47.5 4,635.9 1,992.8 3,021.9 1,331.7 1,017.7 318.5 483.2 1,543.3 2,768.7 7,613.8 0.0Traditional own resources (TOR) (75%) 17,282.9 1,820.2 86.3 206.9 343.6 3,337.0 33.9 201.1 230.6 1,189.7 1,568.5 1,648.6 45.0 29.1 60.0 14.8 113.3 12.6 2,032.8 201.6 450.6 134.0 199.9 89.9 111.7 166.7 454.3 2,500.1 0.0Agricultural duties (100%) 1,703.5 24.6 30.8 6.9 37.4 213.6 1.3 1.9 7.0 29.7 179.7 148.1 7.1 2.1 4.4 0.9 4.2 1.9 306.7 3.2 57.9 19.1 54.7 1.5 0.9 6.0 24.1 527.6 0.0Sugar levies (100%) 943.8 56.8 0.5 9.4 28.6 217.5 11.4 0.0 2.0 8.2 306.4 10.5 4.9 1.1 7.2 0.0 8.4 0.3 54.2 18.4 105.7 0.4 1.3 0.0 7.7 1.2 16.8 64.9 0.0Customs duties (100%) 20,396.6 2,345.5 83.7 259.6 392.2 4,018.2 32.4 266.1 298.4 1,548.3 1,605.3 2,039.5 48.0 35.6 68.4 18.8 138.5 14.6 2,349.5 247.2 437.2 159.1 210.5 118.4 140.3 215.1 564.9 2,740.9 0.0
Amounts (25%) retained as TOR collection costs -5,761.0 -606.7 -28.8 -69.0 -114.5 -1,112.3 -11.3 -67.0 -76.9 -396.6 -522.8 -549.5 -15.0 -9.7 -20.0 -4.9 -37.8 -4.2 -677.6 -67.2 -150.2 -44.7 -66.6 -30.0 -37.2 -55.6 -151.4 -833.4 0.0
TOTAL own resources 111,169.1 4,631.0 363.7 1,396.0 2,301.2 22,215.3 161.2 1,576.6 2,327.9 9,966.1 18,025.1 15,144.5 179.9 215.6 329.2 259.4 947.1 60.1 6,668.7 2,194.4 3,472.5 1,465.7 1,217.6 408.5 594.9 1,710.0 3,223.1 10,113.9 0.0Surplus from previous year 1,528.8Surplus from EAGGF-Guarantee 0.0 p.m. amount of the 2007Surplus external aid guarantee fund 125.8 UK correction: 6,877.2Other revenue 8,760.7
TOTAL REVENUE 121,584.4
Gross National Income (GNI), EUR million* 12,900,329.2 361,286.9 34,812.9 150,515.0 243,782.0 2,589,361.0 15,617.4 162,584.0 234,433.7 1,086,251.0 2,038,461.5 1,617,650.9 18,361.6 24,092.8 31,581.5 29,775.1 100,562.0 6,032.6 621,903.0 294,059.0 356,365.8 171,909.8 138,344.0 37,033.8 64,426.8 194,073.0 366,615.6 1,910,436.4 46,737.2
Operating budgetary balance (EUR million) 0.00 -720.6 +669.6 +1,178.0 -543.2 -8,774.3 +227.4 +566.1 +6,279.7 +2,813.2 -3,842.7 -4,101.4 -17.7 +407.0 +842.6 -22.1 +1,111.7 +30.0 -2,678.2 -356.4 +4,441.7 +2,695.1 +1,581.0 +113.8 +725.6 -318.5 -1,463.1 -844.3 +133.9
Operating budgetary balance (% GNI) 0.00% -0.20% +1.92% +0.78% -0.22% -0.34% +1.46% +0.35% +2.68% +0.26% -0.19% -0.25% -0.10% +1.69% +2.67% -0.07% +1.11% +0.50% -0.43% -0.12% +1.25% +1.57% +1.14% +0.31% +1.13% -0.16% -0.40% -0.04% +0.29%
2008 (EUR million)

p.m.
Total earmarked other non-EU EU-27 BE BG CZ DK DE EE IE EL ES FR IT CY LV LT LU HU MT NL AT PL PT RO SI SK FI SE UK HR
1 SUSTAINABLE GROWTH 44,683.5 493.0 1,060.3 704.7 42,425.5 1,184.8 303.6 2,040.6 203.4 4,755.6 541.6 240.6 2,483.6 4,833.3 3,312.4 3,174.7 91.7 485.9 1,279.2 115.3 2,241.0 41.9 688.5 452.2 6,210.7 2,563.3 965.2 393.8 633.5 399.5 469.0 2,320.7 7.51.1 Competitiveness for growth and em 10,750.6 492.7 1,024.7 704.4 8,528.8 814.1 36.6 65.7 146.9 1,444.2 24.3 119.3 224.5 659.1 1,392.2 761.5 17.6 16.1 102.5 86.1 66.6 6.5 446.2 210.9 128.6 129.7 47.1 25.5 48.7 205.6 256.7 1,045.8 7.5
1.1.1 Seventh Research framework programme ( 6,675.4 250.7 777.0 431.5 5,216.2 550.8 13.8 32.3 116.8 877.5 11.0 68.9 145.9 433.4 688.9 483.6 9.3 2.6 7.7 30.9 36.6 1.9 354.8 132.1 47.9 44.1 15.1 14.5 6.6 94.0 177.4 817.7 7.0
1.1.2 Decommissioning (Direct research) 19.1 0.0 0.0 0.0 19.1 0.8 0.0 1.6 0.0 2.9 0.0 0.0 0.0 1.9 0.2 10.6 0.0 0.0 0.0 0.0 0.0 0.0 0.0 0.0 0.0 0.0 0.0 0.0 0.0 0.0 0.0 1.1 0.0
1.1.3 Ten 852.1 7.1 0.2 228.1 616.8 24.6 0.6 5.8 3.8 78.0 4.4 11.5 17.8 93.6 104.7 90.7 0.0 2.8 0.0 3.8 4.1 0.4 19.4 39.4 1.9 9.3 0.1 0.4 0.5 13.2 51.2 34.5 0.0
1.1.4 Galileo 722.9 0.0 18.6 0.6 703.7 0.4 0.0 0.0 0.0 264.8 0.0 0.0 0.0 1.4 415.7 20.1 0.0 0.0 0.0 0.0 0.0 0.0 0.2 0.0 0.0 0.1 0.0 0.0 0.0 0.0 0.0 1.0 0.0
1.1.5 Marco Polo 31.0 0.8 0.1 0.4 29.7 3.0 1.0 0.0 0.0 4.8 0.0 0.0 0.0 1.4 0.9 12.5 0.0 0.0 0.0 0.1 0.4 0.0 2.6 2.0 0.0 0.5 0.0 0.1 0.0 0.0 0.0 0.5 0.0
1.1.6 Lifelong Learning 1,149.1 115.8 21.7 20.9 990.7 41.5 12.1 20.7 17.6 126.5 7.3 10.2 24.0 88.8 118.3 113.1 5.4 9.5 14.4 4.4 17.3 2.7 40.8 22.0 74.9 29.3 29.8 7.3 12.7 26.1 18.6 95.3 0.1
1.1.7 Competitiveness and innovation framew 309.6 6.5 165.0 4.2 134.0 35.5 0.4 0.7 2.7 17.6 0.5 1.5 3.4 9.1 8.6 10.6 0.6 0.3 0.3 5.9 1.8 0.1 8.5 6.2 0.2 2.3 0.6 0.6 0.2 2.6 2.2 11.1 0.2
1.1.71 CIP Entrepreneurship and innovation 189.6 4.9 119.7 3.6 61.5 17.5 0.4 0.1 0.8 6.8 0.4 0.9 1.8 6.9 2.8 5.0 0.4 0.1 0.2 0.5 1.6 0.0 4.7 2.9 0.1 0.4 0.4 0.3 0.0 0.6 1.1 4.7 0.1
1.1.72 CIP ICT policy support 54.4 0.1 44.7 0.1 9.6 1.9 0.0 0.3 0.7 1.1 0.0 0.0 0.3 0.8 0.5 0.3 0.1 0.1 0.1 0.4 0.2 0.0 0.2 0.5 0.0 0.2 0.0 0.2 0.1 0.1 0.2 1.4 0.0
1.1.73 CIP Intelligent energy 65.5 1.5 0.6 0.5 62.9 16.1 0.0 0.3 1.2 9.7 0.0 0.6 1.3 1.4 5.2 5.3 0.1 0.1 0.0 5.1 0.1 0.0 3.5 2.9 0.1 1.7 0.1 0.2 0.1 1.9 0.9 5.0 0.2
1.1.8 Social policy agenda 141.6 2.3 0.5 4.4 134.4 57.9 1.4 2.4 1.0 11.4 0.3 0.9 0.8 3.0 10.5 8.1 0.5 0.1 0.5 2.3 2.2 0.4 7.7 4.6 1.6 1.0 0.5 1.2 0.7 1.2 3.3 9.2 0.2
1.1.9 Customs 2013 and Fiscalis 2013 62.6 0.4 14.5 4.5 43.2 23.3 0.3 0.4 0.6 1.0 0.4 0.2 0.5 0.4 0.5 0.5 0.3 0.2 0.4 9.1 0.5 0.2 0.4 0.5 0.6 0.3 0.4 0.4 0.3 0.6 0.7 0.4 0.1
1.1.10 Nuclear decommissioning 110.0 0.0 0.0 0.0 110.0 0.0 6.2 0.0 0.0 0.0 0.0 0.0 0.0 0.0 0.0 0.0 0.0 0.0 78.5 0.0 0.0 0.0 0.0 0.0 0.0 0.0 0.0 0.0 25.2 0.0 0.0 0.0 0.0
1.1.11 European Global Adjustment Funds 12.4 0.0 0.0 0.0 12.4 0.0 0.0 0.0 0.0 5.6 0.0 0.0 0.0 6.0 0.0 0.0 0.0 0.0 0.0 0.0 0.0 0.0 0.0 0.0 0.0 0.8 0.0 0.0 0.0 0.0 0.0 0.0 0.0
1.1.12 Energy projects to aid economic recover 0.2 0.0 0.0 0.0 0.2 0.1 0.0 0.0 0.0 0.0 0.0 0.0 0.0 0.0 0.0 0.0 0.0 0.0 0.0 0.0 0.0 0.0 0.0 0.0 0.0 0.0 0.0 0.0 0.0 0.0 0.0 0.0 0.0
1.1.DAG Decentralised agencies 285.4 28.3 0.3 0.0 256.8 5.2 0.0 0.0 0.0 31.5 0.0 19.5 23.5 12.5 16.1 0.0 0.0 0.0 0.0 0.0 0.0 0.0 0.0 0.0 0.0 39.6 0.0 0.0 0.0 66.1 0.0 42.9 0.0
1.1.OTH Other actions and programmes 379.2 80.9 26.9 9.8 261.6 70.8 0.9 1.8 4.4 22.7 0.5 6.5 8.6 7.6 27.8 11.7 1.6 0.7 0.7 29.8 3.6 0.8 11.6 3.9 1.5 2.4 0.6 1.1 2.6 1.8 3.3 32.2 0.0
1.2 Cohesion for growth and employmen 33,932.9 0.3 35.6 0.3 33,896.7 370.8 267.0 1,974.9 56.5 3,311.4 517.3 121.3 2,259.2 4,174.2 1,920.2 2,413.2 74.1 469.7 1,176.8 29.1 2,174.4 35.3 242.3 241.2 6,082.0 2,433.6 918.1 368.3 584.8 193.9 212.2 1,274.9 0.0
1.2.1 Structural funds 26,848.5 0.3 31.6 0.3 26,816.3 368.0 175.6 1,227.9 56.4 3,311.4 389.7 98.4 1,848.8 3,373.5 1,919.5 2,412.7 51.5 331.4 834.3 26.4 1,316.0 24.0 242.0 241.2 3,706.1 1,976.2 615.4 203.1 385.9 193.9 212.2 1,274.7 0.0
1.2.11 Convergence objective 19,886.8 0.0 0.0 0.0 19,886.8 98.0 175.6 1,197.5 0.0 2,263.7 387.6 0.0 1,732.9 2,598.3 444.6 1,690.0 0.0 328.5 822.5 0.0 1,059.6 23.9 0.0 21.4 3,691.4 1,802.6 606.5 197.0 350.4 0.0 8.6 386.5 0.0
1.2.12 Regional competitiveness and employmen 6,176.3 0.0 0.0 0.0 6,176.3 227.2 0.0 20.2 42.3 984.8 0.0 91.9 56.7 739.2 1,373.4 647.0 51.4 0.0 0.0 5.0 230.5 0.0 235.2 162.8 0.0 70.3 0.0 1.5 29.7 184.2 184.5 838.3 0.0
1.2.13 European territorial cooperation objectiv 700.0 0.0 29.7 0.0 670.2 19.9 0.0 10.1 13.8 58.0 2.0 5.6 58.2 33.9 96.2 69.2 0.0 3.0 11.6 1.6 25.6 0.0 3.3 54.7 14.6 102.3 8.7 4.5 5.8 8.1 16.2 43.1 0.0
1.2.14 Technical assistance 85.4 0.3 1.8 0.3 83.0 22.9 0.0 0.1 0.3 4.8 0.0 0.9 1.0 2.2 5.3 6.5 0.1 0.0 0.1 19.8 0.2 0.0 3.5 2.4 0.2 0.9 0.3 0.1 0.0 1.6 2.9 6.9 0.0
1.2.2 Cohesion Fund 7,083.8 0.0 4.0 0.0 7,079.8 2.7 91.3 746.9 0.1 0.0 127.6 22.9 410.4 800.6 0.4 0.5 22.6 138.3 342.5 2.7 858.5 11.4 0.2 0.0 2,375.9 457.4 302.7 165.2 198.8 0.0 0.0 0.2 0.0
1.2.DAG Decentralised agencies 0.0 0.0 0.0 0.0 0.0 0.0 0.0 0.0 0.0 0.0 0.0 0.0 0.0 0.0 0.0 0.0 0.0 0.0 0.0 0.0 0.0 0.0 0.0 0.0 0.0 0.0 0.0 0.0 0.0 0.0 0.0 0.0 0.0
1.2.OTH Other actions and programmes 0.6 0.0 0.0 0.0 0.5 0.0 0.0 0.0 0.0 0.0 0.0 0.0 0.0 0.0 0.4 0.0 0.0 0.0 0.0 0.0 0.0 0.0 0.1 0.0 0.0 0.0 0.0 0.0 0.0 0.0 0.0 0.0 0.0
2 PRESERVATION AND MANAGEMENT O 55,877.3 5,077.3 25.4 148.5 50,626.0 310.2 361.4 867.0 1,062.9 6,679.7 156.6 1,081.1 2,875.6 6,611.7 9,749.4 5,287.1 58.7 206.2 468.5 54.5 1,279.9 6.9 1,013.0 1,307.7 2,858.7 1,102.7 1,167.9 190.8 513.0 766.7 875.7 3,712.3 0.02.0.1 Market related expenditure and direct ai 46,349.2 5,066.5 3.8 1.6 41,277.3 210.2 227.8 499.3 955.3 5,702.3 55.3 740.7 2,583.7 5,950.7 8,908.8 4,640.0 39.7 80.0 214.1 38.9 747.6 2.7 945.9 749.5 1,734.2 728.9 600.4 74.9 220.4 561.9 744.4 3,319.9 0.0
2.0.11 Agriculture markets 46,093.3 5,061.8 0.4 0.2 41,030.9 198.8 227.2 496.2 952.3 5,674.1 53.1 733.1 2,581.9 5,897.7 8,857.0 4,624.6 38.0 79.4 213.1 36.6 744.5 2.6 935.1 745.3 1,721.7 716.9 599.3 73.9 218.9 561.1 741.3 3,307.1 0.0
Direct Aid 39,113.9 1,335.2 0.0 0.0 37,778.7 109.5 210.3 473.7 908.5 5,536.3 51.4 692.5 2,490.0 5,114.9 8,166.9 3,939.2 24.6 76.3 195.8 34.5 682.6 1.7 819.7 712.4 1,562.2 601.8 533.4 66.8 200.6 545.3 713.2 3,314.5 0.0
Export refunds 649.5 162.5 0.0 0.0 487.1 47.4 2.5 3.9 29.1 51.8 0.1 12.9 0.9 18.1 133.1 23.2 0.3 0.1 7.0 0.0 6.9 0.0 45.1 16.7 32.6 6.3 0.3 0.5 0.4 5.8 14.7 27.1 0.0
Storage 173.4 83.7 0.0 0.0 89.7 3.6 -1.8 11.6 2.5 4.6 0.1 5.9 2.6 22.2 10.7 26.1 0.1 0.0 0.0 0.0 2.1 -0.2 6.1 0.2 -15.4 3.2 -6.5 -0.3 12.4 0.5 -1.3 0.8 0.0
Other 6,156.4 3,480.4 0.4 0.2 2,675.4 38.2 16.2 7.0 12.2 81.5 1.6 21.8 88.3 742.4 546.3 636.1 13.0 3.0 10.2 2.1 52.9 1.1 64.2 16.0 142.4 105.6 72.1 6.9 5.5 9.5 14.7 -35.3 0.0
2.0.12 Fisheries market 24.2 0.0 0.0 0.0 24.2 0.1 0.0 0.0 0.2 0.0 0.7 0.6 0.0 8.7 8.4 0.0 0.0 0.0 0.0 0.1 0.0 0.0 0.1 0.0 0.1 5.0 0.0 0.0 0.0 0.0 0.2 0.0 0.0
2.0.13 Animal and plant health 231.7 4.8 3.4 1.3 222.3 11.4 0.5 3.1 2.8 28.1 1.4 7.0 1.8 44.3 43.5 15.4 1.7 0.6 1.0 2.2 3.2 0.1 10.7 4.2 12.4 7.0 1.0 0.9 1.5 0.8 2.9 12.8 0.0
2.0.2 Rural development 8,739.7 0.2 0.0 0.0 8,739.5 61.0 127.1 366.7 53.9 930.7 95.1 329.9 257.7 621.3 795.7 582.3 16.2 104.5 247.5 13.7 525.7 3.4 45.0 548.4 1,043.8 344.9 565.9 112.8 289.3 191.4 106.8 359.0 0.0
2.0.3 European fisheries fund 290.9 0.0 0.4 0.0 290.6 6.0 5.6 0.0 9.4 18.5 4.7 5.5 24.7 2.2 24.1 21.9 0.0 20.4 5.8 0.3 2.6 0.6 8.3 1.1 77.4 24.5 0.0 1.6 0.3 5.7 6.6 13.0 0.0
2.0.4 Fisheries governance and international 221.9 0.0 14.6 146.3 60.9 4.8 0.2 0.0 3.9 2.6 0.5 3.5 1.1 9.5 6.0 5.2 1.2 0.2 0.2 0.6 0.0 0.2 4.7 0.0 0.6 1.4 0.1 0.1 0.0 1.0 8.2 5.2 0.0
2.0.5 Life+ 216.0 3.6 1.3 0.6 210.5 26.6 0.8 0.9 5.1 25.2 0.8 1.5 8.3 26.5 12.8 35.4 1.7 1.1 0.9 0.6 3.9 0.1 8.1 8.7 2.6 3.1 1.4 1.5 3.1 6.3 9.0 14.6 0.0
2.0.DAG Decentralised agencies 49.1 7.0 5.2 0.0 36.9 0.0 0.0 0.0 35.4 0.0 0.0 0.0 0.0 1.5 0.0 0.0 0.0 0.0 0.0 0.0 0.0 0.0 0.0 0.0 0.0 0.0 0.0 0.0 0.0 0.0 0.0 0.0 0.0
2.0.OTH Other actions and programmes 10.4 0.0 0.2 0.0 10.3 1.6 0.0 0.1 0.0 0.4 0.3 0.0 0.0 0.0 2.0 2.3 0.0 0.0 0.0 0.5 0.0 0.0 1.1 0.1 0.0 0.0 0.0 0.0 0.0 0.5 0.7 0.7 0.0
3 CITIZENSHIP, FREEDOM, SECURITY A 1,993.0 53.2 15.3 16.6 1,907.8 139.0 16.1 16.4 12.9 93.9 10.8 12.7 36.8 91.7 241.5 648.1 15.3 10.2 28.4 11.0 23.1 15.4 61.8 36.6 107.7 31.6 36.5 11.6 8.5 19.8 82.3 88.0 0.73.1 Freedom, security and justice 684.5 17.6 1.1 0.7 665.1 63.9 2.7 6.2 2.1 44.4 5.9 5.1 26.4 68.5 46.6 58.7 5.2 5.7 21.1 1.7 9.1 12.1 43.6 25.5 83.1 23.6 1.4 6.5 4.3 11.1 24.1 56.4 0.0
3.1.1 Solidarity and management of migration 405.5 2.7 0.1 0.3 402.5 15.8 1.8 4.7 0.6 36.4 5.2 3.4 25.6 57.8 34.4 44.2 4.8 4.3 20.7 1.4 6.3 10.6 11.8 10.5 13.8 7.6 1.2 6.2 3.2 9.3 19.7 41.0 0.0
3.1.2 Security and safeguarding liberties 44.7 0.7 0.9 0.0 43.1 2.7 0.2 0.9 0.6 4.0 0.3 1.7 0.4 3.6 1.3 8.3 0.0 1.1 0.1 0.3 1.4 1.1 3.2 0.2 0.5 1.9 0.1 0.1 0.6 0.7 2.7 4.9 0.0
3.1.3 Fundamental rights and justice 49.3 0.4 0.2 0.4 48.4 15.2 0.7 0.6 1.0 3.9 0.5 0.0 0.3 4.6 1.4 6.0 0.3 0.3 0.4 0.0 1.4 0.3 2.5 2.0 0.4 0.3 0.2 0.1 0.5 1.2 0.8 3.6 0.0
3.1.DAG Decentralised agencies 138.3 11.6 0.0 0.0 126.7 0.0 0.0 0.0 0.0 0.0 0.0 0.0 0.0 0.0 0.0 0.0 0.0 0.0 0.0 0.0 0.0 0.0 25.9 12.4 68.1 13.8 0.0 0.0 0.0 0.0 0.0 6.4 0.0
3.1.OTH Other actions and programmes 46.7 2.2 0.0 0.0 44.6 30.2 0.0 0.0 0.0 0.0 0.0 0.0 0.2 2.5 9.5 0.1 0.0 0.0 0.0 0.0 0.0 0.1 0.1 0.3 0.2 0.0 0.0 0.0 0.0 0.0 0.9 0.4 0.0
3.2 Citizenship 1,308.5 35.6 14.1 16.0 1,242.7 75.2 13.5 10.2 10.7 49.5 4.8 7.5 10.4 23.2 194.9 589.3 10.1 4.5 7.3 9.3 14.0 3.3 18.3 11.1 24.7 8.0 35.1 5.1 4.3 8.7 58.2 31.6 0.7
3.2.1 Public health and consumer protection 80.4 0.9 1.0 2.6 76.0 17.1 0.4 0.6 2.6 5.8 0.4 1.0 1.7 3.5 6.4 4.6 0.5 0.5 0.9 6.2 2.5 0.2 6.0 1.3 0.8 0.7 0.3 0.9 0.3 1.7 1.7 7.5 0.0
3.2.2 Culture 2007-2013 50.1 2.2 0.0 4.0 43.9 4.8 0.8 1.3 0.5 4.7 0.4 0.2 0.8 0.6 6.6 4.6 0.2 0.1 1.3 0.2 2.6 0.0 1.8 4.2 1.0 0.9 0.2 0.5 0.1 0.5 1.0 4.1 0.2
3.2.3 Youth in action 139.8 15.8 0.2 4.6 119.3 7.7 2.4 2.4 2.7 13.0 2.1 2.0 3.3 8.6 13.5 7.6 0.0 1.4 2.0 1.4 2.8 1.6 4.0 2.8 8.5 2.9 6.5 2.0 1.9 2.4 2.9 10.8 0.0
3.2.4 Media 2007 110.9 11.2 0.0 4.1 95.5 14.5 0.5 1.2 2.8 13.8 0.3 1.2 1.7 6.8 23.7 6.6 0.1 0.4 0.4 0.6 0.8 0.0 3.6 1.4 2.6 1.1 0.5 0.4 0.2 1.6 3.2 5.4 0.2
3.2.5 Europe for Citizens 26.1 0.2 0.0 0.2 25.6 3.9 0.2 0.6 0.1 3.8 0.1 0.2 0.3 0.9 5.4 3.2 0.1 0.2 0.1 0.1 2.1 0.1 0.1 0.5 1.1 0.1 0.6 0.1 0.3 0.1 0.3 0.9 0.2
3.2.6 Civil protection Financial instrument 10.0 0.3 0.4 0.3 9.0 0.5 0.0 0.0 0.9 1.8 0.5 0.0 1.1 0.2 0.5 1.5 0.0 0.1 0.0 0.0 0.0 0.0 0.3 0.3 0.0 0.2 0.2 0.0 0.0 0.0 0.4 0.6 0.0
3.2.7 Communication actions 89.6 0.5 0.0 0.0 89.1 23.8 0.6 0.9 1.0 5.3 0.5 2.5 1.2 2.3 27.0 4.3 0.3 0.9 0.7 0.9 2.2 0.5 2.0 0.7 2.0 2.1 1.2 0.9 0.7 1.2 1.5 2.0 0.0
3.2.8 European Solidarity Fund 622.5 0.0 0.0 0.0 622.5 0.0 0.0 0.0 0.0 0.0 0.0 0.0 0.0 0.0 109.4 493.8 7.6 0.0 0.0 0.0 0.0 0.0 0.0 0.0 0.0 0.0 11.8 0.0 0.0 0.0 0.0 0.0 0.0
3.2.DAG Decentralised agencies 112.6 3.9 0.0 0.0 108.7 0.0 0.0 0.0 0.0 0.0 0.0 0.0 0.0 0.0 0.0 61.6 0.0 0.0 0.0 0.0 0.0 0.0 0.0 0.0 0.0 0.0 0.0 0.0 0.0 0.0 47.1 0.0 0.0
3.2.OTH Other actions and programmes 66.5 0.6 12.5 0.1 53.2 2.8 8.6 3.0 0.2 1.3 0.5 0.3 0.3 0.3 2.5 1.4 1.4 0.8 2.0 0.0 1.1 0.8 0.4 0.0 8.6 0.0 13.9 0.4 0.6 1.2 0.2 0.3 0.0
4 THE EU AS A GLOBAL PARTNER 7,982.9 195.1 1,550.3 5,293.4 944.1 0.0 221.2 8.0 0.0 0.0 1.0 0.0 0.0 0.0 0.0 0.0 0.0 0.0 4.4 0.0 6.4 0.0 0.0 0.0 46.6 0.0 618.9 11.1 26.6 0.0 0.0 0.0 97.04.0.1 Instrument for Preaccession (IPA) 2,203.2 46.3 189.2 1,023.5 944.1 0.0 221.2 8.0 0.0 0.0 1.0 0.0 0.0 0.0 0.0 0.0 0.0 0.0 4.4 0.0 6.4 0.0 0.0 0.0 46.6 0.0 618.9 11.1 26.6 0.0 0.0 0.0 95.0
Other actions and programmes 5,779.8 148.8 1,361.1 4,269.9 0.0 0.0 0.0 0.0 0.0 0.0 0.0 0.0 0.0 0.0 0.0 0.0 0.0 0.0 0.0 0.0 0.0 0.0 0.0 0.0 0.0 0.0 0.0 0.0 0.0 0.0 0.0 0.0 2.1
5 ADMINISTRATION 7,615.3 230.7 482.0 193.9 6,708.7 3,995.3 11.6 16.6 48.8 184.0 6.5 43.6 38.0 77.6 328.6 262.5 6.6 8.0 9.8 1,272.7 18.3 7.3 86.2 20.0 29.3 26.5 18.3 9.0 10.8 21.8 25.0 126.1 1.56 COMPENSATIONS 209.1 0.0 0.0 0.0 209.1 0.0 64.7 0.0 0.0 0.0 0.0 0.0 0.0 0.0 0.0 0.0 0.0 0.0 0.0 0.0 0.0 0.0 0.0 0.0 0.0 0.0 144.4 0.0 0.0 0.0 0.0 0.0 0.0TOTAL EXPENDITURE 118,361.0 6,049.4 3,133.3 6,357.2 102,821.2 5,629.3 978.6 2,948.6 1,328.0 11,713.3 716.4 1,378.0 5,434.0 11,614.2 13,631.9 9,372.3 172.3 710.3 1,790.3 1,453.6 3,568.6 71.5 1,849.5 1,816.6 9,252.9 3,724.1 2,951.2 616.3 1,192.4 1,207.8 1,451.9 6,247.1 106.8
VAT-based own resource 12,796.2 349.4 51.0 170.0 274.9 1,705.0 19.9 201.4 328.3 1,527.9 2,545.6 1,378.6 24.8 22.5 41.8 41.1 113.2 8.2 264.2 270.7 427.6 227.7 156.6 53.9 77.0 237.2 152.9 2,124.7 0.0GNI-based own resource 81,982.5 2,408.1 240.8 860.3 1,600.2 17,104.4 93.9 949.8 1,577.8 7,208.3 13,623.0 10,390.3 117.6 147.4 202.5 194.4 588.9 38.8 3,990.1 1,871.3 2,031.0 1,077.5 901.8 256.0 462.9 1,203.5 2,044.4 10,797.7 0.0UK correction -321.1 251.1 25.1 95.4 172.8 311.7 10.9 106.6 184.1 762.2 1,421.2 1,082.8 12.5 14.0 18.8 21.5 56.5 4.2 92.9 27.7 208.7 113.1 89.7 27.2 46.3 134.6 45.1 -5,657.7 0.0Adjustment re-Implementation of the 2007 Own Resources Decision -88.7 204.6 17.4 71.9 143.8 -1,736.4 8.7 91.6 126.2 592.5 1,096.2 949.4 8.8 11.7 16.7 16.9 51.1 3.0 -2,108.7 -31.0 146.1 89.1 61.0 19.0 36.9 110.4 -609.4 523.7 0.0Lump Sum Reduction Granted for NL & SE 4.1 24.1 2.4 9.2 16.9 171.1 1.0 10.0 16.9 73.7 137.7 106.5 1.2 1.4 2.0 2.0 6.1 0.4 -624.4 19.4 20.1 11.1 8.7 2.5 4.7 12.8 -148.7 115.3 0.0FSJ adjustment for Denmark, Ireland and the United Kingdom 5.7 1.1 0.1 0.4 -0.5 8.3 0.0 -2.3 0.7 3.4 6.4 5.0 0.1 0.1 0.1 0.1 0.3 0.0 1.9 0.9 1.0 0.5 0.4 0.1 0.2 0.6 1.0 -24.2 0.0
TOTAL national contribution 94,378.7 3,238.5 336.7 1,207.3 2,208.1 17,564.0 134.5 1,357.0 2,234.0 10,168.1 18,830.0 13,912.7 165.0 197.2 282.0 276.0 816.0 54.6 1,615.9 2,159.0 2,834.5 1,519.1 1,218.0 358.8 628.0 1,699.0 1,485.3 7,879.6 0.0Traditional own resources (TOR) (75%) 14,528.2 1,423.0 52.9 166.8 282.8 2,945.9 24.0 176.6 190.8 1,001.8 1,263.0 1,505.4 34.5 18.5 40.3 10.8 92.9 9.6 1,721.1 156.9 299.5 117.6 124.3 68.8 83.6 114.9 370.1 2,232.0 0.0Agricultural duties (100%) 0.0 0.0 0.0 0.0 0.0 0.0 0.0 0.0 0.0 0.0 0.0 0.0 0.0 0.0 0.0 0.0 0.0 0.0 0.0 0.0 0.0 0.0 0.0 0.0 0.0 0.0 0.0 0.0 0.0Sugar levies (100%) 175.5 8.8 0.5 3.9 4.5 36.9 11.4 0.0 1.9 7.6 41.2 6.3 5.0 1.1 1.1 0.0 2.1 0.3 9.7 4.2 12.4 0.1 1.2 0.0 2.8 1.0 0.0 11.5 0.0Customs duties (100%) 19,195.5 1,888.5 70.0 218.6 372.6 3,891.0 20.6 235.5 252.5 1,328.0 1,642.7 2,000.8 41.0 23.5 52.7 14.3 121.8 12.6 2,285.1 204.9 386.9 156.8 164.5 91.8 108.6 152.2 493.5 2,964.6 0.0
Amounts (25%) retained as TOR collection costs -4,842.7 -474.3 -17.6 -55.6 -94.3 -982.0 -8.0 -58.9 -63.6 -333.9 -421.0 -501.8 -11.5 -6.2 -13.4 -3.6 -31.0 -3.2 -573.7 -52.3 -99.8 -39.2 -41.4 -22.9 -27.9 -38.3 -123.4 -744.0 0.0
TOTAL own resources 108,906.9 4,661.4 389.6 1,374.1 2,490.9 20,509.9 158.5 1,533.6 2,424.8 11,169.9 20,093.0 15,418.1 199.4 215.6 322.3 286.7 908.9 64.3 3,337.0 2,315.8 3,133.9 1,636.7 1,342.3 427.7 711.6 1,813.9 1,855.4 10,111.6 0.0Surplus from previous year 1,796.2Surplus from EAGGF-Guarantee 0.0 p.m. amount of the 2008Surplus external aid guarantee fund 0.0 UK correction: 5,223.6Other revenue 6,922.5
TOTAL REVENUE 117,625.6
Gross National Income (GNI), EUR million* 12,202,481.3 347,851.1 35,227.2 137,912.7 232,519.9 2,515,769.0 13,706.5 141,107.0 231,881.1 1,059,241.0 1,973,646.9 1,571,979.2 17,512.0 20,141.6 27,437.6 23,703.9 89,114.9 5,805.4 613,573.0 286,116.0 303,921.9 169,024.2 118,802.1 35,672.7 63,413.1 183,350.0 317,628.6 1,666,422.8 43,539.1
Operating budgetary balance (EUR million) 0.00 -1,663.9 +624.2 +1,702.5 -969.5 -6,357.5 +573.0 -47.5 +3,121.0 +1,181.7 -5,872.7 -5,058.5 -2.3 +501.5 +1,493.3 -100.2 +2,719.4 +8.6 +117.7 -402.1 +6,337.1 +2,150.7 +1,692.5 +241.9 +542.1 -544.2 -85.6 -1,903.3 +105.3
Operating budgetary balance (% GNI) 0.00% -0.48% +1.77% +1.23% -0.42% -0.25% +4.18% -0.03% +1.35% +0.11% -0.30% -0.32% -0.01% +2.49% +5.44% -0.42% +3.05% +0.15% +0.02% -0.14% +2.09% +1.27% +1.42% +0.68% +0.85% -0.30% -0.03% -0.11% +0.24%
2009 (EUR million)

p.m.
Total earmarked other non-EU EU-27 BE BG CZ DK DE EE IE EL ES FR IT CY LV LT LU HU MT NL AT PL PT RO SI SK FI SE UK HR
1 SUSTAINABLE GROWTH 48,828.0 533.2 992.0 811.2 46,491.7 1,012.2 468.9 2,320.5 311.3 4,607.8 606.6 280.4 2,748.6 6,010.5 2,789.3 3,335.7 91.3 539.6 1,026.3 137.7 2,172.2 72.1 791.4 403.1 7,965.9 3,061.5 566.8 522.0 1,208.0 362.7 478.4 2,600.9 4.01.1 Competitiveness for growth and em 11,648.9 533.0 924.9 810.8 9,380.2 810.6 71.7 88.2 244.5 1,604.3 40.9 182.0 201.4 885.2 1,314.8 768.2 24.3 30.7 123.4 101.5 86.0 6.2 558.9 240.9 184.9 177.6 54.6 46.3 111.8 209.3 280.9 931.1 3.6
1.1.1 Seventh Research framework programme ( 6,919.9 328.7 719.6 498.5 5,373.1 473.4 7.7 25.6 111.1 909.5 11.1 72.0 137.6 572.2 762.5 521.2 15.4 3.1 4.2 28.3 35.5 3.7 379.9 136.6 53.5 51.8 17.1 17.0 5.7 109.9 184.6 722.7 2.6
1.1.2 Decommissioning (Direct research) 21.9 0.0 0.0 1.8 20.1 1.5 0.0 1.3 0.0 5.5 0.0 0.0 0.0 1.7 0.8 8.4 0.0 0.0 0.0 0.0 0.0 0.0 0.0 0.0 0.0 0.0 0.0 0.0 0.0 0.0 0.0 0.8 0.0
1.1.3 Ten 869.5 12.8 50.4 266.0 540.2 36.3 0.0 20.8 9.0 92.1 4.3 4.5 2.2 43.6 78.9 32.1 1.2 0.3 2.3 1.5 4.3 0.1 25.9 56.9 9.1 25.0 0.7 2.7 6.3 28.3 43.5 8.4 0.0
1.1.4 Galileo 453.1 0.0 0.6 0.6 451.8 0.5 0.0 0.0 0.0 182.4 0.0 0.0 0.0 1.5 216.0 27.1 0.0 0.0 0.0 0.0 0.0 0.0 0.2 0.0 0.0 0.1 0.0 0.0 0.0 0.0 0.0 23.9 0.0
1.1.5 Marco Polo 32.1 1.1 0.1 0.0 30.8 6.2 0.2 0.0 0.0 6.5 0.0 0.0 0.0 0.9 5.1 2.8 0.0 1.0 0.0 0.0 2.2 0.0 4.1 0.5 0.0 0.0 0.0 0.0 0.0 0.0 1.4 0.0 0.0
1.1.6 Lifelong Learning 1,187.9 87.0 16.0 19.0 1,066.0 51.8 15.2 22.4 22.2 132.7 7.6 14.7 23.8 102.0 123.1 111.5 5.3 11.5 15.0 3.3 29.6 0.4 52.3 22.7 77.9 29.7 32.4 10.3 13.5 23.1 32.7 79.4 0.1
1.1.7 Competitiveness and innovation framew 243.3 5.3 101.2 2.7 134.2 27.5 0.1 1.8 3.1 18.7 0.4 0.7 3.5 9.6 13.0 13.5 0.6 0.4 0.1 0.6 1.8 0.2 10.4 5.5 1.7 2.9 0.9 0.9 0.6 1.5 3.8 10.4 0.6
1.1.71 CIP Entrepreneurship and innovation 76.7 1.9 10.5 1.7 62.6 12.5 0.1 0.7 2.0 7.5 0.3 0.3 1.8 5.7 7.2 7.3 0.6 0.1 0.1 0.4 1.6 0.1 1.8 1.1 1.1 0.8 0.8 0.4 0.4 0.4 2.3 5.1 0.1
1.1.72 CIP ICT policy support 98.3 1.0 89.8 0.2 7.2 1.3 0.0 0.0 0.3 0.6 0.1 0.0 0.4 0.6 0.2 0.2 0.0 0.1 0.1 0.2 0.1 0.1 0.9 0.1 0.1 0.1 0.1 0.1 0.1 0.1 0.7 0.7 0.0
1.1.73 CIP Intelligent energy 68.4 2.3 0.9 0.8 64.3 13.8 0.0 1.0 0.7 10.7 0.1 0.3 1.4 3.2 5.6 6.1 0.0 0.3 0.0 0.0 0.0 0.0 7.7 4.3 0.5 1.9 0.0 0.4 0.0 1.0 0.9 4.5 0.5
1.1.8 Social policy agenda 171.3 2.8 0.0 3.4 165.0 63.0 1.1 1.3 1.3 11.7 0.4 0.6 2.5 4.7 10.8 8.6 0.6 0.1 0.9 23.5 3.1 0.7 7.4 4.1 1.5 1.2 0.7 1.5 0.6 0.9 1.8 10.3 0.2
1.1.9 Customs 2013 and Fiscalis 2013 65.8 0.9 8.4 11.0 45.5 18.7 0.4 0.5 0.6 1.0 0.4 0.4 0.4 0.4 0.6 0.6 0.4 0.4 0.6 13.8 0.6 0.4 0.7 0.4 0.4 0.7 0.4 0.4 0.5 0.6 0.7 0.5 0.0
1.1.10 Nuclear decommissioning 219.1 0.0 0.0 0.0 219.1 0.0 44.5 0.0 0.0 0.0 0.0 0.0 0.0 0.0 0.0 0.0 0.0 0.0 91.1 0.0 0.0 0.0 0.0 0.0 0.0 0.0 0.0 0.0 83.6 0.0 0.0 0.0 0.0
1.1.11 European Global Adjustment Funds 104.5 0.0 0.0 0.0 104.5 9.4 0.0 0.0 17.6 6.2 0.0 24.8 0.0 13.1 0.0 0.0 0.0 0.0 2.6 0.0 0.0 0.0 12.7 5.7 0.0 2.4 0.0 0.0 0.0 0.0 9.8 0.0 0.0
1.1.12 Energy projects to aid economic recover 701.1 0.0 0.2 0.0 700.9 33.6 1.3 13.3 75.0 181.9 15.0 33.0 0.0 114.4 49.8 31.0 0.0 13.2 0.0 0.0 6.0 0.0 45.0 4.0 38.9 17.1 1.4 12.0 0.0 15.0 0.0 0.0 0.0
1.1.DAG Decentralised agencies 261.6 28.9 0.7 0.0 232.0 5.5 0.0 0.0 0.0 33.7 0.0 19.8 24.4 13.8 23.8 0.0 0.0 0.0 5.8 0.0 0.0 0.0 0.0 0.0 0.0 44.3 0.0 0.0 0.0 27.3 0.0 33.4 0.0
1.1.OTH Other actions and programmes 397.9 65.5 27.6 7.8 297.0 83.1 1.1 1.2 4.5 22.3 1.7 11.5 6.9 7.5 30.5 11.3 0.9 0.7 1.0 30.3 2.9 0.6 20.3 4.4 1.9 2.5 1.1 1.5 1.2 2.6 2.5 41.2 0.0
1.2 Cohesion for growth and employmen 37,179.1 0.2 67.1 0.4 37,111.4 201.5 397.1 2,232.3 66.8 3,003.5 565.8 98.3 2,547.2 5,125.2 1,474.4 2,567.5 66.9 509.0 902.8 36.2 2,086.2 66.0 232.6 162.2 7,781.0 2,883.9 512.2 475.8 1,096.1 153.4 197.5 1,669.8 0.4
1.2.1 Structural funds 29,214.0 0.2 66.5 0.4 29,147.0 197.9 392.1 1,623.1 66.1 3,003.3 422.3 98.3 2,030.2 3,205.1 1,473.6 2,566.8 35.3 305.9 551.3 27.1 1,426.8 33.4 231.6 162.1 5,536.3 2,409.1 337.1 358.7 633.7 153.4 197.3 1,669.0 0.4
1.2.11 Convergence objective 21,725.6 0.0 0.0 0.0 21,725.6 44.6 392.1 1,535.6 0.0 1,747.9 418.2 0.0 1,900.1 2,138.0 217.0 1,825.6 0.0 296.4 548.7 0.0 1,169.5 33.4 6.2 19.4 5,522.8 2,249.7 330.6 357.4 596.3 0.0 0.0 376.1 0.0
1.2.12 Regional competitiveness and employmen 6,757.4 0.0 0.0 0.0 6,757.4 88.8 0.0 45.1 41.6 1,181.8 0.0 96.6 129.6 992.1 1,167.2 678.5 35.3 0.4 0.1 6.7 247.1 0.0 214.6 100.4 0.0 136.7 0.0 0.4 24.1 147.7 175.6 1,247.0 0.0
1.2.13 European territorial cooperation objectiv 650.4 0.0 63.1 0.4 586.9 42.2 0.0 42.3 23.1 66.8 4.0 1.7 0.0 70.3 84.5 53.3 0.0 9.1 2.6 1.4 9.5 0.0 8.6 41.7 13.4 22.7 6.5 1.0 13.3 4.9 20.9 43.1 0.4
1.2.14 Technical assistance 80.7 0.2 3.3 0.0 77.2 22.2 0.0 0.0 1.4 6.8 0.0 0.0 0.5 4.7 4.8 9.4 0.0 0.0 0.0 19.0 0.8 0.0 2.3 0.5 0.2 0.0 0.0 0.0 0.0 0.8 0.9 2.8 0.0
1.2.2 Cohesion Fund 7,959.9 0.0 0.6 0.0 7,959.2 2.8 5.1 609.2 0.7 0.2 143.5 0.0 517.0 1,920.1 0.5 0.7 31.7 203.0 351.5 7.1 658.0 32.6 0.5 0.1 2,244.7 474.8 175.2 117.0 462.4 0.0 0.2 0.8 0.0
1.2.DAG Decentralised agencies 0.0 0.0 0.0 0.0 0.0 0.0 0.0 0.0 0.0 0.0 0.0 0.0 0.0 0.0 0.0 0.0 0.0 0.0 0.0 0.0 0.0 0.0 0.0 0.0 0.0 0.0 0.0 0.0 0.0 0.0 0.0 0.0 0.0
1.2.OTH Other actions and programmes 5.2 0.0 0.0 0.0 5.2 0.8 0.0 0.0 0.0 0.1 0.0 0.0 0.1 0.0 0.4 0.1 0.0 0.0 0.0 2.0 1.4 0.0 0.4 0.0 0.0 0.0 0.0 0.0 0.0 0.0 0.0 0.0 0.0
2 PRESERVATION AND MANAGEMENT O 56,647.3 585.7 11.7 143.3 55,906.7 695.7 574.0 1,062.2 1,148.9 6,939.8 179.7 1,713.7 2,916.5 7,038.3 9,854.9 5,731.5 72.8 284.4 544.1 57.9 1,420.1 22.1 1,119.9 1,351.2 3,690.3 1,258.6 1,435.7 207.4 676.5 908.2 1,061.5 3,940.9 0.02.0.1 Market related expenditure and direct ai 44,283.5 577.6 2.1 1.2 43,702.6 565.6 294.8 615.5 1,010.0 5,726.8 67.9 1,312.5 2,482.1 5,995.9 8,963.8 4,875.0 46.6 98.8 269.2 39.1 959.2 4.7 1,032.7 751.8 2,073.4 762.2 674.3 91.9 276.0 599.1 742.3 3,371.5 0.0
2.0.11 Agriculture markets 43,987.4 577.5 0.7 0.1 43,409.1 545.6 293.4 609.0 1,006.5 5,701.5 66.8 1,296.9 2,480.3 5,936.3 8,897.4 4,841.6 44.1 97.1 268.3 37.5 955.3 4.3 1,025.1 746.7 2,063.0 756.0 671.5 91.0 274.5 598.6 739.5 3,361.4 0.0
Direct Aid 39,675.7 244.9 0.0 0.0 39,430.9 435.2 272.6 563.4 956.1 5,444.7 61.7 1,267.5 2,418.1 5,147.8 8,062.1 4,111.3 33.1 91.0 236.7 34.7 817.4 3.4 806.9 708.0 1,847.1 631.0 617.2 83.3 245.8 540.1 702.2 3,292.3 0.0
Export refunds 385.1 0.0 0.0 0.0 385.1 36.4 0.1 2.8 29.2 34.7 1.0 23.4 0.1 3.7 116.9 14.5 0.2 0.2 6.2 0.0 2.2 0.0 59.5 5.8 13.8 5.1 0.1 0.8 0.7 9.3 5.5 12.8 0.0
Storage 93.6 0.0 0.0 0.0 93.6 -4.3 -5.2 26.8 1.0 61.6 1.1 -15.8 -5.8 -7.3 33.1 -88.9 0.1 -3.6 12.9 0.0 64.8 -0.5 23.7 1.7 -32.5 -4.5 -22.5 -2.1 18.0 33.9 10.5 -2.6 0.0
Other 3,833.0 332.6 0.7 0.1 3,499.6 78.2 25.8 16.0 20.2 160.5 3.0 21.7 68.0 792.1 685.3 804.5 10.7 9.5 12.6 2.8 70.9 1.4 135.0 31.2 234.6 124.3 76.7 9.0 10.0 15.2 21.3 58.9 0.0
2.0.12 Fisheries market 10.4 0.0 0.0 0.0 10.4 0.1 0.0 0.0 1.0 0.0 0.0 1.1 0.0 3.0 2.5 0.0 0.0 0.6 0.0 0.1 0.0 0.0 0.6 0.0 0.0 0.7 0.0 0.0 0.0 0.0 0.2 0.5 0.0
2.0.13 Animal and plant health 285.8 0.1 1.5 1.1 283.1 19.9 1.4 6.5 2.5 25.2 1.1 14.6 1.8 56.7 63.9 33.4 2.4 1.1 0.9 1.4 3.9 0.4 7.0 5.1 10.4 5.6 2.8 0.9 1.4 0.5 2.7 9.6 0.0
2.0.2 Rural development 11,485.8 0.0 0.7 0.0 11,485.1 73.3 277.8 441.3 61.6 1,170.4 100.1 381.2 423.6 872.5 870.6 757.0 19.3 172.6 264.5 16.4 455.3 17.2 75.0 592.0 1,572.0 458.8 760.5 112.5 397.5 300.0 294.2 547.7 0.0
2.0.3 European fisheries fund 395.5 0.0 0.4 0.0 395.1 22.5 0.0 3.3 26.1 19.4 9.6 14.7 2.9 127.6 3.4 50.4 6.1 10.6 8.8 0.3 0.8 0.0 0.0 1.1 37.2 33.3 0.0 0.0 1.7 3.0 11.3 1.0 0.0
2.0.4 Fisheries governance and international 200.0 0.0 6.4 141.5 52.1 4.3 0.1 0.0 5.1 2.2 0.6 2.1 0.1 7.8 4.5 10.2 0.1 0.1 0.1 0.6 0.0 0.2 2.7 0.0 0.3 1.0 0.2 0.1 0.0 0.6 2.8 6.2 0.0
2.0.5 Life+ 221.3 3.0 2.0 0.6 215.8 28.2 1.3 2.0 9.0 21.0 0.9 3.3 7.7 26.7 10.8 36.9 0.6 2.3 1.4 1.0 3.5 0.0 8.5 6.3 7.4 3.2 0.7 2.9 1.3 5.5 9.8 13.6 0.0
2.0.DAG Decentralised agencies 49.6 5.1 0.0 0.0 44.5 0.0 0.0 0.0 36.8 0.0 0.0 0.0 0.0 7.7 0.0 0.0 0.0 0.0 0.0 0.0 0.0 0.0 0.0 0.0 0.0 0.0 0.0 0.0 0.0 0.0 0.0 0.0 0.0
2.0.OTH Other actions and programmes 11.6 0.0 0.0 0.0 11.6 1.8 0.0 0.1 0.3 0.0 0.6 0.0 0.0 0.1 1.8 2.0 0.0 0.0 0.0 0.5 1.2 0.0 1.0 0.0 0.0 0.0 0.0 0.0 0.0 0.1 1.2 0.8 0.0
3 CITIZENSHIP, FREEDOM, SECURITY A 1,373.0 55.4 12.1 16.2 1,289.3 142.8 21.3 13.7 13.0 84.3 8.4 27.0 41.9 53.1 124.0 160.5 5.8 8.4 17.9 12.7 22.1 10.5 147.4 46.5 106.4 28.3 14.6 12.8 8.7 15.3 77.4 64.6 1.23.1 Freedom, security and justice 683.9 16.1 0.9 0.9 666.0 56.3 2.7 4.5 1.8 37.2 4.6 3.3 34.3 24.2 45.8 60.0 4.2 3.6 13.5 2.4 11.0 9.7 128.5 35.2 87.5 21.1 4.3 6.3 4.6 6.1 16.8 36.5 0.0
3.1.1 Solidarity and management of migration 302.6 4.0 0.0 0.4 298.1 12.5 1.4 3.5 0.9 30.0 4.1 2.6 33.2 18.6 26.3 46.2 3.8 3.1 11.4 1.1 9.3 7.3 9.5 10.0 7.9 4.6 1.4 5.5 3.9 5.3 13.3 21.4 0.0
3.1.2 Security and safeguarding liberties 35.7 0.4 0.5 0.0 34.7 3.3 0.6 0.5 0.2 1.7 0.0 0.2 0.4 2.6 2.1 5.7 0.4 0.2 1.5 0.1 0.7 0.1 6.3 0.7 0.2 0.4 0.5 0.0 0.7 0.4 2.6 2.5 0.0
3.1.3 Fundamental rights and justice 54.5 1.3 0.2 0.5 52.5 13.8 0.7 0.5 0.6 5.0 0.3 0.5 0.4 2.4 3.4 6.9 0.0 0.3 0.6 0.5 0.9 0.1 1.9 3.2 0.5 0.9 2.2 0.7 0.0 0.4 0.7 4.8 0.0
3.1.DAG Decentralised agencies 237.1 4.1 0.1 0.0 232.9 0.0 0.0 0.0 0.0 0.0 0.0 0.0 0.0 0.0 0.0 0.0 0.0 0.0 0.0 0.0 0.0 2.1 109.8 21.1 78.7 15.1 0.0 0.0 0.0 0.0 0.0 6.1 0.0
3.1.OTH Other actions and programmes 54.1 6.3 0.1 0.0 47.8 26.7 0.0 0.1 0.1 0.5 0.1 0.0 0.3 0.5 14.0 1.3 0.0 0.0 0.0 0.8 0.0 0.1 1.0 0.2 0.2 0.0 0.1 0.0 0.0 0.0 0.1 1.6 0.0
3.2 Citizenship 689.0 39.3 11.3 15.2 623.3 86.4 18.7 9.1 11.1 47.1 3.7 23.7 7.5 29.0 78.2 100.4 1.6 4.8 4.4 10.3 11.1 0.8 18.9 11.3 18.8 7.2 10.3 6.5 4.1 9.2 60.6 28.1 1.2
3.2.1 Public health and consumer protection 76.9 0.9 1.3 3.6 71.1 17.4 0.7 0.6 1.8 5.0 0.3 0.9 1.2 2.7 7.3 4.7 0.3 0.3 0.4 6.6 1.3 0.2 5.3 1.1 0.8 0.7 0.4 0.8 0.3 1.4 1.5 7.0 0.1
3.2.2 Culture 2007-2013 47.2 2.1 0.0 1.0 44.1 7.4 0.3 1.0 0.4 3.1 1.8 0.2 0.5 2.7 5.4 2.8 0.2 0.4 0.4 0.2 0.7 0.0 2.5 3.9 0.5 0.1 0.1 2.1 0.3 2.0 0.7 4.1 0.5
3.2.3 Youth in action 144.2 18.2 0.0 5.2 120.7 8.1 3.3 3.1 2.4 13.5 0.9 2.3 2.2 8.3 14.2 8.9 0.7 2.2 2.2 1.9 3.2 0.1 4.9 2.7 8.8 3.7 5.6 2.2 2.3 2.6 3.2 7.4 0.0
3.2.4 Media 2007 118.6 12.5 0.0 4.7 101.4 17.0 0.5 2.0 3.7 15.4 0.3 1.5 1.5 8.5 21.8 6.1 0.0 0.4 0.3 0.7 1.1 0.0 3.4 1.8 3.0 1.3 0.3 0.3 0.3 1.4 3.3 5.6 0.4
3.2.5 Europe for Citizens 23.7 0.4 0.0 0.4 22.9 4.5 0.4 0.4 0.2 2.9 0.0 0.1 0.3 0.8 4.4 2.5 0.1 0.3 0.2 0.0 1.6 0.1 0.2 0.8 0.7 0.0 0.3 0.4 0.3 0.1 0.1 1.4 0.3
3.2.6 Civil protection Financial instrument 9.4 0.2 0.2 0.0 9.0 0.4 0.0 0.0 1.6 1.1 0.0 0.0 0.2 0.3 0.0 2.0 0.0 0.0 0.0 0.2 0.2 0.0 0.8 0.0 0.0 0.2 0.0 0.0 0.0 0.0 2.0 0.1 0.0
3.2.7 Communication actions 83.7 0.4 0.0 0.0 83.2 25.0 0.5 0.7 0.7 5.3 0.4 1.4 1.6 2.6 24.1 3.3 0.3 1.3 0.9 0.7 1.3 0.4 1.5 0.8 1.7 1.3 1.1 0.8 0.6 1.4 1.6 1.9 0.0
3.2.8 European Solidarity Fund 13.0 0.0 0.0 0.0 13.0 0.0 0.0 0.0 0.0 0.0 0.0 13.0 0.0 0.0 0.0 0.0 0.0 0.0 0.0 0.0 0.0 0.0 0.0 0.0 0.0 0.0 0.0 0.0 0.0 0.0 0.0 0.0 0.0
3.2.DAG Decentralised agencies 121.1 4.1 0.0 0.0 117.0 0.0 0.0 0.0 0.0 0.0 0.0 0.0 0.0 0.0 0.0 68.9 0.0 0.0 0.0 0.0 0.0 0.0 0.0 0.0 0.0 0.0 0.0 0.0 0.0 0.0 48.1 0.0 0.0
3.2.OTH Other actions and programmes 51.3 0.5 9.7 0.2 40.9 6.7 13.0 1.4 0.3 0.9 0.1 4.2 0.0 3.1 1.0 1.2 0.0 0.0 0.0 0.0 1.8 0.0 0.3 0.2 3.4 0.0 2.5 0.0 0.0 0.4 0.0 0.6 0.0
4 THE EU AS A GLOBAL PARTNER 7,486.5 146.7 1,534.8 5,341.1 463.9 0.0 143.6 0.6 0.0 0.0 4.1 0.0 0.0 0.0 0.0 0.0 0.0 1.2 1.8 0.0 2.7 0.0 0.0 0.0 27.8 0.0 277.8 4.0 0.3 0.0 0.0 0.0 81.04.0.1 Instrument for Preaccession (IPA) 1,473.0 8.9 212.9 787.2 463.9 0.0 143.6 0.6 0.0 0.0 4.1 0.0 0.0 0.0 0.0 0.0 0.0 1.2 1.8 0.0 2.7 0.0 0.0 0.0 27.8 0.0 277.8 4.0 0.3 0.0 0.0 0.0 80.3
Other actions and programmes 6,013.5 137.8 1,321.9 4,553.9 0.0 0.0 0.0 0.0 0.0 0.0 0.0 0.0 0.0 0.0 0.0 0.0 0.0 0.0 0.0 0.0 0.0 0.0 0.0 0.0 0.0 0.0 0.0 0.0 0.0 0.0 0.0 0.0 0.6
5 ADMINISTRATION 7,895.8 203.3 296.4 210.2 7,185.9 4,294.5 14.6 18.7 52.5 193.4 9.1 44.4 41.7 88.6 337.0 269.8 8.2 10.0 11.8 1,346.0 33.0 7.7 87.4 20.8 31.7 30.3 22.5 9.4 11.5 23.4 28.8 139.3 1.56 COMPENSATIONS 0.0 0.0 0.0 0.0 0.0 0.0 0.0 0.0 0.0 0.0 0.0 0.0 0.0 0.0 0.0 0.0 0.0 0.0 0.0 0.0 0.0 0.0 0.0 0.0 0.0 0.0 0.0 0.0 0.0 0.0 0.0 0.0 0.0TOTAL EXPENDITURE 122,230.7 1,524.2 2,847.0 6,522.0 111,337.5 6,145.1 1,222.5 3,415.6 1,525.7 11,825.2 807.9 2,065.6 5,748.7 13,190.5 13,105.1 9,497.5 178.0 843.6 1,601.9 1,554.3 3,650.0 112.4 2,146.1 1,821.6 11,822.0 4,378.8 2,317.4 755.7 1,905.0 1,309.6 1,646.2 6,745.6 87.7
VAT-based own resource 12,470.5 439.2 46.0 180.9 256.9 1,586.9 19.7 193.8 293.6 760.4 2,380.6 1,558.9 24.9 13.7 31.6 39.3 119.4 8.1 202.3 287.1 518.3 276.3 124.1 50.1 53.4 226.7 149.5 2,629.0 0.0GNI-based own resource 91,066.8 2,661.1 247.1 1,050.9 1,709.8 18,694.5 98.9 952.9 1,616.1 7,607.4 14,754.7 11,381.0 124.2 133.8 186.3 196.5 701.9 40.4 4,217.1 2,130.6 2,629.7 1,348.8 859.2 250.8 449.8 1,255.4 2,770.2 12,997.8 0.0UK correction -114.8 168.4 14.7 66.8 95.2 249.6 5.6 56.1 168.5 496.2 897.6 615.7 7.7 9.5 10.2 10.7 34.6 2.6 54.9 22.7 167.0 77.2 50.6 16.6 32.3 80.6 36.2 -3,562.7 0.0Lump Sum Reduction Granted for NL & SE -3.2 23.6 2.2 9.2 15.9 167.8 0.9 8.6 15.6 69.4 133.4 103.1 1.1 1.2 1.8 1.9 6.2 0.4 -612.1 18.9 22.9 10.8 8.0 2.3 4.4 11.8 -148.5 116.1 0.0JHA adjustment for Denmark, Ireland and the United Kingdom -3.7 1.3 0.1 0.5 -4.1 9.3 0.1 -2.7 0.9 3.9 7.3 5.7 0.1 0.1 0.1 0.1 0.3 0.0 2.1 1.0 1.2 0.6 0.4 0.1 0.2 0.7 1.3 -34.4 0.0
TOTAL national contribution 103,415.6 3,293.6 310.2 1,308.3 2,073.7 20,708.1 125.1 1,208.6 2,094.7 8,937.3 18,173.5 13,664.4 158.1 158.3 230.1 248.5 862.5 51.4 3,864.3 2,460.3 3,339.0 1,713.7 1,042.2 320.0 540.1 1,575.2 2,808.8 12,145.8 0.0Traditional own resources (TOR) (75%) 15,659.3 1,489.6 42.4 189.4 306.8 3,064.5 17.2 185.6 215.4 1,158.1 1,407.3 1,668.0 26.4 16.8 39.1 12.7 92.6 9.8 1,749.2 166.6 317.8 134.2 100.9 66.6 107.3 127.0 434.3 2,513.5 0.0Agricultural duties (100%) 0.0 0.0 0.0 0.0 0.0 0.0 0.0 0.0 0.0 0.0 0.0 0.0 0.0 0.0 0.0 0.0 0.0 0.0 0.0 0.0 0.0 0.0 0.0 0.0 0.0 0.0 0.0 0.0 0.0Sugar levies (100%) 194.1 8.2 0.5 4.1 4.2 35.0 0.0 -0.1 1.8 37.3 41.2 4.8 0.0 0.0 1.0 0.0 2.4 0.0 9.1 4.0 17.1 0.0 1.3 0.0 1.5 0.9 7.1 12.7 0.0Customs duties (100%) 20,684.9 1,977.9 56.0 248.4 404.9 4,051.0 23.0 247.6 285.4 1,506.8 1,835.2 2,219.1 35.2 22.4 51.0 17.0 121.0 13.1 2,323.2 218.2 406.7 178.9 133.2 88.9 141.5 168.5 572.0 3,338.7 0.0
Amounts (25%) retained as TOR collection costs -5,219.8 -496.5 -14.1 -63.1 -102.3 -1,021.5 -5.7 -61.9 -71.8 -386.0 -469.1 -556.0 -8.8 -5.6 -13.0 -4.2 -30.9 -3.3 -583.1 -55.5 -105.9 -44.7 -33.6 -22.2 -35.8 -42.3 -144.8 -837.8 0.0
TOTAL own resources 119,074.9 4,783.2 352.6 1,497.7 2,380.5 23,772.6 142.4 1,394.3 2,310.1 10,095.4 19,580.8 15,332.4 184.5 175.0 269.1 261.2 955.0 61.2 5,613.6 2,626.9 3,656.8 1,847.9 1,143.1 386.6 647.3 1,702.2 3,243.1 14,659.4 0.0Surplus from previous year 2,253.6Surplus from EAGGF-Guarantee 0.0 p.m. amount of the 2009Surplus external aid guarantee fund 0.0 UK correction: 3,396.7Other revenue 6,466.8
TOTAL REVENUE 127,795.3
Gross National Income (GNI), EUR million* 12,784,622.3 372,559.8 35,809.7 144,607.5 245,494.2 2,630,399.0 13,944.0 139,764.0 221,569.9 1,065,758.0 2,039,275.0 1,601,576.4 18,348.4 18,238.2 27,479.2 25,726.8 93,249.2 6,321.3 635,504.0 296,814.6 346,265.2 173,689.3 125,224.7 35,867.8 65,632.7 189,635.0 379,246.3 1,836,622.0 43,693.1
Operating budgetary balance (EUR million) 0.00 -1,466.4 +895.5 +2,079.3 -615.3 -9,223.6 +672.7 +803.9 +3,597.4 +4,100.9 -5,534.8 -4,534.0 +10.6 +674.2 +1,358.4 -41.9 +2,748.4 +52.9 -1,833.1 -677.0 +8,427.5 +2,622.6 +1,245.2 +424.1 +1,349.6 -300.2 -1,211.4 -5,625.9 +86.2
Operating budgetary balance (% GNI) 0.00% -0.39% +2.50% +1.44% -0.25% -0.35% +4.82% +0.58% +1.62% +0.38% -0.27% -0.28% +0.06% +3.70% +4.94% -0.16% +2.95% +0.84% -0.29% -0.23% +2.43% +1.51% +0.99% +1.18% +2.06% -0.16% -0.32% -0.31% +0.20%
2010 (EUR million)

p.m.
Total earmarked other non-EU EU-27 BE BG CZ DK DE EE IE EL ES FR IT CY LV LT LU HU MT NL AT PL PT RO SI SK FI SE UK HR
1 SUSTAINABLE GROWTH 54,731.6 636.9 1,004.1 926.5 52,164.1 1,328.4 607.5 1,849.9 321.5 5,024.2 287.4 325.6 3,551.6 6,331.2 3,085.3 3,167.7 103.8 588.9 1,070.2 156.0 3,748.5 103.6 885.8 501.8 9,867.4 3,293.1 768.1 589.7 1,096.8 457.4 653.5 2,399.2 11.71.1 Competitiveness for growth and em 12,353.0 636.9 890.9 926.2 9,899.1 1,041.6 68.1 75.1 189.7 1,576.7 19.2 170.5 219.9 903.1 1,312.7 826.7 18.5 28.1 93.0 134.5 111.5 18.9 578.8 283.0 234.0 184.9 68.0 64.9 40.9 153.9 295.7 1,187.2 11.7
1.1.1 Seventh Research framework programme ( 7,510.7 324.9 760.9 573.3 5,851.5 603.6 10.6 29.7 119.0 947.0 7.2 72.3 132.7 634.9 791.1 553.4 9.6 2.8 5.5 24.2 39.3 1.8 403.9 146.5 60.3 59.0 18.5 21.6 7.3 105.8 203.1 840.8 9.4
1.1.2 Decommissioning (Direct research) 23.5 0.0 0.0 0.0 23.5 1.2 0.0 0.0 0.0 5.3 0.0 0.0 0.0 3.1 2.8 8.7 0.0 0.0 0.0 0.0 0.0 0.0 0.0 0.0 0.0 0.0 0.0 0.0 0.0 0.0 0.0 2.5 0.0
1.1.3 Ten 865.6 29.5 0.5 295.0 540.6 42.2 0.5 3.7 13.8 78.2 0.9 0.5 1.6 57.4 84.0 29.2 0.9 5.4 3.2 4.8 8.8 0.0 50.5 72.3 1.5 3.9 0.3 3.5 2.1 16.2 35.6 19.6 0.0
1.1.4 Galileo 565.6 8.2 0.5 0.5 556.4 7.6 0.0 0.0 0.0 242.0 0.0 0.0 0.0 1.5 214.3 38.5 0.0 0.0 0.0 0.0 0.0 0.0 0.2 0.0 0.0 0.1 0.0 0.0 0.0 0.0 0.0 52.1 0.0
1.1.5 Marco Polo 20.8 0.0 0.1 0.0 20.7 2.2 0.4 0.0 0.0 0.1 0.0 0.0 0.0 1.4 1.7 4.3 0.2 0.4 0.0 1.2 0.1 0.0 0.0 4.5 1.1 0.0 0.0 0.7 0.0 0.0 0.7 1.7 0.0
1.1.6 Lifelong Learning 1,315.1 171.1 0.2 19.6 1,124.2 69.5 24.1 24.3 19.7 142.3 7.9 12.8 32.8 96.5 123.2 124.6 5.7 10.5 15.5 3.8 25.4 1.5 37.0 25.6 87.0 29.2 35.1 8.9 9.6 23.1 20.9 107.6 0.3
1.1.7 Competitiveness and innovation framew 494.7 25.3 107.5 14.2 347.7 38.7 2.5 3.5 5.7 49.4 1.8 3.5 12.5 30.4 27.2 41.1 1.2 1.4 1.1 22.9 3.6 0.7 22.3 12.0 7.5 8.5 4.2 3.1 1.2 4.6 7.4 29.6 1.6
1.1.71 CIP Entrepreneurship and innovation 297.1 22.1 106.0 11.2 157.8 13.3 1.5 2.2 3.4 23.7 1.1 1.8 5.4 15.7 14.5 20.5 0.4 0.5 0.7 1.9 2.4 0.3 9.0 4.4 6.3 2.5 2.5 1.4 0.5 1.8 3.2 16.8 0.9
1.1.72 CIP ICT policy support 102.4 1.5 0.4 2.1 98.4 8.1 0.9 1.3 1.7 9.7 0.5 1.1 6.4 12.9 6.7 13.4 0.7 0.7 0.5 1.0 0.9 0.4 9.9 3.1 0.8 2.5 1.3 0.9 0.5 1.4 3.5 7.6 0.6
1.1.73 CIP Intelligent energy 95.3 1.6 1.1 1.0 91.5 17.3 0.1 0.0 0.6 15.9 0.2 0.5 0.7 1.8 6.0 7.3 0.1 0.2 0.0 20.0 0.2 0.0 3.5 4.5 0.4 3.4 0.5 0.7 0.1 1.5 0.7 5.3 0.2
1.1.8 Social policy agenda 150.9 2.0 0.0 2.7 146.1 66.8 1.0 1.0 1.9 12.4 0.4 0.6 0.9 3.0 10.0 6.1 0.3 0.2 1.0 10.0 2.0 0.4 6.4 4.0 2.1 0.7 0.5 1.5 0.7 0.7 0.9 10.8 0.2
1.1.9 Customs 2013 and Fiscalis 2013 61.4 0.3 14.6 11.6 34.9 18.3 0.4 0.5 0.6 0.6 0.3 0.3 0.4 0.3 0.5 0.6 0.2 0.4 0.4 6.2 0.4 0.2 0.4 0.3 0.4 0.5 0.4 0.3 0.3 0.5 0.7 0.5 0.1
1.1.10 Nuclear decommissioning 102.0 0.0 0.0 0.0 102.0 0.0 27.5 0.0 0.0 0.0 0.0 0.0 0.0 0.0 0.0 0.0 0.0 0.0 57.1 0.0 0.0 0.0 0.0 0.0 0.0 0.0 0.0 0.0 17.3 0.0 0.0 0.0 0.0
1.1.11 European Global Adjustment Funds 114.3 0.0 0.0 0.0 114.3 9.9 0.0 0.3 24.4 12.7 0.0 35.7 2.9 5.4 0.0 0.0 0.0 0.0 0.0 0.0 0.0 0.0 8.4 9.5 1.2 1.5 0.0 2.2 0.0 0.0 0.0 0.1 0.0
1.1.12 Energy projects to aid economic recover 487.7 0.0 0.0 0.0 487.7 55.1 0.0 10.6 0.0 36.5 0.0 18.4 6.0 50.1 0.0 11.6 0.0 5.1 1.0 30.0 22.0 13.8 9.8 4.3 71.5 32.5 7.8 16.0 1.2 0.0 24.3 60.1 0.0
1.1.DAG Decentralised agencies 249.2 13.9 0.9 0.0 234.4 24.4 0.0 0.0 0.0 34.1 0.0 20.2 23.1 13.6 23.6 0.0 0.0 1.2 7.5 0.0 0.0 0.0 0.1 0.0 0.0 47.0 0.0 5.9 0.0 0.0 0.0 33.5 0.0
1.1.OTH Other actions and programmes 391.6 61.5 5.8 9.3 315.0 102.3 1.0 1.3 4.7 16.0 0.8 6.0 7.0 5.5 34.3 8.7 0.5 0.7 0.7 31.3 9.9 0.5 39.7 4.0 1.3 2.3 1.0 1.1 1.2 3.1 2.0 28.1 0.0
1.2 Cohesion for growth and employmen 42,378.5 0.0 113.3 0.3 42,265.0 286.8 539.4 1,774.8 131.7 3,447.5 268.1 155.1 3,331.7 5,428.1 1,772.6 2,341.0 85.3 560.8 977.1 21.6 3,637.1 84.7 307.0 218.8 9,633.3 3,108.1 700.1 524.9 1,056.0 303.6 357.8 1,211.9 0.0
1.2.1 Structural funds 35,914.3 0.0 112.8 0.0 35,801.5 281.8 269.8 1,734.4 130.7 3,438.5 196.0 144.0 2,734.6 4,573.9 1,772.1 2,340.8 37.3 399.1 598.7 16.6 2,797.5 57.6 305.9 218.3 6,952.9 2,936.9 601.2 473.8 917.6 303.4 357.4 1,210.8 0.0
1.2.11 Convergence objective 27,121.2 0.0 0.0 0.0 27,121.2 11.4 269.8 1,643.4 0.0 2,194.6 191.5 44.6 2,587.3 2,970.7 439.2 1,434.0 0.0 387.7 580.5 0.0 2,245.6 57.5 1.1 34.1 6,893.7 2,752.6 599.8 463.0 851.2 24.9 7.9 435.2 0.0
1.2.12 Regional competitiveness and employmen 7,651.0 0.0 0.0 0.0 7,651.0 190.2 0.0 37.0 98.2 1,076.9 0.0 90.9 139.9 1,555.2 1,141.4 840.6 37.3 0.0 0.0 12.4 508.0 0.0 292.9 108.0 6.7 165.2 0.0 0.0 49.5 261.6 323.2 715.9 0.0
1.2.13 European territorial cooperation objectiv 1,076.8 0.0 111.2 0.0 965.6 52.7 0.0 53.9 31.5 146.3 4.5 8.5 7.2 47.8 187.9 64.6 0.0 11.4 18.1 1.4 43.8 0.0 10.8 74.9 52.5 18.7 1.4 10.7 16.9 16.8 26.2 57.0 0.0
1.2.14 Technical assistance 65.3 0.0 1.5 0.0 63.7 27.5 0.0 0.1 1.0 20.7 0.0 0.0 0.3 0.2 3.6 1.5 0.0 0.0 0.0 2.8 0.1 0.1 1.1 1.3 0.0 0.4 0.0 0.0 0.0 0.0 0.1 2.7 0.0
1.2.2 Cohesion Fund 6,453.7 0.0 0.5 0.0 6,453.2 4.6 269.6 40.4 0.8 8.1 72.1 11.1 597.1 854.2 0.4 0.2 48.0 161.6 378.4 0.0 838.0 27.1 0.4 0.1 2,680.2 171.3 98.8 51.0 138.2 0.0 0.0 1.1 0.0
1.2.DAG Decentralised agencies 0.0 0.0 0.0 0.0 0.0 0.0 0.0 0.0 0.0 0.0 0.0 0.0 0.0 0.0 0.0 0.0 0.0 0.0 0.0 0.0 0.0 0.0 0.0 0.0 0.0 0.0 0.0 0.0 0.0 0.0 0.0 0.0 0.0
1.2.OTH Other actions and programmes 10.5 0.0 0.0 0.3 10.3 0.4 0.1 0.0 0.2 0.8 0.0 0.0 0.0 0.0 0.1 0.0 0.0 0.0 0.1 4.9 1.6 0.0 0.6 0.4 0.2 0.0 0.1 0.1 0.2 0.1 0.4 0.0 0.0
2 PRESERVATION AND MANAGEMENT O 57,374.5 1,335.9 8.6 161.2 55,868.8 713.5 443.7 1,132.8 1,088.1 6,836.9 201.0 1,257.2 2,894.7 7,092.4 9,541.5 5,993.5 66.0 302.7 536.2 53.3 1,500.0 15.3 940.4 1,312.4 4,293.0 1,333.4 1,693.6 227.0 647.9 794.6 996.2 3,961.4 0.02.0.1 Market related expenditure and direct ai 44,123.6 1,319.1 4.5 0.8 42,799.1 587.1 315.2 671.7 967.8 5,520.4 79.6 893.9 2,407.7 5,868.6 8,751.8 4,659.4 42.1 112.2 282.1 38.3 1,054.0 5.2 869.2 742.6 2,407.2 783.5 796.0 109.8 298.6 497.2 700.1 3,337.8 0.0
2.0.11 Agriculture markets 43,817.9 1,318.4 1.4 0.2 42,498.0 556.9 315.1 668.0 964.2 5,498.1 74.8 873.0 2,406.9 5,819.6 8,679.9 4,649.3 42.0 109.2 279.9 36.9 1,049.8 4.4 860.2 739.8 2,398.3 761.0 795.7 108.7 296.9 496.4 697.8 3,315.5 0.0
Direct Aid 40,178.0 501.5 0.0 0.0 39,676.5 516.9 300.3 657.0 942.7 5,341.8 71.7 828.0 2,353.7 5,208.4 8,007.8 4,038.0 34.3 105.2 271.4 34.2 953.7 3.7 817.4 713.7 2,177.0 655.4 728.8 102.2 283.1 539.0 694.2 3,296.9 0.0
Export refunds 179.4 0.0 0.0 0.0 179.4 2.6 0.5 0.9 4.7 21.4 0.1 3.5 0.1 3.0 85.7 15.3 0.0 0.0 4.7 0.0 1.5 0.0 8.3 5.5 14.4 4.7 0.5 0.5 0.2 0.1 0.1 1.1 0.0
Storage -175.6 0.0 0.0 0.0 -175.6 -9.1 -5.3 -1.4 1.5 32.6 1.4 37.8 -9.0 -57.8 60.3 -91.2 0.1 -3.9 -5.0 0.0 28.0 -0.6 -3.0 1.5 -25.1 -13.7 -39.7 -2.3 0.8 -52.3 -7.7 -12.4 0.0
Other 3,636.1 816.9 1.4 0.2 2,817.6 46.5 19.6 11.5 15.2 102.2 1.6 3.8 62.1 666.0 526.1 687.3 7.6 7.8 8.9 2.6 66.5 1.2 37.5 19.1 231.9 114.6 106.1 8.3 12.9 9.6 11.2 29.9 0.0
2.0.12 Fisheries market 34.0 0.0 0.0 0.0 34.0 0.1 0.0 0.0 0.9 0.0 3.2 0.9 0.0 7.2 9.7 0.0 0.0 1.3 1.0 0.1 0.0 0.0 0.6 0.0 0.0 8.5 0.0 0.0 0.0 0.0 0.0 0.4 0.0
2.0.13 Animal and plant health 271.7 0.8 3.2 0.6 267.2 30.1 0.1 3.8 2.7 22.2 1.5 20.0 0.8 41.8 62.3 10.1 0.1 1.8 1.2 1.3 4.2 0.8 8.5 2.8 8.9 14.1 0.3 1.1 1.7 0.8 2.3 22.0 0.0
2.0.2 Rural development 12,295.2 9.1 0.3 0.0 12,285.8 83.2 123.3 452.3 50.0 1,275.8 109.2 358.1 442.9 1,051.6 758.9 1,222.2 18.0 164.4 248.7 13.6 432.7 7.6 59.2 560.2 1,809.1 527.5 894.9 112.5 345.9 285.9 276.3 602.0 0.0
2.0.3 European fisheries fund 445.9 0.0 0.2 0.0 445.7 10.4 4.4 7.7 20.6 12.9 10.8 0.0 36.0 118.4 14.1 59.3 4.5 25.5 4.7 0.3 7.2 1.1 1.6 0.8 71.1 19.2 0.0 2.8 1.3 5.0 5.5 0.6 0.0
2.0.4 Fisheries governance and international 236.9 0.0 1.5 157.8 77.6 6.2 0.1 0.0 7.4 3.5 0.3 4.1 0.5 13.4 8.1 11.1 0.1 0.1 0.3 0.6 0.0 0.5 3.6 0.0 1.1 1.6 0.5 0.1 0.0 0.9 8.4 5.0 0.0
2.0.5 Life+ 205.2 2.2 2.1 2.7 198.2 25.5 0.7 1.1 5.8 23.8 1.2 1.1 7.2 28.4 7.7 37.6 1.2 0.5 0.5 0.5 4.4 0.9 5.1 8.8 4.5 1.6 1.9 1.9 2.1 5.0 5.2 14.1 0.0
2.0.DAG Decentralised agencies 53.1 5.5 0.0 0.0 47.6 0.0 0.0 0.0 35.9 0.0 0.0 0.0 0.0 11.7 0.0 0.0 0.0 0.0 0.0 0.0 0.0 0.0 0.0 0.0 0.0 0.0 0.0 0.0 0.0 0.0 0.0 0.0 0.0
2.0.OTH Other actions and programmes 14.7 0.0 0.0 0.0 14.7 1.1 0.0 0.0 0.6 0.4 0.0 0.0 0.5 0.3 0.9 3.8 0.0 0.0 0.0 0.0 1.8 0.0 1.8 0.0 0.0 0.0 0.3 0.0 0.0 0.5 0.8 2.0 0.0
3 CITIZENSHIP, FREEDOM, SECURITY A 1,827.3 86.8 6.0 22.3 1,712.2 151.8 11.6 29.3 12.6 87.7 7.0 14.0 52.9 90.2 192.9 174.9 7.6 9.8 34.8 12.6 44.1 8.1 149.0 42.6 242.5 60.7 50.0 21.4 29.2 16.0 78.2 80.9 2.53.1 Freedom, security and justice 871.1 41.5 1.7 4.9 823.0 59.1 7.3 4.4 2.4 40.1 3.1 3.7 44.0 62.3 62.5 67.8 6.6 5.2 31.7 2.8 10.8 7.1 131.4 32.8 122.8 21.3 10.7 6.7 4.8 9.6 12.8 49.1 0.0
3.1.1 Solidarity and management of migration 437.8 31.8 0.1 4.7 401.2 16.9 5.1 4.1 1.3 31.2 2.6 2.7 42.5 56.1 30.4 53.0 6.3 2.9 29.1 2.0 8.6 6.9 10.5 8.8 9.4 5.1 8.0 4.9 4.6 8.7 12.4 26.9 0.0
3.1.2 Security and safeguarding liberties 41.2 0.8 0.8 0.0 39.6 4.5 1.0 0.2 0.2 4.2 0.5 0.9 0.2 2.9 1.3 5.9 0.0 0.3 1.5 0.0 0.9 0.0 4.7 0.5 0.9 0.4 1.0 1.3 0.2 0.8 0.2 5.2 0.0
3.1.3 Fundamental rights and justice 60.0 0.7 0.1 0.1 59.1 13.9 1.3 0.1 0.9 4.6 0.0 0.1 1.2 3.2 2.5 8.7 0.3 2.0 1.1 0.4 1.1 0.0 3.2 2.1 1.5 0.7 1.7 0.5 0.0 0.1 0.2 7.7 0.0
3.1.DAG Decentralised agencies 272.9 2.4 0.7 0.0 269.8 0.7 0.0 0.0 0.0 0.0 0.0 0.0 0.0 0.0 0.0 0.0 0.0 0.0 0.0 0.0 0.0 0.2 112.9 21.3 111.0 15.2 0.0 0.0 0.0 0.0 0.0 8.4 0.0
3.1.OTH Other actions and programmes 59.3 5.9 0.0 0.0 53.4 23.1 0.0 0.0 0.0 0.0 0.0 0.0 0.0 0.1 28.3 0.2 0.0 0.0 0.0 0.3 0.3 0.0 0.0 0.1 0.0 0.0 0.0 0.0 0.0 0.0 0.0 1.0 0.0
3.2 Citizenship 956.2 45.3 4.3 17.4 889.3 92.7 4.3 24.9 10.2 47.6 3.8 10.3 8.9 27.8 130.4 107.1 1.0 4.5 3.1 9.8 33.3 1.1 17.6 9.7 119.7 39.4 39.3 14.7 24.4 6.3 65.4 31.8 2.5
3.2.1 Public health and consumer protection 67.6 0.4 0.9 2.3 63.9 16.6 0.4 0.4 1.4 4.8 0.4 0.7 0.8 2.3 6.0 3.6 0.3 0.2 0.3 7.1 1.4 0.2 4.4 1.7 0.5 0.5 0.4 0.8 0.3 1.2 1.1 6.0 0.1
3.2.2 Culture 2007-2013 51.5 2.2 0.0 2.7 46.6 5.1 0.4 1.7 0.5 3.3 0.2 0.2 0.3 3.0 7.3 4.4 0.1 0.6 0.2 0.0 1.1 0.0 3.3 2.9 0.4 2.3 0.5 2.5 0.4 0.4 1.1 4.3 0.5
3.2.3 Youth in action 148.6 25.5 0.0 5.2 117.9 8.3 1.3 3.3 2.4 13.8 2.1 2.4 2.9 8.9 16.8 10.3 0.0 1.7 0.8 1.4 3.4 0.2 3.7 1.5 5.8 3.1 4.4 2.4 1.4 2.0 3.4 10.2 1.0
3.2.4 Media 2007 114.9 9.9 3.2 4.8 97.0 8.0 0.6 1.7 3.1 14.6 0.3 1.5 1.7 7.1 29.5 6.6 0.1 0.4 0.4 0.6 0.7 0.0 3.1 1.6 2.9 1.0 0.7 0.4 0.4 1.1 2.7 5.9 0.4
3.2.5 Europe for Citizens 27.8 0.6 0.0 0.6 26.5 4.1 0.2 0.4 0.1 2.9 0.0 0.2 0.3 0.7 5.1 3.4 0.1 0.2 0.3 0.0 2.4 0.1 0.2 0.7 1.7 0.1 0.7 0.3 0.8 0.1 0.1 1.3 0.5
3.2.6 Civil protection Financial instrument 12.7 0.2 0.2 0.6 11.8 0.2 0.3 0.0 1.7 1.8 0.0 0.0 1.4 0.4 0.3 2.2 0.0 0.0 0.0 0.2 0.0 0.0 1.3 0.1 0.2 0.0 0.0 0.0 0.0 0.0 1.4 0.2 0.0
3.2.7 Communication actions 88.2 0.1 0.0 1.0 87.2 25.7 0.8 0.8 0.5 5.0 0.7 0.9 1.3 2.4 27.1 3.6 0.3 1.4 0.9 0.5 1.6 0.4 1.1 1.0 2.3 1.0 1.3 0.8 0.6 1.4 1.4 2.3 0.0
3.2.8 European Solidarity Fund 263.8 0.0 0.0 0.0 263.8 0.0 0.0 16.0 0.0 0.0 0.0 0.0 0.0 0.0 35.6 0.0 0.0 0.0 0.0 0.0 22.5 0.0 0.0 0.0 105.6 31.3 25.0 7.5 20.4 0.0 0.0 0.0 0.0
3.2.DAG Decentralised agencies 132.2 5.9 0.0 0.0 126.2 0.0 0.0 0.0 0.0 0.0 0.0 0.0 0.0 0.0 0.0 72.2 0.0 0.0 0.0 0.0 0.0 0.0 0.0 0.0 0.0 0.0 0.0 0.0 0.0 0.0 54.0 0.0 0.0
3.2.OTH Other actions and programmes 48.9 0.6 0.0 0.1 48.2 24.7 0.1 0.7 0.4 1.4 0.1 4.5 0.2 3.1 2.6 0.8 0.0 0.0 0.1 0.0 0.1 0.1 0.4 0.3 0.3 0.1 6.3 0.1 0.1 0.2 0.1 1.6 0.0
4 THE EU AS A GLOBAL PARTNER 7,102.2 180.7 1,557.4 5,174.9 189.2 0.0 31.3 0.3 0.0 0.0 0.7 0.0 0.0 0.0 0.0 0.0 0.0 0.0 1.1 0.0 16.5 0.0 0.0 0.0 10.1 0.0 128.5 0.2 0.5 0.0 0.0 0.0 97.64.0.1 Instrument for Preaccession (IPA) 1,262.0 9.4 217.4 846.1 189.2 0.0 31.3 0.3 0.0 0.0 0.7 0.0 0.0 0.0 0.0 0.0 0.0 0.0 1.1 0.0 16.5 0.0 0.0 0.0 10.1 0.0 128.5 0.2 0.5 0.0 0.0 0.0 90.6
Other actions and programmes 5,840.2 171.4 1,340.0 4,328.8 0.0 0.0 0.0 0.0 0.0 0.0 0.0 0.0 0.0 0.0 0.0 0.0 0.0 0.0 0.0 0.0 0.0 0.0 0.0 0.0 0.0 0.0 0.0 0.0 0.0 0.0 0.0 0.0 7.0
5 ADMINISTRATION 8,359.3 439.6 363.7 153.4 7,402.7 4,603.1 13.1 16.8 50.9 184.2 8.7 42.5 37.7 85.2 342.6 249.7 6.2 9.5 10.6 1,326.6 21.7 8.2 89.1 19.1 27.7 28.1 19.3 8.7 10.7 25.0 29.2 128.6 1.36 COMPENSATIONS 0.0 0.0 0.0 0.0 0.0 0.0 0.0 0.0 0.0 0.0 0.0 0.0 0.0 0.0 0.0 0.0 0.0 0.0 0.0 0.0 0.0 0.0 0.0 0.0 0.0 0.0 0.0 0.0 0.0 0.0 0.0 0.0 0.0TOTAL EXPENDITURE 129,394.9 2,679.9 2,939.8 6,438.3 117,336.9 6,796.7 1,107.1 3,029.1 1,473.1 12,133.0 504.7 1,639.5 6,536.9 13,599.0 13,162.3 9,585.9 183.6 911.0 1,652.8 1,548.5 5,330.9 135.2 2,064.3 1,875.8 14,440.6 4,715.3 2,659.5 847.0 1,785.1 1,293.0 1,757.0 6,570.0 113.2
1,268.02
VAT-based own resource 14,798.9 516.5 51.2 207.7 291.3 1,671.5 22.9 193.5 278.6 1,964.4 2,916.6 1,811.8 27.0 15.9 27.9 46.7 116.6 9.5 290.3 306.1 527.0 299.3 138.8 54.7 60.0 266.9 173.1 2,513.1 0.0GNI-based own resource 88,414.3 2,626.2 274.0 1,169.9 1,704.6 17,602.4 106.8 886.5 1,375.4 7,351.8 14,029.0 11,698.5 123.4 133.6 213.6 215.0 666.1 43.5 4,215.3 2,149.1 2,493.6 1,207.2 901.8 251.8 474.7 1,435.5 2,797.7 12,267.2 0.0UK correction 5.4 177.5 18.4 74.6 112.1 218.3 6.0 52.7 93.1 487.7 965.9 717.9 8.5 9.0 14.0 15.0 47.0 2.9 50.7 24.0 182.7 81.6 66.9 17.9 36.9 87.1 33.0 -3,595.9 0.0Lump Sum Reduction Granted for NL & SE -1.4 24.2 2.4 9.3 16.1 170.9 1.0 8.3 14.2 69.0 133.0 103.1 1.2 1.2 1.9 2.1 6.4 0.4 -625.0 19.1 23.5 10.8 8.2 2.4 4.5 12.6 -138.3 116.2 0.0JHA adjustment for Denmark, Ireland and the United Kingdom -0.3 1.1 0.1 0.4 -3.3 8.0 0.0 -2.1 0.7 3.3 6.3 4.9 0.1 0.1 0.1 0.1 0.3 0.0 1.9 0.9 1.0 0.5 0.4 0.1 0.2 0.6 1.2 -27.1 0.0
TOTAL national contribution 103,216.9 3,345.5 346.1 1,462.0 2,120.8 19,671.1 136.7 1,139.0 1,762.0 9,876.1 18,050.8 14,336.2 160.1 159.8 257.4 278.8 836.4 56.3 3,933.3 2,499.2 3,227.8 1,599.4 1,116.0 326.9 576.3 1,802.8 2,866.6 11,273.4 0.0Traditional own resources (TOR) (75%) 16,777.7 1,581.0 49.1 220.6 327.6 3,456.0 21.9 199.8 141.0 1,170.2 1,566.3 1,741.7 24.6 22.6 44.6 14.3 101.0 10.1 1,935.7 189.5 352.6 135.0 109.9 74.2 117.4 152.4 466.9 2,551.8 0.0Agricultural duties (100%) 0.0 0.0 0.0 0.0 0.0 0.0 0.0 0.0 0.0 0.0 0.0 0.0 0.0 0.0 0.0 0.0 0.0 0.0 0.0 0.0 0.0 0.0 0.0 0.0 0.0 0.0 0.0 0.0 0.0Sugar levies (100%) 175.6 8.8 0.5 4.9 4.5 36.1 0.0 0.0 1.9 6.7 51.1 5.3 0.0 0.0 1.1 0.0 2.6 0.0 9.7 4.2 18.0 0.1 1.1 0.0 1.8 1.0 3.6 12.7 0.0Customs duties (100%) 22,194.7 2,099.3 65.0 289.2 432.3 4,571.9 29.2 266.3 186.1 1,553.5 2,037.4 2,317.0 32.8 30.1 58.4 19.1 132.0 13.5 2,571.2 248.4 452.1 179.9 145.4 98.9 154.8 202.2 618.9 3,389.7 0.0
Amounts (25%) retained as TOR collection costs -5,592.6 -527.0 -16.4 -73.5 -109.2 -1,152.0 -7.3 -66.6 -47.0 -390.1 -522.1 -580.6 -8.2 -7.5 -14.9 -4.8 -33.7 -3.4 -645.2 -63.2 -117.5 -45.0 -36.6 -24.7 -39.1 -50.8 -155.6 -850.6 0.0
TOTAL own resources 119,994.7 4,926.5 395.2 1,682.5 2,448.3 23,127.1 158.6 1,338.7 1,903.0 11,046.3 19,617.2 16,078.0 184.8 182.3 302.0 293.1 937.4 66.5 5,868.9 2,688.7 3,580.4 1,734.4 1,225.9 401.1 693.7 1,955.2 3,333.6 13,825.2 0.0Surplus from previous year 4,539.4Surplus from EAGGF-Guarantee 0.0 p.m. amount of the 2010Surplus external aid guarantee fund 0.0 UK correction: 3,739.5Other revenue 5,465.9
TOTAL REVENUE 130,000.0
Gross National Income (GNI), EUR million* 13,172,954.7 384,068.4 38,535.4 151,018.0 251,300.2 2,768,548.0 15,556.8 140,376.0 202,141.3 1,056,941.0 2,106,703.0 1,633,443.3 19,697.7 20,192.0 30,099.2 27,824.4 95,535.7 6,684.1 643,351.0 310,038.3 361,657.5 172,518.2 131,586.7 36,557.9 68,801.8 197,761.0 416,503.1 1,885,514.9 43,463.8
Operating budgetary balance (EUR million) 0.00 -1,369.6 +725.4 +1,455.2 -836.6 -9,002.5 +350.4 +383.8 +4,622.6 +2,995.0 -6,405.8 -5,933.0 +6.9 +731.3 +1,368.0 -75.0 +4,418.3 +67.0 -2,214.0 -805.1 +10,975.1 +2,983.7 +1,451.5 +490.1 +1,160.6 -652.1 -1,325.4 -5,565.6 +111.9
Operating budgetary balance (% GNI) 0.00% -0.36% +1.88% +0.96% -0.33% -0.33% +2.25% +0.27% +2.29% +0.28% -0.30% -0.36% +0.03% +3.62% +4.55% -0.27% +4.62% +1.00% -0.34% -0.26% +3.03% +1.73% +1.10% +1.34% +1.69% -0.33% -0.32% -0.30% +0.26%
2011 (EUR million)

p.m.
Total earmarked other non-EU EU-27 BE BG CZ DK DE EE IE EL ES FR IT CY LV LT LU HU MT NL AT PL PT RO SI SK FI SE UK HR
1 SUSTAINABLE GROWTH 61,584.7 896.3 1,108.4 881.7 58,698.4 1,416.4 937.2 3,306.5 291.2 5,172.8 704.0 306.3 3,448.0 7,355.0 3,018.9 3,732.1 63.8 794.4 1,226.9 144.5 2,519.7 92.9 825.6 502.0 10,681.0 5,249.1 1,222.4 652.0 1,646.0 408.0 432.7 2,549.3 13.01.1 Competitiveness for growth and em 13,094.4 892.3 1,028.8 878.7 10,294.5 998.2 88.6 65.6 222.1 1,576.8 20.7 185.7 229.9 1,003.7 1,446.6 878.0 21.2 29.0 154.3 124.6 142.0 7.5 600.6 270.0 163.5 171.8 58.7 66.0 70.4 160.2 270.2 1,268.9 12.8
1.1.1 Seventh Research framework programme ( 8,538.6 520.0 838.1 621.6 6,558.9 610.1 14.2 33.3 142.1 1,047.2 8.1 103.7 142.3 783.4 883.7 570.1 12.0 5.9 9.4 24.9 38.2 3.5 475.3 157.7 58.5 70.5 17.0 29.1 8.8 119.1 210.9 980.0 9.6
1.1.2 Decommissioning (Direct research) 28.0 0.1 0.0 0.0 27.8 0.9 0.0 0.1 0.0 5.3 0.0 0.0 0.0 3.5 4.0 10.5 0.0 0.0 0.0 0.0 0.0 0.0 0.0 0.0 0.0 0.0 0.0 0.0 0.0 0.1 0.0 3.4 0.0
1.1.3 Ten 842.3 37.6 50.3 208.8 545.6 64.8 0.4 1.2 5.1 154.2 0.1 0.0 3.8 24.2 48.8 68.2 0.3 3.6 26.7 15.2 1.1 0.0 21.0 46.3 6.0 0.0 0.2 4.2 1.8 9.4 23.4 15.6 0.0
1.1.4 Galileo 406.4 2.2 0.6 0.7 402.9 6.5 0.0 0.0 0.0 110.5 0.0 0.0 0.0 1.5 193.5 45.1 0.0 0.0 0.0 0.6 0.0 0.0 1.0 0.0 0.0 0.1 0.0 0.0 0.0 0.0 0.0 43.8 0.0
1.1.5 Marco Polo 22.3 12.9 0.1 0.0 9.4 1.9 0.0 0.0 0.0 2.6 0.0 0.0 0.3 0.3 2.6 0.9 0.0 0.0 0.0 0.0 0.0 0.0 0.0 0.0 0.7 0.0 0.0 0.0 0.0 0.0 0.0 0.0 0.0
1.1.6 Lifelong Learning 1,448.4 211.9 0.2 20.2 1,216.1 73.6 18.8 26.2 16.1 135.2 8.9 15.0 41.4 115.1 141.2 128.1 5.8 11.4 15.7 3.4 20.0 2.6 49.6 32.8 83.4 40.7 37.5 11.5 20.9 22.9 22.5 115.8 0.7
1.1.7 Competitiveness and innovation framew 416.7 18.9 111.3 10.9 275.6 44.9 1.0 1.9 5.9 34.4 1.5 3.9 9.7 26.8 17.8 26.8 0.9 1.6 0.7 7.9 3.0 0.4 24.9 15.1 1.4 4.6 1.6 2.8 0.6 5.6 5.7 24.1 2.0
1.1.71 CIP Entrepreneurship and innovation 204.3 15.7 108.8 3.3 76.5 16.6 0.1 0.1 2.7 6.5 0.9 1.1 1.0 7.5 5.4 6.3 0.4 0.1 0.1 1.8 1.9 0.1 7.8 2.9 0.2 0.5 0.0 0.7 0.1 1.7 1.6 8.3 0.3
1.1.72 CIP ICT policy support 115.5 1.9 0.3 5.1 108.1 8.3 0.9 1.1 2.4 11.4 0.6 2.2 7.4 14.5 5.8 12.3 0.3 0.5 0.5 1.7 1.0 0.3 10.3 3.6 0.9 3.4 1.4 1.3 0.4 2.1 3.4 9.8 0.8
1.1.73 CIP Intelligent energy 97.0 1.4 2.2 2.4 91.0 20.0 0.0 0.7 0.7 16.5 0.0 0.5 1.3 4.7 6.6 8.2 0.2 1.1 0.1 4.3 0.1 0.1 6.8 8.6 0.3 0.8 0.1 0.7 0.1 1.8 0.7 6.1 1.0
1.1.8 Social policy agenda 174.0 2.0 0.1 3.8 168.1 55.6 1.3 1.0 1.7 12.5 0.3 0.8 2.9 4.4 12.7 8.9 1.1 0.1 0.7 35.5 1.1 0.2 6.5 3.0 1.3 0.8 0.6 1.1 0.8 0.6 1.3 11.1 0.3
1.1.9 Customs 2013 and Fiscalis 2013 68.5 0.4 17.9 2.4 47.8 34.5 0.4 0.5 0.5 1.0 0.3 0.3 0.5 0.4 0.4 0.6 0.3 0.3 0.3 2.6 0.4 0.3 0.4 0.3 0.5 0.5 0.4 0.4 0.3 0.6 0.6 0.3 0.2
1.1.10 Nuclear decommissioning 179.0 0.0 0.0 0.0 179.0 0.0 51.6 0.0 0.0 0.0 0.0 0.0 0.0 0.0 0.0 0.0 0.0 0.0 92.6 0.0 0.0 0.0 0.0 0.0 0.0 0.0 0.0 0.0 34.8 0.0 0.0 0.0 0.0
1.1.11 European Global Adjustment Funds 83.3 0.0 0.0 0.0 83.3 0.3 0.0 0.0 13.9 5.4 0.0 2.7 0.0 6.6 36.4 3.9 0.0 0.0 0.0 0.0 0.0 0.0 4.4 3.6 0.0 1.5 0.0 0.0 0.0 0.0 4.3 0.1 0.0
1.1.12 Energy projects to aid economic recover 183.7 0.0 0.0 0.0 183.7 3.3 0.0 0.3 25.4 13.0 0.0 25.6 0.0 18.0 25.8 5.3 0.0 1.9 0.9 0.9 8.4 0.0 8.5 7.7 8.0 0.0 0.0 9.0 1.4 0.0 0.0 20.2 0.0
1.1.DAG Decentralised agencies 263.4 16.1 0.0 0.0 247.3 12.3 0.0 0.0 0.0 39.9 0.0 20.3 24.8 13.3 31.5 0.0 0.0 3.2 5.9 0.0 0.0 0.0 0.0 0.0 0.0 51.6 0.0 7.2 0.0 0.0 0.0 37.3 0.0
1.1.OTH Other actions and programmes 439.8 70.2 10.4 10.2 349.1 89.6 0.9 1.1 11.3 15.5 1.4 13.4 4.1 6.0 48.0 9.4 0.9 0.8 1.3 33.6 69.9 0.5 9.0 3.5 3.5 1.6 1.3 0.8 1.0 1.9 1.5 17.0 0.0
1.2 Cohesion for growth and employmen 48,490.4 4.0 79.6 3.0 48,403.8 418.2 848.6 3,240.9 69.1 3,596.0 683.3 120.6 3,218.1 6,351.3 1,572.3 2,854.1 42.6 765.4 1,072.6 19.9 2,377.7 85.4 225.0 232.0 10,517.5 5,077.3 1,163.7 586.0 1,575.7 247.8 162.4 1,280.4 0.1
1.2.1 Structural funds 38,858.4 4.0 78.5 2.9 38,773.0 412.9 530.6 1,770.5 68.5 3,586.8 377.0 120.5 2,545.7 5,506.7 1,571.0 2,853.8 33.5 528.2 711.2 19.5 1,865.2 58.4 224.9 231.3 7,318.9 4,315.2 736.4 484.1 1,212.9 247.7 162.4 1,279.2 0.0
1.2.11 Convergence objective 30,438.2 0.0 0.0 0.0 30,438.2 153.3 525.7 1,665.3 0.0 2,222.0 368.2 19.1 2,362.1 3,995.8 273.3 1,967.1 0.0 518.8 697.0 0.0 1,481.9 58.4 4.1 15.3 7,266.9 4,126.5 710.4 465.4 1,143.0 11.0 0.0 387.6 0.0
1.2.12 Regional competitiveness and employmen 7,036.0 0.0 0.0 0.0 7,036.0 206.8 0.0 66.2 35.5 1,175.8 0.0 90.6 90.5 1,396.3 1,067.8 811.1 33.3 0.0 0.0 7.9 295.6 0.0 207.6 146.3 0.0 181.1 0.0 0.0 47.9 221.6 110.1 844.2 0.0
1.2.13 European territorial cooperation objectiv 1,315.6 3.9 73.1 0.0 1,238.6 26.7 4.9 39.0 32.2 166.1 8.8 10.6 93.1 114.5 228.7 74.8 0.0 9.4 14.1 7.8 87.6 0.0 12.6 69.1 51.9 7.5 26.0 18.7 21.9 15.1 52.3 45.2 0.0
1.2.14 Technical assistance 68.6 0.0 5.4 2.9 60.3 26.2 0.0 0.1 0.7 22.9 0.0 0.1 0.0 0.1 1.2 0.8 0.2 0.0 0.1 3.8 0.1 0.0 0.6 0.6 0.2 0.0 0.0 0.0 0.0 0.0 0.1 2.3 0.0
1.2.2 Cohesion Fund 9,626.2 0.0 1.0 0.0 9,625.2 4.8 317.9 1,470.3 0.2 8.2 306.2 0.1 672.4 844.4 0.3 0.1 9.1 237.3 361.2 0.4 512.1 27.0 0.1 0.0 3,198.5 762.0 427.2 101.7 362.7 0.0 0.0 1.1 0.0
1.2.DAG Decentralised agencies 0.0 0.0 0.0 0.0 0.0 0.0 0.0 0.0 0.0 0.0 0.0 0.0 0.0 0.0 0.0 0.0 0.0 0.0 0.0 0.0 0.0 0.0 0.0 0.0 0.0 0.0 0.0 0.0 0.0 0.0 0.0 0.0 0.0
1.2.OTH Other actions and programmes 5.8 0.0 0.0 0.1 5.6 0.5 0.1 0.1 0.4 1.1 0.1 0.0 0.0 0.2 1.1 0.2 0.0 0.0 0.1 0.0 0.4 0.0 0.0 0.7 0.1 0.1 0.1 0.1 0.1 0.1 0.0 0.1 0.1
2 PRESERVATION AND MANAGEMENT O 59,096.2 1,063.1 9.1 102.6 57,921.3 751.8 746.8 1,197.9 1,084.6 6,802.2 235.8 1,653.5 2,813.2 6,722.1 9,350.9 6,069.1 74.3 367.1 576.1 41.4 1,605.4 16.1 1,045.8 1,289.5 4,918.4 1,480.3 2,131.5 252.3 618.0 872.5 1,022.0 4,182.6 0.02.0.1 Market related expenditure and direct ai 44,859.1 966.1 4.4 0.6 43,888.0 630.0 428.8 771.0 956.8 5,460.7 95.0 1,308.9 2,412.9 5,602.6 8,383.1 4,687.0 50.5 130.6 334.5 22.4 1,149.3 5.8 917.1 747.1 2,849.6 800.1 1,026.1 125.4 334.4 551.5 711.3 3,395.6 0.0
2.0.11 Agriculture markets 44,554.2 960.2 1.5 0.3 43,592.2 618.2 426.2 768.8 954.4 5,446.4 91.8 1,289.7 2,409.2 5,544.9 8,353.2 4,660.0 46.4 127.2 331.2 20.8 1,145.7 5.7 911.4 744.4 2,840.4 772.9 1,024.4 124.3 332.9 550.7 709.9 3,340.8 0.0
Direct Aid 40,880.0 673.1 0.0 0.0 40,206.9 545.7 387.9 743.2 939.0 5,290.8 81.8 1,262.5 2,313.0 4,988.2 7,681.2 3,925.4 39.2 119.2 308.0 17.2 1,078.3 4.3 819.3 714.6 2,457.8 645.2 906.4 114.9 319.4 534.0 688.9 3,281.6 0.0
Export refunds 146.6 0.0 0.0 0.0 146.6 1.1 0.5 0.2 2.0 7.1 0.0 1.3 0.1 3.1 81.7 12.5 0.0 0.0 3.9 0.0 1.1 0.0 5.5 1.8 18.8 4.3 0.6 0.3 0.1 0.1 0.1 0.4 0.0
Storage 32.3 0.0 0.0 0.0 32.3 14.7 -4.0 0.5 1.4 12.2 -0.2 13.1 -4.6 -4.0 10.7 -20.9 0.2 -1.5 3.7 0.0 -3.1 -0.1 8.0 0.0 -14.8 -4.2 -11.4 -0.5 0.0 7.7 6.8 22.6 0.0
Other 3,495.1 287.0 1.5 0.3 3,206.3 56.7 41.7 24.9 12.0 136.3 10.1 12.8 100.7 557.7 579.6 743.0 7.0 9.4 15.7 3.6 69.5 1.6 78.6 28.1 378.6 127.7 128.9 9.5 13.4 8.9 14.1 36.1 0.0
2.0.12 Fisheries market 38.1 0.0 0.0 0.0 38.1 0.0 0.0 0.0 0.3 0.0 2.7 0.0 0.0 13.5 3.6 0.4 0.0 0.8 0.0 0.1 0.0 0.0 0.3 0.0 0.0 16.1 0.0 0.0 0.0 0.0 0.0 0.1 0.0
2.0.13 Animal and plant health 266.8 5.8 2.9 0.3 257.8 11.7 2.6 2.2 2.1 14.3 0.5 19.2 3.7 44.2 26.3 26.6 4.1 2.6 3.3 1.5 3.5 0.0 5.4 2.6 9.2 11.1 1.7 1.1 1.5 0.8 1.3 54.8 0.0
2.0.2 Rural development 13,261.0 89.7 2.1 0.0 13,169.3 70.8 306.8 419.0 62.7 1,310.9 129.3 325.7 367.7 876.4 934.3 1,321.0 19.9 213.2 235.3 10.8 441.4 9.0 102.3 536.5 1,996.5 648.0 1,101.9 122.1 282.0 302.6 293.2 730.1 0.0
2.0.3 European fisheries fund 480.7 0.0 0.4 0.0 480.3 7.1 8.9 4.8 15.7 6.0 11.3 14.3 26.9 194.6 9.5 0.0 2.2 22.0 5.5 0.2 8.8 0.7 8.0 0.7 63.0 28.2 0.0 3.4 0.0 5.9 0.0 32.7 0.0
2.0.4 Fisheries governance and international 173.7 0.0 0.8 97.1 75.7 6.7 0.1 0.0 7.7 3.7 0.2 3.7 0.1 11.5 4.8 10.7 0.6 0.2 0.2 0.7 0.0 0.4 4.0 0.0 0.5 2.7 0.2 0.1 0.0 2.6 6.9 7.2 0.0
2.0.5 Life+ 244.5 2.2 1.0 4.2 237.2 36.7 2.2 3.2 4.7 20.4 0.2 0.9 5.5 26.3 17.2 44.1 1.1 1.0 0.5 7.2 5.1 0.2 10.5 4.9 8.7 1.3 3.0 1.4 1.6 5.2 10.5 13.4 0.0
2.0.DAG Decentralised agencies 56.1 5.2 0.0 0.0 50.9 0.0 0.0 0.0 36.7 0.0 0.0 0.0 0.0 10.0 0.0 0.0 0.0 0.0 0.0 0.0 0.0 0.0 0.0 0.0 0.0 0.0 0.0 0.0 0.0 4.2 0.0 0.0 0.0
2.0.OTH Other actions and programmes 21.0 0.0 0.3 0.8 20.0 0.5 0.0 0.0 0.4 0.5 0.0 0.0 0.1 0.6 1.9 6.3 0.0 0.0 0.0 0.0 0.8 0.0 3.9 0.4 0.0 0.0 0.2 0.0 0.0 0.6 0.1 3.6 0.0
3 CITIZENSHIP, FREEDOM, SECURITY A 2,374.5 122.6 7.3 41.3 2,203.3 172.1 15.6 9.3 14.9 89.7 6.6 11.4 53.3 90.9 169.1 907.5 10.4 9.4 17.5 13.2 23.4 24.7 156.5 45.4 106.2 30.2 24.4 16.2 12.6 20.7 82.1 70.0 3.33.1 Freedom, security and justice 917.0 61.4 5.0 7.1 843.6 75.4 10.3 3.4 2.2 42.9 3.9 4.3 46.2 45.6 82.4 91.9 7.2 6.3 13.9 3.0 12.9 22.4 135.1 33.6 88.8 20.6 14.5 7.1 5.3 13.1 12.3 38.6 0.0
3.1.1 Solidarity and management of migration 475.5 48.4 0.0 5.4 421.7 16.2 6.8 2.1 1.3 33.3 3.1 2.8 42.4 39.1 38.8 75.3 6.7 4.2 13.1 1.8 11.7 18.3 8.8 11.1 17.7 5.6 10.9 5.5 4.2 12.0 11.0 18.0 0.0
3.1.2 Security and safeguarding liberties 61.4 4.7 0.9 0.0 55.7 7.2 1.7 0.5 0.5 4.1 0.4 1.1 2.4 3.8 1.3 9.2 0.3 1.2 0.6 0.4 0.9 0.0 9.5 0.7 0.7 0.2 1.7 1.3 0.9 0.2 0.9 4.1 0.0
3.1.3 Fundamental rights and justice 62.9 1.0 0.3 0.2 61.3 20.8 1.7 0.9 0.3 4.7 0.3 0.4 1.3 2.5 3.1 7.2 0.1 0.9 0.1 0.7 0.3 0.0 3.4 1.4 0.8 0.3 1.7 0.3 0.3 0.9 0.2 6.6 0.0
3.1.DAG Decentralised agencies 240.6 3.7 3.7 0.0 233.2 2.8 0.0 0.0 0.0 0.0 0.0 0.0 0.0 0.0 0.0 0.0 0.0 0.0 0.0 0.1 0.0 4.1 113.2 20.2 69.5 14.5 0.0 0.0 0.0 0.0 0.2 8.5 0.0
3.1.OTH Other actions and programmes 76.7 3.6 0.0 1.5 71.6 28.5 0.1 0.0 0.1 0.8 0.0 0.0 0.1 0.3 39.2 0.3 0.0 0.0 0.0 0.0 0.0 0.0 0.2 0.2 0.0 0.1 0.2 0.0 0.0 0.0 0.1 1.4 0.0
3.2 Citizenship 1,457.5 61.2 2.4 34.2 1,359.7 96.7 5.3 5.9 12.7 46.8 2.7 7.1 7.1 45.3 86.7 815.6 3.2 3.1 3.6 10.1 10.5 2.4 21.4 11.8 17.4 9.5 9.9 9.1 7.3 7.6 69.8 31.3 3.3
3.2.1 Public health and consumer protection 83.9 2.4 0.4 5.0 76.0 22.4 0.5 0.5 2.5 4.1 0.3 0.8 1.2 2.5 7.2 4.6 0.4 0.3 0.5 6.9 0.7 0.3 6.3 1.3 0.8 0.6 0.8 1.1 0.4 1.9 1.2 6.1 0.4
3.2.2 Culture 2007-2013 56.9 2.8 0.0 2.5 51.5 7.2 0.2 0.7 1.5 6.5 0.1 0.5 0.7 3.1 9.1 3.1 0.0 0.3 0.1 0.1 0.6 0.0 3.5 2.3 0.5 1.7 0.4 3.1 1.7 0.3 0.4 3.9 1.0
3.2.3 Youth in action 173.9 44.5 0.0 19.1 110.4 8.4 2.6 1.4 2.5 11.3 0.9 2.0 1.0 7.6 4.0 9.7 1.5 0.8 1.0 1.8 3.8 1.1 3.9 2.7 9.5 4.7 5.8 2.8 3.0 2.3 3.6 10.9 1.2
3.2.4 Media 2007 114.5 7.7 1.5 5.3 100.0 8.0 0.5 2.0 3.1 14.7 0.4 1.5 1.3 6.5 29.8 6.5 0.6 0.3 0.5 0.8 0.8 0.0 4.2 2.6 2.6 1.1 0.5 0.4 0.4 1.5 2.8 6.3 0.4
3.2.5 Europe for Citizens 28.6 0.2 0.0 0.4 27.9 3.8 0.4 0.5 0.4 3.6 0.0 0.1 0.3 0.8 4.0 2.8 0.2 0.5 0.3 0.0 3.3 0.1 0.3 0.8 2.0 0.0 0.7 0.4 0.9 0.2 0.2 1.2 0.2
3.2.6 Civil protection Financial instrument 16.6 0.7 0.4 0.2 15.4 0.0 0.1 0.0 1.7 1.1 0.3 0.0 1.2 0.6 0.6 3.9 0.0 0.0 0.0 0.0 0.0 0.3 1.3 0.7 0.0 0.1 0.0 0.5 0.0 0.3 2.1 0.4 0.0
3.2.7 Communication actions 88.4 0.9 0.0 1.6 85.9 22.7 0.9 0.8 0.5 4.4 0.6 1.0 1.2 2.2 30.6 3.7 0.4 0.8 0.8 0.5 1.1 0.5 1.5 0.8 1.9 1.3 1.3 0.7 0.9 1.0 1.3 2.3 0.0
3.2.8 European Solidarity Fund 726.2 0.0 0.0 0.0 726.2 0.0 0.0 0.0 0.0 0.0 0.0 0.0 0.0 21.1 0.0 705.2 0.0 0.0 0.0 0.0 0.0 0.0 0.0 0.0 0.0 0.0 0.0 0.0 0.0 0.0 0.0 0.0 0.0
3.2.DAG Decentralised agencies 134.7 1.3 0.0 0.0 133.4 0.0 0.0 0.0 0.0 0.0 0.0 0.0 0.0 0.0 0.0 75.2 0.0 0.0 0.0 0.0 0.0 0.0 0.0 0.0 0.0 0.0 0.0 0.0 0.0 0.0 58.2 0.0 0.0
3.2.OTH Other actions and programmes 33.8 0.7 0.0 0.1 33.0 24.3 0.1 0.0 0.4 0.9 0.0 1.2 0.1 0.9 1.3 0.8 0.0 0.1 0.4 0.0 0.0 0.0 0.4 0.6 0.1 0.0 0.4 0.1 0.0 0.1 0.1 0.4 0.0
4 THE EU AS A GLOBAL PARTNER 7,063.6 290.7 1,650.1 5,037.0 85.8 0.0 20.6 0.3 0.0 0.0 0.4 0.0 0.0 0.0 0.0 0.0 0.0 0.5 2.4 0.0 7.3 0.0 0.0 0.0 2.0 0.0 49.1 2.7 0.5 0.0 0.0 0.0 85.84.0.1 Instrument for Preaccession (IPA) 1,257.2 26.2 206.4 938.8 85.8 0.0 20.6 0.3 0.0 0.0 0.4 0.0 0.0 0.0 0.0 0.0 0.0 0.5 2.4 0.0 7.3 0.0 0.0 0.0 2.0 0.0 49.1 2.7 0.5 0.0 0.0 0.0 84.9
Other actions and programmes 5,806.4 264.5 1,443.8 4,098.2 0.0 0.0 0.0 0.0 0.0 0.0 0.0 0.0 0.0 0.0 0.0 0.0 0.0 0.0 0.0 0.0 0.0 0.0 0.0 0.0 0.0 0.0 0.0 0.0 0.0 0.0 0.0 0.0 0.9
5 ADMINISTRATION 8,564.4 459.2 488.2 176.5 7,440.5 4,628.8 12.3 15.5 50.1 180.5 7.3 42.1 38.3 89.3 351.4 248.2 6.1 8.1 9.7 1,331.1 21.4 7.4 95.7 19.0 28.2 29.3 18.2 8.6 9.7 22.9 29.2 132.0 1.56 COMPENSATIONS 0.0 0.0 0.0 0.0 0.0 0.0 0.0 0.0 0.0 0.0 0.0 0.0 0.0 0.0 0.0 0.0 0.0 0.0 0.0 0.0 0.0 0.0 0.0 0.0 0.0 0.0 0.0 0.0 0.0 0.0 0.0 0.0 0.0TOTAL EXPENDITURE 138,683.4 2,831.9 3,263.1 6,239.2 126,349.3 6,969.1 1,732.5 4,529.4 1,440.7 12,245.2 954.2 2,013.2 6,352.9 14,257.2 12,890.3 10,956.9 154.5 1,179.5 1,832.6 1,530.2 4,177.1 141.2 2,123.6 1,856.0 15,735.8 6,788.9 3,445.5 931.8 2,286.8 1,324.1 1,566.0 6,933.9 103.6
1,301.232.6%
VAT-based own resource 14,871.2 475.8 52.8 198.1 292.9 1,803.2 23.0 191.1 215.6 1,317.1 2,877.1 2,294.4 25.9 22.1 36.7 40.9 89.0 9.3 257.3 327.0 543.9 235.3 147.1 51.9 84.0 277.2 188.3 2,794.3 0.0GNI-based own resource 98,163.0 2,951.3 295.3 1,112.5 1,963.6 20,604.1 121.3 978.4 1,363.7 7,772.7 15,773.3 11,796.1 130.4 170.3 238.6 207.6 692.4 46.8 4,500.7 2,389.4 2,781.9 1,318.1 1,097.4 262.7 524.2 1,469.4 3,209.5 14,391.5 0.0UK correction -56.5 188.6 20.2 74.8 121.2 224.3 8.1 61.1 87.9 498.5 999.9 778.3 7.4 10.8 16.0 14.0 43.5 2.7 51.1 26.9 173.4 81.2 72.1 16.5 33.1 101.6 33.9 -3,803.6 0.0Lump Sum Reduction Granted for NL & SE 1.6 25.3 2.5 9.5 16.7 175.8 1.0 8.3 13.1 68.2 136.8 103.8 1.1 1.4 2.1 2.0 6.2 0.4 -638.8 20.3 24.4 10.6 8.9 2.3 4.6 13.2 -144.5 126.5 0.0JHA adjustment for Denmark, Ireland and the United Kingdom -2.8 1.8 0.2 0.7 -3.2 12.9 0.1 -3.2 1.0 5.1 9.9 7.6 0.1 0.1 0.1 0.1 0.5 0.0 3.0 1.5 1.7 0.8 0.6 0.2 0.3 0.9 2.0 -47.5 0.0
TOTAL national contribution 112,976.4 3,642.7 371.0 1,395.5 2,391.1 22,820.2 153.5 1,235.6 1,681.3 9,661.6 19,796.9 14,980.2 164.9 204.7 293.5 264.7 831.6 59.2 4,173.3 2,765.1 3,525.3 1,646.0 1,326.1 333.5 646.1 1,862.3 3,289.2 13,461.1 0.0Traditional own resources (TOR) (75%) 16,453.4 1,600.9 45.9 198.5 306.4 3,393.6 22.1 203.5 123.1 1,084.9 1,499.3 1,563.3 20.3 24.4 49.2 11.8 96.8 9.4 1,906.9 177.1 382.9 119.5 131.0 65.0 96.6 139.7 464.9 2,716.3 0.0Agricultural duties (100%) 0.0 0.0 0.0 0.0 0.0 0.0 0.0 0.0 0.0 0.0 0.0 0.0 0.0 0.0 0.0 0.0 0.0 0.0 0.0 0.0 0.0 0.0 0.0 0.0 0.0 0.0 0.0 0.0 0.0Sugar levies (100%) 256.7 27.9 0.7 11.0 5.4 48.7 0.0 0.0 1.9 10.6 50.8 7.0 0.0 0.0 2.5 0.0 3.8 0.0 12.9 7.7 31.0 0.1 3.1 0.0 6.1 1.9 7.0 16.4 0.0Customs duties (100%) 21,681.1 2,106.6 60.5 253.6 403.1 4,476.1 29.5 271.4 162.3 1,436.0 1,948.2 2,077.4 27.0 32.5 63.1 15.7 125.2 12.5 2,529.7 228.5 479.6 159.3 171.6 86.6 122.7 184.3 612.9 3,605.4 0.0
Amounts (25%) retained as TOR collection costs -5,484.5 -533.6 -15.3 -66.2 -102.1 -1,131.2 -7.4 -67.8 -41.0 -361.6 -499.8 -521.1 -6.8 -8.1 -16.4 -3.9 -32.3 -3.1 -635.6 -59.0 -127.6 -39.8 -43.7 -21.7 -32.2 -46.6 -155.0 -905.4 0.0
TOTAL own resources 129,429.8 5,243.6 416.9 1,594.0 2,697.5 26,213.8 175.7 1,439.2 1,804.5 10,746.5 21,296.2 16,543.6 185.2 229.1 342.7 276.4 928.4 68.6 6,080.2 2,942.2 3,908.3 1,765.5 1,457.1 398.5 742.8 2,001.9 3,754.1 16,177.5 0.0Surplus from previous year 1,497.0Surplus from EAGGF-Guarantee 0.0 p.m. amount of the 2011Surplus external aid guarantee fund 0.0 UK correction: 4,386.4Other revenue 8,613.8
TOTAL REVENUE 139,540.5
Gross National Income (GNI), EUR million* 13,417,862.2 395,096.1 40,031.2 150,810.0 256,551.9 2,822,208.0 16,932.2 142,620.0 195,430.3 1,046,296.0 2,123,735.0 1,611,767.0 18,874.8 22,068.2 32,312.9 28,358.8 94,491.4 6,913.3 648,536.0 320,153.6 370,114.3 164,316.6 131,441.3 35,736.5 70,706.8 200,836.0 436,521.3 2,035,002.9 42,550.8
Operating budgetary balance (EUR million) 0.00 -1,493.7 +1,329.7 +3,045.2 -1,126.0 -11,953.8 +785.3 +670.6 +4,544.9 +3,999.0 -8,297.5 -5,058.1 -25.2 +955.9 +1,514.0 -79.5 +3,280.4 +71.4 -2,364.5 -1,073.3 +11,997.2 +5,027.2 +2,031.6 +572.2 +1,597.0 -658.8 -1,925.1 -7,366.1 +102.0
Operating budgetary balance (% GNI) 0.00% -0.38% +3.32% +2.02% -0.44% -0.42% +4.64% +0.47% +2.33% +0.38% -0.39% -0.31% -0.13% +4.33% +4.69% -0.28% +3.47% +1.03% -0.36% -0.34% +3.24% +3.06% +1.55% +1.60% +2.26% -0.33% -0.44% -0.36% +0.24%
2012 (EUR million)

Total
1 SUSTAINABLE GROWTH 71,238.21.1 Competitiveness for growth and em 14,306.9
1.1.1 Seventh Research framework programme ( 9,590.4
1.1.2 Decommissioning (Direct research) 28.5
1.1.3 Ten 809.9
1.1.4 Galileo 396.4
1.1.5 Marco Polo 21.7
1.1.6 Lifelong Learning 1,524.3
1.1.7 Competitiveness and innovation framew 577.0
1.1.71 CIP Entrepreneurship and innovation 341.1
1.1.72 CIP ICT policy support 137.1
1.1.73 CIP Intelligent energy 98.8
1.1.8 Social policy agenda 134.6
1.1.9 Customs 2013 and Fiscalis 2013 68.5
1.1.10 Nuclear decommissioning 180.4
1.1.11 European Global Adjustment Funds 42.0
1.1.12 Energy projects to aid economic recover 201.6
1.1.DAG Decentralised agencies 286.0
1.1.OTH Other actions and programmes 445.6
1.2 Cohesion for growth and employmen 56,931.3
1.2.1 Structural funds 45,014.6
1.2.11 Convergence objective 34,688.8
1.2.12 Regional competitiveness and employmen 8,678.4
1.2.13 European territorial cooperation objectiv 1,578.9
1.2.14 Technical assistance 68.5
1.2.2 Cohesion Fund 11,910.3
1.2.DAG Decentralised agencies 0.0
1.2.OTH Other actions and programmes 6.4
2 PRESERVATION AND MANAGEMENT O 59,524.22.0.1 Market related expenditure and direct ai 45,275.0
2.0.11 Agriculture markets 45,011.7
Direct Aid 41,658.3
Export refunds 62.3
Storage 31.6
Other 3,259.5
2.0.12 Fisheries market 20.5
2.0.13 Animal and plant health 242.8
2013 (EUR million)

2.0.2 Rural development 13,156.1
2.0.3 European fisheries fund 567.3
2.0.4 Fisheries governance and international 184.6
2.0.5 Life+ 268.6
2.0.DAG Decentralised agencies 59.5
2.0.OTH Other actions and programmes 13.0
3 CITIZENSHIP, FREEDOM, SECURITY A 1,883.13.1 Freedom, security and justice 1,122.0
3.1.1 Solidarity and management of migration 607.8
3.1.2 Security and safeguarding liberties 71.5
3.1.3 Fundamental rights and justice 65.7
3.1.DAG Decentralised agencies 274.5
3.1.OTH Other actions and programmes 102.5
3.2 Citizenship 761.1
3.2.1 Public health and consumer protection 76.2
3.2.2 Culture 2007-2013 60.1
3.2.3 Youth in action 199.5
3.2.4 Media 2007 120.4
3.2.5 Europe for Citizens 27.8
3.2.6 Civil protection Financial instrument 14.1
3.2.7 Communication actions 82.3
3.2.8 European Solidarity Fund 14.3
3.2.DAG Decentralised agencies 133.8
3.2.OTH Other actions and programmes 32.6
4 THE EU AS A GLOBAL PARTNER 7,055.24.0.1 Instrument for Preaccession (IPA) 1,296.6
Other actions and programmes 5,758.7
5 ADMINISTRATION 8,693.26 COMPENSATIONS 75.0TOTAL EXPENDITURE 148,468.9
VAT-based own resourceGNI-based own resourceUK correctionLump Sum Reduction Granted for NL & SEJHA adjustment for Denmark, Ireland and the United Kingdom
TOTAL national contributionTraditional own resources (TOR) (75%)Agricultural duties (100%)Sugar levies (100%)Customs duties (100%)

Amounts (25%) retained as TOR collection costs
TOTAL own resourcesSurplus from previous yearSurplus from EAGGF-GuaranteeSurplus external aid guarantee fundOther revenue
TOTAL REVENUE
Gross National Income (GNI), EUR million*
Operating budgetary balance (EUR million)Operating budgetary balance (% GNI)
* GNI figures are based on ESA 2010

earmarked other non-EU EU-28 BE BG
2,020.4 1,062.5 962.3 67,193.1 1,566.0 986.41,409.6 982.6 958.2 10,956.5 1,101.0 95.4
1,024.3 668.9 660.3 7,237.0 753.3 11.6
0.1 0.0 0.0 28.4 0.9 0.0
48.8 14.5 209.8 536.8 54.8 0.3
0.0 1.0 1.1 394.3 1.0 0.1
4.2 1.7 0.0 15.8 0.0 0.7
217.2 0.3 47.7 1,259.2 61.5 14.4
30.8 152.5 14.2 379.5 44.0 2.2
27.0 136.3 8.2 169.6 19.0 1.4
3.0 8.6 4.8 120.8 9.0 0.8
0.8 7.6 1.2 89.1 15.9 0.1
0.9 0.3 3.5 129.9 52.6 0.9
1.1 21.0 8.8 37.6 26.6 0.3
0.0 0.0 0.0 180.4 0.0 64.2
0.0 0.0 0.0 42.0 0.5 0.0
0.0 0.0 0.0 201.6 0.0 0.0
19.7 114.0 0.0 152.3 13.3 0.0
62.6 8.5 12.7 361.8 92.5 0.8
610.8 79.9 4.1 56,236.5 465.0 891.0
603.4 79.2 3.7 44,328.3 459.2 748.7
409.7 0.0 0.0 34,279.2 131.3 744.0
188.5 0.0 0.0 8,489.9 274.9 0.0
5.1 74.1 0.0 1,499.7 28.6 4.7
0.1 5.1 3.7 59.6 24.4 0.0
7.4 0.8 0.3 11,901.8 5.3 142.3
0.0 0.0 0.0 0.0 0.0 0.0
0.0 0.0 0.1 6.4 0.5 0.0
1,511.2 10.8 105.2 57,897.0 736.8 943.21,367.9 6.0 1.2 43,900.0 633.7 541.0
1,364.4 3.1 0.2 43,644.0 619.5 538.9
1,102.2 0.0 0.0 40,556.1 566.8 494.4
0.0 0.0 0.0 62.3 0.2 0.4
0.0 0.0 0.0 31.6 2.2 0.0
262.2 3.1 0.2 2,994.0 50.4 44.0
0.0 0.1 0.0 20.5 0.1 0.0
3.5 2.8 0.9 235.5 14.1 2.2

133.8 1.8 0.0 13,020.5 57.2 393.2
0.0 0.6 0.0 566.6 2.9 5.9
0.0 1.6 99.7 83.3 6.3 0.1
4.0 0.8 4.1 259.8 36.1 2.9
5.2 0.0 0.0 54.3 0.0 0.0
0.3 0.0 0.3 12.5 0.7 0.0
157.9 6.3 44.2 1,674.6 172.0 15.267.6 4.3 8.4 1,041.7 88.7 11.9
49.1 0.0 8.0 550.6 22.1 9.6
2.5 0.8 0.0 68.1 6.9 1.3
1.5 0.3 0.0 63.9 19.2 1.0
10.5 3.1 0.0 260.9 2.5 0.0
3.9 0.1 0.3 98.2 38.0 0.1
90.3 2.0 35.8 633.0 83.3 3.2
0.8 0.4 3.6 71.5 20.4 0.4
6.1 0.0 1.5 52.5 7.2 0.4
68.7 0.1 5.7 125.0 7.3 0.5
9.8 0.9 5.3 104.5 7.2 0.5
0.3 0.0 0.5 26.9 3.8 0.4
0.1 0.6 0.5 12.8 0.9 0.1
2.1 0.0 2.0 78.1 26.6 0.9
0.0 0.0 0.0 14.3 0.0 0.0
1.7 0.0 0.0 132.2 0.0 0.0
0.7 0.0 16.7 15.2 9.8 0.0
243.5 1,518.7 5,077.1 216.0 0.0 16.215.4 295.0 772.4 213.8 0.0 16.2
228.1 1,223.6 4,304.7 2.3 0.0 0.0
457.9 465.8 169.1 7,600.4 4,734.7 15.90.0 0.0 0.0 75.0 0.0 0.0
4,390.9 3,064.1 6,357.9 134,656.1 7,209.5 1,976.9
VAT-based own resource 14,019.7 476.9 60.0GNI-based own resource 110,194.6 3,198.0 336.0UK correction 169.9 229.1 24.0Lump Sum Reduction Granted for NL & SE -5.8 25.5 2.6JHA adjustment for Denmark, Ireland and the United Kingdom -0.1 1.7 0.2
TOTAL national contribution 124,378.3 3,931.3 422.8Traditional own resources (TOR) (75%) 15,365.3 1,359.5 54.7Agricultural duties (100%) 0.0 0.0 0.0Sugar levies (100%) 268.8 11.9 0.5Customs duties (100%) 20,218.3 1,800.8 72.4

Amounts (25%) retained as TOR collection costs -5,121.8 -453.2 -18.2
TOTAL own resources 139,743.6 5,290.8 477.6Surplus from previous year 1,053.6Surplus from EAGGF-Guarantee 0.0 p.m. amount of the 2012Surplus external aid guarantee fund 0.0 UK correction:Other revenue 8,706.4
TOTAL REVENUE 149,503.7
Gross National Income (GNI), EUR million* 13,536,988.7 391,280.6 40,250.8
Operating budgetary balance (EUR million) 0.00 -1,541.1 +1,529.0
Operating budgetary balance (% GNI) 0.00% -0.39% +3.80%

CZ DK DE EE IE EL ES
3,652.8 323.8 6,134.5 707.5 291.0 4,476.9 6,636.190.8 252.2 1,562.7 26.3 193.7 244.8 1,030.1
43.3 163.9 1,143.2 15.1 109.5 160.5 795.7
1.0 0.0 5.9 0.0 0.0 0.0 2.4
0.4 28.4 108.9 0.1 5.1 8.8 25.1
6.3 0.1 50.7 0.0 0.1 0.0 3.4
0.0 0.0 1.5 0.0 0.0 0.1 1.3
27.1 24.0 163.7 7.7 18.0 32.0 116.1
3.3 8.3 50.1 2.0 4.9 13.0 37.8
1.6 4.1 24.4 0.5 2.5 4.0 18.8
0.9 3.5 12.2 1.2 2.1 7.4 16.1
0.9 0.7 13.5 0.3 0.4 1.7 2.9
0.5 1.4 10.1 0.4 1.4 0.7 3.4
0.3 0.3 0.2 0.2 0.2 0.4 0.3
0.0 0.0 0.0 0.0 0.0 0.0 0.0
0.0 1.4 0.0 0.0 0.0 0.0 2.1
7.7 0.8 9.4 0.0 33.0 0.0 21.7
0.0 0.0 6.0 0.0 20.1 25.8 14.8
0.7 23.5 13.2 0.8 1.3 3.5 5.9
3,562.0 71.6 4,571.8 681.2 97.3 4,232.0 5,606.1
2,179.1 71.3 4,560.8 355.9 86.8 3,169.7 4,963.7
2,116.3 0.0 2,522.6 355.9 9.0 2,970.2 3,674.4
43.2 46.7 1,842.5 0.0 73.1 127.1 1,132.1
19.6 24.1 174.5 0.0 4.5 72.2 156.4
0.1 0.5 21.2 0.0 0.2 0.2 0.7
1,382.9 0.1 8.6 325.3 10.4 1,062.3 641.8
0.0 0.0 0.0 0.0 0.0 0.0 0.0
0.0 0.2 2.4 0.0 0.1 0.0 0.6
1,211.1 1,046.7 6,636.0 236.8 1,529.1 2,651.1 6,901.6839.3 934.9 5,355.9 97.2 1,263.2 2,349.2 5,646.4
837.8 931.3 5,343.3 95.5 1,248.6 2,346.5 5,603.1
824.1 924.1 5,240.9 91.9 1,240.9 2,281.4 4,970.8
0.0 0.5 2.4 0.0 0.1 0.0 0.7
0.0 0.3 1.2 0.0 1.2 0.0 17.4
13.7 6.4 98.9 3.5 6.4 65.1 614.1
0.0 0.4 0.0 1.4 0.0 0.0 7.8
1.5 3.3 12.6 0.4 14.6 2.7 35.6

370.8 61.1 1,250.8 125.5 259.2 229.3 1,131.9
0.0 2.1 15.5 12.1 2.0 58.0 67.7
0.0 6.6 3.3 0.4 3.5 5.6 11.5
1.0 5.2 10.3 1.2 1.2 7.8 34.8
0.0 36.8 0.0 0.0 0.0 0.0 8.9
0.0 0.0 0.2 0.3 0.0 1.1 0.5
13.2 14.5 92.1 21.5 12.5 45.5 119.59.0 2.5 35.0 19.9 5.8 36.6 93.9
7.7 0.9 26.1 7.0 3.3 33.5 87.7
0.8 0.9 4.5 0.5 1.3 1.7 3.4
0.4 0.5 3.8 1.2 0.9 1.2 2.6
0.0 0.0 0.0 10.7 0.0 0.0 0.0
0.0 0.2 0.5 0.5 0.3 0.2 0.3
4.3 12.0 57.2 1.6 6.6 8.9 25.6
0.5 1.7 5.4 0.4 0.8 0.7 2.4
0.4 0.5 5.4 0.1 0.5 0.7 3.5
0.2 3.3 18.0 0.2 3.1 3.3 8.9
2.0 4.7 16.5 0.4 1.1 1.4 5.7
0.3 0.1 3.1 0.0 0.1 0.5 0.6
0.0 0.4 1.9 0.0 0.0 1.1 1.5
0.9 0.6 5.3 0.5 0.9 1.2 2.8
0.0 0.0 0.0 0.0 0.0 0.0 0.0
0.0 0.0 0.0 0.0 0.0 0.0 0.0
0.0 0.8 1.6 0.0 0.2 0.0 0.1
0.0 0.0 0.0 0.0 0.0 0.0 0.00.0 0.0 0.0 0.0 0.0 0.0 0.0
0.0 0.0 0.0 0.0 0.0 0.0 0.0
15.9 49.8 193.5 7.6 41.8 41.1 94.90.0 0.0 0.0 0.0 0.0 0.0 0.0
4,893.1 1,434.8 13,056.2 973.3 1,874.3 7,214.6 13,752.2
199.8 290.4 1,804.1 24.9 202.2 204.2 1,292.11,152.4 2,153.0 23,848.5 154.0 1,234.2 1,480.7 8,415.7
83.0 149.6 278.8 10.1 78.4 96.4 595.19.2 16.9 181.1 1.1 8.8 12.0 68.10.6 -3.9 12.6 0.1 -3.0 0.9 4.7
1,445.0 2,606.0 26,125.1 190.3 1,520.6 1,794.2 10,375.6171.7 293.3 3,251.1 21.7 210.6 112.3 993.10.0 0.0 0.0 0.0 0.0 0.0 0.010.1 6.8 64.1 0.0 0.0 1.9 7.4218.8 384.3 4,270.7 28.9 280.8 147.8 1,316.7

-57.2 -97.8 -1,083.7 -7.2 -70.2 -37.4 -331.01,616.6 2,899.4 29,376.2 211.9 1,731.2 1,906.4 11,368.7
p.m. amount of the 2012UK correction: 5,276.4
146,187.0 261,989.3 2,881,862.0 18,266.5 148,710.0 182,378.8 1,041,940.0
+3,401.1 -1,277.1 -13,824.8 +771.4 +279.1 +5,340.7 +3,058.3
+2.33% -0.49% -0.48% +4.22% +0.19% +2.93% +0.29%

FR HR IT CY LV LT LU
4,112.1 23.1 6,517.7 128.6 695.9 1,221.1 182.21,508.6 23.0 931.7 24.6 38.7 121.2 163.1
910.7 14.9 596.6 15.7 10.0 9.6 28.1
2.9 0.0 13.9 0.0 0.0 0.0 0.1
89.7 0.0 48.8 1.7 1.0 1.8 18.5
224.8 0.0 48.8 0.0 0.0 0.0 18.5
3.3 0.3 0.9 0.0 0.0 0.0 0.0
148.1 4.5 146.5 4.5 11.4 16.5 3.8
28.3 2.3 45.9 1.3 0.8 1.2 12.1
15.9 0.8 21.3 0.6 0.4 0.7 1.8
7.1 0.4 17.9 0.6 0.3 0.5 0.0
5.2 1.1 6.7 0.1 0.2 0.0 10.3
6.8 0.5 6.8 0.2 0.3 1.1 21.5
0.4 0.2 0.4 0.3 0.3 0.2 3.2
0.0 0.0 0.0 0.0 0.0 83.3 0.0
0.0 0.0 15.1 0.0 0.0 0.0 0.0
40.6 0.0 0.0 0.0 10.6 0.8 24.9
6.9 0.0 0.0 0.0 3.1 5.8 0.0
46.1 0.3 7.9 0.9 1.1 0.9 32.3
2,603.4 0.1 5,585.9 104.0 657.2 1,099.9 19.1
2,603.0 0.0 5,585.5 100.4 428.5 723.9 18.6
572.7 0.0 4,257.0 0.0 418.8 712.3 0.0
1,744.4 0.0 1,213.6 100.4 0.0 0.0 8.1
283.8 0.0 114.7 0.0 9.6 11.5 7.3
2.1 0.0 0.2 0.0 0.0 0.0 3.3
0.2 0.0 0.0 3.5 228.7 376.0 0.5
0.0 0.0 0.0 0.0 0.0 0.0 0.0
0.3 0.0 0.4 0.0 0.0 0.0 0.0
9,619.4 2.4 5,600.0 77.2 351.2 621.7 51.48,582.8 0.1 4,183.7 52.1 151.1 358.6 38.9
8,554.1 0.1 4,162.2 50.5 148.6 357.4 36.8
7,955.2 0.0 3,515.0 43.8 132.9 345.6 33.6
42.2 0.0 6.7 0.0 0.0 0.3 0.0
5.8 0.0 0.0 0.0 0.0 -0.8 0.0
550.9 0.1 640.5 6.6 15.6 12.3 3.2
3.9 0.0 0.7 0.0 0.8 0.0 0.1
24.8 0.0 20.8 1.6 1.7 1.2 2.0

978.3 0.0 1,266.1 23.0 181.7 250.1 10.7
34.7 2.2 77.5 0.1 16.0 11.2 0.2
7.3 0.2 13.7 0.1 0.3 0.3 1.1
15.2 0.0 56.0 2.0 2.1 1.6 0.5
0.0 0.0 0.0 0.0 0.0 0.0 0.0
1.1 0.0 2.9 0.0 0.0 0.0 0.0
168.2 43.1 179.6 8.3 7.8 28.7 14.285.8 40.0 68.0 4.9 5.9 24.7 4.2
65.4 0.0 48.9 4.3 4.8 22.9 2.5
1.3 0.0 11.7 0.3 0.8 1.7 1.0
2.9 0.0 6.9 0.3 0.2 0.2 0.2
2.7 0.0 0.0 0.0 0.0 0.0 0.6
13.4 40.0 0.4 0.0 0.1 0.0 0.0
82.4 3.1 111.6 3.4 2.0 3.9 9.9
7.7 0.4 3.8 0.2 0.2 0.3 7.6
9.0 0.5 4.0 0.1 0.3 0.3 0.0
7.0 0.8 13.0 1.9 0.1 1.4 0.6
33.4 0.4 7.7 0.1 0.3 0.4 0.8
4.7 0.7 2.6 0.1 0.3 0.5 0.0
0.3 0.0 2.5 0.5 0.0 0.0 0.1
19.7 0.0 3.6 0.4 0.7 0.8 0.8
0.0 0.0 0.0 0.0 0.0 0.0 0.0
0.0 0.0 73.9 0.0 0.0 0.0 0.0
0.7 0.1 0.5 0.0 0.0 0.1 0.0
0.0 137.6 0.0 0.0 0.0 0.0 0.00.0 135.3 0.0 0.0 0.0 0.0 0.0
0.0 2.3 0.0 0.0 0.0 0.0 0.0
339.7 8.7 257.0 13.0 8.3 9.8 1,350.40.0 75.0 0.0 0.0 0.0 0.0 0.0
14,239.3 290.0 12,554.3 227.1 1,063.2 1,881.2 1,598.2
2,837.1 32.1 1,732.2 24.2 26.5 43.4 42.917,685.4 180.5 13,003.8 135.6 206.1 284.2 246.4
1,204.2 12.7 902.3 9.2 14.0 19.5 18.9138.2 1.4 102.7 1.1 1.5 2.2 2.2
9.5 0.0 7.2 0.1 0.1 0.1 0.121,874.4 226.8 15,748.1 170.0 248.3 349.4 310.5
1,417.2 11.5 1,419.8 14.8 20.7 55.3 11.30.0 0.0 0.0 0.0 0.0 0.0 0.054.5 0.0 10.2 0.0 0.0 6.8 0.0
1,835.1 15.3 1,882.9 19.7 27.6 67.0 15.1

-472.4 -3.8 -473.3 -4.9 -6.9 -18.4 -3.823,291.6 238.2 17,167.9 184.8 269.0 404.8 321.8
2,150,372.0 42,732.2 1,606,156.2 17,566.1 23,182.9 34,045.9 28,763.1
-8,445.7 +49.6 -3,789.9 +40.4 +801.2 +1,514.5 -69.4
-0.39% +0.12% -0.24% +0.23% +3.46% +4.45% -0.24%

HU MT NL AT PL PT RO
4,086.8 120.7 1,054.0 531.5 10,848.4 4,568.3 3,022.2178.3 10.8 659.9 240.5 190.4 133.3 69.0
40.2 4.8 560.3 172.9 67.5 86.3 17.5
0.0 0.0 0.0 0.0 0.0 0.0 0.0
7.5 0.7 5.9 13.6 2.2 0.0 0.0
0.0 0.0 1.4 0.1 0.1 0.1 0.0
0.0 0.0 4.9 1.5 0.0 0.8 0.0
29.2 3.5 43.5 21.9 94.3 26.1 42.9
1.7 0.5 28.6 16.0 7.0 7.0 3.6
0.8 0.2 10.2 4.3 5.1 1.7 2.1
0.8 0.3 12.1 3.4 1.5 3.3 1.2
0.1 0.0 6.3 8.3 0.3 2.0 0.3
0.5 0.5 5.5 2.0 0.7 0.6 0.5
0.4 0.2 0.4 0.2 0.3 0.4 0.3
0.0 0.0 0.0 0.0 0.0 0.0 0.0
0.0 0.0 0.0 9.1 0.0 0.0 2.9
4.3 0.0 1.6 0.0 15.7 3.4 0.0
0.0 0.0 0.0 0.0 0.0 7.3 0.0
94.6 0.6 7.7 3.2 2.8 1.2 1.3
3,908.5 109.9 394.1 291.1 10,658.0 4,435.0 2,953.2
2,395.2 76.3 393.8 290.7 7,115.3 3,452.6 1,990.7
1,930.6 76.3 0.0 30.1 7,050.2 3,263.7 1,922.0
320.7 0.0 379.8 151.5 0.0 167.0 0.0
143.9 0.0 11.3 108.3 64.9 21.7 68.6
0.1 0.0 2.7 0.7 0.2 0.1 0.1
1,513.0 33.6 0.3 0.0 3,542.5 982.4 962.5
0.0 0.0 0.0 0.0 0.0 0.0 0.0
0.2 0.0 0.0 0.4 0.2 0.0 0.0
1,778.3 17.4 954.1 1,262.8 5,157.2 1,532.9 2,459.11,276.3 4.3 828.7 729.3 3,208.7 781.4 1,211.2
1,272.1 4.3 821.4 728.0 3,186.3 767.3 1,208.3
1,203.4 3.3 775.8 706.1 2,769.5 647.1 1,086.8
0.8 0.0 2.0 0.2 3.7 1.1 0.8
0.0 0.0 2.8 0.1 0.1 0.0 0.0
67.9 1.0 40.8 21.7 412.9 119.0 120.7
0.0 0.0 0.3 0.0 0.0 4.8 0.0
4.2 0.0 7.0 1.3 22.4 9.2 2.9

491.1 9.6 99.5 526.9 1,821.0 710.6 1,191.6
4.2 1.6 6.1 0.5 116.7 35.3 55.4
0.0 0.5 3.0 0.0 0.6 1.0 0.0
5.4 1.4 15.9 5.9 10.2 4.7 0.8
0.0 0.0 0.0 0.0 0.0 0.0 0.0
1.3 0.0 0.9 0.3 0.0 0.0 0.0
22.3 29.1 163.5 46.6 124.5 30.6 27.813.5 27.0 142.7 35.6 105.9 26.6 16.9
11.4 17.4 26.4 10.2 18.7 8.4 13.9
1.0 0.1 8.2 1.5 1.8 2.0 2.1
1.1 0.0 2.7 1.9 0.5 0.5 0.9
0.0 9.4 105.0 21.1 85.0 15.4 0.0
0.0 0.1 0.4 0.9 0.0 0.2 0.0
8.8 2.1 20.7 11.0 18.7 4.0 10.9
0.6 0.2 5.1 1.1 0.5 0.7 0.8
1.2 0.0 3.5 3.4 0.4 0.5 0.8
3.4 1.3 4.6 2.9 11.8 0.7 6.3
0.7 0.0 3.6 1.7 2.5 1.0 0.8
2.2 0.1 0.6 0.5 1.9 0.1 0.7
0.0 0.0 1.8 0.4 0.0 0.0 0.0
0.7 0.5 1.1 0.7 1.5 1.0 1.3
0.0 0.0 0.0 0.2 0.0 0.0 0.0
0.0 0.0 0.0 0.0 0.0 0.0 0.0
0.0 0.0 0.3 0.1 0.0 0.0 0.1
7.1 0.0 0.0 0.0 20.1 0.0 32.17.1 0.0 0.0 0.0 20.1 0.0 32.1
0.0 0.0 0.0 0.0 0.0 0.0 0.0
15.3 6.5 92.5 21.0 29.2 31.0 19.30.0 0.0 0.0 0.0 0.0 0.0 0.0
5,909.8 173.7 2,264.1 1,862.0 16,179.5 6,162.8 5,560.6
109.2 11.2 260.2 333.8 501.4 225.6 153.8751.2 62.0 5,074.5 2,639.1 3,083.2 1,347.4 1,122.0
53.3 3.9 60.5 32.2 219.7 94.6 83.36.2 0.4 -653.4 21.0 24.6 10.5 9.20.4 0.0 2.8 1.4 1.7 0.7 0.6
920.2 77.5 4,744.6 3,027.5 3,830.6 1,678.9 1,369.090.9 8.9 1,807.6 163.9 383.8 114.0 105.30.0 0.0 0.0 0.0 0.0 0.0 0.03.0 0.0 17.9 4.2 41.4 0.1 6.8
118.2 11.8 2,392.2 214.3 470.4 151.9 133.7

-30.3 -3.0 -602.5 -54.6 -127.9 -38.0 -35.11,011.1 86.4 6,552.1 3,191.4 4,214.4 1,793.0 1,474.3
97,619.6 7,259.1 644,231.0 322,289.2 380,001.5 167,717.7 140,743.4
+4,954.5 +88.0 -2,675.1 -1,251.7 +12,237.1 +4,416.7 +4,142.8
+5.08% +1.21% -0.42% -0.39% +3.22% +2.63% +2.94%

SI SK FI SE UK
580.3 1,439.2 548.4 630.7 2,106.944.5 58.4 180.3 341.5 1,441.6
21.8 10.2 118.4 241.2 1,114.0
0.0 0.0 0.0 0.0 1.1
1.7 0.3 27.9 50.9 32.5
0.0 0.0 0.1 0.0 38.9
0.0 0.0 0.0 0.5 0.0
15.3 12.4 18.8 31.0 120.6
3.6 1.1 6.3 9.5 36.8
2.0 0.6 2.5 4.2 17.9
1.0 0.4 2.4 3.0 11.4
0.6 0.1 1.3 2.4 7.6
1.2 0.5 0.6 0.6 8.2
0.2 0.3 0.4 0.5 0.2
0.0 32.8 0.0 0.0 0.1
0.0 0.0 5.3 5.5 0.0
0.0 0.0 0.0 0.0 27.2
0.0 0.0 0.0 0.0 49.2
0.7 0.8 2.5 1.9 12.9
535.8 1,380.8 368.1 289.2 665.3
425.3 812.1 368.0 288.7 664.5
411.2 757.0 0.0 0.0 353.7
0.0 40.6 334.7 250.5 239.0
14.1 14.5 33.2 37.6 70.0
0.0 0.0 0.1 0.6 1.9
110.4 568.7 0.0 0.0 0.4
0.0 0.0 0.0 0.0 0.0
0.0 0.0 0.1 0.5 0.4
194.8 566.0 893.7 906.7 3,958.262.0 365.0 540.6 695.3 3,168.9
60.7 363.6 540.0 694.3 3,123.9
51.6 354.3 530.4 682.0 3,084.2
0.0 0.0 0.0 0.0 0.2
0.0 0.0 0.0 1.1 0.3
9.1 9.2 9.6 11.2 39.2
0.0 0.0 0.0 0.0 0.2
1.3 1.4 0.7 1.1 44.9

125.4 195.3 327.6 181.0 751.9
4.3 3.1 7.6 10.2 13.4
0.1 0.0 1.5 8.2 8.2
2.9 2.6 7.2 10.8 14.4
0.0 0.0 8.6 0.0 0.0
0.0 0.0 0.7 1.1 1.3
27.3 11.0 29.2 91.9 115.16.9 5.0 20.7 22.2 82.0
4.6 3.7 19.1 20.4 49.9
1.6 0.7 0.4 1.0 9.5
0.6 0.3 0.5 0.3 13.1
0.0 0.0 0.0 0.0 8.5
0.0 0.3 0.6 0.4 1.0
20.4 6.0 8.5 69.7 33.1
1.0 0.3 1.0 0.8 6.2
1.9 0.4 0.7 2.2 4.4
2.2 2.7 4.3 3.2 11.7
0.2 0.3 1.3 2.7 7.1
0.3 1.4 0.2 0.4 0.7
0.0 0.0 0.4 0.8 0.1
0.6 0.8 0.7 1.4 2.3
14.1 0.0 0.0 0.0 0.0
0.0 0.0 0.0 58.3 0.0
0.0 0.0 0.0 0.0 0.5
2.9 0.0 0.0 0.0 0.02.9 0.0 0.0 0.0 0.0
0.0 0.0 0.0 0.0 0.0
8.3 9.9 25.5 31.7 128.10.0 0.0 0.0 0.0 0.0
813.6 2,026.1 1,496.8 1,661.0 6,308.3
52.2 67.9 285.3 198.6 2,527.3293.3 598.7 1,614.5 3,664.3 16,230.0
20.1 41.8 117.6 47.0 -4,329.52.3 4.8 13.2 -142.9 123.60.2 0.3 0.9 1.9 -41.9
368.1 713.4 2,031.5 3,768.9 14,509.557.5 85.9 127.6 442.6 2,558.80.0 0.0 0.0 0.0 0.00.0 4.7 4.0 -1.3 13.976.7 109.8 166.2 591.4 3,397.8

-19.2 -28.6 -42.5 -147.5 -852.9425.6 799.3 2,159.1 4,211.5 17,068.4
35,877.9 72,132.8 202,647.0 452,139.7 1,998,646.4
+429.2 +1,287.4 -604.0 -2,220.7 -8,641.7
+1.20% +1.78% -0.30% -0.49% -0.43%
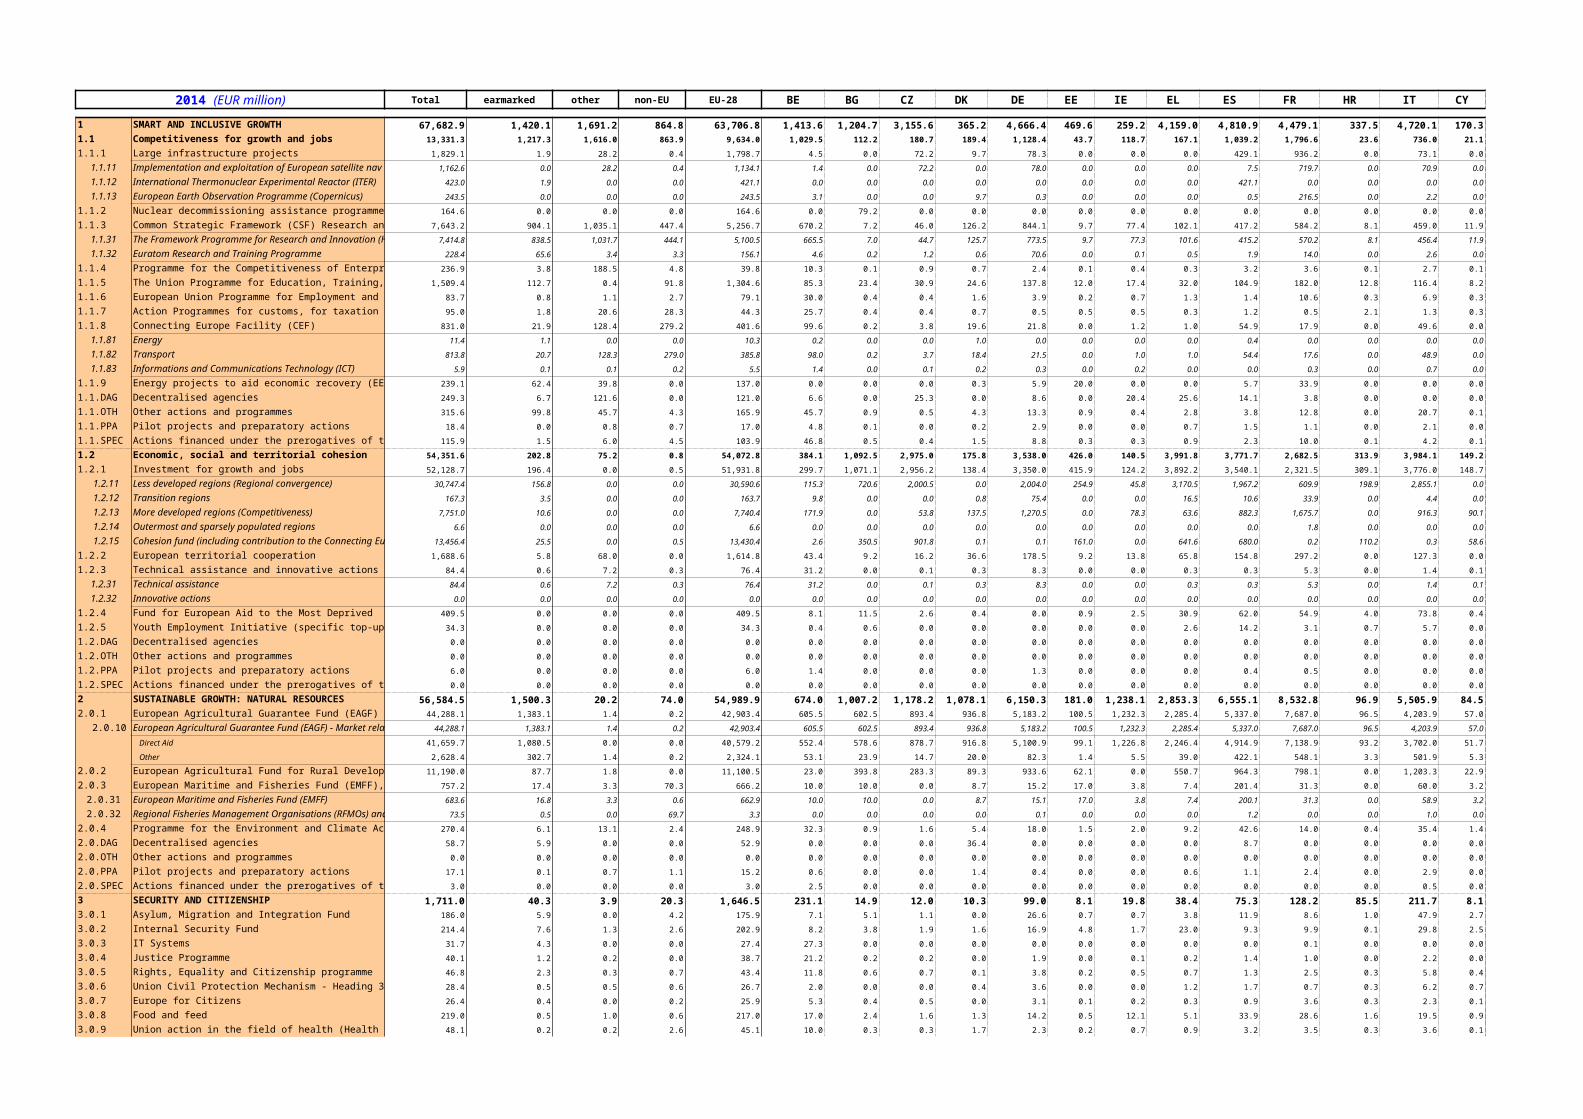
Total earmarked other non-EU EU-28 BE BG CZ DK DE EE IE EL ES FR HR IT CY LV LT
1 SMART AND INCLUSIVE GROWTH 67,682.9 1,420.1 1,691.2 864.8 63,706.8 1,413.6 1,204.7 3,155.6 365.2 4,666.4 469.6 259.2 4,159.0 4,810.9 4,479.1 337.5 4,720.1 170.3 806.7 1,214.21.1 Competitiveness for growth and jobs 13,331.3 1,217.3 1,616.0 863.9 9,634.0 1,029.5 112.2 180.7 189.4 1,128.4 43.7 118.7 167.1 1,039.2 1,796.6 23.6 736.0 21.1 26.4 77.2
1.1.1 Large infrastructure projects 1,829.1 1.9 28.2 0.4 1,798.7 4.5 0.0 72.2 9.7 78.3 0.0 0.0 0.0 429.1 936.2 0.0 73.1 0.0 0.0 0.0
1.1.11 Implementation and exploitation of European sa 1,162.6 0.0 28.2 0.4 1,134.1 1.4 0.0 72.2 0.0 78.0 0.0 0.0 0.0 7.5 719.7 0.0 70.9 0.0 0.0 0.0
1.1.12 International Thermonuclear Experimental Reacto 423.0 1.9 0.0 0.0 421.1 0.0 0.0 0.0 0.0 0.0 0.0 0.0 0.0 421.1 0.0 0.0 0.0 0.0 0.0 0.0
1.1.13 European Earth Observation Programme (Copern 243.5 0.0 0.0 0.0 243.5 3.1 0.0 0.0 9.7 0.3 0.0 0.0 0.0 0.5 216.5 0.0 2.2 0.0 0.0 0.0
1.1.2 Nuclear decommissioning assistance programme 164.6 0.0 0.0 0.0 164.6 0.0 79.2 0.0 0.0 0.0 0.0 0.0 0.0 0.0 0.0 0.0 0.0 0.0 0.0 49.6
1.1.3 Common Strategic Framework (CSF) Research an 7,643.2 904.1 1,035.1 447.4 5,256.7 670.2 7.2 46.0 126.2 844.1 9.7 77.4 102.1 417.2 584.2 8.1 459.0 11.9 3.9 4.8
1.1.31 The Framework Programme for Research and Inn 7,414.8 838.5 1,031.7 444.1 5,100.5 665.5 7.0 44.7 125.7 773.5 9.7 77.3 101.6 415.2 570.2 8.1 456.4 11.9 3.8 4.7
1.1.32 Euratom Research and Training Programme 228.4 65.6 3.4 3.3 156.1 4.6 0.2 1.2 0.6 70.6 0.0 0.1 0.5 1.9 14.0 0.0 2.6 0.0 0.1 0.1
1.1.4 Programme for the Competitiveness of Enterpris 236.9 3.8 188.5 4.8 39.8 10.3 0.1 0.9 0.7 2.4 0.1 0.4 0.3 3.2 3.6 0.1 2.7 0.1 0.3 0.1
1.1.5 The Union Programme for Education, Training, Y 1,509.4 112.7 0.4 91.8 1,304.6 85.3 23.4 30.9 24.6 137.8 12.0 17.4 32.0 104.9 182.0 12.8 116.4 8.2 14.9 17.5
1.1.6 European Union Programme for Employment and S 83.7 0.8 1.1 2.7 79.1 30.0 0.4 0.4 1.6 3.9 0.2 0.7 1.3 1.4 10.6 0.3 6.9 0.3 0.1 0.6
1.1.7 Action Programmes for customs, for taxation and 95.0 1.8 20.6 28.3 44.3 25.7 0.4 0.4 0.7 0.5 0.5 0.5 0.3 1.2 0.5 2.1 1.3 0.3 0.4 0.3
1.1.8 Connecting Europe Facility (CEF) 831.0 21.9 128.4 279.2 401.6 99.6 0.2 3.8 19.6 21.8 0.0 1.2 1.0 54.9 17.9 0.0 49.6 0.0 2.5 3.0
1.1.81 Energy 11.4 1.1 0.0 0.0 10.3 0.2 0.0 0.0 1.0 0.0 0.0 0.0 0.0 0.4 0.0 0.0 0.0 0.0 0.0 0.0
1.1.82 Transport 813.8 20.7 128.3 279.0 385.8 98.0 0.2 3.7 18.4 21.5 0.0 1.0 1.0 54.4 17.6 0.0 48.9 0.0 2.4 2.9
1.1.83 Informations and Communications Technology (I 5.9 0.1 0.1 0.2 5.5 1.4 0.0 0.1 0.2 0.3 0.0 0.2 0.0 0.0 0.3 0.0 0.7 0.0 0.1 0.0
1.1.9 Energy projects to aid economic recovery (EERP) 239.1 62.4 39.8 0.0 137.0 0.0 0.0 0.0 0.3 5.9 20.0 0.0 0.0 5.7 33.9 0.0 0.0 0.0 0.0 0.0
1.1.DAG Decentralised agencies 249.3 6.7 121.6 0.0 121.0 6.6 0.0 25.3 0.0 8.6 0.0 20.4 25.6 14.1 3.8 0.0 0.0 0.0 3.6 0.0
1.1.OTH Other actions and programmes 315.6 99.8 45.7 4.3 165.9 45.7 0.9 0.5 4.3 13.3 0.9 0.4 2.8 3.8 12.8 0.0 20.7 0.1 0.6 0.6
1.1.PPA Pilot projects and preparatory actions 18.4 0.0 0.8 0.7 17.0 4.8 0.1 0.0 0.2 2.9 0.0 0.0 0.7 1.5 1.1 0.0 2.1 0.0 0.1 0.0
1.1.SPEC Actions financed under the prerogatives of the 115.9 1.5 6.0 4.5 103.9 46.8 0.5 0.4 1.5 8.8 0.3 0.3 0.9 2.3 10.0 0.1 4.2 0.1 0.1 0.8
1.2 Economic, social and territorial cohesion 54,351.6 202.8 75.2 0.8 54,072.8 384.1 1,092.5 2,975.0 175.8 3,538.0 426.0 140.5 3,991.8 3,771.7 2,682.5 313.9 3,984.1 149.2 780.2 1,137.0
1.2.1 Investment for growth and jobs 52,128.7 196.4 0.0 0.5 51,931.8 299.7 1,071.1 2,956.2 138.4 3,350.0 415.9 124.2 3,892.2 3,540.1 2,321.5 309.1 3,776.0 148.7 766.5 1,118.7
1.2.11 Less developed regions (Regional convergence) 30,747.4 156.8 0.0 0.0 30,590.6 115.3 720.6 2,000.5 0.0 2,004.0 254.9 45.8 3,170.5 1,967.2 609.9 198.9 2,855.1 0.0 417.3 657.6
1.2.12 Transition regions 167.3 3.5 0.0 0.0 163.7 9.8 0.0 0.0 0.8 75.4 0.0 0.0 16.5 10.6 33.9 0.0 4.4 0.0 0.0 0.0
1.2.13 More developed regions (Competitiveness) 7,751.0 10.6 0.0 0.0 7,740.4 171.9 0.0 53.8 137.5 1,270.5 0.0 78.3 63.6 882.3 1,675.7 0.0 916.3 90.1 0.0 0.0
1.2.14 Outermost and sparsely populated regions 6.6 0.0 0.0 0.0 6.6 0.0 0.0 0.0 0.0 0.0 0.0 0.0 0.0 0.0 1.8 0.0 0.0 0.0 0.0 0.0
1.2.15 Cohesion fund (including contribution to the Con 13,456.4 25.5 0.0 0.5 13,430.4 2.6 350.5 901.8 0.1 0.1 161.0 0.0 641.6 680.0 0.2 110.2 0.3 58.6 349.2 461.1
1.2.2 European territorial cooperation 1,688.6 5.8 68.0 0.0 1,614.8 43.4 9.2 16.2 36.6 178.5 9.2 13.8 65.8 154.8 297.2 0.0 127.3 0.0 8.9 9.5
1.2.3 Technical assistance and innovative actions 84.4 0.6 7.2 0.3 76.4 31.2 0.0 0.1 0.3 8.3 0.0 0.0 0.3 0.3 5.3 0.0 1.4 0.1 0.0 0.1
1.2.31 Technical assistance 84.4 0.6 7.2 0.3 76.4 31.2 0.0 0.1 0.3 8.3 0.0 0.0 0.3 0.3 5.3 0.0 1.4 0.1 0.0 0.1
1.2.32 Innovative actions 0.0 0.0 0.0 0.0 0.0 0.0 0.0 0.0 0.0 0.0 0.0 0.0 0.0 0.0 0.0 0.0 0.0 0.0 0.0 0.0
1.2.4 Fund for European Aid to the Most Deprived 409.5 0.0 0.0 0.0 409.5 8.1 11.5 2.6 0.4 0.0 0.9 2.5 30.9 62.0 54.9 4.0 73.8 0.4 4.5 8.5
1.2.5 Youth Employment Initiative (specific top-up allo 34.3 0.0 0.0 0.0 34.3 0.4 0.6 0.0 0.0 0.0 0.0 0.0 2.6 14.2 3.1 0.7 5.7 0.0 0.3 0.3
1.2.DAG Decentralised agencies 0.0 0.0 0.0 0.0 0.0 0.0 0.0 0.0 0.0 0.0 0.0 0.0 0.0 0.0 0.0 0.0 0.0 0.0 0.0 0.0
1.2.OTH Other actions and programmes 0.0 0.0 0.0 0.0 0.0 0.0 0.0 0.0 0.0 0.0 0.0 0.0 0.0 0.0 0.0 0.0 0.0 0.0 0.0 0.0
1.2.PPA Pilot projects and preparatory actions 6.0 0.0 0.0 0.0 6.0 1.4 0.0 0.0 0.0 1.3 0.0 0.0 0.0 0.4 0.5 0.0 0.0 0.0 0.0 0.0
1.2.SPEC Actions financed under the prerogatives of the 0.0 0.0 0.0 0.0 0.0 0.0 0.0 0.0 0.0 0.0 0.0 0.0 0.0 0.0 0.0 0.0 0.0 0.0 0.0 0.0
2 SUSTAINABLE GROWTH: NATURAL RESOURC 56,584.5 1,500.3 20.2 74.0 54,989.9 674.0 1,007.2 1,178.2 1,078.1 6,150.3 181.0 1,238.1 2,853.3 6,555.1 8,532.8 96.9 5,505.9 84.5 236.5 624.42.0.1 European Agricultural Guarantee Fund (EAGF) - 44,288.1 1,383.1 1.4 0.2 42,903.4 605.5 602.5 893.4 936.8 5,183.2 100.5 1,232.3 2,285.4 5,337.0 7,687.0 96.5 4,203.9 57.0 148.0 384.3
2.0.10 European Agricultural Guarantee Fund (EAGF) - 44,288.1 1,383.1 1.4 0.2 42,903.4 605.5 602.5 893.4 936.8 5,183.2 100.5 1,232.3 2,285.4 5,337.0 7,687.0 96.5 4,203.9 57.0 148.0 384.3
Direct Aid 41,659.7 1,080.5 0.0 0.0 40,579.2 552.4 578.6 878.7 916.8 5,100.9 99.1 1,226.8 2,246.4 4,914.9 7,138.9 93.2 3,702.0 51.7 143.8 374.1
Other 2,628.4 302.7 1.4 0.2 2,324.1 53.1 23.9 14.7 20.0 82.3 1.4 5.5 39.0 422.1 548.1 3.3 501.9 5.3 4.3 10.2
2.0.2 European Agricultural Fund for Rural Developme 11,190.0 87.7 1.8 0.0 11,100.5 23.0 393.8 283.3 89.3 933.6 62.1 0.0 550.7 964.3 798.1 0.0 1,203.3 22.9 58.8 232.4
2.0.3 European Maritime and Fisheries Fund (EMFF), R 757.2 17.4 3.3 70.3 666.2 10.0 10.0 0.0 8.7 15.2 17.0 3.8 7.4 201.4 31.3 0.0 60.0 3.2 17.7 6.3
2.0.31 European Maritime and Fisheries Fund (EMFF) 683.6 16.8 3.3 0.6 662.9 10.0 10.0 0.0 8.7 15.1 17.0 3.8 7.4 200.1 31.3 0.0 58.9 3.2 17.7 6.3
2.0.32 Regional Fisheries Management Organisations (R 73.5 0.5 0.0 69.7 3.3 0.0 0.0 0.0 0.0 0.1 0.0 0.0 0.0 1.2 0.0 0.0 1.0 0.0 0.0 0.0
2.0.4 Programme for the Environment and Climate Acti 270.4 6.1 13.1 2.4 248.9 32.3 0.9 1.6 5.4 18.0 1.5 2.0 9.2 42.6 14.0 0.4 35.4 1.4 11.9 1.3
2.0.DAG Decentralised agencies 58.7 5.9 0.0 0.0 52.9 0.0 0.0 0.0 36.4 0.0 0.0 0.0 0.0 8.7 0.0 0.0 0.0 0.0 0.0 0.0
2.0.OTH Other actions and programmes 0.0 0.0 0.0 0.0 0.0 0.0 0.0 0.0 0.0 0.0 0.0 0.0 0.0 0.0 0.0 0.0 0.0 0.0 0.0 0.0
2.0.PPA Pilot projects and preparatory actions 17.1 0.1 0.7 1.1 15.2 0.6 0.0 0.0 1.4 0.4 0.0 0.0 0.6 1.1 2.4 0.0 2.9 0.0 0.0 0.0
2.0.SPEC Actions financed under the prerogatives of the 3.0 0.0 0.0 0.0 3.0 2.5 0.0 0.0 0.0 0.0 0.0 0.0 0.0 0.0 0.0 0.0 0.5 0.0 0.0 0.0
3 SECURITY AND CITIZENSHIP 1,711.0 40.3 3.9 20.3 1,646.5 231.1 14.9 12.0 10.3 99.0 8.1 19.8 38.4 75.3 128.2 85.5 211.7 8.1 9.9 37.03.0.1 Asylum, Migration and Integration Fund 186.0 5.9 0.0 4.2 175.9 7.1 5.1 1.1 0.0 26.6 0.7 0.7 3.8 11.9 8.6 1.0 47.9 2.7 1.0 1.6
3.0.2 Internal Security Fund 214.4 7.6 1.3 2.6 202.9 8.2 3.8 1.9 1.6 16.9 4.8 1.7 23.0 9.3 9.9 0.1 29.8 2.5 4.1 21.2
3.0.3 IT Systems 31.7 4.3 0.0 0.0 27.4 27.3 0.0 0.0 0.0 0.0 0.0 0.0 0.0 0.0 0.1 0.0 0.0 0.0 0.0 0.0
3.0.4 Justice Programme 40.1 1.2 0.2 0.0 38.7 21.2 0.2 0.2 0.0 1.9 0.0 0.1 0.2 1.4 1.0 0.0 2.2 0.0 0.3 0.1
3.0.5 Rights, Equality and Citizenship programme 46.8 2.3 0.3 0.7 43.4 11.8 0.6 0.7 0.1 3.8 0.2 0.5 0.7 1.3 2.5 0.3 5.8 0.4 0.2 0.4
3.0.6 Union Civil Protection Mechanism - Heading 3 28.4 0.5 0.5 0.6 26.7 2.0 0.0 0.0 0.4 3.6 0.0 0.0 1.2 1.7 0.7 0.3 6.2 0.7 0.2 0.3
3.0.7 Europe for Citizens 26.4 0.4 0.0 0.2 25.9 5.3 0.4 0.5 0.0 3.1 0.1 0.2 0.3 0.9 3.6 0.3 2.3 0.1 0.4 0.3
3.0.8 Food and feed 219.0 0.5 1.0 0.6 217.0 17.0 2.4 1.6 1.3 14.2 0.5 12.1 5.1 33.9 28.6 1.6 19.5 0.9 2.2 4.1
3.0.9 Union action in the field of health (Health Prog 48.1 0.2 0.2 2.6 45.1 10.0 0.3 0.3 1.7 2.3 0.2 0.7 0.9 3.2 3.5 0.3 3.6 0.1 0.1 0.3
2014 (EUR million)

3.0.10 Consumer Programme 19.7 0.0 0.2 0.5 18.9 9.9 0.0 0.0 0.1 0.6 0.0 0.1 0.0 0.3 1.2 0.1 0.4 0.0 0.0 0.2
3.0.11 Creative Europe Programme 192.0 5.6 0.3 5.8 180.4 32.1 1.1 4.9 4.6 20.4 1.0 2.8 1.6 8.5 44.2 1.3 11.0 0.2 0.6 0.6
3.0.DAG Decentralised agencies 476.2 11.1 0.0 0.0 465.1 41.5 0.0 0.0 0.0 0.0 0.0 0.0 0.0 0.0 1.1 0.0 78.8 0.0 0.0 7.3
3.0.OTH Other actions and programmes 0.6 0.0 0.0 0.2 0.4 0.0 0.0 0.0 0.0 0.2 0.0 0.0 0.0 0.0 0.1 0.0 0.0 0.0 0.0 0.1
3.0.PPA Pilot projects and preparatory actions 11.4 0.0 0.0 0.0 11.4 3.4 0.1 0.0 0.0 0.7 0.0 0.1 0.0 0.2 2.0 0.0 1.2 0.0 0.0 0.0
3.0.SPEC Actions financed under the prerogatives of the 170.2 0.6 0.0 2.5 167.1 34.3 0.8 0.8 0.6 4.9 0.4 0.8 1.5 2.6 21.0 80.3 2.9 0.5 0.6 0.6
4 GLOBAL EUROPE 7,205.8 296.2 1,387.0 5,437.0 85.5 0.0 16.5 0.0 0.0 0.0 0.0 0.0 0.0 0.0 0.0 26.4 0.0 0.0 0.1 0.04.0.1 Instrument for Pre-accession Assistance (IPA) 1,314.6 65.9 230.9 932.3 85.5 0.0 16.5 0.0 0.0 0.0 0.0 0.0 0.0 0.0 0.0 26.4 0.0 0.0 0.1 0.0
4.0.OTH other 5,891.2 230.3 1,156.1 4,504.8 0.0 0.0 0.0 0.0 0.0 0.0 0.0 0.0 0.0 0.0 0.0 0.0 0.0 0.0 0.0 0.0
5 ADMINISTRATION 8,819.3 478.1 481.2 179.1 7,680.9 4,725.4 12.2 15.4 51.6 205.9 8.9 46.1 37.5 97.2 339.0 9.1 257.5 10.0 9.2 10.46 COMPENSATIONS 28.6 0.0 0.0 0.0 28.6 0.0 0.0 0.0 0.0 0.0 0.0 0.0 0.0 0.0 0.0 28.6 0.0 0.0 0.0 0.08 NEGATIVE RESERVE 0.0 0.0 0.0 0.0 0.0 0.0 0.0 0.0 0.0 0.0 0.0 0.0 0.0 0.0 0.0 0.0 0.0 0.0 0.0 0.09 SPECIAL INSTRUMENTS 464.9 38.3 0.0 0.0 426.7 0.1 0.0 15.9 6.4 362.8 0.0 0.0 6.9 0.0 0.0 0.3 0.0 0.0 0.0 0.0TOTAL EXPENDITURE 142,497.0 3,773.3 3,583.6 6,575.2 128,564.9 7,044.3 2,255.4 4,377.2 1,511.7 11,484.5 667.6 1,563.1 7,095.0 11,538.5 13,479.1 584.3 10,695.2 272.9 1,062.2 1,885.9
VAT-based own resource 17,667.4 508.6 58.7 183.8 279.5 3,698.7 25.7 203.2 286.0 1,382.0 2,956.4 63.0 1,760.1 23.0 32.5 40.3GNI-based own resource 99,075.6 2,862.4 315.1 1,022.9 1,743.4 21,722.9 138.2 1,111.3 1,410.0 7,844.9 15,014.0 294.6 11,434.7 107.6 192.6 253.6UK correction -209.3 287.1 29.9 101.4 196.3 379.6 14.2 113.9 129.7 745.8 1,592.2 29.5 1,165.1 12.1 18.9 26.3Lump Sum Reduction Granted for DK, NL, AT & SE 0.0 0.0 0.0 0.0 0.0 0.0 0.0 0.0 0.0 0.0 0.0 0.0 0.0 0.0 0.0 0.0FSJ adjustment for Denmark, Ireland and the United Kingdom -1.8 2.0 0.2 0.7 -5.8 14.7 0.1 -3.3 0.9 5.4 11.0 0.1 8.3 0.1 0.1 0.2
TOTAL national contribution 116,531.8 3,660.2 403.9 1,308.8 2,213.4 25,815.9 178.2 1,425.1 1,826.6 9,978.1 19,573.6 387.2 14,368.2 142.8 244.1 320.4Traditional own resources (TOR) (75%) 16,429.5 1,572.5 56.7 197.9 294.2 3,327.0 22.2 225.6 123.2 1,132.9 1,394.1 42.5 1,520.4 17.8 25.9 64.3Agricultural duties (100%) 0.0 0.0 0.0 0.0 0.0 0.0 0.0 0.0 0.0 0.0 0.0 0.0 0.0 0.0 0.0 0.0Sugar levies (100%) -25.2 -4.5 0.5 3.6 -1.6 -31.2 0.0 -1.6 1.9 3.2 -19.0 2.3 0.1 0.0 0.0 1.0Customs duties (100%) 21,998.0 2,105.7 75.0 260.5 396.7 4,489.4 29.5 302.9 162.4 1,508.4 1,900.2 54.4 2,028.9 23.8 34.6 84.7
Amounts (25%) retained as TOR collection costs -5,543.3 -528.6 -18.9 -66.2 -100.9 -1,131.1 -7.4 -75.7 -41.1 -378.7 -487.1 -14.2 -508.6 -5.9 -8.6 -21.5
TOTAL own resources 132,961.3 5,232.7 460.5 1,506.7 2,507.6 29,143.0 200.4 1,650.6 1,949.8 11,111.0 20,967.7 429.8 15,888.6 160.6 270.0 384.7Surplus from previous year 1,005.4Surplus from EAGGF-Guarantee 0.0 p.m. amount of the 2013Surplus external aid guarantee fund 0.0 UK correction (3rd update): 5,923.0Other revenue 9,973.4
TOTAL REVENUE 143,940.1
Gross National Income (GNI), EUR million* 13,921,700.4 402,665.3 40,972.9 144,472.9 264,872.5 2,972,188.0 19,048.7 159,732.3 178,380.6 1,052,245.0 2,179,155.1 41,772.8 1,613,794.7 16,582.8 23,867.9 35,202.8
Operating budgetary balance (EUR million) 0.00 -1,478.1 +1,824.3 +3,004.2 -836.0 -15,501.6 +473.8 +38.8 +5,162.6 +1,090.6 -7,164.5 +173.4 -4,467.0 +114.8 +799.8 +1,543.2
Operating budgetary balance (% GNI) 0.00% -0.37% +4.45% +2.08% -0.32% -0.52% +2.49% +0.02% +2.89% +0.10% -0.33% +0.42% -0.28% +0.69% +3.35% +4.38%
* GNI figures are based on ESA 2010
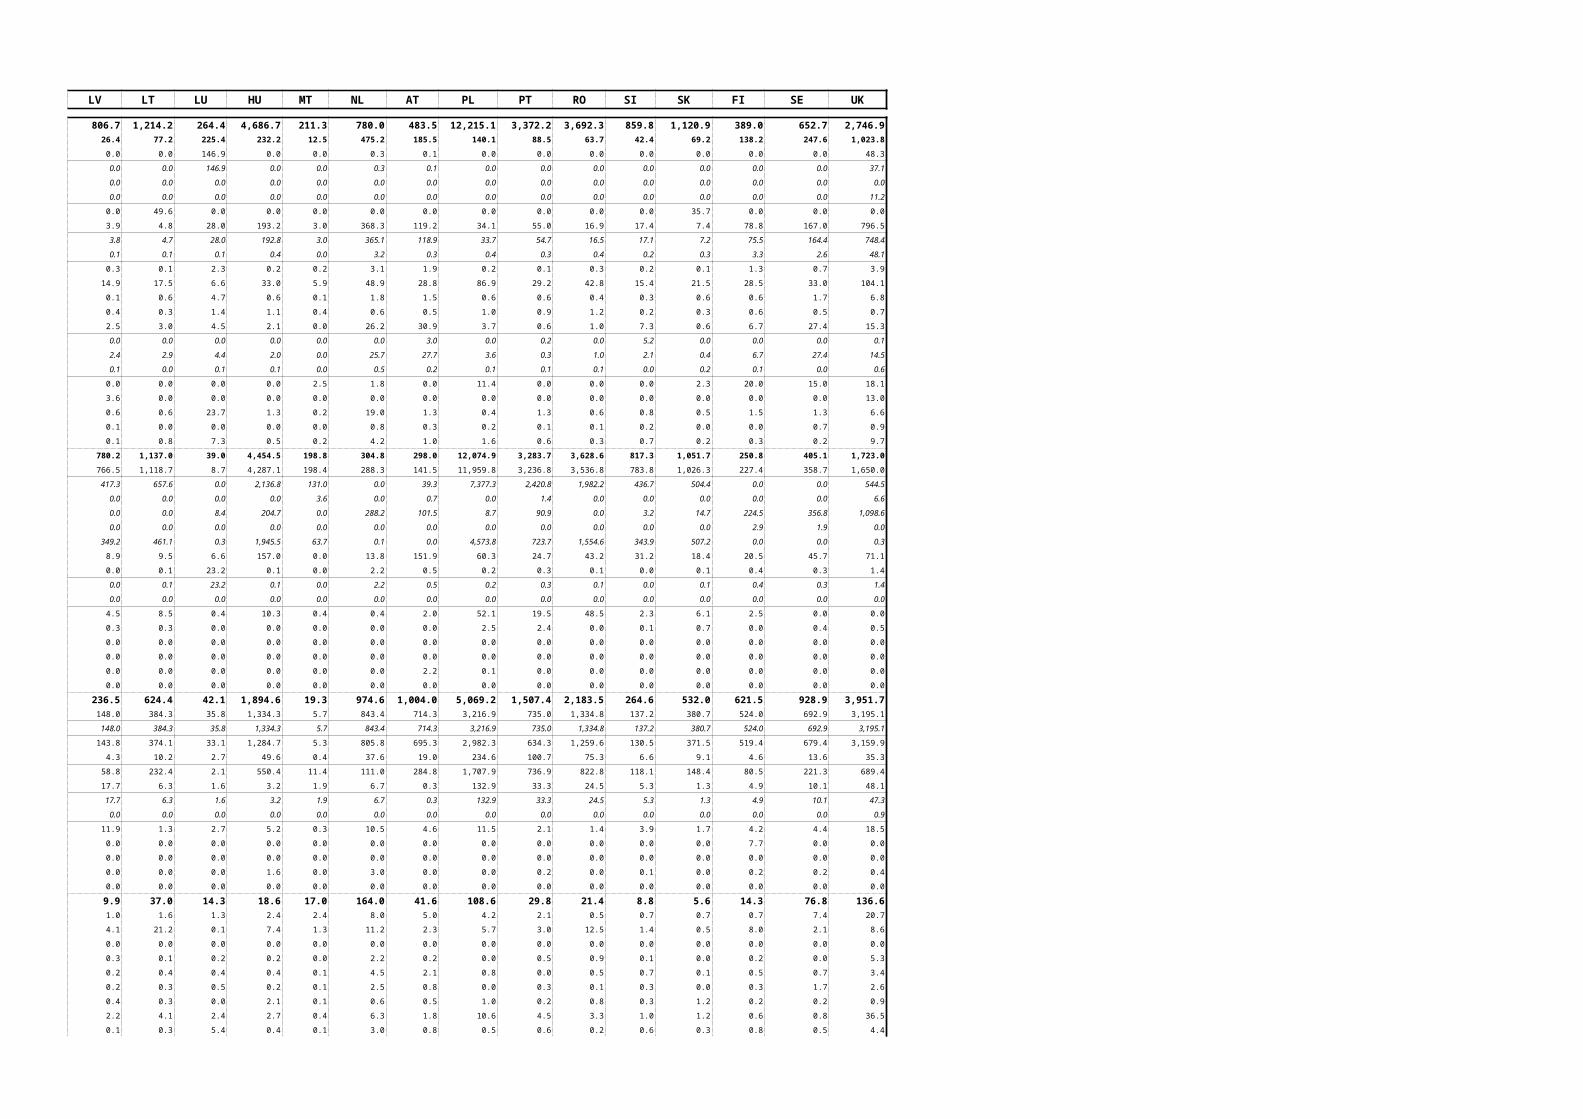
LU HU MT NL AT PL PT RO SI SK FI SE UK
264.4 4,686.7 211.3 780.0 483.5 12,215.1 3,372.2 3,692.3 859.8 1,120.9 389.0 652.7 2,746.9225.4 232.2 12.5 475.2 185.5 140.1 88.5 63.7 42.4 69.2 138.2 247.6 1,023.8
146.9 0.0 0.0 0.3 0.1 0.0 0.0 0.0 0.0 0.0 0.0 0.0 48.3
146.9 0.0 0.0 0.3 0.1 0.0 0.0 0.0 0.0 0.0 0.0 0.0 37.1
0.0 0.0 0.0 0.0 0.0 0.0 0.0 0.0 0.0 0.0 0.0 0.0 0.0
0.0 0.0 0.0 0.0 0.0 0.0 0.0 0.0 0.0 0.0 0.0 0.0 11.2
0.0 0.0 0.0 0.0 0.0 0.0 0.0 0.0 0.0 35.7 0.0 0.0 0.0
28.0 193.2 3.0 368.3 119.2 34.1 55.0 16.9 17.4 7.4 78.8 167.0 796.5
28.0 192.8 3.0 365.1 118.9 33.7 54.7 16.5 17.1 7.2 75.5 164.4 748.4
0.1 0.4 0.0 3.2 0.3 0.4 0.3 0.4 0.2 0.3 3.3 2.6 48.1
2.3 0.2 0.2 3.1 1.9 0.2 0.1 0.3 0.2 0.1 1.3 0.7 3.9
6.6 33.0 5.9 48.9 28.8 86.9 29.2 42.8 15.4 21.5 28.5 33.0 104.1
4.7 0.6 0.1 1.8 1.5 0.6 0.6 0.4 0.3 0.6 0.6 1.7 6.8
1.4 1.1 0.4 0.6 0.5 1.0 0.9 1.2 0.2 0.3 0.6 0.5 0.7
4.5 2.1 0.0 26.2 30.9 3.7 0.6 1.0 7.3 0.6 6.7 27.4 15.3
0.0 0.0 0.0 0.0 3.0 0.0 0.2 0.0 5.2 0.0 0.0 0.0 0.1
4.4 2.0 0.0 25.7 27.7 3.6 0.3 1.0 2.1 0.4 6.7 27.4 14.5
0.1 0.1 0.0 0.5 0.2 0.1 0.1 0.1 0.0 0.2 0.1 0.0 0.6
0.0 0.0 2.5 1.8 0.0 11.4 0.0 0.0 0.0 2.3 20.0 15.0 18.1
0.0 0.0 0.0 0.0 0.0 0.0 0.0 0.0 0.0 0.0 0.0 0.0 13.0
23.7 1.3 0.2 19.0 1.3 0.4 1.3 0.6 0.8 0.5 1.5 1.3 6.6
0.0 0.0 0.0 0.8 0.3 0.2 0.1 0.1 0.2 0.0 0.0 0.7 0.9
7.3 0.5 0.2 4.2 1.0 1.6 0.6 0.3 0.7 0.2 0.3 0.2 9.7
39.0 4,454.5 198.8 304.8 298.0 12,074.9 3,283.7 3,628.6 817.3 1,051.7 250.8 405.1 1,723.0
8.7 4,287.1 198.4 288.3 141.5 11,959.8 3,236.8 3,536.8 783.8 1,026.3 227.4 358.7 1,650.0
0.0 2,136.8 131.0 0.0 39.3 7,377.3 2,420.8 1,982.2 436.7 504.4 0.0 0.0 544.5
0.0 0.0 3.6 0.0 0.7 0.0 1.4 0.0 0.0 0.0 0.0 0.0 6.6
8.4 204.7 0.0 288.2 101.5 8.7 90.9 0.0 3.2 14.7 224.5 356.8 1,098.6
0.0 0.0 0.0 0.0 0.0 0.0 0.0 0.0 0.0 0.0 2.9 1.9 0.0
0.3 1,945.5 63.7 0.1 0.0 4,573.8 723.7 1,554.6 343.9 507.2 0.0 0.0 0.3
6.6 157.0 0.0 13.8 151.9 60.3 24.7 43.2 31.2 18.4 20.5 45.7 71.1
23.2 0.1 0.0 2.2 0.5 0.2 0.3 0.1 0.0 0.1 0.4 0.3 1.4
23.2 0.1 0.0 2.2 0.5 0.2 0.3 0.1 0.0 0.1 0.4 0.3 1.4
0.0 0.0 0.0 0.0 0.0 0.0 0.0 0.0 0.0 0.0 0.0 0.0 0.0
0.4 10.3 0.4 0.4 2.0 52.1 19.5 48.5 2.3 6.1 2.5 0.0 0.0
0.0 0.0 0.0 0.0 0.0 2.5 2.4 0.0 0.1 0.7 0.0 0.4 0.5
0.0 0.0 0.0 0.0 0.0 0.0 0.0 0.0 0.0 0.0 0.0 0.0 0.0
0.0 0.0 0.0 0.0 0.0 0.0 0.0 0.0 0.0 0.0 0.0 0.0 0.0
0.0 0.0 0.0 0.0 2.2 0.1 0.0 0.0 0.0 0.0 0.0 0.0 0.0
0.0 0.0 0.0 0.0 0.0 0.0 0.0 0.0 0.0 0.0 0.0 0.0 0.0
42.1 1,894.6 19.3 974.6 1,004.0 5,069.2 1,507.4 2,183.5 264.6 532.0 621.5 928.9 3,951.735.8 1,334.3 5.7 843.4 714.3 3,216.9 735.0 1,334.8 137.2 380.7 524.0 692.9 3,195.1
35.8 1,334.3 5.7 843.4 714.3 3,216.9 735.0 1,334.8 137.2 380.7 524.0 692.9 3,195.1
33.1 1,284.7 5.3 805.8 695.3 2,982.3 634.3 1,259.6 130.5 371.5 519.4 679.4 3,159.9
2.7 49.6 0.4 37.6 19.0 234.6 100.7 75.3 6.6 9.1 4.6 13.6 35.3
2.1 550.4 11.4 111.0 284.8 1,707.9 736.9 822.8 118.1 148.4 80.5 221.3 689.4
1.6 3.2 1.9 6.7 0.3 132.9 33.3 24.5 5.3 1.3 4.9 10.1 48.1
1.6 3.2 1.9 6.7 0.3 132.9 33.3 24.5 5.3 1.3 4.9 10.1 47.3
0.0 0.0 0.0 0.0 0.0 0.0 0.0 0.0 0.0 0.0 0.0 0.0 0.9
2.7 5.2 0.3 10.5 4.6 11.5 2.1 1.4 3.9 1.7 4.2 4.4 18.5
0.0 0.0 0.0 0.0 0.0 0.0 0.0 0.0 0.0 0.0 7.7 0.0 0.0
0.0 0.0 0.0 0.0 0.0 0.0 0.0 0.0 0.0 0.0 0.0 0.0 0.0
0.0 1.6 0.0 3.0 0.0 0.0 0.2 0.0 0.1 0.0 0.2 0.2 0.4
0.0 0.0 0.0 0.0 0.0 0.0 0.0 0.0 0.0 0.0 0.0 0.0 0.0
14.3 18.6 17.0 164.0 41.6 108.6 29.8 21.4 8.8 5.6 14.3 76.8 136.61.3 2.4 2.4 8.0 5.0 4.2 2.1 0.5 0.7 0.7 0.7 7.4 20.7
0.1 7.4 1.3 11.2 2.3 5.7 3.0 12.5 1.4 0.5 8.0 2.1 8.6
0.0 0.0 0.0 0.0 0.0 0.0 0.0 0.0 0.0 0.0 0.0 0.0 0.0
0.2 0.2 0.0 2.2 0.2 0.0 0.5 0.9 0.1 0.0 0.2 0.0 5.3
0.4 0.4 0.1 4.5 2.1 0.8 0.0 0.5 0.7 0.1 0.5 0.7 3.4
0.5 0.2 0.1 2.5 0.8 0.0 0.3 0.1 0.3 0.0 0.3 1.7 2.6
0.0 2.1 0.1 0.6 0.5 1.0 0.2 0.8 0.3 1.2 0.2 0.2 0.9
2.4 2.7 0.4 6.3 1.8 10.6 4.5 3.3 1.0 1.2 0.6 0.8 36.5
5.4 0.4 0.1 3.0 0.8 0.5 0.6 0.2 0.6 0.3 0.8 0.5 4.4

2.2 0.1 0.1 1.6 0.1 0.0 0.1 0.1 0.1 0.0 0.3 0.4 0.7
1.0 1.5 0.1 7.5 5.8 3.9 2.2 1.0 2.9 0.5 2.2 5.7 11.1
0.0 0.0 12.1 114.1 21.1 79.5 14.8 0.0 0.0 0.0 0.0 56.5 38.3
0.0 0.0 0.0 0.0 0.0 0.0 0.0 0.0 0.0 0.0 0.0 0.0 0.0
0.0 0.2 0.0 1.0 0.1 0.0 0.0 0.2 0.1 0.0 0.0 0.0 2.0
0.7 0.9 0.2 1.5 1.0 2.3 1.5 1.3 0.5 1.0 0.5 0.9 2.1
0.0 5.2 0.0 0.0 0.0 13.3 0.0 23.8 0.3 0.0 0.0 0.0 0.00.0 5.2 0.0 0.0 0.0 13.3 0.0 23.8 0.3 0.0 0.0 0.0 0.0
0.0 0.0 0.0 0.0 0.0 0.0 0.0 0.0 0.0 0.0 0.0 0.0 0.0
1,393.1 15.1 7.4 95.8 21.8 29.8 33.6 20.3 9.1 10.2 27.4 32.6 149.30.0 0.0 0.0 0.0 0.0 0.0 0.0 0.0 0.0 0.0 0.0 0.0 0.00.0 0.0 0.0 0.0 0.0 0.0 0.0 0.0 0.0 0.0 0.0 0.0 0.00.1 0.0 0.0 0.0 21.7 0.0 0.0 2.5 0.0 0.0 9.8 0.0 0.3
1,713.9 6,620.2 254.9 2,014.4 1,572.6 17,436.1 4,943.0 5,943.9 1,142.5 1,668.8 1,061.9 1,691.0 6,984.7
38.5 118.1 10.6 818.6 453.0 445.1 242.3 161.3 52.8 69.0 270.5 553.1 2,932.9171.2 700.4 49.4 5,490.0 2,195.9 2,785.0 1,270.3 1,089.7 247.0 502.3 1,364.3 3,217.4 14,524.622.2 71.3 5.7 79.1 40.5 294.4 123.4 101.4 26.7 53.5 141.4 55.5 -6,066.30.0 0.0 0.0 0.0 0.0 0.0 0.0 0.0 0.0 0.0 0.0 0.0 0.00.2 0.5 0.0 3.3 1.6 2.0 0.9 0.7 0.2 0.4 1.0 2.1 -49.6
232.1 890.3 65.7 6,391.0 2,690.9 3,526.5 1,636.9 1,353.1 326.8 625.1 1,777.2 3,828.2 11,341.614.0 105.5 10.5 1,981.7 178.6 428.2 111.0 105.8 58.2 95.1 126.8 466.1 2,730.70.0 0.0 0.0 0.0 0.0 0.0 0.0 0.0 0.0 0.0 0.0 0.0 0.00.0 2.7 0.0 -6.3 -2.2 13.4 -0.5 1.0 0.0 0.8 -0.4 6.6 4.918.7 138.0 13.9 2,653.9 242.4 558.8 148.6 140.1 77.6 126.4 169.9 613.8 3,638.8
-4.7 -35.2 -3.5 -665.9 -61.7 -144.0 -37.2 -35.3 -19.4 -32.0 -42.7 -154.3 -912.9246.2 995.8 76.1 8,372.7 2,869.5 3,954.6 1,747.9 1,458.9 385.0 720.2 1,904.1 4,294.3 14,072.3
29,477.4 100,695.3 7,628.7 662,465.0 328,896.7 396,057.8 171,107.8 146,462.1 36,676.2 73,854.5 203,977.0 445,167.8 2,174,279.7
+80.1 +5,681.6 +179.4 -4,711.0 -1,240.6 +13,748.1 +3,211.3 +4,519.9 +794.4 +1,010.1 -809.0 -2,312.7 -4,929.8
+0.27% +5.64% +2.35% -0.71% -0.38% +3.47% +1.88% +3.09% +2.17% +1.37% -0.40% -0.52% -0.23%

Total
1 SMART AND INCLUSIVE GROWTH 68,009.21.1 Competitiveness for growth and jobs 16,801.9
1.1.1 Large infrastructure projects 1,784.1
1.1.10 European Fund for Strategic Investments (E 3.6
1.1.11 Implementation and exploitation of Europe 836.5
1.1.12 International Thermonuclear Experimental 417.7
1.1.13 European Earth Observation Programme (C 526.2
1.1.2 Nuclear decommissioning assistance prog 149.7
1.1.3 Common Strategic Framework (CSF) Resear 9,985.5
1.1.31 The Framework Programme for Research and 9,626.8
1.1.32 Euratom Research and Training Programm 358.7
1.1.4 Programme for the Competitiveness of Ent 347.6
1.1.5 The Union Programme for Education, Train 1,834.2
1.1.6 European Union Programme for Employment 88.3
1.1.7 Action Programmes for customs, for taxatio 109.1
1.1.8 Connecting Europe Facility (CEF) 1,414.4
1.1.81 Energy 77.7
1.1.82 Transport 1,312.0
1.1.83 Informations and Communications Technolo 24.7
1.1.9 Energy projects to aid economic recovery ( 401.9
1.1.DAG Decentralised agencies 252.7
1.1.OTH Other actions and programmes 300.9
1.1.PPA Pilot projects and preparatory actions 17.0
1.1.SPEC Actions financed under the prerogatives o 116.8
1.2 Economic, social and territorial cohesi 51,207.31.2.1 Investment for growth and jobs 48,279.6
1.2.11 Less developed regions (Regional converge 27,818.5
1.2.12 Transition regions 785.7
1.2.13 More developed regions (Competitiveness) 7,562.7
1.2.14 Outermost and sparsely populated regions 25.4
1.2.15 Cohesion fund (including contribution to th 12,087.3
1.2.2 European territorial cooperation 1,288.0
1.2.3 Technical assistance and innovative action 161.7
1.2.31 Technical assistance 161.7
1.2.32 Innovative actions 0.0
1.2.4 Fund for European Aid to the Most Deprive 45.5
1.2.5 Youth Employment Initiative (specific top-up 1,035.1
2015 (EUR million)
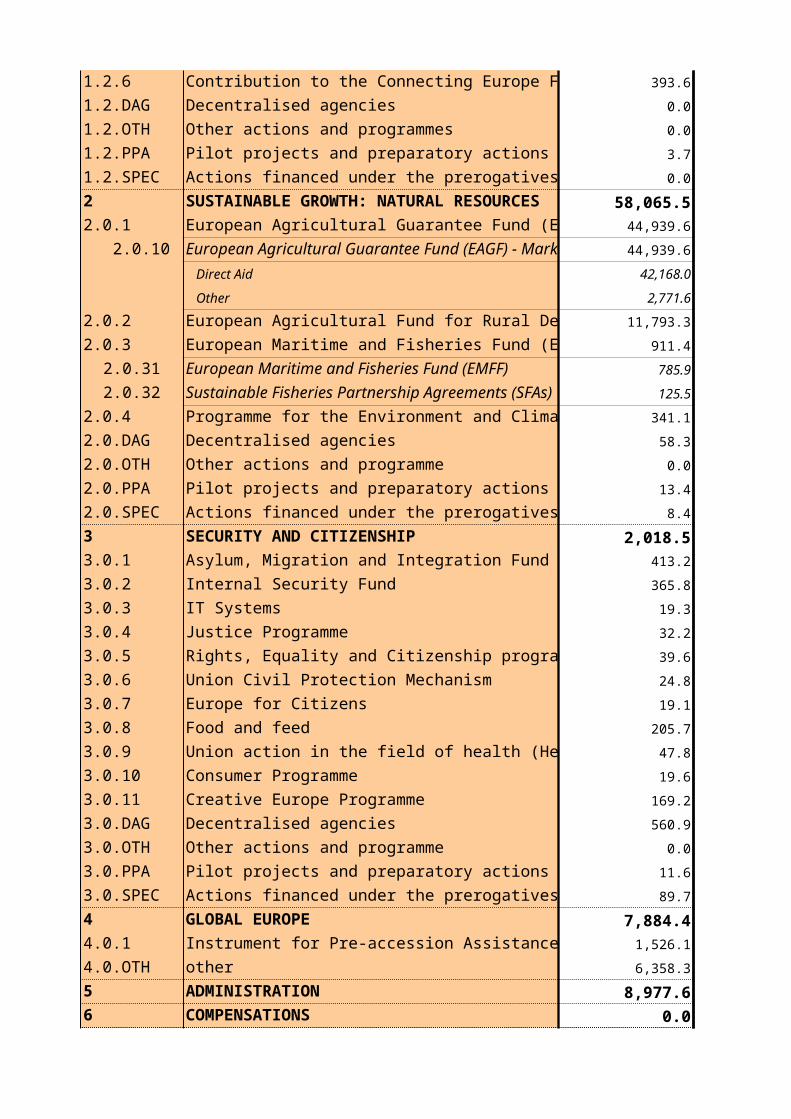
1.2.6 Contribution to the Connecting Europe Facil 393.6
1.2.DAG Decentralised agencies 0.0
1.2.OTH Other actions and programmes 0.0
1.2.PPA Pilot projects and preparatory actions 3.7
1.2.SPEC Actions financed under the prerogatives o 0.0
2 SUSTAINABLE GROWTH: NATURAL RES 58,065.52.0.1 European Agricultural Guarantee Fund (EAG 44,939.6
2.0.10 European Agricultural Guarantee Fund (EAG 44,939.6
Direct Aid 42,168.0
Other 2,771.6
2.0.2 European Agricultural Fund for Rural Deve 11,793.3
2.0.3 European Maritime and Fisheries Fund (EMF 911.4
2.0.31 European Maritime and Fisheries Fund (EM 785.9
2.0.32 Sustainable Fisheries Partnership Agreemen 125.5
2.0.4 Programme for the Environment and Climate 341.1
2.0.DAG Decentralised agencies 58.3
2.0.OTH Other actions and programme 0.0
2.0.PPA Pilot projects and preparatory actions 13.4
2.0.SPEC Actions financed under the prerogatives o 8.4
3 SECURITY AND CITIZENSHIP 2,018.53.0.1 Asylum, Migration and Integration Fund 413.2
3.0.2 Internal Security Fund 365.8
3.0.3 IT Systems 19.3
3.0.4 Justice Programme 32.2
3.0.5 Rights, Equality and Citizenship programm 39.6
3.0.6 Union Civil Protection Mechanism 24.8
3.0.7 Europe for Citizens 19.1
3.0.8 Food and feed 205.7
3.0.9 Union action in the field of health (Health 47.8
3.0.10 Consumer Programme 19.6
3.0.11 Creative Europe Programme 169.2
3.0.DAG Decentralised agencies 560.9
3.0.OTH Other actions and programme 0.0
3.0.PPA Pilot projects and preparatory actions 11.6
3.0.SPEC Actions financed under the prerogatives o 89.7
4 GLOBAL EUROPE 7,884.44.0.1 Instrument for Pre-accession Assistance (IP 1,526.1
4.0.OTH other 6,358.3
5 ADMINISTRATION 8,977.66 COMPENSATIONS 0.0

8 NEGATIVE RESERVE 0.09 SPECIAL INSTRUMENTS 287.9TOTAL EXPENDITURE 145,243.2
VAT-based own resourceGNI-based own resourceUK correctionLump Sum Reduction Granted for DK, NL, AT & SEFSJ adjustment for Denmark, Ireland and the United Kingdom
TOTAL national contributionTraditional own resources (TOR) (75%)Agricultural duties (100%)Sugar levies (100%)Customs duties (100%)
Amounts (25%) retained as TOR collection costs
TOTAL own resourcesSurplus from previous yearSurplus from EAGGF-GuaranteeSurplus external aid guarantee fundOther revenue
TOTAL REVENUE
Gross National Income (GNI), EUR million*
Operating budgetary balance (EUR million)Operating budgetary balance (% GNI)
* GNI figures are based on ESA 2010
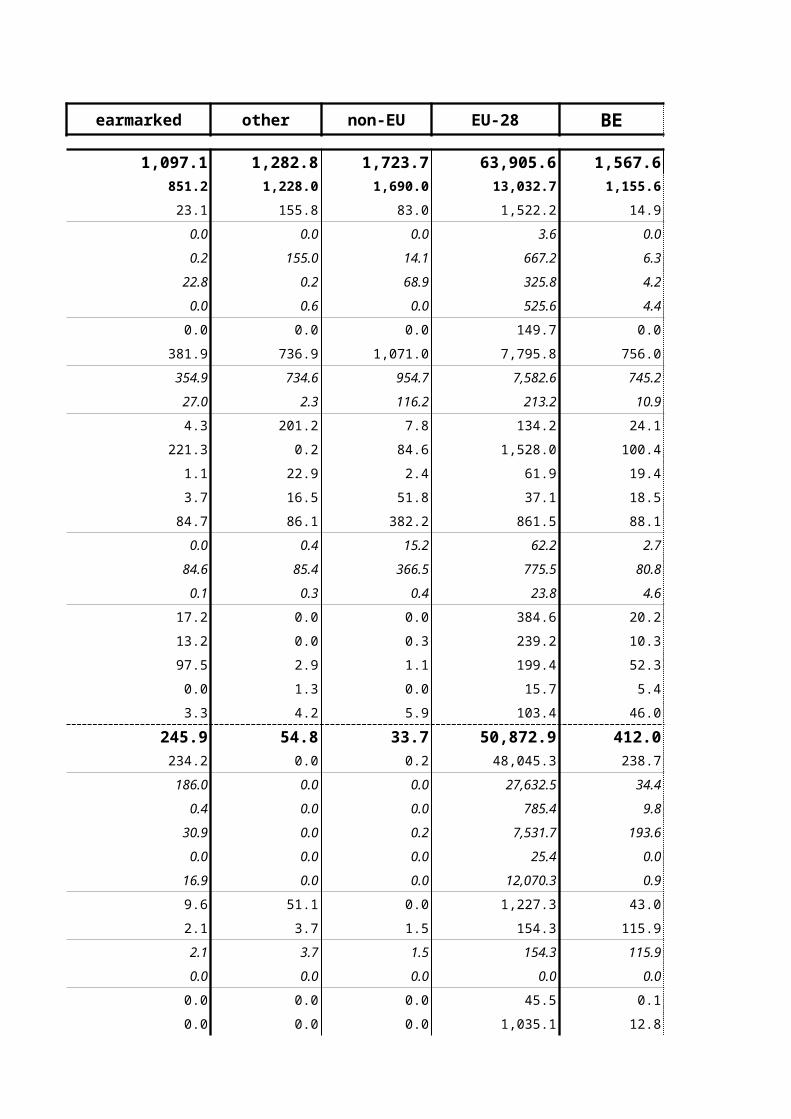
earmarked other non-EU EU-28 BE BG
1,097.1 1,282.8 1,723.7 63,905.6 1,567.6 1,539.3851.2 1,228.0 1,690.0 13,032.7 1,155.6 118.1
23.1 155.8 83.0 1,522.2 14.9 0.0
0.0 0.0 0.0 3.6 0.0 0.0
0.2 155.0 14.1 667.2 6.3 0.0
22.8 0.2 68.9 325.8 4.2 0.0
0.0 0.6 0.0 525.6 4.4 0.0
0.0 0.0 0.0 149.7 0.0 74.9
381.9 736.9 1,071.0 7,795.8 756.0 9.3
354.9 734.6 954.7 7,582.6 745.2 8.5
27.0 2.3 116.2 213.2 10.9 0.8
4.3 201.2 7.8 134.2 24.1 1.2
221.3 0.2 84.6 1,528.0 100.4 27.1
1.1 22.9 2.4 61.9 19.4 0.1
3.7 16.5 51.8 37.1 18.5 1.2
84.7 86.1 382.2 861.5 88.1 3.1
0.0 0.4 15.2 62.2 2.7 2.9
84.6 85.4 366.5 775.5 80.8 0.0
0.1 0.3 0.4 23.8 4.6 0.2
17.2 0.0 0.0 384.6 20.2 0.0
13.2 0.0 0.3 239.2 10.3 0.2
97.5 2.9 1.1 199.4 52.3 0.4
0.0 1.3 0.0 15.7 5.4 0.0
3.3 4.2 5.9 103.4 46.0 0.5
245.9 54.8 33.7 50,872.9 412.0 1,421.2234.2 0.0 0.2 48,045.3 238.7 1,386.8
186.0 0.0 0.0 27,632.5 34.4 830.9
0.4 0.0 0.0 785.4 9.8 0.0
30.9 0.0 0.2 7,531.7 193.6 0.0
0.0 0.0 0.0 25.4 0.0 0.0
16.9 0.0 0.0 12,070.3 0.9 555.9
9.6 51.1 0.0 1,227.3 43.0 10.9
2.1 3.7 1.5 154.3 115.9 0.0
2.1 3.7 1.5 154.3 115.9 0.0
0.0 0.0 0.0 0.0 0.0 0.0
0.0 0.0 0.0 45.5 0.1 0.0
0.0 0.0 0.0 1,035.1 12.8 16.6
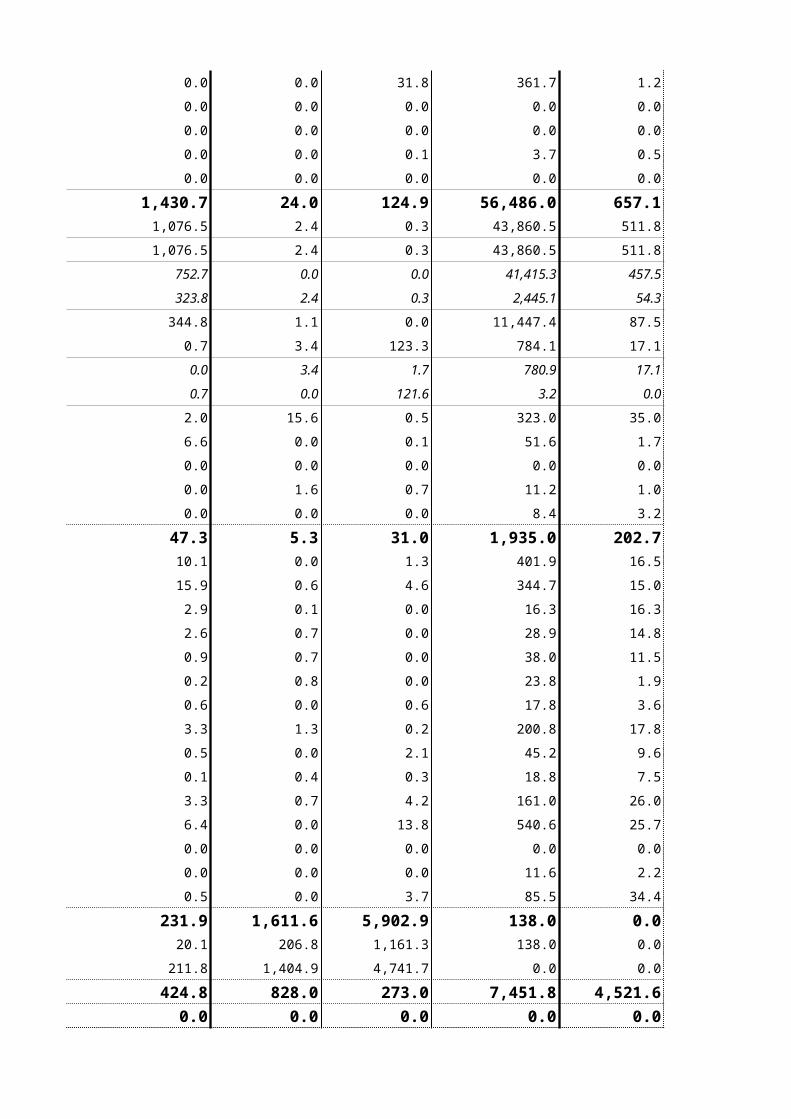
0.0 0.0 31.8 361.7 1.2 6.9
0.0 0.0 0.0 0.0 0.0 0.0
0.0 0.0 0.0 0.0 0.0 0.0
0.0 0.0 0.1 3.7 0.5 0.0
0.0 0.0 0.0 0.0 0.0 0.0
1,430.7 24.0 124.9 56,486.0 657.1 1,107.31,076.5 2.4 0.3 43,860.5 511.8 674.7
1,076.5 2.4 0.3 43,860.5 511.8 674.7
752.7 0.0 0.0 41,415.3 457.5 643.8
323.8 2.4 0.3 2,445.1 54.3 30.9
344.8 1.1 0.0 11,447.4 87.5 415.4
0.7 3.4 123.3 784.1 17.1 13.5
0.0 3.4 1.7 780.9 17.1 13.5
0.7 0.0 121.6 3.2 0.0 0.0
2.0 15.6 0.5 323.0 35.0 3.7
6.6 0.0 0.1 51.6 1.7 0.0
0.0 0.0 0.0 0.0 0.0 0.0
0.0 1.6 0.7 11.2 1.0 0.0
0.0 0.0 0.0 8.4 3.2 0.0
47.3 5.3 31.0 1,935.0 202.7 27.210.1 0.0 1.3 401.9 16.5 4.8
15.9 0.6 4.6 344.7 15.0 17.5
2.9 0.1 0.0 16.3 16.3 0.0
2.6 0.7 0.0 28.9 14.8 0.2
0.9 0.7 0.0 38.0 11.5 0.4
0.2 0.8 0.0 23.8 1.9 0.0
0.6 0.0 0.6 17.8 3.6 0.3
3.3 1.3 0.2 200.8 17.8 0.9
0.5 0.0 2.1 45.2 9.6 0.1
0.1 0.4 0.3 18.8 7.5 0.1
3.3 0.7 4.2 161.0 26.0 0.9
6.4 0.0 13.8 540.6 25.7 1.2
0.0 0.0 0.0 0.0 0.0 0.0
0.0 0.0 0.0 11.6 2.2 0.1
0.5 0.0 3.7 85.5 34.4 0.7
231.9 1,611.6 5,902.9 138.0 0.0 25.420.1 206.8 1,161.3 138.0 0.0 25.4
211.8 1,404.9 4,741.7 0.0 0.0 0.0
424.8 828.0 273.0 7,451.8 4,521.6 11.50.0 0.0 0.0 0.0 0.0 0.0

0.0 0.0 0.0 0.0 0.0 0.035.5 0.0 60.2 192.2 2.9 18.9
3,267.2 3,751.7 8,115.7 130,108.6 6,951.9 2,729.5
VAT-based own resource 18,087.0 584.7 61.1GNI-based own resource 100,967.4 2,824.8 332.9UK correction -443.0 280.8 30.0Lump Sum Reduction Granted for DK, NL, AT & SE 0.0 0.0 0.0FSJ adjustment for Denmark, Ireland and the United Kingdom -7.0 1.5 0.2
TOTAL national contribution 118,604.3 3,691.9 424.1Traditional own resources (TOR) (75%) 18,730.4 1,778.8 59.8Agricultural duties (100%) 0.0 0.0 0.0Sugar levies (100%) 165.0 8.8 0.5Customs duties (100%) 24,808.8 2,362.9 79.3
Amounts (25%) retained as TOR collection costs -6,243.5 -592.9 -19.9
TOTAL own resources 137,334.7 5,470.7 484.0Surplus from previous year 1,434.6Surplus from EAGGF-Guarantee 0.0 p.m. amount of the 2014Surplus external aid guarantee fund 0.0 UK correction (2nd update):Other revenue 7,258.2
TOTAL REVENUE 146,027.4
Gross National Income (GNI), EUR million* 14,621,241.5 415,782.3 42,801.7
Operating budgetary balance (EUR million) 0.00 -1,387.8 +2,279.4
Operating budgetary balance (% GNI) 0.00% -0.33% +5.33%
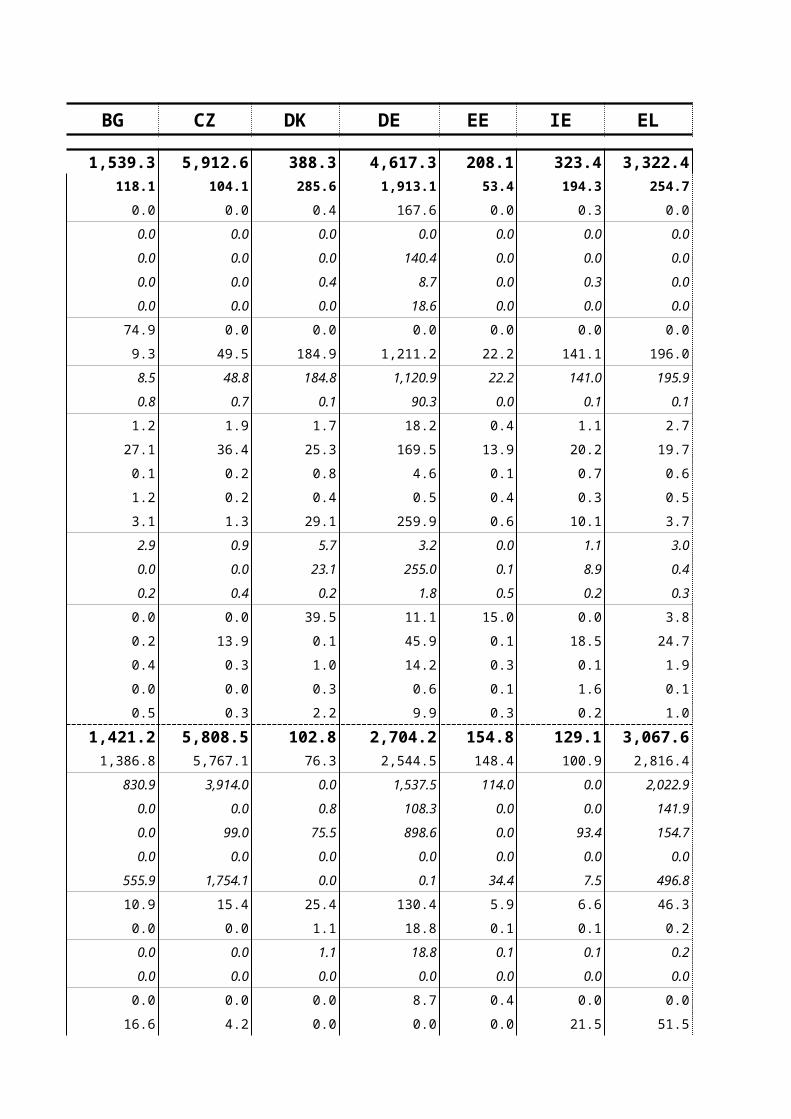
CZ DK DE EE IE EL ES
5,912.6 388.3 4,617.3 208.1 323.4 3,322.4 6,678.2104.1 285.6 1,913.1 53.4 194.3 254.7 1,220.1
0.0 0.4 167.6 0.0 0.3 0.0 80.5
0.0 0.0 0.0 0.0 0.0 0.0 0.0
0.0 0.0 140.4 0.0 0.0 0.0 4.3
0.0 0.4 8.7 0.0 0.3 0.0 74.3
0.0 0.0 18.6 0.0 0.0 0.0 1.9
0.0 0.0 0.0 0.0 0.0 0.0 0.0
49.5 184.9 1,211.2 22.2 141.1 196.0 728.8
48.8 184.8 1,120.9 22.2 141.0 195.9 724.7
0.7 0.1 90.3 0.0 0.1 0.1 4.1
1.9 1.7 18.2 0.4 1.1 2.7 13.0
36.4 25.3 169.5 13.9 20.2 19.7 167.0
0.2 0.8 4.6 0.1 0.7 0.6 2.9
0.2 0.4 0.5 0.4 0.3 0.5 0.8
1.3 29.1 259.9 0.6 10.1 3.7 143.9
0.9 5.7 3.2 0.0 1.1 3.0 0.6
0.0 23.1 255.0 0.1 8.9 0.4 143.1
0.4 0.2 1.8 0.5 0.2 0.3 0.3
0.0 39.5 11.1 15.0 0.0 3.8 59.5
13.9 0.1 45.9 0.1 18.5 24.7 15.6
0.3 1.0 14.2 0.3 0.1 1.9 6.2
0.0 0.3 0.6 0.1 1.6 0.1 0.9
0.3 2.2 9.9 0.3 0.2 1.0 1.1
5,808.5 102.8 2,704.2 154.8 129.1 3,067.6 5,458.15,767.1 76.3 2,544.5 148.4 100.9 2,816.4 5,100.2
3,914.0 0.0 1,537.5 114.0 0.0 2,022.9 3,264.3
0.0 0.8 108.3 0.0 0.0 141.9 401.9
99.0 75.5 898.6 0.0 93.4 154.7 1,231.0
0.0 0.0 0.0 0.0 0.0 0.0 11.4
1,754.1 0.0 0.1 34.4 7.5 496.8 191.6
15.4 25.4 130.4 5.9 6.6 46.3 74.1
0.0 1.1 18.8 0.1 0.1 0.2 0.5
0.0 1.1 18.8 0.1 0.1 0.2 0.5
0.0 0.0 0.0 0.0 0.0 0.0 0.0
0.0 0.0 8.7 0.4 0.0 0.0 0.0
4.2 0.0 0.0 0.0 21.5 51.5 283.0

21.8 0.0 0.0 0.0 0.0 153.4 0.0
0.0 0.0 0.0 0.0 0.0 0.0 0.0
0.0 0.0 0.0 0.0 0.0 0.0 0.0
0.0 0.0 1.8 0.0 0.0 0.0 0.1
0.0 0.0 0.0 0.0 0.0 0.0 0.0
1,140.0 1,074.1 6,041.0 181.6 1,618.2 2,774.6 6,764.6897.4 925.6 5,247.9 119.7 1,224.0 2,195.9 5,488.1
897.4 925.6 5,247.9 119.7 1,224.0 2,195.9 5,488.1
882.5 913.4 5,135.3 110.7 1,218.5 2,133.8 5,009.7
14.9 12.2 112.7 9.0 5.4 62.1 478.4
233.8 64.6 723.3 47.5 381.9 509.9 1,083.6
6.8 44.7 34.8 12.9 9.1 58.5 137.9
6.8 44.7 34.7 12.9 9.1 58.5 136.7
0.0 0.0 0.1 0.0 0.0 0.0 1.2
2.0 5.6 34.5 1.5 3.2 9.4 46.3
0.0 33.0 0.3 0.0 0.1 0.1 7.9
0.0 0.0 0.0 0.0 0.0 0.0 0.0
0.0 0.6 0.1 0.0 0.0 0.7 0.8
0.0 0.0 0.0 0.0 0.0 0.0 0.0
6.3 12.7 148.0 43.6 18.9 63.7 156.70.2 0.1 66.6 1.6 0.9 24.2 42.7
0.1 1.6 29.2 9.4 0.1 20.3 48.1
0.0 0.0 0.0 0.0 0.0 0.0 0.0
0.0 0.0 1.3 0.1 0.2 0.1 0.6
0.1 0.1 3.3 0.2 0.4 0.9 1.2
0.0 0.6 3.8 0.0 0.0 1.3 2.1
0.2 0.2 1.2 0.0 0.1 0.2 0.7
0.8 1.2 10.0 0.3 13.7 4.1 32.8
0.3 0.2 2.8 0.1 0.5 0.6 2.7
0.1 0.5 1.2 0.1 0.2 0.2 0.4
2.6 6.0 16.7 0.5 1.4 2.7 9.3
1.1 1.3 8.5 30.7 0.6 7.6 13.4
0.0 0.0 0.0 0.0 0.0 0.0 0.0
0.0 0.6 0.9 0.0 0.2 0.4 0.5
0.8 0.4 2.8 0.4 0.5 1.0 2.2
0.6 0.0 0.0 0.6 0.0 0.0 0.00.6 0.0 0.0 0.6 0.0 0.0 0.0
0.0 0.0 0.0 0.0 0.0 0.0 0.0
15.1 53.5 206.9 8.6 47.7 28.9 96.20.0 0.0 0.0 0.0 0.0 0.0 0.0

0.0 0.0 0.0 0.0 0.0 0.0 0.00.0 0.0 0.0 0.0 0.4 20.0 0.0
7,074.7 1,528.6 11,013.3 442.6 2,008.6 6,209.7 13,695.7
206.1 294.5 3,673.2 29.1 222.1 171.1 1,255.01,006.6 1,718.6 20,238.2 141.5 1,219.2 916.2 6,764.1
101.9 180.6 360.7 14.1 119.8 117.7 749.30.0 0.0 0.0 0.0 0.0 0.0 0.00.5 -3.1 11.3 0.1 -2.6 0.7 3.9
1,315.2 2,190.6 24,283.4 184.8 1,558.4 1,205.6 8,772.5227.2 330.6 3,842.0 25.3 280.9 137.2 1,317.00.0 0.0 0.0 0.0 0.0 0.0 0.04.5 4.5 35.0 0.0 0.0 1.9 5.4
298.5 436.4 5,087.7 33.7 374.6 181.0 1,750.6
-75.7 -110.2 -1,280.7 -8.4 -93.6 -45.7 -439.01,542.4 2,521.2 28,125.5 210.1 1,839.3 1,342.8 10,089.4
p.m. amount of the 2014UK correction (2nd update): 4,795.6
151,342.2 273,002.2 3,091,500.0 20,034.6 182,267.0 176,522.7 1,080,330.0
+5,699.4 -790.4 -14,306.8 +242.9 +349.3 +4,934.0 +4,527.4
+3.77% -0.29% -0.46% +1.21% +0.19% +2.80% +0.42%

FR HR IT CY LV LT LU
4,891.9 255.1 6,280.0 99.0 710.9 296.9 190.22,221.1 32.5 1,060.2 36.6 47.9 99.0 175.3
963.8 0.0 193.1 0.0 0.0 0.0 4.4
0.0 0.0 0.0 0.0 0.0 0.0 3.6
315.2 0.0 135.6 0.0 0.0 0.0 0.0
175.1 0.0 54.2 0.0 0.0 0.0 0.3
473.6 0.0 3.3 0.0 0.0 0.0 0.4
0.0 0.0 0.0 0.0 0.0 52.2 0.0
807.9 12.2 612.5 24.2 7.5 6.9 26.8
791.8 12.2 605.6 24.2 7.4 6.1 26.6
16.1 0.0 6.9 0.0 0.0 0.8 0.2
12.0 0.7 14.8 0.4 0.6 1.1 1.9
159.3 15.0 174.5 10.4 16.9 13.3 19.6
8.5 0.2 4.9 0.0 0.5 0.4 4.5
0.9 1.2 1.2 0.2 0.6 1.6 2.0
79.6 2.8 23.5 0.6 1.0 21.9 16.0
1.6 2.6 0.0 0.4 0.5 21.7 0.0
76.9 0.2 22.4 0.0 0.4 0.0 15.3
1.2 0.0 1.1 0.2 0.1 0.2 0.7
137.0 0.0 15.8 0.0 17.9 0.0 14.7
32.7 0.1 0.9 0.5 2.5 0.1 1.4
10.5 0.0 14.8 0.2 0.3 0.3 72.9
2.4 0.1 1.1 0.0 0.1 0.0 0.0
6.6 0.2 3.2 0.1 0.1 1.2 11.2
2,670.8 222.6 5,219.8 62.3 663.0 197.9 14.92,308.0 194.7 4,957.0 58.5 645.6 172.8 6.1
472.3 127.1 4,014.4 0.0 406.8 129.8 0.0
46.3 0.0 21.0 0.0 0.0 0.0 0.0
1,782.9 0.0 921.4 32.3 0.0 0.0 6.0
6.5 0.0 0.0 0.0 0.0 0.0 0.0
0.0 67.6 0.1 26.3 238.8 43.1 0.1
231.8 3.3 89.6 0.0 7.2 9.7 6.4
3.6 0.0 2.9 0.2 0.4 0.1 1.8
3.6 0.0 2.9 0.2 0.4 0.1 1.8
0.0 0.0 0.0 0.0 0.0 0.0 0.0
34.0 0.0 0.0 0.0 1.1 0.0 0.0
93.0 19.9 170.3 3.6 8.7 9.5 0.0

0.0 4.7 0.0 0.0 0.0 5.7 0.7
0.0 0.0 0.0 0.0 0.0 0.0 0.0
0.0 0.0 0.0 0.0 0.0 0.0 0.0
0.4 0.0 0.0 0.0 0.0 0.0 0.0
0.0 0.0 0.0 0.0 0.0 0.0 0.0
9,031.9 258.0 5,473.0 82.9 253.7 528.4 56.08,129.5 155.9 4,065.7 58.6 167.9 414.7 36.1
8,129.5 155.9 4,065.7 58.6 167.9 414.7 36.1
7,588.7 151.0 3,524.6 51.1 156.5 393.7 33.1
540.8 4.9 541.1 7.4 11.4 20.9 2.9
820.3 94.9 1,295.3 20.8 74.9 106.9 15.1
57.7 6.1 58.0 1.4 2.9 6.4 1.7
57.7 6.1 56.7 1.4 2.9 6.4 1.7
0.0 0.0 1.3 0.0 0.0 0.0 0.0
22.2 1.0 46.0 2.1 7.9 0.3 2.8
0.4 0.1 1.0 0.0 0.0 0.0 0.3
0.0 0.0 0.0 0.0 0.0 0.0 0.0
1.7 0.0 1.8 0.0 0.0 0.0 0.0
0.0 0.0 5.2 0.0 0.0 0.0 0.0
189.9 18.7 250.5 13.8 7.5 41.3 22.137.5 10.0 51.7 5.2 0.5 1.8 2.2
36.4 3.2 57.9 4.3 0.3 26.4 0.7
0.0 0.0 0.0 0.0 0.0 0.0 0.0
1.8 0.2 1.8 0.1 0.3 0.1 0.5
2.4 0.3 4.6 1.0 0.3 0.1 0.2
1.2 0.0 6.0 1.4 0.0 0.0 0.2
2.9 0.5 1.2 0.1 0.1 0.3 0.1
15.6 1.0 22.9 0.8 1.0 3.5 1.8
6.8 0.2 3.9 0.1 0.1 0.2 4.8
0.8 0.3 0.4 0.1 0.1 0.1 2.0
32.5 1.2 11.6 0.2 0.7 0.7 2.0
25.9 1.4 83.7 0.1 3.5 7.6 6.7
0.0 0.0 0.0 0.0 0.0 0.0 0.0
1.7 0.1 1.8 0.3 0.0 0.0 0.2
24.3 0.5 3.0 0.3 0.5 0.6 0.7
0.0 46.4 0.0 0.1 0.2 0.4 0.00.0 46.4 0.0 0.1 0.2 0.4 0.0
0.0 0.0 0.0 0.0 0.0 0.0 0.0
328.8 8.9 259.3 7.5 9.3 10.3 1,381.10.0 0.0 0.0 0.0 0.0 0.0 0.0

0.0 0.0 0.0 0.0 0.0 0.0 0.025.9 17.6 75.6 0.0 0.0 0.0 0.0
14,468.4 604.6 12,338.5 203.3 981.6 877.2 1,649.4
2,849.1 61.1 1,486.9 35.5 28.5 42.9 60.214,661.0 269.4 11,613.3 162.4 161.5 247.2 274.2
1,494.2 26.1 1,125.2 13.8 15.8 25.6 15.70.0 0.0 0.0 0.0 0.0 0.0 0.08.2 0.2 6.1 0.1 0.1 0.1 0.1
19,012.5 356.8 14,231.6 211.9 205.9 315.8 350.31,593.7 40.3 1,688.7 18.3 29.7 73.9 16.5
0.0 0.0 0.0 0.0 0.0 0.0 0.041.4 2.3 5.3 0.0 0.0 1.1 0.0
2,083.5 51.5 2,246.3 24.5 39.6 97.4 22.0
-531.2 -13.4 -562.9 -6.1 -9.9 -24.6 -5.520,606.2 397.1 15,920.3 230.2 235.6 389.7 366.8
2,226,210.9 43,596.5 1,634,366.3 17,473.3 24,308.1 35,750.7 34,327.6
-5,522.5 +226.7 -2,638.7 -23.4 +759.4 +540.3 -94.0
-0.25% +0.52% -0.16% -0.13% +3.12% +1.51% -0.27%

HU MT NL AT PL PT RO
3,774.7 96.0 1,158.9 569.8 8,152.3 1,428.1 3,469.981.5 19.1 962.5 307.2 166.8 212.4 77.4
0.3 0.0 0.7 1.1 3.0 4.1 0.0
0.0 0.0 0.0 0.0 0.0 0.0 0.0
0.0 0.0 0.0 0.0 0.0 0.0 0.0
0.3 0.0 0.7 1.1 0.0 1.6 0.0
0.0 0.0 0.0 0.0 3.0 2.5 0.0
0.0 0.0 0.0 0.0 0.0 0.0 0.0
44.4 2.9 839.2 216.6 59.0 98.0 17.3
44.0 2.9 835.2 216.5 57.9 97.9 17.1
0.4 0.0 4.0 0.1 1.1 0.2 0.2
0.8 0.3 3.5 2.7 5.2 1.9 2.5
32.3 6.1 63.5 30.5 81.0 44.9 55.3
0.5 0.1 2.3 0.9 0.6 0.7 0.3
0.9 0.5 0.5 0.1 1.2 1.1 0.4
1.0 0.4 32.1 53.3 5.8 9.1 0.6
0.1 0.2 0.1 0.2 2.4 0.3 0.5
0.7 0.0 24.1 52.9 3.1 8.6 0.0
0.2 0.2 7.9 0.2 0.4 0.2 0.2
0.0 8.7 2.0 0.0 9.0 4.1 0.0
0.0 0.0 1.7 0.1 0.2 47.0 0.2
1.0 0.2 10.8 0.4 0.2 0.8 0.4
0.1 0.0 0.7 0.4 0.3 0.2 0.1
0.2 0.1 5.4 1.1 1.2 0.6 0.2
3,693.2 76.8 196.4 262.7 7,985.6 1,215.7 3,392.53,503.5 76.7 184.4 159.5 7,812.4 1,075.2 3,224.2
1,690.1 50.6 0.0 11.6 3,894.3 854.0 2,097.8
0.0 5.6 0.0 0.7 0.0 7.9 0.0
12.7 0.0 184.4 147.2 62.3 68.2 25.2
0.0 0.0 0.0 0.0 0.0 2.7 0.0
1,800.7 20.6 0.0 0.0 3,855.8 142.4 1,101.2
140.1 0.0 10.6 100.6 60.2 25.6 44.3
0.6 0.0 1.4 1.9 0.1 0.1 0.1
0.6 0.0 1.4 1.9 0.1 0.1 0.1
0.0 0.0 0.0 0.0 0.0 0.0 0.0
0.0 0.0 0.0 0.0 0.0 0.0 0.0
15.4 0.0 0.0 0.0 75.7 114.8 33.4

33.6 0.1 0.0 0.0 37.2 0.0 90.5
0.0 0.0 0.0 0.0 0.0 0.0 0.0
0.0 0.0 0.0 0.0 0.0 0.0 0.0
0.0 0.0 0.0 0.7 0.0 0.0 0.0
0.0 0.0 0.0 0.0 0.0 0.0 0.0
1,791.4 17.0 915.3 1,144.9 5,079.0 1,097.8 2,987.71,333.2 4.8 843.9 711.2 3,545.3 736.3 1,462.3
1,333.2 4.8 843.9 711.2 3,545.3 736.3 1,462.3
1,282.9 4.3 785.9 692.8 3,352.9 630.0 1,418.9
50.4 0.5 58.0 18.4 192.3 106.2 43.4
450.7 9.8 50.4 421.9 1,362.5 304.3 1,501.5
4.7 1.9 5.8 0.3 161.3 51.6 20.9
4.7 1.9 5.8 0.3 161.3 51.6 20.9
0.0 0.0 0.0 0.0 0.0 0.0 0.0
2.6 0.5 12.3 11.5 9.8 5.6 2.8
0.1 0.0 0.2 0.1 0.1 0.1 0.1
0.0 0.0 0.0 0.0 0.0 0.0 0.0
0.0 0.0 2.6 0.0 0.0 0.0 0.2
0.0 0.0 0.0 0.0 0.0 0.0 0.0
42.2 14.1 186.6 49.9 68.6 36.2 23.68.4 0.7 16.6 12.3 9.0 1.0 2.3
17.8 0.8 16.1 3.6 6.6 3.2 7.5
0.0 0.0 0.0 0.0 0.0 0.0 0.0
0.4 0.2 2.7 1.0 0.1 0.2 0.4
0.3 0.0 2.1 1.3 0.1 0.5 0.7
0.3 0.0 2.1 0.4 0.0 0.4 0.7
1.5 0.1 0.4 0.3 1.1 0.0 0.4
3.6 0.0 6.1 0.9 11.8 2.4 3.4
0.3 0.0 3.1 1.1 0.2 0.6 0.2
0.1 0.1 2.1 0.8 0.1 0.1 0.1
1.6 0.0 8.3 4.0 5.8 1.7 1.2
6.4 11.8 124.9 22.9 32.1 25.1 5.2
0.0 0.0 0.0 0.0 0.0 0.0 0.0
0.6 0.0 0.3 0.4 0.0 0.3 0.0
0.8 0.3 1.8 0.8 1.8 0.9 1.4
6.4 0.0 0.0 0.0 26.9 0.0 29.36.4 0.0 0.0 0.0 26.9 0.0 29.3
0.0 0.0 0.0 0.0 0.0 0.0 0.0
14.5 7.0 98.4 22.9 29.6 33.2 19.10.0 0.0 0.0 0.0 0.0 0.0 0.0

0.0 0.0 0.0 0.0 0.0 0.0 0.00.0 0.0 0.0 0.0 1.3 0.0 8.5
5,629.1 134.2 2,359.2 1,787.4 13,357.7 2,595.4 6,538.0
134.2 15.6 770.7 445.3 542.5 253.9 153.0737.8 70.4 4,899.6 2,046.4 2,897.0 1,152.7 1,057.5
73.5 6.4 86.4 36.3 277.0 121.4 108.30.0 0.0 0.0 0.0 0.0 0.0 0.00.4 0.0 2.5 1.2 1.5 0.6 0.6
945.8 92.3 5,759.2 2,529.2 3,718.0 1,528.7 1,319.4127.8 11.8 2,187.9 197.1 518.4 117.7 127.00.0 0.0 0.0 0.0 0.0 0.0 0.02.5 0.0 9.6 4.2 17.2 0.1 1.1
167.9 15.7 2,907.6 258.6 674.0 156.9 168.3
-42.6 -3.9 -729.3 -65.7 -172.8 -39.2 -42.31,073.6 104.1 7,947.1 2,726.4 4,236.4 1,646.4 1,446.4
105,740.9 8,567.5 678,284.0 335,224.3 411,402.5 175,546.1 157,510.3
+4,636.5 +31.7 -3,695.2 -851.1 +9,483.1 +981.2 +5,154.5
+4.38% +0.37% -0.54% -0.25% +2.31% +0.56% +3.27%

SI SK FI SE UK
700.7 3,147.9 315.3 438.5 3,372.376.3 61.6 208.4 298.5 1,589.6
0.0 0.0 0.9 0.4 86.4
0.0 0.0 0.0 0.0 0.0
0.0 0.0 0.0 0.0 65.4
0.0 0.0 0.9 0.1 3.5
0.0 0.0 0.0 0.3 17.6
0.0 22.6 0.0 0.0 0.0
34.0 7.9 151.9 247.6 1,280.1
33.8 7.7 151.0 243.1 1,209.7
0.2 0.1 0.9 4.5 70.4
1.1 1.2 1.4 2.9 15.0
17.5 23.1 29.5 35.2 120.8
0.3 0.6 0.1 0.7 6.3
0.2 0.4 0.5 0.6 0.5
13.6 5.2 8.3 9.6 37.1
1.0 3.8 0.0 0.0 6.9
12.5 1.1 8.0 9.3 28.6
0.1 0.3 0.3 0.3 1.6
0.0 0.0 15.0 0.1 11.5
8.7 0.1 0.2 0.2 13.5
0.6 0.4 0.4 0.4 8.0
0.0 0.0 0.0 0.5 0.7
0.3 0.2 0.3 0.2 9.6
624.5 3,086.3 106.9 140.0 1,782.7594.3 3,053.6 104.8 96.8 1,637.7
130.6 1,610.9 0.0 0.0 424.3
0.0 0.0 0.0 0.0 41.2
12.7 161.6 101.9 94.9 1,172.1
0.0 0.0 2.9 1.9 0.0
451.0 1,281.1 0.0 0.0 0.1
21.4 11.0 1.2 28.6 77.7
0.0 0.0 0.9 0.5 3.4
0.0 0.0 0.9 0.5 3.4
0.0 0.0 0.0 0.0 0.0
0.0 0.0 0.0 0.9 0.4
2.8 21.7 0.0 13.2 63.4

5.9 0.0 0.0 0.0 0.1
0.0 0.0 0.0 0.0 0.0
0.0 0.0 0.0 0.0 0.0
0.0 0.1 0.0 0.0 0.0
0.0 0.0 0.0 0.0 0.0
191.3 566.5 960.3 904.0 3,788.5138.1 439.7 531.2 699.8 3,101.2
138.1 439.7 531.2 699.8 3,101.2
131.0 431.3 524.9 687.0 3,069.3
7.1 8.5 6.3 12.9 31.8
46.7 122.5 406.6 175.7 619.1
2.4 2.1 8.5 14.3 40.7
2.4 2.1 8.5 14.3 40.1
0.0 0.0 0.0 0.0 0.7
3.9 2.0 8.4 14.2 25.9
0.0 0.1 5.6 0.1 0.1
0.0 0.0 0.0 0.0 0.0
0.0 0.0 0.1 0.0 1.5
0.0 0.0 0.0 0.0 0.0
19.4 9.0 21.6 90.6 149.55.6 2.0 6.2 27.7 43.6
7.8 1.5 5.4 1.2 2.7
0.0 0.0 0.0 0.0 0.0
0.1 0.1 0.0 0.0 1.7
0.2 0.0 0.3 0.7 4.7
0.0 0.0 0.5 0.8 0.2
0.2 0.7 0.3 0.3 0.6
1.0 1.5 0.3 0.5 41.1
0.4 1.0 1.2 0.3 3.8
0.1 0.1 0.2 0.4 0.6
2.8 0.4 3.3 4.8 12.0
0.7 0.9 3.2 53.0 35.4
0.0 0.0 0.0 0.0 0.0
0.1 0.0 0.0 0.0 1.1
0.5 0.8 0.6 0.9 1.8
1.4 0.5 0.0 0.0 0.01.4 0.5 0.0 0.0 0.0
0.0 0.0 0.0 0.0 0.0
8.7 10.9 30.2 34.6 147.40.0 0.0 0.0 0.0 0.0

0.0 0.0 0.0 0.0 0.018.4 0.0 2.6 0.0 0.0
939.9 3,734.8 1,330.0 1,467.7 7,457.6
56.9 85.0 265.6 565.4 3,737.5257.6 473.1 1,328.2 2,896.4 20,599.7
26.0 49.5 134.5 49.8 -6,083.60.0 0.0 0.0 0.0 0.00.1 0.3 0.8 1.6 -44.1
340.7 607.9 1,729.1 3,513.3 18,209.462.7 88.9 125.1 506.0 3,199.90.0 0.0 0.0 0.0 0.00.0 1.8 1.0 3.4 13.583.6 116.7 165.8 671.2 4,253.0
-20.9 -29.6 -41.7 -168.7 -1,066.6403.4 696.8 1,854.1 4,019.3 21,409.3
38,233.2 76,102.1 209,410.0 454,557.8 2,521,046.8
+578.9 +3,095.1 -488.3 -2,200.2 -11,521.4
+1.51% +4.07% -0.23% -0.48% -0.46%

Total
1 SMART AND INCLUSIVE GROWTH 56,265.01.1 Competitiveness for growth and jobs 18,461.2
1.1.1 Large infrastructure projects 2,781.7
1.1.10 European Fund for Strategic Investments (E 1,031.6
1.1.11 Implementation and exploitation of Europe 557.1
1.1.12 International Thermonuclear Experimental 601.8
1.1.13 European Earth Observation Programme (C 591.2
1.1.2 Nuclear decommissioning assistance prog 150.6
1.1.3 Common Strategic Framework (CSF) Resear 10,873.7
1.1.31 The Framework Programme for Research and 10,588.1
1.1.32 Euratom Research and Training Programm 285.7
1.1.4 Programme for the Competitiveness of Ent 239.8
1.1.5 The Union Programme for Education, Train 2,048.3
1.1.6 European Union Programme for Employment 137.9
1.1.7 Action Programmes for customs, for taxatio 120.4
1.1.8 Connecting Europe Facility (CEF) 1,192.8
1.1.81 Energy 142.8
1.1.82 Transport 1,003.7
1.1.83 Informations and Communications Technolo 46.2
1.1.9 Energy projects to aid economic recovery ( 189.1
1.1.DAG Decentralised agencies 325.7
1.1.OTH Other actions and programmes 267.0
1.1.PPA Pilot projects and preparatory actions 17.4
1.1.SPEC Actions financed under the prerogatives o 116.9
1.2 Economic, social and territorial cohesi 37,803.81.2.1 Investment for growth and jobs 35,503.4
1.2.11 Less developed regions (Regional converge 21,674.6
1.2.12 Transition regions 1,502.6
1.2.13 More developed regions (Competitiveness) 4,817.5
1.2.14 Outermost and sparsely populated regions 85.5
1.2.15 Cohesion fund (including contribution to th 7,423.2
1.2.2 European territorial cooperation 711.4
1.2.3 Technical assistance and innovative action 179.4
1.2.31 Technical assistance 179.4
1.2.32 Innovative actions 0.0
1.2.4 Fund for European Aid to the Most Deprive 278.2
1.2.5 Youth Employment Initiative (specific top-up 346.6
2016 (EUR million)

1.2.6 Contribution to the Connecting Europe Facil 777.6
1.2.DAG Decentralised agencies 0.0
1.2.OTH Other actions and programmes 0.0
1.2.PPA Pilot projects and preparatory actions 7.2
1.2.SPEC Actions financed under the prerogatives o 0.0
2 SUSTAINABLE GROWTH: NATURAL RES 57,411.82.0.1 European Agricultural Guarantee Fund (EAG 44,084.5
2.0.10 European Agricultural Guarantee Fund (EAG 44,084.5
Direct Aid 40,808.7
Other 3,275.8
2.0.2 European Agricultural Fund for Rural Deve 12,370.2
2.0.3 European Maritime and Fisheries Fund (EMF 539.3
2.0.31 European Maritime and Fisheries Fund (EM 415.9
2.0.32 Sustainable Fisheries Partnership Agreemen 123.4
2.0.4 Programme for the Environment and Climate 328.9
2.0.DAG Decentralised agencies 52.8
2.0.OTH Other actions and programme 24.0
2.0.PPA Pilot projects and preparatory actions 11.6
2.0.SPEC Actions financed under the prerogatives o 0.5
3 SECURITY AND CITIZENSHIP 3,077.33.0.1 Asylum, Migration and Integration Fund 1,006.4
3.0.2 Internal Security Fund 480.5
3.0.3 IT Systems 18.9
3.0.4 Justice Programme 37.4
3.0.5 Rights, Equality and Citizenship programm 47.2
3.0.6 Union Civil Protection Mechanism 23.0
3.0.7 Europe for Citizens 26.1
3.0.8 Food and feed 238.7
3.0.9 Union action in the field of health (Health 56.8
3.0.10 Consumer Programme 24.5
3.0.11 Creative Europe Programme 185.1
3.0.12 Instrument for Emergency Support within th 138.9
3.0.DAG Decentralised agencies 695.9
3.0.OTH Other actions and programme 0.0
3.0.PPA Pilot projects and preparatory actions 9.2
3.0.SPEC Actions financed under the prerogatives o 88.9
4 GLOBAL EUROPE 10,277.14.0.1 Instrument for Pre-accession Assistance (IP 1,936.2
4.0.OTH other 8,340.8
5 ADMINISTRATION 9,324.2

6 COMPENSATIONS 0.08 NEGATIVE RESERVE 0.09 SPECIAL INSTRUMENTS 61.0TOTAL EXPENDITURE 136,416.4
VAT-based own resourceGNI-based own resourceUK correctionRetro-active implementation of the 2014 Own Resources Decision - NCLump Sum Reduction Granted for DK, NL, AT & SEFSJ adjustment for Denmark, Ireland and the United Kingdom
TOTAL national contributionTraditional own resources (TOR) (80%)Agricultural duties (100%)Sugar levies (100%)Customs duties (100%)Retro-active implementation of the 2014 Own Resources Decision - TORAmounts (20%) retained as TOR collection costs
TOTAL own resourcesSurplus from previous yearSurplus from EAGGF-GuaranteeSurplus external aid guarantee fundOther revenue
TOTAL REVENUE
Gross National Income (GNI), EUR million*
Operating budgetary balance (EUR million)Operating budgetary balance (% GNI)
* GNI figures are based on ESA 2010

earmarked other non-EU EU-28 BE BG
789.3 2,501.0 877.3 52,097.5 1,542.4 1,235.2745.3 2,327.4 870.4 14,518.0 1,336.1 83.2
36.7 1,019.2 77.5 1,648.3 24.1 0.0
6.3 1,011.7 0.0 13.6 0.4 0.0
2.0 0.0 0.0 555.1 7.4 0.0
28.4 6.3 61.0 506.2 1.9 0.0
0.0 1.2 16.6 573.4 14.4 0.0
0.0 0.0 0.0 150.6 0.0 35.9
400.9 1,020.7 661.9 8,790.3 912.4 11.5
382.3 944.6 660.0 8,601.2 901.0 11.4
18.6 76.1 1.9 189.1 11.5 0.1
5.0 165.6 4.6 64.6 19.8 0.1
159.5 0.4 111.9 1,776.5 102.4 31.2
0.7 58.0 1.2 78.0 28.5 0.3
0.8 1.6 1.1 117.0 67.4 1.3
40.6 51.2 6.3 1,094.6 63.8 1.7
0.6 0.8 2.3 139.1 0.2 0.6
39.8 50.0 3.0 910.9 52.6 0.7
0.2 0.5 1.0 44.5 11.1 0.3
18.3 3.0 0.0 167.8 0.0 0.0
8.2 0.0 0.3 317.3 14.5 0.2
74.1 2.2 1.7 189.0 47.6 0.5
0.1 0.5 0.5 16.3 5.7 0.0
0.5 5.2 3.4 107.8 49.8 0.6
44.0 173.6 6.9 37,579.4 206.4 1,152.039.0 0.0 0.0 35,464.4 97.4 1,104.1
8.2 0.0 0.0 21,666.4 2.4 707.1
1.5 0.0 0.0 1,501.1 33.0 0.0
0.2 0.0 0.0 4,817.3 61.7 0.0
0.0 0.0 0.0 85.5 0.0 0.0
29.0 0.0 0.0 7,394.2 0.3 397.0
4.2 54.3 0.0 652.9 40.0 4.2
0.2 45.8 6.6 126.9 41.6 0.1
0.2 45.8 6.6 126.9 41.6 0.1
0.0 0.0 0.0 0.0 0.0 0.0
0.0 0.0 0.0 278.2 14.4 4.7
0.0 0.0 0.0 346.6 7.0 8.2
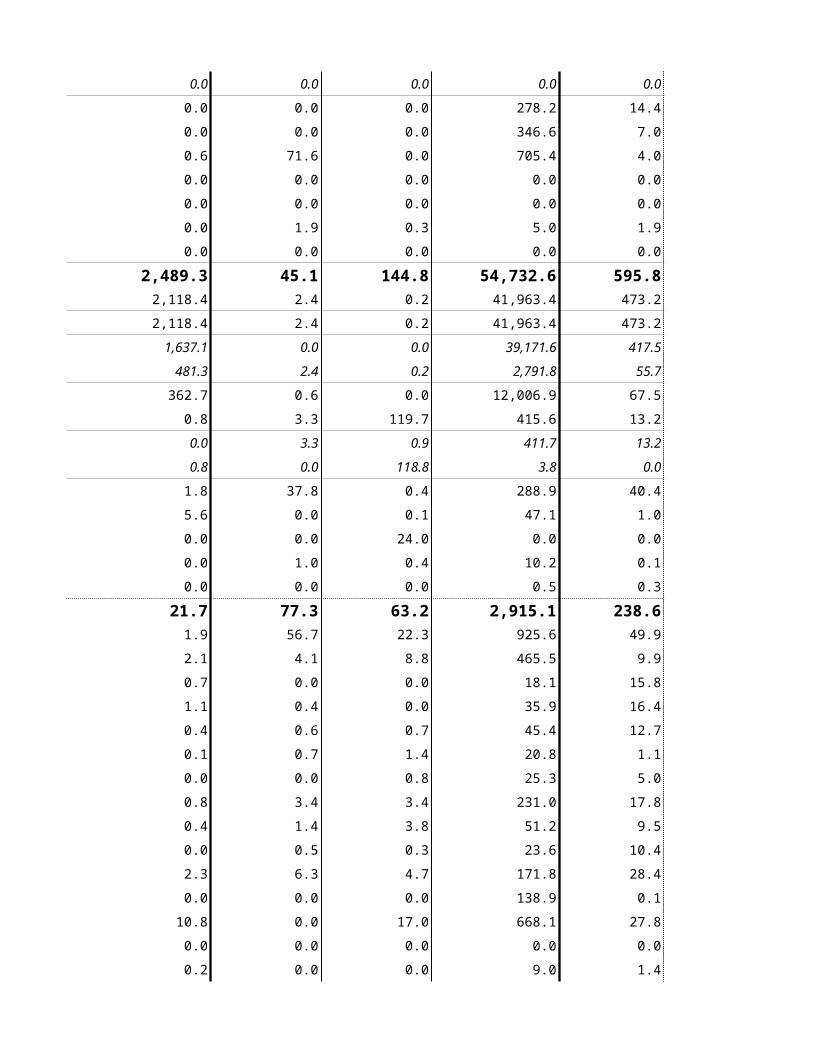
0.6 71.6 0.0 705.4 4.0 30.6
0.0 0.0 0.0 0.0 0.0 0.0
0.0 0.0 0.0 0.0 0.0 0.0
0.0 1.9 0.3 5.0 1.9 0.0
0.0 0.0 0.0 0.0 0.0 0.0
2,489.3 45.1 144.8 54,732.6 595.8 1,013.02,118.4 2.4 0.2 41,963.4 473.2 743.3
2,118.4 2.4 0.2 41,963.4 473.2 743.3
1,637.1 0.0 0.0 39,171.6 417.5 705.3
481.3 2.4 0.2 2,791.8 55.7 38.0
362.7 0.6 0.0 12,006.9 67.5 257.9
0.8 3.3 119.7 415.6 13.2 10.3
0.0 3.3 0.9 411.7 13.2 10.3
0.8 0.0 118.8 3.8 0.0 0.0
1.8 37.8 0.4 288.9 40.4 1.6
5.6 0.0 0.1 47.1 1.0 0.0
0.0 0.0 24.0 0.0 0.0 0.0
0.0 1.0 0.4 10.2 0.1 0.0
0.0 0.0 0.0 0.5 0.3 0.0
21.7 77.3 63.2 2,915.1 238.6 84.61.9 56.7 22.3 925.6 49.9 20.6
2.1 4.1 8.8 465.5 9.9 55.0
0.7 0.0 0.0 18.1 15.8 0.0
1.1 0.4 0.0 35.9 16.4 0.4
0.4 0.6 0.7 45.4 12.7 0.8
0.1 0.7 1.4 20.8 1.1 0.0
0.0 0.0 0.8 25.3 5.0 0.4
0.8 3.4 3.4 231.0 17.8 2.4
0.4 1.4 3.8 51.2 9.5 0.1
0.0 0.5 0.3 23.6 10.4 0.1
2.3 6.3 4.7 171.8 28.4 0.9
0.0 0.0 0.0 138.9 0.1 0.0
10.8 0.0 17.0 668.1 27.8 3.2
0.0 0.0 0.0 0.0 0.0 0.0
0.2 0.0 0.0 9.0 1.4 0.0
0.9 3.2 0.0 84.7 32.6 0.7
822.7 2,355.7 7,043.1 55.5 0.0 0.6301.0 265.7 1,314.0 55.5 0.0 0.6
521.8 2,090.0 5,729.1 0.0 0.0 0.0
475.3 554.5 253.1 8,041.4 4,955.8 12.0

0.0 0.0 0.0 0.0 0.0 0.00.0 0.0 0.0 0.0 0.0 0.0
27.6 0.0 0.0 33.4 0.3 0.04,626.0 5,533.6 8,381.4 117,875.4 7,333.1 2,345.4
VAT-based own resource 15,895.1 516.6 62.4GNI-based own resource 95,578.4 2,733.8 281.4UK correction 626.1 325.8 34.5Retro-active implementation of the 2014 Own Resources Decision - NC -4.1 380.2 13.0Lump Sum Reduction Granted for DK, NL, AT & SE -21.8 31.4 3.2FSJ adjustment for Denmark, Ireland and the United Kingdom 6.4 3.3 0.4
TOTAL national contribution 112,080.2 3,991.1 394.8Traditional own resources (TOR) (80%) 20,094.1 2,070.8 71.9Agricultural duties (100%) 0.0 0.0 0.0Sugar levies (100%) 165.8 8.8 0.5Customs duties (100%) 24,951.9 2,579.7 89.4Retro-active implementation of the 2014 Own Resources Decision - TORAmounts (20%) retained as TOR collection costs -5,023.5 -517.7 -18.0
TOTAL own resources 132,174.3 6,061.9 466.8Surplus from previous year 10,565.8Surplus from EAGGF-Guarantee 0.0 p.m. amount of the 2015Surplus external aid guarantee fund 0.0 UK correction (2nd update):Other revenue 1,349.1
TOTAL REVENUE 144,089.2
Gross National Income (GNI), EUR million* 14,790,681.1 421,269.8 46,946.1
Operating budgetary balance (EUR million) 0.00 -1,533.9 +1,946.5
Operating budgetary balance (% GNI) 0.00% -0.36% +4.15%

CZ DK DE EE IE EL ES
3,440.3 311.5 3,334.6 356.0 325.4 2,521.8 5,027.4123.1 280.7 1,981.6 60.2 213.1 282.8 1,247.7
0.0 8.9 255.5 0.0 0.0 0.5 115.2
0.0 0.0 0.0 0.0 0.0 0.0 0.0
0.0 0.0 87.7 0.0 0.0 0.0 7.6
0.0 0.5 15.8 0.0 0.0 0.0 75.2
0.0 8.4 152.0 0.0 0.0 0.5 32.3
0.0 0.0 0.0 0.0 0.0 0.0 0.0
54.5 202.7 1,318.2 20.1 149.5 194.1 782.2
53.8 202.6 1,255.2 20.0 149.5 193.8 778.8
0.7 0.2 63.0 0.1 0.0 0.3 3.3
0.1 2.6 3.1 0.1 0.3 0.6 5.7
41.9 25.8 183.5 15.7 27.9 51.1 159.9
0.1 0.9 4.9 0.0 0.4 0.9 4.2
0.3 0.8 0.7 0.5 0.7 0.7 1.1
5.0 33.1 137.5 23.0 15.1 7.1 157.8
4.1 5.0 1.7 19.8 7.0 0.3 1.6
0.5 27.8 132.7 2.6 7.6 6.3 155.8
0.5 0.3 3.0 0.5 0.5 0.6 0.4
0.0 2.8 10.0 0.0 0.0 0.0 0.0
19.9 0.0 44.1 0.1 18.7 25.8 15.6
1.1 1.4 16.3 0.4 0.2 1.1 2.4
0.0 0.5 0.3 0.1 0.0 0.2 1.7
0.4 1.2 7.5 0.2 0.2 0.7 1.9
3,317.1 30.8 1,353.0 295.8 112.3 2,239.0 3,779.73,244.4 14.0 1,266.0 292.6 109.7 2,127.7 3,573.4
1,725.2 0.0 286.8 170.9 44.9 1,197.6 2,024.2
0.0 3.6 379.5 0.0 0.0 337.9 417.5
49.0 10.4 599.6 0.0 64.8 337.7 1,107.0
0.0 0.0 0.0 0.0 0.0 0.0 13.6
1,470.3 0.0 0.0 121.7 0.0 254.4 11.1
15.3 16.6 47.9 2.0 0.5 46.0 58.4
0.0 0.3 38.4 0.0 0.1 0.3 0.6
0.0 0.3 38.4 0.0 0.1 0.3 0.6
0.0 0.0 0.0 0.0 0.0 0.0 0.0
0.9 0.0 0.0 1.2 0.0 11.9 118.8
0.5 0.0 0.0 0.0 2.0 52.9 28.3

56.0 0.0 0.0 0.0 0.0 0.2 0.0
0.0 0.0 0.0 0.0 0.0 0.0 0.0
0.0 0.0 0.0 0.0 0.0 0.0 0.0
0.0 0.0 0.7 0.0 0.0 0.0 0.0
0.0 0.0 0.0 0.0 0.0 0.0 0.0
1,210.1 1,046.7 6,306.8 259.1 1,634.1 2,939.8 6,275.7860.7 872.7 5,121.2 122.6 1,225.9 2,145.5 5,243.9
860.7 872.7 5,121.2 122.6 1,225.9 2,145.5 5,243.9
834.0 852.3 4,874.8 112.8 1,208.1 2,070.3 4,795.2
26.7 20.4 246.4 9.7 17.9 75.2 448.7
343.9 118.1 1,142.2 131.6 399.0 763.5 881.5
0.9 15.7 12.7 4.6 8.4 24.9 93.6
0.9 15.7 12.6 4.6 8.4 24.9 92.3
0.0 0.0 0.1 0.0 0.0 0.0 1.3
4.5 5.8 30.5 0.3 0.8 5.8 47.2
0.0 33.7 0.2 0.0 0.1 0.1 7.9
0.0 0.0 0.0 0.0 0.0 0.0 0.0
0.0 0.8 0.0 0.0 0.0 0.1 1.6
0.0 0.0 0.0 0.0 0.0 0.0 0.0
23.9 16.6 221.1 50.3 30.2 361.7 182.710.0 0.0 120.0 2.6 9.7 143.8 80.1
4.8 1.1 26.8 6.4 2.1 45.4 28.5
0.0 0.0 0.0 0.0 0.0 0.0 0.0
0.2 0.0 2.0 0.1 0.7 0.5 1.1
0.1 0.3 3.9 0.3 0.6 1.3 2.1
0.0 0.2 3.6 0.3 0.0 0.6 1.3
0.6 0.0 1.8 0.2 0.2 0.2 1.2
1.0 1.9 11.4 1.9 11.4 11.3 38.3
0.1 0.3 2.8 0.0 0.7 1.5 3.2
0.1 0.3 1.7 0.1 0.4 0.1 0.1
3.0 7.1 17.9 0.7 2.4 2.6 6.8
0.0 0.0 0.0 0.0 0.0 138.8 0.0
3.1 4.7 24.4 37.3 1.5 14.5 16.8
0.0 0.0 0.0 0.0 0.0 0.0 0.0
0.0 0.3 1.1 0.0 0.0 0.0 0.7
0.8 0.4 3.6 0.4 0.5 1.1 2.6
0.0 0.0 0.0 0.0 0.0 0.0 0.00.0 0.0 0.0 0.0 0.0 0.0 0.0
0.0 0.0 0.0 0.0 0.0 0.0 0.0
15.8 56.4 219.7 8.3 48.0 25.0 107.2
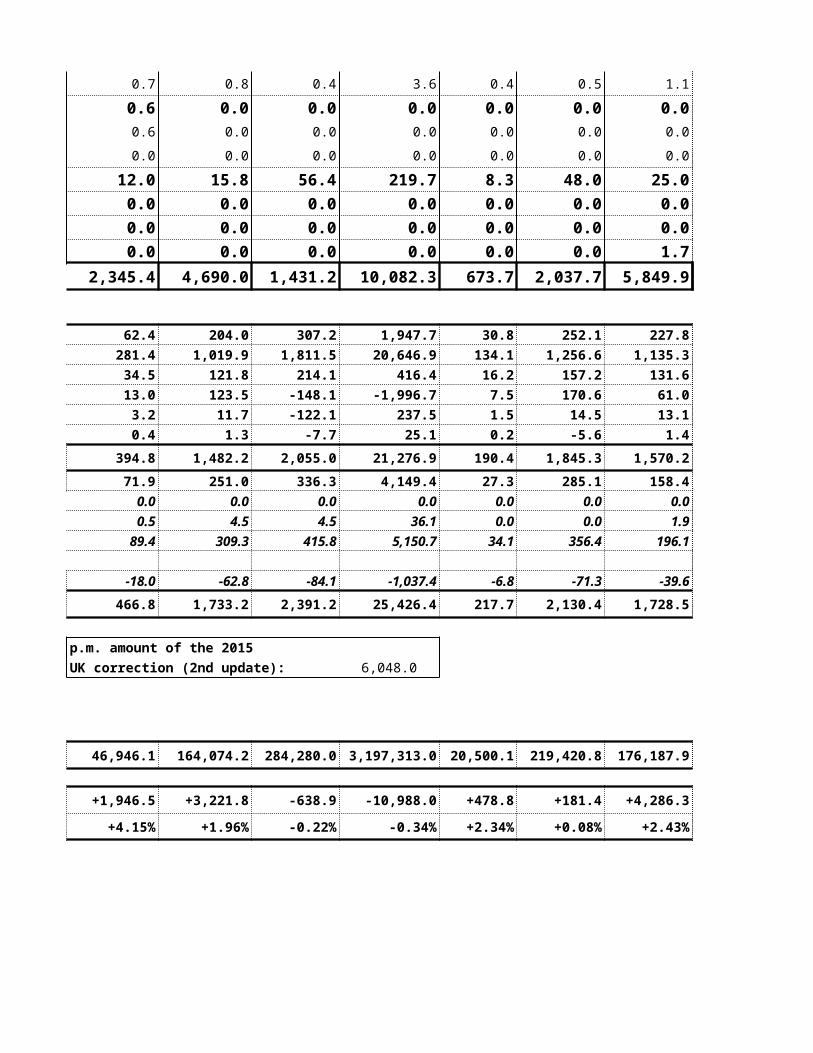
0.0 0.0 0.0 0.0 0.0 0.0 0.00.0 0.0 0.0 0.0 0.0 0.0 0.00.0 0.0 0.0 0.0 0.0 1.7 0.0
4,690.0 1,431.2 10,082.3 673.7 2,037.7 5,849.9 11,592.9
204.0 307.2 1,947.7 30.8 252.1 227.8 1,416.91,019.9 1,811.5 20,646.9 134.1 1,256.6 1,135.3 7,220.0
121.8 214.1 416.4 16.2 157.2 131.6 835.0123.5 -148.1 -1,996.7 7.5 170.6 61.0 444.6
11.7 -122.1 237.5 1.5 14.5 13.1 83.11.3 -7.7 25.1 0.2 -5.6 1.4 8.7
1,482.2 2,055.0 21,276.9 190.4 1,845.3 1,570.2 10,008.2251.0 336.3 4,149.4 27.3 285.1 158.4 1,512.00.0 0.0 0.0 0.0 0.0 0.0 0.04.5 4.5 36.1 0.0 0.0 1.9 6.3
309.3 415.8 5,150.7 34.1 356.4 196.1 1,883.7
-62.8 -84.1 -1,037.4 -6.8 -71.3 -39.6 -378.01,733.2 2,391.2 25,426.4 217.7 2,130.4 1,728.5 11,520.2
p.m. amount of the 2015UK correction (2nd update): 6,048.0
164,074.2 284,280.0 3,197,313.0 20,500.1 219,420.8 176,187.9 1,114,601.0
+3,221.8 -638.9 -10,988.0 +478.8 +181.4 +4,286.3 +1,678.1
+1.96% -0.22% -0.34% +2.34% +0.08% +2.43% +0.15%

FR HR IT CY LV LT LU
3,244.2 536.3 5,915.0 88.6 328.6 691.1 229.42,216.0 39.0 1,344.6 38.7 31.4 158.0 196.2
830.2 0.0 233.8 0.0 0.0 0.0 14.1
0.0 0.0 0.0 0.0 0.0 0.0 13.2
306.9 0.0 92.2 0.0 0.0 0.0 0.0
323.0 0.0 79.5 0.0 0.0 0.0 0.2
200.2 0.0 62.1 0.0 0.0 0.0 0.7
0.0 0.0 0.0 0.0 0.0 77.2 0.0
1,034.8 12.6 744.9 22.5 6.6 9.4 54.7
1,025.8 12.6 724.3 22.4 6.5 9.3 53.0
8.9 0.0 20.6 0.0 0.0 0.1 1.8
7.5 0.1 6.0 0.1 0.1 0.5 1.0
173.6 19.8 194.8 14.0 15.8 26.7 11.8
7.2 0.0 6.2 0.0 0.1 0.6 5.9
3.0 2.0 1.2 0.3 0.8 1.1 23.2
98.9 3.6 63.6 0.9 4.6 41.6 5.2
4.6 2.2 0.4 0.0 0.2 33.3 0.3
91.8 0.9 61.6 0.4 4.1 8.0 2.0
2.5 0.4 1.5 0.5 0.3 0.3 2.9
0.0 0.0 77.0 0.0 0.0 0.0 0.0
36.1 0.2 1.0 0.6 2.9 0.1 1.3
13.6 0.4 10.7 0.1 0.4 0.3 65.4
2.7 0.0 1.2 0.1 0.0 0.0 0.0
8.4 0.3 4.3 0.1 0.1 0.3 13.6
1,028.3 497.3 4,570.4 49.9 297.1 533.1 33.2901.5 431.0 4,354.8 47.1 284.7 521.6 2.5
330.5 280.8 3,713.3 0.0 165.1 368.9 0.0
172.4 0.0 42.5 0.0 0.0 0.0 0.0
386.2 0.0 599.1 18.4 0.0 0.0 2.5
12.5 0.0 0.0 0.0 0.0 0.0 0.0
0.0 150.3 0.0 28.7 119.6 152.8 0.0
91.8 4.7 101.6 0.0 1.8 1.6 7.3
3.8 0.0 1.4 0.2 0.1 0.1 23.2
3.8 0.0 1.4 0.2 0.1 0.1 23.2
0.0 0.0 0.0 0.0 0.0 0.0 0.0
0.0 0.0 29.7 0.0 4.0 8.4 0.2
31.1 6.3 82.7 2.4 6.6 1.4 0.0

0.0 55.2 0.0 0.1 0.0 0.0 0.1
0.0 0.0 0.0 0.0 0.0 0.0 0.0
0.0 0.0 0.0 0.0 0.0 0.0 0.0
0.0 0.0 0.0 0.0 0.0 0.0 0.0
0.0 0.0 0.0 0.0 0.0 0.0 0.0
7,353.0 305.5 5,109.0 77.9 371.5 721.1 59.06,612.9 141.2 4,052.3 57.9 189.3 440.6 37.9
6,612.9 141.2 4,052.3 57.9 189.3 440.6 37.9
6,088.0 130.6 3,481.7 49.8 177.9 409.9 33.2
524.8 10.6 570.7 8.1 11.4 30.7 4.6
702.6 151.3 980.8 16.6 172.1 276.2 14.9
23.4 12.4 28.7 2.6 8.1 2.9 2.1
23.4 12.4 27.3 2.6 8.1 2.9 2.1
0.0 0.0 1.4 0.0 0.0 0.0 0.0
11.3 0.5 44.6 0.8 2.0 1.3 3.8
0.3 0.1 0.9 0.0 0.0 0.0 0.3
0.0 0.0 0.0 0.0 0.0 0.0 0.0
2.5 0.0 1.4 0.0 0.0 0.1 0.0
0.0 0.0 0.2 0.0 0.0 0.0 0.0
314.9 19.7 269.4 12.6 24.6 55.2 28.7121.0 4.1 41.7 4.9 4.5 3.6 4.0
37.3 6.6 73.6 3.4 8.1 37.0 0.5
2.3 0.0 0.0 0.0 0.0 0.0 0.0
1.5 0.2 3.6 0.2 0.2 0.4 1.4
1.1 0.5 5.3 0.4 0.3 0.2 0.4
0.3 0.6 4.4 0.2 0.0 0.0 0.5
3.4 0.5 1.8 0.1 0.5 0.2 0.2
17.2 3.5 26.3 0.5 3.2 3.8 2.7
7.9 0.2 4.1 0.0 0.1 0.1 4.9
0.8 0.2 0.9 0.1 0.2 0.1 2.4
42.5 1.1 11.3 1.6 0.7 0.6 1.9
0.0 0.0 0.0 0.0 0.0 0.0 0.0
54.2 1.4 92.4 0.3 6.3 8.5 8.4
0.0 0.0 0.0 0.0 0.0 0.0 0.0
1.8 0.2 1.1 0.4 0.1 0.0 0.5
23.6 0.5 2.8 0.5 0.5 0.6 1.0
0.0 50.9 0.0 0.0 0.0 0.0 0.00.0 50.9 0.0 0.0 0.0 0.0 0.0
0.0 0.0 0.0 0.0 0.0 0.0 0.0
362.9 8.9 268.7 5.3 9.4 10.0 1,470.5

0.0 0.0 0.0 0.0 0.0 0.0 0.00.0 0.0 0.0 0.0 0.0 0.0 0.00.0 0.0 30.0 0.7 0.0 0.0 0.0
11,275.0 921.4 11,592.1 185.1 734.1 1,477.4 1,787.7
2,913.8 66.5 1,777.3 25.9 29.6 45.3 52.514,650.4 285.9 10,763.3 111.3 166.9 242.6 225.8
1,725.3 34.6 1,261.9 13.3 19.5 28.2 30.11,064.0 13.4 887.8 9.9 6.7 12.0 4.6
168.5 3.3 123.8 1.3 1.9 2.8 2.618.0 0.4 13.2 0.1 0.2 0.3 0.3
20,540.0 404.0 14,827.3 161.8 224.9 331.3 316.01,636.5 46.7 1,788.4 21.1 34.7 77.5 19.5
0.0 0.0 0.0 0.0 0.0 0.0 0.041.4 2.3 5.3 0.0 0.0 1.1 0.0
2,004.2 56.0 2,230.2 26.4 43.4 95.8 24.4
-409.1 -11.7 -447.1 -5.3 -8.7 -19.4 -4.922,176.5 450.7 16,615.7 182.9 259.6 408.8 335.5
2,261,420.2 43,988.0 1,675,309.7 17,418.8 25,102.1 37,012.9 35,184.1
-9,216.3 +516.5 -3,206.8 +21.2 +504.3 +1,142.8 +7.5
-0.41% +1.17% -0.19% +0.12% +2.01% +3.09% +0.02%

HU MT NL AT PL PT RO
2,836.5 112.7 1,086.0 475.4 5,757.1 1,857.5 4,535.298.0 17.9 988.9 378.5 254.9 242.3 126.6
0.3 0.0 5.0 5.9 12.9 4.6 0.0
0.0 0.0 0.0 0.0 0.0 0.0 0.0
0.0 0.0 0.6 0.1 0.0 0.0 0.0
0.1 0.0 0.2 0.0 0.2 0.9 0.0
0.2 0.0 4.2 5.7 12.7 3.6 0.0
0.0 0.0 0.0 0.0 0.0 0.0 0.0
44.0 8.0 832.5 238.1 69.4 130.7 29.6
43.6 8.0 827.5 237.8 69.0 130.2 29.3
0.4 0.0 5.1 0.2 0.5 0.5 0.3
1.4 0.1 3.0 1.6 0.6 0.8 0.1
40.3 8.0 74.4 40.1 123.1 48.9 66.6
0.7 0.0 2.0 0.5 0.7 0.4 0.1
0.7 0.9 1.7 0.2 2.2 1.2 1.5
1.8 0.5 56.4 89.3 7.6 3.5 27.3
0.6 0.0 0.1 0.2 2.6 0.1 25.8
0.9 0.1 46.2 87.9 4.4 2.6 1.3
0.4 0.4 10.2 1.2 0.6 0.8 0.2
7.3 0.0 0.3 0.0 35.8 0.0 0.0
0.1 0.0 2.3 0.1 0.2 50.2 0.4
1.1 0.3 6.7 0.8 0.8 1.6 0.7
0.0 0.0 0.7 0.2 0.4 0.0 0.0
0.4 0.1 3.8 1.7 1.3 0.4 0.3
2,738.5 94.8 97.1 96.9 5,502.2 1,615.3 4,408.62,575.3 94.4 92.1 48.9 5,139.4 1,513.6 4,296.8
2,151.9 26.7 0.0 0.0 2,626.9 1,277.8 3,080.5
0.0 26.3 0.0 2.0 0.0 14.4 0.0
42.0 0.0 92.1 46.9 170.3 75.6 25.2
0.0 0.0 0.0 0.0 0.0 22.9 0.0
381.4 41.4 0.0 0.0 2,342.2 122.9 1,191.1
12.9 0.0 2.9 42.1 11.4 21.2 45.1
0.6 0.0 2.1 2.5 0.3 0.1 0.0
0.6 0.0 2.1 2.5 0.3 0.1 0.0
0.0 0.0 0.0 0.0 0.0 0.0 0.0
0.0 0.4 0.0 2.0 57.0 16.0 3.9
5.6 0.0 0.0 0.0 84.9 7.1 3.2

143.9 0.0 0.0 0.0 209.1 57.2 59.6
0.0 0.0 0.0 0.0 0.0 0.0 0.0
0.0 0.0 0.0 0.0 0.0 0.0 0.0
0.2 0.0 0.0 1.4 0.0 0.0 0.0
0.0 0.0 0.0 0.0 0.0 0.0 0.0
1,667.2 13.6 871.8 1,364.1 4,742.4 1,424.7 2,757.71,319.8 5.6 767.9 719.0 3,595.1 756.0 1,568.9
1,319.8 5.6 767.9 719.0 3,595.1 756.0 1,568.9
1,266.1 5.0 703.4 686.4 3,339.9 645.9 1,521.3
53.7 0.6 64.5 32.7 255.3 110.1 47.6
342.9 6.1 73.2 636.4 1,097.9 655.1 1,140.8
1.3 1.6 14.1 0.3 38.9 11.7 46.9
1.3 1.6 14.1 0.3 38.9 11.7 46.9
0.0 0.0 0.0 0.0 0.0 0.0 0.0
3.2 0.3 15.7 8.3 10.4 1.3 1.0
0.0 0.0 0.2 0.1 0.0 0.0 0.2
0.0 0.0 0.0 0.0 0.0 0.0 0.0
0.0 0.0 0.8 0.0 0.0 0.6 0.0
0.0 0.0 0.0 0.0 0.0 0.0 0.0
27.2 73.9 227.0 76.4 108.4 65.9 43.75.6 22.6 42.5 31.2 25.6 16.9 10.8
4.2 26.9 12.4 3.1 26.8 5.5 12.4
0.0 0.0 0.0 0.0 0.0 0.0 0.0
0.0 0.0 1.7 1.1 0.1 1.3 0.5
0.6 0.4 3.1 2.0 0.5 0.9 0.1
0.0 0.0 1.2 0.8 0.1 0.0 0.7
1.9 0.2 0.6 0.6 1.3 0.2 0.7
4.7 0.1 6.9 1.6 7.6 5.4 7.3
0.2 0.1 6.4 0.5 0.3 0.2 0.2
0.2 0.1 1.8 0.5 0.1 0.1 0.1
1.4 0.0 7.6 6.0 4.0 1.4 0.6
0.0 0.0 0.0 0.0 0.0 0.0 0.0
7.5 23.2 140.4 28.1 40.4 32.8 9.0
0.0 0.0 0.0 0.0 0.0 0.0 0.0
0.0 0.0 0.6 0.2 0.0 0.2 0.1
0.9 0.3 1.9 0.6 1.6 1.0 1.2
0.1 0.0 0.0 0.0 0.0 0.0 3.80.1 0.0 0.0 0.0 0.0 0.0 3.8
0.0 0.0 0.0 0.0 0.0 0.0 0.0
15.2 7.3 104.1 24.0 29.9 35.9 19.4

0.0 0.0 0.0 0.0 0.0 0.0 0.00.0 0.0 0.0 0.0 0.0 0.0 0.00.0 0.0 0.0 0.0 0.0 0.4 0.0
4,546.1 207.5 2,289.0 1,939.9 10,637.8 3,384.4 7,359.9
131.9 13.7 418.1 467.0 536.9 261.3 166.4701.0 58.9 4,535.0 2,232.9 2,671.0 1,172.2 1,067.1
83.1 7.2 94.3 45.2 318.5 139.0 127.644.4 2.5 -1,798.8 180.2 149.1 77.1 32.4
8.1 0.7 -709.3 14.7 30.4 13.5 12.20.8 0.1 5.5 2.7 3.2 1.4 1.3
969.4 83.1 2,544.6 2,942.8 3,709.1 1,664.5 1,407.0142.3 12.1 2,373.7 214.0 591.3 138.4 163.20.0 0.0 0.0 0.0 0.0 0.0 0.02.8 0.0 9.7 4.2 16.6 0.1 1.4
175.1 15.1 2,957.5 263.3 722.5 172.9 202.6
-35.6 -3.0 -593.4 -53.5 -147.8 -34.6 -40.81,111.7 95.1 4,918.3 3,156.8 4,300.4 1,802.9 1,570.2
108,611.7 9,329.8 687,301.0 347,563.8 408,179.4 181,105.6 164,714.8
+3,580.9 +118.8 -308.7 -967.9 +6,973.1 +1,717.3 +5,961.6
+3.30% +1.27% -0.04% -0.28% +1.71% +0.95% +3.62%

SI SK FI SE UK
234.6 2,075.0 464.1 587.7 2,947.784.2 85.5 319.6 456.1 1,833.1
0.0 0.0 4.2 10.7 122.5
0.0 0.0 0.0 0.0 0.0
0.0 0.0 0.0 0.0 52.6
0.0 0.0 0.7 0.8 7.1
0.0 0.0 3.5 9.9 62.8
0.0 37.4 0.0 0.0 0.0
43.7 18.0 160.7 299.8 1,385.3
43.3 17.8 158.4 298.6 1,317.7
0.4 0.1 2.3 1.1 67.6
0.5 0.8 0.7 0.0 7.1
21.1 25.5 31.7 38.8 162.4
0.5 0.4 0.3 3.0 8.8
0.2 0.4 1.4 0.8 0.8
4.3 1.7 63.8 67.8 108.3
0.3 0.4 12.6 0.0 15.1
3.8 0.9 49.9 67.2 90.7
0.2 0.4 1.4 0.6 2.5
0.0 0.3 0.0 33.1 1.1
13.0 0.1 54.6 0.2 15.0
0.7 0.7 1.4 0.9 11.6
0.0 0.0 0.4 0.7 1.0
0.2 0.2 0.4 0.3 9.2
150.4 1,989.6 144.5 131.6 1,114.6111.5 1,904.2 136.6 104.6 1,074.2
35.5 1,267.2 0.0 0.0 182.2
0.0 0.0 0.0 0.0 72.0
25.2 78.8 113.0 91.9 820.0
0.0 0.0 23.6 12.8 0.0
50.7 558.2 0.0 0.0 0.0
15.2 11.7 5.5 21.4 23.7
0.0 0.1 1.0 0.4 9.5
0.0 0.1 1.0 0.4 9.5
0.0 0.0 0.0 0.0 0.0
2.4 0.1 1.4 0.1 0.5
0.3 4.9 0.0 5.1 6.2

20.8 68.5 0.0 0.0 0.0
0.0 0.0 0.0 0.0 0.0
0.0 0.0 0.0 0.0 0.0
0.0 0.1 0.0 0.0 0.5
0.0 0.0 0.0 0.0 0.0
279.0 566.4 978.9 956.6 3,832.2147.1 435.6 538.0 684.9 3,084.7
147.1 435.6 538.0 684.9 3,084.7
137.6 425.4 522.2 666.2 3,010.7
9.5 10.2 15.8 18.7 74.0
128.3 127.4 425.2 248.2 705.7
0.7 1.3 9.1 8.1 16.9
0.7 1.3 9.1 8.1 15.9
0.0 0.0 0.0 0.0 1.0
2.8 2.1 5.1 15.3 22.4
0.0 0.0 1.4 0.1 0.3
0.0 0.0 0.0 0.0 0.0
0.0 0.0 0.1 0.0 2.1
0.0 0.0 0.0 0.0 0.1
21.0 10.7 54.9 132.7 138.42.9 1.7 34.7 60.9 49.6
9.3 2.2 9.4 4.9 1.7
0.0 0.0 0.0 0.0 0.0
0.7 0.0 0.1 0.0 1.6
1.0 0.4 1.0 1.6 3.8
0.5 0.1 0.9 1.6 1.8
0.3 1.5 0.2 0.4 0.9
1.0 1.4 0.3 1.4 38.8
0.6 0.3 0.5 0.2 6.2
0.2 0.2 0.4 0.7 1.2
2.9 0.6 1.4 4.8 11.5
0.0 0.0 0.0 0.0 0.0
1.1 1.4 5.4 55.3 18.6
0.0 0.0 0.0 0.0 0.0
0.0 0.0 0.0 0.0 0.3
0.5 0.8 0.5 0.9 2.4
0.1 0.1 0.0 0.0 0.00.1 0.1 0.0 0.0 0.0
0.0 0.0 0.0 0.0 0.0
10.1 10.6 32.8 34.9 133.0

0.0 0.0 0.0 0.0 0.00.0 0.0 0.0 0.0 0.00.0 0.0 0.0 0.0 0.3
544.9 2,662.8 1,530.8 1,711.9 7,051.6
53.6 79.9 274.6 300.5 3,314.9252.7 500.6 1,372.4 3,077.4 15,251.5
30.1 59.5 164.1 62.1 -5,870.222.1 33.3 132.9 -606.5 673.3
2.9 5.8 15.8 -159.9 165.30.3 0.6 1.7 3.5 -74.3
361.6 679.7 1,961.5 2,677.1 13,460.565.8 99.1 133.1 513.2 3,161.10.0 0.0 0.0 0.0 0.00.0 1.8 1.1 3.5 11.982.2 122.1 165.3 638.0 3,939.5
-16.4 -24.8 -33.3 -128.3 -790.3427.4 778.8 2,094.7 3,190.3 16,621.6
39,302.3 79,711.4 216,333.0 469,820.4 2,338,679.2
+180.3 +1,986.0 -424.3 -946.4 -6,272.2
+0.46% +2.49% -0.20% -0.20% -0.27%