Embed Size (px)
Citation preview

EBRD Private Equity Funds Portfolio to 31 December 2012

Contents
1. Introduction
2. Funds Portfolio
3. EBRD Net Returns & Performance
4. Performance and Composition of Underlying Portfolio
5. LP Data
6. General Information
© European Bank for Reconstruction and Development 2014 2

Introduction
© European Bank for Reconstruction and Development 2014 3

Why does EBRD invest in Private Equity?
4
Efficiently deploy equity capital to companies
Provide co-investment facilities (debt, mezzanine and equity)
Maintain existing relationships with successful fund managers and support sustainable flow of
funding
Provide active supervision and set high standards on integrity, processes and ESG
Foster sustainable investments and strong returns
Build a sustainable private equity industry in the region
Share extensive in-house experience of macro, equity sector and country issues with fund
managers and institutional investors
Support the establishment of first time and innovative funds
Set return benchmarks and report widely on the regional performances through
conferences and industry associations
Continue to cooperate with other IFIs to mobilise institutional investors into the region
© European Bank for Reconstruction and Development 2014

Private Equity Penetration
© European Bank for Reconstruction and Development 2014 5
0.6
02%
0.5
30%
0.3
73%
0.3
69%
0.3
52%
0.3
12%
0.2
60%
0.2
58%
0.2
47%
0.2
44%
0.2
26%
0.2
11%
0.1
90%
0.1
59%
0.1
53%
0.1
37%
0.1
37%
0.1
25%
0.1
09%
0.1
03%
0.0
86%
0.0
84%
0.0
82%
0.0
73%
0.0
69%
0.0
33%
0.0
23%
0.0
20%
0.0
18%
0.0
17%
0.0
14%
0.0
10%
Source: EVCA/PEREP_Analytics
Private Equity Investment as a Percentage of GDP by Country

Key Facts about EBRD’s work in Private Equity
© European Bank for Reconstruction and Development 2014 6
• Most Active private equity fund investor in Central and South-East Europe (CSE) and the
Commonwealth of Independent States (CIS).
• Covering a wide spectrum of fund sizes and investment strategies; regional and country-specific
funds, generalist and sector-specific funds.
Historic Activity:
• 20 years investing in the asset class with EUR 3.4 billion commitments to 147 funds with total
capital of EUR 18.2 billion.
• Around 60% of funds (by number) are first time funds.
• Supporting 83 fund managers.
• Over 850 fully exited underlying investees in the funds’ portfolio.
Current Portfolio:
• Current portfolio of 96 active funds managed by 62 fund managers with EUR 2.7 billion in
commitments with total capital of EUR 16.1 billion.
• Around 45% of active funds (by number) are first time funds.
• Over 400 unrealised underlying investees in the funds’ portfolio.

Funds Portfolio
© European Bank for Reconstruction and Development 2014 7
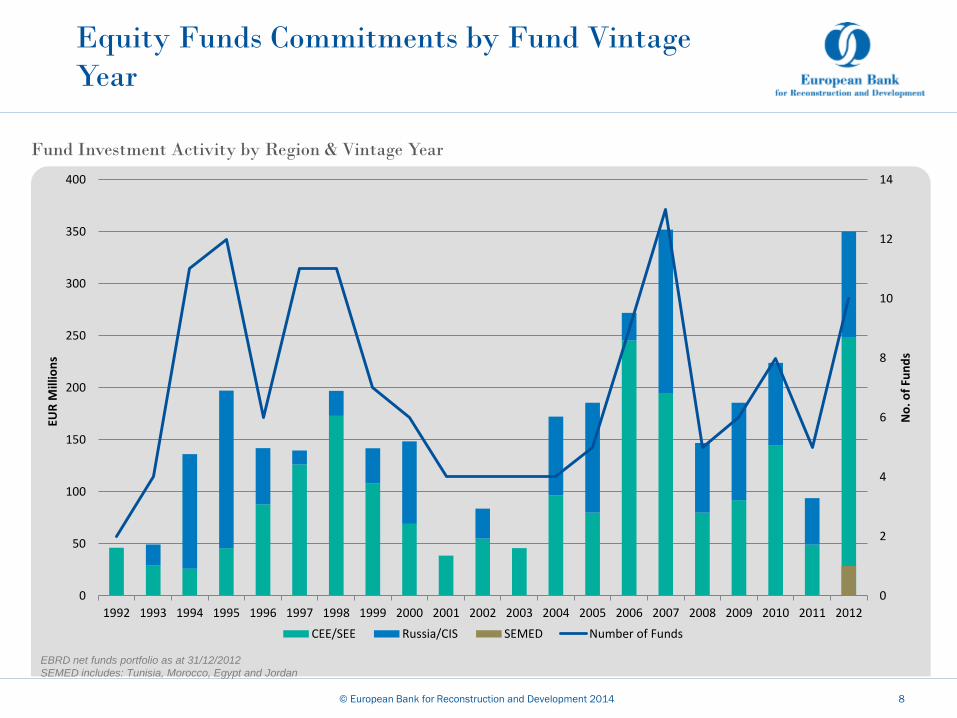
Equity Funds Commitments by Fund Vintage
Year
© European Bank for Reconstruction and Development 2014 8
Fund Investment Activity by Region & Vintage Year
0
2
4
6
8
10
12
14
0
50
100
150
200
250
300
350
400
1992 1993 1994 1995 1996 1997 1998 1999 2000 2001 2002 2003 2004 2005 2006 2007 2008 2009 2010 2011 2012
No
. of
Fun
ds
EUR
Mill
ion
s
CEE/SEE Russia/CIS SEMED Number of Funds
EBRD net funds portfolio as at 31/12/2012
SEMED includes: Tunisia, Morocco, Egypt and Jordan

Equity Funds Active Portfolio by Region and
Fund Size
© European Bank for Reconstruction and Development 2014 9
EBRD net funds portfolio as at 31/12/2012
SEMED includes: Tunisia, Morocco, Egypt and Jordan
EBRD Fund Commitments by Region and Fund Size
CEE/SEE
Russia/CIS
SEMED
0%
10%
20%
30%
40%
50%
60%
70%
80%
90%
100%
Capital Commited
0-100m
100-200m
200-300m
300m+
0%
10%
20%
30%
40%
50%
60%
70%
80%
90%
100%
Capital Committed

EBRD Net Returns & Performance
© European Bank for Reconstruction and Development 2014 10

© European Bank for Reconstruction and Development 2014 11
EBRD Equity Funds Portfolio
Net Horizon IRRs vs. Benchmarks
Three Years Five Years Ten Years Since Inception
EUR EBRD Private Equity Portfolio - All 9.5% 2.2% 18.9% 9.7%
Cambridge Western Europe Private
Equity & Venture Capital Index (EUR) 13.9% 3.7% 13.6% N/A
Cambridge Western Europe Private
Equity Only Index 14.0% 3.8% 14.7% N/A
MSCI Europe Index (EUR) 6.2% -2.3% 5.9% N/A
USD EBRD Private Equity Portfolio - All 6.7% 0.2% 23.6% 11.4%
Cambridge Global ex U.S. Private Equity
& Venture Capital Index 10.8% 2.8% 14.0% N/A
Cambridge Western Europe Private
Equity & Venture Capital Index (USD) 10.8% 1.5% 15.8% N/A
Cambridge Western Europe Private
Equity Only Index 14.0% 3.7% 14.7% N/A
MSCI Emerging Markets Index 5.0% -0.6% 16.9% N/A
Net Horizon IRRs by Currency
Source: EBRD Net Funds Portfolio, Cambridge Associates, as of 31/12/2012

Performance and Composition of Underlying Portfolio
© European Bank for Reconstruction and Development 2014 12

Underlying Investments by Country
© European Bank for Reconstruction and Development 2014 13
EBRD underlying investments portfolio as of 31/12/2012
*Georgia formally withdrew from the CIS effective 17 August 2009
SEMED includes: Tunisia, Morocco, Egypt and Jordan
Russian Federation 34.8%
Rest CIS 9.1%
Poland 17.9%
Romania 7.8%
Czech Republic
7.0%
Turkey 6.7%
Rest CSE 16.5%
SEMED 0.2%
Bulgaria, 4.6%
Hungary, 3.4%
Lithuania, 2.4%
Serbia, 1.2%
Croatia, 1.1%
Estonia, 1.1%
Latvia, 0.9%
Slovak Republic, 0.8%
Albania, 0.6%
Slovenia, 0.2%
Kosovo, 0.1%
Bosnia and Herzegovina, 0.1%
Ukraine, 5.7%
Kazakhstan, 3.0%
Azerbaijan, 0.1%
Georgia*, 0.1%
Mongolia, 0.1%
Kyrgyz Republic, 0.1%
Active Investments in Underlying Portfolio by Country

Underlying Investments by Sector
© European Bank for Reconstruction and Development 2014 14
Active Investments in Underlying Portfolio by Sector
Services 27.4%
ICT 24.1%
Wholesale & Retail 11.2%
Pharma & Medical
9.3%
Consumer 9.0%
Primary & Energy 6.6%
Manufacturing 5.4%
Construction 5.1%
Agriculture & Forestry 2.0%
EBRD underlying investments portfolio as of 31/12/2012

Investment Activity of EBRD Supported Funds
© European Bank for Reconstruction and Development 2014 15
Investments by Vintage Year by Exit Status
EBRD underlying investments portfolio as at 31/12/2012
1
20
37
44
62
88
109
100
122
90
44 40
45
55
50
70
64
41 43
60
74
0
20
40
60
80
100
120
140
1992 1993 1994 1995 1996 1997 1998 1999 2000 2001 2002 2003 2004 2005 2006 2007 2008 2009 2010 2011 2012
No
. In
vestm
en
ts b
y V
inta
ge Y
ear
Unrealised
Partly Realised
Fully Realised

Exit Activity of EBRD Supported Funds
© European Bank for Reconstruction and Development 2014 16
Number of Exits and Mean Cash Proceeds by Exit Year
EBRD underlying investments portfolio as at 31/12/2012
0.0x
1.0x
2.0x
3.0x
4.0x
5.0x
0
20
40
60
80
100
120
1993 1994 1995 1996 1997 1998 1999 2000 2001 2002 2003 2004 2005 2006 2007 2008 2009 2010 2011 2012
TV
PI
Nu
mb
er
of
Exit
s
Pooled TVPI of Exits (excl. Write-Offs)
Number of Write-Offs
Number of Exits (excl. Write-Offs)

Gross Snapshot of all Investees
© European Bank for Reconstruction and Development 2014 17
Gross Snapshot of Investees by Exit Status
Unrealised EUR 5.6bn
Unrealised EUR 6.9bn
Partly Realised EUR 0.8bn
Partly Realised EUR 3.0bn
Fully Realised EUR 3.8bn
Fully Realised EUR 7.4bn
0
2
4
6
8
10
12
14
16
18
20
Investment at Cost EUR 10.3bn Investment Value EUR 17.3bn
EU
R B
illio
ns
All Investees
Money Multiple: 1.7x; IRR: 17.41%
Fully Realised Investees
Money Multiple: 2.0x; IRR: 19.3%
Partly Realised Investees
Money Multiple: 3.5x; IRR: 26.4%
Unrealised Investees
Money Multiple: 1.2x; IRR: 7.1%
EBRD underlying investments portfolio as at 31/12/2012

LP Data
© European Bank for Reconstruction and Development 2014 18

Composition of Investor Base in EBRD funds by
Origin
© European Bank for Reconstruction and Development 2014 19
Geographical Origin of LPs in EBRD Funds
0%
10%
20%
30%
40%
50%
60%
70%
80%
90%
100%
1992-2000 2001-2007 2008-2011 2012
USA
Other
Middle East
Europe
Asia

Composition of Investor Base in EBRD Funds
by Investor Type
© European Bank for Reconstruction and Development 2014 20
0%
10%
20%
30%
40%
50%
60%
70%
80%
90%
100%
1992-2000 2001-2007 2008-2011 2012
Sovereign Wealth Fund
Private Individual / Trust
Pension Fund
NA/Other
International Financial Institution
Insurance Company
GP/Sponsor Commitment
Government Agency
Fund of Funds
Corporate Investor
Capital Markets
Bank
Academic Institution / Endowment / Foundation
Types of Investors in EBRD Supported Funds

General Information
© European Bank for Reconstruction and Development 2014 21

3TS
€30 million
EBRD commitment
May 2013
Select Equity Funds Signed in 2012/2013
© European Bank for Reconstruction and Development 2014 22
Avallon MBO Fund
€27 million
EBRD commitment
December 2012
Capital North Africa
Venture Fund
€20 million
EBRD commitment
May 2013
Earlybird Digital East
Fund
$35 million
EBRD commitment
November 2013
21 Concordia
€30 million
EBRD commitment
September 2013
Almaz Capital Russia
Fund
$50 million
EBRD commitment
May 2013
Capman Russia Fund II
$50 million
EBRD commitment
March 2013
Mid Europa Fund IV
€80 million
EBRD commitment
September 2013
Mediterannia
€20 million
EBRD commitment
September 2013
Maghreb Private Equity
Fund III
€20 million
EBRD commitment
September 2012
• Largest available sample of PE performance in Central and South
Eastern Europe (CEE/SEE), Russia and the Commonwealth of
Independent States (CIS)
• Tracks all “gross” investments made by EBRD invested funds as
well as “net” returns to EBRD (“tracked portfolio”)
• Obligatory reporting by fund managers
• No “survivor bias” resulting from only best fund managers
reporting
23
General Information
© European Bank or Reconstruction and Development 2014 23

EBRD Region
• CSE Countries – Albania, Bosnia & Herzegovina, Bulgaria, Croatia, Estonia, FYR Macedonia, Hungary, Latvia, Lithuania, Kosovo, Poland, Montenegro, Romania, Slovak Republic, Serbia, Slovenia, Turkey.
• SEE Countries – Albania, Bosnia & Herzegovina, Bulgaria, FYR Macedonia, Montenegro, Romania, Serbia
• CEE Countries – Croatia, Hungary, Poland, Slovak Republic, Slovenia, Czech Republic*
• Baltic States – Latvia, Lithuania, Estonia
• CIS Countries – Armenia**, Azerbaijan, Belarus**, Georgia†, Kazakhstan, Kyrgyz Republic, Moldova, Russian Federation, Tajikistan**, Turkmenistan, Uzbekistan**, Ukraine and Mongolia
• SEMED Countries – Egypt, Jordan, Morocco, Tunisia
* Czech Republic ceased to be a country of operation in 2007 but some funds remain exposed to investees in the country.
**There are no underlying investments in these countries as of 31/12/2012. † Formally withdrew from the CIS effective 17 August 2009
24 © European Bank for Reconstruction and Development 2014 24

Copyright 2014 EBRD. All rights reserved
This material is for the recipient’s private information. No part of this
document may be reproduced or transmitted in any form or by any
means, including photocopying and recording, without the written
permission of the Bank. Such written permission must also be
obtained before any part of this publication is stored in a retrieval
system of any nature. While the information contained herein was
compiled by the EBRD, we do not guarantee its accuracy or
completeness. We accept no liability in relation to the use of this
information. Copyright 2014 European Bank for Reconstruction and
Development. All rights reserved.
© European Bank for Reconstruction and Development 2013 25 © European Bank for Reconstruction and Development 2014 25