Embed Size (px)
Citation preview

RISK DASHBOARD
DATA AS OF Q2 2017

2
Contents
1 Summary 3
2 Overview of the main risks and vulnerabilities in the EU banking sector 4
3 Heatmap 5
4 Risk Indicators (RIs)
4.1 Solvency Tier 1 capital ratio 6
Total capital ratio 7
CET1 ratio 8
CET1 ratio (fully loaded) 9
4.2 Credit Risk and Asset Quality Ratio of non‐performing loans and advances (NPL ratio) 10
Coverage ratio for non‐performing loans and advances 11
Forbearance ratio for loans 12
Ratio of non‐performing exposures (NPE ratio) 13
4.3 Profitability Return on equity 14
Return on assets 15
Cost to income ratio 16
Net interest income to total operating income 17
Net fee and commission income to total operating income 18
Net trading income to total operating income 19
Net interest income to interest bearing assets 20
4.4Balance Sheet Structure
and Liquidity
Loan‐to‐deposit ratio (for households and non‐financial
corporations)21
Leverage ratio (fully phased‐in definition of Tier 1) 22
Leverage Ratio (transitional definition of Tier 1 capital) 23
Debt to equity ratio 22
Asset encumbrance ratio 23
Liquidity coverage ratio (%) 24
5 Annex 1: Statistical Annex Asset composition and volumes 26
Liability composition and volumes 27
Risk‐weighted asset composition and break‐down of asset quality
data28
Profitability analysis 29
6 Annex 2: Methodological note on the RIs heatmap 30
7 Annex 3: The RI and Annex database 31

3
*) This risk dashboard is based on a sample of Risk Indicators (RI) from 189 European banks (unconsolidated number of banks, including 36 subsidiaries; the list of the banks can be found under the link
https://www.eba.europa.eu/risk‐analysis‐and‐data). The sample of banks is reviewed annually by competent authorities and adjusted accordingly (http://www.eba.europa.eu/documents/10180/16082/
EBA+DC+090+%28Decision+on+Reporting+by+Competent+Authorities+to+the+EBA%29.pdf/9beaf5be‐2624‐4e36‐a75b‐b77aa3164f3f). This can determine breaks in the time series. Ratios provided in the text are weighted
average if not otherwise stated. The name of the country is only disclosed if the number of reporting institutions is at least three. The data is based on the EBA’s implementing technical standards (ITS) on supervisory reporting
(EU Regulation No 680/2014 and it subsequent amendments). In the chart on Risk Indicators by size class, considering the distribution of the average total assets, the small banks are those below the first quartile, the large banks
are those above the third quartile. Underlying data in this risk dashboard has been compiled by the EBA since 2014 and it has served as basis for additional analyses included in EBA's Risk Assessment Report, last version
published in December 2016.
The net interest income continued to decrease its share of EU banks’ total operating income in Q2 2017
compared to the previous year (55.4% in Q2 2017 vs 57.0% in Q2 2016). The annual increase at Q2 2017 in the
share of net trading income and net fee and commission income is of 3.9 p.p. (to 9.2%) and 0.8 p.p. (to 27.4%)
respectively.
Summary *
The quality of banks’ loans portfolios continued improving, albeit the slow progress and wider dispersion
among countries remain a concern. The non‐performing loans ratio (NPLs) confirmed its downward trend of
previous quarters, decreasing by 30 bps to 4.5% (Q2 2017) and reaching its lowest level since Q4 2014. This
reduction was mainly the result of one‐off events that impacted all bank‐size classes, in particular, smaller banks,
which reduced their NPL ratios by 1.7 p.p. to 17.7%. However, there is still a widespread dispersion among the
EU countries (with ratios ranging from 0.9% to 46.5%), and the total volume of NPLs remains at a high level (EUR
893 bln). The coverage ratio for NPLs remained broadly stable, slightly decreasing by 20 bps to 45.0% in Q2 2017.
EU banks’ profitability improved slightly. The average return on equity (RoE) remained stable from 6.9% (Q1
2017) to 7.0% in Q2 2017. Comparing on a year‐on‐year basis, the average RoE rose 1.3 p.p. from 5.7% in Q2
2016. Nevertheless, the RoE dispersion among countries is now more widespread than in the previous quarter,
varying from about ‐25.4% to 17.7%. Despite these recent improvements, the return on equity remains, on
average, below several estimates of the cost of equity. Moreover, while large‐ and medium‐sized banks’ ratios
remained broadly stable, the average RoE for smaller banks dropped from 8.2% in Q1 2017 to 2.2% in Q2 2017.
The average return on assets (RoA) was 0.45% (0.36% in Q2 2016 and 0.44% in the previous quarter). Higher
profits, together with a reduction of administrative and depreciation expenses, contributed to improving the cost
to income ratio to 61.5% (63.9% in the previous quarter).
Loan‐to‐deposit ratio for households and non‐financial corporations (NFCs) confirmed a downwards trend. It
declined slightly by 60 bps to 117.5% with the increase in loans being offset by a larger increase in deposits to
NFCs and households. Asset encumbrance ratio increased from 27.7% in the previous quarter to 28.1% in Q2
2017. The liquidity coverage ratio (LCR) kept its upwards trend, with a 90 bps increase to 145.6%, continuing well
above the liquidity coverage requirement of 80% for 2017.
EU banks’ capital ratios experienced a modest improvement in Q2 2017. The CET1 ratio reached a new peak
since Q4 2014, increasing from 14.1% in Q1 2017 to 14.3% in Q2 2017, with all EU countries experiencing an
average ratio above 10%. However, this outcome was mainly driven by a reduction of the denominator, with
banks decreasing their risk exposure amounts (by EUR 195 bln), particularly for credit risk. Nevertheless, and
despite the increase in banks’ retained earnings, this quarter EU banks reduced the amount of capital eligible as
CET1 capital (“share premium”) and other comprehensive income, partially offsetting the REA’s trend. On a fully
loaded basis, the CET1 ratio was 14.0%, increasing by 20 bps when compared to the previous quarter. Tier 1 and
total capital ratios have shown a similar trend.

4
LevelExpected
TrendLevel
Forward
Trend
‐1 ‐1
‐1 ‐1
‐1 ‐1
0 0
‐1 ‐1
‐1 ‐1
0 0
0 0
0 0
0 0
‐1 ‐1
‐1 0 1
High Medium Low
Increasing Stable Decreasing
Level The level of risk summarises, in a judgmental fashion, the probability of the materialisation of the risk factors and the likely impact
on banks. The assessment takes into consideration the evolution of market and prudential indicators, National Supervisory
Authorities' and banks’ own assessments as well as analysts’ views.Trend
Fragmentation of asset quality and profitability remains high among
jurisdictions. This also potentially affects banks' access to funding.
Sovereign riskPolitical risk, debt
overhang
Significant sovereign exposures contribute to elevated vulnerabilities of
banks in some jurisdictions. Also, risks from a large debt overhang persist in
some countries.
At a time of a growing probability of a reduction of central banks funding,
banks have to reconsider their funding structure. Further competition in the
senior non‐preferred supply is expected as many banks will focus on
fulfilment of their BRRD requirement.
Environment
Regulatory and legal environment
Risk weighted assets,
regulatory arbitrage,
IFRS 9
Regulatory uncertainty remains on banks' agendas in several aspects,
including credit risk weight related requirements. The uncertainties on the
coordination of international financial regulation continue, and give room for
regulatory arbitrage in Europe and beyond. In parallel banks are making
progress with the implementation of IFRS 9.
FragmentationAsset quality,
profitability, funding
Liquidity & Funding
Access to funding and maturity
distribution
Vulnerability from
volatility
Profitability has continued to improve, but at a slower pace than expected,
and is still below long‐term sustainable levels. Dispersion among countries
and banks remains broad. To enhance profitability, further NPL reductions,
cost cutting, adaptation of business models ‐ if applicable ‐ as well as
consolidation are necessary steps.
Funding structure
Potential challenges to
attain MREL, ending
central bank funding
Ample liquidity and good market conditions have supported banks to fulfil
their funding plans. However, in a context of strong uncertainties, a
resurgence of higher volatility could deteriorate banks' funding access and
costs.
Information and communication technology (ICT) remains a high risk as
banks still rely on complex and fragmented IT infrastructure. Amid elevated
cyber risk, improvements of IT systems are crucial to support the
implementation of banks' digitalisation strategies.
Pillar 2
Concentration risk, IRRBB and other
Low interest rate
environment,
increasing interest
rates
Interest income remains under pressure in a low rate environment. Even
though there is an expectation that a steepening interest rate curve or its
parallel shift upwards have a positive impact on banks' interest income, this
still needs to be proven in practice.
Reputational and legal
Unabated risks from
misconduct, lengthy
settlement processes
Incurring conduct costs have not increased further. Lengthy processes to
settle cases of detrimental business practices add to uncertainties and
adversely affect the sentiment for banks.
Profitability riskToo slow improvement
in profitability
Despite the ongoing downward trend of the NPL ratio, its current level
remains high. High NPL levels continue to hamper banks' profitability and
potentially negatively affect their new lending activity. Structural
impediments remain a burden for banks' efforts to reduce their NPLs. Even
though there has been an increasing volume of NPL transactions, secondary
market activity is not yet sufficient to materially contribute to NPL
reductions. There have been rising concerns about the potentially increasing
cost of risk for consumer and credit card related exposures, in particular for
auto loans. The EU Council's initiatives are a significant step forward for
tackling NPLs.
Market risk
Risk of sudden increase
in volatility, market
liquidity
Volatility and valuation risk continue to be contained. However, political risk,
including growing geopolitical tensions, as well as uncertainties around
central bank monetary policy decisions may trigger higher volatility and
tighten market liquidity.
Capital
Pillar 1
Credit risk
NPL ratios remain high,
impediments for NPL
reduction, risk of rising
impairments
Operational risk
Risks from complex
and fragmented IT
infrastructure, cyber
attacks
Overview of the main risks and vulnerabilities in the EU banking sector
Bank risk Risk drivers
Level of risk
Contributing factors/interactionsLast quarter
(memo)Current quarter
5
Sample of banks*
153 155 154 153 152 156 156 155 158 153 151
Threshold
Current vs previous
quarters for the
worst bucket
201412 201503 201506 201509 201512 201603 201606 201609 201612 201703 201706
> 15% 21.8% 14.4% 16.9% 27.7% 30.7% 28.8% 29.7% 39.6% 55.6% 50.4% 50.5%
[12% ‐ 15%] 48.1% 57.6% 63.9% 52.7% 61.5% 63.6% 62.4% 52.6% 35.4% 42.9% 39.7%
< 12% 30.1% 28.0% 19.2% 19.6% 7.8% 7.7% 8.0% 7.8% 9.0% 6.7% 9.8%
> 14% 19.7% 12.0% 19.6% 13.1% 23.0% 22.0% 22.8% 27.5% 31.4% 42.5% 40.0%
[11% ‐ 14%] 39.3% 49.9% 66.5% 73.9% 72.7% 73.7% 72.6% 68.0% 64.1% 54.3% 52.0%
< 11% 41.0% 38.1% 13.9% 13.0% 4.3% 4.3% 4.6% 4.5% 4.5% 3.2% 8.0%
< 3% 34.2% 36.5% 37.7% 38.0% 36.2% 37.5% 42.6% 41.7% 41.2% 41.0% 44.3%
[3% ‐ 8%] 42.7% 46.5% 46.3% 46.2% 49.9% 48.9% 44.2% 44.9% 45.5% 45.6% 43.0%
> 8% 23.0% 17.0% 15.9% 15.8% 13.8% 13.6% 13.2% 13.4% 13.3% 13.3% 12.7%
> 55% 9.2% 9.7% 9.6% 10.4% 10.1% 10.5% 10.7% 10.5% 16.4% 9.1% 10.9%
[40% ‐ 55%] 56.1% 55.9% 58.9% 57.0% 50.2% 48.3% 50.3% 49.1% 43.7% 51.2% 50.8%
< 40% 34.8% 34.4% 31.5% 32.7% 39.7% 41.2% 39.0% 40.4% 39.8% 39.7% 38.3%
< 1.5% 29.3% 29.2% 35.4% 36.2% 42.4% 41.6% 42.8% 43.0% 51.5% 52.8% 52.2%
[1.5% ‐ 4%] 40.3% 41.6% 34.5% 37.4% 36.0% 37.2% 36.4% 32.2% 23.2% 26.4% 27.3%
>4% 30.4% 29.2% 30.2% 26.3% 21.7% 21.2% 20.9% 24.8% 25.3% 20.9% 20.6%
> 10% 5.0% 18.8% 24.0% 22.5% 6.4% 3.1% 6.0% 6.6% 5.3% 13.5% 12.0%
[6% ‐ 10%] 29.1% 33.0% 46.4% 35.6% 44.3% 42.3% 49.4% 36.8% 38.4% 44.6% 47.7%
< 6% 65.8% 48.2% 29.7% 41.9% 49.3% 54.6% 44.6% 56.6% 56.4% 41.9% 40.3%
< 50% 10.2% 10.5% 11.6% 12.4% 11.7% 12.1% 9.9% 9.4% 10.7% 13.5% 14.7%
[50% ‐ 60%] 13.5% 33.8% 34.6% 36.1% 17.5% 16.9% 26.3% 23.8% 13.8% 11.0% 16.9%
> 60% 76.3% 55.7% 53.8% 51.6% 70.8% 71.0% 63.9% 66.8% 75.6% 75.5% 68.4%
< 100% 28.6% 29.4% 27.6% 29.5% 30.6% 27.3% 28.7% 29.9% 35.4% 31.2% 35.7%
[100% ‐ 150%] 58.2% 57.9% 59.3% 57.8% 56.7% 59.9% 58.6% 56.9% 52.5% 56.6% 51.7%
> 150% 13.2% 12.7% 13.1% 12.7% 12.6% 12.8% 12.7% 13.3% 12.1% 12.2% 12.6%
< 12x 10.6% 10.1% 7.4% 10.6% 12.6% 9.6% 11.0% 16.4% 16.3% 17.9% 27.3%
[12x ‐ 15x] 26.4% 32.8% 41.3% 37.8% 36.7% 35.7% 33.0% 32.5% 29.0% 34.3% 25.4%
> 15x 63.0% 57.2% 51.3% 51.6% 50.7% 54.7% 56.0% 51.1% 54.6% 47.8% 47.4%
24
87
45
Cost to income ratio
Loan‐to‐deposit ratio for
households and non‐
financial corporations
Debt to equity ratio
Balance Sheet Structure
Profitability
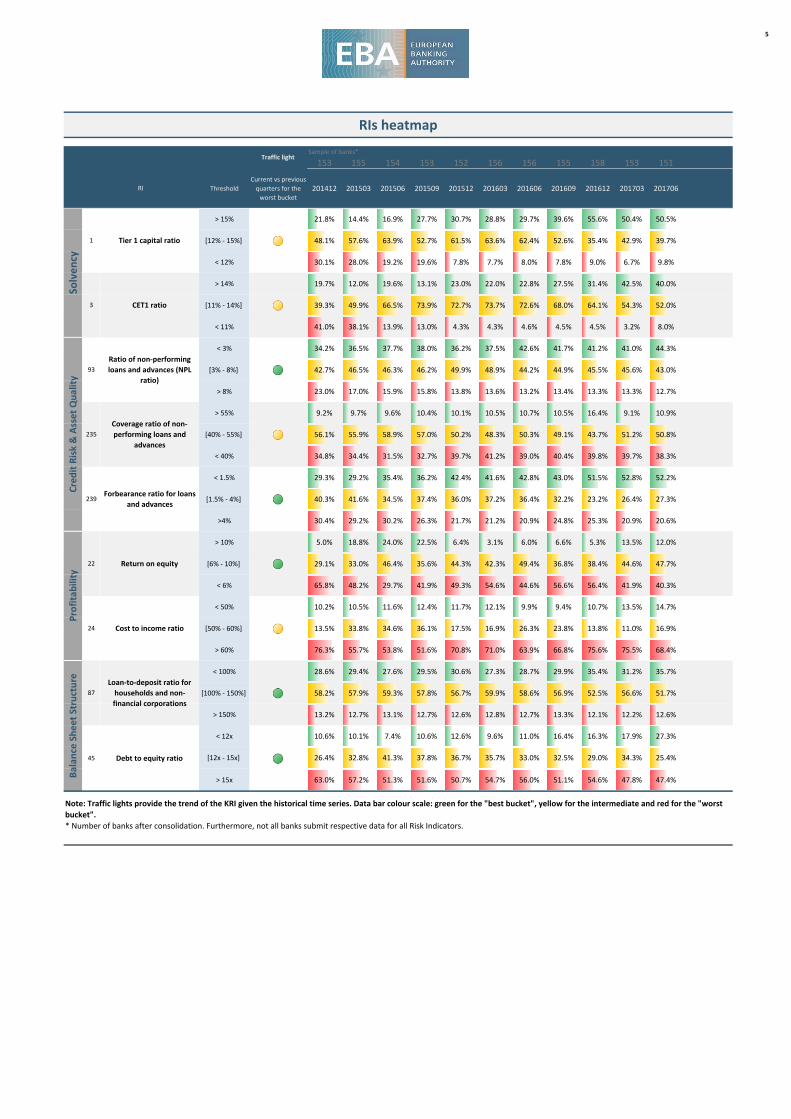
Note: Traffic lights provide the trend of the KRI given the historical time series. Data bar colour scale: green for the "best bucket", yellow for the intermediate and red for the "worst
bucket".
* Number of banks after consolidation. Furthermore, not all banks submit respective data for all Risk Indicators.
RIs heatmap
22 Return on equity
Forbearance ratio for loans
and advances
93
Coverage ratio of non‐
performing loans and
advances
Traffic light
Credit Risk & Asset Quality
Solvency
RI
235
239
Tier 1 capital ratio1
CET1 ratio3
Ratio of non‐performing
loans and advances (NPL
ratio)

6
Dec ‐ 14 13.5% 11.7% 13.6% 16.2%
Mar ‐ 15 13.4% 11.6% 13.6% 16.2%
Jun ‐ 15 13.9% 12.0% 13.8% 16.8%
Sep ‐ 15 14.1% 12.1% 14.1% 17.6%
Dec ‐ 15 14.7% 13.1% 14.9% 18.8%
Mar ‐ 16 14.5% 12.8% 14.7% 18.1%
Jun ‐ 16 14.8% 13.0% 15.0% 18.5%
Sep ‐ 16 15.3% 13.0% 15.2% 19.0%
Dec ‐ 16 15.5% 13.0% 15.7% 19.9%
Mar ‐ 17 15.4% 13.3% 16.0% 19.2%
Jun ‐ 17 15.7% 13.6% 16.2% 19.6%
Solvency
1 ‐ Tier 1 capital ratio
Dispersion Numerator and denominator: trends
5th and 95th pct, interquartile range and median.Total numerator and denominator.
Dec 2014 =100.
Country dispersion (as of Jun. 2017) RI by size class
Weighted Averages by country.Weighted average. Banks are classified in the size class according to the their average total assets
between Dec. 2014 and Jun. 2017. Non‐FINREP banks are assigned to the bucket of small banks.
Period Weighted average 25th 50th 75th
92
94
96
98
100
102
104
106
108
110
Dec ‐ 14
Mar ‐ 15
Jun ‐ 15
Sep ‐ 15
Dec ‐ 15
Mar ‐ 16
Jun ‐ 16
Sep ‐ 16
Dec ‐ 16
Mar ‐ 17
Jun ‐ 17
Numerator: Tier 1 capital
Denominator: Total risk exposure amount
0%
5%
10%
15%
20%
25%
30%
35%
40%
EE SE LU FI LV BG
HR LT IE DK
RO NL SI CZ
GR
GB
NO BE PL
SK DE
MT
FR HU AT
CY IT PT ES
EU
12%
13%
14%
15%
16%
17%
18%
Dec ‐ 14
Mar ‐ 15
Jun ‐ 15
Sep ‐ 15
Dec ‐ 15
Mar ‐ 16
Jun ‐ 16
Sep ‐ 16
Dec ‐ 16
Mar ‐ 17
Jun ‐ 17
Small Medium All banks Large
0%
8%
16%
24%
32%
40%
48%
56%
Dec ‐ 14
Mar ‐ 15
Jun ‐ 15
Sep ‐ 15
Dec ‐ 15
Mar ‐ 16
Jun ‐ 16
Sep ‐ 16
Dec ‐ 16
Mar ‐ 17
Jun ‐ 17

7
Dec ‐ 14 16.2% 13.8% 16.4% 19.4%
Mar ‐ 15 16.1% 13.7% 15.8% 19.5%
Jun ‐ 15 16.7% 14.2% 16.6% 20.3%
Sep ‐ 15 17.0% 14.4% 16.8% 21.7%
Dec ‐ 15 17.7% 14.8% 17.3% 22.9%
Mar ‐ 16 17.4% 14.9% 17.2% 22.5%
Jun ‐ 16 17.8% 15.1% 17.3% 22.7%
Sep ‐ 16 18.3% 15.1% 17.9% 22.6%
Dec ‐ 16 18.5% 15.2% 18.5% 23.5%
Mar ‐ 17 18.5% 15.3% 18.1% 22.7%
Jun ‐ 17 18.6% 16.0% 18.2% 23.9%
Solvency
2 ‐ Total capital ratio
Dispersion Numerator and denominator: trends
5th and 95th pct, interquartile range and median.Total numerator and denominator.
Dec 2014 =100.
Country dispersion (as of Jun. 2017) RI by size class
Weighted Averages by country.Weighted average. Banks are classified in the size class according to the their average total assets
between Dec. 2014 and Jun. 2017. Non‐FINREP banks are assigned to the bucket of small banks.
Period Weighted average 25th 50th 75th
92
94
96
98
100
102
104
106
108
110
Dec ‐ 14
Mar ‐ 15
Jun ‐ 15
Sep ‐ 15
Dec ‐ 15
Mar ‐ 16
Jun ‐ 16
Sep ‐ 16
Dec ‐ 16
Mar ‐ 17
Jun ‐ 17
Numerator: Total capital
Denominator: Total risk exposure amount
0%
5%
10%
15%
20%
25%
30%
35%
40%
EE SE NL FI LV IE LU DK
HR
BG
GB LT RO
NO DE SK BE
AT
MT
FR SI CZ
GR PL
HU IT CY ES PT
EU
14%
15%
16%
17%
18%
19%
20%
21%
Dec ‐ 14
Mar ‐ 15
Jun ‐ 15
Sep ‐ 15
Dec ‐ 15
Mar ‐ 16
Jun ‐ 16
Sep ‐ 16
Dec ‐ 16
Mar ‐ 17
Jun ‐ 17
Small Medium All banks Large
0%
8%
16%
24%
32%
40%
48%
56%
Dec ‐ 14
Mar ‐ 15
Jun ‐ 15
Sep ‐ 15
Dec ‐ 15
Mar ‐ 16
Jun ‐ 16
Sep ‐ 16
Dec ‐ 16
Mar ‐ 17
Jun ‐ 17

8
Dec ‐ 14 12.5% 11.2% 12.8% 15.5%
Mar ‐ 15 12.4% 11.4% 13.0% 15.2%
Jun ‐ 15 12.8% 11.6% 13.1% 15.9%
Sep ‐ 15 13.0% 11.8% 13.4% 17.2%
Dec ‐ 15 13.5% 12.4% 14.0% 17.1%
Mar ‐ 16 13.4% 12.5% 14.2% 17.3%
Jun ‐ 16 13.6% 12.3% 14.3% 17.6%
Sep ‐ 16 14.0% 12.6% 14.6% 17.9%
Dec ‐ 16 14.2% 12.5% 14.7% 18.8%
Mar ‐ 17 14.1% 12.6% 14.7% 18.8%
Jun ‐ 17 14.3% 13.0% 15.0% 19.1%
Solvency
3 ‐ CET1 ratio
Dispersion Numerator and denominator: trends
5th and 95th pct, interquartile range and median.Total numerator and denominator.
Dec 2014 =100.
Country dispersion (as of Jun. 2017) RI by size class
Weighted Averages by country.Weighted average. Banks are classified in the size class according to the their average total assets
between Dec. 2014 and Jun. 2017. Non‐FINREP banks are assigned to the bucket of small banks.
Period Weighted average 25th 50th 75th
92
94
96
98
100
102
104
106
108
110
Dec ‐ 14
Mar ‐ 15
Jun ‐ 15
Sep ‐ 15
Dec ‐ 15
Mar ‐ 16
Jun ‐ 16
Sep ‐ 16
Dec ‐ 16
Mar ‐ 17
Jun ‐ 17
Numerator: CET1 capital
Denominator: Total risk exposure amount
0%
5%
10%
15%
20%
25%
30%
35%
40%
EE SE LV HR FI LT LU BG IE RO SI DK
GR CZ PL
BE
NL
MT SK NO DE
HU
GB
AT
FR CY
PT IT ES
EU
11%
12%
13%
14%
15%
16%
17%
18%
Dec ‐ 14
Mar ‐ 15
Jun ‐ 15
Sep ‐ 15
Dec ‐ 15
Mar ‐ 16
Jun ‐ 16
Sep ‐ 16
Dec ‐ 16
Mar ‐ 17
Jun ‐ 17
Small Medium All banks Large
0%
8%
16%
24%
32%
40%
48%
Dec ‐ 14
Mar ‐ 15
Jun ‐ 15
Sep ‐ 15
Dec ‐ 15
Mar ‐ 16
Jun ‐ 16
Sep ‐ 16
Dec ‐ 16
Mar ‐ 17
Jun ‐ 17
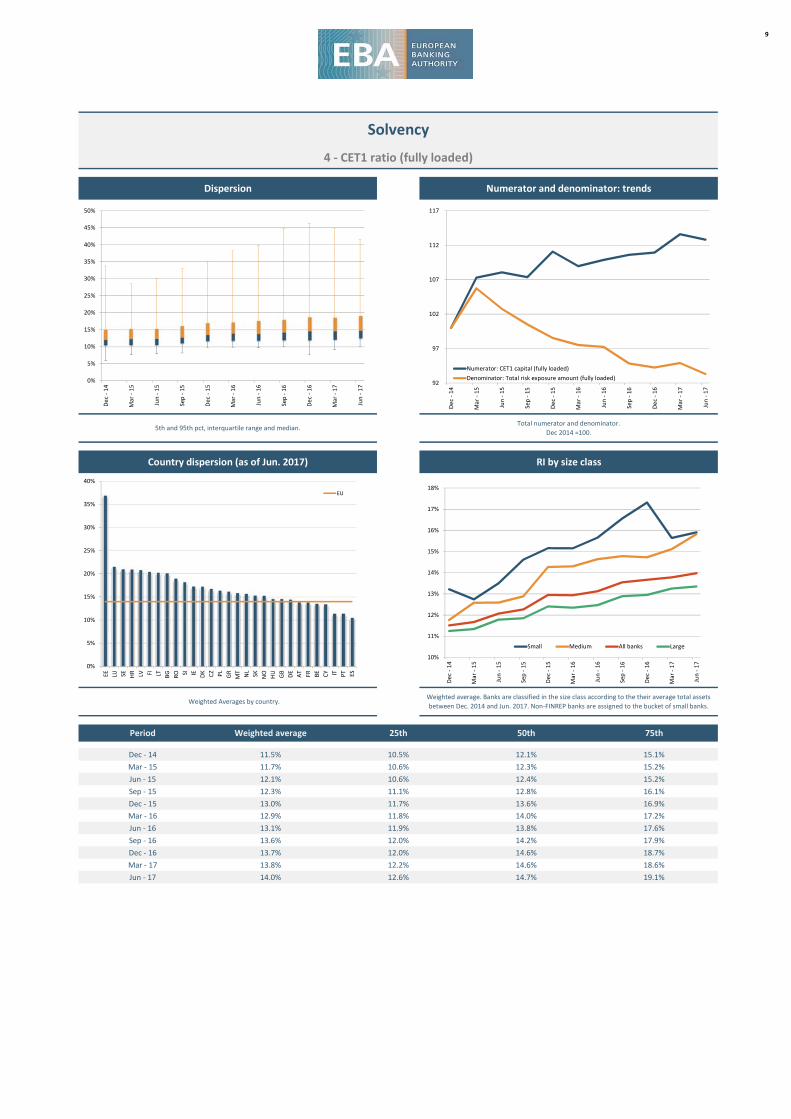
9
Dec ‐ 14 11.5% 10.5% 12.1% 15.1%
Mar ‐ 15 11.7% 10.6% 12.3% 15.2%
Jun ‐ 15 12.1% 10.6% 12.4% 15.2%
Sep ‐ 15 12.3% 11.1% 12.8% 16.1%
Dec ‐ 15 13.0% 11.7% 13.6% 16.9%
Mar ‐ 16 12.9% 11.8% 14.0% 17.2%
Jun ‐ 16 13.1% 11.9% 13.8% 17.6%
Sep ‐ 16 13.6% 12.0% 14.2% 17.9%
Dec ‐ 16 13.7% 12.0% 14.6% 18.7%
Mar ‐ 17 13.8% 12.2% 14.6% 18.6%
Jun ‐ 17 14.0% 12.6% 14.7% 19.1%
Solvency
4 ‐ CET1 ratio (fully loaded)
Dispersion Numerator and denominator: trends
5th and 95th pct, interquartile range and median.Total numerator and denominator.
Dec 2014 =100.
Country dispersion (as of Jun. 2017) RI by size class
Weighted Averages by country.Weighted average. Banks are classified in the size class according to the their average total assets
between Dec. 2014 and Jun. 2017. Non‐FINREP banks are assigned to the bucket of small banks.
Period Weighted average 25th 50th 75th
92
97
102
107
112
117
Dec ‐ 14
Mar ‐ 15
Jun ‐ 15
Sep ‐ 15
Dec ‐ 15
Mar ‐ 16
Jun ‐ 16
Sep ‐ 16
Dec ‐ 16
Mar ‐ 17
Jun ‐ 17
Numerator: CET1 capital (fully loaded)
Denominator: Total risk exposure amount (fully loaded)
0%
5%
10%
15%
20%
25%
30%
35%
40%
EE LU SE HR LV FI LT BG
RO SI IE DK CZ PL
GR
MT
NL
SK NO
HU
GB
DE
AT
FR BE
CY IT PT ES
EU
10%
11%
12%
13%
14%
15%
16%
17%
18%
Dec ‐ 14
Mar ‐ 15
Jun ‐ 15
Sep ‐ 15
Dec ‐ 15
Mar ‐ 16
Jun ‐ 16
Sep ‐ 16
Dec ‐ 16
Mar ‐ 17
Jun ‐ 17
Small Medium All banks Large
0%
5%
10%
15%
20%
25%
30%
35%
40%
45%
50%
Dec ‐ 14
Mar ‐ 15
Jun ‐ 15
Sep ‐ 15
Dec ‐ 15
Mar ‐ 16
Jun ‐ 16
Sep ‐ 16
Dec ‐ 16
Mar ‐ 17
Jun ‐ 17

10
Dec ‐ 14 6.5% 2.4% 5.8% 15.3%
Mar ‐ 15 6.2% 2.4% 5.8% 15.8%
Jun ‐ 15 6.0% 2.4% 6.0% 15.0%
Sep ‐ 15 5.9% 2.4% 5.6% 14.9%
Dec ‐ 15 5.7% 2.3% 5.0% 15.1%
Mar ‐ 16 5.6% 2.0% 5.0% 14.7%
Jun ‐ 16 5.4% 2.0% 4.9% 13.9%
Sep ‐ 16 5.4% 1.9% 4.8% 14.2%
Dec ‐ 16 5.1% 1.7% 4.3% 13.3%
Mar ‐ 17 4.8% 1.5% 3.7% 12.0%
Jun ‐ 17 4.5% 1.5% 3.7% 9.1%
Credit Risk and Asset Quality
5 ‐ Ratio of non‐performing loans and advances (NPL ratio)
Dispersion Numerator and denominator: trends
5th and 95th pct, interquartile range and median.Total numerator and denominator.
Dec 2014 =100.
Country dispersion (as of Jun. 2017) RI by size class
Weighted Averages by country.Weighted average. Banks are classified in the size class according to the their average total assets
between Dec. 2014 and Jun. 2017.
Period Weighted average 25th 50th 75th
70
75
80
85
90
95
100
105
110
115
Dec ‐ 14
Mar ‐ 15
Jun ‐ 15
Sep ‐ 15
Dec ‐ 15
Mar ‐ 16
Jun ‐ 16
Sep ‐ 16
Dec ‐ 16
Mar ‐ 17
Jun ‐ 17
Numerator: Non‐performing loans
Denominator: Total loans
0%
5%
10%
15%
20%
25%
30%
35%
40%
45%
50%
GR CY
PT SI BG IT IE
HU
HR
RO PL
ES AT
MT SK FR LT BE LV DK
NL
DE
NO CZ FI GB EE LU SE
EU
0%
5%
10%
15%
20%
25%
30%
Dec ‐ 14
Mar ‐ 15
Jun ‐ 15
Sep ‐ 15
Dec ‐ 15
Mar ‐ 16
Jun ‐ 16
Sep ‐ 16
Dec ‐ 16
Mar ‐ 17
Jun ‐ 17
Small Medium All banks Large
0%
5%
10%
15%
20%
25%
30%
35%
40%
Dec ‐ 14
Mar ‐ 15
Jun ‐ 15
Sep ‐ 15
Dec ‐ 15
Mar ‐ 16
Jun ‐ 16
Sep ‐ 16
Dec ‐ 16
Mar ‐ 17
Jun ‐ 17

11
Dec ‐ 14 43.4% 31.6% 40.9% 48.0%
Mar ‐ 15 43.0% 31.1% 41.3% 47.1%
Jun ‐ 15 43.6% 32.1% 40.8% 47.3%
Sep ‐ 15 43.6% 32.3% 41.5% 47.7%
Dec ‐ 15 43.7% 31.3% 40.3% 47.5%
Mar ‐ 16 43.7% 31.2% 39.5% 47.6%
Jun ‐ 16 43.9% 31.8% 40.6% 47.9%
Sep ‐ 16 44.3% 31.6% 40.8% 47.2%
Dec ‐ 16 44.8% 31.0% 40.2% 47.9%
Mar ‐ 17 45.2% 30.7% 38.9% 48.0%
Jun ‐ 17 45.0% 29.4% 40.2% 48.7%
Credit Risk and Asset Quality
6 ‐ Coverage ratio of non‐performing loans and advances
Dispersion Numerator and denominator: trends
5th and 95th pct, interquartile range and median.Total numerator and denominator.
Dec 2014 =100.
Country dispersion (as of Jun. 2017) RI by size class
Weighted Averages by country.Weighted average. Banks are classified in the size class according to the their average total assets
between Dec. 2014 and Jun. 2017.
Period Weighted average 25th 50th 75th
70
75
80
85
90
95
100
105
Dec ‐ 14
Mar ‐ 15
Jun ‐ 15
Sep ‐ 15
Dec ‐ 15
Mar ‐ 16
Jun ‐ 16
Sep ‐ 16
Dec ‐ 16
Mar ‐ 17
Jun ‐ 17
Numerator: Specific allowances for loans
Denominator: Non‐performing loans
0%
10%
20%
30%
40%
50%
60%
70%
80%
RO SI
HU CZ PL
BG
HR SK AT
FR IT GR CY
BE
PT ES DE
LU MT
NL IE GB LT LV DK SE NO FI EE
EU
36%
38%
40%
42%
44%
46%
48%
Dec ‐ 14
Mar ‐ 15
Jun ‐ 15
Sep ‐ 15
Dec ‐ 15
Mar ‐ 16
Jun ‐ 16
Sep ‐ 16
Dec ‐ 16
Mar ‐ 17
Jun ‐ 17
Small Medium All banks Large
0%
10%
20%
30%
40%
50%
60%
70%
Dec ‐ 14
Mar ‐ 15
Jun ‐ 15
Sep ‐ 15
Dec ‐ 15
Mar ‐ 16
Jun ‐ 16
Sep ‐ 16
Dec ‐ 16
Mar ‐ 17
Jun ‐ 17

12
Dec ‐ 14 3.9% 1.4% 3.5% 9.5%
Mar ‐ 15 3.8% 1.4% 3.4% 10.3%
Jun ‐ 15 3.7% 1.3% 3.5% 8.9%
Sep ‐ 15 3.6% 1.3% 3.3% 9.1%
Dec ‐ 15 3.5% 1.3% 2.9% 9.0%
Mar ‐ 16 3.5% 1.2% 2.9% 9.4%
Jun ‐ 16 3.4% 1.3% 3.0% 9.1%
Sep ‐ 16 3.4% 1.5% 3.0% 9.4%
Dec ‐ 16 3.2% 1.4% 2.9% 8.8%
Mar ‐ 17 3.0% 1.2% 2.6% 8.4%
Jun ‐ 17 2.9% 1.2% 2.5% 7.9%
Credit Risk and Asset Quality
7 ‐ Forbearance ratio for loans and advances
Dispersion Numerator and denominator: trends
5th and 95th pct, interquartile range and median.Total numerator and denominator.
Dec 2014 =100.
Country dispersion (as of Jun. 2017) RI by size class
Weighted Averages by country.Weighted average. Banks are classified in the size class according to the their average total assets
between Dec. 2014 and Jun. 2017.
Period Weighted average 25th 50th 75th
80
85
90
95
100
105
110
115
Dec ‐ 14
Mar ‐ 15
Jun ‐ 15
Sep ‐ 15
Dec ‐ 15
Mar ‐ 16
Jun ‐ 16
Sep ‐ 16
Dec ‐ 16
Mar ‐ 17
Jun ‐ 17
Numerator: Forborne loans Denominator: Total loans
0%
5%
10%
15%
20%
25%
30%
CY
GR PT IE SI BG
RO ES HU IT HR LV MT LT AT
NO PL
NL FI DE EE DK SK BE
GB FR SE CZ
LU
EU
0%
2%
4%
6%
8%
10%
12%
14%
16%
18%
Dec ‐ 14
Mar ‐ 15
Jun ‐ 15
Sep ‐ 15
Dec ‐ 15
Mar ‐ 16
Jun ‐ 16
Sep ‐ 16
Dec ‐ 16
Mar ‐ 17
Jun ‐ 17
Small Medium All banks Large
0%
5%
10%
15%
20%
25%
Dec ‐ 14
Mar ‐ 15
Jun ‐ 15
Sep ‐ 15
Dec ‐ 15
Mar ‐ 16
Jun ‐ 16
Sep ‐ 16
Dec ‐ 16
Mar ‐ 17
Jun ‐ 17

13
Dec ‐ 14 5.5% 2.0% 4.7% 12.4%
Mar ‐ 15 5.3% 2.0% 4.6% 12.1%
Jun ‐ 15 5.1% 2.0% 4.8% 12.4%
Sep ‐ 15 5.0% 2.0% 4.9% 12.4%
Dec ‐ 15 4.9% 1.8% 4.2% 12.1%
Mar ‐ 16 4.8% 1.8% 4.1% 12.2%
Jun ‐ 16 4.7% 1.8% 3.9% 11.1%
Sep ‐ 16 4.6% 1.7% 3.9% 11.4%
Dec ‐ 16 4.4% 1.5% 3.6% 9.6%
Mar ‐ 17 4.2% 1.4% 3.2% 8.6%
Jun ‐ 17 3.9% 1.3% 3.1% 7.7%
Credit Risk and Asset Quality
8 ‐ Ratio of non‐performing exposures (NPE ratio)
Dispersion Numerator and denominator: trends
5th and 95th pct, interquartile range and median.Total numerator and denominator.
Dec 2014 =100.
Country dispersion (as of Jun. 2017) RI by size class
Weighted Averages by country.Weighted average. Banks are classified in the size class according to the their average total assets
between Dec. 2014 and Jun. 2017.
Period Weighted average 25th 50th 75th
70
75
80
85
90
95
100
105
110
115
Dec ‐ 14
Mar ‐ 15
Jun ‐ 15
Sep ‐ 15
Dec ‐ 15
Mar ‐ 16
Jun ‐ 16
Sep ‐ 16
Dec ‐ 16
Mar ‐ 17
Jun ‐ 17
Numerator: Non‐performing debt instruments
Denominator: Total debt instruments
0%
5%
10%
15%
20%
25%
30%
35%
40%
45%
GR CY
PT
BG IT SI IE HR
HU
RO PL
ES AT LT SK FR MT
DK LV BE
NL
DE
NO
GB FI CZ
EE LU SE
EU
0%
5%
10%
15%
20%
25%
Dec ‐ 14
Mar ‐ 15
Jun ‐ 15
Sep ‐ 15
Dec ‐ 15
Mar ‐ 16
Jun ‐ 16
Sep ‐ 16
Dec ‐ 16
Mar ‐ 17
Jun ‐ 17
Small Medium All banks Large
0%
5%
10%
15%
20%
25%
30%
35%
Dec ‐ 14
Mar ‐ 15
Jun ‐ 15
Sep ‐ 15
Dec ‐ 15
Mar ‐ 16
Jun ‐ 16
Sep ‐ 16
Dec ‐ 16
Mar ‐ 17
Jun ‐ 17

14
Dec ‐ 14 3.5% ‐2.8% 3.8% 8.0%
Mar ‐ 15 6.9% 3.4% 7.1% 10.6%
Jun ‐ 15 6.8% 3.5% 7.0% 10.5%
Sep ‐ 15 6.4% 3.5% 6.8% 10.7%
Dec ‐ 15 4.5% 2.5% 5.7% 9.1%
Mar ‐ 16 5.6% 1.9% 5.0% 8.5%
Jun ‐ 16 5.7% 2.3% 6.2% 9.7%
Sep ‐ 16 5.4% 2.4% 5.9% 9.7%
Dec ‐ 16 3.3% 1.4% 5.5% 9.6%
Mar ‐ 17 6.9% 3.0% 6.7% 10.4%
Jun ‐ 17 7.0% 4.1% 7.5% 10.4%
Profitability
9 ‐ Return on equity
Dispersion Numerator and denominator: trends
5th and 95th pct, interquartile range and median.Total numerator and denominator.
Dec 2014 =100.
Country dispersion (as of Jun. 2017) RI by size class
Weighted Averages by country.Weighted average. Banks are classified in the size class according to the their average total assets
between Dec. 2014 and Jun. 2017.
Period Weighted average 25th 50th 75th
‐
50
100
150
200
250
Dec ‐ 14
Mar ‐ 15
Jun ‐ 15
Sep ‐ 15
Dec ‐ 15
Mar ‐ 16
Jun ‐ 16
Sep ‐ 16
Dec ‐ 16
Mar ‐ 17
Jun ‐ 17
Numerator: Profit or loss for the year
Denominator: Total equity
‐30%
‐25%
‐20%
‐15%
‐10%
‐5%
0%
5%
10%
15%
20%
HU CZ
RO
BG LV DK SK SE SI LT EE MT
NL
AT FI PL IT
NO BE ES IE LU FR GB
HR
DE
GR PT
CY
EU
‐3%
‐1%
1%
3%
5%
7%
9%
11%
13%
Dec ‐ 14
Mar ‐ 15
Jun ‐ 15
Sep ‐ 15
Dec ‐ 15
Mar ‐ 16
Jun ‐ 16
Sep ‐ 16
Dec ‐ 16
Mar ‐ 17
Jun ‐ 17
Small Medium All banks Large
‐40%
‐30%
‐20%
‐10%
0%
10%
20%
Dec ‐ 14
Mar ‐ 15
Jun ‐ 15
Sep ‐ 15
Dec ‐ 15
Mar ‐ 16
Jun ‐ 16
Sep ‐ 16
Dec ‐ 16
Mar ‐ 17
Jun ‐ 17

15
Dec ‐ 14 0.20% ‐0.11% 0.24% 0.53%
Mar ‐ 15 0.40% 0.21% 0.43% 0.73%
Jun ‐ 15 0.41% 0.21% 0.45% 0.72%
Sep ‐ 15 0.38% 0.20% 0.40% 0.67%
Dec ‐ 15 0.28% 0.14% 0.35% 0.59%
Mar ‐ 16 0.36% 0.11% 0.34% 0.63%
Jun ‐ 16 0.36% 0.16% 0.36% 0.65%
Sep ‐ 16 0.34% 0.10% 0.39% 0.65%
Dec ‐ 16 0.21% 0.08% 0.36% 0.65%
Mar ‐ 17 0.44% 0.21% 0.41% 0.70%
Jun ‐ 17 0.45% 0.24% 0.47% 0.80%
Profitability
10 ‐ Return on assets
Dispersion Numerator and denominator: trends
5th and 95th pct, interquartile range and median.Total numerator and denominator.
Dec 2014 =100.
Country dispersion (as of Jun. 2017) RI by size class
Weighted Averages by country.Weighted average. Banks are classified in the size class according to the their average total assets
between Dec. 2014 and Jun. 2017.
Period Weighted average 25th 50th 75th
‐
50
100
150
200
250
Dec ‐ 14
Mar ‐ 15
Jun ‐ 15
Sep ‐ 15
Dec ‐ 15
Mar ‐ 16
Jun ‐ 16
Sep ‐ 16
Dec ‐ 16
Mar ‐ 17
Jun ‐ 17
Numerator: Profit or loss for the year
Denominator: Total assets
‐3.0%
‐2.0%
‐1.0%
0.0%
1.0%
2.0%
3.0%
HU EE BG
RO SI LV CZ LT SK PL IE AT FI
MT
HR
NO DK SE IT ES NL
BE
LU FR GB
DE
GR PT
CY
EU
‐0.2%
0.0%
0.2%
0.4%
0.6%
0.8%
1.0%
1.2%
1.4%
Dec ‐ 14
Mar ‐ 15
Jun ‐ 15
Sep ‐ 15
Dec ‐ 15
Mar ‐ 16
Jun ‐ 16
Sep ‐ 16
Dec ‐ 16
Mar ‐ 17
Jun ‐ 17
Small Medium All banks Large
‐3%
‐3%
‐2%
‐2%
‐1%
‐1%
0%
1%
1%
2%
2%
3%
Dec ‐ 14
Mar ‐ 15
Jun ‐ 15
Sep ‐ 15
Dec ‐ 15
Mar ‐ 16
Jun ‐ 16
Sep ‐ 16
Dec ‐ 16
Mar ‐ 17
Jun ‐ 17

16
Dec ‐ 14 62.9% 45.9% 58.5% 69.7%
Mar ‐ 15 60.9% 44.8% 56.8% 66.5%
Jun ‐ 15 59.3% 46.3% 55.9% 65.3%
Sep ‐ 15 59.9% 46.9% 57.3% 66.3%
Dec ‐ 15 62.8% 48.2% 59.2% 67.7%
Mar ‐ 16 66.0% 50.7% 63.9% 73.8%
Jun ‐ 16 62.7% 49.9% 59.8% 70.7%
Sep ‐ 16 63.0% 49.5% 58.9% 70.8%
Dec ‐ 16 65.3% 50.0% 61.2% 73.2%
Mar ‐ 17 63.9% 49.7% 59.8% 72.5%
Jun ‐ 17 61.5% 50.2% 58.0% 69.0%
Profitability
11 ‐ Cost to income ratio
Dispersion Numerator and denominator: trends
5th and 95th pct, interquartile range and median.Total numerator and denominator.
Dec 2014 =100.
Country dispersion (as of Jun. 2017) RI by size class
Weighted Averages by country.Weighted average. Banks are classified in the size class according to the their average total assets
between Dec. 2014 and Jun. 2017.
Period Weighted average 25th 50th 75th
95
97
99
101
103
105
107
109
111
113
Dec ‐ 14
Mar ‐ 15
Jun ‐ 15
Sep ‐ 15
Dec ‐ 15
Mar ‐ 16
Jun ‐ 16
Sep ‐ 16
Dec ‐ 16
Mar ‐ 17
Jun ‐ 17
Numerator: Costs Denominator: Net operating income
0%
10%
20%
30%
40%
50%
60%
70%
80%
DE
FR AT
LU PT
BE SI GB
HU IE
MT IT NL
PL
CY SK ES GR SE FI RO
HR LV DK CZ LT NO EE BG
EU
42%
45%
48%
51%
54%
57%
60%
63%
66%
69%
Dec ‐ 14
Mar ‐ 15
Jun ‐ 15
Sep ‐ 15
Dec ‐ 15
Mar ‐ 16
Jun ‐ 16
Sep ‐ 16
Dec ‐ 16
Mar ‐ 17
Jun ‐ 17
Small Medium All banks Large
0%
20%
40%
60%
80%
100%
120%
140%
Dec ‐ 14
Mar ‐ 15
Jun ‐ 15
Sep ‐ 15
Dec ‐ 15
Mar ‐ 16
Jun ‐ 16
Sep ‐ 16
Dec ‐ 16
Mar ‐ 17
Jun ‐ 17

17
Dec ‐ 14 58.8% 49.6% 62.2% 75.4%
Mar ‐ 15 55.5% 43.2% 58.3% 73.8%
Jun ‐ 15 54.9% 45.9% 58.9% 72.7%
Sep ‐ 15 56.3% 48.3% 59.9% 77.6%
Dec ‐ 15 57.3% 48.9% 61.1% 78.1%
Mar ‐ 16 58.8% 51.9% 64.7% 80.7%
Jun ‐ 16 57.0% 50.4% 64.1% 77.1%
Sep ‐ 16 57.7% 50.4% 62.6% 76.8%
Dec ‐ 16 57.8% 49.7% 63.8% 75.5%
Mar ‐ 17 55.9% 48.7% 62.7% 75.9%
Jun ‐ 17 55.4% 50.1% 61.9% 72.9%
Profitability
12 ‐ Net interest income to total operating income
Dispersion Numerator and denominator: trends
5th and 95th pct, interquartile range and median.Total numerator and denominator.
Dec 2014 =100.
Country dispersion (as of Jun. 2017) RI by size class
Weighted Averages by country.Weighted average. Banks are classified in the size class according to the their average total assets
between Dec. 2014 and Jun. 2017.
Period Weighted average 25th 50th 75th
92
94
96
98
100
102
104
106
108
110
112
Dec ‐ 14
Mar ‐ 15
Jun ‐ 15
Sep ‐ 15
Dec ‐ 15
Mar ‐ 16
Jun ‐ 16
Sep ‐ 16
Dec ‐ 16
Mar ‐ 17
Jun ‐ 17
Numerator: Net interest income
Denominator: Net operating income
0%
10%
20%
30%
40%
50%
60%
70%
80%
90%
GR
NO NL
SK CY
MT
BG ES HR PL
AT
CZ
PT IE BE
HU EE SI SE RO LT LV GB
DK
LU FI DE
FR IT
EU
35%
40%
45%
50%
55%
60%
65%
70%
Dec ‐ 14
Mar ‐ 15
Jun ‐ 15
Sep ‐ 15
Dec ‐ 15
Mar ‐ 16
Jun ‐ 16
Sep ‐ 16
Dec ‐ 16
Mar ‐ 17
Jun ‐ 17
Small Medium All banks Large
0%
20%
40%
60%
80%
100%
120%
Dec ‐ 14
Mar ‐ 15
Jun ‐ 15
Sep ‐ 15
Dec ‐ 15
Mar ‐ 16
Jun ‐ 16
Sep ‐ 16
Dec ‐ 16
Mar ‐ 17
Jun ‐ 17
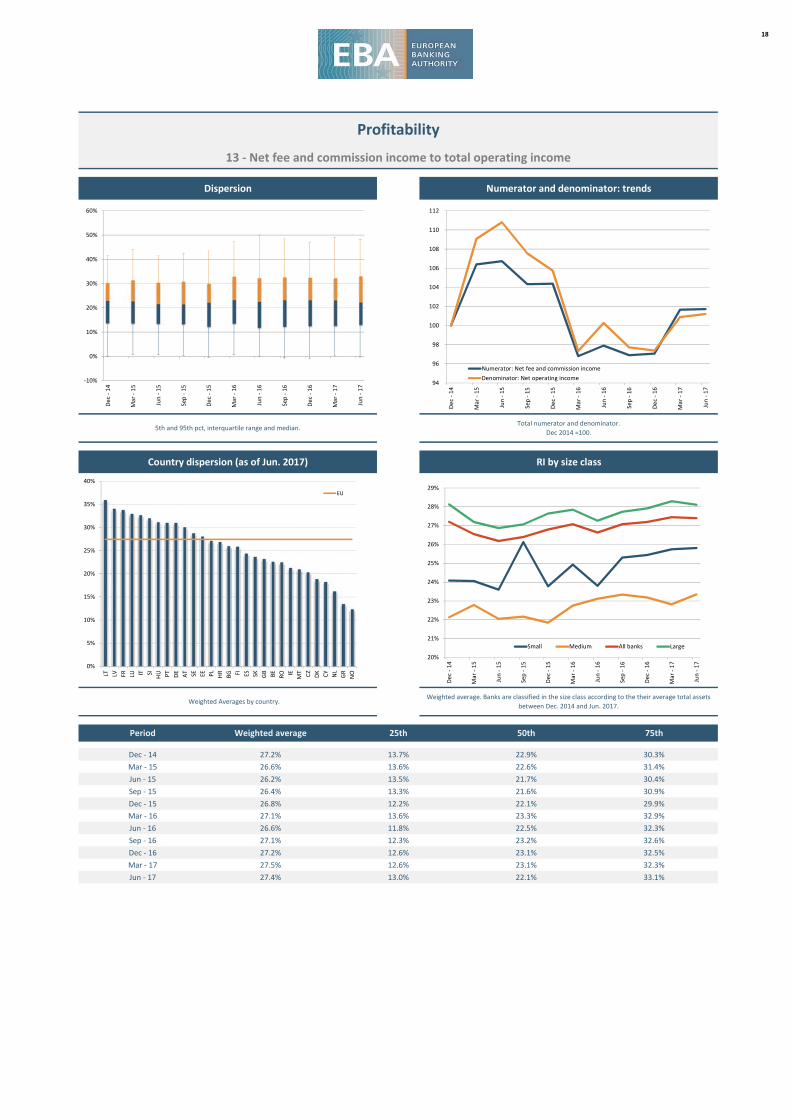
18
Dec ‐ 14 27.2% 13.7% 22.9% 30.3%
Mar ‐ 15 26.6% 13.6% 22.6% 31.4%
Jun ‐ 15 26.2% 13.5% 21.7% 30.4%
Sep ‐ 15 26.4% 13.3% 21.6% 30.9%
Dec ‐ 15 26.8% 12.2% 22.1% 29.9%
Mar ‐ 16 27.1% 13.6% 23.3% 32.9%
Jun ‐ 16 26.6% 11.8% 22.5% 32.3%
Sep ‐ 16 27.1% 12.3% 23.2% 32.6%
Dec ‐ 16 27.2% 12.6% 23.1% 32.5%
Mar ‐ 17 27.5% 12.6% 23.1% 32.3%
Jun ‐ 17 27.4% 13.0% 22.1% 33.1%
Profitability
13 ‐ Net fee and commission income to total operating income
Dispersion Numerator and denominator: trends
5th and 95th pct, interquartile range and median.Total numerator and denominator.
Dec 2014 =100.
Country dispersion (as of Jun. 2017) RI by size class
Weighted Averages by country.Weighted average. Banks are classified in the size class according to the their average total assets
between Dec. 2014 and Jun. 2017.
Period Weighted average 25th 50th 75th
94
96
98
100
102
104
106
108
110
112
Dec ‐ 14
Mar ‐ 15
Jun ‐ 15
Sep ‐ 15
Dec ‐ 15
Mar ‐ 16
Jun ‐ 16
Sep ‐ 16
Dec ‐ 16
Mar ‐ 17
Jun ‐ 17
Numerator: Net fee and commission income
Denominator: Net operating income
0%
5%
10%
15%
20%
25%
30%
35%
40%
LT LV FR LU IT SI
HU PT
DE
AT SE EE PL
HR
BG FI ES SK GB BE
RO IE
MT
CZ
DK
CY
NL
GR
NO
EU
20%
21%
22%
23%
24%
25%
26%
27%
28%
29%
Dec ‐ 14
Mar ‐ 15
Jun ‐ 15
Sep ‐ 15
Dec ‐ 15
Mar ‐ 16
Jun ‐ 16
Sep ‐ 16
Dec ‐ 16
Mar ‐ 17
Jun ‐ 17
Small Medium All banks Large
‐10%
0%
10%
20%
30%
40%
50%
60%
Dec ‐ 14
Mar ‐ 15
Jun ‐ 15
Sep ‐ 15
Dec ‐ 15
Mar ‐ 16
Jun ‐ 16
Sep ‐ 16
Dec ‐ 16
Mar ‐ 17
Jun ‐ 17

19
Dec ‐ 14 6.7% ‐0.5% 1.2% 5.4%
Mar ‐ 15 7.8% ‐1.0% 1.0% 9.6%
Jun ‐ 15 6.5% ‐1.3% 1.3% 5.5%
Sep ‐ 15 6.2% ‐1.4% 1.5% 4.4%
Dec ‐ 15 5.8% ‐0.6% 0.9% 4.8%
Mar ‐ 16 5.3% ‐2.0% 0.2% 3.8%
Jun ‐ 16 5.4% ‐1.2% 0.4% 3.5%
Sep ‐ 16 6.2% ‐0.3% 1.0% 4.5%
Dec ‐ 16 6.1% ‐0.1% 1.7% 6.6%
Mar ‐ 17 10.1% 0.0% 1.9% 8.4%
Jun ‐ 17 9.2% 0.1% 2.2% 7.9%
Profitability
14 ‐ Net trading income to total operating income
Dispersion Numerator and denominator: trends
5th and 95th pct, interquartile range and median.Total numerator and denominator.
Dec 2014 =100.
Country dispersion (as of Jun. 2017) RI by size class
Weighted Averages by country.Weighted average. Banks are classified in the size class according to the their average total assets
between Dec. 2014 and Jun. 2017.
Period Weighted average 25th 50th 75th
60
70
80
90
100
110
120
130
140
150
160
Dec ‐ 14
Mar ‐ 15
Jun ‐ 15
Sep ‐ 15
Dec ‐ 15
Mar ‐ 16
Jun ‐ 16
Sep ‐ 16
Dec ‐ 16
Mar ‐ 17
Jun ‐ 17
Numerator: Net trading income
Denominator: Net operating income
‐15%
‐10%
‐5%
0%
5%
10%
15%
20%
DK CZ
FR GB
DE
PT LV FI IE SE EE NO IT ES RO PL
LU GR
AT SI LT NL
HU
HR BE SK BG
CY*
MT*
EU
‐8%
‐6%
‐4%
‐2%
0%
2%
4%
6%
8%
10%
12%
14%
Dec ‐ 14
Mar ‐ 15
Jun ‐ 15
Sep ‐ 15
Dec ‐ 15
Mar ‐ 16
Jun ‐ 16
Sep ‐ 16
Dec ‐ 16
Mar ‐ 17
Jun ‐ 17
Small Medium All banks Large
‐50%
‐40%
‐30%
‐20%
‐10%
0%
10%
20%
30%
40%
Dec ‐ 14
Mar ‐ 15
Jun ‐ 15
Sep ‐ 15
Dec ‐ 15
Mar ‐ 16
Jun ‐ 16
Sep ‐ 16
Dec ‐ 16
Mar ‐ 17
Jun ‐ 17

20
Dec ‐ 14 1.55% 1.07% 1.48% 1.79%
Mar ‐ 15 1.55% 1.03% 1.48% 1.81%
Jun ‐ 15 1.57% 1.06% 1.53% 1.84%
Sep ‐ 15 1.57% 1.05% 1.52% 1.85%
Dec ‐ 15 1.60% 1.13% 1.53% 1.96%
Mar ‐ 16 1.50% 1.08% 1.46% 2.10%
Jun ‐ 16 1.49% 1.07% 1.41% 2.09%
Sep ‐ 16 1.48% 1.07% 1.44% 2.13%
Dec ‐ 16 1.49% 1.07% 1.39% 2.03%
Mar ‐ 17 1.48% 1.02% 1.42% 2.01%
Jun ‐ 17 1.48% 0.99% 1.38% 2.02%
Profitability
15 ‐ Net interest income to interest bearing assets
Dispersion Numerator and denominator: trends
5th and 95th pct, interquartile range and median.Total numerator and denominator.
Dec 2014 =100.
Country dispersion (as of Jun. 2017) RI by size class
Weighted Averages by country.Weighted average. Banks are classified in the size class according to the their average total assets
between Dec. 2014 and Jun. 2017.
Period Weighted average 25th 50th 75th
92
94
96
98
100
102
104
106
Dec ‐ 14
Mar ‐ 15
Jun ‐ 15
Sep ‐ 15
Dec ‐ 15
Mar ‐ 16
Jun ‐ 16
Sep ‐ 16
Dec ‐ 16
Mar ‐ 17
Jun ‐ 17
Numerator: Net interest income
Denominator: Interest earning assets
0.0%
0.5%
1.0%
1.5%
2.0%
2.5%
3.0%
3.5%
4.0%
4.5%
HU
BG PL
HR
RO
GR SK CY ES SI CZ IE EE AT LV MT
PT
NO NL LT IT GB BE
FR DE SE LU FI DK
EU
1.2%
1.4%
1.6%
1.8%
2.0%
2.2%
2.4%
2.6%
Dec ‐ 14
Mar ‐ 15
Jun ‐ 15
Sep ‐ 15
Dec ‐ 15
Mar ‐ 16
Jun ‐ 16
Sep ‐ 16
Dec ‐ 16
Mar ‐ 17
Jun ‐ 17
Small Medium All banks Large
0%
1%
1%
2%
2%
3%
3%
4%
4%
5%
5%
Dec ‐ 14
Mar ‐ 15
Jun ‐ 15
Sep ‐ 15
Dec ‐ 15
Mar ‐ 16
Jun ‐ 16
Sep ‐ 16
Dec ‐ 16
Mar ‐ 17
Jun ‐ 17

21
Dec ‐ 14 124.3% 96.2% 121.1% 191.8%
Mar ‐ 15 125.1% 98.7% 122.2% 188.0%
Jun ‐ 15 124.7% 100.1% 120.6% 182.6%
Sep ‐ 15 123.2% 98.0% 120.0% 187.0%
Dec ‐ 15 121.0% 94.0% 118.3% 179.4%
Mar ‐ 16 121.7% 97.4% 119.6% 175.6%
Jun ‐ 16 120.5% 96.9% 118.2% 176.0%
Sep ‐ 16 120.1% 93.3% 117.0% 181.5%
Dec ‐ 16 118.6% 93.8% 116.0% 192.4%
Mar ‐ 17 118.1% 94.2% 117.7% 182.6%
Jun ‐ 17 117.5% 91.6% 114.7% 172.0%
Balance Sheet Structure and Liquidity
16 ‐ Loan‐to‐deposit ratio for households and non‐financial corporations
Dispersion Numerator and denominator: trends
5th and 95th pct, interquartile range and median.Total numerator and denominator.
Dec 2014 =100.
Country dispersion (as of Jun. 2017) RI by size class
Weighted Averages by country.Weighted average. Banks are classified in the size class according to the their average total assets
between Dec. 2014 and Jun. 2017.
Period Weighted average 25th 50th 75th
96
98
100
102
104
106
108
110
Dec ‐ 14
Mar ‐ 15
Jun ‐ 15
Sep ‐ 15
Dec ‐ 15
Mar ‐ 16
Jun ‐ 16
Sep ‐ 16
Dec ‐ 16
Mar ‐ 17
Jun ‐ 17
Numerator: Loans to NFCs and households
Denominator: Deposits to NFCs and households
0%
50%
100%
150%
200%
250%
300%
350%
400%
DK SE FI
NO DE IT NL
GR ES LU IE FR EE SK AT LT BE PL
GB PT
CZ
CY
HU
HR LV BG SI RO
MT
EU
60%
70%
80%
90%
100%
110%
120%
130%
140%
150%
Dec ‐ 14
Mar ‐ 15
Jun ‐ 15
Sep ‐ 15
Dec ‐ 15
Mar ‐ 16
Jun ‐ 16
Sep ‐ 16
Dec ‐ 16
Mar ‐ 17
Jun ‐ 17
Small Medium All banks Large
0%
200%
400%
600%
800%
1000%
1200%
1400%
1600%
1800%
Dec ‐ 14
Mar ‐ 15
Jun ‐ 15
Sep ‐ 15
Dec ‐ 15
Mar ‐ 16
Jun ‐ 16
Sep ‐ 16
Dec ‐ 16
Mar ‐ 17
Jun ‐ 17

22
Sep ‐ 16 5.0% 4.1% 5.4% 7.2%
Dec ‐ 16 5.1% 4.3% 5.4% 7.3%
Mar ‐ 17 5.0% 4.3% 5.3% 6.9%
Jun ‐ 17 5.1% 4.3% 5.4% 7.4%
Balance Sheet Structure and Liquidity
17 ‐ Leverage ratio (fully phased‐in definition of Tier 1)
Dispersion Numerator and denominator: trends
5th and 95th pct, interquartile range and median.Total numerator and denominator.
Sep 2016 =100.
Country dispersion (as of Jun. 2017) RI by size class
Weighted Averages by country.Weighted average. Banks are classified in the size class according to the their average total assets
between Dec. 2014 and Jun. 2017.
Period Weighted average 25th 50th 75th
97
98
99
100
101
102
103
Sep ‐ 16
Dec ‐ 16
Mar ‐ 17
Jun ‐ 17
Numerator: Tier 1 capital ‐ fully phased‐in definition
Denominator: Total Leverage Ratio exposure ‐ using a fullyphased‐in definition of Tier 1 capital
0%
2%
4%
6%
8%
10%
12%
14%
16%
EE HR
BG PL
GR
RO SI LV IE LT CY
HU SK MT FI
NO PT
LU AT
CZ ES GB IT BE
FR DK SE DE
NL
EU
4.0%
4.5%
5.0%
5.5%
6.0%
6.5%
7.0%
7.5%
Sep ‐ 16
Dec ‐ 16
Mar ‐ 17
Jun ‐ 17
Small Medium All banks Large
0%
2%
4%
6%
8%
10%
12%
14%
Sep ‐ 16
Dec ‐ 16
Mar ‐ 17
Jun ‐ 17

23
Sep ‐ 16 5.3% 4.4% 5.8% 7.2%
Dec ‐ 16 5.5% 4.6% 5.7% 7.6%
Mar ‐ 17 5.3% 4.4% 5.5% 7.3%
Jun ‐ 17 5.3% 4.4% 5.6% 7.5%
Balance Sheet Structure and Liquidity
18 ‐ Leverage Ratio (transitional definition of Tier 1 capital)
Dispersion Numerator and denominator: trends
5th and 95th pct, interquartile range and median.Total numerator and denominator.
Sep 2016 =100.
Country dispersion (as of Jun. 2017) RI by size class
Weighted Averages by country.Weighted average. Banks are classified in the size class according to the their average total assets
between Dec. 2014 and Jun. 2017.
Period Weighted average 25th 50th 75th
95
96
97
98
99
100
101
102
103
Sep ‐ 16
Dec ‐ 16
Mar ‐ 17
Jun ‐ 17
Numerator: Tier 1 capital ‐ transitional definition
Denominator: Total Leverage Ratio exposure ‐ using a transitional definition of Tier1 capital
0%
2%
4%
6%
8%
10%
12%
14%
16%
EE HR
BG
GR PL IE LV SI RO LT CY
HU SK MT
PT FI
NO AT
LU ES GB IT CZ
BE
FR DE
NL
SE DK
EU
4.0%
4.5%
5.0%
5.5%
6.0%
6.5%
7.0%
7.5%
Sep ‐ 16
Dec ‐ 16
Mar ‐ 17
Jun ‐ 17
Small Medium All banks Large
0%
2%
4%
6%
8%
10%
12%
14%
Sep ‐ 16
Dec ‐ 16
Mar ‐ 17
Jun ‐ 17

24
Dec ‐ 14 1592.0% 1137.5% 1469.1% 1925.6%
Mar ‐ 15 1632.5% 1159.9% 1427.4% 1975.5%
Jun ‐ 15 1547.4% 1165.1% 1416.2% 1934.6%
Sep ‐ 15 1534.5% 1145.2% 1393.7% 1859.6%
Dec ‐ 15 1462.1% 1091.9% 1373.0% 1768.5%
Mar ‐ 16 1504.7% 1012.1% 1351.6% 1784.8%
Jun ‐ 16 1532.0% 1034.7% 1346.9% 1852.9%
Sep ‐ 16 1476.2% 1009.6% 1290.3% 1797.7%
Dec ‐ 16 1440.2% 1069.0% 1301.4% 1696.3%
Mar ‐ 17 1438.4% 1070.5% 1276.4% 1763.6%
Jun ‐ 17 1422.9% 1011.1% 1255.2% 1714.1%
Balance Sheet Structure and Liquidity
19 ‐ Debt to equity ratio
Dispersion Numerator and denominator: trends
5th and 95th pct, interquartile range and median.Total numerator and denominator.
Dec 2014 =100.
Country dispersion (as of Jun. 2017) RI by size class
Weighted Averages by country.Weighted average. Banks are classified in the size class according to the their average total assets
between Dec. 2014 and Jun. 2017.
Period Weighted average 25th 50th 75th
92
94
96
98
100
102
104
106
108
110
Dec ‐ 14
Mar ‐ 15
Jun ‐ 15
Sep ‐ 15
Dec ‐ 15
Mar ‐ 16
Jun ‐ 16
Sep ‐ 16
Dec ‐ 16
Mar ‐ 17
Jun ‐ 17
Numerator: Total liabilities Denominator: Total equity
0%
200%
400%
600%
800%
1000%
1200%
1400%
1600%
1800%
2000%
SE DK
DE
NL
FR BE
GB
LU IT
MT ES NO CZ FI AT
PT SK CY LT LV HU IE RO
GR PL
BG SI HR EE
EU
700%
900%
1100%
1300%
1500%
1700%
1900%
Dec ‐ 14
Mar ‐ 15
Jun ‐ 15
Sep ‐ 15
Dec ‐ 15
Mar ‐ 16
Jun ‐ 16
Sep ‐ 16
Dec ‐ 16
Mar ‐ 17
Jun ‐ 17
Small Medium All banks Large
0%
500%
1000%
1500%
2000%
2500%
3000%
3500%
Dec ‐ 14
Mar ‐ 15
Jun ‐ 15
Sep ‐ 15
Dec ‐ 15
Mar ‐ 16
Jun ‐ 16
Sep ‐ 16
Dec ‐ 16
Mar ‐ 17
Jun ‐ 17

25
Dec ‐ 14 25.4% 13.1% 24.3% 38.8%
Mar ‐ 15 25.6% 14.3% 24.8% 38.4%
Jun ‐ 15 25.8% 13.7% 25.3% 36.2%
Sep ‐ 15 25.4% 13.7% 24.9% 36.9%
Dec ‐ 15 25.5% 15.0% 25.4% 35.7%
Mar ‐ 16 25.4% 14.3% 24.6% 36.2%
Jun ‐ 16 25.5% 12.8% 24.9% 36.1%
Sep ‐ 16 26.5% 14.0% 24.3% 36.9%
Dec ‐ 16 26.6% 13.5% 24.6% 37.4%
Mar ‐ 17 27.7% 14.3% 25.3% 37.9%
Jun ‐ 17 28.1% 13.4% 24.3% 36.8%
Balance Sheet Structure and Liquidity
20 ‐ Asset encumbrance ratio
Dispersion Numerator and denominator: trends
5th and 95th pct, interquartile range and median.Total numerator and denominator.
Dec 2014 =100.
Country dispersion (as of Jun. 2017) RI by size class
Weighted Averages by country.Weighted average. Banks are classified in the size class according to the their average total assets
between Dec. 2014 and Jun. 2017. Non‐FINREP banks are assigned to the bucket of small banks.
Period Weighted average 25th 50th 75th
94
96
98
100
102
104
106
108
110
112
Dec ‐ 14
Mar ‐ 15
Jun ‐ 15
Sep ‐ 15
Dec ‐ 15
Mar ‐ 16
Jun ‐ 16
Sep ‐ 16
Dec ‐ 16
Mar ‐ 17
Jun ‐ 17
Numerator: Encumbered assets and collateral
Denominator: Total assets and collateral
0%
10%
20%
30%
40%
50%
60%
70%
DK
GR
GB IT DE FI ES SE FR BE IE PT
NO AT
NL
SK HR CZ
HU LV LU CY PL
BG
MT
RO SI LT EE
EU
20%
22%
24%
26%
28%
30%
32%
34%
36%
38%
Dec ‐ 14
Mar ‐ 15
Jun ‐ 15
Sep ‐ 15
Dec ‐ 15
Mar ‐ 16
Jun ‐ 16
Sep ‐ 16
Dec ‐ 16
Mar ‐ 17
Jun ‐ 17
Small Medium All banks Large
0%
10%
20%
30%
40%
50%
60%
70%
Dec ‐ 14
Mar ‐ 15
Jun ‐ 15
Sep ‐ 15
Dec ‐ 15
Mar ‐ 16
Jun ‐ 16
Sep ‐ 16
Dec ‐ 16
Mar ‐ 17
Jun ‐ 17

26
Sep ‐ 16 140.5% 127.1% 150.3% 243.3%
Dec ‐ 16 141.2% 128.4% 154.1% 243.9%
Mar ‐ 17 144.7% 131.7% 156.6% 226.8%
Jun ‐ 17 145.6% 135.8% 158.6% 230.9%
Balance Sheet Structure and Liquidity
21 ‐ Liquidity coverage ratio (%)
Dispersion Numerator and denominator: trends
5th and 95th pct, interquartile range and median.Total numerator and denominator.
Sep 2016 =100.
Country dispersion (as of Jun. 2017) RI by size class
Weighted Averages by country.Weighted average. Banks are classified in the size class according to the their average total assets
between Dec. 2014 and Jun. 2017.
Period Weighted average 25th 50th 75th
98
100
102
104
106
108
110
Sep ‐ 16
Dec ‐ 16
Mar ‐ 17
Jun ‐ 17
Numerator: Liquidity Buffer
Denominator: Net Liquidity Outflow
0%
50%
100%
150%
200%
250%
300%
350%
400%
450%
LV RO SI BG LT HU CY SK IT DK EE MT
PT
CZ
DE ES GB
AT
HR SE LU FI IE BE
NL
FR NO PL
GR*
EU
100%
120%
140%
160%
180%
200%
220%
240%
260%
Sep ‐ 16
Dec ‐ 16
Mar ‐ 17
Jun ‐ 17
Small Medium All banks Large
0%
100%
200%
300%
400%
500%
600%
700%
800%
Sep ‐ 16
Dec ‐ 16
Mar ‐ 17
Jun ‐ 17

STATISTICAL ANNEX

28
% of total assets
Sep‐16 Dec‐16 Mar‐17 Jun‐17 Sep‐16 Dec‐16 Mar‐17 Jun‐17 Sep‐16 Dec‐16 Mar‐17 Jun‐17 Sep‐16 Dec‐16 Mar‐17 Jun‐17 Sep‐16 Dec‐16 Mar‐17 Jun‐17 Sep‐16 Dec‐16 Mar‐17 Jun‐17
AT 6.7% 8.9% 10.3% 11.1% 0.5% 0.6% 0.6% 0.5% 14.4% 17.5% 16.7% 16.5% 53.7% 66.0% 65.8% 65.4% 3.2% 3.1% 2.7% 2.6% 21.6% 3.9% 3.9% 3.9%
BE 6.5% 6.5% 8.9% 11.1% 0.7% 0.4% 0.4% 0.4% 20.8% 20.4% 19.7% 18.9% 54.7% 55.2% 55.9% 55.3% 7.6% 6.8% 6.2% 5.7% 9.8% 10.7% 8.8% 8.6%
BG 19.1% 21.2% 21.5% 17.2% 0.1% 0.1% 0.1% 0.1% 11.6% 12.6% 12.6% 13.4% 63.3% 60.2% 60.1% 63.2% 0.2% 0.3% 0.3% 0.2% 5.6% 5.5% 5.4% 5.9%
CY 18.2% 19.4% 18.8% 19.9% 0.1% 0.2% 0.2% 0.2% 6.0% 5.7% 6.5% 6.9% 67.7% 66.4% 66.2% 64.5% 0.0% 0.1% 0.0% 0.0% 8.0% 8.3% 8.3% 8.5%
CZ 11.1% 11.3% 12.9% 18.4% 0.2% 0.1% 0.1% 0.1% 18.6% 18.7% 14.6% 14.2% 65.3% 65.4% 68.9% 64.0% 2.8% 2.5% 1.8% 1.8% 1.9% 2.0% 1.6% 1.6%
DE 6.0% 7.8% 8.8% 11.2% 2.7% 2.8% 2.9% 2.9% 14.8% 14.6% 14.3% 14.0% 54.2% 54.2% 55.3% 53.7% 17.6% 16.4% 14.1% 13.4% 4.7% 4.2% 4.5% 4.9%
DK 3.2% 4.6% 5.6% 6.4% 0.6% 0.7% 0.6% 0.5% 13.4% 13.4% 13.5% 13.4% 72.9% 72.0% 71.7% 71.1% 7.3% 6.7% 6.2% 6.4% 2.7% 2.6% 2.3% 2.2%
ES 3.5% 4.8% 4.4% 5.0% 1.1% 1.2% 1.2% 1.3% 15.1% 14.7% 14.8% 14.6% 65.5% 65.3% 65.8% 65.9% 5.7% 5.1% 4.6% 4.4% 9.1% 9.0% 9.2% 8.9%
FI 14.3% 11.3% 10.3% 9.4% 0.3% 0.4% 0.1% 0.1% 12.2% 13.2% 12.3% 12.5% 48.6% 50.3% 68.1% 70.2% 19.5% 19.2% 5.6% 4.5% 5.1% 5.6% 3.5% 3.4%
FR 6.7% 7.3% 8.6% 8.9% 2.8% 2.9% 3.6% 3.6% 11.5% 11.0% 11.0% 10.8% 57.6% 58.5% 58.5% 59.1% 13.2% 12.3% 10.4% 10.0% 8.2% 8.0% 7.9% 7.6%
GB 7.4% 7.7% 8.6% 9.4% 2.2% 2.6% 3.0% 3.3% 13.5% 13.5% 13.4% 13.4% 52.6% 53.0% 54.9% 55.6% 19.7% 18.5% 15.0% 14.5% 4.6% 4.8% 5.0% 3.8%
GR 3.5% 3.3% 3.2% 3.2% 0.2% 0.2% 0.3% 0.3% 18.2% 16.8% 15.8% 14.4% 61.7% 62.3% 63.1% 64.3% 2.9% 2.6% 2.4% 2.4% 13.4% 14.8% 15.2% 15.4%
HR 9.8% 10.9% 10.5% 11.3% 0.4% 0.3% 0.3% 0.3% 10.2% 10.4% 10.7% 10.8% 75.5% 74.3% 74.5% 73.6% 0.7% 0.9% 0.8% 0.5% 3.3% 3.1% 3.2% 3.5%
HU 7.2% 8.9% 8.8% 8.1% 0.8% 0.9% 1.0% 0.5% 24.8% 25.0% 25.7% 26.6% 61.3% 59.4% 58.4% 59.0% 1.5% 1.5% 1.3% 1.3% 4.3% 4.3% 4.8% 4.6%
IE 7.1% 9.7% 9.2% 8.9% 0.2% 0.2% 0.2% 0.3% 17.9% 16.2% 15.9% 16.0% 63.3% 64.0% 64.1% 64.7% 6.6% 5.7% 5.2% 4.9% 4.9% 4.2% 5.3% 5.2%
IT 1.2% 1.3% 2.1% 2.8% 1.4% 1.5% 1.6% 1.5% 18.3% 17.6% 17.7% 17.1% 67.6% 67.0% 66.6% 67.9% 5.1% 4.6% 4.1% 4.0% 6.3% 8.0% 7.8% 6.6%
LT 18.4% 21.3% 21.2% 20.6% 0.0% 0.0% 0.0% 0.0% 4.5% 4.2% 3.4% 3.3% 75.0% 72.3% 73.4% 74.2% 0.7% 0.8% 0.7% 0.6% 1.4% 1.4% 1.3% 1.3%
LU 11.9% 12.0% 13.1% 12.8% 1.1% 0.6% 0.5% 0.5% 18.7% 13.3% 11.9% 13.9% 62.7% 67.3% 66.8% 64.7% 3.1% 4.1% 5.4% 5.7% 2.5% 2.6% 2.3% 2.4%
LV 21.9% 21.1% 22.9% 23.8% 0.2% 0.3% 0.2% 0.2% 20.8% 21.4% 19.1% 17.1% 54.7% 54.7% 55.8% 56.9% 0.8% 1.0% 0.4% 0.3% 1.6% 1.6% 1.6% 1.6%
NL 6.9% 6.6% 8.4% 6.3% 0.8% 0.8% 0.8% 0.9% 10.1% 10.1% 9.4% 9.4% 72.0% 73.5% 73.4% 76.0% 5.9% 5.5% 4.4% 4.3% 4.2% 3.5% 3.6% 3.2%
NO 6.0% 6.9% 12.7% 9.8% 0.2% 0.3% 0.3% 0.3% 11.4% 11.8% 9.9% 9.6% 73.4% 73.2% 68.7% 71.6% 6.1% 5.3% 5.3% 5.5% 2.9% 2.5% 3.0% 3.2%
PL 4.7% 4.4% 4.6% 4.8% 0.3% 0.3% 0.3% 0.3% 20.9% 21.7% 20.9% 20.6% 69.4% 68.8% 69.4% 69.8% 1.2% 1.2% 1.2% 0.9% 3.5% 3.6% 3.7% 3.6%
PT 3.3% 3.0% 3.7% 3.7% 3.2% 3.0% 3.0% 2.8% 19.2% 17.8% 19.1% 20.1% 64.0% 63.2% 63.3% 62.6% 1.4% 1.3% 1.2% 1.1% 8.9% 11.8% 9.7% 9.7%
RO 12.9% 15.0% 13.6% 13.3% 0.2% 0.2% 0.2% 0.2% 26.0% 27.8% 29.0% 28.4% 57.9% 53.8% 54.0% 55.1% 0.2% 0.2% 0.2% 0.2% 2.8% 3.0% 3.0% 2.9%
SE 10.3% 6.7% 12.2% 12.2% 1.1% 0.8% 1.4% 1.2% 10.3% 11.0% 11.2% 10.7% 66.3% 69.7% 65.9% 67.0% 8.3% 7.9% 5.9% 5.7% 3.7% 3.9% 3.5% 3.2%
SK 4.3% 5.5% 6.3% 6.7% 0.1% 0.1% 0.1% 0.1% 19.6% 18.3% 16.9% 15.1% 73.3% 73.6% 74.3% 75.7% 0.5% 0.4% 0.3% 0.4% 2.2% 2.1% 2.0% 2.0%
EE 23.9% 23.5% 23.8% 21.6% 0.1% 0.1% 0.1% 0.1% 2.7% 2.9% 2.4% 2.2% 71.7% 72.0% 72.4% 74.5% 0.3% 0.3% 0.3% 0.2% 1.3% 1.2% 1.1% 1.3%
SI 11.4% 11.9% 13.6% 11.9% 0.9% 0.9% 0.8% 0.8% 28.5% 26.6% 25.7% 26.8% 55.9% 57.3% 56.7% 57.2% 0.2% 0.2% 0.2% 0.2% 3.1% 3.1% 3.1% 3.1%
MT 2.6% 3.0% 3.7% 3.9% 0.4% 0.5% 0.4% 0.4% 31.4% 29.6% 30.0% 28.8% 62.7% 64.0% 62.7% 63.9% 0.1% 0.1% 0.1% 0.1% 2.8% 3.0% 3.1% 2.8%
EU 6.1% 6.6% 7.9% 8.5% 1.9% 2.0% 2.4% 2.4% 13.8% 13.6% 13.4% 13.2% 59.8% 60.3% 60.7% 61.1% 12.2% 11.3% 9.5% 9.1% 6.1% 6.2% 6.2% 5.8%
T02_1 T02_1 T02_1 T02_1 T02_3 T02_3 T02_3 T02_3 T02_2 T02_2 T02_2 T02_2 T03_1 T03_1 T03_1 T03_1 T03_1 T03_1 T03_1 T03_1
201609 201612 201703 201706 201609 201612 201703 201706 201609 201612 201703 201706 201609 201612 201703 201706
Volumes bln EUR; % Volumes; bln EUR
Sep‐16 Dec‐16 Mar‐17 Jun‐17 Sep‐16 Dec‐16 Mar‐17 Jun‐17 Sep‐16 Dec‐16 Mar‐17 Jun‐17
712.0 598.8 617.4 610.9 3.0% 3.1% 2.9% 2.7% 3.3% 3.5% 7.5% 5.9%
1 036.3 1 016.0 1 018.7 1 028.4 7.3% 6.4% 6.1% 5.7% 10.1% 9.2% 9.1% 8.8%
20.6 21.1 21.4 20.6 0.7% 0.8% 0.9% 1.0% 0.9% 0.8% 0.6% 0.5%
42.7 42.5 42.5 41.8 0.0% 0.1% 0.0% 0.0% 1.4% 1.2% 1.1% 1.0%
118.0 116.5 142.2 143.0 3.5% 2.2% 4.5% 2.7% 4.2% 4.7% 3.3% 4.8%
4 334.1 4 116.1 4 184.1 4 120.3 23.8% 22.3% 20.3% 19.4% 2.8% 3.1% 3.4% 3.1%
825.1 822.8 713.5 718.1 15.0% 14.7% 14.3% 13.9% 0.5% 0.5% 0.4% 0.4%
3 296.0 3 307.3 3 331.8 3 267.0 8.2% 7.9% 7.7% 7.1% 1.1% 1.0% 1.0% 1.0%
482.5 415.4 181.5 177.7 31.5% 30.8% 4.7% 4.5% 1.4% 1.5% 2.5% 4.1%
7 078.2 6 918.8 7 116.4 6 961.6 23.7% 21.7% 21.8% 21.0% 2.4% 2.6% 2.5% 2.5%
6 994.3 6 784.2 6 766.4 6 464.2 27.9% 26.1% 24.1% 24.1% 2.1% 2.3% 2.3% 2.2%
295.9 288.9 279.5 268.1 3.3% 2.8% 3.1% 2.8% 1.5% 1.7% 1.6% 1.7%
36.5 36.5 36.1 36.6 1.0% 1.1% 1.1% 0.8% 2.4% 2.5% 2.4% 2.3%
59.1 61.1 55.3 57.4 3.3% 3.2% 2.9% 2.4% 0.6% 0.5% 0.4% 0.4%
315.2 301.2 298.8 290.2 4.8% 4.7% 4.5% 4.3% 3.7% 3.0% 3.2% 2.9%
2 296.5 2 277.3 2 289.0 2 228.0 8.2% 7.1% 7.1% 6.7% 2.2% 2.4% 2.2% 2.3%
18.3 18.8 18.7 18.7 1.7% 1.8% 1.6% 1.3% 0.8% 0.9% 1.1% 1.2%
282.8 247.7 255.9 209.3 3.5% 4.5% 5.8% 5.8% 0.9% 0.9% 0.7% 0.6%
12.9 12.7 12.6 12.5 3.8% 4.1% 1.8% 1.7% 0.3% 0.3% 0.4% 0.5%
2 210.5 2 114.4 2 178.2 2 093.7 9.4% 8.2% 8.2% 8.7% 2.4% 2.3% 2.1% 2.1%
363.0 381.4 327.2 299.9 16.6% 15.5% 16.5% 15.0% 10.7% 10.3% 11.0% 11.7%
134.0 137.7 142.4 143.0 1.8% 1.5% 1.7% 2.1% 4.4% 3.9% 4.1% 3.6%
289.4 283.9 281.2 280.0 4.1% 3.1% 3.7% 3.5% 25.6% 23.0% 20.8% 19.6%
36.6 37.7 37.5 37.8 0.7% 1.1% 1.4% 0.8% 1.2% 1.1% 1.1% 0.6%
1 486.9 1 395.8 1 531.2 1 495.0 16.6% 14.9% 14.8% 13.8% 0.9% 0.9% 1.1% 0.8%
39.7 40.2 41.3 42.1 0.8% 0.4% 0.4% 0.4% 0.9% 1.7% 1.5% 2.4%
16.3 16.5 16.5 16.4 2.5% 2.3% 1.8% 1.7% 0.5% 0.4% 0.6% 0.7%
23.0 23.1 23.3 23.0 1.1% 0.5% 0.4% 0.6% 0.3% 0.3% 0.3% 0.3%
18.8 19.3 19.5 19.7 0.1% 0.1% 0.1% 0.1% 0.2% 0.3% 0.3% 0.3%
31 055.1 30 262.6 30 746.7 29 977.6 18.6% 17.2% 16.4% 15.9% 2.5% 2.6% 2.7% 2.5%
(1) Net carrying amount, including loans held for trading.
Statistical Annex
Asset composition and volumes
Asset composition
Cash balances Equity instruments Debt securities Loans and advances Derivatives Other Assets
NL
NO
PL
PT
RO
SE
HU
IE
IT
LT
LU
LV
BG
CY
CZ
DE
DK
SK
EE*
SI
MT
ES
FI
FR
GB
GR
HR
LU
LV
SK
EE*
SI
MT
CZ
DE
DK
HU
IE
IT
LT
ES
FI
FR
GB
GR
HR
NL
NO
PL
PT
RO
SE
406.2
77.1 76.2 98.0
234.5 209.0 123.6
27.5 27.1 26.9
13.7 13.6 13.7
266.3 279.3 224.9
BG
CY
399.5
566.5 560.4 569.7 568.6
Assets
Total Assets Share of financial assets held for trading Share of fair value level 3 to total fair valued
assets
382.0 395.0
Sep‐16 Dec‐16
BE
Loans and advances(1)
AT
BE
AT
Mar‐17 Jun‐17
91.5
2 348.3 2 231.8 2 314.2 2 211.4
13.0 12.7 12.9 13.0
28.9 28.2 28.1 27.0
124.7
4 079.9 4 048.3 4 160.7 4 112.4
601.3 592.0 511.2 510.6
2 160.3 2 158.2 2 191.5 2 152.5
26.9
36.2 36.3 32.3 33.9
3 678.8 3 594.8 3 716.5 3 595.5
182.6 179.9 176.5 172.3
13.9
177.3 166.8 170.9 135.3
199.5 192.7 191.7 187.8
1 553.6 1 526.9 1 525.4 1 513.4
214.8
93.0 94.7 98.8 99.9
7.0 7.0 7.0 7.1
1 592.4 1 553.2 1 599.3 1 590.4
13.2 13.2 13.2
30.7 31.929.1 29.6
185.3 179.5 178.1 175.2
21.2 20.3 20.3 20.8
985.7 973.0 1 008.6 1 001.5
Individual country data includes subsidiaries, which are excluded from EU aggregate. For example, at country level the subsidiary in country X of a bank domiciled in country Y is included both in data for countries X and Y (for the latter as part of the consolidated entity). In the EU aggregate, only the consolidated entity domiciled in
country Y is considered. The sample of banks is unbalanced and reviewed annually.
11.8 12.3 12.2 12.6
18 559.6 18 241.8 18 662.6 18 318.2EUEU
11.7 11.9 12.0 12.2
12.9
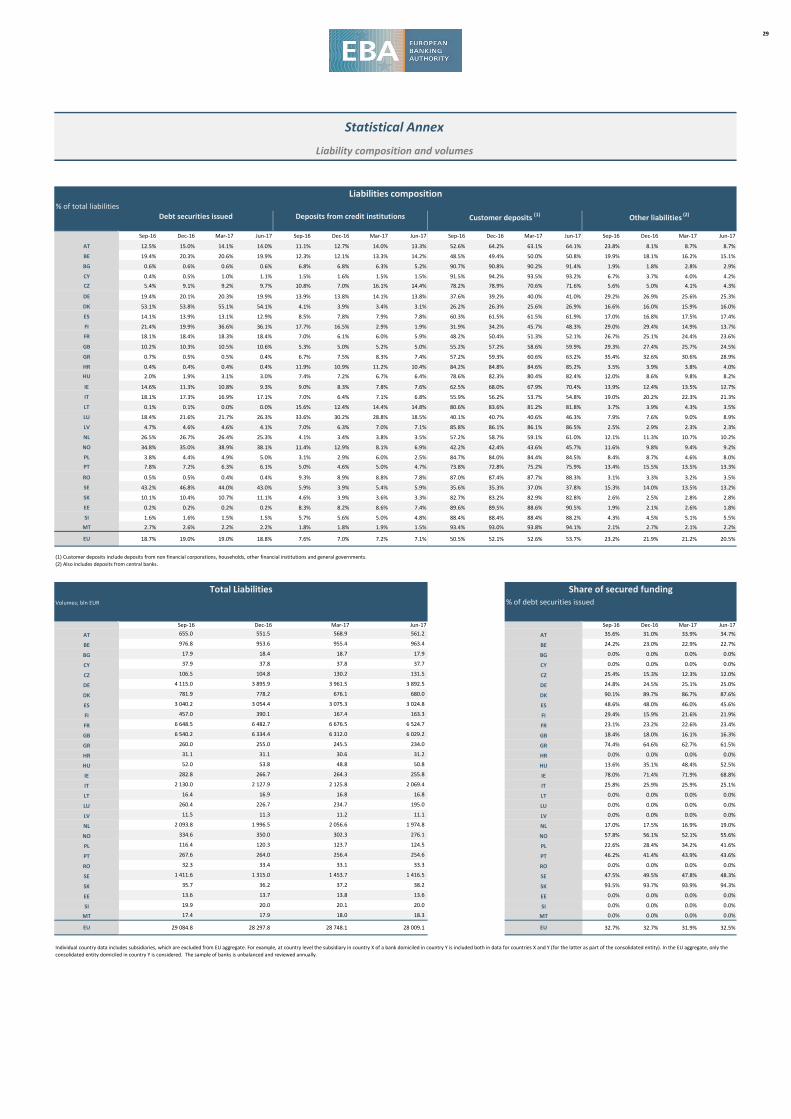
29
% of total liabilities
Sep‐16 Dec‐16 Mar‐17 Jun‐17 Sep‐16 Dec‐16 Mar‐17 Jun‐17 Sep‐16 Dec‐16 Mar‐17 Jun‐17 Sep‐16 Dec‐16 Mar‐17 Jun‐17
12.5% 15.0% 14.1% 14.0% 11.1% 12.7% 14.0% 13.3% 52.6% 64.2% 63.1% 64.1% 23.8% 8.1% 8.7% 8.7%
19.4% 20.3% 20.6% 19.9% 12.3% 12.1% 13.3% 14.2% 48.5% 49.4% 50.0% 50.8% 19.9% 18.1% 16.2% 15.1%
0.6% 0.6% 0.6% 0.6% 6.8% 6.8% 6.3% 5.2% 90.7% 90.8% 90.2% 91.4% 1.9% 1.8% 2.8% 2.9%
0.4% 0.5% 1.0% 1.1% 1.5% 1.6% 1.5% 1.5% 91.5% 94.2% 93.5% 93.2% 6.7% 3.7% 4.0% 4.2%
5.4% 9.1% 9.2% 9.7% 10.8% 7.0% 16.1% 14.4% 78.2% 78.9% 70.6% 71.6% 5.6% 5.0% 4.1% 4.3%
19.4% 20.1% 20.3% 19.9% 13.9% 13.8% 14.1% 13.8% 37.6% 39.2% 40.0% 41.0% 29.2% 26.9% 25.6% 25.3%
53.1% 53.8% 55.1% 54.1% 4.1% 3.9% 3.4% 3.1% 26.2% 26.3% 25.6% 26.9% 16.6% 16.0% 15.9% 16.0%
14.1% 13.9% 13.1% 12.9% 8.5% 7.8% 7.9% 7.8% 60.3% 61.5% 61.5% 61.9% 17.0% 16.8% 17.5% 17.4%
21.4% 19.9% 36.6% 36.1% 17.7% 16.5% 2.9% 1.9% 31.9% 34.2% 45.7% 48.3% 29.0% 29.4% 14.9% 13.7%
18.1% 18.4% 18.3% 18.4% 7.0% 6.1% 6.0% 5.9% 48.2% 50.4% 51.3% 52.1% 26.7% 25.1% 24.4% 23.6%
10.2% 10.3% 10.5% 10.6% 5.3% 5.0% 5.2% 5.0% 55.2% 57.2% 58.6% 59.9% 29.3% 27.4% 25.7% 24.5%
0.7% 0.5% 0.5% 0.4% 6.7% 7.5% 8.3% 7.4% 57.2% 59.3% 60.6% 63.2% 35.4% 32.6% 30.6% 28.9%
0.4% 0.4% 0.4% 0.4% 11.9% 10.9% 11.2% 10.4% 84.2% 84.8% 84.6% 85.2% 3.5% 3.9% 3.8% 4.0%
2.0% 1.9% 3.1% 3.0% 7.4% 7.2% 6.7% 6.4% 78.6% 82.3% 80.4% 82.4% 12.0% 8.6% 9.8% 8.2%
14.6% 11.3% 10.8% 9.3% 9.0% 8.3% 7.8% 7.6% 62.5% 68.0% 67.9% 70.4% 13.9% 12.4% 13.5% 12.7%
18.1% 17.3% 16.9% 17.1% 7.0% 6.4% 7.1% 6.8% 55.9% 56.2% 53.7% 54.8% 19.0% 20.2% 22.3% 21.3%
0.1% 0.1% 0.0% 0.0% 15.6% 12.4% 14.4% 14.8% 80.6% 83.6% 81.2% 81.8% 3.7% 3.9% 4.3% 3.5%
18.4% 21.6% 21.7% 26.3% 33.6% 30.2% 28.8% 18.5% 40.1% 40.7% 40.6% 46.3% 7.9% 7.6% 9.0% 8.9%
4.7% 4.6% 4.6% 4.1% 7.0% 6.3% 7.0% 7.1% 85.8% 86.1% 86.1% 86.5% 2.5% 2.9% 2.3% 2.3%
26.5% 26.7% 26.4% 25.3% 4.1% 3.4% 3.8% 3.5% 57.2% 58.7% 59.1% 61.0% 12.1% 11.3% 10.7% 10.2%
34.8% 35.0% 38.9% 38.1% 11.4% 12.9% 8.1% 6.9% 42.2% 42.4% 43.6% 45.7% 11.6% 9.8% 9.4% 9.2%
3.8% 4.4% 4.9% 5.0% 3.1% 2.9% 6.0% 2.5% 84.7% 84.0% 84.4% 84.5% 8.4% 8.7% 4.6% 8.0%
7.8% 7.2% 6.3% 6.1% 5.0% 4.6% 5.0% 4.7% 73.8% 72.8% 75.2% 75.9% 13.4% 15.5% 13.5% 13.3%
0.5% 0.5% 0.4% 0.4% 9.3% 8.9% 8.8% 7.8% 87.0% 87.4% 87.7% 88.3% 3.1% 3.3% 3.2% 3.5%
43.2% 46.8% 44.0% 43.0% 5.9% 3.9% 5.4% 5.9% 35.6% 35.3% 37.0% 37.8% 15.3% 14.0% 13.5% 13.2%
10.1% 10.4% 10.7% 11.1% 4.6% 3.9% 3.6% 3.3% 82.7% 83.2% 82.9% 82.8% 2.6% 2.5% 2.8% 2.8%
0.2% 0.2% 0.2% 0.2% 8.3% 8.2% 8.6% 7.4% 89.6% 89.5% 88.6% 90.5% 1.9% 2.1% 2.6% 1.8%
1.6% 1.6% 1.5% 1.5% 5.7% 5.6% 5.0% 4.8% 88.4% 88.4% 88.4% 88.2% 4.3% 4.5% 5.1% 5.5%
2.7% 2.6% 2.2% 2.2% 1.8% 1.8% 1.9% 1.5% 93.4% 93.0% 93.8% 94.1% 2.1% 2.7% 2.1% 2.2%
18.7% 19.0% 19.0% 18.8% 7.6% 7.0% 7.2% 7.1% 50.5% 52.1% 52.6% 53.7% 23.2% 21.9% 21.2% 20.5%
(1) Customer deposits include deposits from non financial corporations, households, other financial institutions and general governments.
(2) Also includes deposits from central banks.
T05_1 T05_1 T05_1 T05_1 T05_1 T05_1 T05_1 T05_1 T04_2 T04_2 T04_2 T04_2
201609 201612 201703 201706 201609 201612 201703 201706
Volumes; bln EUR % of debt securities issued
Sep‐16 Dec‐16 Mar‐17 Jun‐17
35.6% 31.0% 33.9% 34.7%
24.2% 23.0% 22.9% 22.7%
0.0% 0.0% 0.0% 0.0%
0.0% 0.0% 0.0% 0.0%
25.4% 15.3% 12.3% 12.0%
24.8% 24.5% 25.1% 25.0%
90.1% 89.7% 86.7% 87.6%
48.6% 48.0% 46.0% 45.6%
29.4% 15.9% 21.6% 21.9%
23.1% 23.2% 22.6% 23.4%
18.4% 18.0% 16.1% 16.3%
74.4% 64.6% 62.7% 61.5%
0.0% 0.0% 0.0% 0.0%
13.6% 35.1% 48.4% 52.5%
78.0% 71.4% 71.9% 68.8%
25.8% 25.9% 25.9% 25.1%
0.0% 0.0% 0.0% 0.0%
0.0% 0.0% 0.0% 0.0%
0.0% 0.0% 0.0% 0.0%
17.0% 17.5% 16.9% 19.0%
57.8% 56.1% 52.1% 55.6%
22.6% 28.4% 34.2% 41.6%
46.2% 41.4% 43.9% 43.6%
0.0% 0.0% 0.0% 0.0%
47.5% 49.5% 47.8% 48.3%
93.5% 93.7% 93.9% 94.3%
0.0% 0.0% 0.0% 0.0%
0.0% 0.0% 0.0% 0.0%
0.0% 0.0% 0.0% 0.0%
32.7% 32.7% 31.9% 32.5%
Statistical Annex
Liability composition and volumes
Customer deposits (1)Debt securities issued Other liabilities (2)
DK
ES
FI
963.4
BG 17.9 18.4 18.7 17.9
CY 37.9 37.8 37.8 37.7
CZ 106.5 104.8
FR
GB
GR
HR
Individual country data includes subsidiaries, which are excluded from EU aggregate. For example, at country level the subsidiary in country X of a bank domiciled in country Y is included both in data for countries X and Y (for the latter as part of the consolidated entity). In the EU aggregate, only the
consolidated entity domiciled in country Y is considered. The sample of banks is unbalanced and reviewed annually.
Deposits from credit institutions
Sep‐16 Dec‐16 Mar‐17 Jun‐17
BE
BG
CY
CZ
DE
AT 655.0 551.5 568.9 561.2
BE 976.8 953.6 955.4
131.5
DE 4 115.0 3 895.9 3 961.5 3 892.5
DK 781.9 778.2 676.1 680.0
130.2
ES 3 040.2 3 054.4 3 075.3 3 024.8
FI 457.0 390.1 167.4 163.3
FR 6 648.5 6 482.7 6 676.5 6 524.7
GB 6 540.2 6 334.4 6 312.0 6 029.2
GR 260.0 255.0 245.5 234.0
HR 31.1 31.1 30.6 31.2
52.0 53.8 48.8 50.8
LU 260.4 226.7 234.7 195.0
IE 282.8 266.7 264.3 255.8
IT 2 130.0 2 127.9 2 125.8 2 069.4
SK 35.7 36.2 37.2 38.2
RO 32.3 33.4 33.1 33.3
EE 13.6 13.7 13.8 13.6
SI 19.9 20.0 20.1 20.0
MT 17.4 17.9 18.0 18.3
EU 29 084.8 28 297.8 28 748.1 28 009.1
SK
EE
SI
MT
EU
HU
IE
IT
LT
LU
LV
NL
NO
PL
RO
AT
Total Liabilities
PT 267.6 264.0 256.4 254.6
SESE 1 411.6 1 315.0 1 453.7 1 416.5
NO 334.6 350.0 302.3 276.1
PL 116.4 120.3 123.7 124.5
HU
LU
LV
NL
NO
PL
PT
RO
SE
PT
LV 11.5 11.3 11.2 11.1
NL 2 093.8 1 996.5 2 056.6 1 974.8
LT 16.4 16.9 16.8 16.8
Liabilities composition
Share of secured funding
SK
EE
SI
MT
EU
AT
BE
BG
CY
CZ
DE
DK
ES
FI
FR
GB
GR
HR
HU
IE
IT
LT

30
% of total RWA
Sep‐16 Dec‐16 Mar‐17 Jun‐17 Sep‐16 Dec‐16 Mar‐17 Jun‐17 Sep‐16 Dec‐16 Mar‐17 Jun‐17 Sep‐16 Dec‐16 Mar‐17 Jun‐17 Sep‐16 Dec‐16 Mar‐17 Jun‐17
AT 85.5% 84.5% 83.8% 83.2% 0.3% 0.3% 0.3% 0.3% 2.6% 2.6% 2.9% 2.7% 10.9% 11.9% 12.4% 12.5% 0.7% 0.7% 0.6% 1.4%
BE 83.3% 83.6% 83.8% 83.8% 1.5% 1.5% 1.1% 1.0% 2.6% 2.1% 2.3% 2.6% 7.6% 8.1% 8.3% 8.4% 5.1% 4.7% 4.5% 4.3%
BG 90.7% 90.6% 89.9% 90.1% 0.1% 0.0% 0.0% 0.0% 0.4% 0.4% 0.6% 0.6% 8.5% 8.9% 9.6% 9.4% 0.3% 0.0% 0.0% 0.0%
CY 87.2% 87.8% 88.4% 87.7% 0.0% 0.0% 0.0% 0.0% 0.7% 0.8% 0.5% 0.7% 11.9% 11.1% 10.9% 11.4% 0.3% 0.3% 0.2% 0.2%
CZ 83.1% 82.9% 81.7% 81.6% 0.0% 0.0% 0.0% 0.0% 3.2% 3.2% 4.0% 4.4% 12.9% 13.0% 13.1% 13.3% 0.8% 0.9% 1.1% 0.7%
DE 73.8% 74.3% 74.8% 75.4% 3.2% 3.4% 3.3% 2.8% 7.7% 6.8% 6.5% 6.5% 12.9% 13.2% 13.2% 13.4% 2.4% 2.2% 2.2% 1.9%
DK 83.4% 83.0% 83.1% 83.7% 0.2% 0.2% 0.1% 0.1% 6.8% 7.0% 7.3% 6.7% 8.9% 9.2% 8.8% 9.0% 0.7% 0.7% 0.7% 0.7%
ES 86.8% 87.0% 86.8% 86.8% 0.4% 0.4% 0.4% 0.5% 3.5% 3.1% 3.4% 3.5% 8.6% 9.0% 9.0% 8.8% 0.7% 0.5% 0.5% 0.5%
FI 82.4% 83.1% 81.0% 80.6% 0.1% 0.1% 0.1% 0.1% 6.4% 5.7% 2.7% 3.4% 8.9% 9.2% 8.5% 8.5% 2.2% 2.0% 7.6% 7.5%
FR 84.5% 84.6% 85.3% 85.4% 1.2% 1.1% 1.0% 1.0% 3.0% 3.0% 3.0% 2.8% 9.7% 9.7% 9.8% 10.0% 1.6% 1.6% 1.0% 0.8%
GB 68.0% 68.4% 67.7% 68.0% 1.3% 1.3% 1.3% 1.3% 12.7% 12.7% 13.4% 14.0% 10.7% 10.9% 10.5% 10.7% 7.3% 6.7% 7.1% 5.9%
GR 89.5% 89.0% 89.0% 88.9% 0.1% 0.1% 0.1% 0.1% 3.3% 3.4% 3.5% 3.4% 6.9% 7.3% 7.3% 7.4% 0.2% 0.2% 0.2% 0.2%
HR 87.2% 87.4% 87.7% 88.0% 0.0% 0.0% 0.0% 0.0% 2.6% 2.3% 2.1% 2.1% 9.9% 10.1% 10.2% 9.8% 0.3% 0.2% 0.1% 0.1%
HU 78.9% 79.3% 82.4% 82.2% 0.0% 0.0% 0.0% 0.0% 5.5% 5.1% 3.7% 4.1% 15.3% 15.3% 13.6% 13.5% 0.3% 0.3% 0.2% 0.2%
IE 88.6% 88.6% 88.4% 87.9% 0.4% 0.3% 0.3% 0.3% 1.1% 0.9% 1.0% 1.2% 7.9% 8.1% 8.4% 8.6% 2.0% 2.1% 1.9% 2.0%
IT 85.4% 85.8% 85.7% 85.7% 0.9% 0.8% 0.8% 0.7% 4.2% 4.1% 4.2% 4.2% 8.8% 8.6% 8.6% 8.7% 0.7% 0.7% 0.6% 0.6%
LT 90.7% 90.1% 90.0% 89.9% 0.0% 0.0% 0.0% 0.0% 1.3% 1.5% 1.6% 1.7% 8.0% 8.4% 8.4% 8.4% 0.0% 0.0% 0.0% 0.0%
LU 90.2% 88.5% 88.1% 88.0% 0.4% 0.4% 0.4% 0.4% 0.6% 1.4% 0.7% 0.8% 7.8% 8.6% 8.8% 8.7% 1.0% 1.1% 2.0% 2.2%
LV 86.3% 86.5% 86.8% 86.7% 0.0% 0.0% 0.0% 0.0% 1.6% 1.7% 1.3% 1.4% 12.0% 11.7% 11.8% 11.9% 0.0% 0.0% 0.0% 0.0%
NL 82.0% 82.4% 82.4% 82.6% 0.8% 0.7% 0.7% 0.8% 2.3% 2.3% 2.3% 2.1% 13.4% 13.3% 13.4% 13.4% 1.4% 1.3% 1.2% 1.1%
NO 71.9% 72.1% 80.0% 86.7% 0.8% 0.8% 0.9% 0.8% 1.0% 1.0% 1.1% 0.9% 7.6% 7.5% 7.7% 7.6% 18.6% 18.6% 10.3% 3.9%
PL 90.7% 90.9% 90.6% 91.3% 0.0% 0.0% 0.0% 0.0% 2.4% 2.4% 2.4% 2.0% 6.5% 6.3% 6.5% 6.4% 0.4% 0.5% 0.4% 0.4%
PT 88.0% 87.1% 88.4% 88.0% 1.1% 1.1% 1.2% 1.1% 3.5% 3.4% 2.5% 2.5% 6.1% 6.8% 6.5% 6.7% 1.2% 1.6% 1.4% 1.7%
RO 78.9% 77.6% 76.4% 76.8% 0.0% 0.0% 0.0% 0.0% 5.7% 6.6% 6.9% 5.9% 15.1% 15.6% 16.5% 17.2% 0.2% 0.2% 0.2% 0.1%
SE 81.6% 80.9% 80.9% 81.2% 0.4% 0.4% 0.3% 0.3% 3.9% 3.7% 3.4% 3.3% 11.7% 12.1% 11.8% 11.9% 2.4% 2.9% 3.5% 3.2%
SK 85.5% 86.4% 83.9% 82.7% 0.0% 0.0% 0.0% 0.0% 1.2% 0.8% 2.9% 4.1% 12.0% 11.8% 12.2% 12.1% 1.3% 1.0% 0.9% 1.1%
EE 90.3% 90.3% 89.9% 90.1% 0.0% 0.0% 0.0% 0.0% 0.4% 0.4% 0.4% 0.3% 9.2% 9.2% 9.6% 9.6% 0.1% 0.0% 0.0% 0.0%
SI 86.8% 87.3% 87.1% 87.1% 0.0% 0.0% 0.0% 0.0% 1.3% 1.2% 1.0% 1.2% 11.9% 11.5% 11.9% 11.7% 0.0% 0.0% 0.0% 0.0%
MT 90.8% 91.0% 90.9% 90.8% 0.0% 0.0% 0.0% 0.0% 0.0% 0.1% 0.1% 0.1% 9.0% 8.9% 8.9% 9.0% 0.1% 0.1% 0.1% 0.2%
EU 79.1% 79.4% 79.4% 79.8% 1.2% 1.2% 1.1% 1.1% 6.3% 6.1% 6.3% 6.3% 10.2% 10.4% 10.3% 10.4% 3.2% 2.9% 2.9% 2.4%
T08_1 T08_1 T08_1 T08_1 T08_2 T08_2 T08_2 T08_2 T08_3 T08_3 T08_3 T08_3 T09_1 T09_1 T09_1 T09_1201609 201612 201703 201706 201609 201612 201703 201706 201609 201612 201703 201706 201609 201612 201703 201706
Sep‐16 Dec‐16 Mar‐17 Jun‐17 Sep‐16 Dec‐16 Mar‐17 Jun‐17 Sep‐16 Dec‐16 Mar‐17 Jun‐17 Sep‐16 Dec‐16 Mar‐17 Jun‐17
AT 23.8 22.0 21.6 20.4 412.9 429.6 472.0 471.8 5.8% 5.1% 4.6% 4.3% 56.9% 57.5% 56.3% 54.3%
BE 21.0 20.1 19.3 19.0 614.1 632.1 664.9 686.2 3.4% 3.2% 2.9% 2.8% 43.0% 44.1% 44.3% 44.9%
BG 2.4 2.3 2.3 2.2 18.1 18.2 18.5 17.5 13.2% 12.5% 12.4% 12.4% 59.9% 57.8% 58.3% 58.2%
CY 20.8 19.9 19.3 18.6 44.5 44.3 44.0 43.5 46.7% 45.0% 43.8% 42.7% 38.4% 40.1% 41.3% 45.4%
CZ 2.2 2.2 2.1 2.0 87.8 86.9 111.9 116.0 2.5% 2.5% 1.8% 1.7% 62.4% 62.6% 61.9% 62.7%
DE 65.2 62.9 63.4 59.2 2 572.3 2 524.7 2 662.8 2 656.4 2.5% 2.5% 2.4% 2.2% 40.1% 38.2% 37.8% 40.7%
DK 19.3 18.4 15.0 13.8 611.5 601.8 510.7 512.0 3.2% 3.1% 2.9% 2.7% 31.2% 30.0% 28.7% 29.0%
ES 136.1 134.7 131.8 127.3 2 324.2 2 359.4 2 379.5 2 354.6 5.9% 5.7% 5.5% 5.4% 44.4% 43.7% 43.6% 44.7%
FI 4.0 3.7 2.3 2.4 269.1 232.6 143.0 141.9 1.5% 1.6% 1.6% 1.7% 26.6% 29.5% 28.9% 26.4%
FR 148.5 146.4 145.8 141.0 3 789.5 4 003.7 4 139.8 4 137.6 3.9% 3.7% 3.5% 3.4% 50.8% 51.8% 51.3% 50.8%
GB 83.5 75.0 70.9 65.2 3 883.8 3 852.4 4 002.0 3 944.5 2.2% 1.9% 1.8% 1.7% 30.3% 30.5% 30.5% 31.4%
GR 114.1 111.7 110.3 108.1 242.4 243.2 238.6 232.2 47.1% 45.9% 46.2% 46.5% 48.2% 48.3% 48.2% 47.5%
HR 3.3 3.1 3.2 3.0 31.0 31.0 30.9 30.8 10.5% 10.1% 10.4% 9.8% 61.4% 63.3% 63.0% 57.7%
HU 5.5 5.1 4.7 4.4 43.2 44.3 39.5 40.6 12.8% 11.5% 11.9% 10.8% 62.0% 64.2% 64.2% 64.6%
IE 31.1 28.2 26.2 26.1 216.2 231.7 228.9 222.8 14.4% 12.2% 11.5% 11.7% 37.9% 35.5% 34.8% 32.5%
IT 275.9 254.0 249.4 199.7 1 685.6 1 661.0 1 685.9 1 662.6 16.4% 15.3% 14.8% 12.0% 47.2% 48.9% 50.6% 49.9%
LT 0.7 0.7 0.6 0.6 17.0 17.5 17.5 17.6 4.1% 3.8% 3.7% 3.3% 33.3% 30.4% 31.0% 30.9%
LU 2.4 2.1 2.1 1.8 205.0 191.2 198.0 163.2 1.2% 1.1% 1.1% 1.1% 38.5% 44.7% 41.6% 40.1%
LV 0.4 0.3 0.3 0.3 9.9 9.6 9.9 10.1 3.6% 3.2% 2.9% 2.7% 27.7% 28.6% 30.1% 29.1%
NL 43.4 41.8 41.0 41.2 1 687.8 1 649.8 1 718.8 1 650.7 2.6% 2.5% 2.4% 2.5% 35.9% 35.2% 34.7% 33.0%
NO 4.1 4.9 3.6 3.6 246.0 261.8 202.7 197.2 1.7% 1.9% 1.8% 1.8% 30.4% 28.2% 29.6% 27.4%
PL 6.8 6.4 6.7 6.5 104.3 105.3 107.8 108.9 6.5% 6.1% 6.2% 6.0% 60.8% 58.8% 59.5% 60.4%
PT 40.8 38.6 37.3 35.0 205.9 198.3 202.0 199.5 19.8% 19.5% 18.5% 17.6% 42.1% 44.0% 44.4% 44.9%
RO 2.9 2.7 2.5 2.3 26.8 26.5 25.8 26.2 10.7% 10.1% 9.9% 8.9% 63.5% 66.8% 66.7% 68.3%
SE 10.1 9.9 9.3 10.3 1 054.7 1 015.6 1 112.9 1 097.4 1.0% 1.0% 0.8% 0.9% 28.6% 28.7% 32.1% 28.7%
SK 1.4 1.4 1.4 1.3 31.2 32.3 33.7 35.1 4.6% 4.2% 4.1% 3.8% 54.1% 55.0% 55.9% 56.8%
EE 0.2 0.2 0.2 0.2 15.2 15.4 15.5 15.2 1.4% 1.3% 1.3% 1.3% 28.5% 31.7% 31.6% 26.1%
SI 2.8 2.5 2.4 2.3 17.3 17.4 17.7 17.2 16.3% 14.4% 13.5% 13.3% 66.5% 63.7% 63.7% 64.8%
MT 0.6 0.6 0.6 0.5 12.4 13.1 13.1 13.5 4.6% 4.4% 4.2% 3.9% 36.0% 36.3% 34.7% 36.3%
EU 1 038.0 988.6 966.9 893.0 19 372.0 19 463.1 20 137.8 19 972.3 5.4% 5.1% 4.8% 4.5% 44.3% 44.8% 45.2% 45.0%
(1) Gross carrying amounts, other than held for trading.
Statistical Annex
Risk‐weighted asset composition and break‐down of asset quality data
RWA composition
Credit risk capital requirements
(excl. securitisation)
Securitisation capital requirements Market risk capital requirements Operational risk capital
requirements
Other capital requirements
Non‐performing loans (1) Loans and advances (1) Non‐performing loans ratio Coverage ratio of Non‐
performing loansVolumes bln
EUR; %
GR
AT
BE
BG
CY
CZ
DE
DK
ES
FI
FR
GB
RO
HR
HU
IE
IT
LT
LU
LV
NL
NO
PL
PT
Individual country data includes subsidiaries, which are excluded from EU aggregate. For example, at country level the subsidiary in country X of a bank domiciled in country Y is included both in data for countries X and Y (for the latter as part of the consolidated entity). In the EU aggregate, only the
consolidated entity domiciled in country Y is considered. The sample of banks is unbalanced and reviewed annually.
SE
SK
EE
SI
MT
EU

31
%
Sep‐16 Dec‐16 Mar‐17 Jun‐17 Sep‐16 Dec‐16 Mar‐17 Jun‐17 Sep‐16 Dec‐16 Mar‐17 Jun‐17 Sep‐16 Dec‐16 Mar‐17 Jun‐17 Sep‐16 Dec‐16 Mar‐17 Jun‐17
AT 8.9% 7.1% 8.0% 10.0% 2.2% 2.4% 2.6% 2.7% 13.06 13.19 12.70 12.46 27.6% 20.1% 29.5% 35.9% 111.9% 111.1% 81.9% 83.4%
BE 9.8% 9.9% 6.8% 9.0% 1.7% 1.7% 1.7% 1.8% 17.25 16.65 16.19 16.05 39.8% 41.1% 29.5% 41.1% 84.2% 84.2% 81.2% 77.0%
BG 16.9% 14.8% 12.5% 14.3% 5.2% 5.1% 4.2% 4.6% 7.72 7.73 7.82 7.69 46.4% 42.0% 42.8% 44.5% 90.0% 90.1% 89.8% 89.8%
CY 3.6% 0.8% ‐1.3% ‐25.4% 3.6% 3.6% 3.3% 3.4% 9.06 9.21 9.14 9.58 13.7% 7.7% ‐2.8% ‐68.0% 79.4% 31.6% 46.3% 85.5%
CZ 14.8% 14.1% 15.5% 16.4% 3.6% 3.6% 3.1% 3.2% 9.69 9.54 10.94 11.19 52.0% 49.9% 54.2% 55.7% 81.9% 82.5% 83.4% 82.5%
DE 2.1% 1.3% 3.9% 3.0% 1.5% 1.6% 1.6% 1.6% 19.36 18.81 18.74 18.38 12.6% 8.3% 17.6% 16.0% 56.2% 54.6% 72.2% 62.4%
DK 9.8% 10.3% 13.4% 12.9% 1.4% 1.4% 1.6% 1.5% 18.78 18.41 18.91 18.78 46.3% 48.6% 57.5% 57.1% 79.4% 79.7% 78.6% 78.8%
ES 7.1% 5.1% 7.9% 8.3% 2.8% 2.8% 3.0% 3.0% 13.21 13.31 13.04 13.28 25.7% 18.3% 28.3% 29.2% 74.1% 74.6% 72.5% 72.0%
FI 8.3% 9.3% 13.1% 9.8% 1.0% 1.2% 2.1% 1.8% 18.97 17.69 12.82 12.54 50.1% 51.5% 57.3% 49.7% 83.4% 84.1% 87.2% 84.9%
FR 7.2% 6.6% 6.3% 7.2% 2.1% 2.1% 2.2% 2.1% 16.33 16.02 16.06 15.94 27.6% 26.1% 25.4% 29.0% 76.0% 73.6% 71.3% 73.1%
GB 3.4% 0.8% 5.9% 5.1% 1.8% 1.8% 2.0% 1.9% 15.24 15.09 14.99 14.97 19.4% 9.2% 31.5% 30.2% 64.1% 33.4% 64.2% 58.7%
GR ‐10.1% ‐7.4% 1.3% ‐0.4% 2.8% 2.8% 3.0% 3.0% 8.81 8.97 8.37 8.19 3.9% 0.8% 6.3% 5.0% ‐1041.5% ‐3844.5% 81.4% ‐28.0%
HR 12.1% 10.8% 4.0% 5.0% 4.6% 4.6% 4.3% 4.5% 7.08 7.03 6.64 6.78 46.3% 43.0% 16.8% 20.4% 79.9% 77.3% 83.0% 81.7%
HU 19.1% 16.4% 13.6% 17.7% 5.9% 6.2% 6.4% 6.3% 8.91 8.90 8.51 8.56 42.0% 35.6% 28.4% 37.4% 86.0% 83.5% 88.7% 87.1%
IE 9.2% 7.9% 7.1% 8.0% 2.6% 2.6% 2.7% 2.8% 9.89 9.32 8.69 8.58 46.5% 40.1% 35.6% 39.7% 77.3% 80.2% 84.0% 83.8%
IT 1.5% ‐10.8% 7.3% 9.3% 2.8% 2.6% 2.6% 3.1% 13.77 14.47 14.65 14.66 5.5% ‐30.3% 21.0% 17.7% 70.4% 106.6% 90.8% 117.1%
LT 10.0% 10.1% 12.3% 12.2% 2.7% 2.6% 2.5% 2.6% 8.37 8.38 9.81 9.67 52.1% 51.3% 57.6% 56.8% 85.2% 89.2% 85.8% 86.4%
LU 6.1% 9.3% 5.9% 7.8% 1.6% 2.0% 1.6% 1.8% 12.81 11.75 11.92 14.15 40.3% 46.4% 39.7% 37.3% 74.0% 84.1% 77.4% 81.4%
LV 14.3% 13.7% 14.5% 13.0% 3.5% 3.5% 3.2% 3.2% 8.03 7.87 8.68 8.73 55.8% 55.5% 58.9% 53.3% 90.5% 90.1% 88.4% 87.7%
NL 9.0% 8.0% 9.1% 10.3% 1.8% 1.9% 1.8% 1.9% 18.67 18.16 17.92 17.78 34.6% 30.4% 37.5% 40.8% 78.8% 77.1% 74.6% 74.2%
NO 9.9% 10.0% 8.8% 9.1% 2.0% 2.0% 1.7% 1.8% 12.96 12.60 12.83 12.54 48.7% 49.3% 50.9% 51.9% 77.8% 80.3% 77.2% 77.2%
PL 10.3% 9.9% 7.4% 9.4% 4.6% 4.4% 4.4% 4.5% 7.67 7.82 7.78 7.82 37.9% 37.4% 31.5% 36.6% 77.8% 77.3% 69.4% 73.8%
PT ‐2.4% ‐9.6% ‐3.2% ‐2.1% 2.2% 2.2% 2.0% 2.3% 13.06 13.52 12.64 12.47 ‐15.4% ‐61.7% ‐0.5% ‐0.2% 146.1% 146.8% ‐2227.9% ‐4672.5%
RO 17.3% 16.1% 15.6% 15.4% 5.6% 5.3% 4.8% 5.1% 8.54 8.72 8.54 8.54 41.9% 35.5% 45.1% 44.4% 86.9% 98.4% 83.8% 79.0%
SE 13.0% 12.5% 13.5% 12.3% 1.5% 1.6% 1.6% 1.6% 19.14 17.81 18.49 18.15 55.7% 53.5% 57.5% 54.2% 81.8% 81.3% 80.6% 79.0%
SK 13.6% 12.3% 11.0% 12.6% 4.0% 3.9% 3.4% 3.5% 9.65 9.64 10.00 10.33 46.2% 42.8% 41.0% 44.3% 75.6% 75.3% 78.0% 77.5%
EE 12.6% 11.7% 12.7% 11.1% 3.2% 3.2% 3.0% 3.1% 5.94 5.91 6.01 5.92 72.2% 67.7% 80.9% 68.3% 92.2% 92.2% 85.9% 88.6%
SI 27.0% 21.1% 14.0% 12.2% 3.3% 3.3% 3.8% 3.5% 7.53 7.56 7.42 7.53 114.6% 87.2% 54.6% 50.0% 95.0% 96.6% 92.3% 92.1%
MT 12.1% 11.7% 10.3% 10.7% 2.8% 2.6% 2.4% 2.4% 14.04 14.16 13.95 13.97 46.1% 46.9% 45.2% 45.0% 66.5% 66.8% 67.7% 71.4%
EU 5.4% 3.3% 6.9% 7.0% 2.0% 2.0% 2.1% 2.1% 15.67 15.48 15.41 15.32 23.8% 15.6% 28.6% 28.9% 71.4% 65.7% 73.3% 73.0%
Individual country data includes subsidiaries, which are excluded from EU aggregate. For example, at country level the subsidiary in country X of a bank domiciled in country Y is included both in data for countries X and Y (for the latter as part of the consolidated entity). In the EU aggregate, only
the consolidated entity domiciled in country Y is considered. The sample of banks is unbalanced and reviewed annually.
(1) The RoE is decomposed according to the formula: RoE = (NoP / Asset) * (Asset / Equity) * (EbT / NoP) * (NP / EbT). In case of a negative EbT, the ratio NP / EbT is computed according to the formula (1 ‐ ((EbT ‐ NP) / ABS (EbT))) to maintain the sign of the tax effect. Therefore, the RoE
decomposition adjusts to the following: RoE = (NoP / Asset) * (Asset / Equity) * (EbT / NoP) * (1+ (1‐(NP / EbT))).
Statistical Annex
Profitability analysis
Decomposition of the RoE
RoE
(Return on Equity)
NoP / Assets
(asset yield contribution)
Assets / Equity
(leverage contribution)
EbT / NoP
(operating contribution)NP / EbT
(1)
(tax effect on the capital yield)

32
Methodological note on the Risk Indicators' (RIs) heatmap
The heatmap provides a quick overview of the main RIs, in which it is possible to find the category, number and
designation of the specific RI, its historic development and the three buckets in which each data point is assigned to across
time (green for the “best” bucket, yellow for the intermediary one and red for the “worst” bucket). The “sample of
reporting banks” returns the actual number of banks that submitted the expected data for that reference date
(consolidated view).
For each of the RIs' quarterly data, the distribution across the three buckets is computed in respect of the sum of total
assets from all banks. Thus, if we observe any given bucket increasing its percentage, we immediately acknowledge that
more assets are being assigned to that bucket. However, this does not necessarily mean that more banks are comprised
within the bucket (the sum of total assets for all banks is fixed, as well as the total assets from each bank taken
individually).
The traffic light of each RI can assume three colours (green, yellow and red) depending on the latest developments on the
“worst” bucket of the RI comparing to the whole time series. If the “worst” bucket is progressing positively (i.e. in case
fewer assets are being assigned to it), the traffic light should be moving away from red getting closer to green. The colour
is computed considering the 33rd and the 67th percentile of the time series.
To help reading the heatmap, let us consider the example of the cost to income ratio:
The green traffic light for the ratio points to the good behaviour of this RI in the last quarter relating to past observations.
More than just declaring if the “worst” bucket has more or less percentage of assets assigned to it, this traffic light
approach delivers simultaneously an insight to the latest developments in the RI’s “worst” bucket and to the relative
position of that data point comparing to all other observations in the same bucket.
The Risk Assessment (RA) meter summarizes the developments in all the KRIs included in the heatmap, providing a single
measure. It is computed as the weighted average across the KRIs sum of total assets in the "intermediate" and "worst"
bucket. The average is weighted in order to guarantee that each KRI category (solvency, credit risk and asset quality,
earnings and balance sheet structure) receives the same weight. Since each category includes a different number of KRIs,
the weight of each KRI is thus different. The risk perception increases with higher values of the RA meter: the closer to
100%, the higher the risk.
< 50% 12.6% 12.2% 12.5% 13.7% 14.5%
[50% ‐ 60%] 25.0% 12.0% 32.6% 34.0% 36.3%
> 60% 62.5% 75.8% 54.9% 52.3% 49.3%
Cost to income ratio

33
Risk Indicators in the DashboardNr
Risk Indicator
codeDashboard name Formula
Template Row Column Template Row Column Template Row Column1 SVC_1 Tier 1 capital ratio Tier 1 capital (A) / Total risk exposure amount (B) C 01.00 015 010 C 02.00 010 010
2 SVC_2 Total capital ratio Own funds (A) / Total risk exposure amount (B) C 01.00 010 010 C 02.00 010 010
3 SVC_3 CET1 ratio Common equity TIER 1 capital (A) / Total risk exposure amount (B) C 01.00 020 010 C 02.00 010 010
4 SVC_29 CET1 ratio (fully loaded)Tier 1 capital (A) / Total risk exposure amount (B) with both, numerator
and denominator, being adjusted for transitional effects
5 AQT_3.2Level of non‐performing loans and advances
(NPL ratio)
Non‐performing loans and advances (A) / Total gross loans and advances
(B)F 18.00 070, 250 060 F 18.00 070, 250 010
6 AQT_41.2Coverage ratio of non‐performing loans and
advances
Specific allowances for loans (A) / Total gross non‐performing loans and
advances (B)F 18.00 070, 250 150 F 18.00 070, 250 060
7 AQT_42.2 Forbearance ratio for loans and advancesExposures with forbearance measures (A) / Total gross loans and
advances (B)F 19.00 070, 250 010 F 18.00 070, 250 010
8 AQT_3.1Ratio of non‐performing exposures (NPE
ratio)
Non‐performing debt securities and loans and advances (A) / Total gross
debt securities and loans and advances (B)F 18.00 330 060 F 18.00 330 010
9 PFT_21Return on equity (numerator annualised,
denominator as average)**Profit or loss for the year (A) / Total equity (B) F 02.00 670 010 F 01.03 300 010
10 PFT_24Return on assets (numerator annualised,
denominator as average)**Profit or loss for the year (A) / Total assets (B) F 02.00 670 010 F 01.01 380 010
11 PFT_23 Cost to income ratioAdministrative and depreciation expenses (A) / Total net operating
income (B)F 02.00 360, 390 010 F 02.00 355 010
12 PFT_25Net interest income to total operating
incomeNet interest income (A) / Total net operating income (B) F 02.00 010, 090 010 F 02.00 355 010
13 PFT_26Net fee and commission income to total
operating incomeNet fee and commission income (A) / Total net operating income (B) F 02.00 200, 210 010 F 02.00 355 010
14 PFT_29 Net trading income to total operating incomeNet gains or losses on financial assets & liabilities held for trading (A) /
Total net operating income (B)F 02.00 280 010 F 02.00 355 010
15 PFT_41
Net interest income to interest bearing
assets (numerator annualised, denominator
as average)**
Net interest income (A) / Interest earning assets (B) F 02.00 010, 090 010 F 01.01
010, 080,
090, 120,
130, 160,
170, 180, 210
010
16 FND_32Loan‐to‐deposit ratio for households and
non‐financial corporations
Total loans and advances to non‐financial corporations and households
(A) / Total deposits to non‐financial corporations and households (B)F 05.00 080 050, 060 F 08.01 260, 310 010, 020, 030
17 SVC_12Leverage ratio (fully phased‐in definition of
Tier 1)
Tier 1 capital ‐ fully phased‐in definition (A) / Total Leverage Ratio
exposure ‐ using a fully phased‐in definition of Tier 1 capital (B)C 47.00 310 010 C 47.00 290 010
18 SVC_13Leverage ratio (transitional definition of Tier
1)
Tier 1 capital ‐ transitional definition (A) / Total Leverage Ratio exposure ‐
using a transitional definition of Tier 1 capital (B)C 47.00 320 010 C 47.00 300 010
19 FND_12 Debt to equity ratio Total liabilities (A) / Total equity (B) F 01.02 300 010 F 01.03 300 010
20 FND_33 Asset encumbrance ratioTotal encumbered assets and collateral (A) / Total assets and collateral
(B+C) ***
F 32.01 &
F32.02010, 130 010 F 32.01 010 010, 060 F 32.02 130 010, 040
21 LIQ_17 Liquidity coverage ratio Liquidity Buffer (A) / Net Liquidity Outflow (B) C 76.00 010 010 C 76.00 020 010
* The data points refer either to FINREP tables ("F") or COREP tables ("C") (http://www.eba.europa.eu/regulation‐and‐policy/supervisory‐reporting/implementing‐technical‐standard‐on‐supervisory‐reporting)** For the calculation of the average the previous December figure is used as an “anchor” for the subsequent year, and the second the number is taken from the latest quarter observation, i.e. Q1, Q2, Q3 or Q4*** Encumbered assets (recognised on the balance sheet) are considered at their carrying value, collateral received is considered as at fair value
Data Point A* Data Point B* Data Point C*
{C 01.00(r020, c10) ‐ C 05.01(r010, c010) ‐ C 01.00(r440, c010) + MIN ([C 01.00(r530, c10) ‐ C 01.00(r740, c10) ‐ C 05.01(r010, c020) ‐
C 01.00(r720, c10) + MIN ([C 01.00(r750, c10) ‐ C 01.00(r970, c10) ‐ C 05.01(r010, c030)], 0)], 0)} / ( {C 02.00;r010;c010} ‐ {C
05.01;r010;c040} )

34
Risk Indicators in the Statistical AnnexAnnex series
Risk Indicator
code
RI's parameter
shownFormula
Template Row Column Template Row Column
Cash balances RDB_1 Ratio Cash positions (A) / Total Assets (B) F 01.01 020, 030, 040 010 F 01.01 380 010
Equity instruments RDB_2 Ratio Equity instruments (A) / Total Assets (B) F 01.01070, 093, 110, 150,
172, 176, 235010 F 01.01 380 010
Debt securities RDB_3 Ratio Debt securities (A) / Total Assets (B) F 01.01
080, 094, 120, 160,
173, 177, 190, 220,
232, 236
010 F 01.01 380 010
Loans and advances RDB_4 Ratio Loans and advances (A) / Total Assets (B) F 01.01
090, 095, 130, 170,
174, 178, 200, 230,
233, 237
010 F 01.01 380 010
Derivatives RDB_5 Ratio Derivatives (A) / Total Assets (B) F 01.01 060, 092, 240 010 F 01.01 380 010
Other assets RDB_6 Ratio Other assets (A) / Total Assets (B) F 01.01250, 260, 270, 300,
330, 360, 370010 F 01.01 380 010
Total Assets RDB_1 Denominator Total assets (B) n/a n/a n/a F 01.01 380 010
Share of financial assets held for trading LIQ_13 Ratio Financial assets held for trading (A) / Total assets (B) F 01.01 050 010 F 01.01 380 010
Share of fair value level 3 to total fair valued assets AQT_22.3 Ratio [level of FV hierarchy for assets] (A) / [sum of levels 1 to 3 for assets] (B) F 14.00 010, 060, 100, 140 030 F 14.00 010, 060, 100, 140 010, 020, 030
Total loans and advances RDB_4 Numerator Loans and advances (A) / Total Assets (B) F 01.01
090, 095, 130, 170,
174, 178, 200, 230,
233, 237
010 n/a n/a n/a
Debt securities issued FND_9 Ratio Debt securities issued (A) / Total liabilities (B) F 01.02050, 090, 130, 65,
143010 F 01.02 300 010
Deposits from credit institutions FND_10 Ratio Deposits from credit institutions (A) / Total liabilities (B) F 08.01 160010, 020, 030, 034,
035F 01.02 300 010
Customer deposits FND_18 Ratio Total deposits other than from banks (A) / Total liabilities (B) F 08.01 110, 210, 260, 310010, 020, 030, 034,
035F 01.02 300 010
Other liabilities n/a Ratio Residual in total liabilities n/a n/a n/a n/a n/a n/a
Total liabilities FND_18 Denominator Total deposits other than from banks (A) / Total liabilities (B) n/a n/a n/a F 01.02 300 010
n/a n/a n/a n/a n/a n/a
FND_28 Numerator Covered bonds at cost and at fair value (A) / Total financial liabilities (B) F 08.01 390010, 020, 030, 034,
035n/a n/a n/a
FND_29 Numerator Asset‐backed securities at cost and at fair value (A) / Total financial liabilities (B) F 08.01 380010, 020, 030, 034,
035n/a n/a n/a
Calculated as SCV_4 ‐ SCV_6 n/a n/a n/a n/a n/a n/a
SCV_4 Ratio Credit risk capital requirements (A) / Total capital requirements (B) C 02.00 040 010 C 02.00 010 010
Securitisation capital requirements SCV_6 Ratio Securitisation capital requirements (A) / Total capital requirements (B) C 02.00 220, 430 010 C 02.00 010 010
Market risk capital requirements SCV_8 Ratio Market risk capital requirements (A) / Total capital requirements (B) C 02.00 520 010 C 02.00 010 010
Operational risk capital requirements SCV_9 Ratio Operational risk capital requirements (A) / Total capital requirements (B) C 02.00 590 010 C 02.00 010 010
Other capital requirements n/a Ratio Residual in total capital requirements n/a n/a n/a n/a n/a n/a
Non‐performing loans AQT_3.2 Numerator Non‐performing loans and advances F 18.00 070, 250 060 n/a n/a n/a
Loans and advances AQT_3.2 Denominator Total gross loans and advances F 18.00 070, 250 010 n/a n/a n/a
NPL Ratio AQT_3.2 Ratio Non‐performing loans and advances (A) / Total gross loans and advances (B) F 18.00 070, 250 060 F 18.00 070, 250 010
Coverage ratio of NPLs AQT_41.2 Ratio Specific allowances for loans (A) / Total gross non‐performing loans and advances (B) F 18.00 070, 250 150 F 18.00 070, 250 060
NoP / Asset (asset yield contribution)
(numerator annualised, denominator as average)**PFT_17 Ratio Total net operating income (A) / Total Assets (B) F 02.00 355 010 F 01.01 380 010
Asset / Equity (leverage contribution)
(numerator and denominator both as average)**PFT_18 Ratio Total Assets (A) / Total equity (B) F 01.01 380 010 F 01.03 300 010
EbT / NoP
(Non operating contribution)PFT_19 Ratio
[Earnings before Tax = Profit or (‐) loss before tax from continuing operations (A)] / [Net operating Profit
=Total operating income net (B)] F 02.00 610 010 F 02.00 355 010
NP / EbT
(tax effect on the capital yield)PFT_20 Ratio 1 ‐ {(Earnings before Tax(B) ‐ Net Profit (A) )/ ABS [Earnings before Tax (B)]} F 02.00 670 010 F 02.00 610 010
* The data points refer either to FINREP tables ("F") or COREP tables ("C") (http://www.eba.europa.eu/regulation‐and‐policy/supervisory‐reporting/implementing‐technical‐standard‐on‐supervisory‐reporting).
** For the calculation of the average the previous December figure is used as an “anchor” for the subsequent year, and the second the number is taken from the latest quarter observation, i.e. Q1, Q2, Q3 or Q4.
Data Point A* Data Point B*
Share of secured funding
Calculated as sum (numerator FND_28 and FND_29) / numerator FND_9
Credit risk capital requirements (excl. securitisation)

35
1
Department Oversight ‐ Risk Analysis Unit
European Banking Authority
One Canada Square, Canary Wharf ‐ London E14 5AA, United Kingdom