Embed Size (px)
Citation preview

EAWG Update March 6, 2012 Jacquie Smith, ReliabilityFirst Corp.
2 RELIABILITY | ACCOUNTABILITY
EA Process Approval
Path to Version 1 Approval and Implementation
1. Endorsed by the Operating and Planning Committees (January 2012)
2. Approved by the NERC Board of Trustees (February 2012)
3. Process in effect as of February 21, 2012 4. Informational Webinar on Thursday, March 15,
2012

3 RELIABILITY | ACCOUNTABILITY
EA Subcommittee Scope
EAS Primary Focus Points 1. Event Analysis Reports – Review reports and
provide OC/PC/CIPC updates, reliability standards input for SARs, and Registered Entity outreach
2. Lessons Learned Management – Review for quality, share with forums, and improve mechanisms for viewing on website.
3. NERC Staff – Increased collaboration with human performance and trending efforts, reliability assessments (post analysis)
4. Annual report with input to PAS and Process document maintenance

4 RELIABILITY | ACCOUNTABILITY
EA Subcommittee Membership
Proposed Subcommittee Membership
oAn industry representative and a Regional Entity representative from each Region
oSeek one active participant from each of the Forums oSeek a System Protection and Control Subcommittee
representative from the Planning Committee oAttempt to cover the industry’s functional groups
(RC, BA, TOP, GOP, etc.) with the aforementioned members
5 RELIABILITY | ACCOUNTABILITY
EAS Leadership oChair – Sam Holeman, Duke Energy oVice Chair – Hassan Hamdar, FRCC Staff oNERC Facilitator – Roman Carter
EAS Leadership

NERC Operating Committee (OC) Cyber Attack Task Force (CATF) Update
March 6, 2012

Status
• Comment Period – Second Round
January 24th – February 8th
Total of 8 comments received
• Final report incorporated in NERC CIPC Agenda package and distributed on February 22nd
• Present to NERC OC/PC for concurrence at March meeting in Phoenix
• Present to NERC CIPC for approval at March meeting in Phoenix
• Submit to ESCC for approval
• Submit to BOT prior to May meeting
2

Document Contents
1. Executive Overview
2. Adversaries, Motivations and Capabilities
3. What a Coordinated Attack Looks Like
4. Detection Capabilities
5. Deterrence / Defensive Capabilities
6. Responses to Attack
7. Recommendations
8. Outreach
9. References
Appendices
• Introduction to Attack Trees
• Other Sources of Information (Alerts, CERTS)
• Cyber Scenarios for System Operators
• Acronyms
• Potential Responses to an Attack
• Precursors and Local Indicators of an Unusual Event
• Isolation and Survivability Tactics
• Defensive Capabilities
• CRPA Observations and Recommendations
• Case Studies
3
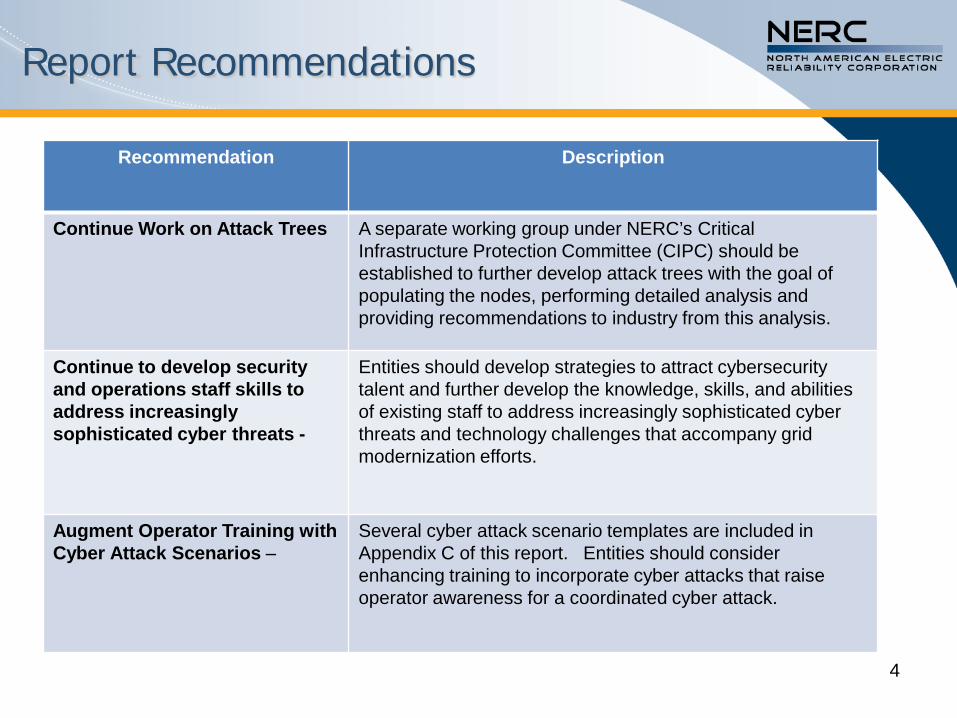
Report Recommendations
4
Recommendation Description
Continue Work on Attack Trees A separate working group under NERC’s Critical Infrastructure Protection Committee (CIPC) should be established to further develop attack trees with the goal of populating the nodes, performing detailed analysis and providing recommendations to industry from this analysis.
Continue to develop security and operations staff skills to address increasingly sophisticated cyber threats -
Entities should develop strategies to attract cybersecurity talent and further develop the knowledge, skills, and abilities of existing staff to address increasingly sophisticated cyber threats and technology challenges that accompany grid modernization efforts.
Augment Operator Training with Cyber Attack Scenarios –
Several cyber attack scenario templates are included in Appendix C of this report. Entities should consider enhancing training to incorporate cyber attacks that raise operator awareness for a coordinated cyber attack.

Report Recommendations
5
Recommendation Description
Conservative Operations - A significant amount of work in preparing for conservative operations is documented in the Severe Impact Resilience: Considerations and Recommendations report created by the Severe Impact Resiliency Task Force. Entities should review this document for applicable best practices that would apply to a coordinated cyber attack.
Conduct Transmission Planning Exercise –
Working with Department of Energy’s national labs and a pilot group of electricity utilities, a transmission planning exercise should be coordinated by NERC to simulate a coordinated cyber attack that creates a cascading event and blackout. The event should attempt to identify the point at which current transmission planning criteria is exceeded and allow for dynamic resilience and mitigation exercise.
Continue to endorse existing NERC initiatives that help entities prepare for and respond to a cyber attack –
Entities should consider greater participation and support of NERC’s initiatives that can help the industry with cyber attack identification, defense and response. Three examples are:
Cyber Readiness Preparedness Assessments (CRPA) NERC Grid Security Exercise ES-ISAC portal and collaboration

Report Recommendations
6
Recommendation Description
Increase Awareness for Department of Energy Initiatives
The Energy Sector Control Systems Working Group recently released the Roadmap to Achieve Energy Delivery System Cybersecurity. NERC’s Critical Infrastructure Protection Committee should review these initiatives and support further development and implementation of these initiatives to help ensure protection of critical systems supporting Bulk Power System.
Continue to Extend Public / Private Partnership –
Entities should review their cyber incident response plans to ensure an appropriate mix of operational, security, technical and managerial staff are aware of how they need to evaluate, respond and make timely decisions to slow or stop a coordinated cyber attack. This could include participating in ES-ISAC and government sponsored programs to share security-sensitive or classified information regarding cyber threats and vulnerabilities. In the event standard information sharing protocols are unavailable (e.g. between utilities, ES-ISAC, etc), alternative methods need to be defined.

Question & Answer

SIRTF Severe Impact Resilience Task Force
Approval Request - OC/PC/CIPC
Tom Bowe SIRTF Chair February 28th, 2012

2 RELIABILITY | ACCOUNTABILITY
Purpose
SIRTF Requests Approval of its Report

3 RELIABILITY | ACCOUNTABILITY
Report’s Conclusion
• The suggestions offered throughout this report are intended to prompt entities to develop their own approaches and flexible plans that would be applicable under a wide variety of circumstances.
• Entities are encouraged to critically examine their current capabilities, and to consider what else they may need to do to manage restoration and operations during a Severe Event.

4 RELIABILITY | ACCOUNTABILITY
• Entities are strongly encouraged to consider these from a strategic and leadership perspective,
• Recognize that the situation will need to be
continually assessed and plans adjusted as necessary through an extended period that could last months or years.
Report’s Conclusion

5 RELIABILITY | ACCOUNTABILITY
• On balance, the SIRTF concluded that entities do not need guidance on the applicability of standards during a Severe Event. Although a Severe Event may put entities in a position where they cannot comply with all standards, entities are in the best position to “do the right thing” for reliability and public safety, and self-report any violation of NERC standards as time and circumstances permit.
Conclusion – Compliance

6 RELIABILITY | ACCOUNTABILITY
Appendix 5: Severe Event Response Checklist
• PURPOSE: The Appendix provides checklist of questions
that may be used by entities through a Severe Event to periodically assess the situation and decide new courses of action as system conditions and circumstances evolve through the New Normal period.

7 RELIABILITY | ACCOUNTABILITY
Schedule and Deliverables
• Tech Committee Approvals – March 6-8
• BOT Approvals – March/April by
Teleconference? • The future – how do we keep this a living
document that improves with new ideas?
If any of you have a concern about the report please contact me at 610-666-4776 or

8 RELIABILITY | ACCOUNTABILITY
OC Future Work ?
• Key Recommendation #1 | Operations Page 21 - Consider which entities would take the
independent actions and the tools needed to stabilize islands when communications capability is severely disrupted or unavailable.
• Key Recommendation #3 | Operations Page 26 - Consider ways to adopt and apply the terms
“critical load” and “priority load” across all BPS entities to improve consistent use during a Severe Event.
• Develop, through system studies and industry experience, rules of thumb to help the operators determine the maximum size of a block of load that can be safely added to an island, based on the available MVA of synchronized generation.

9 RELIABILITY | ACCOUNTABILITY
OC Future Work ?
• Page 30 - Develop, through system studies and industry experience, rules of thumb to help the operators determine the maximum size of a block of load that can be safely added to an island, based on the available MVA of synchronized generation.
• Page 30 - System operators should consider developing policies on how they treat variable generation (i.e., wind, solar) during island operation.
• Enhance Appendix 3 Worksheet & 4 Checklist
• RESILIENCE DRILLS

10 RELIABILITY | ACCOUNTABILITY
PC Future Work ?
• Key Recommendation #16| Short-term and Long-term System Planning – Guidelines for . . . Consider performing selected studies in advance
(e.g., equipment interchangeability) that could help speed restoration. Perform studies to identify the islands that would
likely form during a Severe Event, and their sources of generation, including sources of generation (e.g., cogeneration at an industrial plant) not normally supplying the BPS.]
•

11 RELIABILITY | ACCOUNTABILITY
Possible MOTION
• The SIRTF Requests the committee’s approval.
• The _________________ Committee approves the Severe Impacted Resilience Report

12 RELIABILITY | ACCOUNTABILITY
COM-002-2 Introduction to Discussion
March 6-7, 2012 OC Chair Tom Bowe

2 RELIABILITY | ACCOUNTABILITY
Purpose of COM-002-2
COM-002-2 (Communication and Coordination): • Purpose:
1. To ensure BAs, TOPs, and GOPs have adequate communications and that these communications capabilities are staffed and available for addressing a real-time emergency condition.
2. To ensure communications by operating personnel are effective.

3 RELIABILITY | ACCOUNTABILITY
Background Information
COM-002-2 (Communication and Coordination): • 2003 Blackout Concerns – Are there Linkages?
• Three part should be utilized anytime there is a change in BES topology – i.e., the expectation that all directives to insert elements, disconnect elements or change operating levels would require 3-part communications

4 RELIABILITY | ACCOUNTABILITY
Interpretation of COM-002
COM-002-2 (Communication and Coordination): • Issue is not what we want the standard to say, but
what it does say – Strict Constructivist Approach. Interpretation is a fairness issue, not reliability, but, if approved, the interpretation needs some Best Practice guidance out to the industry
• COM-002-2 clearly has issues: 1. Where does emergency apply and where does it stop
in the purpose statement 2. What is a “directive”

Communications Protocol
NERC Operating Committee
March 6-7, 2012

Words….
• Verbal communications between employees of different organizations require a certain level of formality
• Entities that control a portion of the bulk power system recognize that we must work together in a coordinated fashion in order to preserve reliability

Words….
• Due to overlapping scopes, the OPCP SDT, RC SDT and RTO SDT met in 2009 in Charlotte, NC to reach agreement on the required level of formality for communications that included an action required of the recipient by the issuer
• The agreement reached there was that ordinary discourse did not require the use of three-way communication protocol

Words….
• For those exchanges that were intended to require a certain action in a certain time in order to preserve reliability, the teams agreed that three-way communication was necessary.
• A new definition was coined for “Reliability Directive” and requirements were written by RC SDT and RTO SDT to implement this definition.

Words….
• These standards developed by the RC SDT and RTO SDT are in the process of being approved.
• The teams have seen little pushback from the industry on this approach, however, FERC staff and some Regional compliance staff have continued to insist that all discussions between reliability personnel must be by three-way communication

Words….
• The crux of the matter is that for certainty, we need a formal communications protocol when a Reliability Directive is issued and identified as such by the issuer. However, if we formalize all speech – we dilute the importance of the true Reliability Directives.
• It may be easier to measure compliance if every discussion is required to use three-way communications, but at what cost to reliability?

Words….
• COM-003 New Definition: Operating Communication – Communication with the intent to change or maintain the state, status, output, or input of an Element or Facility of the Bulk Electric System.

ACE Diversity Interchange (ADI) Don Badley Operating Committee Meeting March 6, 2011 Phoenix, Arizona

2 RELIABILITY | ACCOUNTABILITY
ACE DIVERSITY INTERCHANGE: WHAT IS IT?
• ADI stands for Area Control Error (ACE) Diversity Interchange.
• ADI pools the momentary imbalance of ACE among Balancing Authorities to reduce control burden; reduce generation movement; reduce sensitivity to non-dispatchable resource output; and, improve control performance.
• ADI adjustments do not involve schedules or transmission; they are modeled as dynamic transfers and appear as actual interchange (pseudo-tie) in the ACE equation.
• ADI adjustments are not monetized.

3 RELIABILITY | ACCOUNTABILITY
ACE DIVERSITY INTERCHANGE: THE HISTORY
• ADI has been used in various regions in North America since the mid-1980s. It was developed in MAPP.
• ADI has been used by Balancing Authorities in the MAPP, NPCC, MISO, WECC, and SPP.

4 RELIABILITY | ACCOUNTABILITY
ACE DIVERSITY INTERCHANGE: DEFINITIION
A frequency neutral form of ACE exchange that uses real-time, sub-minute adjustments to the raw ACE values of participating Balancing Authorities that always net to zero and are non-zero individually only when at least one participating Balancing Authority’s raw ACE value differs in algebraic sign from at least one other participating Balancing Authority’s raw ACE. Participating Balancing Authorities achieve reductions in their generation control and reporting ACE values via Dynamic Transfers of the ADI adjustments computed by an ACE Diversity Interchange algorithm.

5 RELIABILITY | ACCOUNTABILITY
• Balancing Authorities participating in ADI have backup plans to address failures in data exchange communications.
• Individual Balancing Authorities can enable or disable their participation in real-time for reliability concerns.
• Global enabling or disabling of ADI is activated when appropriate for global reliability concerns.
• The ADI process will be disabled in the event that normal or contingent operations require the use of transmission being used for ADI-related activity.
• The present ADI implementations all have limits on the magnitude of ADI exchanges and are subject to oversight by the ADI program’s stakeholders and industry subject matter experts.
ACE DIVERSITY INTERCHANGE: IMPLEMENTATION MECHANICS

6 RELIABILITY | ACCOUNTABILITY
ACE DIVERSITY INTERCHANGE: INDUSTRY CONCERNS
Reliability concerns have been expressed about present and future implementations of ADI. The ADI Task Force divided these concerns into three categories.
• Reliability (8)
• Administrative (5)
• Equity (4)

7 RELIABILITY | ACCOUNTABILITY
ACE DIVERSITY INTERCHANGE: RELIABILITY CONCERNS
R1 – Can system frequency be affected adversely by ADI?
R2 – Does ADI create congestion management problems?
R3 – Does the presence of ADI create system modeling difficulties?
R4 – Does ADI detract from the effectiveness of CPS2, which includes adjustments for ADI, in limiting deviations from net scheduled flow of participating Balancing Authorities?
R5 – Will ADI hamper the development of future transmission-based ACE limits?

8 RELIABILITY | ACCOUNTABILITY
R6 – Are there sufficient controls in place such that Balancing Authorities, Reliability Coordinators, and Transmission Operators can observe any adverse impacts being caused by ADI?
R7 – Will ADI obscure DCS measurements such that contingencies will in part be exported without proper attendant monitoring?
R8 – Will inconsistencies in ADI implementations hamper the ability of Reliability Coordinators to manage their Interconnections?
ACE DIVERSITY INTERCHANGE: RELIABILITY CONCERNS

9 RELIABILITY | ACCOUNTABILITY
A1 – Does ADI cause any inherent conflicts with the assignment of functions among entities described in the industry’s reliability functional model?
A2 – Does ADI complicate computations related to transfer capability?
A3 – Are transmission service requirements addressed adequately in the presence of ADI?
A4 – How should transmission reservations be addressed in the presence of ADI?
A5 – Are inadvertent accounts being managed properly in the presence of ADI?
ACE DIVERSITY INTERCHANGE: ADMINISTRATIVE CONCERNS

10 RELIABILITY | ACCOUNTABILITY
E1 – Does ADI give unfair advantages to its participants related to CPS2?
E2 – Does ADI interfere with energy or regulation markets?
E3 – Are there equity concerns related to Inadvertent?
E4 – Are there inequities within the ADI allocation methodologies related to the size of participating Balancing Authorities?
ACE DIVERSITY INTERCHANGE: EQUITY CONCERNS
11 RELIABILITY | ACCOUNTABILITY
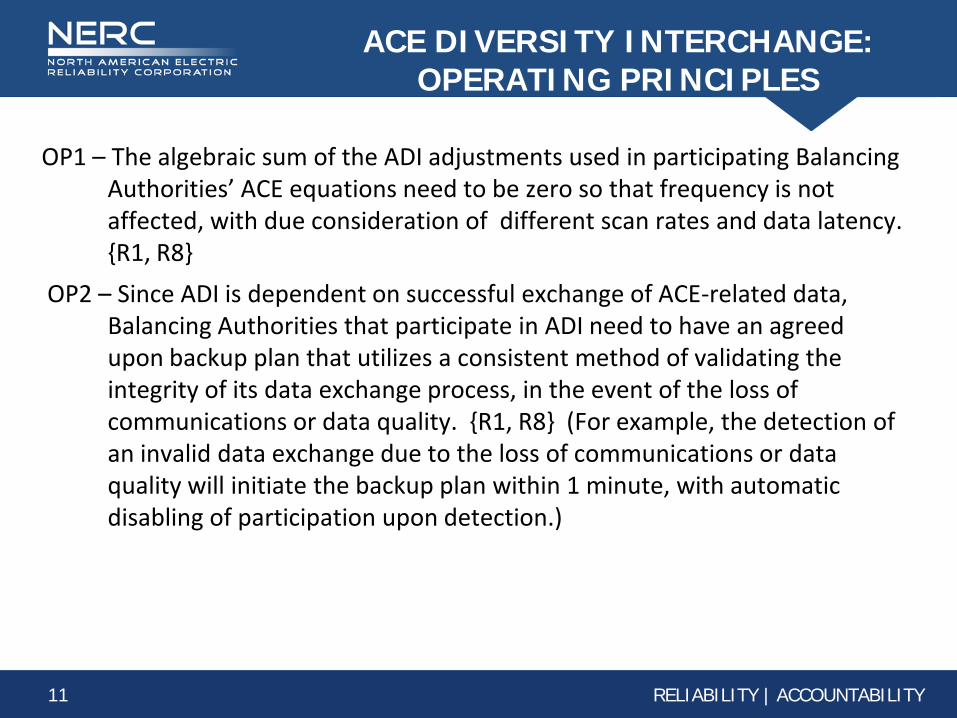
ACE DIVERSITY INTERCHANGE: OPERATING PRINCIPLES
OP1 – The algebraic sum of the ADI adjustments used in participating Balancing Authorities’ ACE equations need to be zero so that frequency is not affected, with due consideration of different scan rates and data latency. R1, R8
OP2 – Since ADI is dependent on successful exchange of ACE-related data, Balancing Authorities that participate in ADI need to have an agreed upon backup plan that utilizes a consistent method of validating the integrity of its data exchange process, in the event of the loss of communications or data quality. R1, R8 (For example, the detection of an invalid data exchange due to the loss of communications or data quality will initiate the backup plan within 1 minute, with automatic disabling of participation upon detection.)

12 RELIABILITY | ACCOUNTABILITY
ACE DIVERSITY INTERCHANGE: OPERATING PRINCIPLES
OP3 – Implementations of ADI need to be reviewed and approved by the NERC Resources Subcommittee and the NERC Operating Reliability Subcommittee prior to deployment in order to verify that the intent of applicable Balancing and Transmission related Standards are not compromised by the implementation. R1, R4, R8, E1
OP4 – Balancing Authorities participating in ADI need to continuously assure that their regulation control is not affecting the reliability of the transmission system. R2, R8
OP5 – Balancing Authorities participating in ADI need to develop an appropriate methodology to continuously verify that their regulation control is not affecting the reliability of the transmission system. R2, R8
13 RELIABILITY | ACCOUNTABILITY
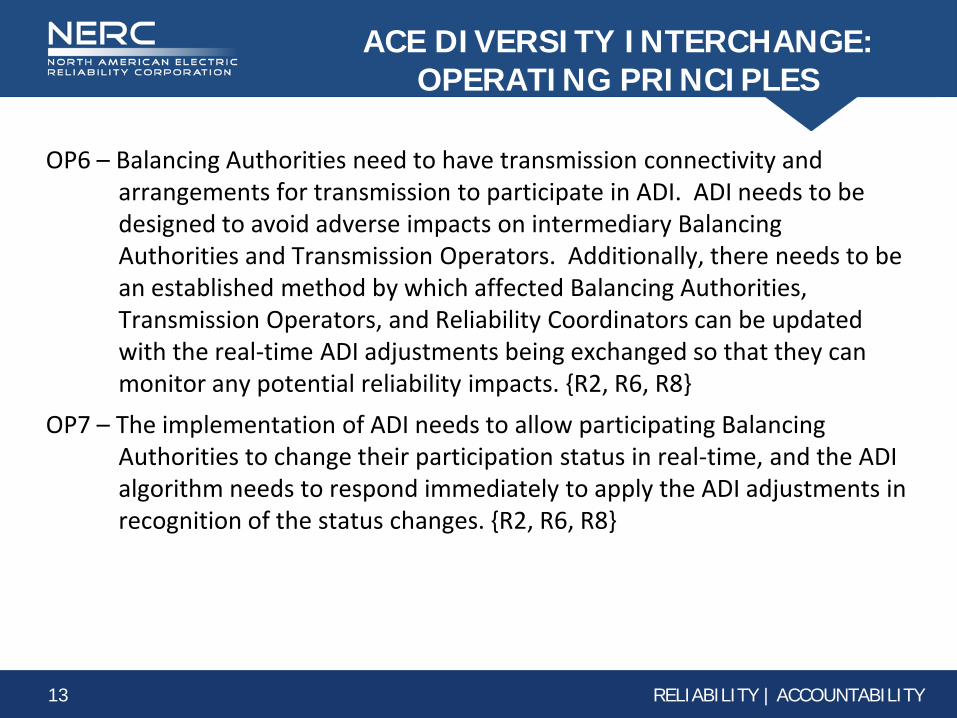
ACE DIVERSITY INTERCHANGE: OPERATING PRINCIPLES
OP6 – Balancing Authorities need to have transmission connectivity and arrangements for transmission to participate in ADI. ADI needs to be designed to avoid adverse impacts on intermediary Balancing Authorities and Transmission Operators. Additionally, there needs to be an established method by which affected Balancing Authorities, Transmission Operators, and Reliability Coordinators can be updated with the real-time ADI adjustments being exchanged so that they can monitor any potential reliability impacts. R2, R6, R8
OP7 – The implementation of ADI needs to allow participating Balancing Authorities to change their participation status in real-time, and the ADI algorithm needs to respond immediately to apply the ADI adjustments in recognition of the status changes. R2, R6, R8

14 RELIABILITY | ACCOUNTABILITY
ACE DIVERSITY INTERCHANGE: OPERATING PRINCIPLES
OP8 – Real-time observability of participation and communication status, raw ACE, ADI adjustments, and ADI-adjusted ACE values need to be available to Balancing Authorities, Transmission Operators, and Reliability Coordinators. The ADI participants need to share the ADI results with the appropriate Reliability Coordinators who can also assess the impacts. R2, R6, R8
OP9 – When a Balancing Authority is an ADI participant and it experiences a contingency that qualifies as a NERC DCS Reportable Event, and, the other Balancing Authorities participating in ADI do not jointly activate contingency reserve sharing for the resource loss, then ADI needs to be disabled by the contingent Balancing Authority when their contingency occurs, or after-the-fact corrections need to be made to remove the ADI adjustment from ACE to compute DCS recovery. R7, R8
15 RELIABILITY | ACCOUNTABILITY
ACE DIVERSITY INTERCHANGE: ADMINISTRATIVE CONCERNS & RECOMMENDATIONS
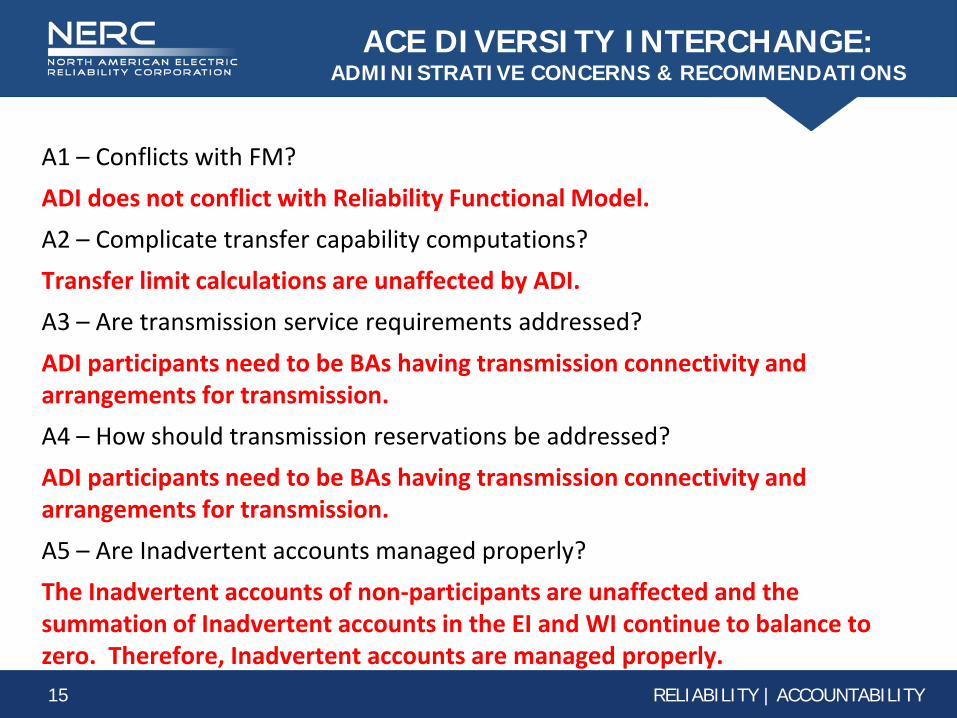
A1 – Conflicts with FM?
ADI does not conflict with Reliability Functional Model.
A2 – Complicate transfer capability computations?
Transfer limit calculations are unaffected by ADI.
A3 – Are transmission service requirements addressed?
ADI participants need to be BAs having transmission connectivity and arrangements for transmission.
A4 – How should transmission reservations be addressed?
ADI participants need to be BAs having transmission connectivity and arrangements for transmission.
A5 – Are Inadvertent accounts managed properly?
The Inadvertent accounts of non-participants are unaffected and the summation of Inadvertent accounts in the EI and WI continue to balance to zero. Therefore, Inadvertent accounts are managed properly.

16 RELIABILITY | ACCOUNTABILITY
ACE DIVERSITY INTERCHANGE: EQUITY CONCERNS & RECOMMENDATIONS
E1 – Does ADI give unfair advantages to its participants related to CPS2?
The review of CPS2 compliance for existing ADI implementations did not point to any abusive practices.
E2 – Does ADI interfere with energy or regulation markets?
ADI’s interaction with energy and regulation markets (E2) was reviewed. Given the OP4 and OP5 practice of disabling ADI, if transmission constraints arise, ADI does not impact energy markets directly.
E3 – Are there equity concerns related to inadvertent?
Inadvertent energy accounts of Balancing Authorities not participating in ADI are unaffected.
E4 – Are there inequities within the ADI allocation methodologies related to the size of participating Balancing Authorities?
The review of CPS2 compliance for existing ADI implementations did not point to any abusive practices.

17 RELIABILITY | ACCOUNTABILITY
ACE DIVERSITY INTERCHANGE: CONCLUSIONS
• Based on operating experience, existing implementations of ADI do not have an adverse impact on the reliability of the Interconnections.
• Existing ADI implementations are consistent with NERC standards, especially BAL-001 and BAL-002, as well as BAL-005 R6, R9, and R10.
• ADI implementation differences are acceptable provided that operating principles 1 through 9 are adhered to.
• Operating principles 1 through 9 above would assure that future implementations of ADI will not have an adverse impact on the reliability of the Interconnections.

18 RELIABILITY | ACCOUNTABILITY
ACE DIVERSITY INTERCHANGE: CONCLUSIONS
• To assure the reliability of the Interconnections, the Reliability Coordinators need to have the ability to monitor ADI activity and, if necessary, direct suspension of ADI and, subsequently, authorize re-initiation of ADI.
• With the exception of the requirement for the sign diversity of ACE values, all requirements and operating principles noted for ADI should apply equally to the provision of supplemental regulation.
• ADI participants need to be Balancing Authorities having transmission connectivity and arrangements for transmission.

19 RELIABILITY | ACCOUNTABILITY
ACE DIVERSITY INTERCHANGE: RECOMMENDATIONS
• ADI implementations should be allowed to continue.
• This white paper should be transformed into a Reference Document and added to the NERC Operating Manual.
• Operating principles within this white paper should be considered in the development of a relevant standard.

20 RELIABILITY | ACCOUNTABILITY
Questions and Answers

ALR Task Force
OC Meeting March 6-7, 2012
Keith Carman, Jerry Rust, ALR Task Force Members
2 RELIABILITY | ACCOUNTABILITY
Outline
• Background
• Work Products
• Plan
• Next Steps
• OC Comments

3 RELIABILITY | ACCOUNTABILITY
Background
• Adequate Level of Reliability Task Force (ALRTF) charged with: Reviewing current definition of ALRTF (filed for information
with FERC in 2008)
Determining if existing definition and characteristics need enhancement in coordination with the MRC’s BES/ALR Policy Group
• Task Force includes representatives from each of the Standing Committees
• Has met monthly since June 2011

4 RELIABILITY | ACCOUNTABILITY
Background, cont.
• Goal: Definition of ALR that encompasses NERC’s responsibility to ensure
reliability, and to define objectives and characteristics that are measurable
Enable the ERO enterprise to focus on and align its activities with specific characteristics of ALR that have the greatest impact on bulk power system reliability
• Definition must be: Concise, yet self-contained
Self-explanatory to BES planners and operators
Meaningful to policymakers

5 RELIABILITY | ACCOUNTABILITY
ALRTF: Work Products
• ALR Definition: Draft three-page revised ALR Definition
• ALR Technical Document: Supporting nineteen page document that details the approach
• Socio-Economic Impacts Discussion Paper: Separate ten page discussion paper that addresses ALRTF thinking on concepts such as societal risk tolerance and probabilistic approaches to BES reliability. It addresses a number of issues that may form the basis for future research.
• Note that a side-by-side comparison of the proposed definition with the
existing definition of ALR is in progress and will be integrated into the ALR Technical Document.

6 RELIABILITY | ACCOUNTABILITY
Next Steps
• Friday March 2 or Monday March 5: post draft documents for a three-week preliminary review by the standing committees.
• March 6-7-8: Standing committees (OC, PC, CIPC) discuss as schedules permit including comment process.
• March 23: Comments from standing committees (members) due to ALRTF
• Week of March 26: Edit documents to incorporate standing committee member comments.
• Week of April 2: Post for initial 45-day industry comment period
• Late May – early June: Assess next steps and prepare responses to comments
• June 2012: Repost for additional comments or prepare to present to standing committees for endorsement at their June 19-21 meetings in Toronto.

7 RELIABILITY | ACCOUNTABILITY
ALR: OC Comments
Specific areas ALRTF is seeking OC comment:
• Does the definition make sense? Performance that meets or exceeds objectives
Does the document set out fundamental reliability objectives and performance outcomes for reliable planning and operation of the BES? o Are elements missing?
o Is there duplication?
• Should the concept of adequacy be included in the definition? FPA section 215 – facility construction
• Does the construction of the documents make sense? Definition w/ 3 pages of performance objectives
19 pages of technical document explanation

8 RELIABILITY | ACCOUNTABILITY
ALR: OC Comments (cont’d)
Specific areas ALRTF is seeking OC comment:
• Section 4.2, Causes of Disturbances Included in the technical document or a separate appendix?
• Do the definition and technical document appropriately address the OC’s Operational Reliability issues?
• Do you support the concepts laid out in the Socio-Economic Impacts Discussion Paper? Should there be a second effort to define Socio-Economic impacts?
• Ideas for future development?

9 RELIABILITY | ACCOUNTABILITY
Questions?

CAN Update OC, PC and CIPC Phoenix March 6-8, 2012 Valerie Agnew, Mgr Interface and Outreach

2 RELIABILITY | ACCOUNTABILITY
Agenda
• CAN Process Improvements Consistency Efforts
NERC Committee involvement
• High Level of Review CAN-0016
CAN-0008
• Individual CANs CAN-0017, CAN-0024, CAN-0043 and CAN-0022
• CAN Production Status
•Registered Entity Assessments
•RSAWS

3 RELIABILITY | ACCOUNTABILITY
CAN Purpose
Create Consistency
• ERO-wide
• 80/20 or 98/2 Rule
Provide Transparency
Deliver Expeditiously

4 RELIABILITY | ACCOUNTABILITY
•CAN Process Steps
• Earlier and additional input needed • NERC Committees (SC, CCC, OC, PC, CIPC)
• Primary Process • Transition Process
• Provide for range of methods for compliance • 2 week Regional comment period • Provide a final check point for Regions

5 RELIABILITY | ACCOUNTABILITY
CAN Process

6 RELIABILITY | ACCOUNTABILITY
CAN Process

7 RELIABILITY | ACCOUNTABILITY
Standards’ Process Subcommittee CAN Prioritization Tool
• Provides objective prioritization • Offered to all NERC Committees, but no
obligation • Open to suggestions for other criteria • Trial for a period of time to see if outcomes are
consistent • For more information, contact:
• Ben Li
• Laura Hussey

8 RELIABILITY | ACCOUNTABILITY
Standards’ Process Subcommittee CAN Prioritization Tool

9 RELIABILITY | ACCOUNTABILITY
Standards’ Process Subcommittee CAN Prioritization Tool
• Does the request for clarity involve multiple requirements, including in related standards?
• Reliability impact of the requirements involved (with VRF as a proxy)
• On Most Frequently Violated list
• On Most Frequently dismissed violations
• Have there been multiple requests for clarification about compliance obligations?
• Does the CAN Involve a CIP standard
• Is the standard or requirement on the AML (or next year’s AML)?
• Requirements that apply to a large number of types of functional entities

10 RELIABILITY | ACCOUNTABILITY
Standards’ Process Subcommittee CAN Prioritization Tool
• May be benefits to standardized prioritization • Continue to request NERC Committee pre-
development input on potential CAN issues • NERC Staff will continue to bring the
Committees more information on potential issues

11 RELIABILITY | ACCOUNTABILITY
CAN-0016 High Level Review
• Several Trade organizations requested the first high level review on January 25, 2012
Edison Electric Institute (EEI)
National Rural Electric Cooperative Association (NRECA)
The Electric Power Supply Association (EPSA)
The Transmission Access Policy Study Group (TAPS)
Electricity Consumers Resource Council (ELCON)
The American Public Power Association (APPA)

12 RELIABILITY | ACCOUNTABILITY
CAN-0016 High Level Review
• NERC CEO responded to the request on February 8, 2012
• CAN-0016 was remanded to NERC Staff for further work or for withdrawal
• CAN-0016 was withdrawn
• CEAs are not to assess compliance according to CAN-0016 – look to the NERC CEO response

13 RELIABILITY | ACCOUNTABILITY
CAN-0016 High Level Review
Response: The CAN imposes a new requirement that the sabotage events covered are those impacting or threatening the reliability of the BPS, when the intent of the standard may have been broader than that, as supported by the purpose statement.
Direction for future CANs: • Simplify language
• Move disclaimer to the front of CANs
• Add purpose statement of standard at issue
• Address Effective Date recommendations

14 RELIABILITY | ACCOUNTABILITY
CAN-0008 High Level Review
• The Trade organizations requested the high level review on February 24, 2012
• Basis for Review
CAN creates retroactive rulemaking
CAN violates due process
• NERC CEO will issue a response within 14 days

15 RELIABILITY | ACCOUNTABILITY
CAN Status
• 4 CANs have been retired
• 1 CAN has been remanded (CAN-0016)
• 24 CANs are posted as final
• There were 11 CANs that were in development in 2011 • Currently 8 are planned for development
• Added an additional step to obtain NERC Committees input
• 26 CANs are in the pre-development prioritization/comment period • Prioritization due March 9 (extended from February 29)
• Next set of potential CAN issues posted March 12 • Approximately 12 new requests have been received

16 RELIABILITY | ACCOUNTABILITY
Individual CANs
• CAN-0022 VAR-002 Generator Operation in Manual Mode
• CAN-0043 PRC-005 Protection System Maintenance and Testing Evidence
• CAN-0017 CIP-007 Technical and Procedural System Access and Password Controls
• CAN-0024 CIP-002–CIP-009 Routable Protocols and Data Diode Devices

17 RELIABILITY | ACCOUNTABILITY
CAN-0022
This applies to throughout the CAN
18 RELIABILITY | ACCOUNTABILITY
CAN-0043

19 RELIABILITY | ACCOUNTABILITY
Individual CANs
• CAN-0017 CIP-007 Technical and Procedural System Access and Password Controls
• CAN-0024 CIP-002–CIP-009 Routable Protocols and Data Diode Devices

20 RELIABILITY | ACCOUNTABILITY
Registered Entity Assessments
• CCC working group is meeting bi-weekly
• ERO focus groups are being developed; attendees will be finalized in the next 2 weeks
• Individual entities are providing comments
• Regional Entities are providing input
• Schedule: • Late Q2/early Q3 – post draft template for comment
• Review comments and determine further action
• Post final template before year end

21 RELIABILITY | ACCOUNTABILITY
RSAWS
• PER-005

22 RELIABILITY | ACCOUNTABILITY
Questions

Performance Analysis Subcommittee (PAS) Update
Bill Adams, PAS Chair, Georgia Power Company OC/PC Meeting, March 6-7, 2012

2 RELIABILITY | ACCOUNTABILITY
Topics
• Status Update
• PAS Annual Report
• TADS, GADS, DADS Updates
• Event Driven Index – Approval Item

3 RELIABILITY | ACCOUNTABILITY
Status
• Held January face-to-face meeting in ATL
• Discussed 2012 State of Reliability Report Purpose, organization, timeline, work plan
• Annual Metric Review (18 metrics)
• Integrated reliability indicator Roadmap Considering Sandia’s recommendations - build a
probabilistic model which statistically links reliability cause/effect and identify top initiating events. Sandia’s final report: http://www.nerc.com/docs/pc/rmwg/pas/Mar_2012_OCPC/Final_Memo_Sandia.pdf
4 RELIABILITY | ACCOUNTABILITY
Report Organization
• Executive Summary
• Introduction
• Key Findings/Conclusions
• Reliability Indicators
• Integrated Study, analysis of: TADS GADS DADS Events
• Post Summer Assessments for 2011
• Future Advancements

5 RELIABILITY | ACCOUNTABILITY
Desired Timeline and Current Work Plan
• Publish each spring Critical path: TADS annual submittal by 2/29/12
• Draft TADS analysis (2008-2010) by 3/9/12
• ERO-RAPA and TADS regional coordinators: – shorten review time from 3 to 2 weeks
– Complete by March 16, 2012
• NERC review and second draft by 3/23/12

Subgroup Update TADSWG, GADSWG, & DADSWG
Agenda Item 5 MRC Presentation January 31, 2012

7 RELIABILITY | ACCOUNTABILITY
TADSWG
• Held January face-to-face meeting at SERC offices
• Endorsed EIA’s recommendation for analyzing 2008-2011 single mode outage data Unpaired Poisson method (in agenda package)
• Developed a voluntary data request for common/ dependent mode outages Due 3/6/2012 (in agenda package)
• Received 49 sets of comments on proposed 100-199kV outage data collection Present responses at June PC meeting

8 RELIABILITY | ACCOUNTABILITY
GADSWG
• First face-to-face meeting slated: 3/14-15/12
• January 1, 2012 – Mandatory generating availability data request starts
• March 20, 2012 – Software (webE-GADS) training starts
• April 30, 2012 – First quarter data due

9 RELIABILITY | ACCOUNTABILITY
DADSWG
• First face-to-face meeting – 2/29 to 3/1, 2012; Work plan to publish first DADS report in June; Reviewed first dataset - 4/1/2011 – 9/30/2011
Demand Response Availability Data (April – September 2011)
total # of entities reported 133
# of avg registered resources each month 6,300,218
max # of registered resources (in August) 6,639,579
avg registered capacity (MW) each month 50,403
max registered capacity (MW) (in August) 53,883
total # of deployment events (April to Sept.) 667
total deployment (MW) from April to Sept. 48,509
realized demand reduction rate 62% (30,002 MW)
avg deployment duration 2 hour 49 minutes

Event Driven Index (EDI)
Agenda Item 5 MRC Presentation January 31, 2012

11 RELIABILITY | ACCOUNTABILITY
Integrated Indicators
• December 2011, the OC/PC approved phased approach to develop 3 integrated indicators Focus on individual reliability performance areas
Event Driven Index (EDI) – by March 2012
Condition Driven Index (CDI) – by June 2012
Standards Driven Index (SDI) – by June 2012
12 RELIABILITY | ACCOUNTABILITY
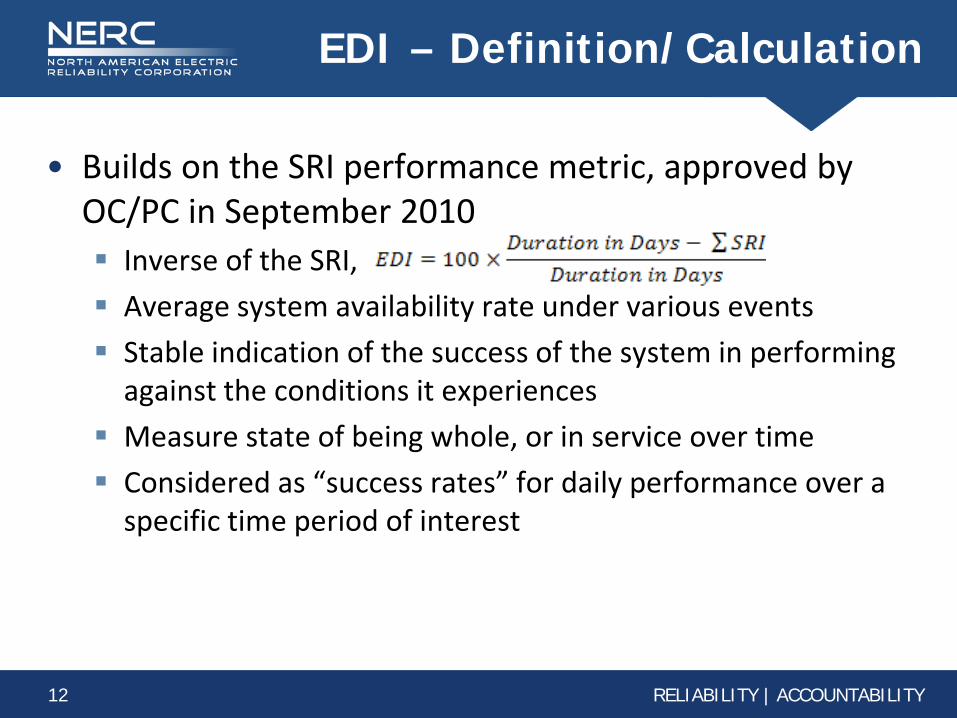
EDI – Definition/Calculation
• Builds on the SRI performance metric, approved by OC/PC in September 2010 Inverse of the SRI,
Average system availability rate under various events
Stable indication of the success of the system in performing against the conditions it experiences
Measure state of being whole, or in service over time
Considered as “success rates” for daily performance over a specific time period of interest

13 RELIABILITY | ACCOUNTABILITY
EDI - Application
• EDI increases if the accumulation of significant events (both in count and magnitude) is reduced over a trending period
• Stakeholders can use the tool to measure the severity of these days, compare against event analysis reports and disturbance history

14 RELIABILITY | ACCOUNTABILITY
EDI - Limitations
• Historical measure useful for trending and does not address real-time, nor forward-looking performance score
• Neither current SRI nor EDI incorporate any “risk” parameters As experience with both measures increases there may be
opportunity to transition into a risk-based view

15 RELIABILITY | ACCOUNTABILITY
Future Steps
Present
• Severity Risk Index
• Adequate Level of Reliability metrics
• TADS • GADS • Event Analysis
Database • Event Driven
Index (EDI) proposal
• CDI proposal • SDI proposal
Work Plan
• Statistically link reliability reduction cause & effect
• Link event, precursor indicators, and outage datasets to explore initiating events
• Find top initiating events
• Develop reliability index framework
Future
• Use the probabilistic cause & effect model to quantitatively measure reliability
• Focus on improving top initiating event performance
• Help focus industry on relevant reliability risks to improve reliability

16 RELIABILITY | ACCOUNTABILITY
Recommended Action
• The PAS recommends that the Operating Committee and Planning Committee Approve the Event Driven Index whitepaper

17 RELIABILITY | ACCOUNTABILITY
Questions and Answers

NASPI Visualization Workshop Summary
Dave Zwergel MISO March 5, 2012

NASPI Visualization Workshop
• Who – 125 attendees
– 20 operators (5 east, 15 west – RCs and BAs)
– 4 visualization tool providers (Alstom Grid, Electric Power Group, OSIsoft, PowerWorld)
– 3 human factors visualization experts (PNNL, ERCOT, NERC)
• When – February 28, 2012, in Orlando, before the NASPI Work Group meeting
2
Why – Workshop purpose Compare wide-area situational awareness tools
using synchrophasor data to see whether they meet operators’ needs
• Look at several visualization tools head-to-head for the same grid events (use film clips)
• Look at visual portrayal of information and how easy it is to understand (but not at analytical capabilities underlying each tool)
• Get operators’ feedback directly • Get input from human factors visualization
experts on how to make these better 3

What events did we look at?
Four grid events:
1. Large generation outage in the west (SoCal)
2. Islanding in the west (Alberta from US)
3. Growing oscillation in the west
4. Line outages and oscillations in the east
4

Sample screen shots
(1) Western generator outage
1-C 1-F
1-A 1-D
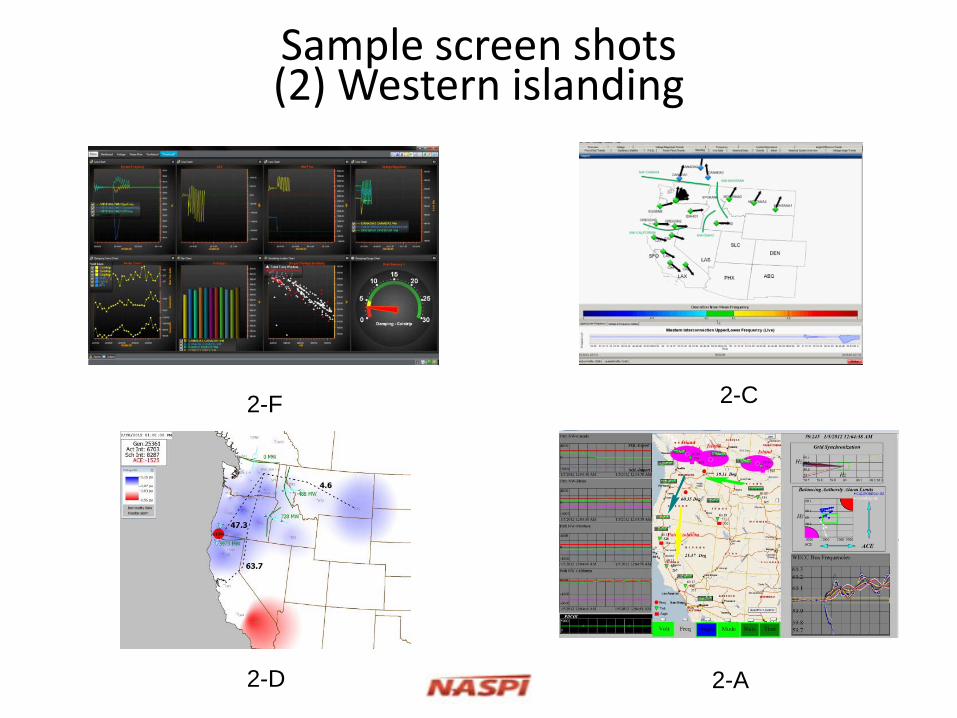
Sample screen shots (2) Western islanding
2-D
2-F
2-A
2-C

What did we learn (or re-learn)? • Operators could figure out every event from every tool (with
one exception)
• Each visualization tool has strengths and weaknesses
• Some operators want numbers, some like graphs and pictures
• Different operators’ jobs require different screens and information at different times – no one screen or metric works all the time
– sometimes there’s too much information
• Synchrophasor data reveals conditions (esp. oscillations) that SCADA doesn’t
• Don’t need “common look and feel” w/in control rooms but do need common view and terms in emergencies
7

What’s next? • Issue workshop summary, share with attendees and OC
• Share visualization principles from human factors experts with workshop participants
• Visualization tool vendors already thinking about how to improve their tools based on this feedback
• Share workshop insights with NERC Human Factors conference
• NERC guidance – industry needs to move toward more common view of events to facilitate fast, effective interpretation and communication in grid emergencies
All summary materials and event clips will be posted on www.naspi.org
8

For more information Event clip examples (all will be posted soon) • Event 1
– http://www.youtube.com/watch?v=rf5bfnefatY2-L
– http://youtu.be/cPh_mACCIbA
• Event 2 – http://www.youtube.com/watch?v=35VURxHm5gM3-L
– http://youtu.be/AX_aH5OyuWM
• Event 3 – http://www.youtube.com/watch?v=VgCLmcIjBcw4-L
• Event 4 – http://www.youtube.com/watch?v=b1rJhtJYLCo
NASPI -- www.naspi.org
9
System Events Reliability Risk Management Group Operating Committee Meeting March 6 & 7, 2011 Earl Shockley, Director of Reliability Risk Management

2 RELIABILITY | ACCOUNTABILITY
Emerging Risks
Emerging Reliability Risks Identified by Trend Analysis

3 RELIABILITY | ACCOUNTABILITY
Event Trending Case Study 1
• Trending analysis of bulk power system events identified approximately 15 occurrences where equipment was inadvertently left in an abnormal state following maintenance.
• Extent of conditions was conducted by impacted entities, they discovered many more inadvertent abnormal configurations.
• NERC Alert was issued “Reducing Human Performance Errors by the Use of Configuration Control Practices.”

4 RELIABILITY | ACCOUNTABILITY
• Trending analysis of bulk power system events identified 27 Category 2b events (over the past 15 months) where a complete loss of SCADA/EMS lasted for more than 30 minutes.
• Current analysis of these events: Software failure is a major contributing factor in 60% of the events.
Individual operator error has attributed less than 10% of the events
• Testing of the equipment has been shown to be a factor in over 50% of the failures: Test environment did not match the production environment
Product design (less than adequate)
Event Trending Case Study 2

5 RELIABILITY | ACCOUNTABILITY
• Change Management had an impact in over 50% of the failures: Risk and consequences associated with change not properly
managed
Identified changes not implemented in a timely manner
Event Trending Case Study 2
NERC is currently drafting an industry alert

6 RELIABILITY | ACCOUNTABILITY
Quality of Event Reports
• 75% of event analysis reports stop at the mode Failure Mode: The manner whereby the failure is observed
Failure Mechanism: Physical, chemical or other processes that led to the failure
Error Mode: The manner whereby the error is observed
Error Mechanism: Human actions along the skills, rules, knowledge continuum

7 RELIABILITY | ACCOUNTABILITY
Background Material
Background material

8 RELIABILITY | ACCOUNTABILITY
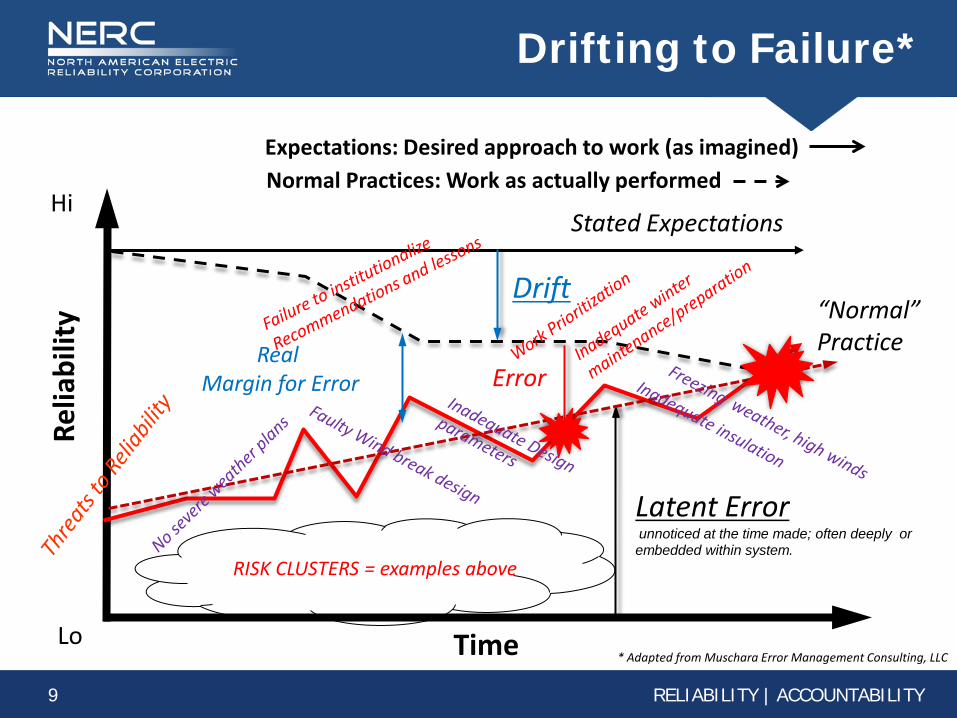
Drifting to Failure Concept*
Latent Errors unnoticed at the time made; often deeply or embedded within system.
Relia
bilit
y
Hi
Lo Time
Drift
Managements Stated Expectations
“Normal” Practice
Real Margin for Error
* Adapted from Muschara Error Management Consulting, LLC
Error
RISK CLUSTERS - Programmatic deficiencies, deficiencies in barriers and defenses, Latent organizational weaknesses and conditions Errors in human performance and contextual factors Equipment design and/or maintenance issues
Expectations: Desired approach to work (as imagined) Normal Practices: Work as actually performed
9 RELIABILITY | ACCOUNTABILITY
Drifting to Failure*
Latent Error unnoticed at the time made; often deeply or embedded within system.
Relia
bilit
y
Hi
Lo Time
Drift
Stated Expectations
“Normal” Practice Real
Margin for Error
* Adapted from Muschara Error Management Consulting, LLC
Error
RISK CLUSTERS = examples above
Expectations: Desired approach to work (as imagined) Normal Practices: Work as actually performed
10 RELIABILITY | ACCOUNTABILITY
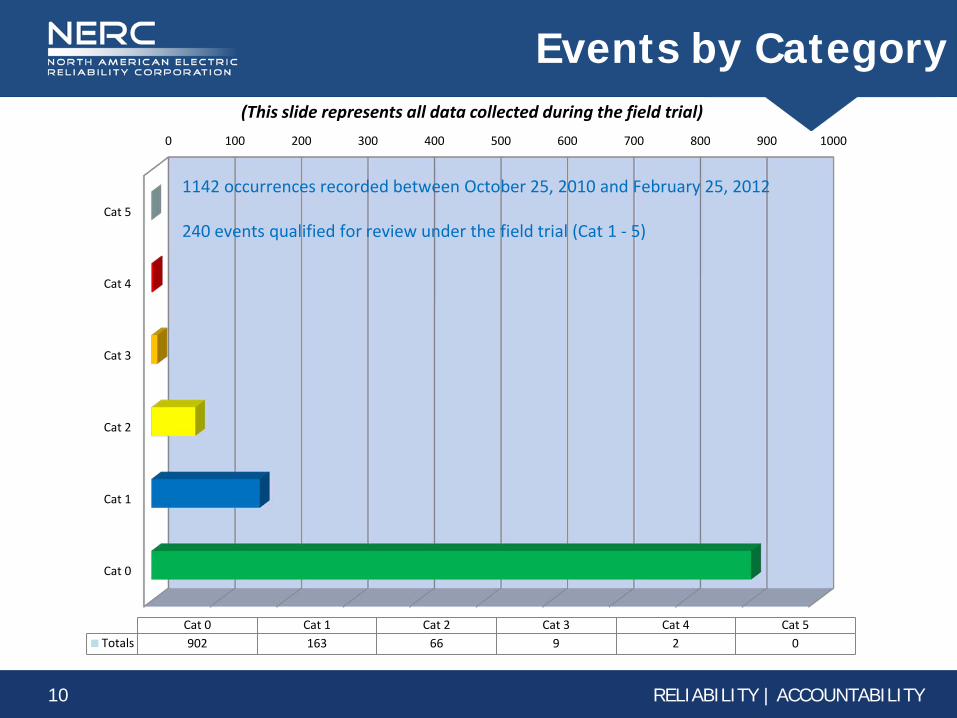
Events by Category (This slide represents all data collected during the field trial)
0 100 200 300 400 500 600 700 800 900 1000
Cat 5
Cat 4
Cat 3
Cat 2
Cat 1
Cat 0
Cat 5 Cat 4 Cat 3 Cat 2 Cat 1 Cat 0 Totals 0 2 9 66 163 902
1142 occurrences recorded between October 25, 2010 and February 25, 2012 240 events qualified for review under the field trial (Cat 1 - 5)

11 RELIABILITY | ACCOUNTABILITY
Qualified Events by Quarter (This slide represents all data collected during the field trial)
121
190
226
333
188
84
0
50
100
150
200
250
300
350
2010Q4 2011Q1 2011Q2 2011Q3 2011Q4 2012Q1
2012Q1 only contains two months of data
2010Q4 only contains two months of data

12 RELIABILITY | ACCOUNTABILITY
Event Trending *
* Control chart of monthly events, with control limits calculated by using 3-month Moving Average method
23
21.14
8.86
0
5
10
15
20
25
Nov-10 Dec-10 Jan-11 Feb-11 Mar-11 Apr-11 May-11 Jun-11 Jul-11 Aug-11 Sep-11 Oct-11 Nov-11 Dec-11 Jan-12 Feb-12
Qualified events (October 25, 2010 - February 25, 2012)
Monthly average = 15.0 events
13 RELIABILITY | ACCOUNTABILITY
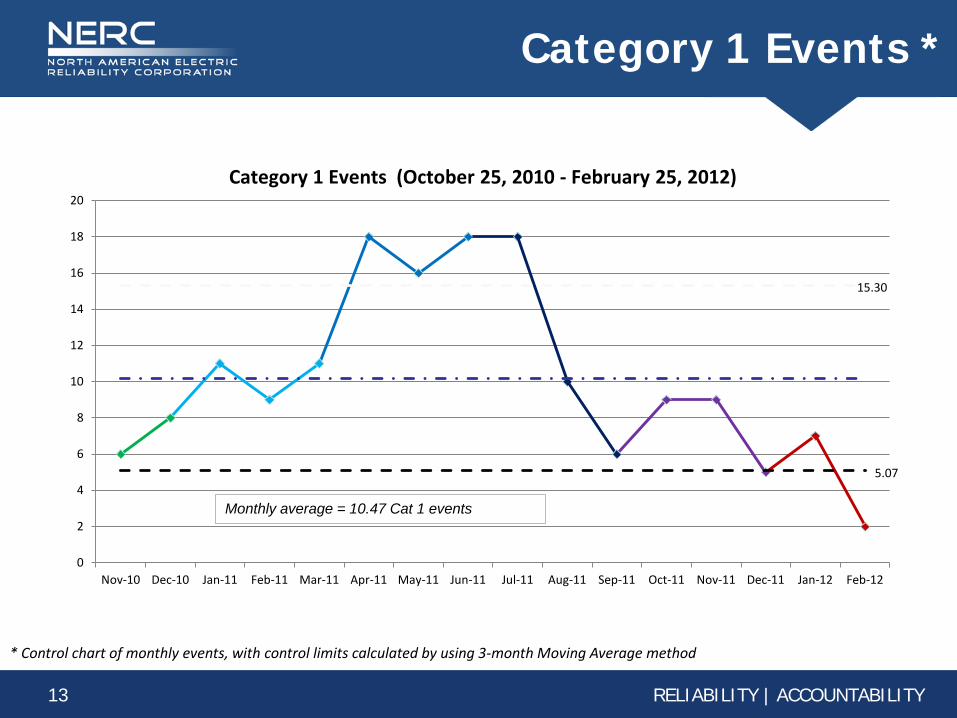
Category 1 Events *
Monthly average = 10.47 Cat 1 events
* Control chart of monthly events, with control limits calculated by using 3-month Moving Average method
15.30
5.07
0
2
4
6
8
10
12
14
16
18
20
Nov-10 Dec-10 Jan-11 Feb-11 Mar-11 Apr-11 May-11 Jun-11 Jul-11 Aug-11 Sep-11 Oct-11 Nov-11 Dec-11 Jan-12 Feb-12
Category 1 Events (October 25, 2010 - February 25, 2012)

14 RELIABILITY | ACCOUNTABILITY
Category 2 Events *
Monthly average = 4.13 Cat 2 events
* Control chart of monthly events, with control limits calculated by using 3-month Moving Average method
6.54
1.71
0
1
2
3
4
5
6
7
8
Nov-10 Dec-10 Jan-11 Feb-11 Mar-11 Apr-11 May-11 Jun-11 Jul-11 Aug-11 Sep-11 Oct-11 Nov-11 Dec-11 Jan-12 Feb-12
Category 2 (October 25, 2010 - February 25, 2012)

15 RELIABILITY | ACCOUNTABILITY
Event Analysis Report (EAR) Submittals
0
2
4
6
8
10
12
14
16
18
20
FRCC MRO NPCC RFC SERC SPP TRE WECC
5
10
17
4
15
2
20 20 93 EAR's submitted during the Field Trial (October 25, 2010 - February 25, 2012)
(This slide represents all data collected during the field trial)

16 RELIABILITY | ACCOUNTABILITY
Candidate Lessons Learned (by Region)
Lessons Learned Published
Lessons Learned by Region
0
5
10
15
20
25
30
FRCC MRO NPCC RFC SERC SPP TRE WECC
0
2
5
3
1 0
8
5
5 4
14
10
4
8
26 25
Lessons Learned Published Lessons Learned by Region
120 candidate lessons learned from 240 “Qualifying” events (October 25, 2010 - February 25, 2012) (includes 22 (down from original 68) submitted from Sunbelt Cold Snap event)
Note: NERC has published one additional Lesson Learned for a total of 25 published; seven lesson learned documents from Sunbelt Cold Snap event have been published to prepare for upcoming winter
(This slide represents all data collected during the field trial)

17 RELIABILITY | ACCOUNTABILITY
Appendix G/ Compliance Assessment
240 Qualified Events (October 25, 2010 – February 25, 2012)
0
10
20
30
40
50
60
FRCC MRO NPCC RFC SERC SPP TRE WECC FRCC MRO NPCC RFC SERC SPP TRE WECC
1 2 1
5 5
13 4
20
42 7
2
15
3
58
1
Cold Weather Appendix 'G' Appendix 'G' Self-reports
Self-Reports
Compliance Assessments (Appendix 'G')

18 RELIABILITY | ACCOUNTABILITY
Background Material
Industry Response to Event Analysis Field Trial

19 RELIABILITY | ACCOUNTABILITY
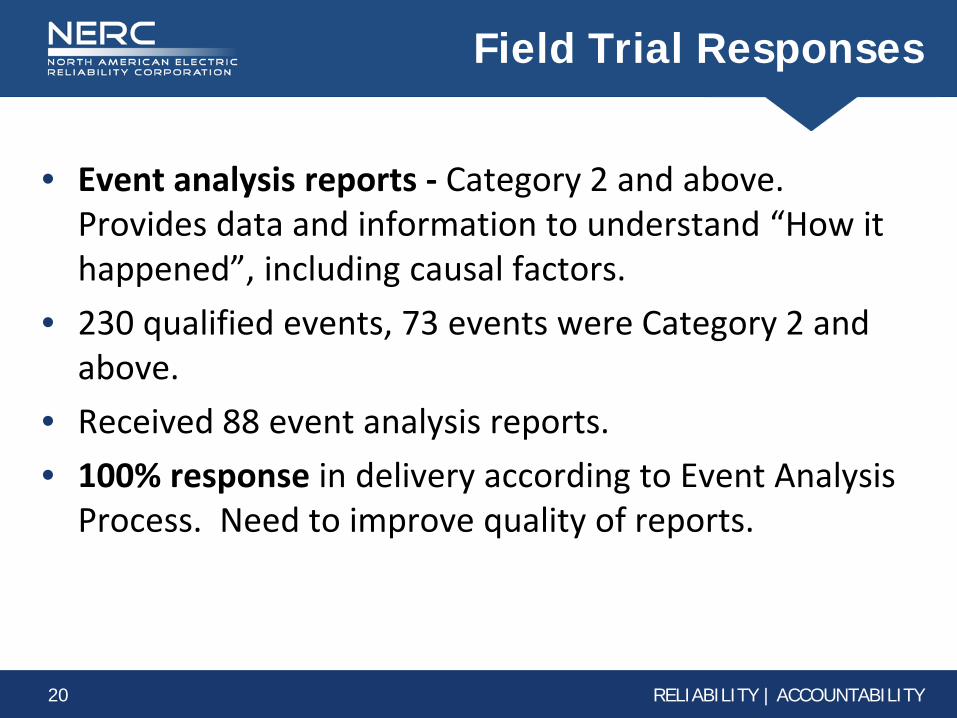
Field Trial Responses
• Brief Report - provides concise explanation of “what happened”. Submitted in Appendix A of the Events Analysis Process.
• For Category 0 and 1 events NERC and Regions review apparent and root causes, and then close to trend.
• 100% reporting according to the event analysis process with quality information to understand what happened.
20 RELIABILITY | ACCOUNTABILITY
• Event analysis reports - Category 2 and above. Provides data and information to understand “How it happened”, including causal factors.
• 230 qualified events, 73 events were Category 2 and above.
• Received 88 event analysis reports.
• 100% response in delivery according to Event Analysis Process. Need to improve quality of reports.
Field Trial Responses

21 RELIABILITY | ACCOUNTABILITY
• Lessons Learned - not every event on the BPS has a quality “Lesson” to share.
• 230 qualifying events, received 119 lessons learned “candidates”. 55 of these came from the Cold Snap event of 2011.
• Excluding the Cold Snap event, there were 64 other events which resulted in a lesson learned being submitted for consideration.
• Over 50 publications to date.
Field Trial Responses

22 RELIABILITY | ACCOUNTABILITY
Field Trial Responses
• Entity self assessment - Category 2 and above. Provides information on the entities self assessment after an event.
• 73 Category 2 and above events, NERC and regional entities received 112 assessments from entities. 62 were from the Cold Snap event.
• Excluding the Cold Snap event, NERC received an additional 50 submittals from other Category 2 and above events.
15 self reports were submitted

GMDTF And Operations Don Watkins Bonneville Power Administration Chairman – Geomagnetic Disturbance Task Force

2 RELIABILITY | ACCOUNTABILITY
Geomagnetic Disturbances
CME
Interaction with Earth’s Magnetic
Field
SpaceNear Earth’s
Surface
GICGrid
Model
MaxwellEq. & Earth
Cond. ModelSolarFlare

3 RELIABILITY | ACCOUNTABILITY
The History
•Class of rare risks outlined in High-Impact, Low-Frequency Event Risk to the North American Bulk Power System report – NERC & DOE (June 2010)
•HILF report recommended task force creation to evaluate and prioritize mitigation and restoration options
oIndustry oEquipment manufacturers and vendors orisk experts
•Four task forces created: GMD, spare equipment, cyber attack and severe impact resilience

4 RELIABILITY | ACCOUNTABILITY
The Report
•Approved by the NERC Board of Trustees and publicly released on February 29, 2012
•Identifies grid vulnerability from GMDs and highlights solutions to mitigate bulk power system
•Comprehensive view at multiple, complex issues: o Evaluated GMD effects on equipment and the
system o Identified the most likely failure mode and
possible outcomes o Outlined short- and long-term industry
recommendations

5 RELIABILITY | ACCOUNTABILITY
The Path to Resilience

6 RELIABILITY | ACCOUNTABILITY

7 RELIABILITY | ACCOUNTABILITY
Phase Four: Implement Solutions & Adjust System Procedures
Phase Three: Develop Integrated Solutions
Phase Two: Perform Technical and Programmatic Analysis
Phase One: Assess and Baseline the Risk
Constant Monitoring
syst
em re
silie
nce

8 RELIABILITY | ACCOUNTABILITY
GMD Notification Process
CME on the Sun
Magnetic Deviation detected by ACE
Balancing Authorities
Notified
NERC GOP and TOP
Functions Notified
Identification
Real-Time System
Operations Actions Taken
Mitigation
Time
NOAA and STDN
Issue Warnings
East Intercon
MISO RC West Intercon
WECC RC
Notification

9 RELIABILITY | ACCOUNTABILITY
This Warrants your attention!
• With the advent of electric lines we discovered Goemagnetically Induced Currents (GIC). – The 1921 Solar Storm -. US telegraph service
virtually halted on lines from the Atlantic Coast to the Mississippi and northwestern United States. Some cable and telegraph lines to Alaska .
– Reported to have “blown out fuses, injured electrical apparatus and done other things which had never been caused by any ground and ocean currents known in the past.”

10 RELIABILITY | ACCOUNTABILITY
This Warrants your attention!
• 1989 Québec Blackout – During the GMD, seven Static Var Compensators
(SVCs) tripped within 59 seconds of each other, leading to voltage collapse of the Quebec system 25 seconds later.
– was caused by the effects of harmonics resulting from half cycle saturation of power transformers. Unanticipated tripping of multiple SVCs and corresponding system separation were the primary causes of the issues that were experienced during the GMD event. Equipment was damaged as the result of temporary overvoltage caused by load shedding

11 RELIABILITY | ACCOUNTABILITY
The Conclusions
• Highest likelihood of GMD is loss of reactive power
Major Conclusion
• Challenge will be to maintain supply of reactive power
Major Conclusion
• Some transformer types may be damaged or lose remaining life
Major Conclusion

12 RELIABILITY | ACCOUNTABILITY
NERC and Industry Actions
Update NERC Alert
on GMD
Training For SystemOp on GMD
Introduce GMD into IC Models
Enhance GMD storm
models
Near-Term Actions (1 to 3 Months)
Mid-Term (6 to 12 Months)
Long-Term On Going
Time
Workshop

13 RELIABILITY | ACCOUNTABILITY
Short-Term Actions - NERC
• Update operating procedures
Existing: http://www.nerc.com/fileUploads/File/Events%20Analysis/A-2011-05-10-
01_GMD_FINAL.pdf
• Provide planning and operator tools
• Develop education and research
• Review the need for enhanced NERC Reliability Standards

14 RELIABILITY | ACCOUNTABILITY
Long-Term Actions - Industry
• Develop additional open source tools and models to develop GMD mitigation strategies
• Assess various potential equipment vulnerabilities
• Improve tools and procedures for System Operators to manage GMD impacts
• Education and information exchange between researchers and industry
• Develop enhanced NERC Reliability Standards as needed
• Improve information Interfaces with other players

15 RELIABILITY | ACCOUNTABILITY
Finishing…!
• Issues? • Questions? • Ideas looking forward?
Thanks!

Manual Time Error Correction Issues Discussion
Terry Bilke
NERC Resources Subcommittee Member March 2012

Agenda (OC’s December Request)
• Reasons for fast time • Reliability risk of TECs • Compliance Issues

Reasons for Fast Time
• Tariffs that treat under-generation more severely than over-generation
• Operator perception that negative Inadvertent Interchange balances are “worse” than positive balances
• Changes to Inadvertent Interchange Payback processes
• Unaccounted for Inadvertent Interchange

Reasons for Fast Time
Data through September 2011

Reliability Risk
• Frequency – 0.02 Hz offset takes 4% of frequency margin
to the prevailing first step of UFLS – Time-weighted margin is 0.6% of frequency
margin (TECs occur 15% of hours) – Takes about 50 MW from 8000MW margin
• Flow impact of an improper TEC is on the order of metering error (fraction of a MW per tie line)

Compliance Issues
• TECs are a commercial service with little reliability impact
• No rational value in over-enforcing TECs – Discourages Time Monitors from performing a
voluntary service – Fixation on TEC compliance could distract
BAs from higher priority tasks • Need to bring the standard filed in 2007 to
conclusion

If TECs Become an Issue Again
• Look for simple solutions based on what works or has worked
• Wider window (+/- 30 seconds) • Smaller offset (+/- 0.01Hz similar to Europe) • Reinstate the payback process NERC
followed under A1/A2 (unilateral payback of 20% of bias when Inadvertent balance is “in phase” with Time Error