Embed Size (px)
Citation preview
© 2013 Eaton. All rights reserved.
Eaton Investor Update September 2013
2 © 2013 Eaton. All rights reserved.
Forward-looking statements and non-GAAP financial information
The information provided today will include forward-looking statements relating to our goals and estimates for future years, including statements about expected sales, acquisition synergies, operating earnings per share, cash flow, segment margins, our worldwide markets, our anticipated effective income tax rate, the tax treatment of our dividends and others. These statements should be used with caution and are subject to various risks and uncertainties, many of which are outside the company’s control. The following factors could cause actual results to differ materially from those in the forward-looking statements: unanticipated changes in the markets for the company’s business segments; unanticipated downturns in business relationships with customers or their purchases from us; competitive pressures on sales and pricing; increases in the cost of material and other production costs, or unexpected costs that cannot be recouped in product pricing; the introduction of competing technologies; unexpected technical or marketing difficulties; unexpected claims, charges, litigation or dispute resolutions; the impact of acquisitions and divestitures; unanticipated difficulties integrating acquisitions or realizing expected synergies from the Cooper acquisition; new laws and governmental regulations; interest rate changes; changes in currency exchange rates; stock market fluctuations; and unanticipated deterioration of economic and financial conditions in the United States and around the world. We do not assume any obligation to update these forward-looking statements. This presentation includes certain non-GAAP measures as defined by SEC rules. A reconciliation of those measures to the most directly comparable GAAP equivalent is provided in the investor relations section of our website at www.eaton.com and is contained in your packet.
3 © 2013 Eaton. All rights reserved.
Eaton – A Power Management Company
• A balanced power management company • Cooper acquisition transforms the Electrical
Sector
• Creating consistent and profitable growth across our Industrial Sector
• Summary and guidance
4 © 2013 Eaton. All rights reserved.
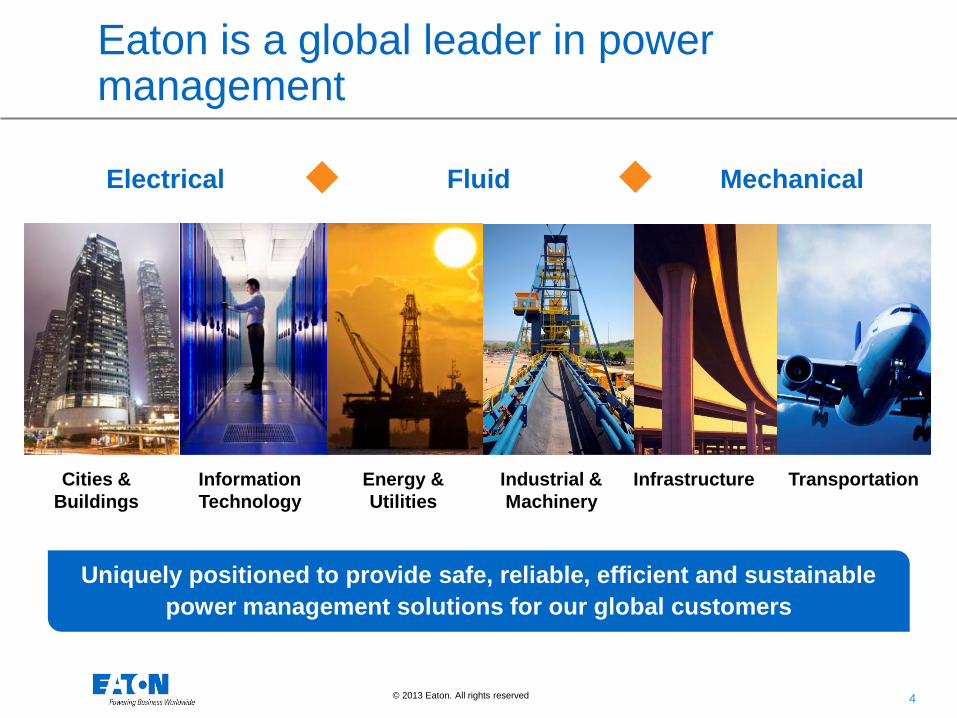
Eaton is a global leader in power management
Uniquely positioned to provide safe, reliable, efficient and sustainable power management solutions for our global customers
Electrical Fluid Mechanical
Cities & Buildings
Industrial & Machinery
Information Technology
Energy & Utilities
Transportation Infrastructure
5 © 2013 Eaton. All rights reserved.
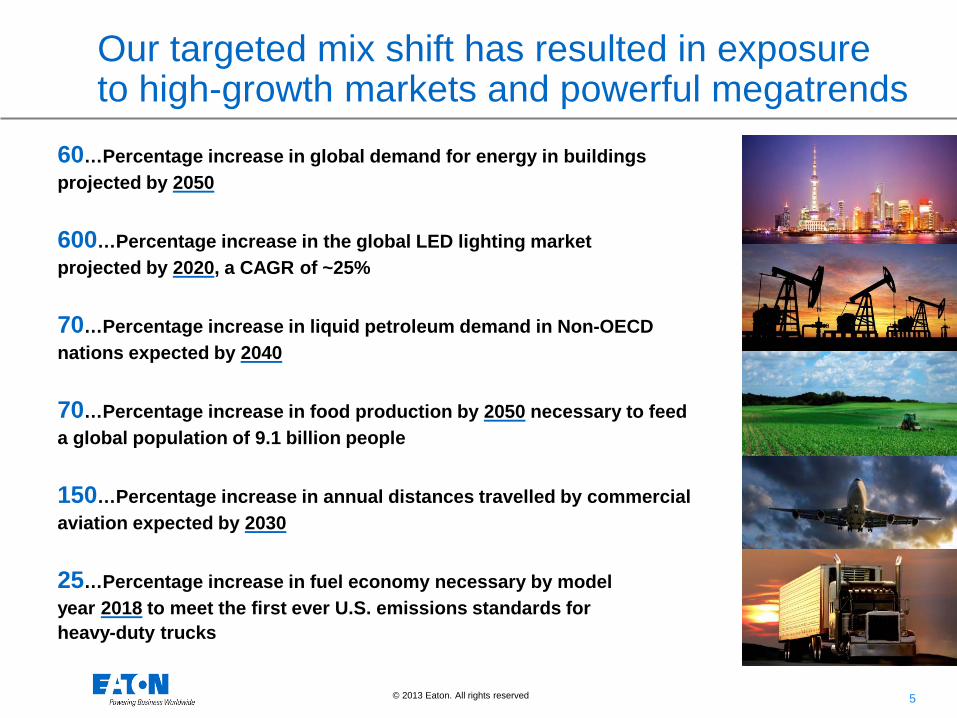
Our targeted mix shift has resulted in exposure to high-growth markets and powerful megatrends
60…Percentage increase in global demand for energy in buildings projected by 2050
600…Percentage increase in the global LED lighting market projected by 2020, a CAGR of ~25%
70…Percentage increase in food production by 2050 necessary to feed a global population of 9.1 billion people
150…Percentage increase in annual distances travelled by commercial aviation expected by 2030
25…Percentage increase in fuel economy necessary by model year 2018 to meet the first ever U.S. emissions standards for heavy-duty trucks
70…Percentage increase in liquid petroleum demand in Non-OECD nations expected by 2040
6 © 2013 Eaton. All rights reserved.
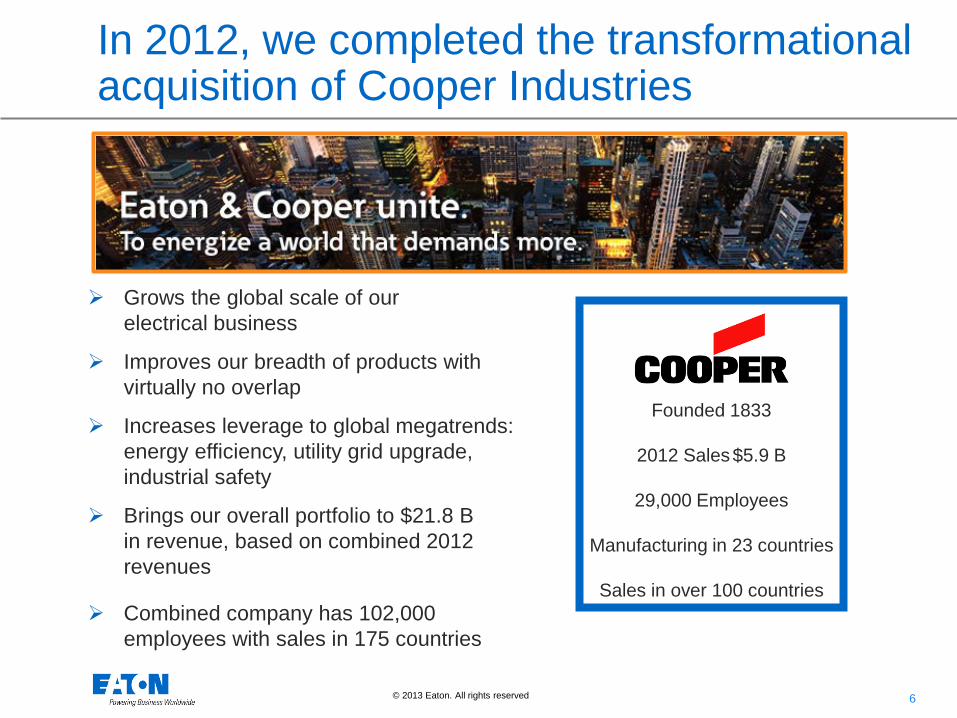
In 2012, we completed the transformational acquisition of Cooper Industries
Grows the global scale of our electrical business
Improves our breadth of products with virtually no overlap
Increases leverage to global megatrends: energy efficiency, utility grid upgrade, industrial safety
Brings our overall portfolio to $21.8 B in revenue, based on combined 2012 revenues
Combined company has 102,000 employees with sales in 175 countries
Founded 1833
2012 Sales $5.9 B
29,000 Employees
Manufacturing in 23 countries
Sales in over 100 countries
7 © 2013 Eaton. All rights reserved.
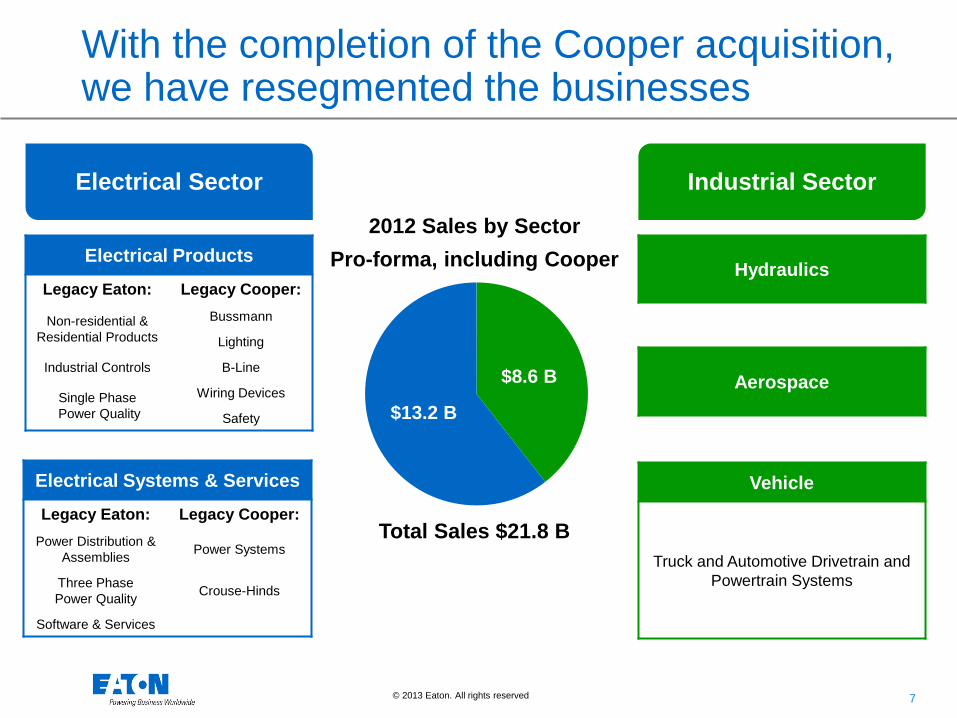
$8.6 B
$13.2 B
With the completion of the Cooper acquisition, we have resegmented the businesses
Industrial Sector Electrical Sector
2012 Sales by Sector Pro-forma, including Cooper Electrical Products
Legacy Eaton: Legacy Cooper:
Non-residential & Residential Products
Bussmann
Lighting
Industrial Controls B-Line
Single Phase Power Quality
Wiring Devices
Safety
Electrical Systems & Services
Legacy Eaton: Legacy Cooper: Power Distribution &
Assemblies Power Systems
Three Phase Power Quality Crouse-Hinds
Software & Services
Hydraulics
Aerospace
Total Sales $21.8 B
Vehicle
Truck and Automotive Drivetrain and Powertrain Systems
8 © 2013 Eaton. All rights reserved.
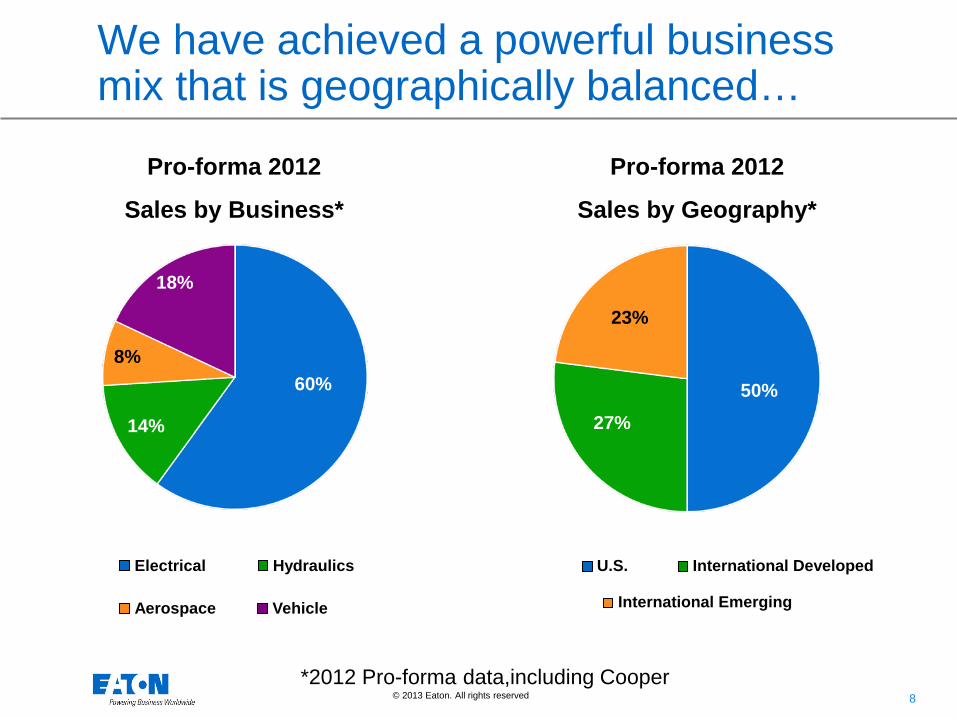
60%
14%
8%
18%
We have achieved a powerful business mix that is geographically balanced…
Pro-forma 2012
Sales by Business*
Electrical Hydraulics
Aerospace Vehicle
International Developed U.S.
International Emerging
50% 27%
23%
Pro-forma 2012
Sales by Geography*
*2012 Pro-forma data,including Cooper
9 © 2013 Eaton. All rights reserved.
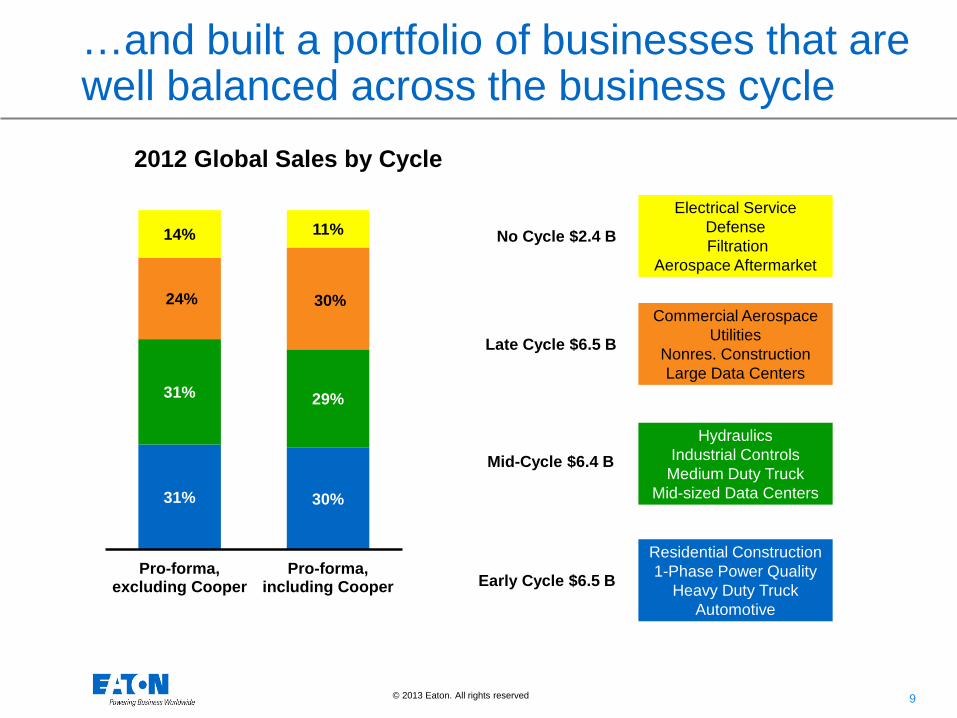
…and built a portfolio of businesses that are well balanced across the business cycle
Electrical Service Defense Filtration
Aerospace Aftermarket
Commercial Aerospace Utilities
Nonres. Construction Large Data Centers
Hydraulics Industrial Controls
Medium Duty Truck Mid-sized Data Centers
Residential Construction 1-Phase Power Quality
Heavy Duty Truck Automotive
Early Cycle $6.5 B
Mid-Cycle $6.4 B
Late Cycle $6.5 B
No Cycle $2.4 B
2012 Global Sales by Cycle
31% 30%
31% 29%
24% 30%
14% 11%
Pro-forma,excluding Cooper
Pro-forma,including Cooper
10 © 2013 Eaton. All rights reserved.
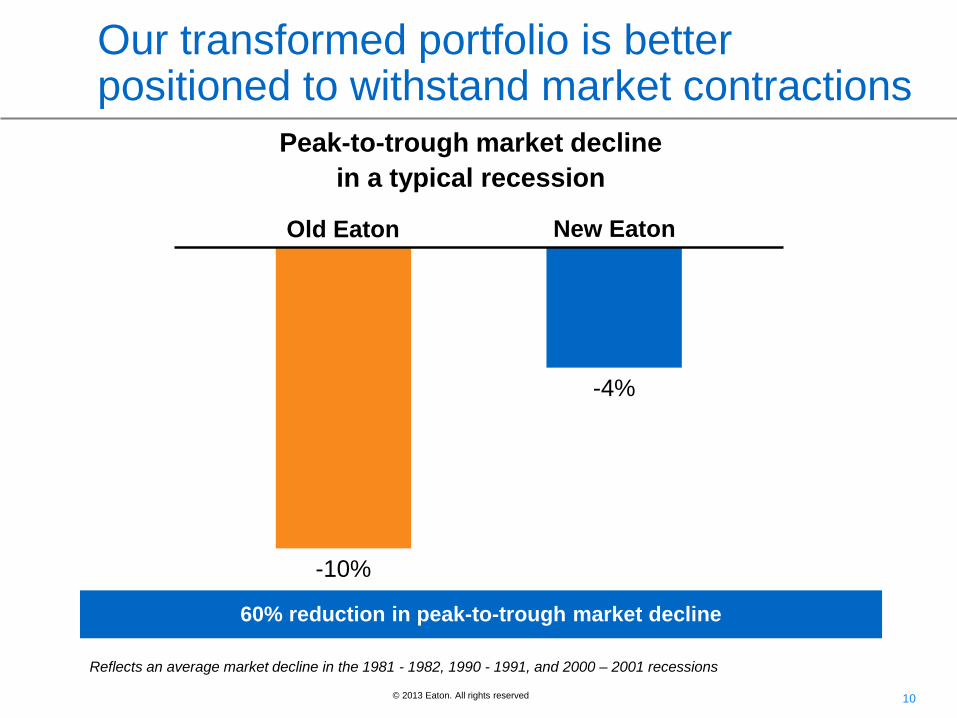
Our transformed portfolio is better positioned to withstand market contractions
60% reduction in peak-to-trough market decline
-10%
-4%
Old Eaton New Eaton
Peak-to-trough market decline in a typical recession
Reflects an average market decline in the 1981 - 1982, 1990 - 1991, and 2000 – 2001 recessions
11 © 2013 Eaton. All rights reserved.
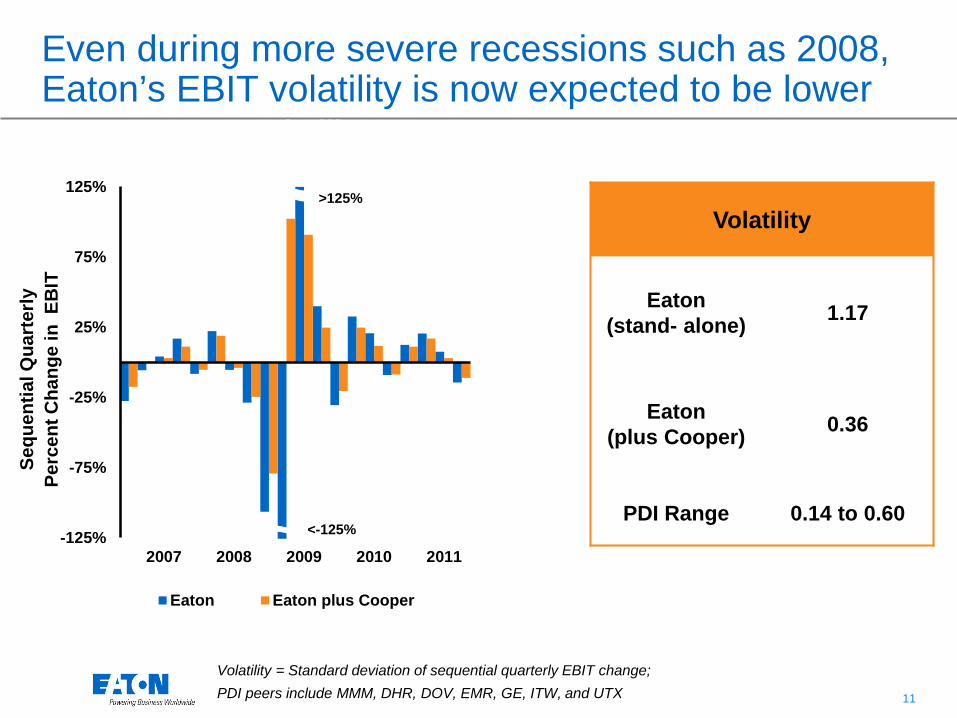
-125%
-75%
-25%
25%
75%
125%
2007 2008 2009 2010 2011
EBIT Volatility 2007 - 2011
Eaton Eaton plus Cooper
Even during more severe recessions such as 2008, Eaton’s EBIT volatility is now expected to be lower
Sequ
entia
l Qua
rter
ly
Perc
ent C
hang
e in
EB
IT
>125%
<-125%
Volatility
Eaton (stand- alone) 1.17
Eaton (plus Cooper) 0.36
PDI Range 0.14 to 0.60
Volatility = Standard deviation of sequential quarterly EBIT change; PDI peers include MMM, DHR, DOV, EMR, GE, ITW, and UTX
12 © 2013 Eaton. All rights reserved.
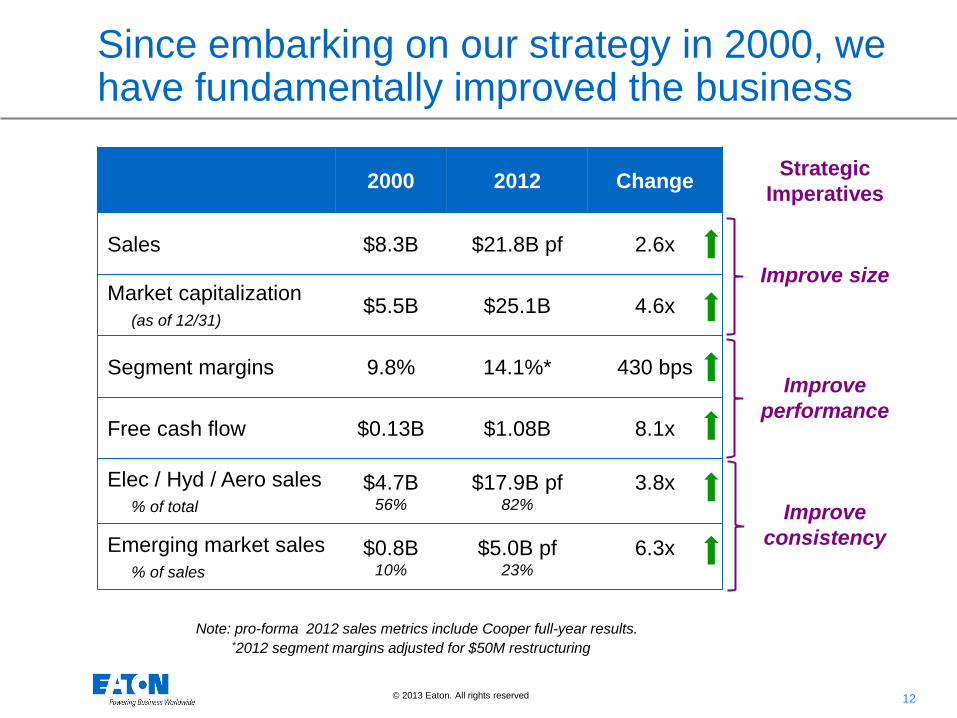
Since embarking on our strategy in 2000, we have fundamentally improved the business
2000 2012 Change Strategic Imperatives
Sales $8.3B $21.8B pf 2.6x Improve size
Market capitalization (as of 12/31)
$5.5B $25.1B 4.6x
Segment margins 9.8% 14.1%* 430 bps Improve
performance Free cash flow $0.13B $1.08B 8.1x
Elec / Hyd / Aero sales % of total
$4.7B 56%
$17.9B pf 82%
3.8x a Improve
consistency Emerging market sales % of sales
$0.8B 10%
$5.0B pf 23%
6.3x
Note: pro-forma 2012 sales metrics include Cooper full-year results. *2012 segment margins adjusted for $50M restructuring
13 © 2013 Eaton. All rights reserved.
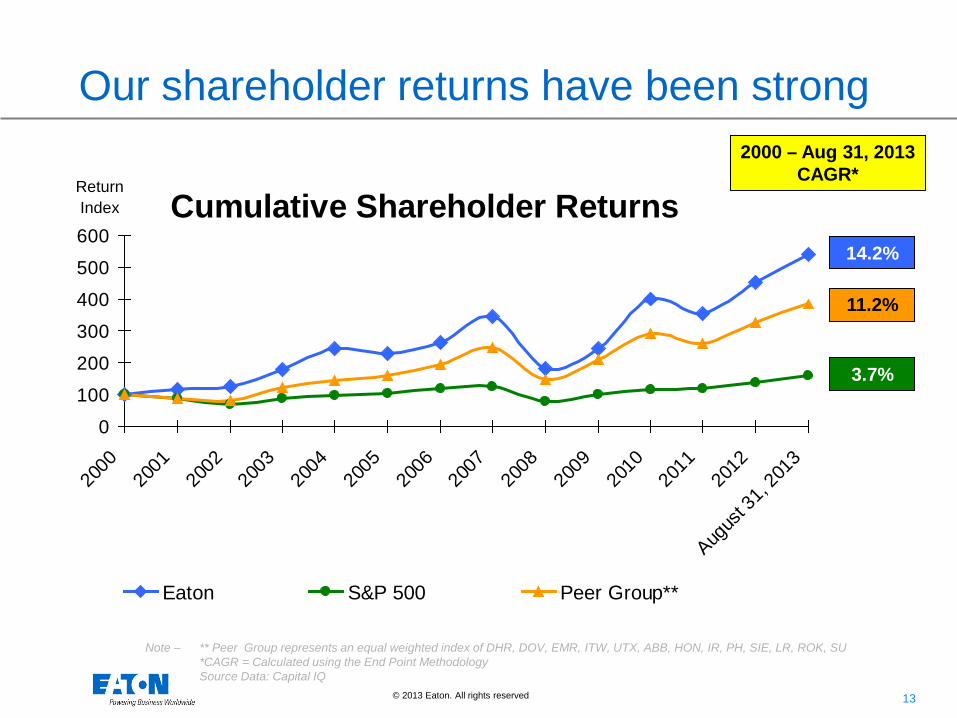
Cumulative Shareholder Returns
0
100
200
300
400
500
600
2000
2001
2002
2003
2004
2005
2006
2007
2008
2009
2010
2011
2012
Augus
t 31,
2013
Eaton S&P 500 Peer Group**
2000 – Aug 31, 2013 CAGR*
Return Index
14.2%
11.2%
3.7%
Note – ** Peer Group represents an equal weighted index of DHR, DOV, EMR, ITW, UTX, ABB, HON, IR, PH, SIE, LR, ROK, SU *CAGR = Calculated using the End Point Methodology Source Data: Capital IQ
Our shareholder returns have been strong
14 © 2013 Eaton. All rights reserved.
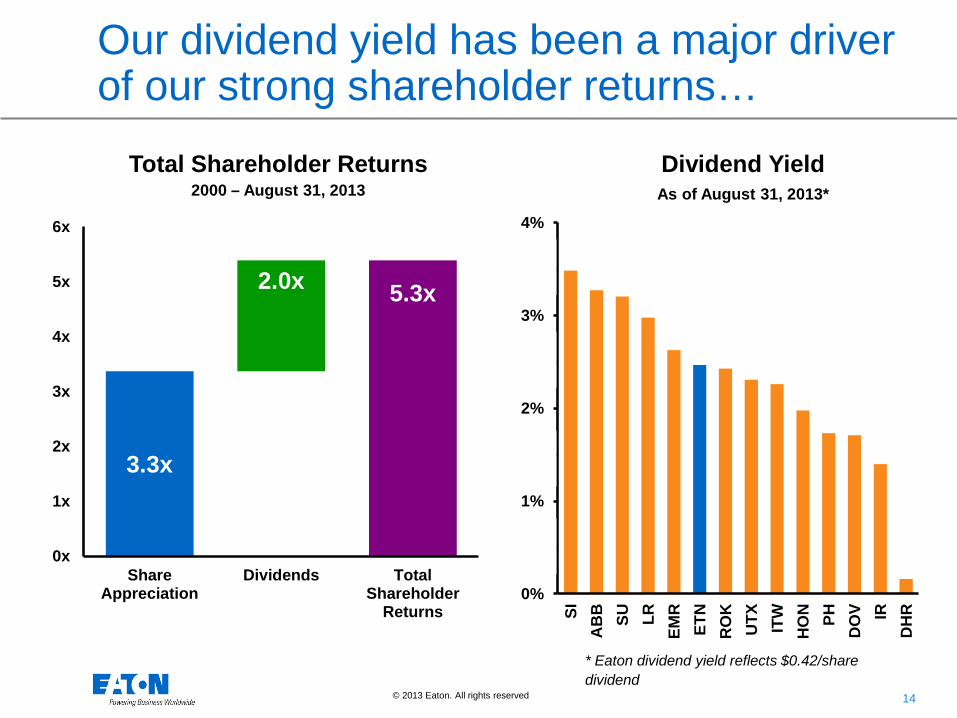
Our dividend yield has been a major driver of our strong shareholder returns…
Total Shareholder Returns 2000 – August 31, 2013
3.3x
5.3x 2.0x
0x
1x
2x
3x
4x
5x
6x
ShareAppreciation
Dividends TotalShareholder
Returns0%
1%
1%
2%
2%
3%
3%
4%
4%
SIA
BB SU LR
EMR
ETN
RO
KU
TX ITW
HO
N PHD
OV IR
DH
R
Dividend Yield As of August 31, 2013*
* Eaton dividend yield reflects $0.42/share dividend
15 © 2013 Eaton. All rights reserved.
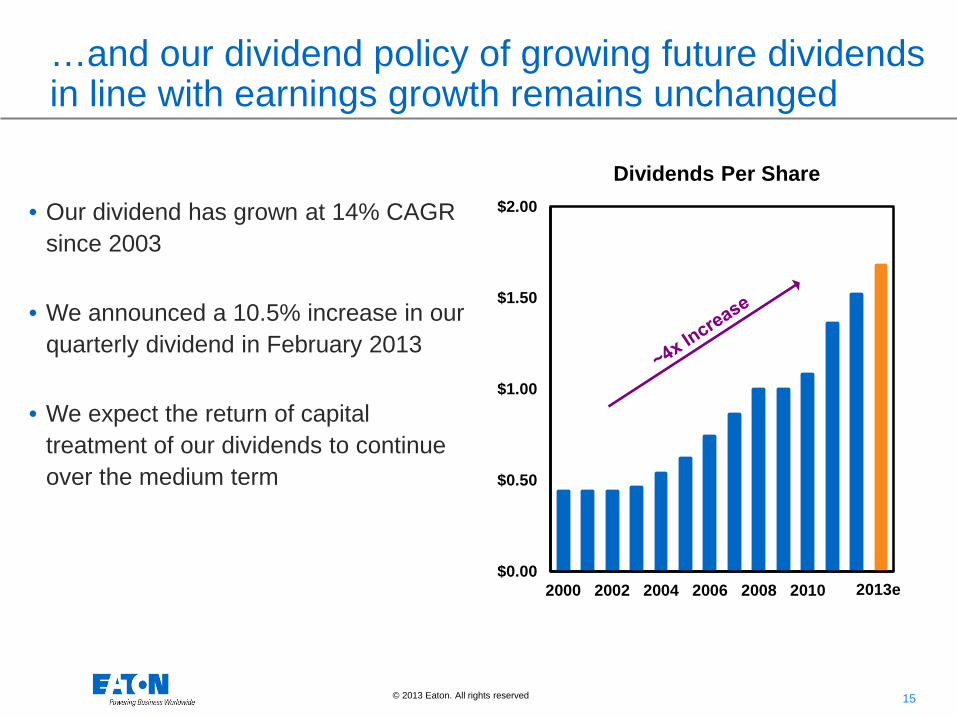
…and our dividend policy of growing future dividends in line with earnings growth remains unchanged
$0.00
$0.50
$1.00
$1.50
$2.00
2000 2002 2004 2006 2008 2010 2012
Dividends Per Share
2013e
• Our dividend has grown at 14% CAGR since 2003
• We announced a 10.5% increase in our quarterly dividend in February 2013
• We expect the return of capital treatment of our dividends to continue over the medium term
16 © 2013 Eaton. All rights reserved.
Eaton – A Power Management Company
• A balanced power management company • Cooper acquisition transforms the Electrical
Sector
• Creating consistent and profitable growth across our Industrial Sector
• Summary and guidance
17 © 2013 Eaton. All rights reserved.
The acquisition of Cooper is transformational for our business
• Largest acquisition in Eaton’s 102-year history
• Broad set of complementary electrical products and solutions • Significant synergies with little overlap
• Expansion across the entire power system • Upstream into power solutions encompassing primary and
secondary distribution, grid automation and smart grid • Downstream into lighting, lighting controls and wiring devices
* Cooper 2012 results on a stand-alone basis
18 © 2013 Eaton. All rights reserved.
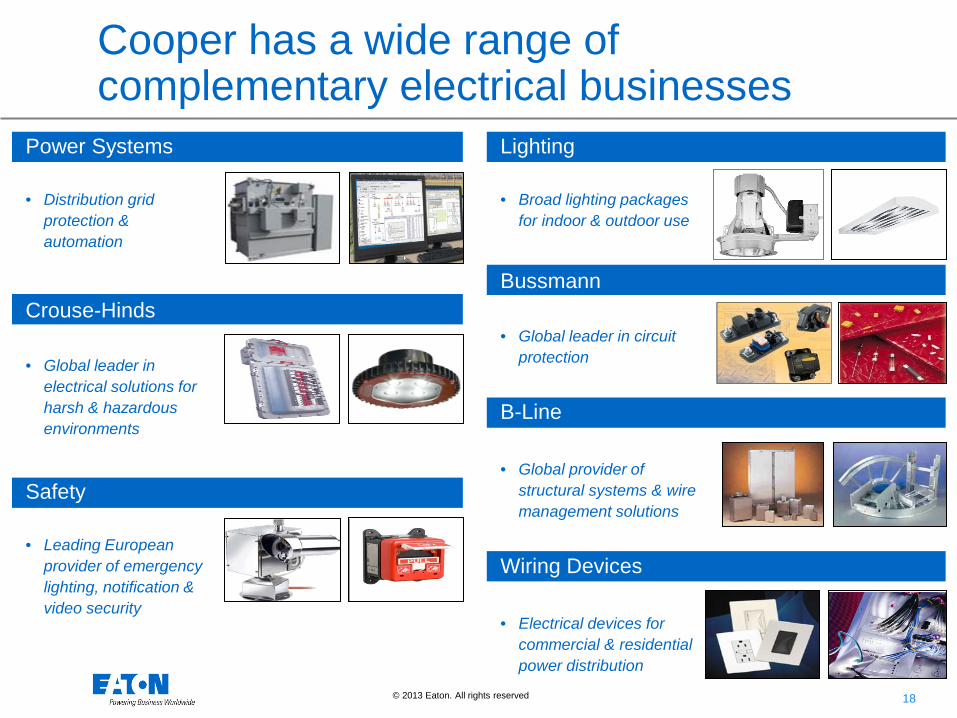
Cooper has a wide range of complementary electrical businesses
Power Systems
• Distribution grid protection & automation
Crouse-Hinds • Global leader in
electrical solutions for harsh & hazardous environments
Safety
• Leading European provider of emergency lighting, notification & video security
Lighting
• Broad lighting packages for indoor & outdoor use
Bussmann
• Global leader in circuit protection
B-Line • Global provider of
structural systems & wire management solutions
Wiring Devices • Electrical devices for
commercial & residential power distribution
19 © 2013 Eaton. All rights reserved.
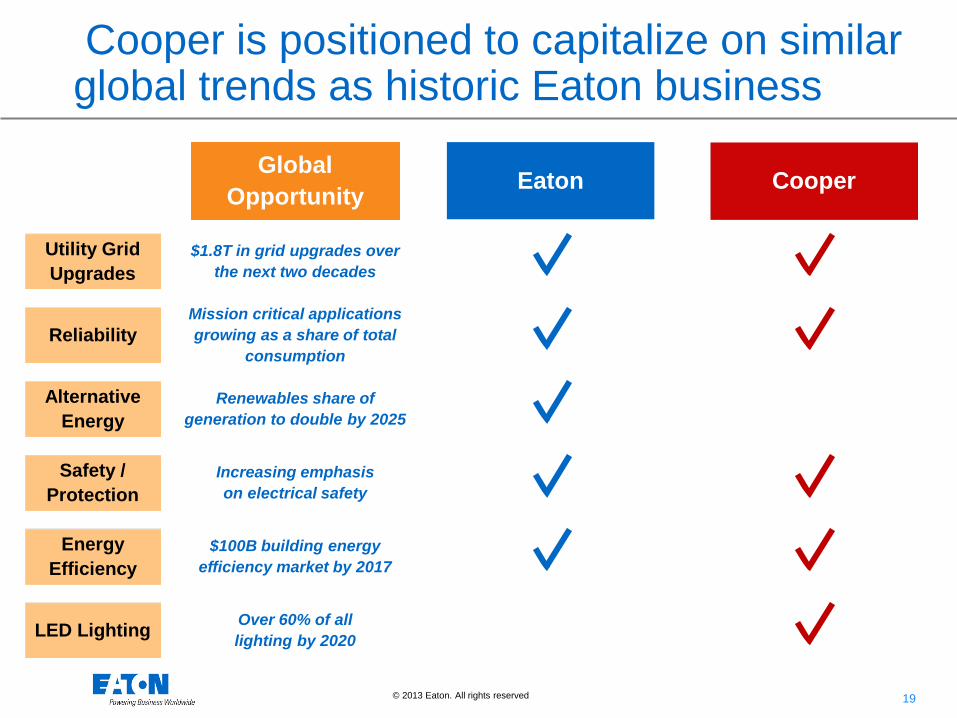
Cooper is positioned to capitalize on similar global trends as historic Eaton business
Utility Grid Upgrades
LED Lighting
Alternative Energy
Safety / Protection
Energy Efficiency
$1.8T in grid upgrades over the next two decades
Over 60% of all lighting by 2020
Renewables share of generation to double by 2025
Increasing emphasis on electrical safety
$100B building energy efficiency market by 2017
Cooper
Reliability Mission critical applications growing as a share of total
consumption
Global Opportunity Eaton
20 © 2013 Eaton. All rights reserved.
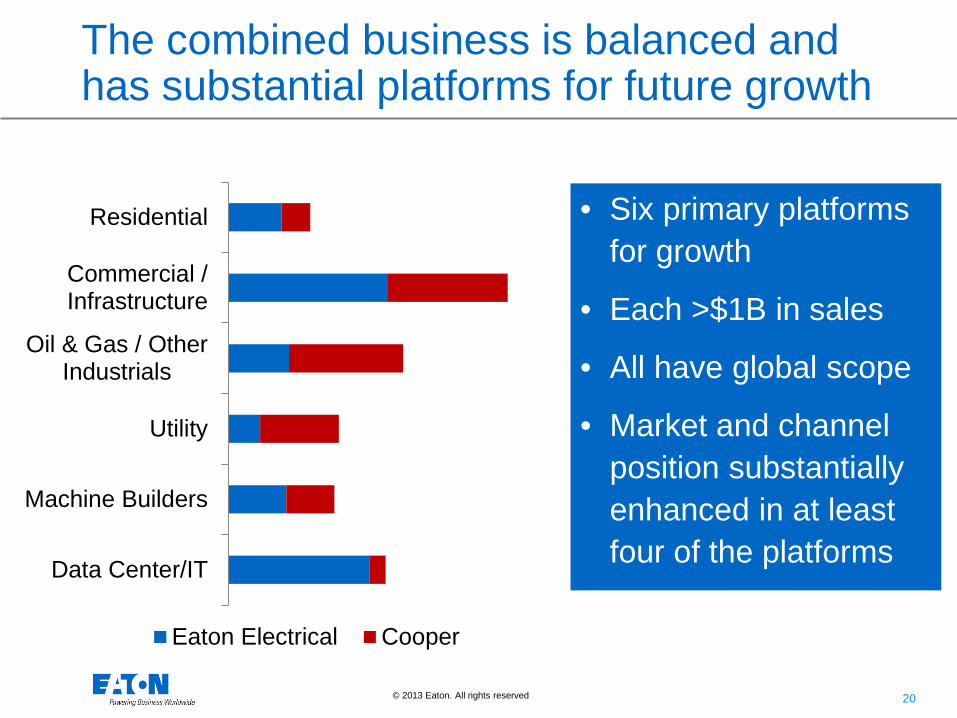
The combined business is balanced and has substantial platforms for future growth
Data Center/IT
Machine Builders
Utility
Oil & Gas / OtherIndustrials
Commercial /Infrastructure
Residential
Eaton Electrical Cooper
• Six primary platforms for growth
• Each >$1B in sales
• All have global scope
• Market and channel position substantially enhanced in at least four of the platforms
21 © 2013 Eaton. All rights reserved.
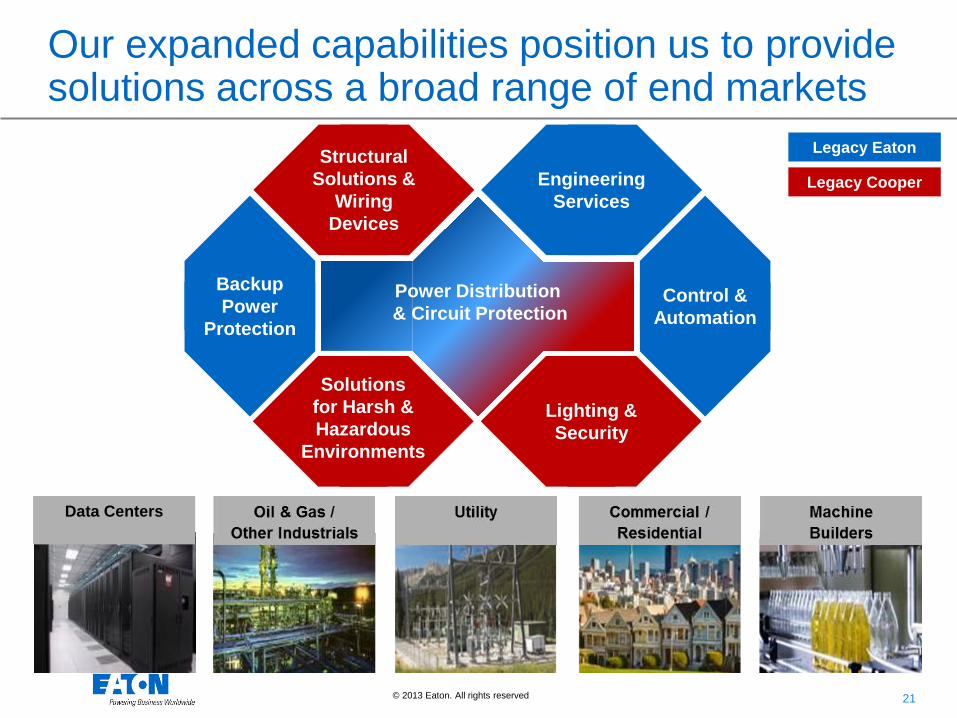
Our expanded capabilities position us to provide solutions across a broad range of end markets
Legacy Eaton
Legacy Cooper
Power Distribution & Circuit Protection
Backup Power
Protection
Control & Automation
Structural Solutions &
Wiring Devices
Engineering Services
Solutions for Harsh & Hazardous
Environments
Lighting & Security
Power Distribution & Circuit Protection
Data Centers
22 © 2013 Eaton. All rights reserved.
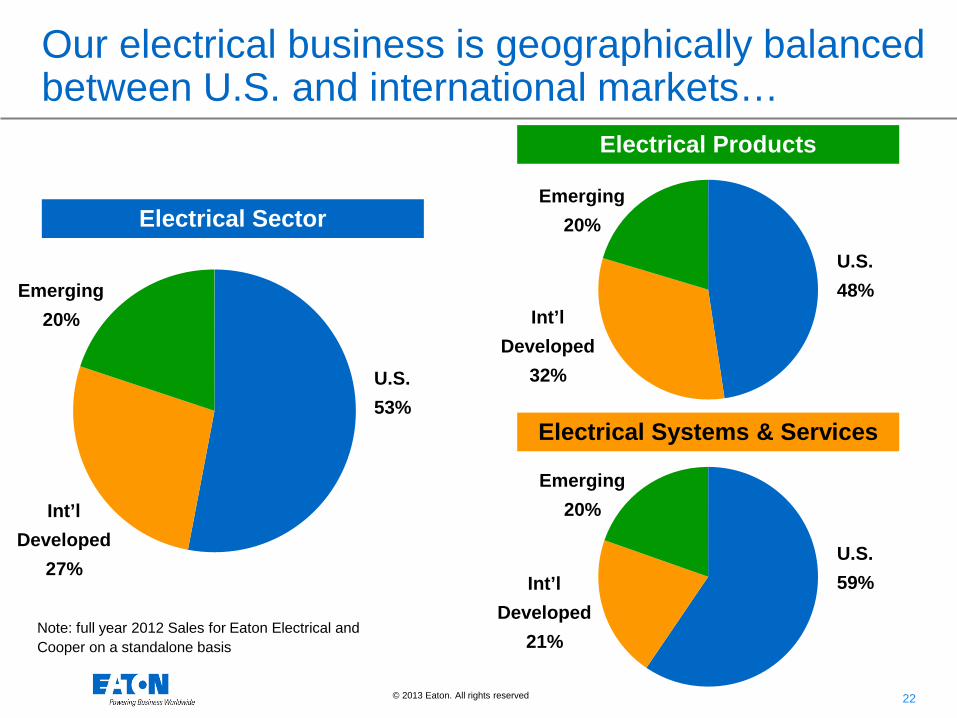
Our electrical business is geographically balanced between U.S. and international markets…
Emerging 20%
Emerging 20%
Int’l Developed
32%
Int’l Developed
21%
U.S. 48%
U.S. 59%
Emerging 20%
Int’l Developed
27%
U.S. 53%
Electrical Sector
Note: full year 2012 Sales for Eaton Electrical and Cooper on a standalone basis
Electrical Products
Electrical Systems & Services
23 © 2013 Eaton. All rights reserved.
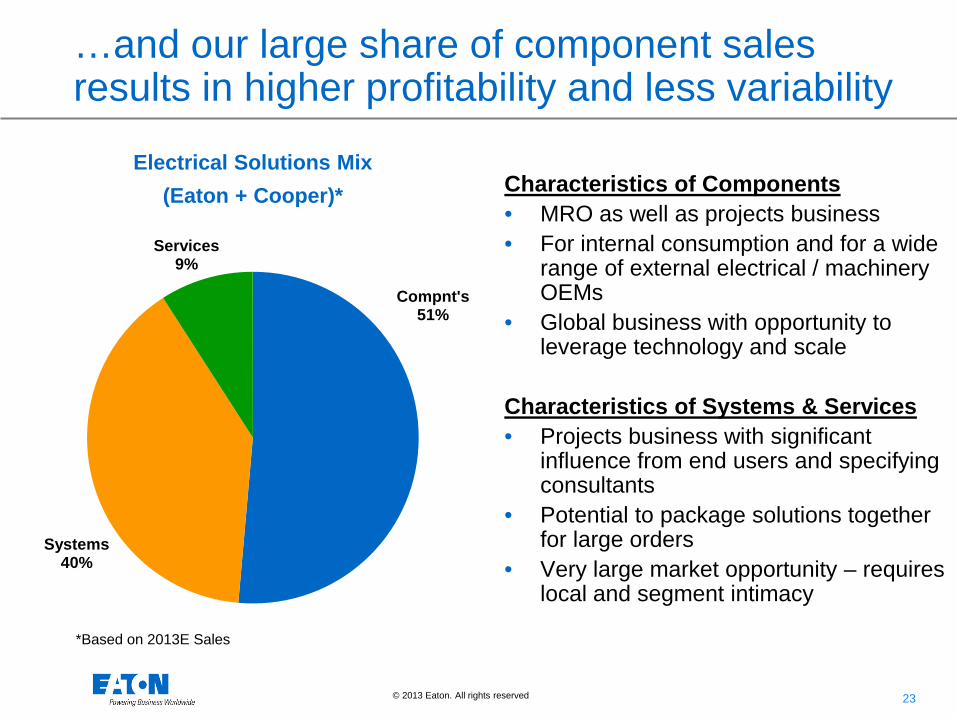
…and our large share of component sales results in higher profitability and less variability
Electrical Solutions Mix (Eaton + Cooper)*
Compnt's 51%
Systems 40%
Services 9%
Characteristics of Components • MRO as well as projects business • For internal consumption and for a wide
range of external electrical / machinery OEMs
• Global business with opportunity to leverage technology and scale
Characteristics of Systems & Services • Projects business with significant
influence from end users and specifying consultants
• Potential to package solutions together for large orders
• Very large market opportunity – requires local and segment intimacy
*Based on 2013E Sales
24 © 2013 Eaton. All rights reserved.
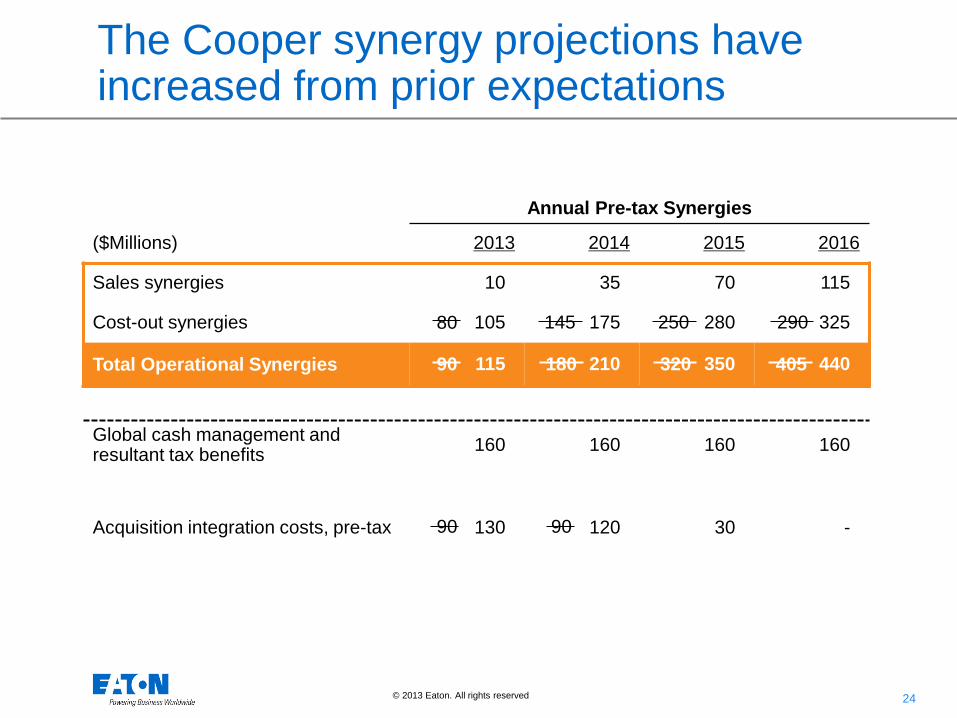
250
Annual Pre-tax Synergies
($Millions) 2013 2014 2015 2016
Sales synergies 10 35 70 115
Cost-out synergies 105 175 280 325
Total Operational Synergies 115 210 350 440
Global cash management and resultant tax benefits 160 160 160 160
Acquisition integration costs, pre-tax 130 120 30 -
80
90 180 405 320
90 90
290 145 250
The Cooper synergy projections have increased from prior expectations
25 © 2013 Eaton. All rights reserved.
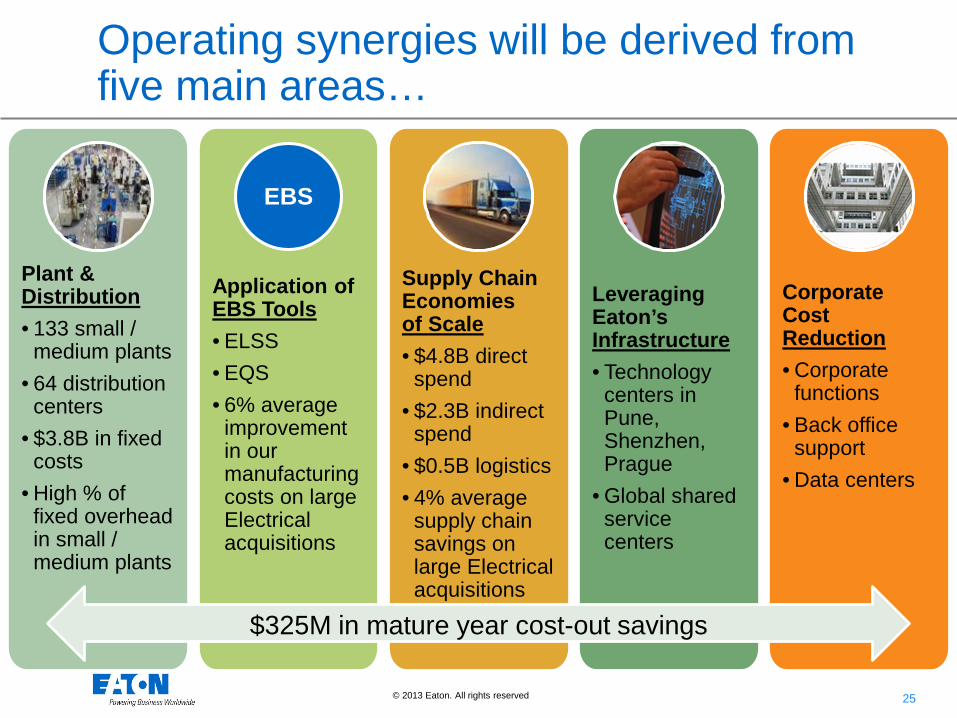
Corporate Cost Reduction • Corporate
functions • Back office
support • Data centers
Plant & Distribution • 133 small /
medium plants • 64 distribution
centers • $3.8B in fixed
costs • High % of
fixed overhead in small / medium plants
Application of EBS Tools • ELSS • EQS • 6% average
improvement in our manufacturing costs on large Electrical acquisitions
Supply Chain Economies of Scale • $4.8B direct
spend • $2.3B indirect
spend • $0.5B logistics • 4% average
supply chain savings on large Electrical acquisitions
Leveraging Eaton’s Infrastructure • Technology
centers in Pune, Shenzhen, Prague
• Global shared service centers
$325M in mature year cost-out savings
Operating synergies will be derived from five main areas…
EBS
26 © 2013 Eaton. All rights reserved.
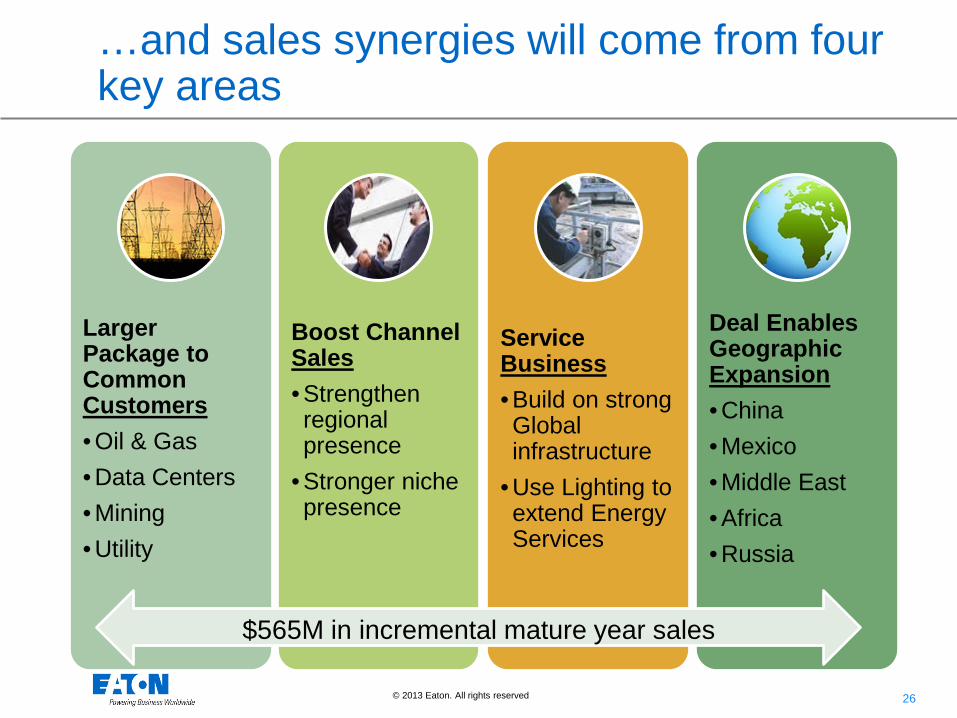
Larger Package to Common Customers • Oil & Gas • Data Centers • Mining • Utility
Boost Channel Sales • Strengthen regional presence
• Stronger niche presence
Service Business • Build on strong Global infrastructure
• Use Lighting to extend Energy Services
Deal Enables Geographic Expansion • China • Mexico • Middle East • Africa • Russia
$565M in incremental mature year sales
…and sales synergies will come from four key areas
27 © 2013 Eaton. All rights reserved.
Eaton – A Power Management Company
• A balanced power management company • Cooper acquisition transforms the Electrical
Sector
• Creating consistent and profitable growth across our Industrial Sector
• Summary and guidance
28 © 2013 Eaton. All rights reserved.
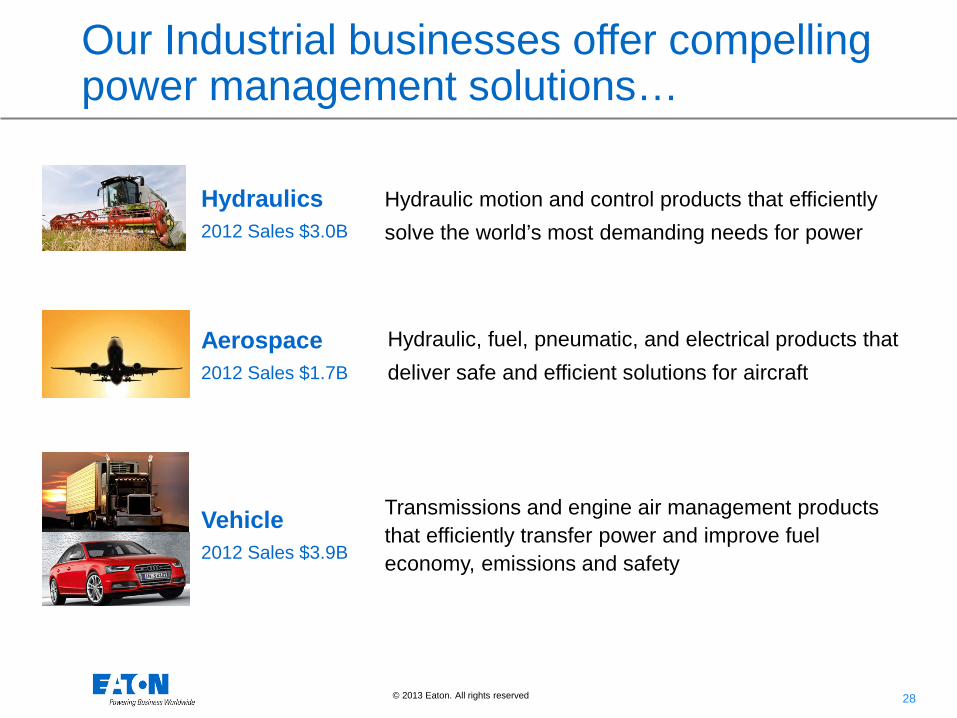
Hydraulic, fuel, pneumatic, and electrical products that deliver safe and efficient solutions for aircraft
Hydraulic motion and control products that efficiently solve the world’s most demanding needs for power
Transmissions and engine air management products that efficiently transfer power and improve fuel economy, emissions and safety
Our Industrial businesses offer compelling power management solutions…
Aerospace 2012 Sales $1.7B
Hydraulics 2012 Sales $3.0B
Vehicle 2012 Sales $3.9B
29 © 2013 Eaton. All rights reserved.
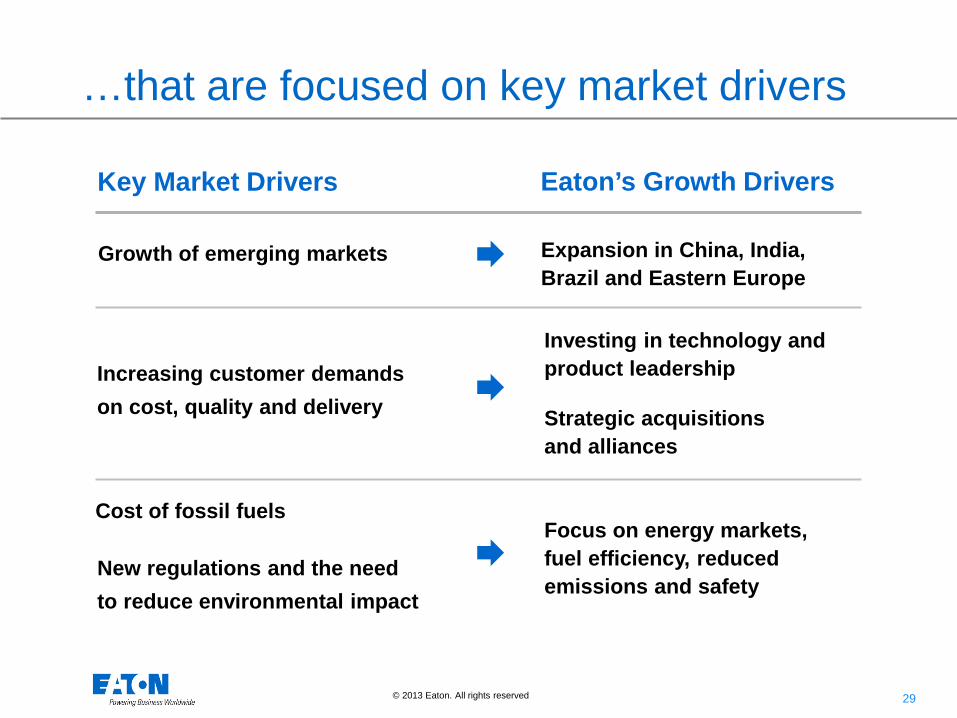
…that are focused on key market drivers
Key Market Drivers Eaton’s Growth Drivers
Growth of emerging markets
Increasing customer demands on cost, quality and delivery
New regulations and the need to reduce environmental impact
Expansion in China, India, Brazil and Eastern Europe
Investing in technology and product leadership
Strategic acquisitions and alliances
Focus on energy markets, fuel efficiency, reduced emissions and safety
Cost of fossil fuels
30 © 2013 Eaton. All rights reserved.
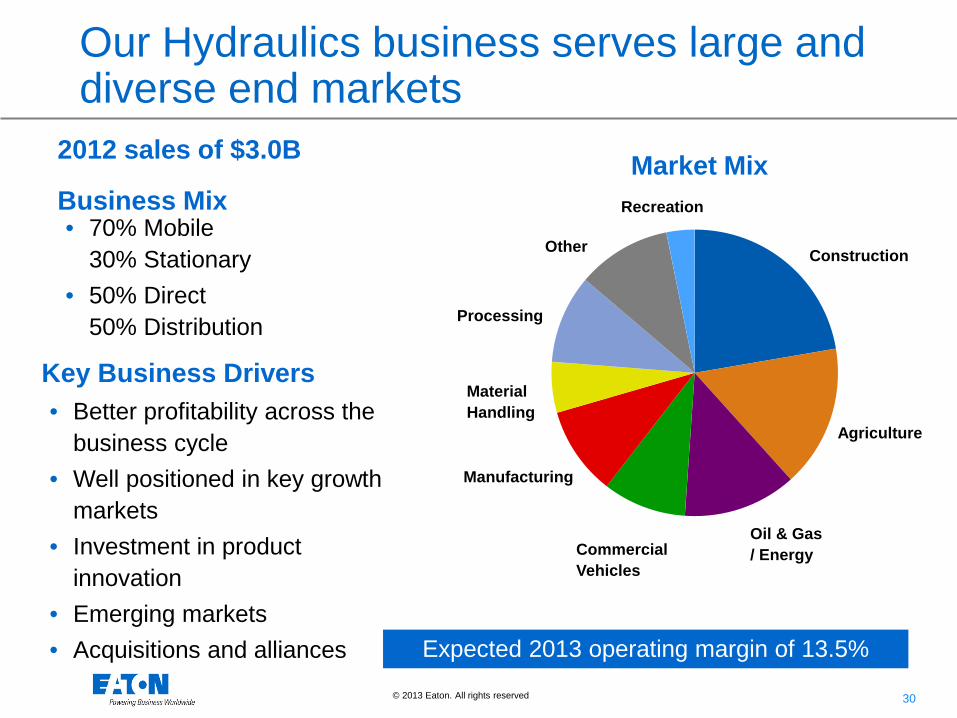
Our Hydraulics business serves large and diverse end markets
Expected 2013 operating margin of 13.5%
• 70% Mobile 30% Stationary
• 50% Direct 50% Distribution
2012 sales of $3.0B
Business Mix Market Mix
• Better profitability across the business cycle
• Well positioned in key growth markets
• Investment in product innovation
• Emerging markets • Acquisitions and alliances
Key Business Drivers
Construction
Agriculture
Oil & Gas / Energy Commercial
Vehicles
Manufacturing
Material Handling
Processing
Other
Recreation
31 © 2013 Eaton. All rights reserved.
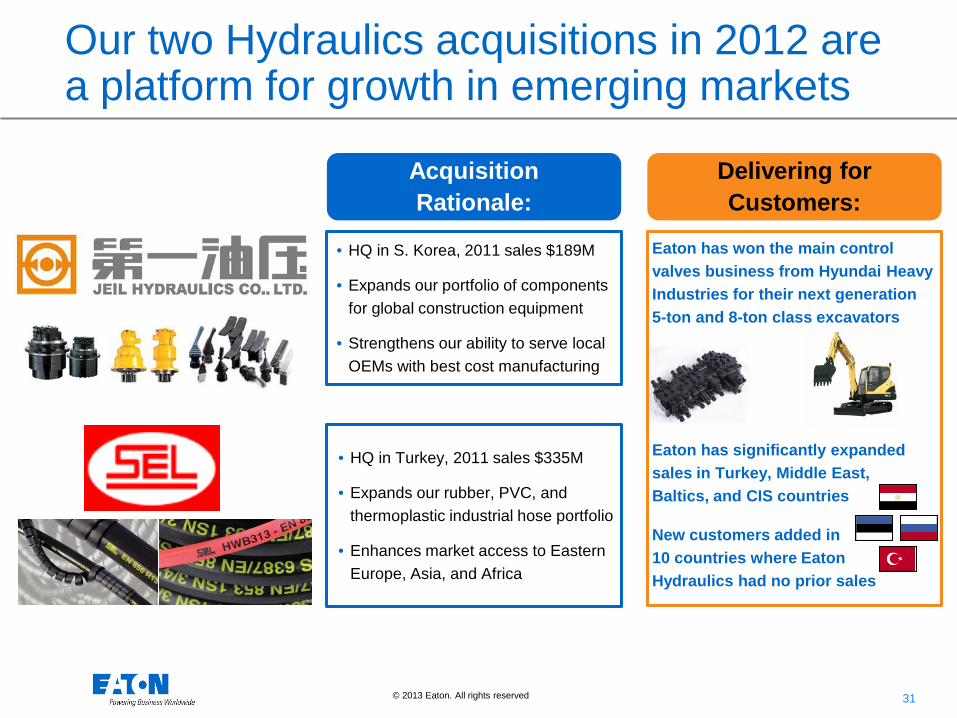
Our two Hydraulics acquisitions in 2012 are a platform for growth in emerging markets
• HQ in S. Korea, 2011 sales $189M
• Expands our portfolio of components for global construction equipment
• Strengthens our ability to serve local OEMs with best cost manufacturing
• HQ in Turkey, 2011 sales $335M
• Expands our rubber, PVC, and thermoplastic industrial hose portfolio
• Enhances market access to Eastern Europe, Asia, and Africa
Acquisition Rationale:
Delivering for Customers:
Eaton has won the main control valves business from Hyundai Heavy Industries for their next generation 5-ton and 8-ton class excavators
Eaton has significantly expanded sales in Turkey, Middle East, Baltics, and CIS countries
New customers added in 10 countries where Eaton Hydraulics had no prior sales
32 © 2013 Eaton. All rights reserved.
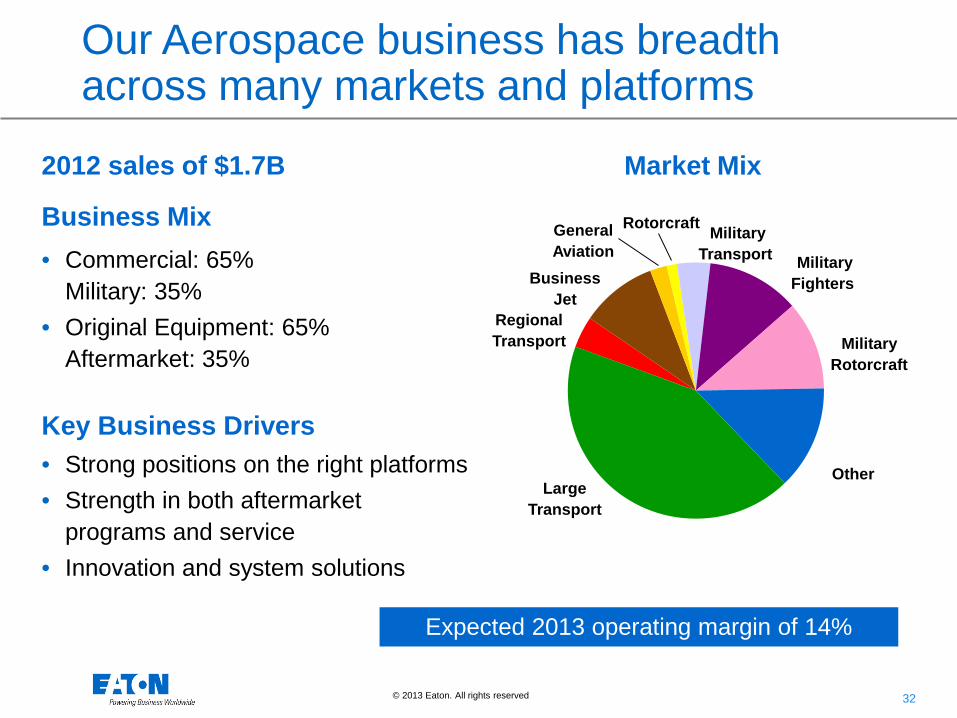
Rotorcraft
Military Fighters
General Aviation
Military Transport
Other
Military Rotorcraft
Expected 2013 operating margin of 14%
• Commercial: 65% Military: 35%
• Original Equipment: 65% Aftermarket: 35%
2012 sales of $1.7B
Business Mix
• Strong positions on the right platforms • Strength in both aftermarket
programs and service • Innovation and system solutions
Key Business Drivers
Market Mix
Large Transport
Regional Transport
Business Jet
Our Aerospace business has breadth across many markets and platforms
33 © 2013 Eaton. All rights reserved.
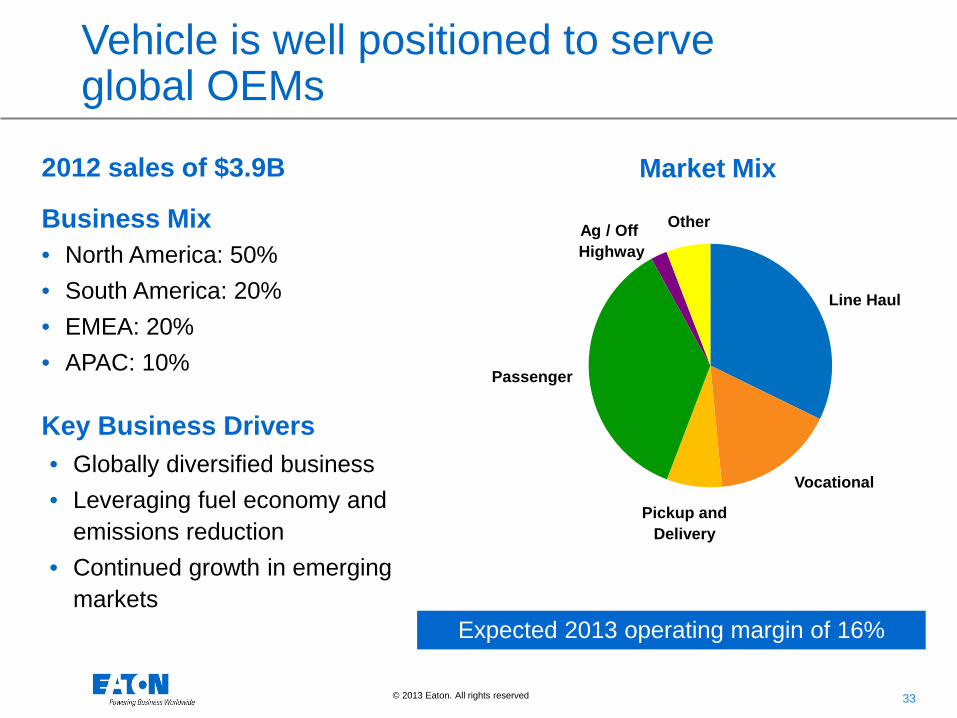
Pickup and Delivery
Expected 2013 operating margin of 16%
• North America: 50% • South America: 20% • EMEA: 20% • APAC: 10%
2012 sales of $3.9B
Business Mix
Market Mix
• Globally diversified business • Leveraging fuel economy and
emissions reduction • Continued growth in emerging
markets
Key Business Drivers
Line Haul
Vocational
Passenger
Ag / Off Highway
Other
Vehicle is well positioned to serve global OEMs
34 © 2013 Eaton. All rights reserved.
Eaton – A Power Management Company
• A balanced power management company • Cooper acquisition transforms the Electrical
Sector
• Creating consistent and profitable growth across our Industrial Sector
• Summary and guidance
35 © 2013 Eaton. All rights reserved.
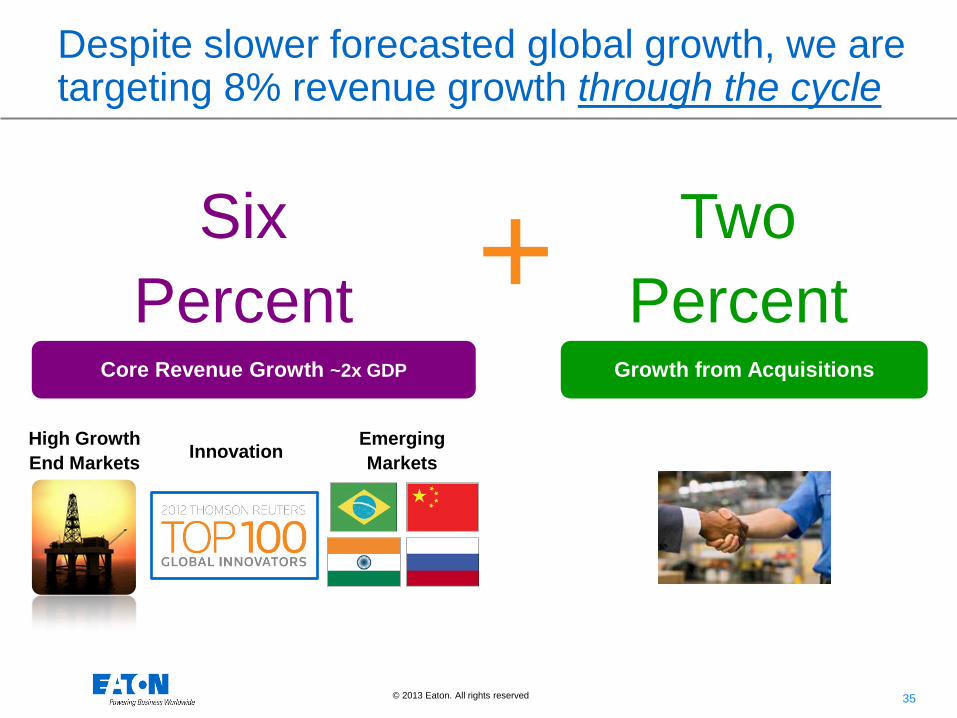
Despite slower forecasted global growth, we are targeting 8% revenue growth through the cycle
Six Percent
Core Revenue Growth ~2x GDP
High Growth End Markets Innovation
Emerging Markets
+ Two Percent
Growth from Acquisitions
36 © 2013 Eaton. All rights reserved.
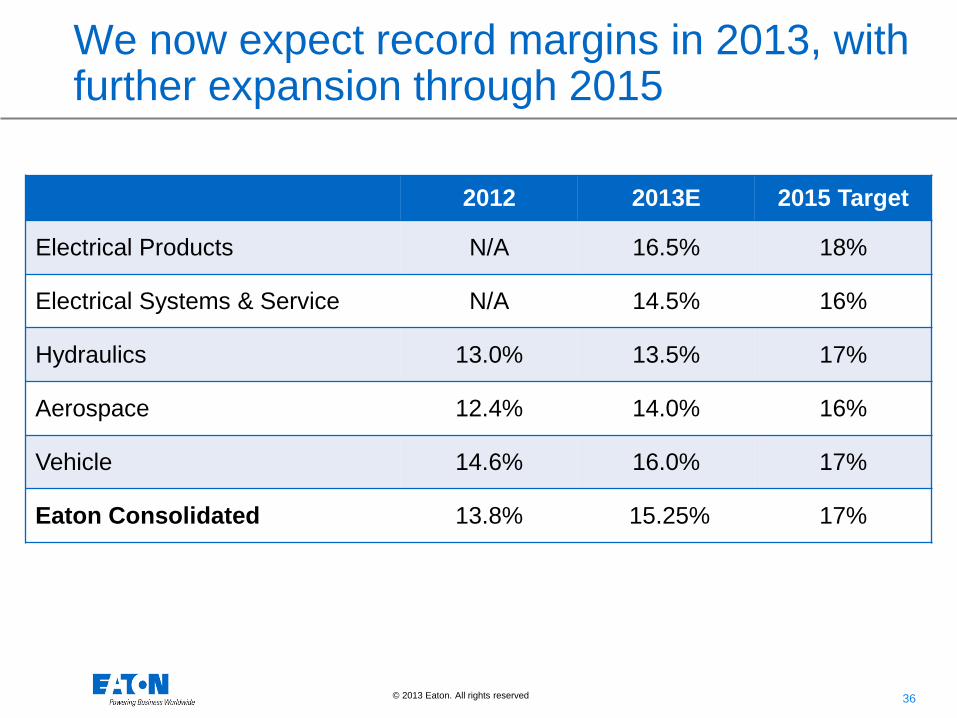
We now expect record margins in 2013, with further expansion through 2015
2012 2013E 2015 Target
Electrical Products N/A 16.5% 18%
Electrical Systems & Service N/A 14.5% 16%
Hydraulics 13.0% 13.5% 17%
Aerospace 12.4% 14.0% 16%
Vehicle 14.6% 16.0% 17%
Eaton Consolidated 13.8% 15.25% 17%
37 © 2013 Eaton. All rights reserved.
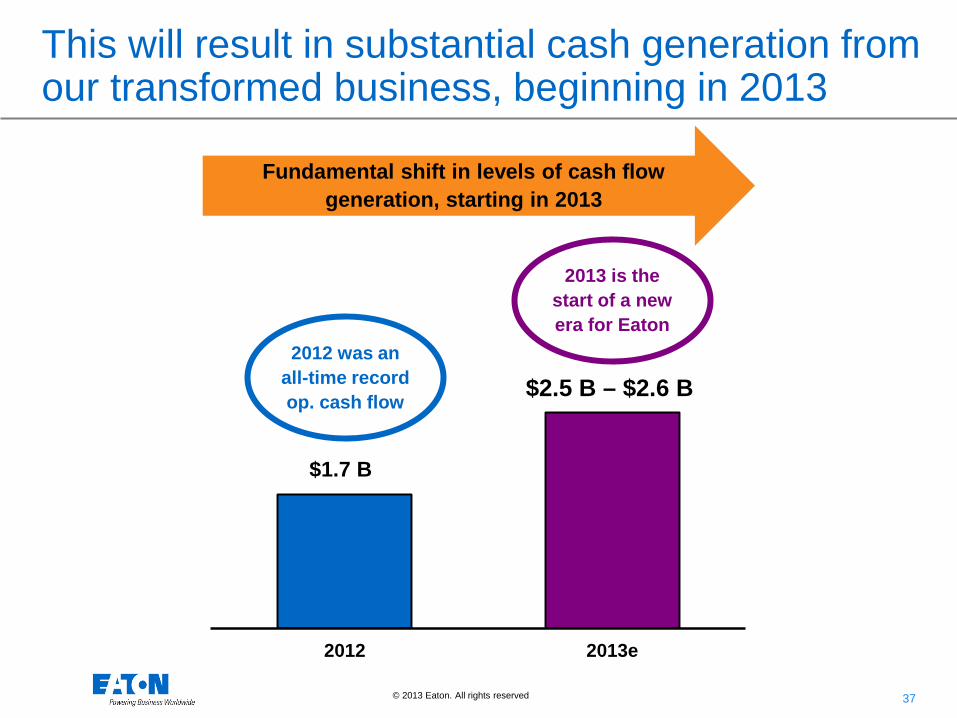
This will result in substantial cash generation from our transformed business, beginning in 2013
2012 2013e
$1.7 B
$2.5 B – $2.6 B
Fundamental shift in levels of cash flow generation, starting in 2013
2012 was an all-time record op. cash flow
2013 is the start of a new era for Eaton
38 © 2013 Eaton. All rights reserved.
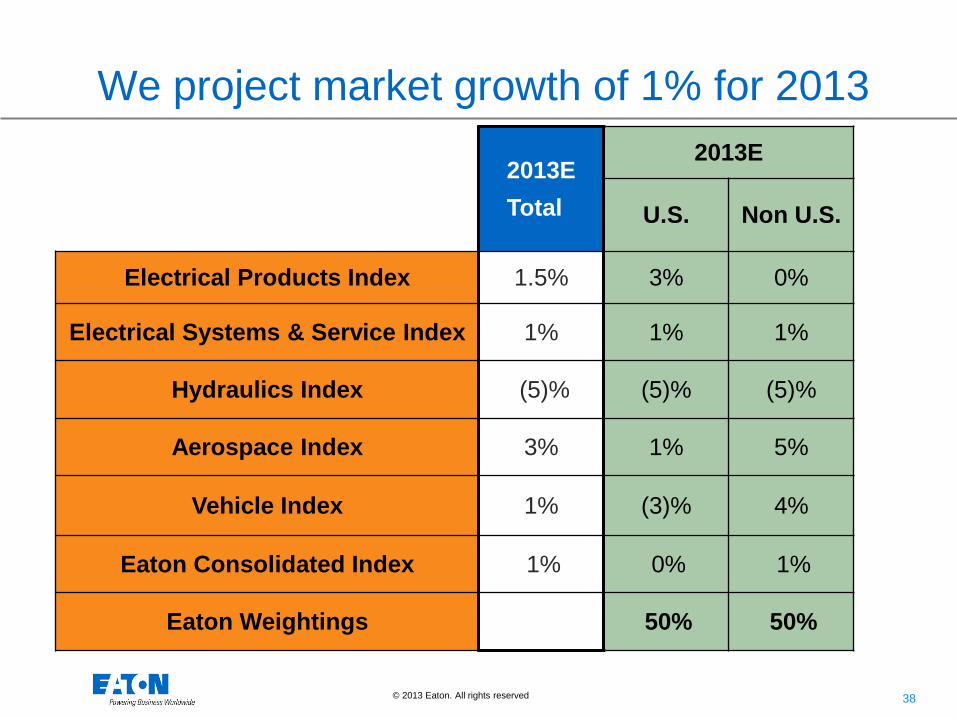
We project market growth of 1% for 2013
2013E Total
2013E
U.S. Non U.S.
Electrical Products Index 1.5% 3% 0%
Electrical Systems & Service Index 1% 1% 1%
Hydraulics Index (5)% (5)% (5)%
Aerospace Index 3% 1% 5%
Vehicle Index 1% (3)% 4%
Eaton Consolidated Index 1% 0% 1%
Eaton Weightings 50% 50%
39 © 2013 Eaton. All rights reserved.
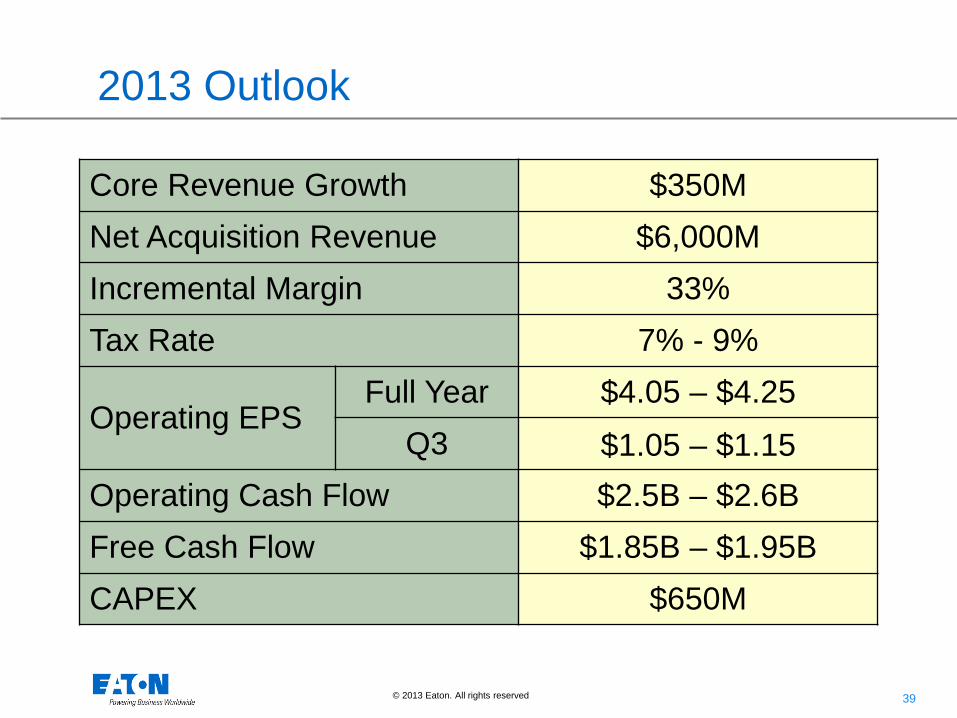
2013 Outlook
Core Revenue Growth $350M Net Acquisition Revenue $6,000M Incremental Margin 33% Tax Rate 7% - 9%
Operating EPS Full Year $4.05 – $4.25
Q3 $1.05 – $1.15 Operating Cash Flow $2.5B – $2.6B Free Cash Flow $1.85B – $1.95B CAPEX $650M
40 © 2013 Eaton. All rights reserved.
2013 – the start of a new era for Eaton
• We have the balance across our businesses to drive strong earnings growth throughout the economic cycle
• The transformed company will be higher growth, higher margin • We expect revenue growth through the cycle of 8% • We have raised our 2015 segment margin goal to 17%
• Post the Cooper acquisition, Eaton’s earnings volatility is near the midpoint of
performance for peer diversified industrials
• The Eaton Business System powers our integrated operating model, and will drive the integration of Cooper
• Strong EPS accretion from year one; exceeding original estimates
• Our dividend provides a yield in the top half of our peers, and for U.S. shareholders the majority is expected to be treated as a return of capital over the medium term
• Performance in 2013 is more dependent on execution than on global growth
41 © 2013 Eaton. All rights reserved.