Embed Size (px)
Citation preview
Participating plans
Total value ratios brochure
Easy reference to total value
ratios
1 |
Introduction
In addition to the fulfilment ratio requirement from the Insurance Authority in Hong Kong and the
Monetary Authority of Macao, to provide you with information on both the guaranteed and non-
guaranteed benefits, we also present the total value ratio, which compares the actual against the
illustrated total value.
This brochure provides easy-to-use guidance on the essential principles and information on the total
value ratios from our participating policies and covers:
1. How the total value ratios are calculated
2. How to read AXA’s total value ratio tables
3. The total value ratio tables for AXA’s participating plans
4. Frequently asked questions
5. Glossary of terminologies
For any further queries, please contact your financial consultant.
2 |
About AXA Hong Kong
AXA Hong Kong, a member of the AXA Group, prides itself of serving over 1 million customers1 in Hong Kong
and Macau. Besides being one of the largest health protection providers in Hong Kong, it is also the #1
General Insurance provider2 and the #1 insurance brand worldwide for ten consecutive years3.
AXA Hong Kong has a clear goal of ‘empowering people to live a better life’. This is reflected in everything
we do. AXA Hong Kong is one of the most diversified insurers providing full range coverage for individual
and commercial customers. We offer all-round, integrated solutions across Life, Health and Property &
Casualty to address all their insurance needs.
AXA Hong Kong leverages on Big Data and AI to transform end-to-end customer experience, making
insurance simpler and more personal. As an innovative insurer, we continue to drive innovation notably in
health and protection, supporting customers in prevention, treatment and recovery.
We also believe it is our inherent responsibility to support the communities we operate in. AXA
Foundation is our flagship corporate social responsibility programme covering all of our efforts in
promoting health, education and community support to create positive and lasting impact to Hong Kong.
1 Including customers of AXA China Region Insurance Company Limited, AXA China Region Insurance Company
(Bermuda) Limited (incorporated in Bermuda with limited liability) and AXA General Insurance Hong Kong
Limited 2 Based on 2017 Insurance Authority market share statistics represented by overall gross premiums 3 Interbrand Best Global Brand 2018 (By brand value)
3 |
1. How the total value ratios are calculated
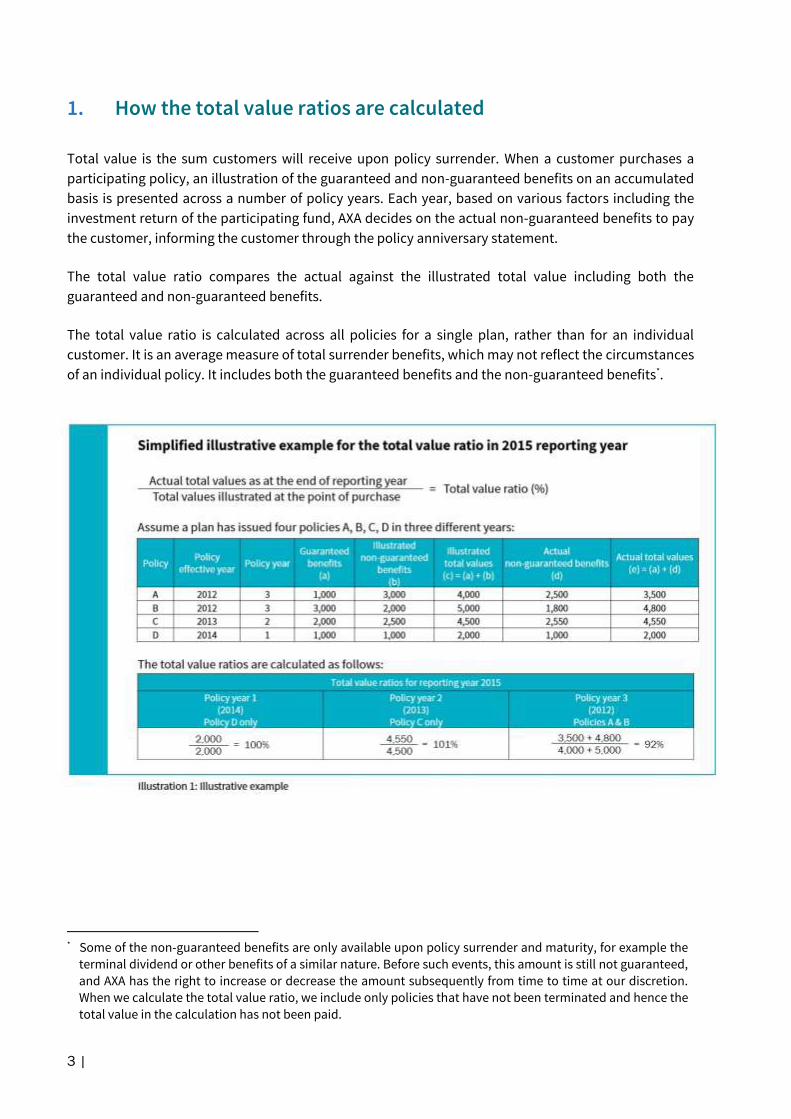
Total value is the sum customers will receive upon policy surrender. When a customer purchases a
participating policy, an illustration of the guaranteed and non-guaranteed benefits on an accumulated
basis is presented across a number of policy years. Each year, based on various factors including the
investment return of the participating fund, AXA decides on the actual non-guaranteed benefits to pay
the customer, informing the customer through the policy anniversary statement.
The total value ratio compares the actual against the illustrated total value including both the
guaranteed and non-guaranteed benefits.
The total value ratio is calculated across all policies for a single plan, rather than for an individual
customer. It is an average measure of total surrender benefits, which may not reflect the circumstances
of an individual policy. It includes both the guaranteed benefits and the non-guaranteed benefits*.
* Some of the non-guaranteed benefits are only available upon policy surrender and maturity, for example the
terminal dividend or other benefits of a similar nature. Before such events, this amount is still not guaranteed,
and AXA has the right to increase or decrease the amount subsequently from time to time at our discretion.
When we calculate the total value ratio, we include only policies that have not been terminated and hence the
total value in the calculation has not been paid.
4 |
In the above example (Illustration 1):
In policy year 1, the total value ratio is 100%. This means the actual total value is equal to the
illustrated total value.
In policy year 2, the total value ratio is 101%. This means the actual total value is 1% higher than
the illustrated total value.
In policy year 3, the total value ratio is 92%. This means the actual total value is 8% less than the
illustrated total value.
The above example is for illustrative purposes only. When you are planning to purchase one of our
participating plans, we advise you to carefully read all the marketing materials including the product
brochure, the participating policy fact sheet and the proposal along with this document and the
fulfilment ratios brochure.

5 |
2. How to read AXA’s total value ratio tables For each AXA participating plan with policies issued in the 5 years prior to the reporting year, there is a
table of total value ratios. These tables are grouped as either “available for sale” or “not available for
sale” as follows:
Total value ratios for plans available for sale
Life Protection and Savings - Savings Oriented
Life Protection and Savings - Protection Oriented
Critical Illness Protection
Total value ratios for plans not available for sale
Life Protection and Savings - Savings Oriented
Life Protection and Savings - Protection Oriented
Critical Illness Protection
For these plans, total value ratios are listed for policies issued in or after 2010. Each table has a number
of rows of total value ratios depending on the policy currency.
6 |
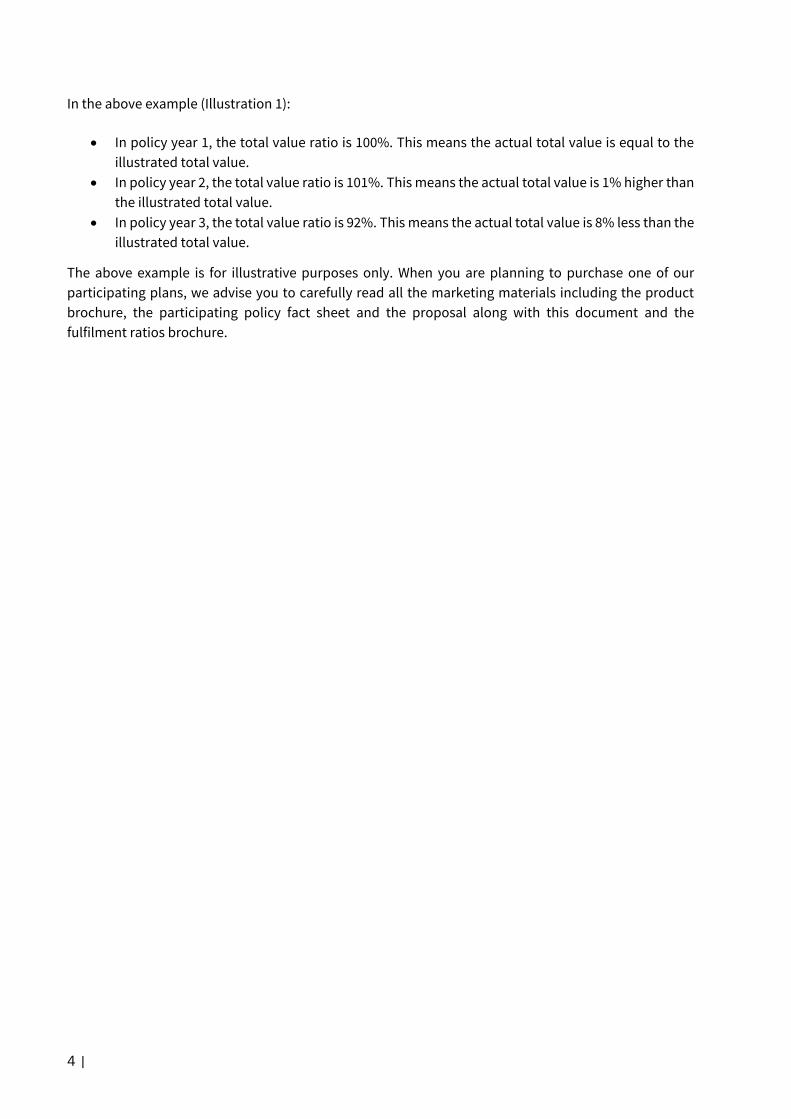
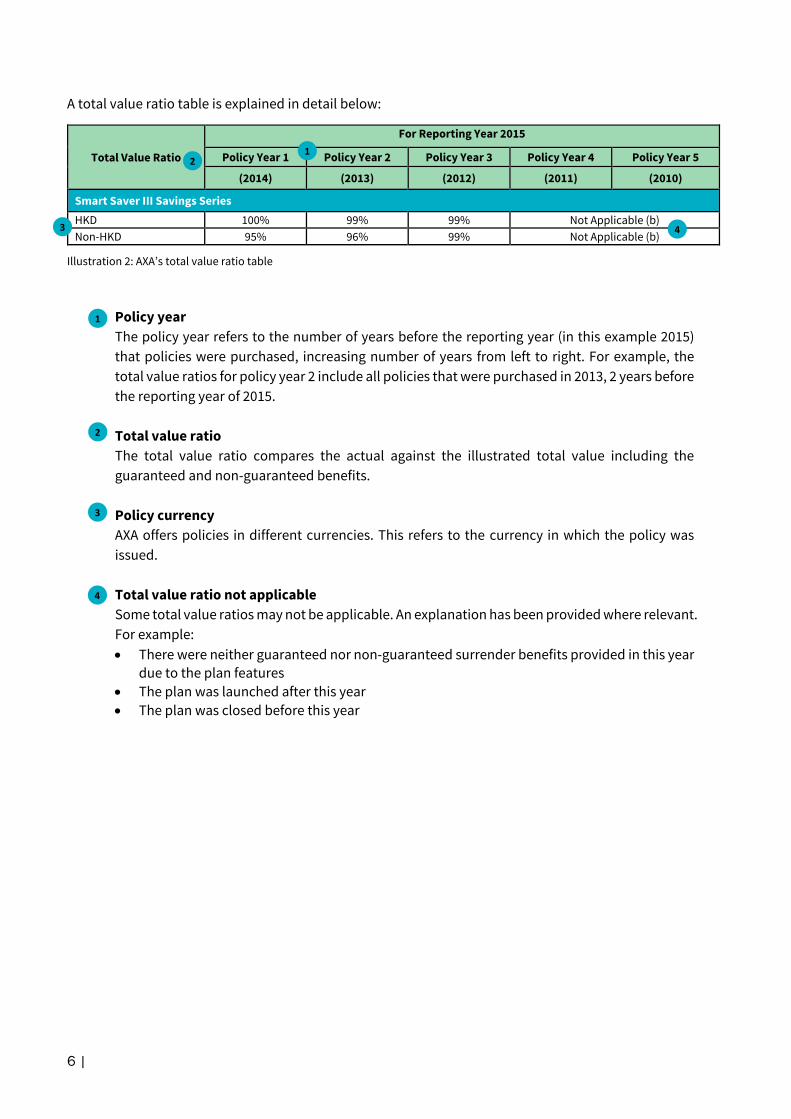
A total value ratio table is explained in detail below:
Total Value Ratio
For Reporting Year 2015
Policy Year 1 Policy Year 2 Policy Year 3 Policy Year 4 Policy Year 5
(2014) (2013) (2012) (2011) (2010)
Smart Saver III Savings Series
HKD 100% 99% 99% Not Applicable (b)
Non-HKD 95% 96% 99% Not Applicable (b)
Illustration 2: AXA’s total value ratio table
Policy year
The policy year refers to the number of years before the reporting year (in this example 2015)
that policies were purchased, increasing number of years from left to right. For example, the
total value ratios for policy year 2 include all policies that were purchased in 2013, 2 years before
the reporting year of 2015.
Total value ratio
The total value ratio compares the actual against the illustrated total value including the
guaranteed and non-guaranteed benefits.
Policy currency
AXA offers policies in different currencies. This refers to the currency in which the policy was
issued.
Total value ratio not applicable
Some total value ratios may not be applicable. An explanation has been provided where relevant.
For example:
There were neither guaranteed nor non-guaranteed surrender benefits provided in this year
due to the plan features
The plan was launched after this year
The plan was closed before this year
1
3
4
2
3 4
2 1
7 |
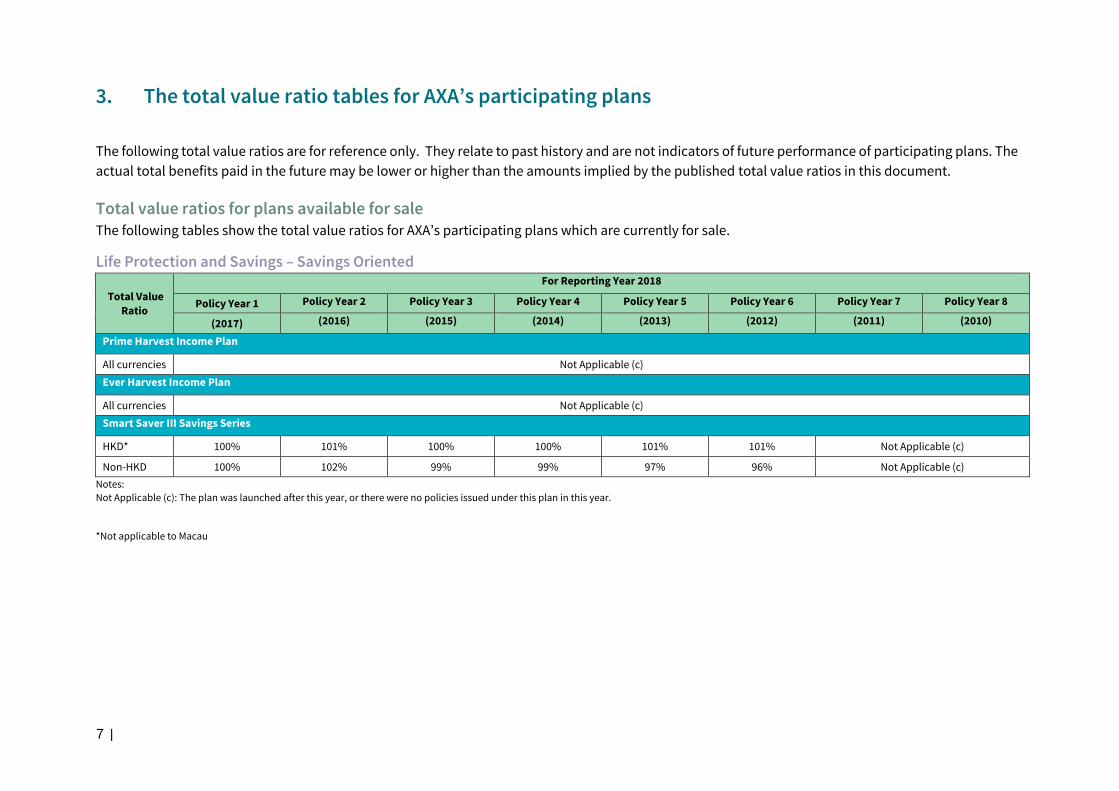
3. The total value ratio tables for AXA’s participating plans
The following total value ratios are for reference only. They relate to past history and are not indicators of future performance of participating plans. The
actual total benefits paid in the future may be lower or higher than the amounts implied by the published total value ratios in this document.
Total value ratios for plans available for sale The following tables show the total value ratios for AXA’s participating plans which are currently for sale.
Life Protection and Savings – Savings Oriented
Total Value
Ratio
For Reporting Year 2018
Policy Year 1 Policy Year 2 Policy Year 3 Policy Year 4 Policy Year 5 Policy Year 6 Policy Year 7 Policy Year 8
(2017) (2016) (2015) (2014) (2013) (2012) (2011) (2010)
Prime Harvest Income Plan
All currencies Not Applicable (c)
Ever Harvest Income Plan
All currencies Not Applicable (c)
Smart Saver III Savings Series
HKD* 100% 101% 100% 100% 101% 101% Not Applicable (c)
Non-HKD 100% 102% 99% 99% 97% 96% Not Applicable (c)
Notes:
Not Applicable (c): The plan was launched after this year, or there were no policies issued under this plan in this year.
*Not applicable to Macau

8 |
Life Protection and Savings – Savings Oriented (Con’t)
Total Value
Ratio
For Reporting Year 2018
Policy Year 1 Policy Year 2 Policy Year 3 Policy Year 4 Policy Year 5 Policy Year 6 Policy Year 7 Policy Year 8
(2017) (2016) (2015) (2014) (2013) (2012) (2011) (2010)
Smart Jumbo Saver III Savings Series
HKD* 101% 100% 100% 99% 99% 100% Not Applicable (c)
Non-HKD 102% 100% 99% 99% 96% 95% Not Applicable (c)
MAXX II Savings Series
HKD* 100% 99% 99% 98% 98% 98% Not Applicable (c)
Non-HKD 100% 100% 99% 98% 95% 94% Not Applicable (c)
Smart Jumbo Saver III Savings Series (Simplified Version) *
HKD 102% 100% 100% 99% 100% Not Applicable (c)
Non-HKD 102% 100% 99% 99% 96% Not Applicable (c)
Wealth Advance Savings Plan
HKD Not Applicable (a) Not Applicable (c)
Non-HKD Not Applicable (a) Not Applicable (c)
Flexi Power Saver
All currencies Not Applicable (c)
Notes:
Not Applicable (a): There were neither guaranteed nor non-guaranteed surrender benefits provided in this year due to the plan features.
Not Applicable (c): The plan was launched after this year, or there were no policies issued under this plan in this year.
*Not applicable to Macau

9 |
Life Protection and Savings - Protection Oriented
Total Value
Ratio
For Reporting Year 2018
Policy Year 1 Policy Year 2 Policy Year 3 Policy Year 4 Policy Year 5 Policy Year 6 Policy Year 7 Policy Year 8
(2017) (2016) (2015) (2014) (2013) (2012) (2011) (2010)
Smart Protector II Life Insurance Series
All currencies 100% 100% 98% 97% 98% 92% 90% 90%
Fortune Guard Life Insurance
HKD Before 29 May, 2017:
Not Applicable (e)
On or after 29 May, 2017:
Not Applicable (a)
Not Applicable (e) Not Applicable (c)
Non-HKD Not Applicable (e) Not Applicable (c)
Fortune Protector Life Insurance
HKD Before 29 May, 2017:
Not Applicable (e)
On or after 29 May, 2017:
Not Applicable (a)
Not Applicable (e) Not Applicable (c)
Non-HKD Not Applicable (e) Not Applicable (c)
Grand Heritage*
All currencies Not Applicable (c)
Notes:
Not Applicable (a): There were neither guaranteed nor non-guaranteed surrender benefits provided in this year due to the plan features.
Not Applicable (c): The plan was launched after this year, or there were no policies issued under this plan in this year.
Not Applicable (e): In general, we illustrate the total values to customers based on our estimate of the future investment return at the point of purchase, and the same figures will be used to calculate the total
value ratio. However, for the policies of Fortune Guard Life Insurance and Fortune Protector Life Insurance, the proposals illustrate the total values under two (applicable to Hong Kong) or three
(applicable to Macau) hypothetical rates of investment return instead. In this regard, the total value ratio calculated with the illustrated figures may not carry the same meaning as other total
value ratios we present in this document. For the same reason, the total value ratio is not applicable.
*Not applicable to Macau
10 |
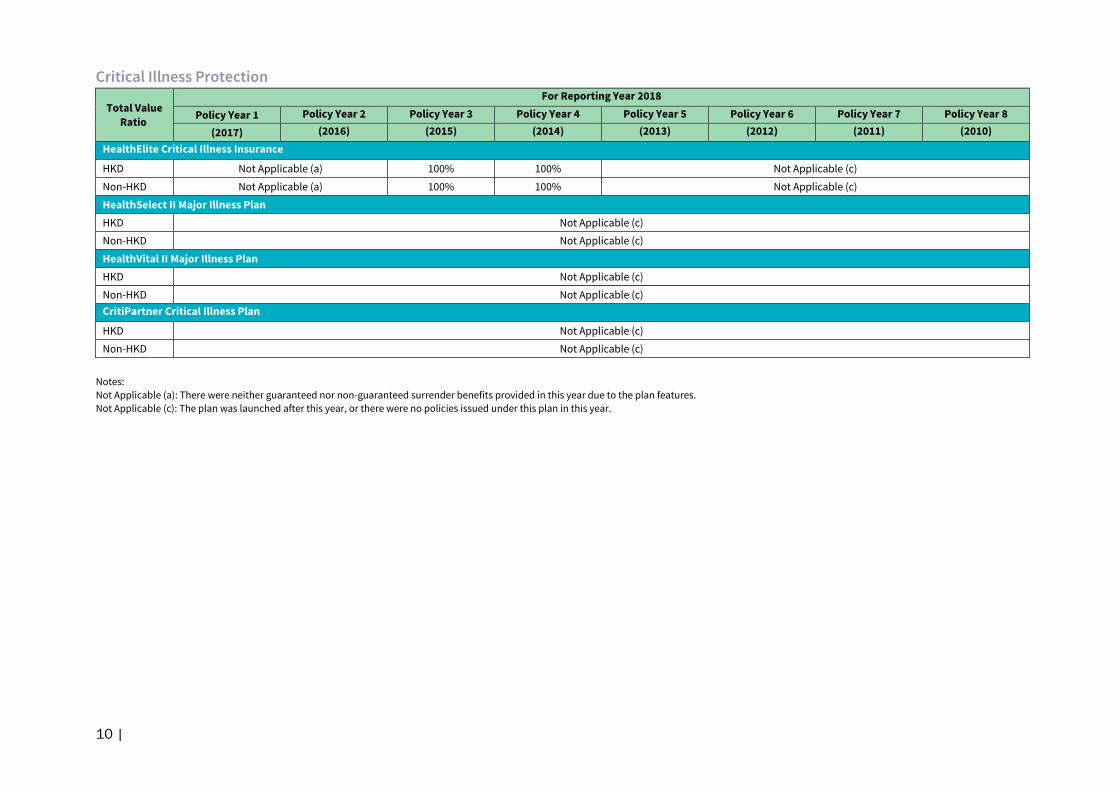
Critical Illness Protection
Total Value
Ratio
For Reporting Year 2018
Policy Year 1 Policy Year 2 Policy Year 3 Policy Year 4 Policy Year 5 Policy Year 6 Policy Year 7 Policy Year 8
(2017) (2016) (2015) (2014) (2013) (2012) (2011) (2010)
HealthElite Critical Illness Insurance
HKD Not Applicable (a) 100% 100% Not Applicable (c)
Non-HKD Not Applicable (a) 100% 100% Not Applicable (c)
HealthSelect II Major Illness Plan
HKD Not Applicable (c)
Non-HKD Not Applicable (c)
HealthVital II Major Illness Plan
HKD Not Applicable (c)
Non-HKD Not Applicable (c)
CritiPartner Critical Illness Plan
HKD Not Applicable (c)
Non-HKD Not Applicable (c)
Notes:
Not Applicable (a): There were neither guaranteed nor non-guaranteed surrender benefits provided in this year due to the plan features.
Not Applicable (c): The plan was launched after this year, or there were no policies issued under this plan in this year.
11 |
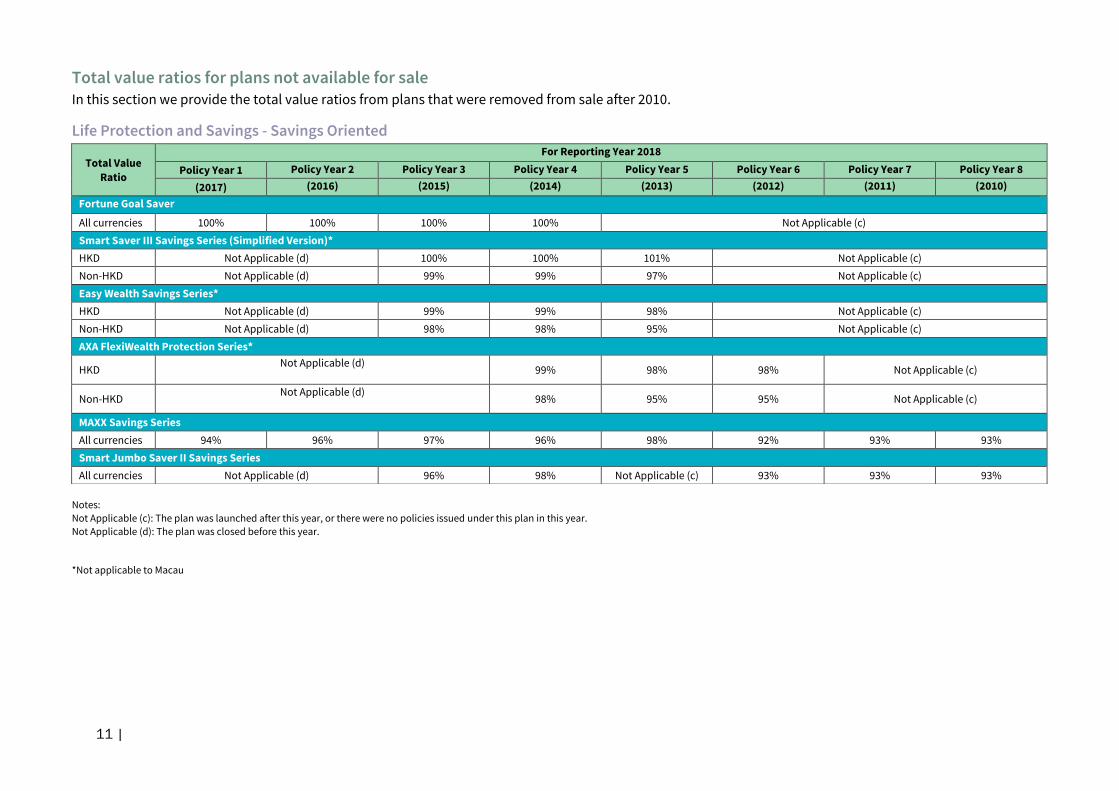
Total value ratios for plans not available for sale In this section we provide the total value ratios from plans that were removed from sale after 2010.
Life Protection and Savings - Savings Oriented
Notes:
Not Applicable (c): The plan was launched after this year, or there were no policies issued under this plan in this year.
Not Applicable (d): The plan was closed before this year.
*Not applicable to Macau
Total Value
Ratio
For Reporting Year 2018
Policy Year 1 Policy Year 2 Policy Year 3 Policy Year 4 Policy Year 5 Policy Year 6 Policy Year 7 Policy Year 8
(2017) (2016) (2015) (2014) (2013) (2012) (2011) (2010)
Fortune Goal Saver
All currencies 100% 100% 100% 100% Not Applicable (c)
Smart Saver III Savings Series (Simplified Version)*
HKD Not Applicable (d) 100% 100% 101% Not Applicable (c)
Non-HKD Not Applicable (d) 99% 99% 97% Not Applicable (c)
Easy Wealth Savings Series*
HKD Not Applicable (d) 99% 99% 98% Not Applicable (c)
Non-HKD Not Applicable (d) 98% 98% 95% Not Applicable (c)
AXA FlexiWealth Protection Series*
HKD Not Applicable (d)
99% 98% 98% Not Applicable (c)
Non-HKD Not Applicable (d)
98% 95% 95% Not Applicable (c)
MAXX Savings Series
All currencies 94% 96% 97% 96% 98% 92% 93% 93%
Smart Jumbo Saver II Savings Series
All currencies Not Applicable (d) 96% 98% Not Applicable (c) 93% 93% 93%
12 |
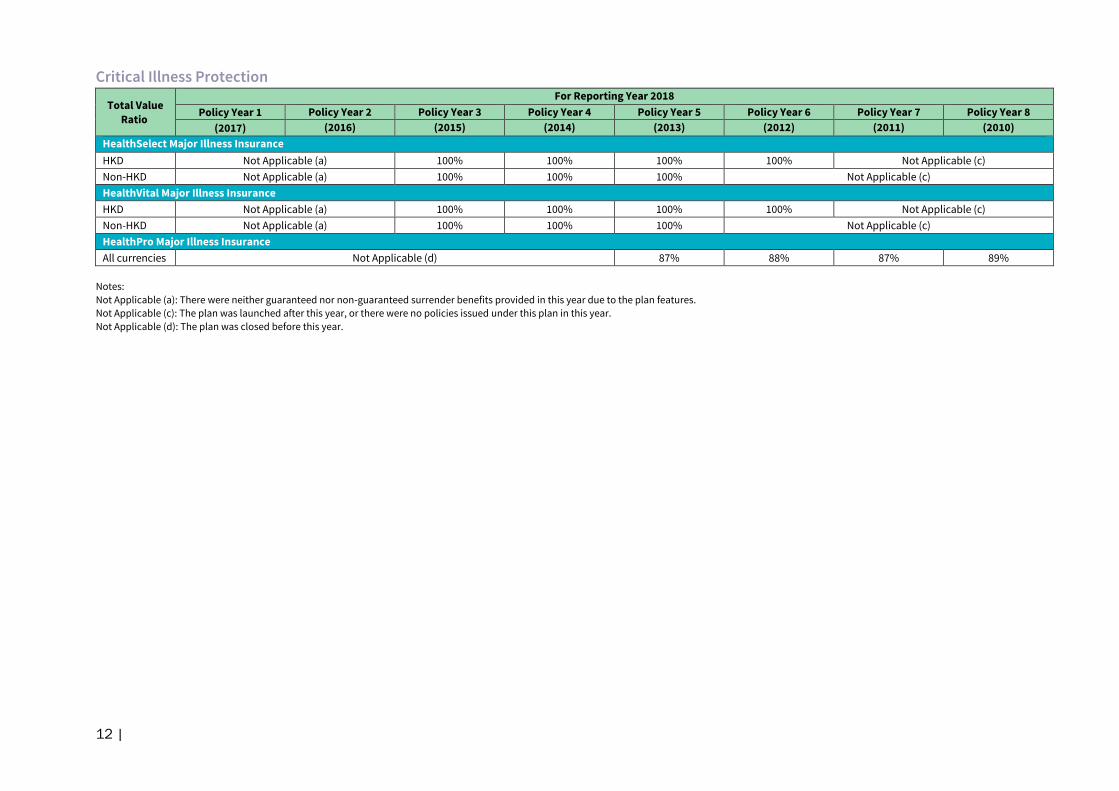
Critical Illness Protection
Total Value
Ratio
For Reporting Year 2018
Policy Year 1 Policy Year 2 Policy Year 3 Policy Year 4 Policy Year 5 Policy Year 6 Policy Year 7 Policy Year 8
(2017) (2016) (2015) (2014) (2013) (2012) (2011) (2010)
HealthSelect Major Illness Insurance
HKD Not Applicable (a) 100% 100% 100% 100% Not Applicable (c)
Non-HKD Not Applicable (a) 100% 100% 100% Not Applicable (c)
HealthVital Major Illness Insurance
HKD Not Applicable (a) 100% 100% 100% 100% Not Applicable (c)
Non-HKD Not Applicable (a) 100% 100% 100% Not Applicable (c)
HealthPro Major Illness Insurance
All currencies Not Applicable (d) 87% 88% 87% 89%
Notes:
Not Applicable (a): There were neither guaranteed nor non-guaranteed surrender benefits provided in this year due to the plan features.
Not Applicable (c): The plan was launched after this year, or there were no policies issued under this plan in this year.
Not Applicable (d): The plan was closed before this year.

13 |
4. Frequently asked questions
a. What is the total value ratio?
The total value ratio compares the actual against the illustrated total value including both the
guaranteed and non-guaranteed benefits. It is calculated across all policies for a single plan, rather
than for an individual customer. It is an average measure of total surrender benefits, which may not
reflect the circumstances of an individual policy. It includes both the guaranteed benefits and the
non-guaranteed benefits.
b. Why is there no total value ratio for my plan?
Tables of total value ratios are available for plans with policies issued in the 5 years prior to the
reporting year except if:
Your plan does not offer non-guaranteed benefits
Your plan is an investment-linked assurance scheme
In general, the total value ratios are listed for policies issued in or after 2010.
However, there can be multiple reasons why your plan does not have a total value ratio for a
particular policy year, the most common factors are listed below:
There were no surrender benefits provided in that year due to the plan features
The plan was launched after that year
The plan was closed before that year
c. Why do the total value ratios in this brochure differ from my policy?
The total value ratios are average ratios calculated for a large number of policies under the
respective plans, instead of being calculated on an individual policy basis. The total value ratios
shown in this brochure may not reflect the circumstances of any particular policy and are for
reference only.
d. Why can’t I see the total value ratios for policies issued in last year and this year in
the total value ratio table?
Non-guaranteed benefits may only be payable after the policies have been in force for at least one
year, depending on the plan features. Therefore for policies issued in last year and this year, their
total value ratios will be published starting from the next reporting year at the earliest.

14 |
e. Why do the total value ratios vary among different participating plans?
Different participating plans may have different investment strategies, as well as different
approaches or philosophies to determine the non-guaranteed benefits. As a result, the
considerations when determining the non-guaranteed benefits may vary. Even if the investment
returns and other factors perform the same, AXA may declare different amounts of non-guaranteed
benefits for different participating plans. Guaranteed benefits are paid regardless of how the
participating fund performs.
f. Do historical total value ratios represent future performance?
No. The total value ratios are intended to be only a summary of the differences between the sum of
the guaranteed benefits and actual non-guaranteed benefits declared versus the total value
amounts illustrated at the point of purchase in the past. Declarations of non-guaranteed benefits
were determined based on the historical performance of a number of factors such as the actual
investment returns. In the future, these may or may not happen again, and there is no guarantee
that the total value ratios in the future will be the same as, or similar to, those in the past.
To understand more about how the non-guaranteed benefits will be determined, you can refer to
the participating policy fact sheets available on our website.
15 |
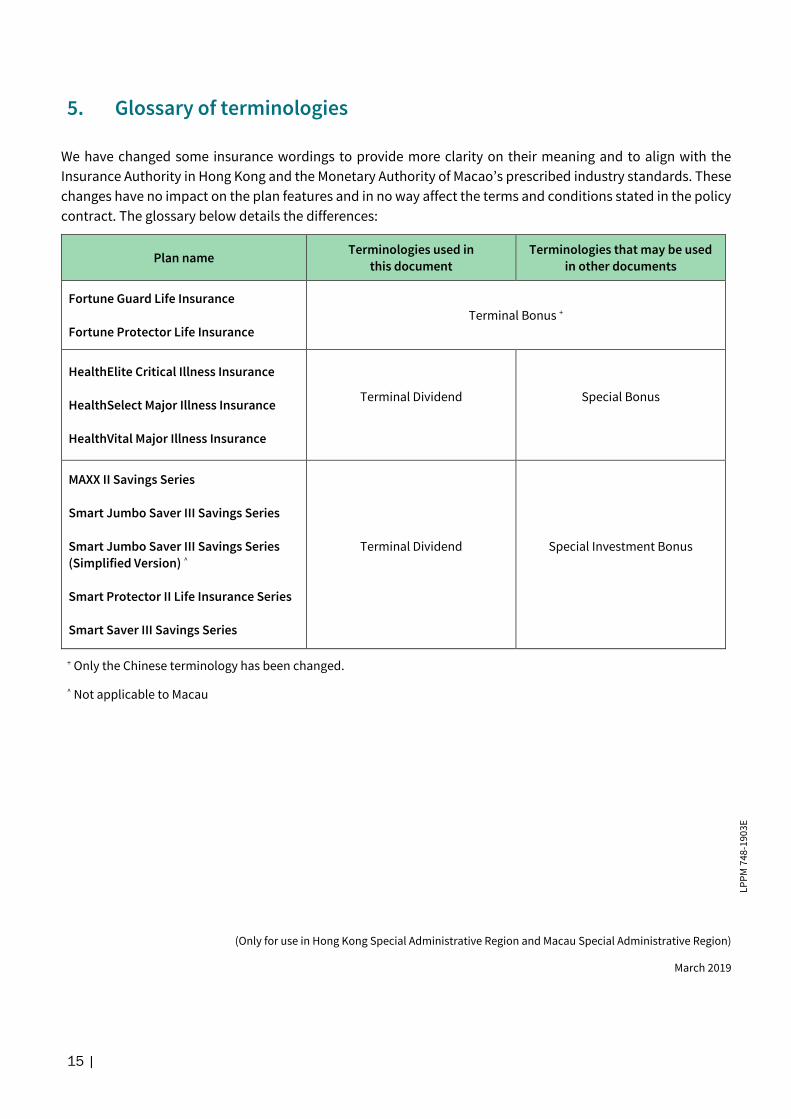
5. Glossary of terminologies
We have changed some insurance wordings to provide more clarity on their meaning and to align with the
Insurance Authority in Hong Kong and the Monetary Authority of Macao’s prescribed industry standards. These
changes have no impact on the plan features and in no way affect the terms and conditions stated in the policy
contract. The glossary below details the differences:
Plan name Terminologies used in
this document
Terminologies that may be used
in other documents
Fortune Guard Life Insurance
Fortune Protector Life Insurance
Terminal Bonus +
HealthElite Critical Illness Insurance
HealthSelect Major Illness Insurance
HealthVital Major Illness Insurance
Terminal Dividend
Special Bonus
MAXX II Savings Series
Smart Jumbo Saver III Savings Series
Smart Jumbo Saver III Savings Series
(Simplified Version) ^
Smart Protector II Life Insurance Series
Smart Saver III Savings Series
Terminal Dividend
Special Investment Bonus
+ Only the Chinese terminology has been changed.
^ Not applicable to Macau
(Only for use in Hong Kong Special Administrative Region and Macau Special Administrative Region)
March 2019
LPP
M 7
48-1
903E
Total Value Ratios Brochure
Hong Kong
Tel : (852) 2802 2812Fax : (852) 2598 7623
www.axa.com.hk
Macau
Tel : (853) 8799 2812Fax : (853) 2878 0022
www.axa.com.mo