Embed Size (px)
Citation preview

Egyptian Journal of Chest Diseases and Tuberculosis (2016) 65, 369–376
CORE Metadata, citation and similar papers at core.ac.uk
Provided by Elsevier - Publisher Connector
HO ST E D BY
The Egyptian Society of Chest Diseases and Tuberculosis
Egyptian Journal of Chest Diseases and Tuberculosis
www.elsevier.com/locate/ejcdtwww.sciencedirect.com
REVIEW
Easy blood gas analysis: Implications for nursing
Abbreviations ABGs, arterial blood gases; ODC, Oxyhaemoglobin
Dissociation Curve* Corresponding author. Mobile: +20 1001964461, +20 966557783525.E-mail addresses: [email protected], [email protected]
(H.M. Mohammed).
Peer review under responsibility of The Egyptian Society of Chest
Diseases and Tuberculosis.
http://dx.doi.org/10.1016/j.ejcdt.2015.11.0090422-7638 � 2015 The Authors. Production and hosting by Elsevier B.V. on behalf of The Egyptian Society of Chest Diseases and TubeThis is an open access article under the CC BY-NC-ND license (http://creativecommons.org/licenses/by-nc-nd/4.0/).
Hanan Mohammed Mohammed *, Dalia Abdallah Abdelatief
Faculty of Nursing, Ain Shams University, Egypt
Received 31 October 2015; accepted 17 November 2015Available online 10 December 2015
KEYWORDS
Arterial blood gases;
Arterial puncture;
Acid base balance;
Acid base imbalance;
Oxyhaemoglobin Dissocia-
tion Curve
Abstract Arterial blood gas analysis is a common investigation in emergency departments and
intensive care units for monitoring patients with acute respiratory failure. It also has some applica-
tions in general practice, such as assessing the need for domiciliary oxygen therapy in patients with
chronic obstructive pulmonary disease. An arterial blood gas result can help in the assessment of a
patient’s gas exchange, ventilatory control and acid–base balance. Nurses are usually involved in
taking and analyzing the ABGs and normally they report these results to the doctors or anesthesi-
ologists. Out of these results the anesthesiologists will then prescribe further treatment for the crit-
ically ill patient. Hence, it is important that nurses are familiar with the information obtained to be
able to detect the disturbances in ventilation, oxygen delivery and acid–base balance.� 2015 The Authors. Production and hosting by Elsevier B.V. on behalf of The Egyptian Society of Chest
Diseases and Tuberculosis. This is an open access article under the CC BY-NC-ND license (http://
creativecommons.org/licenses/by-nc-nd/4.0/).
Contents
Introduction . . . . . . . . . . . . . . . . . . . . . . . . . . . . . . . . . . . . . . . . . . . . . . . . . . . . . . . . . . . . . . . . . . . . . . . . . . . . 370
Arterial puncture . . . . . . . . . . . . . . . . . . . . . . . . . . . . . . . . . . . . . . . . . . . . . . . . . . . . . . . . . . . . . . . . . . . . . . . . . 370When an ABG analysis is needed . . . . . . . . . . . . . . . . . . . . . . . . . . . . . . . . . . . . . . . . . . . . . . . . . . . . . . . . . . . . . 371Physiology of ABGs. . . . . . . . . . . . . . . . . . . . . . . . . . . . . . . . . . . . . . . . . . . . . . . . . . . . . . . . . . . . . . . . . . . . . . . 371Types of blood gasses. . . . . . . . . . . . . . . . . . . . . . . . . . . . . . . . . . . . . . . . . . . . . . . . . . . . . . . . . . . . . . . . . . . . . . 371
Arterial blood gas . . . . . . . . . . . . . . . . . . . . . . . . . . . . . . . . . . . . . . . . . . . . . . . . . . . . . . . . . . . . . . . . . . . . . . 371Venous blood gas . . . . . . . . . . . . . . . . . . . . . . . . . . . . . . . . . . . . . . . . . . . . . . . . . . . . . . . . . . . . . . . . . . . . . . 372Capillary blood gas . . . . . . . . . . . . . . . . . . . . . . . . . . . . . . . . . . . . . . . . . . . . . . . . . . . . . . . . . . . . . . . . . . . . . 372
Basic facts to remember . . . . . . . . . . . . . . . . . . . . . . . . . . . . . . . . . . . . . . . . . . . . . . . . . . . . . . . . . . . . . . . . . . . . 372Acid–base balance . . . . . . . . . . . . . . . . . . . . . . . . . . . . . . . . . . . . . . . . . . . . . . . . . . . . . . . . . . . . . . . . . . . . . . . . 372Measuring pH . . . . . . . . . . . . . . . . . . . . . . . . . . . . . . . . . . . . . . . . . . . . . . . . . . . . . . . . . . . . . . . . . . . . . . . . . . . 373
rculosis.
370 H.M. Mohammed, D.A. Abdelatief
Maintaining acid–base balance . . . . . . . . . . . . . . . . . . . . . . . . . . . . . . . . . . . . . . . . . . . . . . . . . . . . . . . . . . . . . . . 373
Oxygenation . . . . . . . . . . . . . . . . . . . . . . . . . . . . . . . . . . . . . . . . . . . . . . . . . . . . . . . . . . . . . . . . . . . . . . . . . . . . 373Buffers . . . . . . . . . . . . . . . . . . . . . . . . . . . . . . . . . . . . . . . . . . . . . . . . . . . . . . . . . . . . . . . . . . . . . . . . . . . . . . . . 373
Respiratory buffer . . . . . . . . . . . . . . . . . . . . . . . . . . . . . . . . . . . . . . . . . . . . . . . . . . . . . . . . . . . . . . . . . . . . . . 373
Renal buffer . . . . . . . . . . . . . . . . . . . . . . . . . . . . . . . . . . . . . . . . . . . . . . . . . . . . . . . . . . . . . . . . . . . . . . . . . . 373Acid–base imbalance . . . . . . . . . . . . . . . . . . . . . . . . . . . . . . . . . . . . . . . . . . . . . . . . . . . . . . . . . . . . . . . . . . . . . . 373
Respiratory acidosis . . . . . . . . . . . . . . . . . . . . . . . . . . . . . . . . . . . . . . . . . . . . . . . . . . . . . . . . . . . . . . . . . . . . . 373Respiratory alkalosis . . . . . . . . . . . . . . . . . . . . . . . . . . . . . . . . . . . . . . . . . . . . . . . . . . . . . . . . . . . . . . . . . . . . 374
Metabolic acidosis . . . . . . . . . . . . . . . . . . . . . . . . . . . . . . . . . . . . . . . . . . . . . . . . . . . . . . . . . . . . . . . . . . . . . . 374Metabolic alkalosis . . . . . . . . . . . . . . . . . . . . . . . . . . . . . . . . . . . . . . . . . . . . . . . . . . . . . . . . . . . . . . . . . . . . . 374
Oxyhaemoglobin Dissociation Curve (ODC) . . . . . . . . . . . . . . . . . . . . . . . . . . . . . . . . . . . . . . . . . . . . . . . . . . . . . 374
Right shift (acidosis) . . . . . . . . . . . . . . . . . . . . . . . . . . . . . . . . . . . . . . . . . . . . . . . . . . . . . . . . . . . . . . . . . . . . 375Left shift (alkalosis) . . . . . . . . . . . . . . . . . . . . . . . . . . . . . . . . . . . . . . . . . . . . . . . . . . . . . . . . . . . . . . . . . . . . . 375
Ways to interpret ABG . . . . . . . . . . . . . . . . . . . . . . . . . . . . . . . . . . . . . . . . . . . . . . . . . . . . . . . . . . . . . . . . . . . . 375
When your patient is on mechanical ventilation . . . . . . . . . . . . . . . . . . . . . . . . . . . . . . . . . . . . . . . . . . . . . . . . . . . 375Act quickly . . . . . . . . . . . . . . . . . . . . . . . . . . . . . . . . . . . . . . . . . . . . . . . . . . . . . . . . . . . . . . . . . . . . . . . . . . . . . 375Conclusion . . . . . . . . . . . . . . . . . . . . . . . . . . . . . . . . . . . . . . . . . . . . . . . . . . . . . . . . . . . . . . . . . . . . . . . . . . . . . 375Conflict of interest . . . . . . . . . . . . . . . . . . . . . . . . . . . . . . . . . . . . . . . . . . . . . . . . . . . . . . . . . . . . . . . . . . . . . . . . 375
References . . . . . . . . . . . . . . . . . . . . . . . . . . . . . . . . . . . . . . . . . . . . . . . . . . . . . . . . . . . . . . . . . . . . . . . . . . . . 375
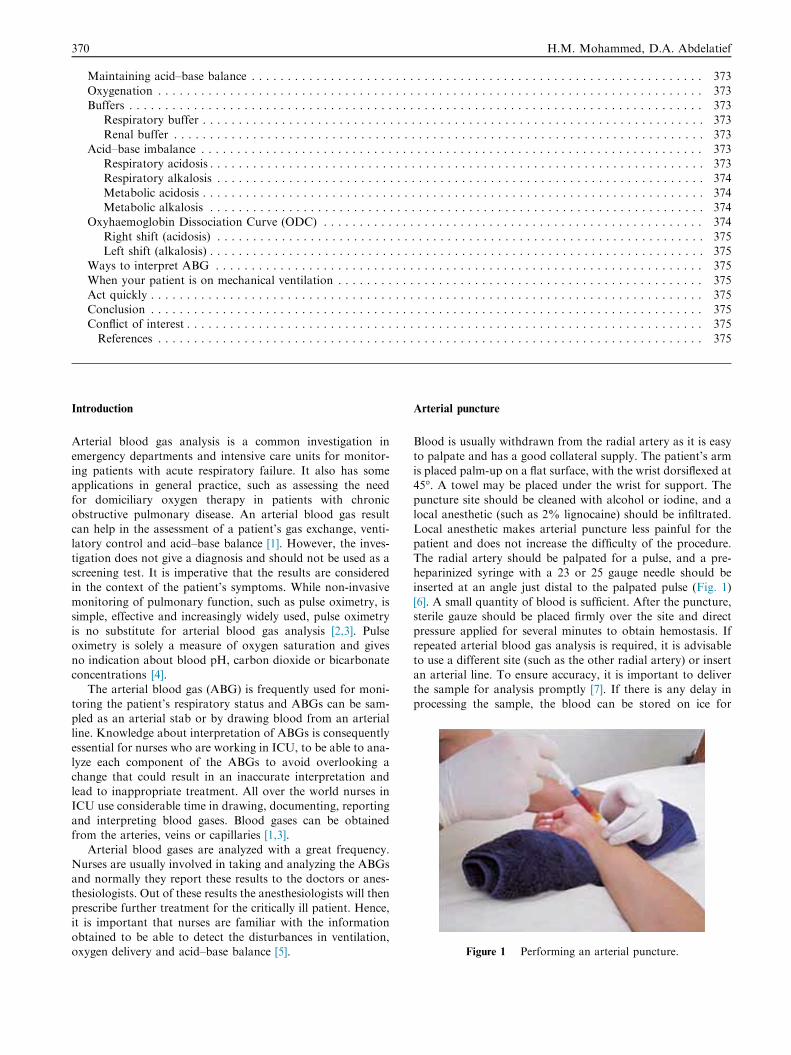
Figure 1 Performing an arterial puncture.
Introduction
Arterial blood gas analysis is a common investigation in
emergency departments and intensive care units for monitor-ing patients with acute respiratory failure. It also has someapplications in general practice, such as assessing the needfor domiciliary oxygen therapy in patients with chronic
obstructive pulmonary disease. An arterial blood gas resultcan help in the assessment of a patient’s gas exchange, venti-latory control and acid–base balance [1]. However, the inves-
tigation does not give a diagnosis and should not be used as ascreening test. It is imperative that the results are consideredin the context of the patient’s symptoms. While non-invasive
monitoring of pulmonary function, such as pulse oximetry, issimple, effective and increasingly widely used, pulse oximetryis no substitute for arterial blood gas analysis [2,3]. Pulseoximetry is solely a measure of oxygen saturation and gives
no indication about blood pH, carbon dioxide or bicarbonateconcentrations [4].
The arterial blood gas (ABG) is frequently used for moni-
toring the patient’s respiratory status and ABGs can be sam-pled as an arterial stab or by drawing blood from an arterialline. Knowledge about interpretation of ABGs is consequently
essential for nurses who are working in ICU, to be able to ana-lyze each component of the ABGs to avoid overlooking achange that could result in an inaccurate interpretation and
lead to inappropriate treatment. All over the world nurses inICU use considerable time in drawing, documenting, reportingand interpreting blood gases. Blood gases can be obtainedfrom the arteries, veins or capillaries [1,3].
Arterial blood gases are analyzed with a great frequency.Nurses are usually involved in taking and analyzing the ABGsand normally they report these results to the doctors or anes-
thesiologists. Out of these results the anesthesiologists will thenprescribe further treatment for the critically ill patient. Hence,it is important that nurses are familiar with the information
obtained to be able to detect the disturbances in ventilation,oxygen delivery and acid–base balance [5].
Arterial puncture
Blood is usually withdrawn from the radial artery as it is easy
to palpate and has a good collateral supply. The patient’s armis placed palm-up on a flat surface, with the wrist dorsiflexed at45�. A towel may be placed under the wrist for support. Thepuncture site should be cleaned with alcohol or iodine, and a
local anesthetic (such as 2% lignocaine) should be infiltrated.Local anesthetic makes arterial puncture less painful for thepatient and does not increase the difficulty of the procedure.
The radial artery should be palpated for a pulse, and a pre-heparinized syringe with a 23 or 25 gauge needle should beinserted at an angle just distal to the palpated pulse (Fig. 1)
[6]. A small quantity of blood is sufficient. After the puncture,sterile gauze should be placed firmly over the site and directpressure applied for several minutes to obtain hemostasis. Ifrepeated arterial blood gas analysis is required, it is advisable
to use a different site (such as the other radial artery) or insertan arterial line. To ensure accuracy, it is important to deliverthe sample for analysis promptly [7]. If there is any delay in
processing the sample, the blood can be stored on ice for

Table 1 Indications for arterial blood sampling/analysis.
Indications for arterial blood sampling/analysis
� Collapse of unknown cause
� Respiratory distress — hypoxia
� Titration of artificial ventilation
� Altered level of consciousness
� Poisons/toxin ingestion
� Metabolic disorders — diabetic ketoacidosis
� Trauma — management of raised intracranial
� Pressure
� Shocked patient — sepsis, cardiogenic
� Evaluation of intervention – fluid resuscitation
� Inotropic therapy
Figure 2 The heart above shows where our subclavian central
Easy blood gas analysis 371
approximately 30 min with little effect on the accuracy of theresults. Complications of arterial puncture are infrequent.
They include prolonged bleeding, infection, thrombosis orarteriospasm [2,8].
lines sit – in the superior vena cava; it is here we can take venous
blood gases. Samples from the pulmonary artery are however,
more accurate and can only be performed if the patient has a PA
catheter.
When an ABG analysis is needed
The common indications for ABGs are included in Table 1 [4].Analysis of arterial blood can assist in the assessment of the
patient’s respiratory and metabolic systems. However, itshould not be relied on in isolation when making clinical deci-sions: a thorough systematic clinical assessment of the patient
with regular re-evaluation can be far more beneficial than theinformation obtained from a single arterial blood gas result [7].
Physiology of ABGs
The components of an ABG analysis are PaO2, SaO2, hydrogenion concentration (pH), PaCO2, HCO3
�, base excess, and serumlevels of hemoglobin, lactate, glucose and electrolytes (sodium,
potassium, calcium, and chloride). Because HCO3� and base
Table 2 Normal values and Definitions.
Name Definition
PH Refers to hydrogen ion (H+�) levels, hence the ‘H’ in pH
(deficit) or too much (excess) will tell you if the patient
about pH is that it is an INVERSE ratio, which means tha
vice versa
Acid Can give away an H+ or can separate (dissociate) hydr
positive and therefore no longer an acid
Acids are end products of metabolism and must be buff
Base Unlike Acids, bases can accept a H+ and bond with hydr
body acids.
Base excess/
base
deficit
Represents an increase or decrease in the amount of bas
HCO3� Concentration of hydrogen carbonate in blood. Used to
acid base imbalance
pCO2 Carbon dioxide partial pressure (tension). Reflects alveol
capillary membrane and ‘‘blown off”
paO2 Arterial oxygen tension. In other words how well the lun
not demand
Lactate (lactic
acid)
When cells no longer have enough O2 for ‘normal’ aero
metabolism takes over resulting in lactate production, le
Hb
(hemoglobin)
Amount of hemoglobin in blood possibly capable of car
excess both yield similar information on the status of base(alkali), I’ll only discuss HCO3
�. The parameters most fre-quently used—PaO2, SaO2, pH, PaCO2, HCO3
�, and lac-
tate—often are adequate in diagnosing and managing mostclinical situations. The normal values of ABG are discussedin Table 2 [9].
Types of blood gasses
Arterial blood gas
The arterial blood may be sampled from a single stab which
can be done from the femoral, brachial or radial artery [2,3].
Value
. H+ levels are important because a lack of
is acidotic or alkolotic. One confusing point
t the more H+ present, the lower the pH and
7.35–7.45
ogen from its ion, so the hydrogen is not
ered or excreted to achieve a normal pH
20 parts base/
1 part acid
ogen. They are all negative and like to ‘buffer’
e compared with the amount of acids present �2 to + 2 mmol/L
determine along with pH and CO2 source of 22–26 mmol/L
ar ventilation as it diffuses across the alveolar 35–45 mmHg
gs are able to pick up oxygen, i.e. supply, but 75–100 mmHg
bic metabolism (cell hypoxia) Anaerobic
ading to lactic acidosis
0.5–2.0 mmol/L
rying oxygen 135–180 g/L 7

Table 3 Arterial versus venous blood gases.
Value Arterial blood Mixed venous
pH 7.40 (7.35–7.45) 7.36 (7.31–7.41)
PaO2 80–100 mmHg 35–40 mmHg
O2 saturation 95% 70–75%
PaCO2 35–45 mmHg 41–51 mmHg
HCO3� 22–26 mEqL�1 22–26 mEqL�1
BE �2 to +2 �2 to +2
(Table adapted from [3]); O2: oxygen, PaO2: partial pressure of
oxygen in arterial blood, pH: acidity/alkalinity, PaCO2: partial
pressure of oxygen in arterial blood, HCO3�: bicarbonate in blood,
BE: base excess.
Figure 4 Visualization of pH and bicarbonate as an elevator.
372 H.M. Mohammed, D.A. Abdelatief
This stab may result in spasm, intraluminal clotting, bleedingor temporary obstruction which may influence these arteries’
blood supply. The collateral arterial blood may provide thissupply however, the brachial and femoral arteries do not haveadequate collateral supplies. Hence, the preferably arterial
puncture site is the wrist at radial artery [4].According to Coggon [4] the safest site for the arterial can-
nula is the radial artery due to the fact that the cannula can be
easily and closely observed. ABGs sampled from a permanentarterial line is yet considered painless and the simplest way inobtaining blood sample [10]. Problems may be encountered inextracting blood from the arterial line like bleeding, infection
and vessel obstruction. Blood gas sample obtained from a per-manent arterial line provides the most efficient assessment ofthe pO2 and pCO2 in the body and gives much more insight
into effective ventilation [1,5].
Venous blood gas
Venous blood gas (VBG) is sampled from the central venousline or from a venipuncture in the patients arm and is rarelyanalyzed. However, in cases like sepsis, shock, and fever con-
gestive heart failure where there is impaired circulation it isessential to assess mixed venous oxygen saturation. Mixedvenous blood is blood from all organs of the body and it isonly sampled from the pulmonary artery (Fig. 2) [11] and is
hardly ever analyzed in the ICU. The blood gas components’value from mixed venous blood and arterial blood is nearlythe same except for oxygen pressure (pO2) and saturation
(SO2). The wide range of oxygenation values between arterialand venous blood is the reason why the peripheral venousblood is never used to measure the patient’s status of oxygena-
tion, Table 3 [6].
Figure 3 Visualization of pH and pa CO2.
Capillary blood gas
Obtaining samples from the capillaries is less complicated thanfrom the veins or the arteries. In general the capillary bloodgas (CBG) will provide nearly the same results as the ABG[10]. However capillary samples give inaccurate results in cases
where there is vasoconstriction, for example in patients whoare hypothermic [9]. Blood gases sampled from the capillaryis often done in newborns and children to avoid excessive
blood loss and it is easier to obtain [12]. CBG can be takenfrom heel of the infants and from the fingertips of children.For adults, capillary blood gases can be taken from the ear-
lobes [2]. There is a major correlation in pH, pCO2, pO2, BEand HCO3 among ABG, VBG, and CBG values, except fora reduced correlation in pO2 in the presence of hypotension[1] and poor systemic perfusion. CBG can be an alternative
for ABG for gasometric evaluation for children even thoughif the patient is hypothermic or poorly perfused, as long asthe patient is not hypotensive. ABG samples drawn from a
permanent arterial line will provide the nurses with the mostreliable result of pO2 and pCO2 [13].
Basic facts to remember
1. CO2 is a respiratory component and considered a respira-tory acid. It moves opposite to the direction of pH and isvisualized as a see-saw (Fig. 3) (as paCO2 in blood
increases, pH decreases—respiratory acidosis) [4].2. Bicarbonate is a metabolic component and considered a
base. It moves in the same direction as pH and is visualized
as an elevator (Fig. 4) (as bicarbonate in blood increases,pH increases—metabolic alkalosis) [4].
3. If CO2 and HCO3� move in the same direction, it is consid-
ered a primary disorder; for example, if there is respiratoryacidosis in the body (CO2 retention), the bicarbonate levelsincrease as a compensation (metabolic alkalosis). The direc-
tions of both CO2 and HCO3� are the same in this case [6].
4. If CO2 and HCO3� move in opposite directions, it is consid-
ered a mixed disorder; for example, mixed disorder in thecase of salicylate poisoning: primary respiratory alkalosis
due to salicylate-induced hyperventilation and a primarymetabolic acidosis due to salicylate toxicity [3].
Acid–base balance
Acid–base balance is a reflection of the pH level. The pH is the
measurement of the acidity or alkalinity of any fluid and is

Table 4 Acid–base disorders.
Increased CO2 (>40 mmHg) Respiratory acidosis
Decreased CO2 (<40 mmHg) Respiratory alkalosis
Increased HCO3� (>24 mEqL/L) Metabolic alkalosis
Decreased HCO3� (<24 mEqL/L) Metabolic acidosis
Easy blood gas analysis 373
recorded on a scale from 1 (very acidic) to 14 (very alkalotic).A fluid with a pH of 7 (water) is considered neutral. The pH ofblood falls within a narrow range of 7.35–7.45. This range is
essential for the body systems to function properly. Mecha-nisms are in place to ensure that a constant state of acid–baseequilibrium exists within the blood at all times. Significant
alterations from this range can interfere with cellular function-ing and ultimately, if uncorrected, death. Therefore, it is essen-tial that nurses recognize when a patient is not able to maintain
this delicate balance, and intervene appropriately [1,7,14].
Measuring pH
To quantify the H+ concentration in blood, a simplifiedmathematical expression, called pH, is used. In health, the nor-mal range for pH is 7.35–7.45 (Box 2). PH is a negative loga-
rithm, which means that the higher the H+ concentration, thelower the pH and vice versa [5].
Maintaining acid–base balance
The three systems that regulate the acid–base balance are thebuffer system (metabolic), kidneys (metabolic) and the lungs(respiratory) [1]. The lungs regulate carbon dioxide (CO2)
and the renal system regulates bicarbonate (HCO3), one ofthe body’s buffers. Therefore, to maintain the tight balanceboth the respiratory and metabolic system work together in
an attempt to compensate for any abnormalities [11].
Oxygenation
Determination of oxygenation should be included in any phys-ical assessment. When assessing ventilation status, it is impor-tant to look at the PaO2 and SaO2 levels. The PaO2 represents
the amount of oxygen dissolved in the blood. A normal valuefor arterial blood gas is 80–100 mmHg. The SaO2 representsthe amount of oxygen bound to hemoglobin. A normal SaO2
value for arterial blood gas is 95–100%. It is also importantto note that assessment of ABGs includes determining the needfor and treatment of pulmonary disease and determining acid–base balance in a patient with heart failure, renal failure,
uncontrolled diabetes, a sleep disorder, severe infection, anddrug overdose [12].
Figure 5 The respiratory and renal systems to maintain the pH
level.
Buffers
The body has two buffer systems in place to maintain thepH level with its narrow range: the respiratory and renalsystems [4].
Respiratory buffer
A normal by-product of cellular metabolism is carbon dioxide(CO2). CO2 is carried in the blood to the lungs, where the
excess combines with water to form carbonic acid. The pHof the blood will change according to the amount of carbonicacid present. The more carbonic acid present in the blood, the
lower (more acidic) the pH level will become. In response, thelungs will either increase or decrease the rate and depth of ven-tilation until balance is restored. This process occurs within 1–
3 min in a healthy individual [1,6].
Renal buffer
The renal system acts as a buffer through its ability to excreteor retain bicarbonate (HCO3). Bicarbonate is considered alka-line and although takes a little longer than the respiratory sys-tem to respond, is considered a powerful buffer. As the blood
pH decreases (more acidic), the kidneys will compensate byretaining HCO3 and likewise, as the blood pH increases, thekidneys excrete HCO3 [11].
When the lungs and kidneys are working together, they areable to maintain the pH of the blood within its narrow rangeof 7.35–7.45. It is when one or both of these buffer systems fail
that the patient’s status is compromised reflecting in abnormalarterial blood gases. The earlier such compromise is detected,the more likely an appropriate intervention can successfully
restore equilibrium (Fig. 5) [13].
Acid–base imbalance
Respiratory acidosis
Respiratory acidosis is defined as a pH less than 7.35 with a
PaCO2 greater than 45 mmHg (Table 4) [15]. Acidosis isprimarily caused by an accumulation of CO2 through the pro-duction of carbonic acid. Any condition that results in hypoven-
tilation can cause respiratory acidosis by preventing theexhalation of CO2 [9]. These conditions include: central nervoussystem depression related to trauma, narcotics, sedatives or
anesthesia impaired respiratory muscle function related tospinal cord injury, neuromuscular disease or blocking agentspulmonary disorders such as atelectasis, pneumonia, pneumoth-
orax, embolus, pulmonary edema or obstruction hypoventila-tion related to pain, chest wall injury or abdominal distention.
If CO2 levels become extremely high, drowsiness andunresponsiveness may be noted. Increasing ventilation and

Figure 6 Oxyhaemoglobin Dissociation Curve (ODC).
374 H.M. Mohammed, D.A. Abdelatief
treatment of the underlying cause will correct respiratoryacidosis [16].
Respiratory alkalosis
Respiratory alkalosis is defined as a pH greater than 7.45 witha PaCO2 less than 35 mmHg. Any condition that causes hyper-ventilation can result in respiratory alkalosis. These conditions
include: psychological responses such as anxiety, severe stressor fear unresolved pain increased metabolic demands such asfever, sepsis, or pregnancy central nervous system lesions [1,7].
Metabolic acidosis
Metabolic acidosis is defined as a pH of less than 7.35 and a
bicarbonate level less than 22 mEq/L. It is caused by either adeficit of base in the bloodstream or an excess of acids, other
Figure 7 Stepwise approach to inte
than CO2. Causes of metabolic acidosis include: renal failure,diabetic ketoacidosis, anaerobic metabolism, starvation andsalicylate intoxication [4].
Metabolic alkalosis
Metabolic alkalosis is defined as a pH of greater than 7.45 anda bicarbonate level greater than 26 mEq/L. An excess of base
or a loss of acid within the body can lead to metabolic alkalo-sis. Causes include: protracted vomiting, aggressive gastric suc-tioning and excess administration of diuretics [11,16].
Oxyhaemoglobin Dissociation Curve (ODC)
The ODC looks at the relationship between oxygen tension
(pressure) and oxygen saturation (Fig. 6) [10]. It helps us better
rpreting ABGs starting with pH.

Easy blood gas analysis 375
understand how our blood interacts with oxygen, i.e. how andwhy it picks up and lets oxygen go.
Right shift (acidosis)
Shift of the curve to right decreases affinity-meaning that theHb is not very attracted to oxygen, and when it does pick up
oxygen, it lets it go very quickly.
Left shift (alkalosis)
Shift of the curve to the left increases affinity-meaning that theHb is very attracted to oxygen and when oxygen is picked up,the Hb has a hard time letting it go at the cellular level.
Ways to interpret ABG
It is essential that nurses thoroughly interpret each component
of the ABGs to avoid overlooking any change in the patient’srespiratory status that could lead to inappropriate or inaccu-rate treatment [16]. Below there is outlined a four step guide-line to help pediatric intensive care nurses systematically
interpret the ABG results [17].
1. Assess oxygenation, low pO2 and SO2 indicate inadequate
supply of oxygen and high pO2 and SO2 indicate adequatesupply of oxygen [4].
2. Determine the pH and any irregularity (alkalosis or acido-
sis) Fig. 7 [9]. The rate and depth of breathing can changethe pH in minutes.
3. Determine the causes of irregularity either respiratory
(irregularity of pCO2) or metabolic (irregularity of HCO3)[17].
4. Determine the compensatory mechanism for example incase of respiratory acidosis whereby there is low pH and
increased pCO2 and this is fully compensated by the kid-ney mechanism. In cases where there is metabolic acidosis,bicarbonate deficit and decreased pH, the lung compensa-
tion mechanism is used by increasing the rate and depthof respiration. For example in mechanically ventilatedpatients the respiratory rate and tidal volume are
increased [7]. In addition it is greatly important to havean idea of the full clinical history of the patient in inter-preting blood gas. For example pO2 and SO2 are relatedto the amount of oxygen administered to the patient as
well as hemoglobin concentration. Serum electrolytes areto be considered also in interpretation especially whenmaking nursing diagnosis with its correspondent nursing
treatment [18].
When your patient is on mechanical ventilation
Mechanical ventilation aims to improve oxygenation and ven-tilation. In a mechanically ventilated patient, ABGs can guide
clinicians in titrating ventilator support and weaning. Person’sminute ventilation (respiratory rate multiplied by tidal volume[VT]) controls the elimination of CO2 and, consequently,
affects the levels of PaCO2 and pH. With volume control ven-tilation, the preset respiratory rate and VT determine minute
ventilation. For pressure control ventilation, minute ventila-tion is influenced by the preset inspiratory pressure, respiratoryrate, inspiratory time, respiratory resistance, and lung compli-
ance. Pressure support ventilation increases spontaneous VTand, therefore, is commonly prescribed for synchronized inter-mittent mandatory ventilation (SIMV), pressure support venti-
lation, and other modes, to lower PaCO2 for patients who havespontaneous breaths[4,10].
ABG results should be interpreted in light of the patient’s
medical history, present health status, and medical therapies.When the patient’s PaCO2 and HCO3
� are both abnormal, thisinformation will help you determine if another abnormality isthe result of compensation or dual pathology. Remember that
full compensation or mixed respiratory and metabolic disor-ders can move pH in opposite directions, resulting in a normalPH. Assess and monitor your patient, and treat the underlying
causes of acid–base derangement as well as correcting abnor-mal parameters. Monitor your patient’s response to changesin ventilator settings and inform the healthcare provider as
necessary [15].
Act quickly
In a critical care setting, a patient’s condition can changerapidly and dramatically. Using a four-step approach toABG interpretation can identify an acid–base disorder quickly
and accurately so you can intervene appropriately. If yourpatient is mechanically ventilated, good ABG interpretationskills can guide clinicians in adjusting the ventilator settingsto meet the patient’s needs [18].
Conclusion
Measuring arterial blood gases can be a useful adjunct to theassessment of patients with either acute or chronic diseases.The results show if the patient is acidaemic or alkalaemicand whether the cause is likely to have a respiratory or meta-
bolic component. The PaCO2 reflects alveolar ventilation andthe PaO2 reflects the oxygenation of arterial blood. When com-bined with a patient’s clinical features, blood gas analysis can
facilitate diagnosis and management. All over the world nursesin ICU use considerable time in drawing, documenting, report-ing and interpreting blood gases.
Conflict of interest
There is no conflict of interest.
References
[1] A.K. Verma, R. Paul, The interpretation of arterial blood gases,
Aust. Prescriber 33 (2010) 124–129.
[2] P. Sood, G. Paul, S. Puri, Interpretation of arterial blood gas,
Indian J. Crit. Care Med. 14 (2010) 57–64.
[3] M. Asif, P.K. Sarkar, Three-digit Allen’s test, Ann. Thorac.
Surg. 84 (2007) 686–687.
[4] D.J. Malinoski, S.R. Todd, S. Slone, R.J. Mullins, M.A.
Schreiber, Correlation of central venous and arterial blood gas
measurements in mechanically ventilated trauma patients, Arch.
Surg. 140 (2005) 1122–1125.

376 H.M. Mohammed, D.A. Abdelatief
[5] P. Middleton, A.M. Kelly, J. Brown, M. Robertson, Agreement
between arterial and central venous values for pH, bicarbonate,
base excess, and lactate, Emerg. Med. J. 23 (2006) 622–624.
[6] G. Malatesha, N.K. Singh, A. Bharija, B. Rehani, A. Goel,
Comparison of arterial and venous pH, bicarbonate, pCO2 and
pO2 in initial emergency department assessment, Emerg. Med. J.
24 (2007) 569–571.
[7] J.M. Coggon, Arterial blood gas analysis. 1: understanding
ABG reports, Nurs. Times 104 (18) (2008) 28–29.
[8] M. Roman, S. Thimothee, J.E. Vidal, Arterial blood gases,
Medsurg. Nurs. 17 (4) (2008) 268–269.
[9] K. Allen, Four-step method of interpreting arterial blood gas
analysis, Nurs. Times 101 (1) (2005) 42–45.
[10] J. Dooley, A. Fegley, Laboratory monitoring of mechanical
ventilation, Crit. Care Clin. 23 (2) (2007) 135–148.
[11] F.M. Vital, H. Saconato, M.T. Ladeira, Non-invasive positive
pressure ventilation (CPAP or bilevel NPPV) for cardiogenic
pulmonary edema, Cochrane Database Syst. Rev. (3) (2008),
CD005351.
[12] L. Ruholl, Arterial blood gases: analysis and nursing responses,
Medsurg. Nurs. 15 (6) (2006) 343–350.
[13] D. Wilder, The clinical utility of lactic acid trending with ABGs
in the critical care setting: a case study, Respir. Ther. 3 (3) (2008)
30.
[14] J. Minor, E. George, Using mixed venous oxygen saturation to
improve patient assessments, Nursing 56 (1) (2008) 1–3.
[15] A.L. Byrne, M. Bennett, R. Chatterji, R. Symons, N.L. Pace, P.
S. Thomas, Peripheral venous and arterial blood gas analysis in
adults: are they comparable? A systematic review and meta-
analysis, Respirology 19 (2) (Feb. 2014) 168–175.
[16] F. Fischbach, M.B. Dunning III, A Manual of Laboratory and
Diagnostic Tests, nineth ed., Wolters Kluwer Health,
Philadelphia, 2015.
[17] M.D. Davis et al, AARC clinical practice guideline: blood gas
analysis and hemoximetry: 2013, Respir. Care 58 (10) (2013)
1694–1703, http://dx.doi.org/10.4187/respcare.02786.
[18] K.D. Pagana, T.J. Pagana, Mosby’s Manual of Diagnostic and
Laboratory Tests, fourth ed., Mosby Elsevier, St. Louis, 2010.


![Plus Size Birth: Nursing Considerations & Implications · Nursing Considerations & Implications-(1 0&/(//$1. Overview:KDW,W V/LNH7R%H3OXV6L]H 3UHJQDQW ... gain during pregnancy, testing](https://img.pdfslide.us/doc/110x75/5f910fc8f514c805f452503c/plus-size-birth-nursing-considerations-implications-nursing-considerations.jpg)