Embed Size (px)
Citation preview

Eastman Kodak Business Park
Traffic Analysis ReportMay 2017
Prepared by:

TABLE OF CONTENTS
INTRODUCTION 1
METHODOLOGY OF ANALYSIS 1
EXISTING 2017 TRAFFIC OPERATIONS 3
FUTURE TRAFFIC OPERATIONS 4
SUMMARY 7
APPENDICES
Appendix A – Concept Plans
Proposed Geometry Plans
Opinion of Probable Construction Costs
Appendix B – Level of Service Analysis Results - 2017 Existing Conditions
Appendix C – Trip Capture Estimator
Appendix D – Trip Generation Calculations
Appendix E – Trip Generation Distribution and Build Out
Appendix F – Level of Service Analysis Results – 2032 Full Build

1
Introduction
The purpose of the traffic analysis is to determine the impacts of development planned for theEastman Business Park in the City of Rochester for two different strategic sites. The proposeddevelopments can be found in Appendix A. The level of development is expected to have a trafficflow impact on the following corridors:
· Eastman Avenue from Dewey Avenue to Lake Avenue· Lake Avenue from Maplewood Drive/Eastman Avenue to Merrill Street· Lake Avenue where the new Maplewood Drive is proposed between Hanford Landing
Road East and Keehl Street
In addition to the proposed developments, roadway changes are proposed:· Maplewood Drive will be eliminated from the Lake Avenue/Eastman Avenue intersection.· Maplewood Drive will be relocated to intersect Lake Avenue in a new location, north of
Keehl Street and south of Hanford Landing Road East.· Eastman Avenue will be connected between Lake Avenue and Dewey Avenue.
The following systematic procedure was used to determine the traffic impacts:
1. Obtain Synchro traffic flow models of the intersections from the Monroe CountyDepartment of Transportation (MCDOT) for the study area.
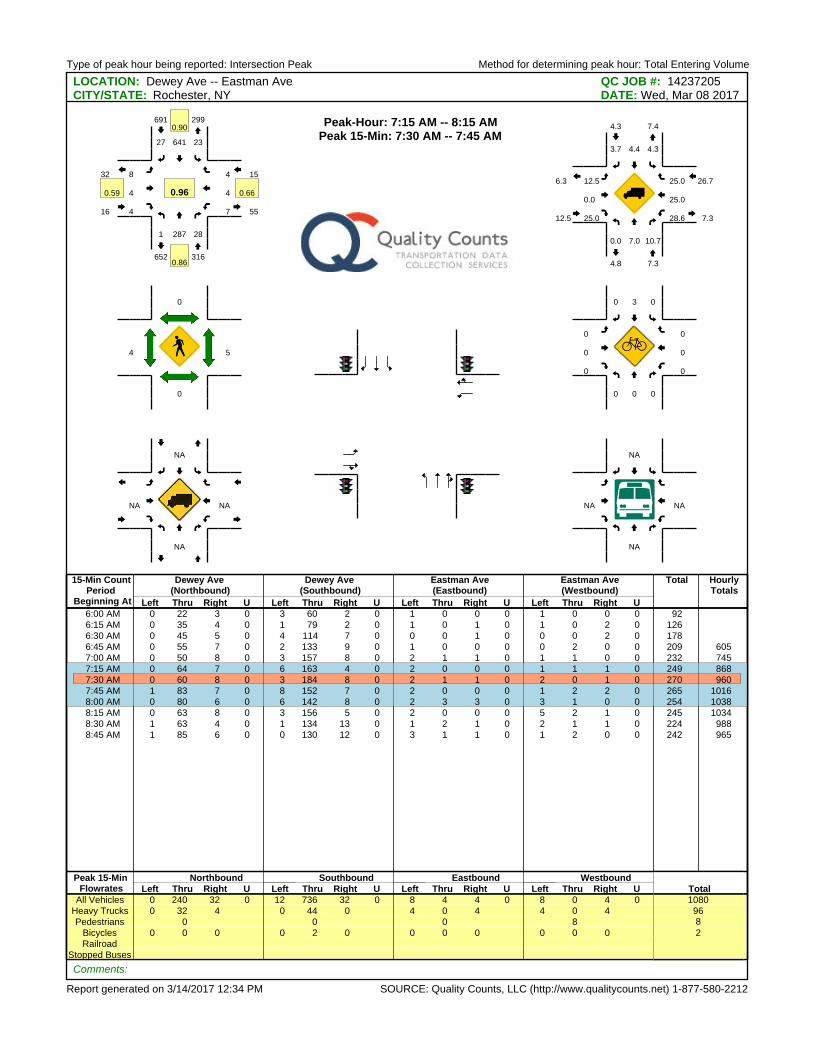
2. Obtain turning movement counts at intersections. The counts were conducted onWednesday, March 8th, 2017 between 6:00 and 9:00 for the AM and on Monday, March20th, 2017 between 3:00 and 6:00 for the PM. Determine the existing weekday AM andPM peak hour turning movements at the intersections. All turning counts for existing 2017volumes during the peak hours can be located in Appendix B.
3. Define the trips generated by the proposed developments and define trip adjustments dueto the proposed Maplewood Drive intersection.
4. Distribute the new trips through the study area.5. Estimate projected future traffic at the intersections for full build-out of the proposed
development.6. Evaluate traffic operations at the subject intersections under:
· Existing (2017) conditions· No Build (2032) conditions· Full Build (2032) conditions (with full build development traffic)
The traffic analyses and evaluations have been performed using standard traffic engineeringmethodologies in accordance with the 9th edition Institute of Transportation Engineers (ITE) TripGeneration Manual. Data used in the traffic analysis has been collected from field investigations,intersection traffic counts, build-out concept plans and the MCDOT.
Methodology of Analysis
Level of Service (LOS) analysis is a means of determining the ability of an intersection toaccommodate traffic volumes. The analysis is based on intersection street geometry, trafficcontrols and traffic maneuvers. Geometry of an intersection includes the width of each lane, thenumber of lanes for each movement (generally for left, through and right movements), and if thelane is exclusive to one movement or shared by two or more movements. The analysis producesan indication of the Level of Service at which an intersection is functioning or is expected tofunction for future conditions.
2
The Level of Service procedures are provided in the Highway Capacity Manual (HCM) publishedby the Transportation Research Board, 2010. Version 8 of Synchro was utilized to determine theLOS for the subject intersections using the Synchro 8 LOS results.
Level of Service is defined by letter characters that range from A to F, with A representing thebest traffic operating conditions that have little or no delay and F characterizing the worstconditions that have significant delay. For signalized intersections LOS A through D are usuallyconsidered acceptable. LOS E may be accepted in urban areas. LOS F operating conditions aretypically unacceptable, and improvements are needed in the form of traffic control, geometricchanges or a combination of both. For unsignalized intersections LOS A through LOS E areusually considered acceptable.
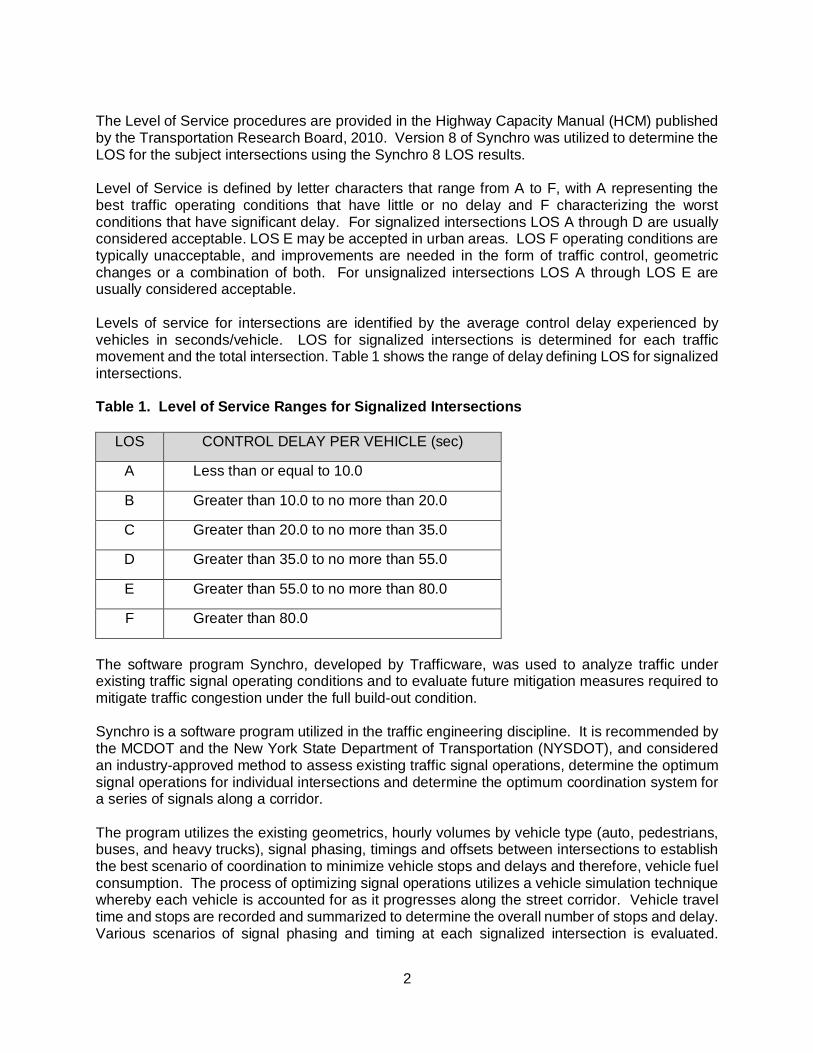
Levels of service for intersections are identified by the average control delay experienced byvehicles in seconds/vehicle. LOS for signalized intersections is determined for each trafficmovement and the total intersection. Table 1 shows the range of delay defining LOS for signalizedintersections.
Table 1. Level of Service Ranges for Signalized Intersections
LOS CONTROL DELAY PER VEHICLE (sec)
A Less than or equal to 10.0
B Greater than 10.0 to no more than 20.0
C Greater than 20.0 to no more than 35.0
D Greater than 35.0 to no more than 55.0
E Greater than 55.0 to no more than 80.0
F Greater than 80.0
The software program Synchro, developed by Trafficware, was used to analyze traffic underexisting traffic signal operating conditions and to evaluate future mitigation measures required tomitigate traffic congestion under the full build-out condition.
Synchro is a software program utilized in the traffic engineering discipline. It is recommended bythe MCDOT and the New York State Department of Transportation (NYSDOT), and consideredan industry-approved method to assess existing traffic signal operations, determine the optimumsignal operations for individual intersections and determine the optimum coordination system fora series of signals along a corridor.
The program utilizes the existing geometrics, hourly volumes by vehicle type (auto, pedestrians,buses, and heavy trucks), signal phasing, timings and offsets between intersections to establishthe best scenario of coordination to minimize vehicle stops and delays and therefore, vehicle fuelconsumption. The process of optimizing signal operations utilizes a vehicle simulation techniquewhereby each vehicle is accounted for as it progresses along the street corridor. Vehicle traveltime and stops are recorded and summarized to determine the overall number of stops and delay.Various scenarios of signal phasing and timing at each signalized intersection is evaluated.

3
Through the series of options of phasing and timing in concert with the offset of signal timingbetween each signal, the optimum signal operation is determined to best serve the road users asthey progress along the corridor. Information on the existing traffic signal timing, phasing, andcoordination was obtained from Synchro models provided by the MCDOT.
Existing (2017) Traffic Operations
Intersection turn counts were collected at the three (3) intersections listed below duringWednesday, March 8th, 2017 for the AM and on Monday, March 20th, 2017 for the PM. Recordedwas the number of vehicles making turning maneuvers from each intersection approach duringpeak weekday time periods. The turning movement counts were collected in 15-minuteincrements to determine peaking characteristics within the peak hours to be included in theanalysis. The counts were comprehensive, including pedestrians, bikes, and classifying vehiclesinto passenger cars and heavy trucks. Figure 1 shows the location of the 3 intersections, anadditional star is placed where the proposed Maplewood Dr will be located along Lake Ave.
Figure 1. Location map of study intersections

4
Intersections:· Dewey Ave and Eastman Ave· Lake Ave and Eastman Ave· Lake Ave and Merrill St· Lake Ave and Proposed Maplewood Dr
The existing traffic operations during the peak hours at the subject intersections range from LOSA to D for all traffic movements according to Synchro except for the following movements:
· The eastbound left turn movement at Lake Avenue and Merrill Street during the PMpeak, exhibiting LOS E. The LOS of the left turn movement is poor due to the amountof green time allocated for the volume of traffic and the heavy traffic on other movementsduring the same time period. This LOS E is justified due to the volumes at the othermovements. It would be unwarranted to allocate less time to other movements.
Overall intersection level of service results are provided in Table 2 and detailed LOS results foreach intersection lane are contained in Appendix B.
Table 2. Intersection Overall Levels of Service for Existing and No-Build RoadwaySystem
Intersection 2017 Existing 2032 No Build
Peak Hour Peak HourAM PM AM PM
Lake Avenue at Merrill Street A A A ALake Avenue at Eastman Avenue A C A CDewey Avenue at Eastman Avenue A A A A
Future Traffic Operations
The future traffic analysis includes the 2032 full build-out scenario referred to as “Full Build”.Appendix A contains maps of the Build Out Plan for each of the strategic sites.
To project the 2032 No Build peak hour traffic volumes (background traffic), the existing peakhour volumes were increased by 0.5% per year to account for normal traffic growth and anydevelopment outside the area of study. By reviewing 2008 traffic volumes compared to 2017 trafficvolumes the 0.5% can be determined to be reasonable.
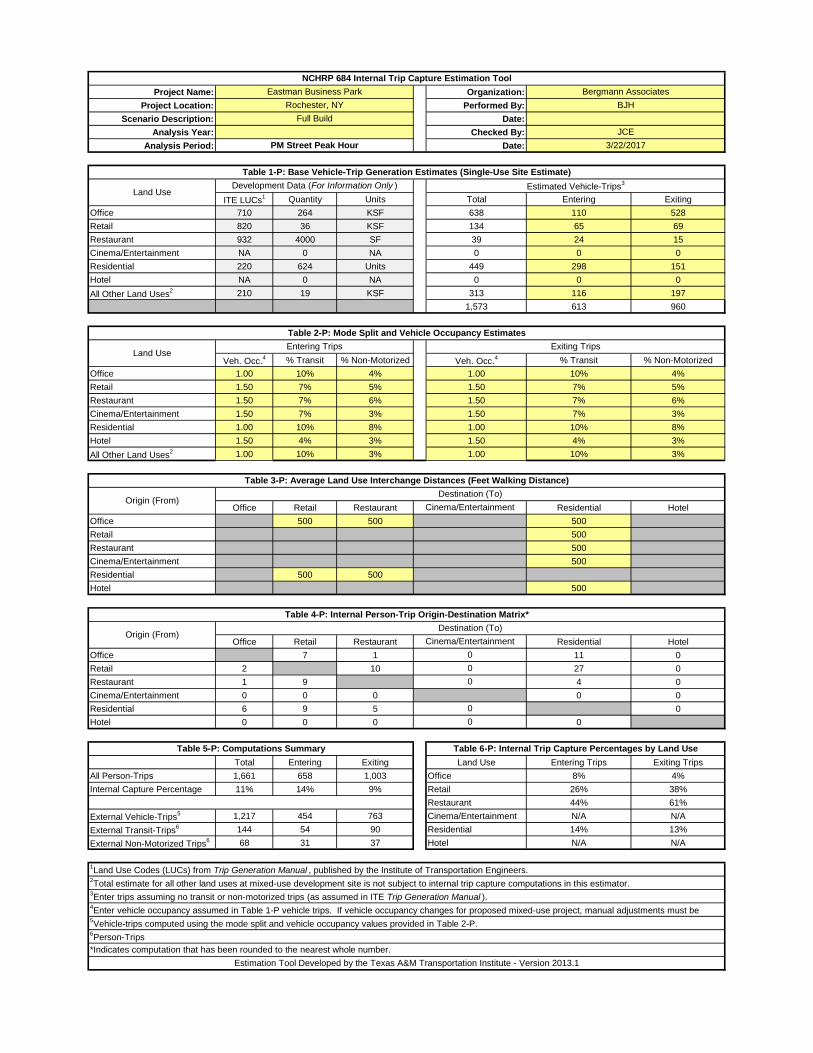
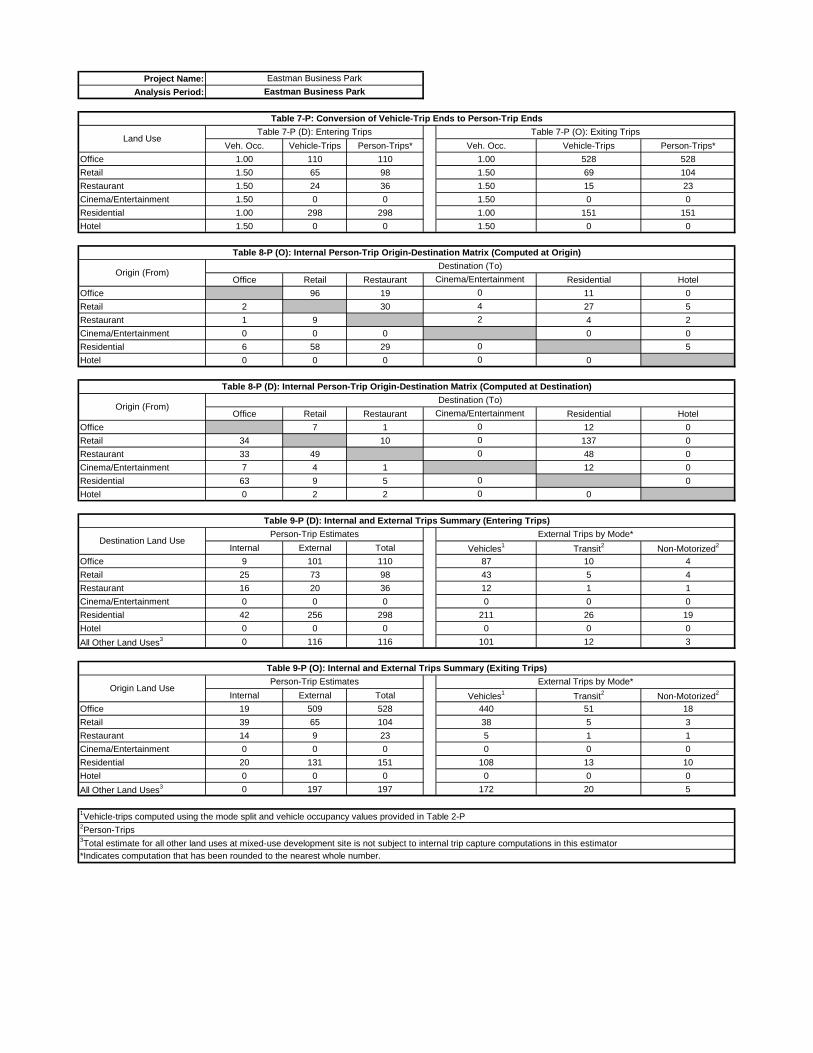
The planned development sites will offer multiple land uses that are expected to “share” apercentage of the total base number of vehicle-trips between uses due to the urban setting of thedevelopment area. The Internal Trip Capture Estimation Tool from the National CooperativeHighway Research Program (NCHRP) Report 684 was used to determine trip sharing credit byland use and also the mode split of trips by land use. This analysis is shown in Appendix C. Abase transit trip percentage of 4%, 7%, or 10% was used due to the proximity of the developmentarea to bus routes. The base non-motorized trip percentage was determined for each land useseparately as residential developments are expected to draw a greater percentage of this modetype relative to office. Appendix D provides the vehicle trip generation analysis. Appendix Eincludes the trip distribution percentages and the calculation of the build trips. Appendix E shows

5
the expected adjustments to intersection turning movements due to the planned realignment ofMaplewood Drive.
The vehicle traffic volumes for the Full Build condition were determined by adding the No Buildtraffic to the traffic expected from build-out of all the proposed sites. This was accomplished byanalyzing the full build-out plan to estimate the trip generation for each proposed site andassigning the trips to the future roadway system based on existing and expected travel patternsboth inside and outside the study area. Then the trips for each site were superimposed on top ofthe background traffic. The 9th edition of the Institute of Transportation Engineers (ITE) TripGeneration Manual (latest edition - 2012) was used to determine the trip estimate for the proposedsites. Calculations for the trip generation can be found in Appendix D. The next step was to assignthe trips to the study area street network based on the distribution shown in Appendix E,developed using existing and expected future traffic patterns for this area of the City.
2032 No Build
The projected 2032 No Build traffic operations during the peak hours at the subject intersectionsrange from LOS A to D for all traffic movements according to Synchro except for the followingmovements:
· The eastbound left turn movement at Lake Avenue and Merrill Street during the PMpeak, exhibiting LOS E. The LOS of the left turn movement is poor due to the amountof green time allocated for the volume of traffic and the heavy traffic on other movementsduring the same time period. This LOS E is justified due to the volumes at the othermovements. It would be unwarranted to allocate less time to other movements.
· The westbound left/through movement at Lake Avenue and EastmanAvenue/Maplewood Drive during the PM peak, exhibiting LOS E. The LOS of theleft/through movement is poor due to the amount of green time allocated for the volumeof traffic and the heavy traffic on other movements during the same time period.
The LOS are very similar to existing conditions and represent conditions expected in 2032 withno build-out of the proposed sites included and no change to the roadway system. Overallintersection level of service results are provided in Table 2 and detailed LOS results for eachintersection lane are contained in Appendix B.
2032 Full Build
The projected 2032 Full Build traffic operations during the peak hours at the subject intersectionsrange from LOS A to D for all traffic movements according to Synchro except for the followingmovements and include proposed changes identified in proposed geometry stated below:
· The eastbound left turn movement at Lake Avenue and Merrill Street during the PMpeak, exhibiting LOS E. The LOS of the left turn movement is poor due to the amountof green time allocated for the volume of traffic and the heavy traffic on other movementsduring the same time period. This LOS E is justified due to the volumes at the othermovements. It would be unwarranted to allocate less time to other movements.
· The eastbound left turn movement at Lake Avenue and Eastman Avenue during thePM peak, exhibiting LOS E. The LOS of the left turn movement is poor due to the amountof green time allocated for the volume of traffic and the heavy traffic on other movementsduring the same time period. This LOS E is justified due to the volumes at the othermovements. It would be unwarranted to allocate less time to other movements.

6
Overall intersection level of service results are provided in Table 4 and detailed LOS results foreach intersection lane are contained in Appendix F. All detailed Synchro 8 reports for existing, nobuild, and full build are located in Appendix G.
Table 4. 2032 Overall Intersection Full Build Levels of Service
Intersection 2032 BuildPeak Hour
AM PMLake Avenue at Merrill Street B ALake Avenue at Eastman Avenue B ADewey Avenue at Eastman Avenue A ALake Avenue at Maplewood Dr B C
Proposed Geometry
The geometry was determined using capacity analysis and existing roadway conditions.
The recommended geometry for the proposed realigned Maplewood Drive and newintersection at Lake Avenue is:
· Eastbound Approach: none.· Westbound Approach: 1 left turn lane, 2 right turn lanes with storage length of 350 feet· Northbound Approach: 1 through lane, 1 shared through/right lane, 6 foot bike lane· Southbound Approach: 1 left turn lane with storage length of 530 feet, 2 through lanes, 6
foot bike lane
The recommended geometry for the reconfigured Lake Avenue at Eastman Avenue intersectionis:
· Eastbound Approach: Left turn lane with storage length of 100 feet, right turn lane, nothrough lanes
· Westbound: No approach, this is eliminated with Maplewood realignment.· Northbound: Left turn lane with storage length of 225 feet, 2 through lanes, no right turn
lane, 6 foot bike lane· Southbound: 1 through lane, 1 shared through/right lane, no left turn lane, 6 foot bike
lane
The recommended geometry for the proposed Eastman Avenue extension from Lake Avenue toDewey Avenue is:
· Construct and mark a Two Way Left Turn Lane (TWLTL) from Goodwill Street to LakeAvenue. This is recommended to accommodate left turning vehicles into the side streetsand numerous driveways entrance/ exits. This will help to facilitate through traffic andenhance safety for entering and exiting traffic. Existing geometry and lanes aremaintained at the Lake Ave/ Eastman Ave Intersection and from Goodwill Street toDewey Avenue.
· Install 6 foot bicycle lanes eastbound and westbound

7
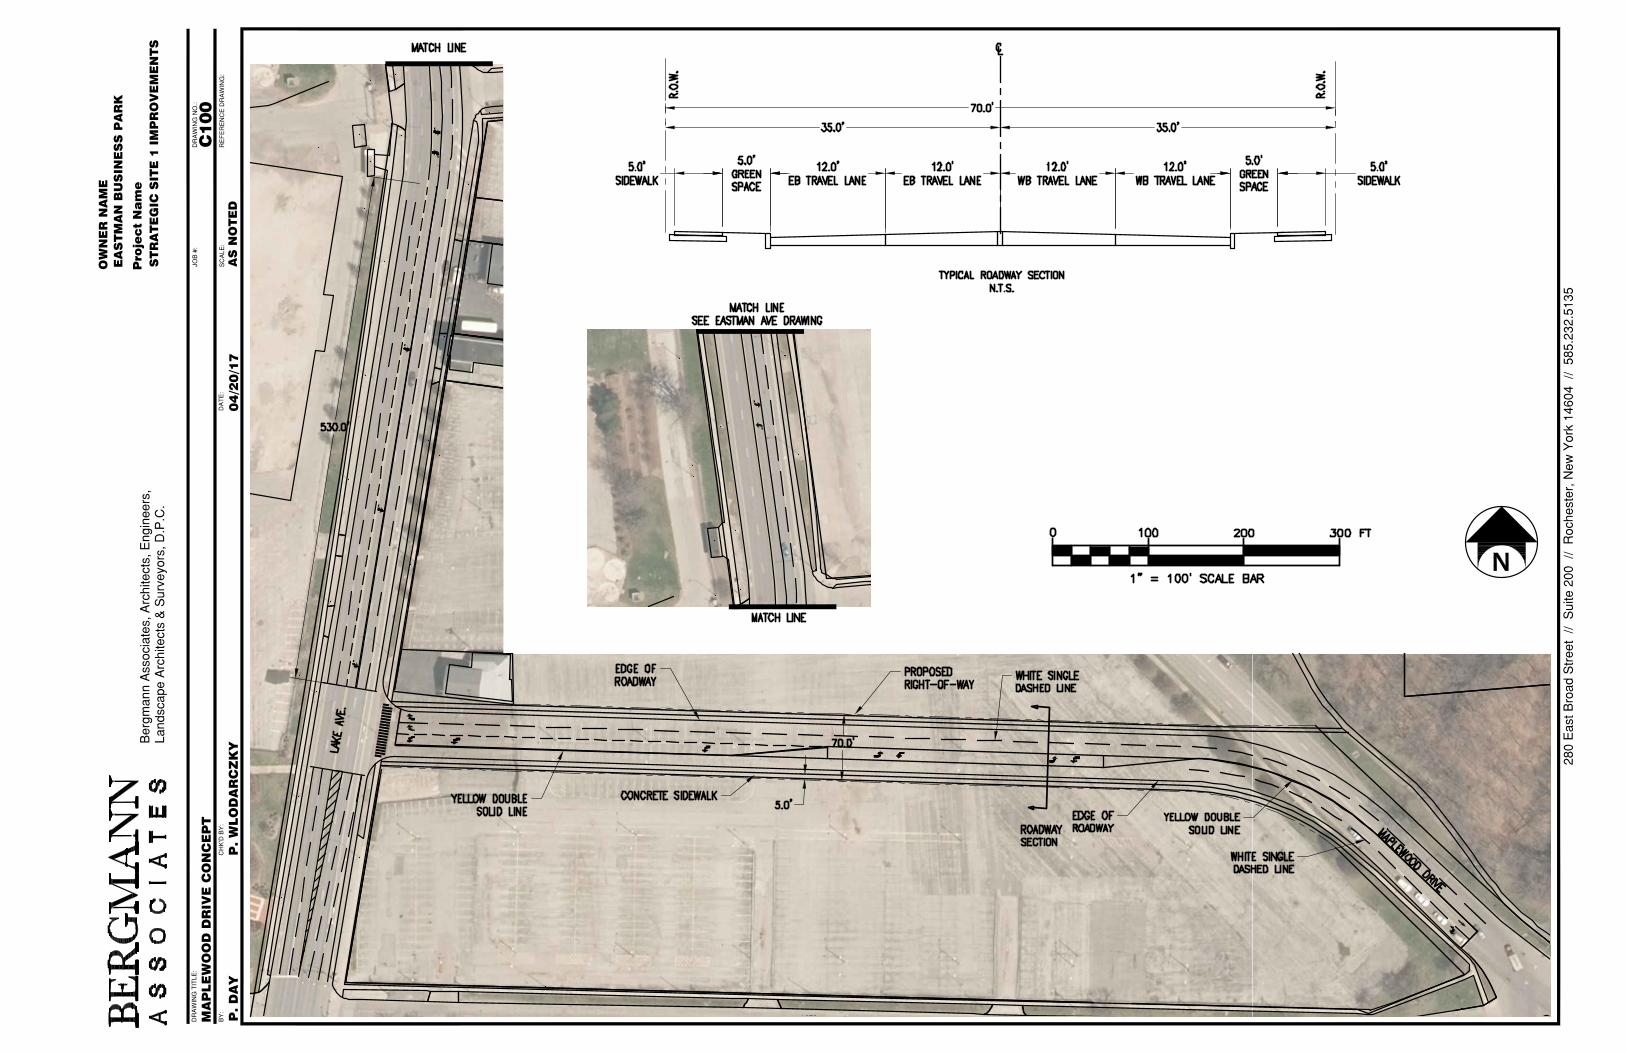
Appendix A contains the plans for the proposed geometry for the realigned Maplewood Drive, for theopening of Eastman Avenue to through traffic and for the reconfiguration of the intersection of Lake Aveat Eastman Avenue. The plans assume a full depth construction for Maplewood Drive and EastmanAvenue. Realigned Maplewood Drive will maintain the exiting four lanes section for the entire realignedlength. The lanes will be marked according to the needed turning lane use. Eastman Avenue willmaintain three lanes the entire length. The removal of the abandoned portion of Maplewood Drive isincluded in the development of that area according to the Master Plan.
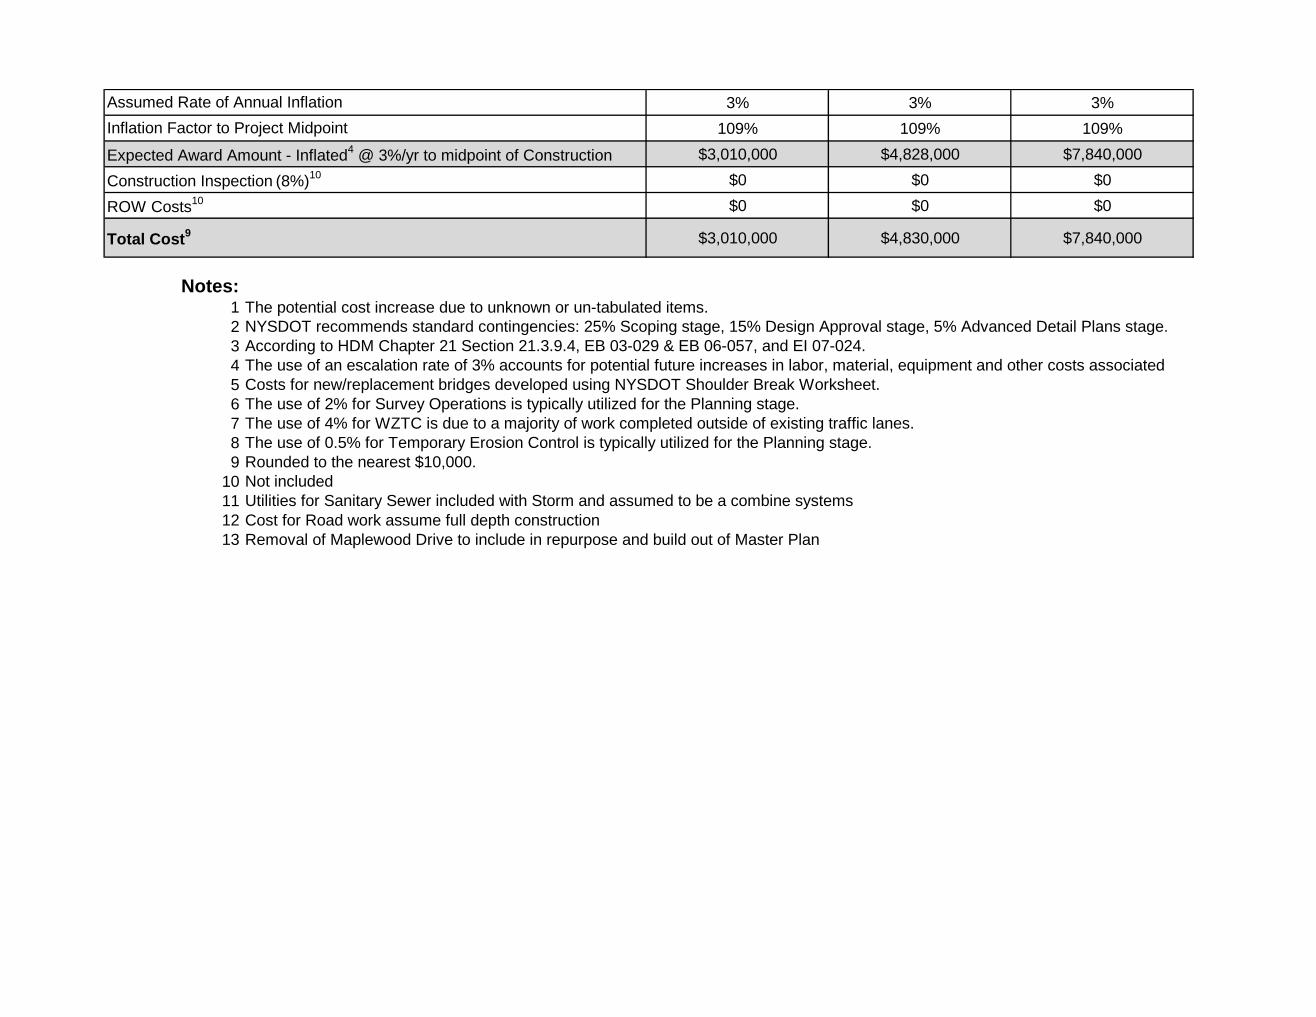
Appendix A includes an opinion of probable construction cost. The opinion of probable constructioncost includes providing new utilities in the Right-of-Way. The cost for Sanitary Sewer is included withthe Storm Sewer system as the City of Rochester maintains a combine system. New water mains areincluded to provide fire protection and new service to the buildable area off the new streets.
Summary
There are proposed developments and roadway changes to the Eastman Business Park and surroundingstreets. Based on analysis using trip generation and Synchro 8 the area could be analyzed under full buildconditions. The proposed development, as well as the proposed geometry changes will have an effect onthe traffic at the analyzed intersections, but the intersections analyzed will all have an appropriate levelof service though even at Full Build conditions of the Master Plan.
The purpose of the traffic analysis is to determine the impacts of development planned for the EastmanBusiness Park in the City of Rochester for two different strategic sites. The proposed developments canbe found in Appendix A. In addition to the proposed developments, roadway changes are proposed andcan be found in Appendix A:
· Maplewood Drive will be eliminated from the Lake Avenue/Eastman Avenue intersection.· Maplewood Drive will be relocated to intersect Lake Avenue in a new location, north of Keehl
Street and south of Hanford Landing Road East.· Eastman Avenue will be connected between Lake Avenue and Dewey Avenue.
The existing traffic operations during the peak hours at the subject intersections range from LOS A to Dfor all traffic movements according to Synchro except for the following movements:
· The eastbound left turn movement at Lake Avenue and Merrill Street during the PM peak,exhibiting LOS E. The LOS of the left turn movement is poor due to the amount of green timeallocated for the volume of traffic and the heavy traffic on other movements during the sametime period. This LOS E is justified due to the volumes at the other movements. It would beunwarranted to allocate less time to other movements.
The future traffic analysis includes the 2032 full build-out scenario referred to as “Full Build”. Appendix Acontains maps of the Build Out Plan for each of the strategic sites. The planned development sites willoffer multiple land uses that are expected to “share” a percentage of the total base number of vehicle-trips between uses due to the urban setting of the development area. The Internal Trip CaptureEstimation Tool from the National Cooperative Highway Research Program (NCHRP) Report 684 was usedto determine trip sharing credit by land use and also the mode split of trips by land use. This analysis isshown in Appendix C. Trip Generation Calculations can be found in Appendix D. Trip Distribution can befound in Appendix E and was developed using existing and expected traffic patterns for this area of theCity.

8
The projected 2032 Full Build traffic operations during the peak hours at the subject intersections rangefrom LOS A to D for all traffic movements according to Synchro except for the following movements andinclude proposed changes identified in proposed geometry stated below:
· The eastbound left turn movement at Lake Avenue and Merrill Street during the PM peak,exhibiting LOS E. The LOS of the left turn movement is poor due to the amount of green timeallocated for the volume of traffic and the heavy traffic on other movements during the sametime period. This LOS E is justified due to the volumes at the other movements. It would beunwarranted to allocate less time to other movements.
· The eastbound left turn movement at Lake Avenue and Eastman Avenue during the PM peak,exhibiting LOS E. The LOS of the left turn movement is poor due to the amount of green timeallocated for the volume of traffic and the heavy traffic on other movements during the sametime period. This LOS E is justified due to the volumes at the other movements. It would beunwarranted to allocate less time to other movements.
The geometry for the proposed full build conditions was determined using capacity analysis and existingroadway conditions. The major changes occurred at the new Maplewood Drive intersection as well as atthe intersection of Lake Avenue and Eastman Avenue. The new Maplewood Drive westbound approachwill have three lanes. There will need to be a left turn storage lane on the Lake Avenue southboundapproach at Maplewood Drive as well. There will no longer be a westbound approach at the intersectionof Lake Avenue and Eastman Avenue. There will need to be a left turn lane northbound at thisintersection. On Eastman Avenue an extension connecting Lake Avenue and Dewey Avenue is proposed.This will have a Two Way Left Turn Lane from Goodwill Street to Lake Avenue to accommodate leftturning vehicles into the side streets and numerous driveways entrance/exits.
Appendix A
Concept Plans
Proposed Geometry Plans
Opinion of Probably Costs

Ridge Road
Redwood Road
Eastman Ave
B-59B-42
B-35
B-6
B-47
B-7B-14
B-31B-8B-66
B-56
B-61
B-18
B-40
B-48
B-87B-82
B-81
Woo
dside
St.
Good
will S
t.
Maplewood Park
Genesee River
Lake
Ave
2000 100 400 600
Strategic Site 2 - Eastman Business Park Middle|Existing Conditions
B-28
B-30
B-29
B-38
B-12
B-26B-1
January, 2017
LegendStrategic Site 2 Boundary

Strategic Site 1- Eastman Business Park East| Full Build Out2000 100 400 600
Ridge Road
Redwood Road
Maplewood Park
Genesee River
Lake
Ave
Key
1
5
55
6
6
7
8
9
9
10
10
11
12
13
14
15 3
3
3
2
4
1. Mixed Use Development | Retail, Office & Residential2. Residential With Surface Lot Parking3. Residential with Structured Garage4. Surface Parking5. Pedestrian Connections6. Park and Open Space 7. Gateway Building | Experiential Center8. Focal Feature9. Office10. Mixed Use | Office & Residential11. Residential with Structured Parking12. Parking Structure13. Co-op Facility14. Theatre on The Ridge Improvements 15. Lake Ave to Theatre Pedestrian
Maplewood Drive(Relocated)
B-28
B-30
B-29
B-38
B-12
B-26B-1
Maplew
ood Drive
January, 2017
+\- 38 SPACES
+\- 50 SPACES
+\- 24SPACES
+\- 135SPACES+\- 55
SPACES
+\- 505SPACES
+\- 378SPACES
Keehl Street
Hanford Landing Road E
Strategic Site 1 Boundary

Strategic Site 2 - Eastman Business Park Middle| Full Build Out
2000 100 400 600
Ridge Road
Redwood Road
Eastman Ave
B-59
B-6
B-47
+\- 264 SPACES
Strategic Site 1 Immprovments
+\- 318 SPACES
+\- 111 SPACES
+\- 111 SPACES
+\- 21 AC
+\- 8 AC
+\- 7 AC
+\- 15 AC
+\- 9 AC
+\- 32SPACES
+\- 144 SPACES
+\- 118SPACES
B-7B-14
B-31B-8B-66
B-56
B-61
B-18
B-40
B-48
B-87B-82
B-81
Woo
dside
St.
Good
will S
t.
Maplewood Park
Genesee River
Lake
Ave
Key1. +/- 40,000 SF Building (Energy
Storage/Flex Space / Photonics)2. +/- 35,00 SF Building (Energy
Storage/Flex Space / Photonics)3. +/- 105,000 SF Building (Energy
Storage / Roll to Roll Manufacturing 4. Multi-Family Residential5. Single-Family Residential6. Trail / Buffer7. Mixed-Use Development8. +/- 233,000 SF Building (Potential
Kodak Alaris Site 350 Parking Spaces)9. Open Eastman Ave10. FLCC Workforce Development Facility
Fence Line
1 1
11
2
3
10
44
4
5
5
5
6
6
6
6
7
8
9 9
January, 2017
B-28
B-30
B-29
B-38
B-12
B-26B-1
Strategic Site 2 Boundary
AS
NO
TE
D
Pro
ject
Na
me
OW
NE
R N
AM
E
P.
DA
Y
MA
PLE
WO
OD
DR
IVE
CO
NC
EP
T
P.
WLO
DA
RC
ZK
Y04/2
0/1
7
C100
ST
RA
TE
GIC
SIT
E 1
IM
PR
OV
EM
EN
TS
EA
ST
MA
N B
US
INE
SS
PA
RK

AS
NO
TE
D
Pro
ject
Na
me
OW
NE
R N
AM
E
P.
DA
Y
EA
ST
MA
N A
VE
CO
NC
EP
T
P.
WLO
DA
RC
ZK
Y04/1
9/1
7
C100
ST
RA
TE
GIC
SIT
E 1
IM
PR
OV
EM
EN
TS
EA
ST
MA
N B
US
INE
SS
PA
RK

Eastman Business Park
Reconstruction of Maplewood and Eastman Ave.By: P. Wlodarczyk
Preliminary Cost Estimate Date: May 1, 2017
Bridge5 $0 $0 $0
Highway $1,780,000 $2,870,000 $4,650,000
$0 $0 $0
$25,000 $25,000 $50,000
$0 $0 $0
$1,805,000 $2,895,000 $4,700,000
$36,000 $58,000 $94,000
$72,000 $116,000 $188,000
$9,000 $14,000 $24,000
$1,922,000 $3,083,000 $5,006,000
$96,000 $154,000 $250,000
$2,018,000 $3,237,000 $5,256,000
$505,000 $809,000 $1,314,000
$2,523,000 $4,046,000 $6,570,000
$126,000 $202,000 $329,000
$2,649,000 $4,248,000 $6,899,000
$106,000 $170,000 $276,000
$2,755,000 $4,418,000 $7,175,000
2017 2017 2017
2019 2019 2018
18 18 18
2020 2020 2020
Total
(both roads)
Subtotal (2017)
Mobilization (4%)
Stormwater Pollution Discharge Elimination System (SPDES)
Wetland and Stream Mitigation
Eastman Ave
Subtotal (2017)
Subtotal (2017)
Construction
Activities Maplewood Ave
Work Zone Traffic Control7 (4%)
ITS (Improvements Outside of Project area)
Survey Operations6 (2%)
Subtotal (2017)
Subtotal (2017)
Potential Field Change Order3
Temporary Erosion Control8 (0.5%)
Subtotal (2017)
Incidentals1 (5%)
Contingencies2 (25% @ Scoping)
Year of Estimate
Anticipated Start of Construction
Anticipated Construction Duration (months)
Anticipated Construction Midpoint
3% 3% 3%
109% 109% 109%
$3,010,000 $4,828,000 $7,840,000
$0 $0 $0
$0 $0 $0
$3,010,000 $4,830,000 $7,840,000
Notes:1
2
3
4
5
6
7
8
9
10
11 Utilities for Sanitary Sewer included with Storm and assumed to be a combine systems
12 Cost for Road work assume full depth construction
13 Removal of Maplewood Drive to include in repurpose and build out of Master Plan
Not included
The use of 4% for WZTC is due to a majority of work completed outside of existing traffic lanes.
The use of 0.5% for Temporary Erosion Control is typically utilized for the Planning stage.
Rounded to the nearest $10,000.
NYSDOT recommends standard contingencies: 25% Scoping stage, 15% Design Approval stage, 5% Advanced Detail Plans stage.
According to HDM Chapter 21 Section 21.3.9.4, EB 03-029 & EB 06-057, and EI 07-024.
The use of an escalation rate of 3% accounts for potential future increases in labor, material, equipment and other costs associated
Costs for new/replacement bridges developed using NYSDOT Shoulder Break Worksheet.
The use of 2% for Survey Operations is typically utilized for the Planning stage.
The potential cost increase due to unknown or un-tabulated items.
Total Cost9
Assumed Rate of Annual Inflation
Inflation Factor to Project Midpoint
Expected Award Amount - Inflated4 @ 3%/yr to midpoint of Construction
Construction Inspection (8%)
10
ROW Costs10

Eastman Business Park
Reconstruction / Re-alignment of Maplewood AveBy: P.Wlodarczyk
Date: May 1, 2017
Item Description Unit QuantityUnit Price
(2017 $)Cost
Clearing and Grubbing LS 1 $5,000 $5,000
Pavement Reconstruction (including excavation, subbase and sawcutting) - Area obtained from CAD SY 6,050 $100 $605,000
Embankment - Assumed LS 1 $10,000 $10,000
Miscellaneous Excavation - Assumed SY 1 $15,000 $15,000
Stone Curbing (including sawcutting and excavation) - Length measured in CAD. FT 2,200 $35 $77,000
Underdrain - Assumed same as curbing FT 2,200 $10 $22,000
Concrete Sidewalk (including excavation, subbase and detectable warning surfaces) - Assumed area SY 2,450 $75 $183,750
Topsoiling and Seeding - Area obtained from CAD SY 1,800 $12 $21,600
Tree Plantings - Assumed EA 40 $600 $24,000
Street Lighting LF 2,000 $140 $280,000
Pavement Markings - Assumed FT 5,000 $2 $10,000
Pavement Marking Symbols - Assumed EA 15 $200 $3,000
Traffic Signal (at Lake Ave including removal of signal at Keehl St LS 1 $200,000 $200,000
Water Main LF 1,100 $220 $242,000
Drainage Structures - Assume DS's every 200' (including incidentals - excavation, trenching, pipe, bedding, backfill) EA 10 $8,000 $80,000
Street Aesthetics - (including incidentals - excavation, trenching, conduit, wiring, pullboxes, tree, shrubs etc.) LF 0 $300 $0
$1,778,350
$1,780,000
Planning Level Construction Cost Estimate
TOTAL
SAY

Eastman Business Park
Reconstruction of Eastman AveBy: P. Wlodarczyk
Date: May 1, 2017
Item Description Unit QuantityUnit Price
(2017 $)Cost
Clearing and Grubbing LS 1 $5,000 $5,000
Pavement Reconstruction (including excavation, subbase and sawcutting) - Area obtained from CAD SY 10,775 $100 $1,077,500
Embankment - Assumed LS 1 $10,000 $10,000
Miscellaneous Excavation - Assumed LS 1 $15,000 $15,000
Stone Curbing (including sawcutting and excavation) - Length measured in CAD. FT 4,500 $35 $157,500
Underdrain - Assumed same as curbing FT 4,500 $10 $45,000
Concrete Sidewalk (including excavation, subbase and detectable warning surfaces) - Assumed area SY 920 $50 $46,000
Topsoiling and Seeding - Area obtained from CAD SY 4,000 $12 $48,000
Tree Plantings - Assumed EA 100 $600 $60,000
Street Lighting LF 4,500 $140 $630,000
Pavement Markings - Assumed FT 13,500 $2 $27,000
Pavement Marking Symbols - Assumed EA 40 $300 $12,000
Miscellaneous Landscaping - Assumed Cost LS 0 $50,000 $0
Drainage Structures - Assume 2 DS's on every approach leg (including incidentals - excavation, trenching, pipe, bedding, backfill) EA 30 $8,000 $240,000
Water Main LF 2,250 $220 $495,000
Replace Traffic Signal LS 0 $160,000 $0
Street Aesthetics - (including incidentals - excavation, trenching, conduit, wiring, pullboxes, tree, shrubs etc.) LF 0 $300 $0
$2,868,000
$2,870,000
Planning Level Construction Cost Estimate
TOTAL
SAY

Appendix B
Detailed Level of Service Analysis Results
2017 Existing Conditions

DEFINITION OF LEVEL OF SERVICE FOR
SIGNALIZED INTERSECTIONS
Level of service for signalized intersections is defined in terms of delay, which is a measure of driver discomfort, frustration, fuel consumption, and lost travel time. The delay experienced by a motorist is made up of a number of factors that relate to control, geometrics, traffic, and incidents. Total delay is the difference between the travel time actually experienced and the reference travel time that would result during ideal conditions: in the absence of traffic control, in the absence of geometric delay, in the absence of any incidents and when there are no other vehicles on the road. Only the portion of total delay attributed to the control facility is quantified. This delay is called control delay. Control delay includes initial deceleration delay, queue move-up time, stopped delay, and final acceleration delay.
Specifically, LOS criteria for traffic signals are stated in terms of the average control delay per vehicle, typically for a 15-minute analysis period. The criteria are given in the following table. Delay is a complex measure and is dependent on a number of variables, including the quality of progression, the cycle length, the green ratio, and the v/c ratio for the lane group in question.
LEVEL OF SERVICE CONTROL DELAY PER VEHICLE (sec)
A Less than or equal to 10.0
B Greater than 10.0 to no more than 20.0
C Greater than 20.0 to no more than 35.0
D Greater than 35.0 to no more than 55.0
E Greater than 55.0 to no more than 80.0
F Greater than 80.0
Level of Service A describes operations with very low control delay, up to 10 seconds per vehicle. This level of service occurs when progression is extremely favorable and most vehicles arrive during the green phase. Most vehicles do not stop at all. Short cycle lengths may also contribute to low delay.
Level of Service B describes operations with control delay greater than 10 and up to 20 seconds per vehicle. This level generally occurs with good progression, short cycle lengths, or both. More vehicles stop than with LOS A, causing higher levels of average delay.
Level of Service C describes operations with control delay greater than 20 and up to 35 seconds per vehicle. These higher delays may result from fair progression, longer cycle lengths, or both. Individual cycle failures may begin to appear at this level. The number of vehicles stopping is significant at this level, though many still pass through the intersection without stopping.

Level of Service D describes operations with control delay greater than 35 and up to 55 seconds per vehicle. At level D, the influence of congestion becomes more noticeable. Longer delays may result from some combination of unfavorable progression, long cycle lengths, or high v/c ratios. Many vehicles stop, and the proportion of vehicles not stopping declines. Individual cycle failures are noticeable.
Level of Service E describes operations with control delay greater than 55 and up to 80 seconds per vehicle. This level is considered by many agencies to be the limit of acceptable delay. These high delay values generally indicate poor progression, long cycle lengths, and high v/c ratios. Individual cycle failures are frequent occurrences.
Level of Service F describes operations with control delay in excess of 80 seconds per vehicle. This level, considered to be unacceptable to most drivers, often occurs with oversaturation, that is, when arrival flow rates exceed the capacity of the intersection. It may also occur at high v/c ratios below 1.0 with many individual cycle failures. Poor progression and long cycle lengths may also be major contributing factors to such delay levels.

DEFINITION OF LEVEL OF SERVICE FOR
UNSIGNALIZED INTERSECTIONS
The level of service for a Two-Way-Stop-Control (TWSC) intersection is determined by the computed or measured control delay and is defined for each minor movement. Level of service is not defined for the intersection as a whole. LOS criteria are given in the accompanying table.
LEVEL OF SERVICE CONTROL DELAY PER VEHICLE (sec)
A Less than or equal to 10.0 B Greater than 10.0 to no more than 15.0 C Greater than 15.0 to no more than 25.0 D Greater than 25.0 to no more than 35.0 E Greater than 35.0 to no more than 50.0 F Greater than 50.0
The LOS criteria for TWSC intersections are somewhat different than the criteria used for signalized intersections. The primary reason for this difference is that drivers expect different levels of performance from different kinds of transportation facilities. The expectation is that a signalized intersection would be designed to carry higher traffic volumes than an unsignalized intersection. In addition, a number of driver behavior considerations combine to make delays at signalized intersections less onerous than delays at unsignalized intersections. Also, there is often much more variability in the amount of delay experienced by individual drivers at an unsignalized intersection versus that at signalized intersections. For these reasons, it is considered that the control delay threshold for any given level of service would be less for an unsignalized intersection than it would be for a signalized intersection.
The delay experienced by a motorist is made up of a number of factors that relate to control, geometrics, traffic, and incidents. Total delay is the difference between the travel time actually experienced and the reference travel time that would result during conditions with ideal geometrics and in the absence of incidents, control and traffic. This delay is called control delay. Control delay includes initial deceleration delay, queue move-up time, stopped delay, and final acceleration delay.
In the performance evaluation of TWSC intersections, it is important to consider other measures of effectiveness (MOE’s) in addition to delay, such as v/c ratios for individual movements, average queue lengths, and 95th percentile queue lengths. By focusing on a single MOE for the worst movement only, such as delay for the minor-street left turn, inappropriate traffic control decisions may be made.

2017 Existing Conditions

PAGE 1
PEAK HOUR LEVELS OF SERVICE (Synchro 8)
Intersection Approach 2017 Existing 2032 No Build
AM Peak Hour PM Peak Hr AM Peak Hour PM Peak Hr
LOS Control Delay
(sec/veh) LOS
Control Delay
(sec/veh) LOS
Control Delay
(sec/veh) LOS
Control Delay
(sec/veh)
Lake Avenue at Merill
Eastbound Left D 55.0 E 62.4 D 55.0 E 63.2 Merill Street Eastbound TR C 23.7 C 28.4 C 23.7 C 28.5 Eastbound Approach C 25.5 D 28.4 C 25.6 D 37.8
Driveway Westbound LTR D 51.0 D 49.9 D 52.0 D 47.9
Signalized Westbound Approach D 51.0 D 49.9 D 52.0 D 47.9
Lake Ave Northbound Left A 4.1 A 1.5 A 4.4 A 1.5
Northbound T TR A 3.6 A 1.6 A 3.5 A 1.5 Northbound Approach A 3.7 A 1.6 A 3.6 A 1.5
Lake Ave Southbound Left A 5.3 A 0.0 A 5.8 A 0.0
Southbound T TR A 8.4 B 10.7 A 9.2 B 11.7 Southbound Approach A 8.3 B 10.7 A 9.2 B 11.7 Overall A 8.6 A 5.6 A 9.2 A 5.9 Lake Avenue at
Eastman Eastbound LT TR A 0.0 D 38.3 A 0.1 D 37.7
Eastman Avenue and Eastbound Approach A 0.0 D 38.3 A 0.1 D 37.7 Maplewood Drive
Maplewood Westbound LT D 54.3 E 56.1 D 54.9 E 56.0
Westbound Right B 11.5 C 34.7 B 14.0 D 37.7 Signalized Westbound Approach B 14.3 C 34.9 B 16.9 D 37.9
Lake Ave Northbound Left A 0.9 C 22.0 A 1.1 C 22.3
Northbound T TR A 3.7 C 20.2 A 5.2 C 23.0 Northbound Approach A 3.3 C 20.2 A 4.6 C 23.0
Lake Ave Southbound Left A 4.1 B 14.6 A 4.8 B 18.5
Southbound T TR A 0.9 A 2.1 A 1.1 A 2.2 Southbound Approach A 2.3 A 8.5 A 2.7 B 10.6 Overall A 4.4 C 23.1 A 5.3 C 25.7 Dewey Avenue at
Eastman Eastbound Left B 17.4 C 23.0 B 18.0 C 23.0
Eastman Avenue Eastbound TR B 15.3 A 0.1 B 14.5 A 0.1 Eastbound Approach B 16.4 B 18.2 B 16.1 B 18.1 Signalized
Eastman Westbound Left B 16.4 B 15.6 B 16.4 B 15.7
Westbound TR B 12.6 B 12.3 B 12.4 B 12.4 Westbound Approach B 14.5 B 12.7 B 14.1 B 12.9
Dewey Ave Northbound Left A 7.0 A 4.3 A 7.0 A 4.5
Northbound TR A 3.2 A 3.3 A 3.3 A 3.8 Northbound Approach A 3.2 A 3.3 A 3.3 A 3.8
Dewey Ave Southbound Left A 6.7 B 10.2 A 6.7 B 10.2
Southbound TR A 6.1 A 8.6 A 6.4 A 8.7 Southbound Approach A 6.1 A 8.6 A 6.4 A 8.7 Overall A 5.5 A 6.5 A 5.8 A 6.8
LR: Shared Left and Right TR: Shared Through and Right LT: Shared Left and Through LTR: Shared Left, Through, and Right

Type of peak hour being reported: Intersection Peak Method for determining peak hour: Total Entering Volume
Report generated on 3/14/2017 12:34 PM SOURCE: Quality Counts, LLC (http://www.qualitycounts.net) 1-877-580-2212
LOCATION: Lake Ave -- Eastman Ave QC JOB #: 14237201CITY/STATE: Rochester, NY DATE: Wed, Mar 08 2017
15-Min CountPeriod
Beginning At
Lake Ave(Northbound)
Lake Ave(Southbound)
Eastman Ave(Eastbound)
Eastman Ave(Westbound)
Total HourlyTotals
Left Thru Right U Left Thru Right U Left Thru Right U Left Thru Right U6:00 AM 0 17 0 0 58 60 0 0 0 0 0 0 0 0 15 0 1506:15 AM 3 17 0 0 73 69 0 0 0 0 1 0 0 0 11 0 1746:30 AM 4 29 0 0 101 107 1 0 0 0 0 0 1 1 28 0 2726:45 AM 8 40 0 0 112 128 0 0 0 0 0 0 0 4 37 0 329 9257:00 AM 6 30 0 0 137 127 0 0 0 2 0 0 1 2 37 0 342 1117
7:15 AM 7 18 1 0 138 188 0 0 0 2 0 0 0 1 55 0 410 13537:30 AM 8 42 1 0 155 197 0 0 0 0 2 0 2 4 66 0 477 1558
7:45 AM 11 66 0 0 175 161 0 0 0 0 2 0 1 5 88 0 509 17388:00 AM 4 47 0 0 142 137 0 0 0 0 1 0 1 7 63 0 402 17988:15 AM 7 50 0 0 112 140 0 0 1 0 0 0 0 3 67 0 380 17688:30 AM 8 56 0 0 88 123 0 0 0 1 0 0 0 3 57 0 336 16278:45 AM 9 56 0 0 90 101 0 0 0 0 1 0 2 2 50 0 311 1429
Peak 15-Min Northbound Southbound Eastbound WestboundTotalFlowrates Left Thru Right U Left Thru Right U Left Thru Right U Left Thru Right U
All Vehicles 44 264 0 0 700 644 0 0 0 0 8 0 4 20 352 0 2036Heavy Trucks 8 100 0 8 32 0 0 0 4 0 0 12 164Pedestrians 0 0 0 0 0
Bicycles 0 0 0 0 0 0 0 0 0 0 0 0 0Railroad
Stopped Buses
Comments:
Peak-Hour: 7:15 AM -- 8:15 AMPeak 15-Min: 7:45 AM -- 8:00 AM
30 173 2
6106830
0
2
5 4
17
272
205
1293
7
293
445
692
614
47
1.00 0.82
0.81
0.92
0.88
10.0 30.1 50.0
3.63.70.0
0.0
0.0
40.0 25.0
0.0
4.8
27.3
3.6
28.6
4.8
14.6
4.0
3.7
6.4
0
0
2 2
0 0 0
000
0
0
0 0
0
0
NA
NA
NA NA
NA
NA
NA NA

Type of peak hour being reported: Intersection Peak Method for determining peak hour: Total Entering Volume
Report generated on 3/23/2017 1:28 PM SOURCE: Quality Counts, LLC (http://www.qualitycounts.net) 1-877-580-2212
LOCATION: Lake Ave -- Eastman Ave QC JOB #: 14237202CITY/STATE: Rochester, NY DATE: Mon, Mar 20 2017
15-Min CountPeriod
Beginning At
Lake Ave(Northbound)
Lake Ave(Southbound)
Eastman Ave(Eastbound)
Eastman Ave(Westbound)
Total HourlyTotals
Left Thru Right U Left Thru Right U Left Thru Right U Left Thru Right U3:00 PM 2 114 0 0 78 78 0 0 0 3 4 0 1 0 96 0 3763:15 PM 2 96 0 0 86 74 0 0 1 2 1 0 0 1 143 0 4063:30 PM 2 99 0 0 109 73 0 0 1 0 4 0 0 0 111 0 3993:45 PM 1 104 0 0 93 96 3 0 0 5 2 0 0 0 157 0 461 16424:00 PM 1 109 0 0 69 83 2 0 1 5 3 0 1 0 148 0 422 16884:15 PM 2 90 0 0 79 72 2 0 2 2 5 0 1 0 166 0 421 17034:30 PM 2 113 0 0 68 64 0 0 1 7 6 0 3 0 159 0 423 1727
4:45 PM 0 145 1 0 69 72 0 0 0 8 5 0 0 0 189 0 489 17555:00 PM 1 130 0 0 67 58 0 0 0 7 5 0 3 0 179 0 450 1783
5:15 PM 1 145 0 0 81 73 0 0 1 5 7 0 2 2 200 0 517 18795:30 PM 0 124 1 0 61 61 0 0 0 4 4 0 0 0 210 0 465 19215:45 PM 1 109 0 0 55 66 0 0 0 0 3 0 2 2 161 0 399 1831
Peak 15-Min Northbound Southbound Eastbound WestboundTotalFlowrates Left Thru Right U Left Thru Right U Left Thru Right U Left Thru Right U
All Vehicles 4 580 0 0 324 292 0 0 4 20 28 0 8 8 800 0 2068Heavy Trucks 0 16 0 0 12 0 0 0 0 0 0 4 32Pedestrians 0 0 0 0 0
Bicycles 0 0 0 0 0 0 0 0 0 0 0 0 0Railroad
Stopped Buses
Comments:
Peak-Hour: 4:45 PM -- 5:45 PMPeak 15-Min: 5:15 PM -- 5:30 PM
2 544 2
2782640
1
24
21 5
2
778
548
542
46
785
1323
290
304
4
0.93 0.93
0.94
0.90
0.93
50.0 2.6 0.0
0.46.10.0
0.0
0.0
0.0 0.0
0.0
0.8
2.7
3.1
0.0
0.8
1.5
5.5
0.3
25.0
0
0
1 0
0 0 0
000
0
0
0 0
0
0
NA
NA
NA NA
NA
NA
NA NA

Type of peak hour being reported: Intersection Peak Method for determining peak hour: Total Entering Volume
Report generated on 3/14/2017 12:34 PM SOURCE: Quality Counts, LLC (http://www.qualitycounts.net) 1-877-580-2212
LOCATION: Lake Ave -- Merrill St QC JOB #: 14237203CITY/STATE: Rochester, NY DATE: Wed, Mar 08 2017
15-Min CountPeriod
Beginning At
Lake Ave(Northbound)
Lake Ave(Southbound)
Merrill St(Eastbound)
Merrill St(Westbound)
Total HourlyTotals
Left Thru Right U Left Thru Right U Left Thru Right U Left Thru Right U6:00 AM 3 25 1 0 0 104 2 0 0 0 9 0 1 0 0 0 1456:15 AM 3 24 0 0 0 128 5 0 0 0 15 0 0 0 0 0 1756:30 AM 5 42 1 0 0 194 0 0 0 0 17 0 0 0 0 0 2596:45 AM 8 66 1 0 0 219 6 0 5 0 17 0 0 0 0 0 322 9017:00 AM 7 49 4 0 1 251 3 0 3 1 26 0 0 0 0 0 345 1101
7:15 AM 6 66 3 0 2 293 7 0 2 0 31 0 0 0 0 0 410 13367:30 AM 14 75 5 0 0 329 2 0 2 0 34 0 0 0 0 0 461 1538
7:45 AM 10 147 0 0 0 289 3 0 3 1 44 0 0 0 0 0 497 17138:00 AM 18 94 1 0 1 256 5 0 2 0 23 0 1 0 0 0 401 17698:15 AM 12 98 0 0 0 227 3 0 2 0 22 0 0 0 0 0 364 17238:30 AM 13 96 1 0 0 198 2 0 1 0 16 0 0 0 0 0 327 15898:45 AM 7 94 2 0 0 174 2 0 2 0 27 0 0 0 0 0 308 1400
Peak 15-Min Northbound Southbound Eastbound WestboundTotalFlowrates Left Thru Right U Left Thru Right U Left Thru Right U Left Thru Right U
All Vehicles 40 588 0 0 0 1156 12 0 12 4 176 0 0 0 0 0 1988Heavy Trucks 4 120 0 0 40 0 4 0 4 0 0 0 172Pedestrians 0 0 0 4 4
Bicycles 0 0 0 0 0 0 0 0 0 0 0 0 0Railroad
Stopped Buses
Comments:
Peak-Hour: 7:15 AM -- 8:15 AMPeak 15-Min: 7:45 AM -- 8:00 AM
48 382 9
3116717
9
1
132 1
0
0
439
1187
142
1
391
1300
13
65
0.77 0.25
0.78
0.90
0.89
10.4 15.2 0.0
0.03.511.8
44.4
0.0
3.0 0.0
0.0
0.0
14.4
3.6
5.6
0.0
15.9
3.5
0.0
10.8
0
0
2 1
0 0 0
000
0
0
0 0
0
0
NA
NA
NA NA
NA
NA
NA NA

Type of peak hour being reported: Intersection Peak Method for determining peak hour: Total Entering Volume
Report generated on 3/23/2017 1:28 PM SOURCE: Quality Counts, LLC (http://www.qualitycounts.net) 1-877-580-2212
LOCATION: Lake Ave -- Merrill St QC JOB #: 14237204CITY/STATE: Rochester, NY DATE: Mon, Mar 20 2017
15-Min CountPeriod
Beginning At
Lake Ave(Northbound)
Lake Ave(Southbound)
Merrill St(Eastbound)
Merrill St(Westbound)
Total HourlyTotals
Left Thru Right U Left Thru Right U Left Thru Right U Left Thru Right U3:00 PM 21 183 0 0 0 136 1 0 2 0 12 0 0 0 0 0 3553:15 PM 27 217 0 0 0 141 0 0 2 0 15 0 0 0 0 0 4023:30 PM 26 184 0 0 0 162 3 0 2 0 13 0 0 0 0 0 3903:45 PM 29 229 0 0 0 174 0 0 5 0 20 0 1 0 1 0 459 16064:00 PM 34 228 1 0 0 133 6 0 7 0 9 0 0 2 2 0 422 16734:15 PM 31 236 0 0 1 129 1 0 2 0 18 0 1 0 0 0 419 16904:30 PM 23 238 0 0 0 110 5 0 3 0 17 0 0 1 1 0 398 1698
4:45 PM 35 299 0 0 0 125 3 0 4 0 10 0 2 1 0 0 479 17185:00 PM 30 279 0 0 0 112 3 0 12 1 12 0 2 0 2 0 453 1749
5:15 PM 48 299 0 0 0 128 4 0 6 0 15 0 1 0 0 0 501 18315:30 PM 42 266 0 0 0 105 1 0 1 0 18 0 0 0 0 0 433 18665:45 PM 29 244 0 0 0 101 1 0 3 0 8 0 0 1 0 0 387 1774
Peak 15-Min Northbound Southbound Eastbound WestboundTotalFlowrates Left Thru Right U Left Thru Right U Left Thru Right U Left Thru Right U
All Vehicles 192 1196 0 0 0 512 16 0 24 0 60 0 4 0 0 0 2004Heavy Trucks 4 20 0 0 8 0 4 0 0 0 0 0 36Pedestrians 8 0 8 0 16
Bicycles 0 0 0 0 0 0 0 0 0 0 0 0 0Railroad
Stopped Buses
Comments:
Peak-Hour: 4:45 PM -- 5:45 PMPeak 15-Min: 5:15 PM -- 5:30 PM
155 1143 0
047011
23
1
55 5
1
2
1298
481
79
8
1168
530
1
167
0.81 0.63
0.94
0.89
0.93
0.6 1.7 0.0
0.03.49.1
30.4
0.0
0.0 0.0
0.0
0.0
1.6
3.5
8.9
0.0
2.3
3.0
0.0
1.2
2
0
2 0
0 0 0
000
0
0
0 0
0
0
NA
NA
NA NA
NA
NA
NA NA
Type of peak hour being reported: Intersection Peak Method for determining peak hour: Total Entering Volume
Report generated on 3/14/2017 12:34 PM SOURCE: Quality Counts, LLC (http://www.qualitycounts.net) 1-877-580-2212
LOCATION: Dewey Ave -- Eastman Ave QC JOB #: 14237205CITY/STATE: Rochester, NY DATE: Wed, Mar 08 2017
15-Min CountPeriod
Beginning At
Dewey Ave(Northbound)
Dewey Ave(Southbound)
Eastman Ave(Eastbound)
Eastman Ave(Westbound)
Total HourlyTotals
Left Thru Right U Left Thru Right U Left Thru Right U Left Thru Right U6:00 AM 0 22 3 0 3 60 2 0 1 0 0 0 1 0 0 0 926:15 AM 0 35 4 0 1 79 2 0 1 0 1 0 1 0 2 0 1266:30 AM 0 45 5 0 4 114 7 0 0 0 1 0 0 0 2 0 1786:45 AM 0 55 7 0 2 133 9 0 1 0 0 0 0 2 0 0 209 6057:00 AM 0 50 8 0 3 157 8 0 2 1 1 0 1 1 0 0 232 745
7:15 AM 0 64 7 0 6 163 4 0 2 0 0 0 1 1 1 0 249 868 7:30 AM 0 60 8 0 3 184 8 0 2 1 1 0 2 0 1 0 270 960
7:45 AM 1 83 7 0 8 152 7 0 2 0 0 0 1 2 2 0 265 10168:00 AM 0 80 6 0 6 142 8 0 2 3 3 0 3 1 0 0 254 10388:15 AM 0 63 8 0 3 156 5 0 2 0 0 0 5 2 1 0 245 10348:30 AM 1 63 4 0 1 134 13 0 1 2 1 0 2 1 1 0 224 9888:45 AM 1 85 6 0 0 130 12 0 3 1 1 0 1 2 0 0 242 965
Peak 15-Min Northbound Southbound Eastbound WestboundTotalFlowrates Left Thru Right U Left Thru Right U Left Thru Right U Left Thru Right U
All Vehicles 0 240 32 0 12 736 32 0 8 4 4 0 8 0 4 0 1080Heavy Trucks 0 32 4 0 44 0 4 0 4 4 0 4 96Pedestrians 0 0 0 8 8
Bicycles 0 0 0 0 2 0 0 0 0 0 0 0 2Railroad
Stopped Buses
Comments:
Peak-Hour: 7:15 AM -- 8:15 AMPeak 15-Min: 7:30 AM -- 7:45 AM
1 287 28
2364127
8
4
4 7
4
4
316
691
16
15
299
652
55
32
0.59 0.66
0.86
0.90
0.96
0.0 7.0 10.7
4.34.43.7
12.5
0.0
25.0 28.6
25.0
25.0
7.3
4.3
12.5
26.7
7.4
4.8
7.3
6.3
0
0
4 5
0 0 0
030
0
0
0 0
0
0
NA
NA
NA NA
NA
NA
NA NA
Type of peak hour being reported: Intersection Peak Method for determining peak hour: Total Entering Volume
Report generated on 3/23/2017 1:28 PM SOURCE: Quality Counts, LLC (http://www.qualitycounts.net) 1-877-580-2212
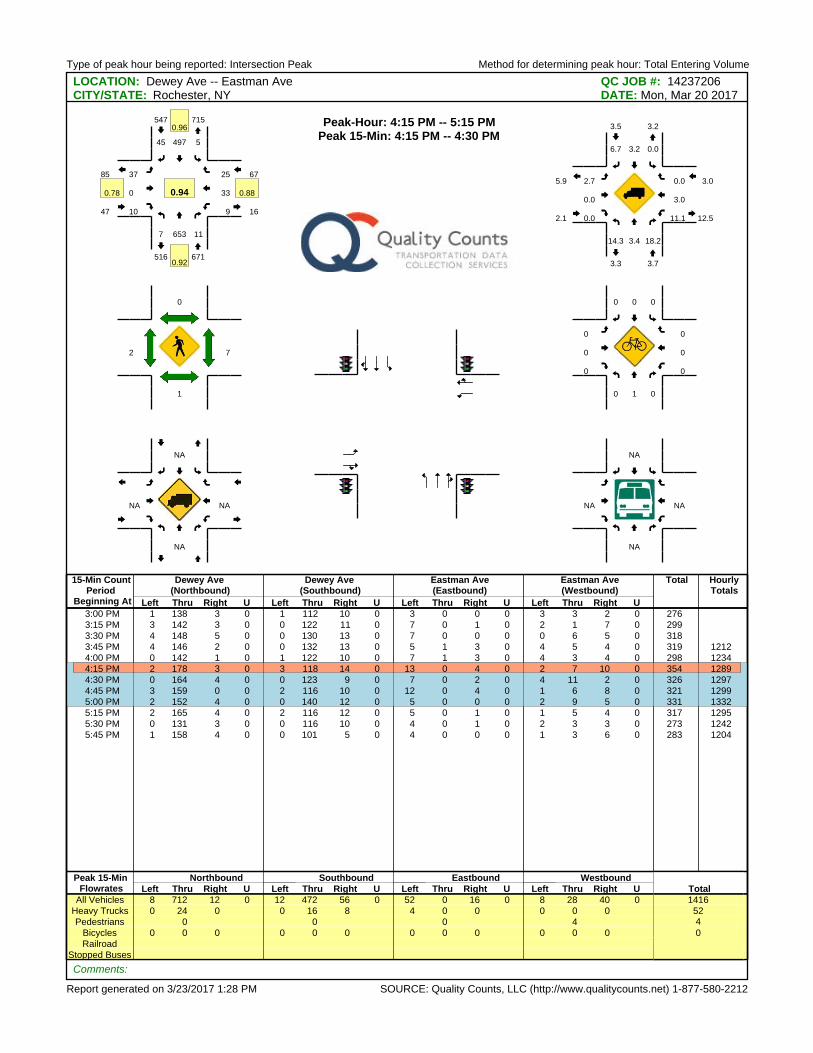
LOCATION: Dewey Ave -- Eastman Ave QC JOB #: 14237206CITY/STATE: Rochester, NY DATE: Mon, Mar 20 2017
15-Min CountPeriod
Beginning At
Dewey Ave(Northbound)
Dewey Ave(Southbound)
Eastman Ave(Eastbound)
Eastman Ave(Westbound)
Total HourlyTotals
Left Thru Right U Left Thru Right U Left Thru Right U Left Thru Right U3:00 PM 1 138 3 0 1 112 10 0 3 0 0 0 3 3 2 0 2763:15 PM 3 142 3 0 0 122 11 0 7 0 1 0 2 1 7 0 2993:30 PM 4 148 5 0 0 130 13 0 7 0 0 0 0 6 5 0 3183:45 PM 4 146 2 0 0 132 13 0 5 1 3 0 4 5 4 0 319 12124:00 PM 0 142 1 0 1 122 10 0 7 1 3 0 4 3 4 0 298 1234
4:15 PM 2 178 3 0 3 118 14 0 13 0 4 0 2 7 10 0 354 12894:30 PM 0 164 4 0 0 123 9 0 7 0 2 0 4 11 2 0 326 12974:45 PM 3 159 0 0 2 116 10 0 12 0 4 0 1 6 8 0 321 12995:00 PM 2 152 4 0 0 140 12 0 5 0 0 0 2 9 5 0 331 13325:15 PM 2 165 4 0 2 116 12 0 5 0 1 0 1 5 4 0 317 12955:30 PM 0 131 3 0 0 116 10 0 4 0 1 0 2 3 3 0 273 12425:45 PM 1 158 4 0 0 101 5 0 4 0 0 0 1 3 6 0 283 1204
Peak 15-Min Northbound Southbound Eastbound WestboundTotalFlowrates Left Thru Right U Left Thru Right U Left Thru Right U Left Thru Right U
All Vehicles 8 712 12 0 12 472 56 0 52 0 16 0 8 28 40 0 1416Heavy Trucks 0 24 0 0 16 8 4 0 0 0 0 0 52Pedestrians 0 0 0 4 4
Bicycles 0 0 0 0 0 0 0 0 0 0 0 0 0Railroad
Stopped Buses
Comments:
Peak-Hour: 4:15 PM -- 5:15 PMPeak 15-Min: 4:15 PM -- 4:30 PM
7 653 11
549745
37
0
10 9
33
25
671
547
47
67
715
516
16
85
0.78 0.88
0.92
0.96
0.94
14.3 3.4 18.2
0.03.26.7
2.7
0.0
0.0 11.1
3.0
0.0
3.7
3.5
2.1
3.0
3.2
3.3
12.5
5.9
1
0
2 7
0 1 0
000
0
0
0 0
0
0
NA
NA
NA NA
NA
NA
NA NA
Appendix C
Trip Capture Estimator

Project Name: Organization:Project Location: Performed By:
Scenario Description: Date:Analysis Year: Checked By:
Analysis Period: Date:
ITE LUCs1 Quantity Units Total Entering ExitingOffice 710 264 KSF 491 433 58Retail 820 36 KSF 35 22 13Restaurant 932 4000 SF 43 24 19Cinema/Entertainment NA 0 NA 0 0 0Residential 220 624 Units 332 65 267Hotel NA 0 NA 0 0 0All Other Land Uses2 140/210/770 338/19/35 KSF/Units/KSF 296 222 74
1,197 766 431
Veh. Occ.4 % Transit % Non-Motorized Veh. Occ.4 % Transit % Non-MotorizedOffice 1.00 10% 4% 1.00 10% 4%Retail 1.50 7% 5% 1.50 7% 5%Restaurant 1.50 7% 6% 1.50 7% 6%Cinema/Entertainment 1.50 7% 3% 1.50 7% 3%Residential 1.00 10% 8% 1.00 10% 8%Hotel 1.50 4% 3% 1.50 4% 3%All Other Land Uses2 1.00 10% 3% 1.00 10% 3%
Office Retail Restaurant Residential HotelOfficeRetailRestaurantCinema/EntertainmentResidentialHotel
Office Retail Restaurant Residential HotelOffice 11 8 0 0Retail 6 3 1 0Restaurant 9 3 1 0Cinema/Entertainment 0 0 0 0 0Residential 5 3 7 0Hotel 0 0 0 0
Total Entering Exiting Land Use Entering Trips Exiting TripsAll Person-Trips 1,237 789 448 Office 5% 33%Internal Capture Percentage 9% 7% 13% Retail 52% 50%
Restaurant 50% 45%External Vehicle-Trips5 945 624 321 Cinema/Entertainment N/A N/AExternal Transit-Trips6 109 71 38 Residential 3% 6%External Non-Motorized Trips6 51 27 24 Hotel N/A N/A
NCHRP 684 Internal Trip Capture Estimation Tool
Table 1-A: Base Vehicle-Trip Generation Estimates (Single-Use Site Estimate)
00
Cinema/Entertainment
Development Data (For Information Only )
000
Estimated Vehicle-Trips3
Land Use
Eastman Business Park
Table 2-A: Mode Split and Vehicle Occupancy Estimates
Table 4-A: Internal Person-Trip Origin-Destination Matrix*Destination (To)
Origin (From)
Origin (From)Destination (To)
Cinema/Entertainment
Land UseEntering Trips Exiting Trips
Table 3-A: Average Land Use Interchange Distances (Feet Walking Distance)
Estimation Tool Developed by the Texas A&M Transportation Institute - Version 2013.1
Table 5-A: Computations Summary Table 6-A: Internal Trip Capture Percentages by Land Use
2Total estimate for all other land uses at mixed-use development site is not subject to internal trip capture computations in this estimator.
5Vehicle-trips computed using the mode split and vehicle occupancy values provided in Table 2-A.
1Land Use Codes (LUCs) from Trip Generation Manual , published by the Institute of Transportation Engineers.
6Person-Trips*Indicates computation that has been rounded to the nearest whole number.
3Enter trips assuming no transit or non-motorized trips (as assumed in ITE Trip Generation Manual ).4Enter vehicle occupancy assumed in Table 1-A vehicle trips. If vehicle occupancy changes for proposed mixed-use project, manual adjustments must be made to Tables 5-A, 9-A (O and D). Enter transit, non-motorized percentages that will result with proposed mixed-use project complete.
Rochester, NY
AM Street Peak Hour
Bergmann AssociatesBJH
3/22/2017JCE
Full Build

Project Name:Analysis Period:
Veh. Occ. Vehicle-Trips Person-Trips* Veh. Occ. Vehicle-Trips Person-Trips*Office 1.00 433 433 1.00 58 58Retail 1.50 22 33 1.50 13 20Restaurant 1.50 24 36 1.50 19 29Cinema/Entertainment 1.50 0 0 1.50 0 0Residential 1.00 65 65 1.00 267 267Hotel 1.50 0 0 1.50 0 0
Office Retail Restaurant Residential HotelOffice 16 37 1 0Retail 6 3 3 0Restaurant 9 4 1 1Cinema/Entertainment 0 0 0 0 0Residential 5 3 53 0Hotel 0 0 0 0
Office Retail Restaurant Residential HotelOffice 11 8 0 0Retail 17 18 1 0Restaurant 61 3 3 0Cinema/Entertainment 0 0 0 0 0Residential 13 6 7 0Hotel 13 1 2 0
Internal External Total Vehicles1 Transit2 Non-Motorized2
Office 20 413 433 358 41 14Retail 17 16 33 9 1 1Restaurant 18 18 36 11 1 1Cinema/Entertainment 0 0 0 0 0 0Residential 2 63 65 52 6 5Hotel 0 0 0 0 0 0All Other Land Uses3 0 222 222 194 22 6
Internal External Total Vehicles1 Transit2 Non-Motorized2
Office 19 39 58 34 4 1Retail 10 10 20 5 1 1Restaurant 13 16 29 9 1 1Cinema/Entertainment 0 0 0 0 0 0Residential 15 252 267 208 25 19Hotel 0 0 0 0 0 0All Other Land Uses3 0 74 74 65 7 2
0
*Indicates computation that has been rounded to the nearest whole number.
000
00
Destination (To)Cinema/Entertainment
0
3Total estimate for all other land uses at mixed-use development site is not subject to internal trip capture computations in this estimator
Destination Land Use
Table 9-A (O): Internal and External Trips Summary (Exiting Trips)
Origin Land UsePerson-Trip Estimates External Trips by Mode*
External Trips by Mode*
1Vehicle-trips computed using the mode split and vehicle occupancy values provided in Table 2-A2Person-Trips
Person-Trip Estimates
Eastman Business ParkEastman Business Park
Table 9-A (D): Internal and External Trips Summary (Entering Trips)
Table 8-A (O): Internal Person-Trip Origin-Destination Matrix (Computed at Origin)
Origin (From)Destination (To)
Cinema/Entertainment
Table 7-A: Conversion of Vehicle-Trip Ends to Person-Trip EndsTable 7-A (O): Exiting Trips
0
0
0
Table 8-A (D): Internal Person-Trip Origin-Destination Matrix (Computed at Destination)
Origin (From)
Land UseTable 7-A (D): Entering Trips
Project Name: Organization:Project Location: Performed By:
Scenario Description: Date:Analysis Year: Checked By:
Analysis Period: Date:
ITE LUCs1 Quantity Units Total Entering ExitingOffice 710 264 KSF 638 110 528Retail 820 36 KSF 134 65 69Restaurant 932 4000 SF 39 24 15Cinema/Entertainment NA 0 NA 0 0 0Residential 220 624 Units 449 298 151Hotel NA 0 NA 0 0 0All Other Land Uses2 210 19 KSF 313 116 197
1,573 613 960
Veh. Occ.4 % Transit % Non-Motorized Veh. Occ.4 % Transit % Non-MotorizedOffice 1.00 10% 4% 1.00 10% 4%Retail 1.50 7% 5% 1.50 7% 5%Restaurant 1.50 7% 6% 1.50 7% 6%Cinema/Entertainment 1.50 7% 3% 1.50 7% 3%Residential 1.00 10% 8% 1.00 10% 8%Hotel 1.50 4% 3% 1.50 4% 3%All Other Land Uses2 1.00 10% 3% 1.00 10% 3%
Office Retail Restaurant Residential HotelOffice 500 500 500Retail 500Restaurant 500Cinema/Entertainment 500Residential 500 500Hotel 500
Office Retail Restaurant Residential HotelOffice 7 1 11 0Retail 2 10 27 0Restaurant 1 9 4 0Cinema/Entertainment 0 0 0 0 0Residential 6 9 5 0Hotel 0 0 0 0
Total Entering Exiting Land Use Entering Trips Exiting TripsAll Person-Trips 1,661 658 1,003 Office 8% 4%Internal Capture Percentage 11% 14% 9% Retail 26% 38%
Restaurant 44% 61%External Vehicle-Trips5 1,217 454 763 Cinema/Entertainment N/A N/AExternal Transit-Trips6 144 54 90 Residential 14% 13%External Non-Motorized Trips6 68 31 37 Hotel N/A N/A
*Indicates computation that has been rounded to the nearest whole number.Estimation Tool Developed by the Texas A&M Transportation Institute - Version 2013.1
Full BuildJCE
PM Street Peak Hour 3/22/2017
Table 1-P: Base Vehicle-Trip Generation Estimates (Single-Use Site Estimate)
Land UseDevelopment Data (For Information Only ) Estimated Vehicle-Trips3
Table 2-P: Mode Split and Vehicle Occupancy Estimates
Land UseEntering Trips Exiting Trips
NCHRP 684 Internal Trip Capture Estimation ToolEastman Business Park Bergmann Associates
Rochester, NY BJH
Table 3-P: Average Land Use Interchange Distances (Feet Walking Distance)
Origin (From)Destination (To)
Cinema/Entertainment
Table 4-P: Internal Person-Trip Origin-Destination Matrix*
Origin (From)Destination (To)
Cinema/Entertainment000
00
Table 5-P: Computations Summary Table 6-P: Internal Trip Capture Percentages by Land Use
4Enter vehicle occupancy assumed in Table 1-P vehicle trips. If vehicle occupancy changes for proposed mixed-use project, manual adjustments must be
6Person-Trips
1Land Use Codes (LUCs) from Trip Generation Manual , published by the Institute of Transportation Engineers.2Total estimate for all other land uses at mixed-use development site is not subject to internal trip capture computations in this estimator.3Enter trips assuming no transit or non-motorized trips (as assumed in ITE Trip Generation Manual ).
5Vehicle-trips computed using the mode split and vehicle occupancy values provided in Table 2-P.
Project Name:Analysis Period:
Veh. Occ. Vehicle-Trips Person-Trips* Veh. Occ. Vehicle-Trips Person-Trips*Office 1.00 110 110 1.00 528 528Retail 1.50 65 98 1.50 69 104Restaurant 1.50 24 36 1.50 15 23Cinema/Entertainment 1.50 0 0 1.50 0 0Residential 1.00 298 298 1.00 151 151Hotel 1.50 0 0 1.50 0 0
Office Retail Restaurant Residential HotelOffice 96 19 11 0Retail 2 30 27 5Restaurant 1 9 4 2Cinema/Entertainment 0 0 0 0 0Residential 6 58 29 5Hotel 0 0 0 0
Office Retail Restaurant Residential HotelOffice 7 1 12 0Retail 34 10 137 0Restaurant 33 49 48 0Cinema/Entertainment 7 4 1 12 0Residential 63 9 5 0Hotel 0 2 2 0
Internal External Total Vehicles1 Transit2 Non-Motorized2
Office 9 101 110 87 10 4Retail 25 73 98 43 5 4Restaurant 16 20 36 12 1 1Cinema/Entertainment 0 0 0 0 0 0Residential 42 256 298 211 26 19Hotel 0 0 0 0 0 0All Other Land Uses3 0 116 116 101 12 3
Internal External Total Vehicles1 Transit2 Non-Motorized2
Office 19 509 528 440 51 18Retail 39 65 104 38 5 3Restaurant 14 9 23 5 1 1Cinema/Entertainment 0 0 0 0 0 0Residential 20 131 151 108 13 10Hotel 0 0 0 0 0 0All Other Land Uses3 0 197 197 172 20 5
*Indicates computation that has been rounded to the nearest whole number.
Eastman Business ParkEastman Business Park
Table 7-P: Conversion of Vehicle-Trip Ends to Person-Trip Ends
Land UseTable 7-P (D): Entering Trips Table 7-P (O): Exiting Trips
Table 8-P (O): Internal Person-Trip Origin-Destination Matrix (Computed at Origin)
Origin (From)Destination (To)
Destination (To)Cinema/Entertainment
Cinema/Entertainment04
1Vehicle-trips computed using the mode split and vehicle occupancy values provided in Table 2-P2Person-Trips
00
Table 9-P (D): Internal and External Trips Summary (Entering Trips)
Destination Land Use
3Total estimate for all other land uses at mixed-use development site is not subject to internal trip capture computations in this estimator
Table 9-P (O): Internal and External Trips Summary (Exiting Trips)
Origin Land UsePerson-Trip Estimates External Trips by Mode*
Person-Trip Estimates External Trips by Mode*
0
Table 8-P (D): Internal Person-Trip Origin-Destination Matrix (Computed at Destination)
Origin (From)
0
0
2
0
0

Appendix D
Trip Generation Calculations

3/23/2017AM PEAK HOUR PM PEAK HOUR
AM Peak PM Peak TRIPS TRIPS Enter Exit Enter Exit88% 17% Total 92 123 81 11 21 102
Ln(T) = 0.80 Ln(x) + 1.57 T = 1.12 (x) + 78.45 Shared/Transit/Non-Motorized20 23 15 5 5 18Avg. Rate=1.56 Avg. Rate=1.49 External Vehicle Trips 72 100 66 6 16 84
20% 65% Total 48 67 10 38 44 23T = 0.49 (x) + 3.73 T = 0.55 (x) + 17.65 Shared/Transit/Non-Motorized11 21 2 9 14 7
Avg. Rate=0.51 Avg. Rate=0.62 External Vehicle Trips 37 46 8 29 30 1655% 60% Total 43 39 24 19 24 15
Shared/Transit/Non-Motorized26 25 15 11 14 11Avg. Rate = 10.81 Avg. Rate = 9.85 External Vehicle Trips 17 14 9 8 10 4
62% 48% Total 35 134 22 13 65 69Shared/Pass By 24 60 15 9 25 35
Avg. Rate=0.96 Avg. Rate=3.71 External Vehicle Trips 11 74 7 4 40 34218 363 137 81 154 209
TOTAL 81 129 47 34 58 71137 234 90 47 96 138
20% 65% Total 40 57 8 32 38 19T = 0.49 (x) + 3.73 T = 0.55 (x) + 17.65 Shared/Transit/Non-Motorized10 18 2 8 12 6
Avg. Rate=0.51 Avg. Rate=0.62 External Vehicle Trips 30 39 6 24 26 1320% 65% Total 141 172 29 112 112 60
T = 0.49 (x) + 3.74 T = 0.55 (x) + 17.66 Shared/Transit/Non-Motorized32 53 6 26 35 18Avg. Rate=0.51 Avg. Rate=0.62 External Vehicle Trips 109 119 23 86 77 42
88% 17% Total 134 150 118 16 26 124Ln(T) = 0.80 Ln(x) + 1.57 T = 1.12 (x) + 78.45 Shared/Transit/Non-Motorized29 28 22 7 6 22
Avg. Rate=1.56 Avg. Rate=1.49 External Vehicle Trips 105 122 96 9 20 10288% 17% Total 120 141 106 14 24 117
Ln(T) = 0.80 Ln(x) + 1.57 T = 1.12 (x) + 78.45 Shared/Transit/Non-Motorized27 25 20 7 5 20Avg. Rate=1.56 Avg. Rate=1.49 External Vehicle Trips 93 116 86 7 19 97
17% 67% Total 47 66 8 39 45 21Ln(T) = 0.80 Ln(x) + 0.26 Ln(T) = 0.82 Ln(x) +0.32 Shared/Transit/Non-Motorized11 20 2 9 14 6
Ave. Rate=0.44 Ave. Rate=0.52 External Vehicle Trips 36 46 6 30 31 15167 207 114 53 69 138
TOTAL 38 45 22 16 19 26129 162 92 37 50 112
17% 67% Total 33 50 6 27 34 16Ln(T) = 0.80 Ln(x) + 0.26 Ln(T) = 0.82 Ln(x) +0.32 Shared/Transit/Non-Motorized7 16 1 6 11 5
Ave. Rate=0.44 Ave. Rate=0.52 External Vehicle Trips 26 34 5 21 23 1188% 17% Total 92 123 81 11 21 102
Ln(T) = 0.80 Ln(x) + 1.56 T = 1.12 (x) + 78.44 Shared/Transit/Non-Motorized20 23 15 5 5 18Avg. Rate=1.56 Avg. Rate=1.49 External Vehicle Trips 72 100 66 6 16 84
85% 26% Total 51 57 44 7 15 42Ln(T) = 0.97 Ln(x) + 0.49 Ln(T) = 0.90 Ln(x) + 0.85 Shared/Transit/Non-Motorized16 19 14 2 5 14
Avg. Rate=1.40 Avg. Rate=1.26 External Vehicle Trips 35 38 30 5 10 2878% 36% Total 58 66 46 12 24 42
T = 0.83 (x) - 29.51 T = 0.78 (x) - 15.96 Shared/Transit/Non-Motorized19 22 15 4 8 14Avg. Rate=0.73 Avg. Rate=0.73 External Vehicle Trips 39 44 31 8 16 28
17% 67% Total 23 37 4 19 25 12Ln(T) = 0.80 Ln(x) + 0.26 Ln(T) = 0.82 Ln(x) +0.32 Shared/Transit/Non-Motorized5 12 1 4 8 4
Ave. Rate=0.44 Ave. Rate=0.52 External Vehicle Trips 18 25 3 15 17 817% 67% Total 23 24 4 19 17 7
Ln(T) = 0.80 Ln(x) + 0.26 Ln(T) = 0.82 Ln(x) +0.32 Shared/Transit/Non-Motorized7 8 1 6 6 2Ave. Rate=0.44 Ave. Rate=0.52 External Vehicle Trips 16 16 3 13 11 5
88% 17% Total 134 150 118 16 26 124Ln(T) = 0.80 Ln(x) + 1.56 T = 1.12 (x) + 78.44 Shared/Transit/Non-Motorized29 28 22 7 6 22
Avg. Rate=1.56 Avg. Rate=1.49 External Vehicle Trips 105 122 96 9 20 10288% 17% Total 53 101 47 6 18 83
Ln(T) = 0.80 Ln(x) + 1.57 T = 1.12 (x) + 78.45 Shared/Transit/Non-Motorized12 19 9 3 4 15Avg. Rate=1.56 Avg. Rate=1.49 External Vehicle Trips 41 82 38 3 14 68
78% 36% Total 164 166 128 36 60 106T = 0.83 (x) - 29.51 T = 0.78 (x) - 15.96 Shared/Transit/Non-Motorized54 54 42 12 20 34
Avg. Rate=0.73 Avg. Rate=0.73 External Vehicle Trips 110 112 86 24 40 72217 267 175 42 78 189
TOTAL 66 73 51 15 24 49151 194 124 27 54 140
Total 1,331 1,723 884 447 639 1,084Shared/Transit/Non-Motorized359 474 219 140 203 271External Vehicle Trips 972 1,249 665 307 436 813
Manufacturing (140) 233.00 KSF LU 140
LU 220, LU 230
36 Units
Manufacturing (140)
19 Units
General Office Building (710)
LU 770
105.00 KSF LU 140
2.8
LU 220, LU 230
PM Peak
LU 220, LU 230
ITE Trip Generation TRIP TYPE
LU 220, LU 230
AM PeakNOTES
General Office Building (710) Office 64.000 KSF
20.000 KSF
1.10
1.11
2.7
Eastman Business Park
Apartment/Condo Residential Apartments 72 Units
General Office Building (710) 40.000 KSF
LAND USE (ITE CODE)Code
1.2
1.1 Commercial
Redevelopment 4 KSF
36 KSF
Apartment/Condo Residential
High Turnover (Sit-Down) Restaurant
(932)
Retail
TOTAL
90 Units
SIZE
City of Rochester1.
32.
41.
92.
5
Mixed Use Gateway Development
Apartment/Condo Residential
Single/TH Residential Townhouses
General Office Building (710)
TOTAL
Apartment/Condo Residential
2.1 General Office
Building (710)
2.2 Business Park
(770)
2.3
General Office Building (710)
Office
Flex
Manufacturing
FINAL TOTALTotal
NOTES: For AM residential LU Code 210 always has the highest number of trips and therefor that Enter/Exit percentage is used. For PM when above 27.5 units LU Code 210 has the highest number of trips and when below 28 units LU Code 220 has the highest number of trips and the respective Enter/Exit percentage values should be used.
Office
Apartment/Condo Residential Apartments
64.000 KSF
88 Units
280 Units LU 220, LU 230
56.000 KSF
LU 210, LU 230
40.000 KSF
35.000 KSF
TOTAL
LU 220, LU 230
Apartment/Condo Residential 58 Units

Appendix E
Trip Generation Distribution and Build Out

Weekday AM Peak HourEastman Business Park
Varies Varies Res Res Res Res Off Off Res Res Res Res Res Res Varies Varies Varies Varies Varies Varies Varies Varies Varies Varies Res ResLU Code LU Code LU Code LU Code LU Code LU Code LU Code LU Code LU Code LU Code LU Code LU Code LU Code LU Code LU Code LU Code LU Code LU Code LU Code LU Code LU Code LU Code LU Code LU Code LU Code LU CodeVaries Varies 220/230 220/230 Varies Varies 710 710 210 210 411 411 710 710 Varies Varies
Total Trips Total Trips 218 218 40 40 141 141 134 134 167 167 33 33 92 92 51 51 58 58 23 23 23 23 134 134 217 217Shared/Pass By Trips Shared/Pass By Trips81 81 10 10 32 32 29 29 38 38 7 7 20 20 16 16 19 19 5 5 7 7 29 29 66 66
Parcel # Parcel # Parcel # Parcel # Parcel # Parcel # Parcel # Parcel # Parcel # Parcel # Enter Enter Enter Enter Enter Enter Enter Enter Enter Enter Enter Enter Enter Enter Enter Enter Enter Enter Enter Enter Enter Enter Enter Enter Enter Enter1.1,1.2 En 1.1,1.2 Ex 1.3,1.9 En 1.3,1.9 Ex 2.7 En 2.7 Ex 90 90 6 6 23 23 96 96 92 92 5 5 66 66 30 30 31 31 3 3 3 3 96 96 124 124
Exit Exit Exit Exit Exit Exit Exit Exit Exit Exit Exit Exit Exit Exit Exit Exit Exit Exit Exit Exit Exit Exit Exit Exit Exit Exit47 47 24 24 86 86 9 9 37 37 21 21 6 6 5 5 8 8 15 15 13 13 9 9 27 27
Prim. Trips Prim. Trips Prim. Trips Prim. Trips Prim. Trips Prim. Trips Prim. Trips Prim. Trips Prim. Trips Prim. Trips Prim. Trips Prim. Trips Prim. Trips Prim. Trips Prim. Trips Prim. Trips Prim. Trips Prim. Trips Prim. Trips Prim. Trips Prim. Trips Prim. Trips Prim. Trips Prim. Trips Prim. Trips Prim. Trips Dev Build137 137 30 30 109 109 105 105 129 129 26 26 72 72 35 35 39 39 18 18 16 16 105 105 151 151 Traffic Traffic
year year Distribution Distribution Distribution Distribution Distribution Distribution Distribution Distribution Distribution Distribution Parcel 1.1 0 Parcel 1.2 0 Parcel 1.3 0 Parcel 1.9 0 Parcel 1.10 0 Parcel 1.11 0 Parcel 2.1 0 Parcel 2.2 0 Parcel 2.3 0 Parcel 2.4 0 Parcel 2.5 0 Parcel 2.7 0 Parcel 2.8 02017 2032 Percents Percents Percents Percents Percents Percents Percents Percents Percents Percents Varies Varies Res Res Res Res Off Off Res Res Res Res Res Res Varies Varies Varies Varies Varies Varies Varies Varies Varies Varies Res Res
Left 0 0 0.0% 0.0% 0.0% 0.0% 0.0% 0.0% 0.0% 15.0% 0.0% 0.0% 0 0 0 0 0 0 0 0 0 0 0 0 0 1 0 1 0 1 0 2 0 2 0 0 0 4 0 11 11Thru 2 3 0.0% 0.0% 0.0% 0.0% 0.0% 0.0% 0.0% 0.0% 0.0% 0.0% 0 0 0 0 0 0 0 0 0 0 0 0 0 0 0 0 0 0 0 0 0 0 0 0 0 0 -3 0 0Right 5 6 15.0% 0.0% 15.0% 0.0% 15.0% 0.0% 0.0% 50.0% 0.0% 0.0% 14 0 14 0 3 0 14 0 14 0 1 0 0 3 0 3 0 4 0 8 0 7 0 0 0 14 3 99 108Left 4 5 0.0% 0.0% 0.0% 0.0% 0.0% 0.0% 0.0% 0.0% 0.0% 0.0% 0 0 0 0 0 0 0 0 0 0 0 0 0 0 0 0 0 0 0 0 0 0 0 0 0 0 -5 0 0Thru 17 19 0.0% 0.0% 0.0% 0.0% 0.0% 0.0% 0.0% 0.0% 0.0% 0.0% 0 0 0 0 0 0 0 0 0 0 0 0 0 0 0 0 0 0 0 0 0 0 0 0 0 0 -19 0 0Right 272 294 0.0% 0.0% 0.0% 0.0% 0.0% 0.0% 0.0% 0.0% 0.0% 0.0% 0 0 0 0 0 0 0 0 0 0 0 0 0 0 0 0 0 0 0 0 0 0 0 0 0 0 -294 0 0Left 30 33 0.0% 15.0% 0.0% 15.0% 0.0% 15.0% 50.0% 0.0% 0.0% 0.0% 0 7 0 7 0 13 0 1 0 6 0 3 33 0 15 0 16 0 2 0 2 0 0 0 62 0 19 167 219Thru 173 187 0.0% 25.0% 0.0% 25.0% 0.0% 25.0% 0.0% 0.0% 0.0% 15.0% 0 12 0 12 0 22 0 2 0 9 0 5 0 0 0 0 0 0 0 0 0 0 0 1 0 0 294 63 544Right 2 3 0.0% 0.0% 0.0% 0.0% 0.0% 0.0% 0.0% 0.0% 0.0% 0.0% 0 0 0 0 0 0 0 0 0 0 0 0 0 0 0 0 0 0 0 0 0 0 0 0 0 0 -3 0 0Left 610 658 0.0% 0.0% 0.0% 0.0% 0.0% 0.0% 0.0% 0.0% 0.0% 0.0% 0 0 0 0 0 0 0 0 0 0 0 0 0 0 0 0 0 0 0 0 0 0 0 0 0 0 -658 0 0Thru 683 737 25.0% 0.0% 25.0% 0.0% 25.0% 0.0% 0.0% 0.0% 15.0% 0.0% 23 0 23 0 6 0 24 0 23 0 1 0 0 0 0 0 0 0 0 0 0 0 14 0 0 0 658 114 1509Right 0 0 0.0% 0.0% 0.0% 0.0% 0.0% 0.0% 15.0% 0.0% 0.0% 0.0% 0 0 0 0 0 0 0 0 0 0 0 0 10 0 5 0 5 0 0 0 0 0 0 0 19 0 0 39 39
Totals: 1798 1945 493 2430 Totals
year year2017 2032
Left 9 10 0.0% 0.0% 0.0% 0.0% 0.0% 0.0% 0.0% 0.0% 0.0% 0.0% 0 0 0 0 0 0 0 0 0 0 0 0 0 0 0 0 0 0 0 0 0 0 0 0 0 0 0 0 10Thru 1 2 0.0% 0.0% 0.0% 0.0% 0.0% 0.0% 0.0% 0.0% 0.0% 0.0% 0 0 0 0 0 0 0 0 0 0 0 0 0 0 0 0 0 0 0 0 0 0 0 0 0 0 0 0 2Right 132 143 0.0% 0.0% 0.0% 0.0% 0.0% 0.0% 0.0% 0.0% 0.0% 0.0% 0 0 0 0 0 0 0 0 0 0 0 0 0 0 0 0 0 0 0 0 0 0 0 0 0 0 0 0 143Left 1 2 0.0% 0.0% 0.0% 0.0% 0.0% 0.0% 0.0% 0.0% 0.0% 0.0% 0 0 0 0 0 0 0 0 0 0 0 0 0 0 0 0 0 0 0 0 0 0 0 0 0 0 0 0 2Thru 0 0 0.0% 0.0% 0.0% 0.0% 0.0% 0.0% 0.0% 0.0% 0.0% 0.0% 0 0 0 0 0 0 0 0 0 0 0 0 0 0 0 0 0 0 0 0 0 0 0 0 0 0 0 0 0Right 0 0 0.0% 0.0% 0.0% 0.0% 0.0% 0.0% 0.0% 0.0% 0.0% 0.0% 0 0 0 0 0 0 0 0 0 0 0 0 0 0 0 0 0 0 0 0 0 0 0 0 0 0 0 0 0Left 48 52 0.0% 0.0% 0.0% 0.0% 0.0% 0.0% 0.0% 0.0% 0.0% 0.0% 0 0 0 0 0 0 0 0 0 0 0 0 0 0 0 0 0 0 0 0 0 0 0 0 0 0 0 0 52Thru 382 412 0.0% 25.0% 0.0% 25.0% 0.0% 25.0% 0.0% 15.0% 0.0% 15.0% 0 12 0 12 0 22 0 2 0 9 0 5 0 1 0 1 0 1 0 2 0 2 0 1 0 4 0 74 486Right 9 10 0.0% 0.0% 0.0% 0.0% 0.0% 0.0% 0.0% 0.0% 0.0% 0.0% 0 0 0 0 0 0 0 0 0 0 0 0 0 0 0 0 0 0 0 0 0 0 0 0 0 0 0 0 10Left 3 4 0.0% 0.0% 0.0% 0.0% 0.0% 0.0% 0.0% 0.0% 0.0% 0.0% 0 0 0 0 0 0 0 0 0 0 0 0 0 0 0 0 0 0 0 0 0 0 0 0 0 0 0 0 4Thru 1167 1258 25.0% 0.0% 25.0% 0.0% 25.0% 0.0% 15.0% 0.0% 15.0% 0.0% 23 0 23 0 6 0 24 0 23 0 1 0 10 0 5 0 5 0 0 0 0 0 14 0 19 0 0 153 1411Right 17 19 0.0% 0.0% 0.0% 0.0% 0.0% 0.0% 0.0% 0.0% 0.0% 0.0% 0 0 0 0 0 0 0 0 0 0 0 0 0 0 0 0 0 0 0 0 0 0 0 0 0 0 0 0 19
Totals: 1769 1912 227 2139 Totals
year year2017 2032
Left 0 0 0.0% 0.0% 0.0% 0.0% 0.0% 0.0% 0.0% 0.0% 0.0% 0.0% 0 0 0 0 0 0 0 0 0 0 0 0 0 0 0 0 0 0 0 0 0 0 0 0 0 0 0 0 0Thru 0 0 0.0% 0.0% 0.0% 0.0% 0.0% 0.0% 0.0% 0.0% 0.0% 0.0% 0 0 0 0 0 0 0 0 0 0 0 0 0 0 0 0 0 0 0 0 0 0 0 0 0 0 0 0 0Right 0 0 0.0% 0.0% 0.0% 0.0% 0.0% 0.0% 0.0% 0.0% 0.0% 0.0% 0 0 0 0 0 0 0 0 0 0 0 0 0 0 0 0 0 0 0 0 0 0 0 0 0 0 0 0 0Left 0 0 30.0% 0.0% 0.0% 30.0% 0.0% 0.0% 0.0% 0.0% 30.0% 0.0% 27 0 27 0 0 26 0 3 0 0 0 0 0 0 0 0 0 0 0 0 0 0 29 0 0 0 5 112 117Thru 0 0 0.0% 0.0% 0.0% 0.0% 0.0% 0.0% 0.0% 0.0% 0.0% 0.0% 0 0 0 0 0 0 0 0 0 0 0 0 0 0 0 0 0 0 0 0 0 0 0 0 0 0 0 0 0Right 0 0 0.0% 0.0% 0.0% 40.0% 30.0% 0.0% 30.0% 0.0% 0.0% 0.0% 0 0 0 0 0 34 0 4 28 0 2 0 20 0 9 0 9 0 1 0 1 0 0 0 37 0 313 145 458Left 0 0 0.0% 0.0% 0.0% 0.0% 0.0% 0.0% 0.0% 0.0% 0.0% 0.0% 0 0 0 0 0 0 0 0 0 0 0 0 0 0 0 0 0 0 0 0 0 0 0 0 0 0 0 0 0Thru 0 0 0.0% 40.0% 0.0% 0.0% 30.0% 0.0% 30.0% 0.0% 0.0% 15.0% 0 19 0 19 0 0 0 0 28 0 2 0 20 0 9 0 9 0 1 0 1 0 0 1 37 0 217 146 363Right 0 0 0.0% 30.0% 0.0% 0.0% 0.0% 0.0% 0.0% 0.0% 0.0% 30.0% 0 14 0 14 0 0 0 0 0 0 0 0 0 0 0 0 0 0 0 0 0 0 0 3 0 0 3 31 34Left 0 0 0.0% 0.0% 0.0% 0.0% 0.0% 30.0% 0.0% 30.0% 0.0% 0.0% 0 0 0 0 0 0 0 0 0 11 0 6 0 2 0 2 0 2 0 5 0 4 0 0 0 8 661 40 701Thru 0 0 40.0% 0.0% 0.0% 0.0% 0.0% 30.0% 0.0% 30.0% 15.0% 0.0% 36 0 36 0 0 0 0 0 0 11 0 6 0 2 0 2 0 2 0 5 0 4 14 0 0 8 743 126 869Right 0 0 0.0% 0.0% 0.0% 0.0% 0.0% 0.0% 0.0% 0.0% 0.0% 0.0% 0 0 0 0 0 0 0 0 0 0 0 0 0 0 0 0 0 0 0 0 0 0 0 0 0 0 0 0 0
Totals: 0 0 600 2542 Totals
year year Dev Dev Build2017 2032 Traffic Traffic Traffic
EB Left 8 9 0.0% 0.0% 0.0% 0.0% 0.0% 0.0% 0.0% 0.0% 0.0% 0.0% 0 0 0 0 0 0 0 0 0 0 0 0 0 0 0 0 0 0 0 0 0 0 0 0 0 0 0 0 9Thru 4 5 5.0% 0.0% 5.0% 0.0% 5.0% 0.0% 10.0% 0.0% 0.0% 0.0% 5 0 5 0 1 0 5 0 5 0 0 0 7 0 3 0 3 0 0 0 0 0 0 0 12 0 0 46 51Right 4 5 0.0% 0.0% 0.0% 0.0% 0.0% 0.0% 0.0% 0.0% 10.0% 0.0% 0 0 0 0 0 0 0 0 0 0 0 0 0 0 0 0 0 0 0 0 0 0 10 0 0 0 0 10 15
WB Left 7 8 0.0% 5.0% 0.0% 5.0% 0.0% 5.0% 0.0% 10.0% 0.0% 0.0% 0 2 0 2 0 4 0 0 0 2 0 1 0 1 0 1 0 1 0 2 0 1 0 0 0 3 0 20 28Thru 4 5 0.0% 5.0% 0.0% 5.0% 0.0% 5.0% 0.0% 10.0% 0.0% 0.0% 0 2 0 2 0 4 0 0 0 2 0 1 0 1 0 1 0 1 0 2 0 1 0 0 0 3 0 20 25Right 4 5 0.0% 5.0% 0.0% 5.0% 0.0% 5.0% 0.0% 15.0% 0.0% 0.0% 0 2 0 2 0 4 0 0 0 2 0 1 0 1 0 1 0 1 0 2 0 2 0 0 0 4 0 22 27
NB Left 1 2 0.0% 0.0% 0.0% 0.0% 0.0% 0.0% 0.0% 0.0% 0.0% 10.0% 0 0 0 0 0 0 0 0 0 0 0 0 0 0 0 0 0 0 0 0 0 0 0 1 0 0 0 1 3Thru 287 310 0.0% 0.0% 0.0% 0.0% 0.0% 0.0% 0.0% 0.0% 0.0% 15.0% 0 0 0 0 0 0 0 0 0 0 0 0 0 0 0 0 0 0 0 0 0 0 0 1 0 0 0 1 311Right 28 31 5.0% 0.0% 5.0% 0.0% 5.0% 0.0% 10.0% 0.0% 0.0% 0.0% 5 0 5 0 1 0 5 0 5 0 0 0 7 0 3 0 3 0 0 0 0 0 0 0 12 0 0 46 77
SB Left 23 25 5.0% 0.0% 5.0% 0.0% 5.0% 0.0% 15.0% 0.0% 0.0% 0.0% 5 0 5 0 1 0 5 0 5 0 0 0 10 0 5 0 5 0 0 0 0 0 0 0 19 0 0 60 85Thru 641 691 0.0% 0.0% 0.0% 0.0% 0.0% 0.0% 0.0% 0.0% 15.0% 0.0% 0 0 0 0 0 0 0 0 0 0 0 0 0 0 0 0 0 0 0 0 0 0 14 0 0 0 0 14 705Right 27 30 0.0% 0.0% 0.0% 0.0% 0.0% 0.0% 0.0% 0.0% 0.0% 0.0% 0 0 0 0 0 0 0 0 0 0 0 0 0 0 0 0 0 0 0 0 0 0 0 0 0 0 0 0 30
Totals: 1038 1126 240 1366 Totals
Adjustment proposed
Maplewood
Parcel 1.10 Parcel 1.11 Parcel 2.1 Parcel 2.5Parcel 1.2 Parcel 1.9
2.1,2.2,2.3,2.4,2.5,2.8
En
EB
WB
NB
SB
NB
WB
Lake Ave and Eastman Ave
Lake Ave and Merril St
EB
SB
2.1,2.2,2.3,2.4,2.5,2.8
Ex
Eastman Ave and Dewey Ave
Parcel 2.8Parcel 2.2 Parcel 2.3 Parcel 2.4 Parcel 2.7
WB
NB
SB
1.10,1.11 En
Parcel 1.1 Parcel 1.3
EB
1.10,1.11 Ex
Lake Ave and Maplewood Prop
Eastman Trip Generation AM.xlsx 1

Weekday PM Peak HourEastman Business Park
Varies Varies Res Res Res Res Off Off Res Res Res Res Res Res Varies Varies Varies Varies Varies Varies Varies Varies Varies Varies Res ResLU Code LU Code LU Code LU Code LU Code LU Code LU Code LU Code LU Code LU Code LU Code LU Code LU Code LU Code LU Code LU Code LU Code LU Code LU Code LU Code LU Code LU Code LU Code LU Code LU Code LU CodeVaries Varies 220/230 220/230 Varies Varies 710 710 210 210 411 411 710 710 Varies Varies
Total Trips Total Trips 218 218 40 40 141 141 134 134 167 167 33 33 92 92 51 51 58 58 23 23 23 23 134 134 217 217Shared/Pass By Trips Shared/Pass By Trips81 81 10 10 32 32 29 29 38 38 7 7 20 20 16 16 19 19 5 5 7 7 29 29 66 66
Parcel # Parcel # Parcel # Parcel # Parcel # Parcel # Parcel # Parcel # Parcel # Parcel # Enter Enter Enter Enter Enter Enter Enter Enter Enter Enter Enter Enter Enter Enter Enter Enter Enter Enter Enter Enter Enter Enter Enter Enter Enter Enter1.1,1.2 En 1.1,1.2 Ex 1.3,1.9 En 1.3,1.9 Ex 2.7 En 2.7 Ex 96 96 26 26 77 77 20 20 50 50 23 23 16 16 10 10 16 16 17 17 11 11 20 20 54 54
Exit Exit Exit Exit Exit Exit Exit Exit Exit Exit Exit Exit Exit Exit Exit Exit Exit Exit Exit Exit Exit Exit Exit Exit Exit Exit138 138 13 13 42 42 102 102 112 112 11 11 84 84 28 28 28 28 8 8 5 5 102 102 140 140
Prim. Trips Prim. Trips Prim. Trips Prim. Trips Prim. Trips Prim. Trips Prim. Trips Prim. Trips Prim. Trips Prim. Trips Prim. Trips Prim. Trips Prim. Trips Prim. Trips Prim. Trips Prim. Trips Prim. Trips Prim. Trips Prim. Trips Prim. Trips Prim. Trips Prim. Trips Prim. Trips Prim. Trips Prim. Trips Prim. Trips Dev Build137 137 30 30 109 109 105 105 129 129 26 26 72 72 35 35 39 39 18 18 16 16 105 105 151 151 Traffic Traffic
year year Distribution Distribution Distribution Distribution Distribution Distribution Distribution Distribution Distribution Distribution Parcel 1.1 0 Parcel 1.2 0 Parcel 1.3 0 Parcel 1.9 0 Parcel 1.10 0 Parcel 1.11 0 Parcel 2.1 0 Parcel 2.2 0 Parcel 2.3 0 Parcel 2.4 0 Parcel 2.5 0 Parcel 2.7 0 Parcel 2.8 02017 2032 Percents Percents Percents Percents Percents Percents Percents Percents Percents Percents Varies Varies Res Res Res Res Off Off Res Res Res Res Res Res Varies Varies Varies Varies Varies Varies Varies Varies Varies Varies Res Res
Left 1 2 0.0% 0.0% 0.0% 0.0% 0.0% 0.0% 0.0% 15.0% 0.0% 0.0% 0 0 0 0 0 0 0 0 0 0 0 0 0 13 0 4 0 4 0 1 0 1 0 0 0 21 0 44 46Thru 24 26 0.0% 0.0% 0.0% 0.0% 0.0% 0.0% 0.0% 0.0% 0.0% 0.0% 0 0 0 0 0 0 0 0 0 0 0 0 0 0 0 0 0 0 0 0 0 0 0 0 0 0 -26 0 0Right 21 23 15.0% 0.0% 15.0% 0.0% 15.0% 0.0% 0.0% 50.0% 0.0% 0.0% 14 0 14 0 12 0 3 0 8 0 3 0 0 42 0 14 0 14 0 4 0 3 0 0 0 70 26 201 250Left 5 6 0.0% 0.0% 0.0% 0.0% 0.0% 0.0% 0.0% 0.0% 0.0% 0.0% 0 0 0 0 0 0 0 0 0 0 0 0 0 0 0 0 0 0 0 0 0 0 0 0 0 0 -6 0 0Thru 2 3 0.0% 0.0% 0.0% 0.0% 0.0% 0.0% 0.0% 0.0% 0.0% 0.0% 0 0 0 0 0 0 0 0 0 0 0 0 0 0 0 0 0 0 0 0 0 0 0 0 0 0 -3 0 0Right 778 839 0.0% 0.0% 0.0% 0.0% 0.0% 0.0% 0.0% 0.0% 0.0% 0.0% 0 0 0 0 0 0 0 0 0 0 0 0 0 0 0 0 0 0 0 0 0 0 0 0 0 0 -839 0 0Left 2 3 0.0% 15.0% 0.0% 15.0% 0.0% 15.0% 50.0% 0.0% 0.0% 0.0% 0 21 0 21 0 6 0 15 0 17 0 2 8 0 5 0 8 0 9 0 6 0 0 0 27 0 3 145 151Thru 544 587 0.0% 25.0% 0.0% 25.0% 0.0% 25.0% 0.0% 0.0% 0.0% 15.0% 0 35 0 35 0 11 0 26 0 28 0 3 0 0 0 0 0 0 0 0 0 0 0 15 0 0 839 153 1579Right 2 3 0.0% 0.0% 0.0% 0.0% 0.0% 0.0% 0.0% 0.0% 0.0% 0.0% 0 0 0 0 0 0 0 0 0 0 0 0 0 0 0 0 0 0 0 0 0 0 0 0 0 0 -3 0 0Left 278 300 0.0% 0.0% 0.0% 0.0% 0.0% 0.0% 0.0% 0.0% 0.0% 0.0% 0 0 0 0 0 0 0 0 0 0 0 0 0 0 0 0 0 0 0 0 0 0 0 0 0 0 -300 0 0Thru 264 285 25.0% 0.0% 25.0% 0.0% 25.0% 0.0% 0.0% 0.0% 15.0% 0.0% 24 0 24 0 19 0 5 0 13 0 6 0 0 0 0 0 0 0 0 0 0 0 3 0 0 0 300 94 679Right 0 0 0.0% 0.0% 0.0% 0.0% 0.0% 0.0% 15.0% 0.0% 0.0% 0.0% 0 0 0 0 0 0 0 0 0 0 0 0 2 0 2 0 2 0 3 0 2 0 0 0 8 0 0 19 19
Totals: 1921 2077 656 2724 Totals
year year2017 2032
Left 23 25 0.0% 0.0% 0.0% 0.0% 0.0% 0.0% 0.0% 0.0% 0.0% 0.0% 0 0 0 0 0 0 0 0 0 0 0 0 0 0 0 0 0 0 0 0 0 0 0 0 0 0 0 0 25Thru 1 2 0.0% 0.0% 0.0% 0.0% 0.0% 0.0% 0.0% 0.0% 0.0% 0.0% 0 0 0 0 0 0 0 0 0 0 0 0 0 0 0 0 0 0 0 0 0 0 0 0 0 0 0 0 2Right 55 60 0.0% 0.0% 0.0% 0.0% 0.0% 0.0% 0.0% 0.0% 0.0% 0.0% 0 0 0 0 0 0 0 0 0 0 0 0 0 0 0 0 0 0 0 0 0 0 0 0 0 0 0 0 60Left 5 6 0.0% 0.0% 0.0% 0.0% 0.0% 0.0% 0.0% 0.0% 0.0% 0.0% 0 0 0 0 0 0 0 0 0 0 0 0 0 0 0 0 0 0 0 0 0 0 0 0 0 0 0 0 6Thru 1 2 0.0% 0.0% 0.0% 0.0% 0.0% 0.0% 0.0% 0.0% 0.0% 0.0% 0 0 0 0 0 0 0 0 0 0 0 0 0 0 0 0 0 0 0 0 0 0 0 0 0 0 0 0 2Right 2 3 0.0% 0.0% 0.0% 0.0% 0.0% 0.0% 0.0% 0.0% 0.0% 0.0% 0 0 0 0 0 0 0 0 0 0 0 0 0 0 0 0 0 0 0 0 0 0 0 0 0 0 0 0 3Left 155 168 0.0% 0.0% 0.0% 0.0% 0.0% 0.0% 0.0% 0.0% 0.0% 0.0% 0 0 0 0 0 0 0 0 0 0 0 0 0 0 0 0 0 0 0 0 0 0 0 0 0 0 0 0 168Thru 1143 1232 0.0% 25.0% 0.0% 25.0% 0.0% 25.0% 0.0% 15.0% 0.0% 15.0% 0 35 0 35 0 11 0 26 0 28 0 3 0 13 0 4 0 4 0 1 0 1 0 15 0 21 0 197 1429Right 0 0 0.0% 0.0% 0.0% 0.0% 0.0% 0.0% 0.0% 0.0% 0.0% 0.0% 0 0 0 0 0 0 0 0 0 0 0 0 0 0 0 0 0 0 0 0 0 0 0 0 0 0 0 0 0Left 0 0 0.0% 0.0% 0.0% 0.0% 0.0% 0.0% 0.0% 0.0% 0.0% 0.0% 0 0 0 0 0 0 0 0 0 0 0 0 0 0 0 0 0 0 0 0 0 0 0 0 0 0 0 0 0Thru 470 507 25.0% 0.0% 25.0% 0.0% 25.0% 0.0% 15.0% 0.0% 15.0% 0.0% 24 0 24 0 19 0 5 0 13 0 6 0 2 0 2 0 2 0 3 0 2 0 3 0 8 0 0 113 620Right 11 12 0.0% 0.0% 0.0% 0.0% 0.0% 0.0% 0.0% 0.0% 0.0% 0.0% 0 0 0 0 0 0 0 0 0 0 0 0 0 0 0 0 0 0 0 0 0 0 0 0 0 0 0 0 12
Totals: 1866 2017 310 2327 Totals
year year2017 2032
Left 0 0 0.0% 0.0% 0.0% 0.0% 0.0% 0.0% 0.0% 0.0% 0.0% 0.0% 0 0 0 0 0 0 0 0 0 0 0 0 0 0 0 0 0 0 0 0 0 0 0 0 0 0 0 0 0Thru 0 0 0.0% 0.0% 0.0% 0.0% 0.0% 0.0% 0.0% 0.0% 0.0% 0.0% 0 0 0 0 0 0 0 0 0 0 0 0 0 0 0 0 0 0 0 0 0 0 0 0 0 0 0 0 0Right 0 0 0.0% 0.0% 0.0% 0.0% 0.0% 0.0% 0.0% 0.0% 0.0% 0.0% 0 0 0 0 0 0 0 0 0 0 0 0 0 0 0 0 0 0 0 0 0 0 0 0 0 0 0 0 0Left 0 0 30.0% 0.0% 0.0% 30.0% 0.0% 0.0% 0.0% 0.0% 30.0% 0.0% 29 0 29 0 0 13 0 31 0 0 0 0 0 0 0 0 0 0 0 0 0 0 6 0 0 0 6 108 114Thru 0 0 0.0% 0.0% 0.0% 0.0% 0.0% 0.0% 0.0% 0.0% 0.0% 0.0% 0 0 0 0 0 0 0 0 0 0 0 0 0 0 0 0 0 0 0 0 0 0 0 0 0 0 0 0 0Right 0 0 0.0% 0.0% 0.0% 40.0% 30.0% 0.0% 30.0% 0.0% 0.0% 0.0% 0 0 0 0 0 17 0 41 15 0 7 0 5 0 3 0 5 0 5 0 3 0 0 0 16 0 842 117 959Left 0 0 0.0% 0.0% 0.0% 0.0% 0.0% 0.0% 0.0% 0.0% 0.0% 0.0% 0 0 0 0 0 0 0 0 0 0 0 0 0 0 0 0 0 0 0 0 0 0 0 0 0 0 0 0 0Thru 0 0 0.0% 40.0% 0.0% 0.0% 30.0% 0.0% 30.0% 0.0% 0.0% 15.0% 0 55 0 55 0 0 0 0 15 0 7 0 5 0 3 0 5 0 5 0 3 0 0 15 16 0 587 184 771Right 0 0 0.0% 30.0% 0.0% 0.0% 0.0% 0.0% 0.0% 0.0% 0.0% 30.0% 0 41 0 41 0 0 0 0 0 0 0 0 0 0 0 0 0 0 0 0 0 0 0 31 0 0 3 113 116Left 0 0 0.0% 0.0% 0.0% 0.0% 0.0% 30.0% 0.0% 30.0% 0.0% 0.0% 0 0 0 0 0 0 0 0 0 34 0 3 0 25 0 8 0 8 0 2 0 2 0 0 0 42 326 124 450Thru 0 0 40.0% 0.0% 0.0% 0.0% 0.0% 30.0% 0.0% 30.0% 15.0% 0.0% 38 0 38 0 0 0 0 0 0 34 0 3 0 25 0 8 0 8 0 2 0 2 3 0 0 42 308 203 511Right 0 0 0.0% 0.0% 0.0% 0.0% 0.0% 0.0% 0.0% 0.0% 0.0% 0.0% 0 0 0 0 0 0 0 0 0 0 0 0 0 0 0 0 0 0 0 0 0 0 0 0 0 0 0 0 0
Totals: 0 0 849 2921 Totals
year year Dev Dev Build2017 2032 Traffic Traffic Traffic
EB Left 37 40 0.0% 0.0% 0.0% 0.0% 0.0% 0.0% 0.0% 0.0% 0.0% 0.0% 0 0 0 0 0 0 0 0 0 0 0 0 0 0 0 0 0 0 0 0 0 0 0 0 0 0 0 0 40Thru 0 0 5.0% 0.0% 5.0% 0.0% 5.0% 0.0% 10.0% 0.0% 0.0% 0.0% 5 0 5 0 4 0 1 0 3 0 1 0 2 0 1 0 2 0 2 0 1 0 0 0 5 0 0 32 32Right 10 11 0.0% 0.0% 0.0% 0.0% 0.0% 0.0% 0.0% 0.0% 10.0% 0.0% 0 0 0 0 0 0 0 0 0 0 0 0 0 0 0 0 0 0 0 0 0 0 2 0 0 0 0 2 13
WB Left 9 10 0.0% 5.0% 0.0% 5.0% 0.0% 5.0% 0.0% 10.0% 0.0% 0.0% 0 7 0 7 0 2 0 5 0 6 0 1 0 8 0 3 0 3 0 1 0 1 0 0 0 14 0 58 68Thru 33 36 0.0% 5.0% 0.0% 5.0% 0.0% 5.0% 0.0% 10.0% 0.0% 0.0% 0 7 0 7 0 2 0 5 0 6 0 1 0 8 0 3 0 3 0 1 0 1 0 0 0 14 0 58 94Right 25 27 0.0% 5.0% 0.0% 5.0% 0.0% 5.0% 0.0% 15.0% 0.0% 0.0% 0 7 0 7 0 2 0 5 0 6 0 1 0 13 0 4 0 4 0 1 0 1 0 0 0 21 0 72 99
NB Left 7 8 0.0% 0.0% 0.0% 0.0% 0.0% 0.0% 0.0% 0.0% 0.0% 10.0% 0 0 0 0 0 0 0 0 0 0 0 0 0 0 0 0 0 0 0 0 0 0 0 10 0 0 0 10 18Thru 653 704 0.0% 0.0% 0.0% 0.0% 0.0% 0.0% 0.0% 0.0% 0.0% 15.0% 0 0 0 0 0 0 0 0 0 0 0 0 0 0 0 0 0 0 0 0 0 0 0 15 0 0 0 15 719Right 11 12 5.0% 0.0% 5.0% 0.0% 5.0% 0.0% 10.0% 0.0% 0.0% 0.0% 5 0 5 0 4 0 1 0 3 0 1 0 2 0 1 0 2 0 2 0 1 0 0 0 5 0 0 32 44
SB Left 5 6 5.0% 0.0% 5.0% 0.0% 5.0% 0.0% 15.0% 0.0% 0.0% 0.0% 5 0 5 0 4 0 1 0 3 0 1 0 2 0 2 0 2 0 3 0 2 0 0 0 8 0 0 38 44Thru 497 536 0.0% 0.0% 0.0% 0.0% 0.0% 0.0% 0.0% 0.0% 15.0% 0.0% 0 0 0 0 0 0 0 0 0 0 0 0 0 0 0 0 0 0 0 0 0 0 3 0 0 0 0 3 539Right 45 49 0.0% 0.0% 0.0% 0.0% 0.0% 0.0% 0.0% 0.0% 0.0% 0.0% 0 0 0 0 0 0 0 0 0 0 0 0 0 0 0 0 0 0 0 0 0 0 0 0 0 0 0 0 49
Totals: 1332 1439 320 1759 Totals
Adjustment proposed
Maplewood
Parcel 1.10 Parcel 1.11 Parcel 2.1 Parcel 2.5Parcel 1.2 Parcel 1.9
2.1,2.2,2.3,2.4,2.5,2.8
En
EB
WB
NB
SB
NB
WB
Lake Ave and Eastman Ave
Lake Ave and Merril St
EB
SB
2.1,2.2,2.3,2.4,2.5,2.8
Ex
Eastman Ave and Dewey Ave
Parcel 2.8Parcel 2.2 Parcel 2.3 Parcel 2.4 Parcel 2.7
WB
NB
SB
1.10,1.11 En
Parcel 1.1 Parcel 1.3
EB
1.10,1.11 Ex
Lake Ave and Maplewood Prop
Eastman Trip Generation PM.xlsx 1

Appendix F
2032 Full Build LOS
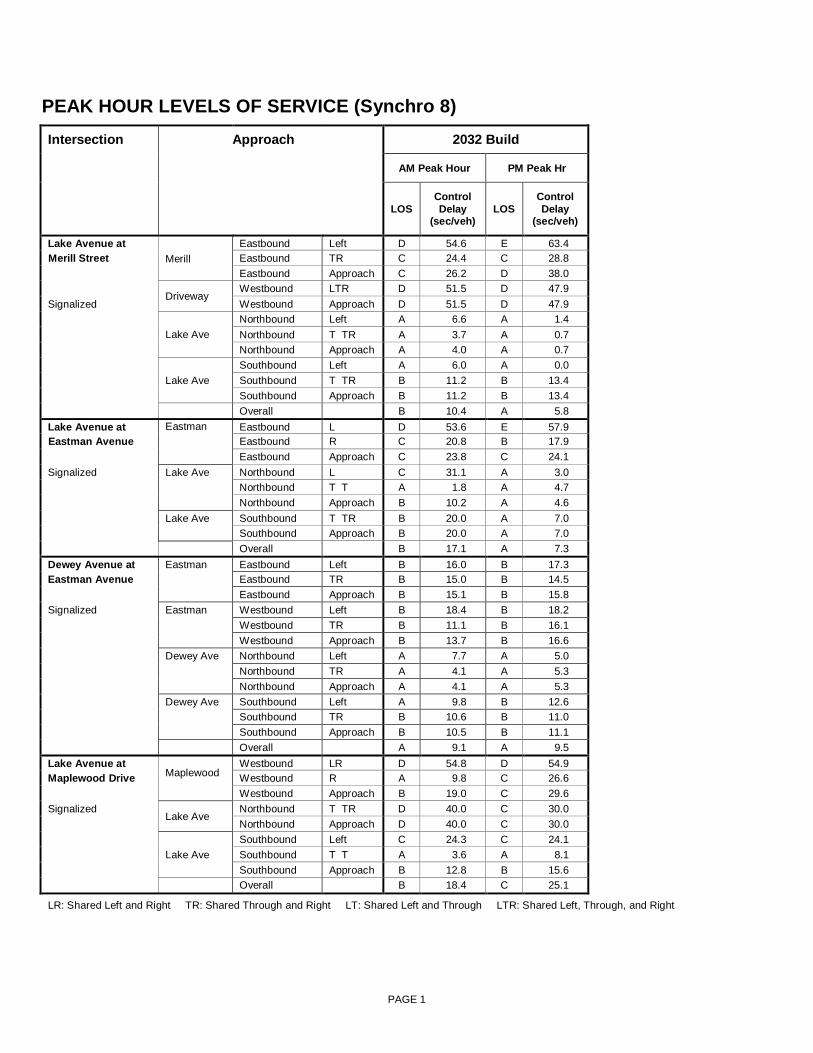
PAGE 1
PEAK HOUR LEVELS OF SERVICE (Synchro 8)
Intersection Approach 2032 Build
AM Peak Hour PM Peak Hr
LOS Control Delay
(sec/veh) LOS
Control Delay
(sec/veh)
Lake Avenue at Merill
Eastbound Left D 54.6 E 63.4 Merill Street Eastbound TR C 24.4 C 28.8 Eastbound Approach C 26.2 D 38.0
Driveway Westbound LTR D 51.5 D 47.9
Signalized Westbound Approach D 51.5 D 47.9
Lake Ave Northbound Left A 6.6 A 1.4
Northbound T TR A 3.7 A 0.7 Northbound Approach A 4.0 A 0.7
Lake Ave Southbound Left A 6.0 A 0.0
Southbound T TR B 11.2 B 13.4 Southbound Approach B 11.2 B 13.4 Overall B 10.4 A 5.8 Lake Avenue at Eastman
Eastbound L D 53.6 E 57.9
Eastman Avenue Eastbound R C 20.8 B 17.9 Eastbound Approach C 23.8 C 24.1 Signalized Lake Ave Northbound L C 31.1 A 3.0 Northbound T T A 1.8 A 4.7 Northbound Approach B 10.2 A 4.6 Lake Ave Southbound T TR B 20.0 A 7.0 Southbound Approach B 20.0 A 7.0 Overall B 17.1 A 7.3 Dewey Avenue at Eastman Eastbound Left B 16.0 B 17.3 Eastman Avenue Eastbound TR B 15.0 B 14.5 Eastbound Approach B 15.1 B 15.8 Signalized Eastman Westbound Left B 18.4 B 18.2 Westbound TR B 11.1 B 16.1 Westbound Approach B 13.7 B 16.6 Dewey Ave Northbound Left A 7.7 A 5.0 Northbound TR A 4.1 A 5.3 Northbound Approach A 4.1 A 5.3 Dewey Ave Southbound Left A 9.8 B 12.6 Southbound TR B 10.6 B 11.0 Southbound Approach B 10.5 B 11.1 Overall A 9.1 A 9.5 Lake Avenue at
Maplewood
Westbound LR D 54.8 D 54.9 Maplewood Drive Westbound R A 9.8 C 26.6 Westbound Approach B 19.0 C 29.6 Signalized
Lake Ave Northbound T TR D 40.0 C 30.0
Northbound Approach D 40.0 C 30.0
Lake Ave Southbound Left C 24.3 C 24.1
Southbound T T A 3.6 A 8.1 Southbound Approach B 12.8 B 15.6 Overall B 18.4 C 25.1
LR: Shared Left and Right TR: Shared Through and Right LT: Shared Left and Through LTR: Shared Left, Through, and Right

Appendix G
Synchro Reports
2017 Existing
2032 No Build
2032 Build

Lanes, Volumes, Timings14: Dewey & Eastman 4/10/2017
7:30 am Baseline Synchro 8 ReportPage 1
Lane Group EBL EBT EBR WBL WBT WBR NBL NBT NBR SBL SBT SBRLane ConfigurationsVolume (vph) 8 4 4 7 4 4 1 287 28 23 641 27Ideal Flow (vphpl) 1900 1900 1900 1900 1900 1900 1900 1900 1900 1900 1900 1900Lane Width (ft) 10 10 10 10 10 10 10 10 10 10 10 10Storage Length (ft) 280 0 0 0 50 0 230 0Storage Lanes 1 0 1 0 1 0 1 0Taper Length (ft) 25 25 25 25Lane Util. Factor 1.00 1.00 1.00 1.00 1.00 1.00 1.00 0.95 0.95 1.00 0.95 0.95Frt 0.925 0.925 0.987 0.994Flt Protected 0.950 0.950 0.950 0.950Satd. Flow (prot) 1652 1608 0 1652 1608 0 1652 3260 0 1652 3283 0Flt Permitted 0.752 0.752 0.370 0.542Satd. Flow (perm) 1307 1608 0 1307 1608 0 643 3260 0 942 3283 0Right Turn on Red Yes Yes Yes YesSatd. Flow (RTOR) 4 4 20 8Link Speed (mph) 30 30 30 30Link Distance (ft) 583 686 580 1020Travel Time (s) 13.3 15.6 13.2 23.2Peak Hour Factor 0.90 0.90 0.90 0.90 0.90 0.90 0.90 0.90 0.90 0.90 0.90 0.90Adj. Flow (vph) 9 4 4 8 4 4 1 319 31 26 712 30Shared Lane Traffic (%)Lane Group Flow (vph) 9 8 0 8 8 0 1 350 0 26 742 0Enter Blocked Intersection No No No No No No No No No No No NoLane Alignment Left Left Right Left Left Right Left Left Right Left Left RightMedian Width(ft) 10 10 10 10Link Offset(ft) 0 0 0 0Crosswalk Width(ft) 16 16 16 16Two way Left Turn LaneHeadway Factor 1.09 1.09 1.09 1.09 1.09 1.09 1.09 1.09 1.09 1.09 1.09 1.09Turning Speed (mph) 15 9 15 9 15 9 15 9Number of Detectors 1 1 2 2 1 1 1 1Detector Template Leading Detector (ft) 15 15 45 45 19 19 19 19Trailing Detector (ft) 0 0 -10 -10 19 19 19 19Detector 1 Position(ft) 0 0 -10 -10 19 19 19 19Detector 1 Size(ft) 15 15 6 6 0 0 0 0Detector 1 Type Cl+Ex Cl+Ex Cl+Ex Cl+Ex Cl+Ex Cl+Ex Cl+Ex Cl+ExDetector 1 ChannelDetector 1 Extend (s) 0.0 0.0 0.0 0.0 0.0 0.0 0.0 0.0Detector 1 Queue (s) 0.0 0.0 0.0 0.0 0.0 0.0 0.0 0.0Detector 1 Delay (s) 0.0 0.0 0.0 0.0 0.0 0.0 0.0 0.0Detector 2 Position(ft) 39 39Detector 2 Size(ft) 6 6Detector 2 Type Cl+Ex Cl+ExDetector 2 ChannelDetector 2 Extend (s) 0.0 0.0Turn Type Perm NA Perm NA Perm NA Perm NAProtected Phases 2 2 1 1Permitted Phases 2 2 1 1

Lanes, Volumes, Timings14: Dewey & Eastman 4/10/2017
7:30 am Baseline Synchro 8 ReportPage 2
Lane Group EBL EBT EBR WBL WBT WBR NBL NBT NBR SBL SBT SBRDetector Phase 2 2 2 2 1 1 1 1Switch PhaseMinimum Initial (s) 6.0 6.0 6.0 6.0 23.0 23.0 23.0 23.0Minimum Split (s) 31.0 31.0 31.0 31.0 29.0 29.0 29.0 29.0Total Split (s) 31.0 31.0 31.0 31.0 29.0 29.0 29.0 29.0Total Split (%) 51.7% 51.7% 51.7% 51.7% 48.3% 48.3% 48.3% 48.3%Maximum Green (s) 25.5 25.5 25.5 25.5 23.0 23.0 23.0 23.0Yellow Time (s) 3.5 3.5 3.5 3.5 4.0 4.0 4.0 4.0All-Red Time (s) 2.0 2.0 2.0 2.0 2.0 2.0 2.0 2.0Lost Time Adjust (s) 0.0 0.0 0.0 0.0 0.0 0.0 0.0 0.0Total Lost Time (s) 5.5 5.5 5.5 5.5 6.0 6.0 6.0 6.0Lead/Lag Lag Lag Lag Lag Lead Lead Lead LeadLead-Lag Optimize?Vehicle Extension (s) 4.0 4.0 4.0 4.0 2.0 2.0 2.0 2.0Recall Mode None None None None C-Max C-Max C-Max C-MaxWalk Time (s) 7.0 7.0 7.0 7.0 7.0 7.0 7.0 7.0Flash Dont Walk (s) 18.0 18.0 18.0 18.0 16.0 16.0 16.0 16.0Pedestrian Calls (#/hr) 1 1 1 1 0 0 0 0Act Effct Green (s) 10.7 10.7 10.7 10.7 48.9 48.9 48.9 48.9Actuated g/C Ratio 0.18 0.18 0.18 0.18 0.82 0.82 0.82 0.82v/c Ratio 0.04 0.03 0.03 0.03 0.00 0.13 0.03 0.28Control Delay 17.4 15.3 16.4 12.6 7.0 3.2 6.7 6.1Queue Delay 0.0 0.0 0.0 0.0 0.0 0.0 0.0 0.0Total Delay 17.4 15.3 16.4 12.6 7.0 3.2 6.7 6.1LOS B B B B A A A AApproach Delay 16.4 14.5 3.2 6.1Approach LOS B B A AQueue Length 50th (ft) 4 1 3 1 0 0 0 0Queue Length 95th (ft) m4 m1 8 7 m1 41 24 181Internal Link Dist (ft) 503 606 500 940Turn Bay Length (ft) 280 50 230Base Capacity (vph) 555 685 555 685 524 2659 767 2676Starvation Cap Reductn 0 0 0 0 0 0 0 0Spillback Cap Reductn 0 0 0 0 0 0 0 0Storage Cap Reductn 0 0 0 0 0 0 0 0Reduced v/c Ratio 0.02 0.01 0.01 0.01 0.00 0.13 0.03 0.28
Intersection SummaryArea Type: OtherCycle Length: 60Actuated Cycle Length: 60Offset: 0 (0%), Referenced to phase 1:NBSB, Start of GreenNatural Cycle: 60Control Type: Actuated-CoordinatedMaximum v/c Ratio: 0.28Intersection Signal Delay: 5.5 Intersection LOS: AIntersection Capacity Utilization 35.4% ICU Level of Service AAnalysis Period (min) 15m Volume for 95th percentile queue is metered by upstream signal.
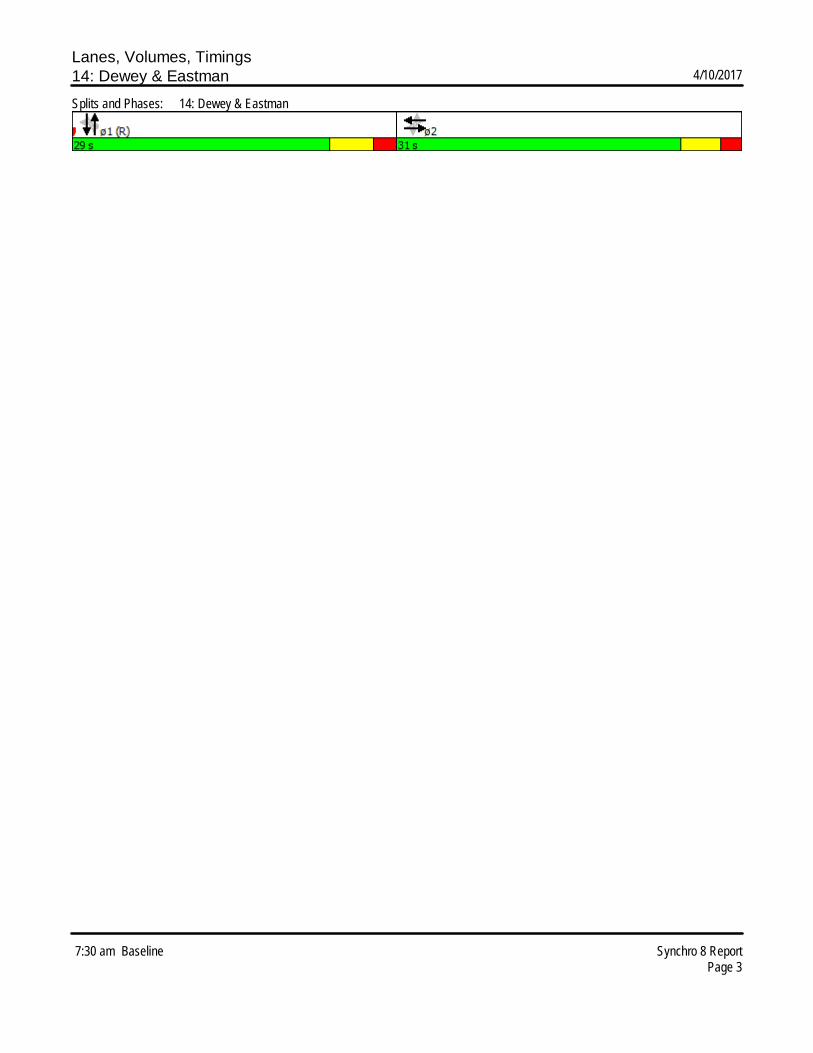
Lanes, Volumes, Timings14: Dewey & Eastman 4/10/2017
7:30 am Baseline Synchro 8 ReportPage 3
Splits and Phases: 14: Dewey & Eastman

Lanes, Volumes, Timings22: Lake & Merrill/Kodak 4/10/2017
7:30 am Baseline Synchro 8 ReportPage 4
Lane Group EBL EBT EBR WBL WBT WBR NBL NBT NBR SBL SBT SBRLane ConfigurationsVolume (vph) 9 1 132 1 0 0 48 382 9 3 1167 17Ideal Flow (vphpl) 1900 1900 1900 1900 1900 1900 1900 1900 1900 1900 1900 1900Lane Width (ft) 12 12 12 12 12 12 11 11 12 12 11 11Storage Length (ft) 125 0 0 0 125 0 125 0Storage Lanes 1 0 0 0 1 0 1 0Taper Length (ft) 25 25 25 25Lane Util. Factor 1.00 1.00 1.00 1.00 1.00 1.00 1.00 0.95 0.95 1.00 0.95 0.95Frt 0.851 0.997 0.998Flt Protected 0.950 0.950 0.950 0.950Satd. Flow (prot) 1770 1585 0 0 1770 0 1711 3411 0 1770 3414 0Flt Permitted 0.757 0.541 0.173 0.500Satd. Flow (perm) 1410 1585 0 0 1008 0 312 3411 0 931 3414 0Right Turn on Red Yes Yes Yes YesSatd. Flow (RTOR) 147 4 2Link Speed (mph) 30 30 35 35Link Distance (ft) 2670 307 1041 3113Travel Time (s) 60.7 7.0 20.3 60.6Peak Hour Factor 1.00 0.90 0.90 0.90 0.90 0.90 0.90 0.90 0.90 0.90 0.90 0.90Adj. Flow (vph) 9 1 147 1 0 0 53 424 10 3 1297 19Shared Lane Traffic (%)Lane Group Flow (vph) 9 148 0 0 1 0 53 434 0 3 1316 0Enter Blocked Intersection No No No No No No No No No No No NoLane Alignment Left Left Right Left Left Right Left Left Right Left Left RightMedian Width(ft) 12 12 12 12Link Offset(ft) 0 0 0 0Crosswalk Width(ft) 16 16 16 16Two way Left Turn LaneHeadway Factor 1.00 1.00 1.00 1.00 1.00 1.00 1.04 1.04 1.00 1.00 1.04 1.04Turning Speed (mph) 15 9 15 9 15 9 15 9Number of Detectors 1 1 1 1 1 1 1 1Detector Template Leading Detector (ft) 10 50 50 50 50 19 19 19Trailing Detector (ft) -10 0 0 0 0 19 19 19Detector 1 Position(ft) -10 0 0 0 0 19 19 19Detector 1 Size(ft) 20 50 50 50 50 0 0 0Detector 1 Type Cl+Ex Cl+Ex Cl+Ex Cl+Ex Cl+Ex Cl+Ex Cl+Ex Cl+ExDetector 1 ChannelDetector 1 Extend (s) 0.0 0.0 0.0 0.0 0.0 0.0 0.0 0.0Detector 1 Queue (s) 0.0 0.0 0.0 0.0 0.0 0.0 0.0 0.0Detector 1 Delay (s) 0.0 0.0 0.0 0.0 0.0 0.0 0.0 0.0Turn Type Perm NA Perm NA pm+pt NA Perm NAProtected Phases 2 2 3 1 3 1Permitted Phases 2 2 1 3 1Detector Phase 2 2 2 2 3 1 3 1 1Switch PhaseMinimum Initial (s) 6.0 6.0 6.0 6.0 6.0 21.0 21.0Minimum Split (s) 31.0 31.0 31.0 31.0 11.5 27.0 27.0Total Split (s) 32.0 32.0 32.0 32.0 15.0 73.0 73.0

Lanes, Volumes, Timings22: Lake & Merrill/Kodak 4/10/2017
7:30 am Baseline Synchro 8 ReportPage 5
Lane Group EBL EBT EBR WBL WBT WBR NBL NBT NBR SBL SBT SBRTotal Split (%) 26.7% 26.7% 26.7% 26.7% 12.5% 60.8% 60.8%Maximum Green (s) 26.0 26.0 26.0 26.0 9.5 67.0 67.0Yellow Time (s) 3.5 3.5 3.5 3.5 3.5 4.0 4.0All-Red Time (s) 2.5 2.5 2.5 2.5 2.0 2.0 2.0Lost Time Adjust (s) 0.0 0.0 0.0 0.0 0.0 0.0Total Lost Time (s) 6.0 6.0 6.0 5.5 6.0 6.0Lead/Lag Lag Lag Lag Lag Lead LeadLead-Lag Optimize?Vehicle Extension (s) 2.0 2.0 2.0 2.0 3.0 2.0 2.0Recall Mode None None None None Min C-Max C-MaxWalk Time (s) 7.0 7.0 7.0 7.0 10.0 10.0Flash Dont Walk (s) 18.0 18.0 18.0 18.0 11.0 11.0Pedestrian Calls (#/hr) 0 0 0 0 0 0Act Effct Green (s) 7.4 7.4 7.4 95.6 100.6 86.6 86.6Actuated g/C Ratio 0.06 0.06 0.06 0.80 0.84 0.72 0.72v/c Ratio 0.10 0.63 0.02 0.15 0.15 0.00 0.53Control Delay 55.0 23.7 51.0 4.1 3.6 5.3 8.4Queue Delay 0.0 0.0 0.0 0.0 0.0 0.0 0.0Total Delay 55.0 23.7 51.0 4.1 3.6 5.3 8.4LOS D C D A A A AApproach Delay 25.5 51.0 3.7 8.3Approach LOS C D A AQueue Length 50th (ft) 6 17 1 9 63 1 199Queue Length 95th (ft) m21 59 6 24 88 m1 340Internal Link Dist (ft) 2590 227 961 3033Turn Bay Length (ft) 125 125 125Base Capacity (vph) 305 458 218 366 2761 671 2463Starvation Cap Reductn 0 0 0 0 0 0 0Spillback Cap Reductn 0 0 0 0 0 0 0Storage Cap Reductn 0 0 0 0 0 0 0Reduced v/c Ratio 0.03 0.32 0.00 0.14 0.16 0.00 0.53
Intersection SummaryArea Type: OtherCycle Length: 120Actuated Cycle Length: 120Offset: 2 (2%), Referenced to phase 1:NBSB, Start of GreenNatural Cycle: 80Control Type: Actuated-CoordinatedMaximum v/c Ratio: 0.63Intersection Signal Delay: 8.6 Intersection LOS: AIntersection Capacity Utilization 58.1% ICU Level of Service BAnalysis Period (min) 15m Volume for 95th percentile queue is metered by upstream signal.
Splits and Phases: 22: Lake & Merrill/Kodak

Lanes, Volumes, Timings23: Lake & Eastman 4/10/2017
7:30 am Baseline Synchro 8 ReportPage 6
Lane Group EBL EBT EBR WBL WBT WBR NBL NBT NBR SBL SBT SBRLane ConfigurationsVolume (vph) 0 2 5 4 17 272 30 173 2 610 683 0Ideal Flow (vphpl) 1900 1900 1900 1900 1900 1900 1900 1900 1900 1900 1900 1900Lane Width (ft) 10 10 10 12 12 12 11 11 11 11 11 11Storage Length (ft) 0 0 0 0 100 0 100 0Storage Lanes 0 0 0 1 1 0 1 0Taper Length (ft) 25 25 25 25Lane Util. Factor 0.95 0.95 0.95 1.00 1.00 1.00 1.00 0.95 0.95 1.00 0.95 0.95Frt 0.887 0.850 0.998Flt Protected 0.991 0.950 0.950Satd. Flow (prot) 0 2930 0 0 1846 1583 1711 3414 0 1711 3421 0Flt Permitted 0.931 0.364 0.595Satd. Flow (perm) 0 2930 0 0 1734 1583 655 3414 0 1071 3421 0Right Turn on Red Yes Yes Yes YesSatd. Flow (RTOR) 310 279 1Link Speed (mph) 30 30 35 35Link Distance (ft) 302 955 682 1041Travel Time (s) 6.9 21.7 13.3 20.3Peak Hour Factor 0.90 0.90 0.90 0.90 1.00 0.90 0.90 0.90 0.90 1.00 0.90 0.90Adj. Flow (vph) 0 2 6 4 17 302 33 192 2 610 759 0Shared Lane Traffic (%)Lane Group Flow (vph) 0 8 0 0 21 302 33 194 0 610 759 0Enter Blocked Intersection No No No No No No No No No No No NoLane Alignment Left Left Right Left Left Right Left Left Right Left Left RightMedian Width(ft) 0 0 11 11Link Offset(ft) 0 0 0 0Crosswalk Width(ft) 16 16 16 16Two way Left Turn LaneHeadway Factor 1.09 1.09 1.09 1.00 1.00 1.00 1.04 1.04 1.04 1.04 1.04 1.04Turning Speed (mph) 15 9 15 9 15 9 15 9Number of Detectors 1 1 2 2 2 1 1 1 1Detector Template Leading Detector (ft) 35 35 65 65 65 50 19 50 19Trailing Detector (ft) 30 30 -5 -5 -5 0 19 0 19Detector 1 Position(ft) 30 30 -5 -5 -5 0 19 0 19Detector 1 Size(ft) 5 5 6 6 6 50 0 50 0Detector 1 Type Cl+Ex Cl+Ex Cl+Ex Cl+Ex Cl+Ex Cl+Ex Cl+Ex Cl+Ex Cl+ExDetector 1 ChannelDetector 1 Extend (s) 0.0 0.0 0.0 0.0 0.0 0.0 0.0 0.0 0.0Detector 1 Queue (s) 0.0 0.0 0.0 0.0 0.0 0.0 0.0 0.0 0.0Detector 1 Delay (s) 0.0 0.0 0.0 0.0 0.0 0.0 0.0 0.0 0.0Detector 2 Position(ft) 59 59 59Detector 2 Size(ft) 6 6 6Detector 2 Type Cl+Ex Cl+Ex Cl+ExDetector 2 ChannelDetector 2 Extend (s) 0.0 0.0 0.0Turn Type NA Perm NA pm+ov pm+pt NA pm+pt NAProtected Phases 4 8 1 5 2 1 6Permitted Phases 4 8 8 2 6
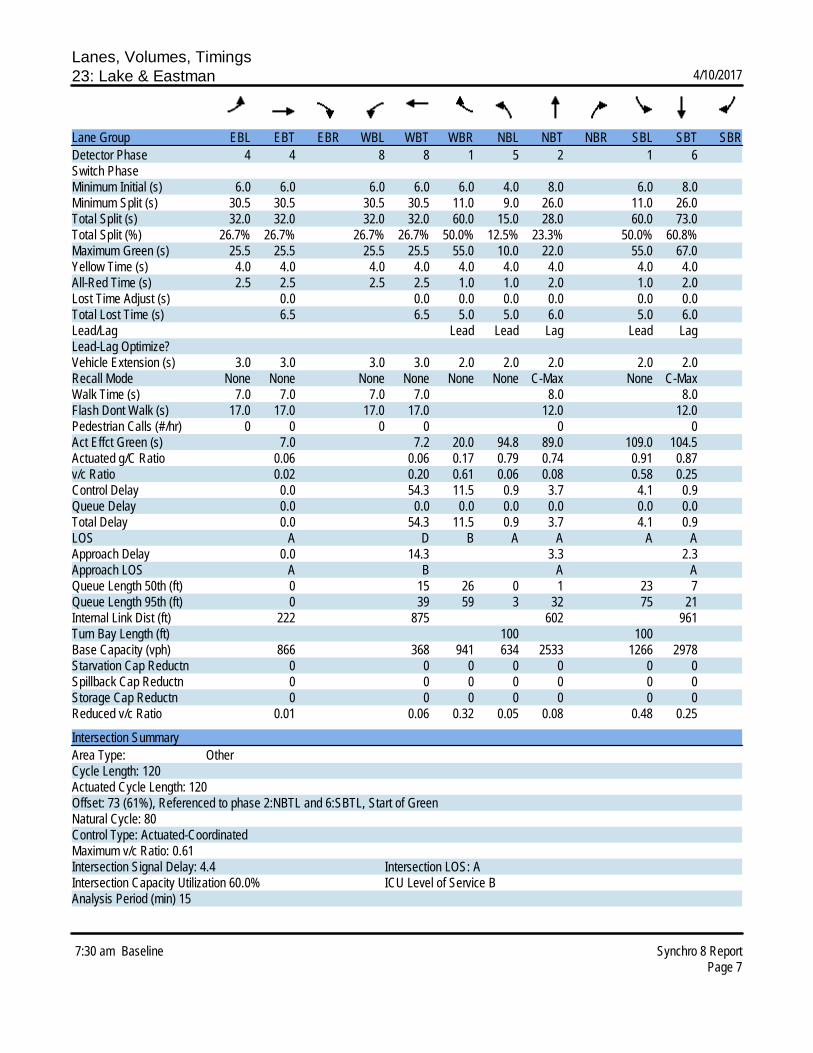
Lanes, Volumes, Timings23: Lake & Eastman 4/10/2017
7:30 am Baseline Synchro 8 ReportPage 7
Lane Group EBL EBT EBR WBL WBT WBR NBL NBT NBR SBL SBT SBRDetector Phase 4 4 8 8 1 5 2 1 6Switch PhaseMinimum Initial (s) 6.0 6.0 6.0 6.0 6.0 4.0 8.0 6.0 8.0Minimum Split (s) 30.5 30.5 30.5 30.5 11.0 9.0 26.0 11.0 26.0Total Split (s) 32.0 32.0 32.0 32.0 60.0 15.0 28.0 60.0 73.0Total Split (%) 26.7% 26.7% 26.7% 26.7% 50.0% 12.5% 23.3% 50.0% 60.8%Maximum Green (s) 25.5 25.5 25.5 25.5 55.0 10.0 22.0 55.0 67.0Yellow Time (s) 4.0 4.0 4.0 4.0 4.0 4.0 4.0 4.0 4.0All-Red Time (s) 2.5 2.5 2.5 2.5 1.0 1.0 2.0 1.0 2.0Lost Time Adjust (s) 0.0 0.0 0.0 0.0 0.0 0.0 0.0Total Lost Time (s) 6.5 6.5 5.0 5.0 6.0 5.0 6.0Lead/Lag Lead Lead Lag Lead LagLead-Lag Optimize?Vehicle Extension (s) 3.0 3.0 3.0 3.0 2.0 2.0 2.0 2.0 2.0Recall Mode None None None None None None C-Max None C-MaxWalk Time (s) 7.0 7.0 7.0 7.0 8.0 8.0Flash Dont Walk (s) 17.0 17.0 17.0 17.0 12.0 12.0Pedestrian Calls (#/hr) 0 0 0 0 0 0Act Effct Green (s) 7.0 7.2 20.0 94.8 89.0 109.0 104.5Actuated g/C Ratio 0.06 0.06 0.17 0.79 0.74 0.91 0.87v/c Ratio 0.02 0.20 0.61 0.06 0.08 0.58 0.25Control Delay 0.0 54.3 11.5 0.9 3.7 4.1 0.9Queue Delay 0.0 0.0 0.0 0.0 0.0 0.0 0.0Total Delay 0.0 54.3 11.5 0.9 3.7 4.1 0.9LOS A D B A A A AApproach Delay 0.0 14.3 3.3 2.3Approach LOS A B A AQueue Length 50th (ft) 0 15 26 0 1 23 7Queue Length 95th (ft) 0 39 59 3 32 75 21Internal Link Dist (ft) 222 875 602 961Turn Bay Length (ft) 100 100Base Capacity (vph) 866 368 941 634 2533 1266 2978Starvation Cap Reductn 0 0 0 0 0 0 0Spillback Cap Reductn 0 0 0 0 0 0 0Storage Cap Reductn 0 0 0 0 0 0 0Reduced v/c Ratio 0.01 0.06 0.32 0.05 0.08 0.48 0.25
Intersection SummaryArea Type: OtherCycle Length: 120Actuated Cycle Length: 120Offset: 73 (61%), Referenced to phase 2:NBTL and 6:SBTL, Start of GreenNatural Cycle: 80Control Type: Actuated-CoordinatedMaximum v/c Ratio: 0.61Intersection Signal Delay: 4.4 Intersection LOS: AIntersection Capacity Utilization 60.0% ICU Level of Service BAnalysis Period (min) 15

Lanes, Volumes, Timings23: Lake & Eastman 4/10/2017
7:30 am Baseline Synchro 8 ReportPage 8
Splits and Phases: 23: Lake & Eastman

Lanes, Volumes, Timings14: Dewey & Eastman 4/10/2017
5:00 pm Baseline Synchro 8 ReportPage 1
Lane Group EBL EBT EBR WBL WBT WBR NBL NBT NBR SBL SBT SBRLane ConfigurationsVolume (vph) 37 0 10 9 33 25 7 653 11 5 497 45Ideal Flow (vphpl) 1900 1900 1900 1900 1900 1900 1900 1900 1900 1900 1900 1900Lane Width (ft) 10 10 10 10 10 10 10 10 10 10 10 10Storage Length (ft) 280 0 0 0 50 0 230 0Storage Lanes 1 0 1 0 1 0 1 0Taper Length (ft) 25 25 25 25Lane Util. Factor 1.00 1.00 1.00 1.00 1.00 1.00 1.00 0.95 0.95 1.00 0.95 0.95Frt 0.850 0.935 0.998 0.988Flt Protected 0.950 0.950 0.950 0.950Satd. Flow (prot) 1652 1478 0 1652 1626 0 1652 3297 0 1652 3264 0Flt Permitted 0.715 0.750 0.424 0.371Satd. Flow (perm) 1243 1478 0 1304 1626 0 737 3297 0 645 3264 0Right Turn on Red Yes Yes Yes YesSatd. Flow (RTOR) 165 28 3 18Link Speed (mph) 30 30 30 30Link Distance (ft) 583 686 580 1020Travel Time (s) 13.3 15.6 13.2 23.2Peak Hour Factor 0.90 0.90 0.90 0.95 0.90 0.90 0.90 0.90 0.90 0.90 0.90 0.90Adj. Flow (vph) 41 0 11 9 37 28 8 726 12 6 552 50Shared Lane Traffic (%)Lane Group Flow (vph) 41 11 0 9 65 0 8 738 0 6 602 0Enter Blocked Intersection No No No No No No No No No No No NoLane Alignment Left Left Right Left Left Right Left Left Right Left Left RightMedian Width(ft) 10 10 10 10Link Offset(ft) 0 0 0 0Crosswalk Width(ft) 16 16 16 16Two way Left Turn LaneHeadway Factor 1.09 1.09 1.09 1.09 1.09 1.09 1.09 1.09 1.09 1.09 1.09 1.09Turning Speed (mph) 15 9 15 9 15 9 15 9Number of Detectors 1 1 2 2 1 1 1 1Detector Template Leading Detector (ft) 15 15 45 45 19 19 19 19Trailing Detector (ft) 0 0 -10 -10 19 19 19 19Detector 1 Position(ft) 0 0 -10 -10 19 19 19 19Detector 1 Size(ft) 15 15 6 6 0 0 0 0Detector 1 Type Cl+Ex Cl+Ex Cl+Ex Cl+Ex Cl+Ex Cl+Ex Cl+Ex Cl+ExDetector 1 ChannelDetector 1 Extend (s) 0.0 0.0 0.0 0.0 0.0 0.0 0.0 0.0Detector 1 Queue (s) 0.0 0.0 0.0 0.0 0.0 0.0 0.0 0.0Detector 1 Delay (s) 0.0 0.0 0.0 0.0 0.0 0.0 0.0 0.0Detector 2 Position(ft) 39 39Detector 2 Size(ft) 6 6Detector 2 Type Cl+Ex Cl+ExDetector 2 ChannelDetector 2 Extend (s) 0.0 0.0Turn Type Perm NA Perm NA Perm NA Perm NAProtected Phases 2 2 1 1Permitted Phases 2 2 1 1

Lanes, Volumes, Timings14: Dewey & Eastman 4/10/2017
5:00 pm Baseline Synchro 8 ReportPage 2
Lane Group EBL EBT EBR WBL WBT WBR NBL NBT NBR SBL SBT SBRDetector Phase 2 2 2 2 1 1 1 1Switch PhaseMinimum Initial (s) 6.0 6.0 6.0 6.0 23.0 23.0 23.0 23.0Minimum Split (s) 31.0 31.0 31.0 31.0 29.0 29.0 29.0 29.0Total Split (s) 31.0 31.0 31.0 31.0 29.0 29.0 29.0 29.0Total Split (%) 51.7% 51.7% 51.7% 51.7% 48.3% 48.3% 48.3% 48.3%Maximum Green (s) 25.5 25.5 25.5 25.5 23.0 23.0 23.0 23.0Yellow Time (s) 3.5 3.5 3.5 3.5 4.0 4.0 4.0 4.0All-Red Time (s) 2.0 2.0 2.0 2.0 2.0 2.0 2.0 2.0Lost Time Adjust (s) 0.0 0.0 0.0 0.0 0.0 0.0 0.0 0.0Total Lost Time (s) 5.5 5.5 5.5 5.5 6.0 6.0 6.0 6.0Lead/Lag Lag Lag Lag Lag Lead Lead Lead LeadLead-Lag Optimize?Vehicle Extension (s) 4.0 4.0 4.0 4.0 2.0 2.0 2.0 2.0Recall Mode None None None None C-Max C-Max C-Max C-MaxWalk Time (s) 7.0 7.0 7.0 7.0 7.0 7.0 7.0 7.0Flash Dont Walk (s) 18.0 18.0 18.0 18.0 16.0 16.0 16.0 16.0Pedestrian Calls (#/hr) 1 1 1 1 0 0 0 0Act Effct Green (s) 11.5 11.5 11.5 11.5 40.6 40.6 40.6 40.6Actuated g/C Ratio 0.19 0.19 0.19 0.19 0.68 0.68 0.68 0.68v/c Ratio 0.17 0.03 0.04 0.19 0.02 0.33 0.01 0.27Control Delay 23.0 0.1 15.6 12.3 4.3 3.3 10.2 8.6Queue Delay 0.0 0.0 0.0 0.0 0.0 0.0 0.0 0.0Total Delay 23.0 0.1 15.6 12.3 4.3 3.3 10.2 8.6LOS C A B B A A B AApproach Delay 18.2 12.7 3.3 8.6Approach LOS B B A AQueue Length 50th (ft) 29 0 3 12 1 26 1 74Queue Length 95th (ft) m7 m0 9 27 m2 m73 m8 136Internal Link Dist (ft) 503 606 500 940Turn Bay Length (ft) 280 50 230Base Capacity (vph) 528 723 554 707 499 2234 436 2216Starvation Cap Reductn 0 0 0 0 0 0 0 0Spillback Cap Reductn 0 0 0 0 0 0 0 0Storage Cap Reductn 0 0 0 0 0 0 0 0Reduced v/c Ratio 0.08 0.02 0.02 0.09 0.02 0.33 0.01 0.27
Intersection SummaryArea Type: OtherCycle Length: 60Actuated Cycle Length: 60Offset: 28 (47%), Referenced to phase 1:NBSB, Start of GreenNatural Cycle: 60Control Type: Actuated-CoordinatedMaximum v/c Ratio: 0.33Intersection Signal Delay: 6.5 Intersection LOS: AIntersection Capacity Utilization 37.5% ICU Level of Service AAnalysis Period (min) 15m Volume for 95th percentile queue is metered by upstream signal.

Lanes, Volumes, Timings14: Dewey & Eastman 4/10/2017
5:00 pm Baseline Synchro 8 ReportPage 3
Splits and Phases: 14: Dewey & Eastman

Lanes, Volumes, Timings22: Lake & Merrill/Kodak 4/10/2017
5:00 pm Baseline Synchro 8 ReportPage 4
Lane Group EBL EBT EBR WBL WBT WBR NBL NBT NBR SBL SBT SBRLane ConfigurationsVolume (vph) 23 1 55 5 1 2 155 1143 0 0 470 11Ideal Flow (vphpl) 1900 1900 1900 1900 1900 1900 1900 1900 1900 1900 1900 1900Lane Width (ft) 12 12 12 12 12 12 11 11 12 12 11 11Storage Length (ft) 125 0 0 0 125 0 125 0Storage Lanes 1 0 0 0 1 0 1 0Taper Length (ft) 25 25 25 25Lane Util. Factor 1.00 1.00 1.00 1.00 1.00 1.00 1.00 0.95 0.95 1.00 0.95 0.95Frt 0.852 0.970 0.997Flt Protected 0.950 0.968 0.950Satd. Flow (prot) 1770 1587 0 0 1749 0 1711 3421 0 1863 3411 0Flt Permitted 0.752 0.762 0.441Satd. Flow (perm) 1401 1587 0 0 1377 0 794 3421 0 1863 3411 0Right Turn on Red Yes Yes Yes YesSatd. Flow (RTOR) 61 2 3Link Speed (mph) 30 30 35 35Link Distance (ft) 2670 307 1041 3113Travel Time (s) 60.7 7.0 20.3 60.6Peak Hour Factor 1.00 0.90 0.90 0.90 0.90 0.90 0.90 0.90 0.90 0.90 0.90 0.90Adj. Flow (vph) 23 1 61 6 1 2 172 1270 0 0 522 12Shared Lane Traffic (%)Lane Group Flow (vph) 23 62 0 0 9 0 172 1270 0 0 534 0Enter Blocked Intersection No No No No No No No No No No No NoLane Alignment Left Left Right Left Left Right Left Left Right Left Left RightMedian Width(ft) 12 12 12 12Link Offset(ft) 0 0 0 0Crosswalk Width(ft) 16 16 16 16Two way Left Turn LaneHeadway Factor 1.00 1.00 1.00 1.00 1.00 1.00 1.04 1.04 1.00 1.00 1.04 1.04Turning Speed (mph) 15 9 15 9 15 9 15 9Number of Detectors 1 1 1 1 1 1 1 1Detector Template Leading Detector (ft) 10 50 50 50 50 19 19 19Trailing Detector (ft) -10 0 0 0 0 19 19 19Detector 1 Position(ft) -10 0 0 0 0 19 19 19Detector 1 Size(ft) 20 50 50 50 50 0 0 0Detector 1 Type Cl+Ex Cl+Ex Cl+Ex Cl+Ex Cl+Ex Cl+Ex Cl+Ex Cl+ExDetector 1 ChannelDetector 1 Extend (s) 0.0 0.0 0.0 0.0 0.0 0.0 0.0 0.0Detector 1 Queue (s) 0.0 0.0 0.0 0.0 0.0 0.0 0.0 0.0Detector 1 Delay (s) 0.0 0.0 0.0 0.0 0.0 0.0 0.0 0.0Turn Type Perm NA Perm NA pm+pt NA Perm NAProtected Phases 2 2 3 1 3 1Permitted Phases 2 2 1 3 1Detector Phase 2 2 2 2 3 1 3 1 1Switch PhaseMinimum Initial (s) 6.0 6.0 6.0 6.0 6.0 21.0 21.0Minimum Split (s) 31.0 31.0 31.0 31.0 11.5 27.0 27.0Total Split (s) 32.0 32.0 32.0 32.0 15.0 73.0 73.0
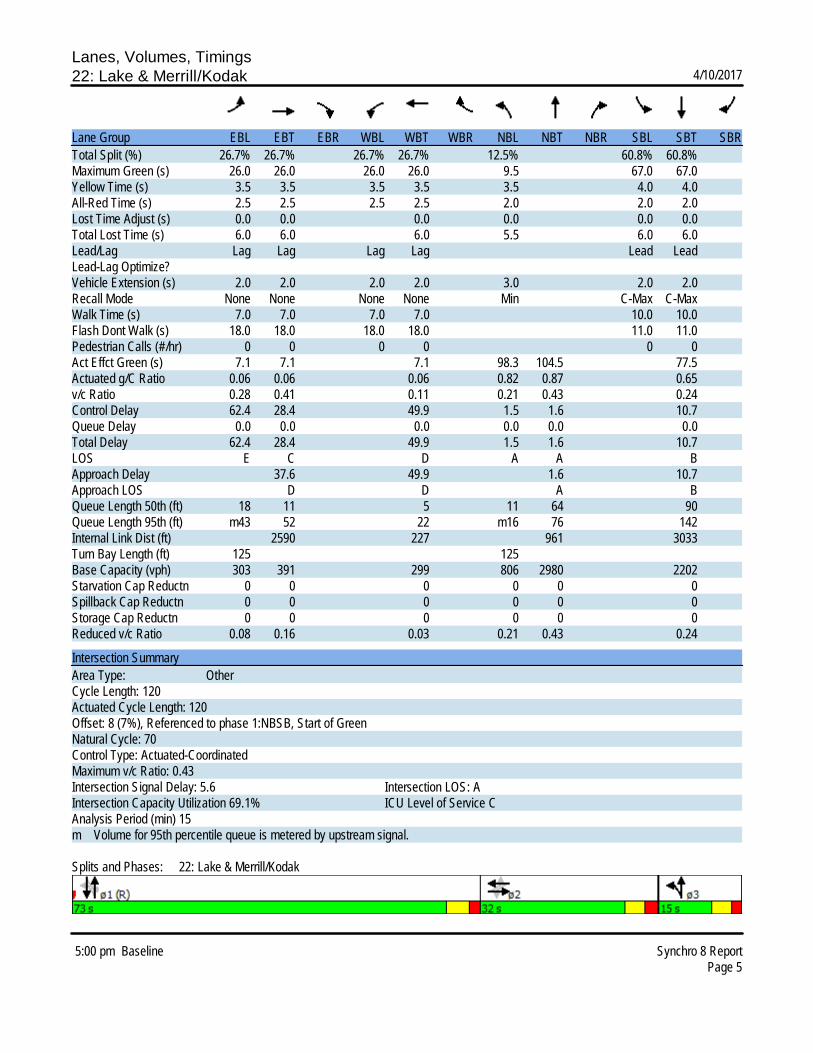
Lanes, Volumes, Timings22: Lake & Merrill/Kodak 4/10/2017
5:00 pm Baseline Synchro 8 ReportPage 5
Lane Group EBL EBT EBR WBL WBT WBR NBL NBT NBR SBL SBT SBRTotal Split (%) 26.7% 26.7% 26.7% 26.7% 12.5% 60.8% 60.8%Maximum Green (s) 26.0 26.0 26.0 26.0 9.5 67.0 67.0Yellow Time (s) 3.5 3.5 3.5 3.5 3.5 4.0 4.0All-Red Time (s) 2.5 2.5 2.5 2.5 2.0 2.0 2.0Lost Time Adjust (s) 0.0 0.0 0.0 0.0 0.0 0.0Total Lost Time (s) 6.0 6.0 6.0 5.5 6.0 6.0Lead/Lag Lag Lag Lag Lag Lead LeadLead-Lag Optimize?Vehicle Extension (s) 2.0 2.0 2.0 2.0 3.0 2.0 2.0Recall Mode None None None None Min C-Max C-MaxWalk Time (s) 7.0 7.0 7.0 7.0 10.0 10.0Flash Dont Walk (s) 18.0 18.0 18.0 18.0 11.0 11.0Pedestrian Calls (#/hr) 0 0 0 0 0 0Act Effct Green (s) 7.1 7.1 7.1 98.3 104.5 77.5Actuated g/C Ratio 0.06 0.06 0.06 0.82 0.87 0.65v/c Ratio 0.28 0.41 0.11 0.21 0.43 0.24Control Delay 62.4 28.4 49.9 1.5 1.6 10.7Queue Delay 0.0 0.0 0.0 0.0 0.0 0.0Total Delay 62.4 28.4 49.9 1.5 1.6 10.7LOS E C D A A BApproach Delay 37.6 49.9 1.6 10.7Approach LOS D D A BQueue Length 50th (ft) 18 11 5 11 64 90Queue Length 95th (ft) m43 52 22 m16 76 142Internal Link Dist (ft) 2590 227 961 3033Turn Bay Length (ft) 125 125Base Capacity (vph) 303 391 299 806 2980 2202Starvation Cap Reductn 0 0 0 0 0 0Spillback Cap Reductn 0 0 0 0 0 0Storage Cap Reductn 0 0 0 0 0 0Reduced v/c Ratio 0.08 0.16 0.03 0.21 0.43 0.24
Intersection SummaryArea Type: OtherCycle Length: 120Actuated Cycle Length: 120Offset: 8 (7%), Referenced to phase 1:NBSB, Start of GreenNatural Cycle: 70Control Type: Actuated-CoordinatedMaximum v/c Ratio: 0.43Intersection Signal Delay: 5.6 Intersection LOS: AIntersection Capacity Utilization 69.1% ICU Level of Service CAnalysis Period (min) 15m Volume for 95th percentile queue is metered by upstream signal.
Splits and Phases: 22: Lake & Merrill/Kodak
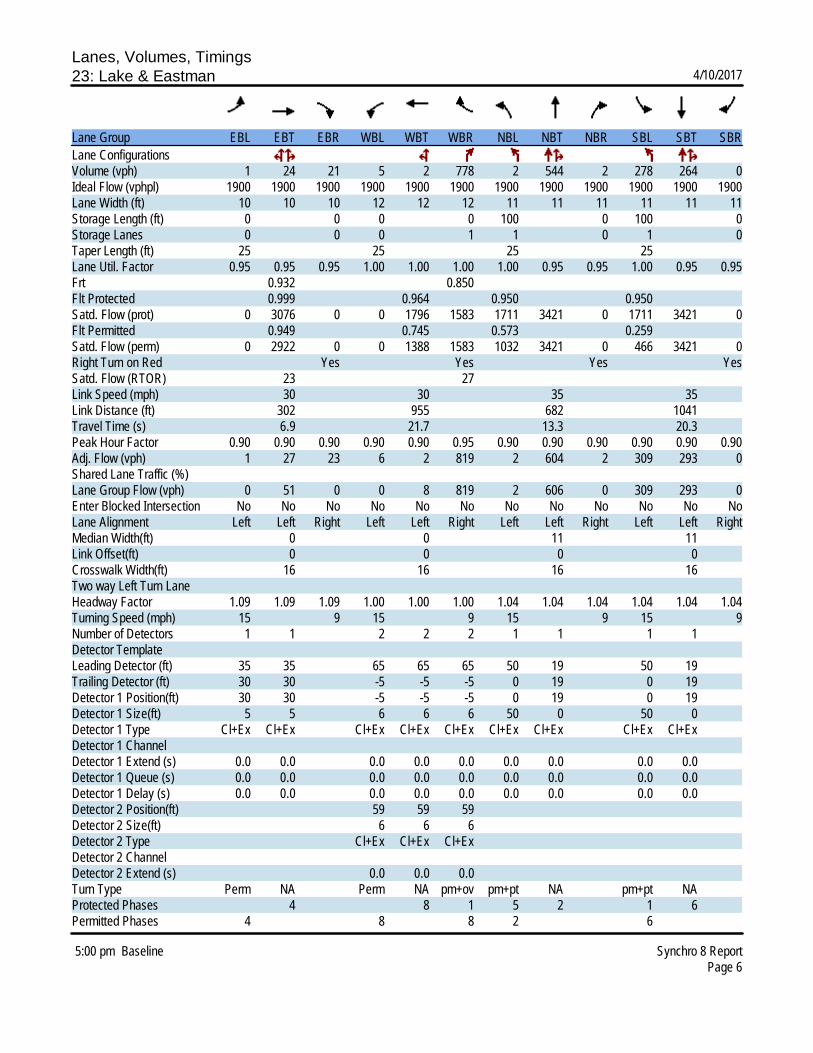
Lanes, Volumes, Timings23: Lake & Eastman 4/10/2017
5:00 pm Baseline Synchro 8 ReportPage 6
Lane Group EBL EBT EBR WBL WBT WBR NBL NBT NBR SBL SBT SBRLane ConfigurationsVolume (vph) 1 24 21 5 2 778 2 544 2 278 264 0Ideal Flow (vphpl) 1900 1900 1900 1900 1900 1900 1900 1900 1900 1900 1900 1900Lane Width (ft) 10 10 10 12 12 12 11 11 11 11 11 11Storage Length (ft) 0 0 0 0 100 0 100 0Storage Lanes 0 0 0 1 1 0 1 0Taper Length (ft) 25 25 25 25Lane Util. Factor 0.95 0.95 0.95 1.00 1.00 1.00 1.00 0.95 0.95 1.00 0.95 0.95Frt 0.932 0.850Flt Protected 0.999 0.964 0.950 0.950Satd. Flow (prot) 0 3076 0 0 1796 1583 1711 3421 0 1711 3421 0Flt Permitted 0.949 0.745 0.573 0.259Satd. Flow (perm) 0 2922 0 0 1388 1583 1032 3421 0 466 3421 0Right Turn on Red Yes Yes Yes YesSatd. Flow (RTOR) 23 27Link Speed (mph) 30 30 35 35Link Distance (ft) 302 955 682 1041Travel Time (s) 6.9 21.7 13.3 20.3Peak Hour Factor 0.90 0.90 0.90 0.90 0.90 0.95 0.90 0.90 0.90 0.90 0.90 0.90Adj. Flow (vph) 1 27 23 6 2 819 2 604 2 309 293 0Shared Lane Traffic (%)Lane Group Flow (vph) 0 51 0 0 8 819 2 606 0 309 293 0Enter Blocked Intersection No No No No No No No No No No No NoLane Alignment Left Left Right Left Left Right Left Left Right Left Left RightMedian Width(ft) 0 0 11 11Link Offset(ft) 0 0 0 0Crosswalk Width(ft) 16 16 16 16Two way Left Turn LaneHeadway Factor 1.09 1.09 1.09 1.00 1.00 1.00 1.04 1.04 1.04 1.04 1.04 1.04Turning Speed (mph) 15 9 15 9 15 9 15 9Number of Detectors 1 1 2 2 2 1 1 1 1Detector Template Leading Detector (ft) 35 35 65 65 65 50 19 50 19Trailing Detector (ft) 30 30 -5 -5 -5 0 19 0 19Detector 1 Position(ft) 30 30 -5 -5 -5 0 19 0 19Detector 1 Size(ft) 5 5 6 6 6 50 0 50 0Detector 1 Type Cl+Ex Cl+Ex Cl+Ex Cl+Ex Cl+Ex Cl+Ex Cl+Ex Cl+Ex Cl+ExDetector 1 ChannelDetector 1 Extend (s) 0.0 0.0 0.0 0.0 0.0 0.0 0.0 0.0 0.0Detector 1 Queue (s) 0.0 0.0 0.0 0.0 0.0 0.0 0.0 0.0 0.0Detector 1 Delay (s) 0.0 0.0 0.0 0.0 0.0 0.0 0.0 0.0 0.0Detector 2 Position(ft) 59 59 59Detector 2 Size(ft) 6 6 6Detector 2 Type Cl+Ex Cl+Ex Cl+ExDetector 2 ChannelDetector 2 Extend (s) 0.0 0.0 0.0Turn Type Perm NA Perm NA pm+ov pm+pt NA pm+pt NAProtected Phases 4 8 1 5 2 1 6Permitted Phases 4 8 8 2 6
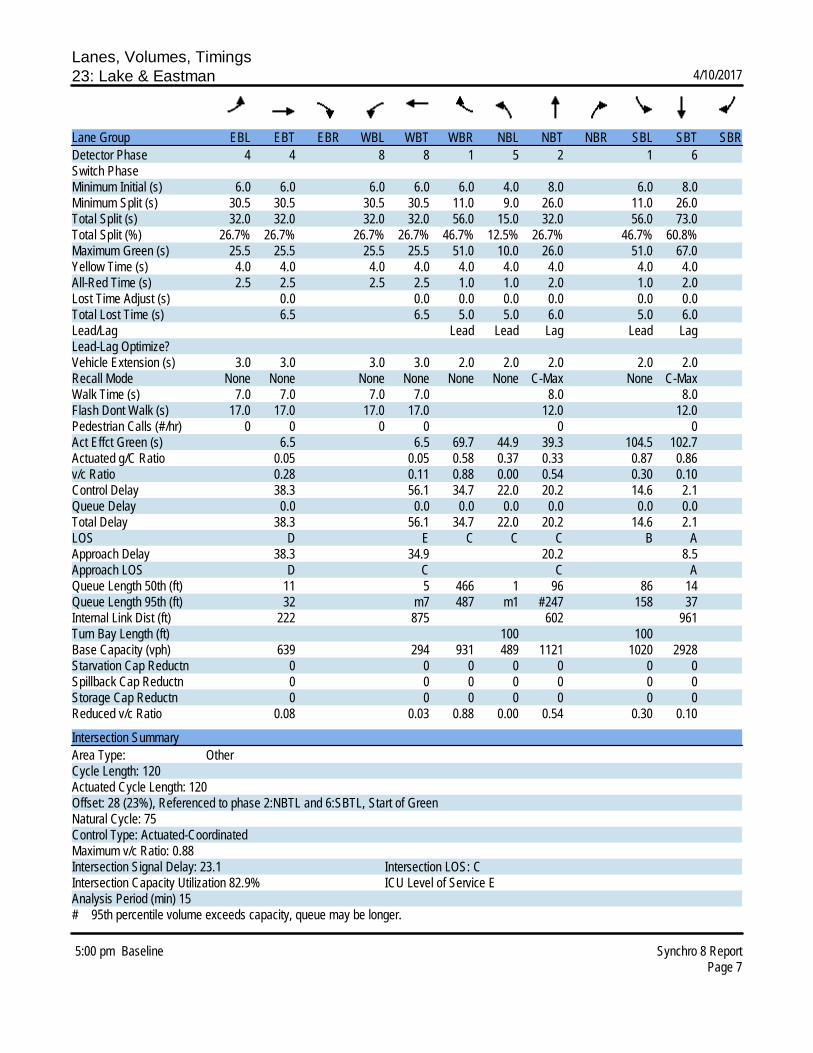
Lanes, Volumes, Timings23: Lake & Eastman 4/10/2017
5:00 pm Baseline Synchro 8 ReportPage 7
Lane Group EBL EBT EBR WBL WBT WBR NBL NBT NBR SBL SBT SBRDetector Phase 4 4 8 8 1 5 2 1 6Switch PhaseMinimum Initial (s) 6.0 6.0 6.0 6.0 6.0 4.0 8.0 6.0 8.0Minimum Split (s) 30.5 30.5 30.5 30.5 11.0 9.0 26.0 11.0 26.0Total Split (s) 32.0 32.0 32.0 32.0 56.0 15.0 32.0 56.0 73.0Total Split (%) 26.7% 26.7% 26.7% 26.7% 46.7% 12.5% 26.7% 46.7% 60.8%Maximum Green (s) 25.5 25.5 25.5 25.5 51.0 10.0 26.0 51.0 67.0Yellow Time (s) 4.0 4.0 4.0 4.0 4.0 4.0 4.0 4.0 4.0All-Red Time (s) 2.5 2.5 2.5 2.5 1.0 1.0 2.0 1.0 2.0Lost Time Adjust (s) 0.0 0.0 0.0 0.0 0.0 0.0 0.0Total Lost Time (s) 6.5 6.5 5.0 5.0 6.0 5.0 6.0Lead/Lag Lead Lead Lag Lead LagLead-Lag Optimize?Vehicle Extension (s) 3.0 3.0 3.0 3.0 2.0 2.0 2.0 2.0 2.0Recall Mode None None None None None None C-Max None C-MaxWalk Time (s) 7.0 7.0 7.0 7.0 8.0 8.0Flash Dont Walk (s) 17.0 17.0 17.0 17.0 12.0 12.0Pedestrian Calls (#/hr) 0 0 0 0 0 0Act Effct Green (s) 6.5 6.5 69.7 44.9 39.3 104.5 102.7Actuated g/C Ratio 0.05 0.05 0.58 0.37 0.33 0.87 0.86v/c Ratio 0.28 0.11 0.88 0.00 0.54 0.30 0.10Control Delay 38.3 56.1 34.7 22.0 20.2 14.6 2.1Queue Delay 0.0 0.0 0.0 0.0 0.0 0.0 0.0Total Delay 38.3 56.1 34.7 22.0 20.2 14.6 2.1LOS D E C C C B AApproach Delay 38.3 34.9 20.2 8.5Approach LOS D C C AQueue Length 50th (ft) 11 5 466 1 96 86 14Queue Length 95th (ft) 32 m7 487 m1 #247 158 37Internal Link Dist (ft) 222 875 602 961Turn Bay Length (ft) 100 100Base Capacity (vph) 639 294 931 489 1121 1020 2928Starvation Cap Reductn 0 0 0 0 0 0 0Spillback Cap Reductn 0 0 0 0 0 0 0Storage Cap Reductn 0 0 0 0 0 0 0Reduced v/c Ratio 0.08 0.03 0.88 0.00 0.54 0.30 0.10
Intersection SummaryArea Type: OtherCycle Length: 120Actuated Cycle Length: 120Offset: 28 (23%), Referenced to phase 2:NBTL and 6:SBTL, Start of GreenNatural Cycle: 75Control Type: Actuated-CoordinatedMaximum v/c Ratio: 0.88Intersection Signal Delay: 23.1 Intersection LOS: CIntersection Capacity Utilization 82.9% ICU Level of Service EAnalysis Period (min) 15# 95th percentile volume exceeds capacity, queue may be longer.

Lanes, Volumes, Timings23: Lake & Eastman 4/10/2017
5:00 pm Baseline Synchro 8 ReportPage 8
Queue shown is maximum after two cycles.m Volume for 95th percentile queue is metered by upstream signal.
Splits and Phases: 23: Lake & Eastman

Lanes, Volumes, Timings14: Dewey & Eastman 4/10/2017
7:30 am 4/10/2017 No Build Synchro 8 ReportPage 1
Lane Group EBL EBT EBR WBL WBT WBR NBL NBT NBR SBL SBT SBRLane ConfigurationsVolume (vph) 9 5 5 8 5 5 2 310 31 25 691 30Ideal Flow (vphpl) 1900 1900 1900 1900 1900 1900 1900 1900 1900 1900 1900 1900Lane Width (ft) 10 10 10 10 10 10 10 10 10 10 10 10Storage Length (ft) 280 0 0 0 50 0 230 0Storage Lanes 1 0 1 0 1 0 1 0Taper Length (ft) 25 25 25 25Lane Util. Factor 1.00 1.00 1.00 1.00 1.00 1.00 1.00 0.95 0.95 1.00 0.95 0.95Frt 0.925 0.925 0.987 0.994Flt Protected 0.950 0.950 0.950 0.950Satd. Flow (prot) 1652 1608 0 1652 1608 0 1652 3260 0 1652 3283 0Flt Permitted 0.750 0.750 0.349 0.528Satd. Flow (perm) 1304 1608 0 1304 1608 0 607 3260 0 918 3283 0Right Turn on Red Yes Yes Yes YesSatd. Flow (RTOR) 6 6 20 8Link Speed (mph) 30 30 30 30Link Distance (ft) 583 686 580 1020Travel Time (s) 13.3 15.6 13.2 23.2Peak Hour Factor 0.90 0.90 0.90 0.90 0.90 0.90 0.90 0.90 0.90 0.90 0.90 0.90Adj. Flow (vph) 10 6 6 9 6 6 2 344 34 28 768 33Shared Lane Traffic (%)Lane Group Flow (vph) 10 12 0 9 12 0 2 378 0 28 801 0Enter Blocked Intersection No No No No No No No No No No No NoLane Alignment Left Left Right Left Left Right Left Left Right Left Left RightMedian Width(ft) 10 10 10 10Link Offset(ft) 0 0 0 0Crosswalk Width(ft) 16 16 16 16Two way Left Turn LaneHeadway Factor 1.09 1.09 1.09 1.09 1.09 1.09 1.09 1.09 1.09 1.09 1.09 1.09Turning Speed (mph) 15 9 15 9 15 9 15 9Number of Detectors 1 1 2 2 1 1 1 1Detector Template Leading Detector (ft) 15 15 45 45 19 19 19 19Trailing Detector (ft) 0 0 -10 -10 19 19 19 19Detector 1 Position(ft) 0 0 -10 -10 19 19 19 19Detector 1 Size(ft) 15 15 6 6 0 0 0 0Detector 1 Type Cl+Ex Cl+Ex Cl+Ex Cl+Ex Cl+Ex Cl+Ex Cl+Ex Cl+ExDetector 1 ChannelDetector 1 Extend (s) 0.0 0.0 0.0 0.0 0.0 0.0 0.0 0.0Detector 1 Queue (s) 0.0 0.0 0.0 0.0 0.0 0.0 0.0 0.0Detector 1 Delay (s) 0.0 0.0 0.0 0.0 0.0 0.0 0.0 0.0Detector 2 Position(ft) 39 39Detector 2 Size(ft) 6 6Detector 2 Type Cl+Ex Cl+ExDetector 2 ChannelDetector 2 Extend (s) 0.0 0.0Turn Type Perm NA Perm NA Perm NA Perm NAProtected Phases 2 2 1 1Permitted Phases 2 2 1 1

Lanes, Volumes, Timings14: Dewey & Eastman 4/10/2017
7:30 am 4/10/2017 No Build Synchro 8 ReportPage 2
Lane Group EBL EBT EBR WBL WBT WBR NBL NBT NBR SBL SBT SBRDetector Phase 2 2 2 2 1 1 1 1Switch PhaseMinimum Initial (s) 6.0 6.0 6.0 6.0 23.0 23.0 23.0 23.0Minimum Split (s) 31.0 31.0 31.0 31.0 29.0 29.0 29.0 29.0Total Split (s) 31.0 31.0 31.0 31.0 29.0 29.0 29.0 29.0Total Split (%) 51.7% 51.7% 51.7% 51.7% 48.3% 48.3% 48.3% 48.3%Maximum Green (s) 25.5 25.5 25.5 25.5 23.0 23.0 23.0 23.0Yellow Time (s) 3.5 3.5 3.5 3.5 4.0 4.0 4.0 4.0All-Red Time (s) 2.0 2.0 2.0 2.0 2.0 2.0 2.0 2.0Lost Time Adjust (s) 0.0 0.0 0.0 0.0 0.0 0.0 0.0 0.0Total Lost Time (s) 5.5 5.5 5.5 5.5 6.0 6.0 6.0 6.0Lead/Lag Lag Lag Lag Lag Lead Lead Lead LeadLead-Lag Optimize?Vehicle Extension (s) 4.0 4.0 4.0 4.0 2.0 2.0 2.0 2.0Recall Mode None None None None C-Max C-Max C-Max C-MaxWalk Time (s) 7.0 7.0 7.0 7.0 7.0 7.0 7.0 7.0Flash Dont Walk (s) 18.0 18.0 18.0 18.0 16.0 16.0 16.0 16.0Pedestrian Calls (#/hr) 1 1 1 1 0 0 0 0Act Effct Green (s) 10.7 10.7 10.7 10.7 48.9 48.9 48.9 48.9Actuated g/C Ratio 0.18 0.18 0.18 0.18 0.82 0.82 0.82 0.82v/c Ratio 0.04 0.04 0.04 0.04 0.00 0.14 0.04 0.30Control Delay 18.0 14.5 16.4 12.4 7.0 3.3 6.7 6.4Queue Delay 0.0 0.0 0.0 0.0 0.0 0.0 0.0 0.0Total Delay 18.0 14.5 16.4 12.4 7.0 3.3 6.7 6.4LOS B B B B A A A AApproach Delay 16.1 14.1 3.3 6.4Approach LOS B B A AQueue Length 50th (ft) 4 2 3 2 0 0 0 0Queue Length 95th (ft) m4 m1 9 9 m1 45 25 194Internal Link Dist (ft) 503 606 500 940Turn Bay Length (ft) 280 50 230Base Capacity (vph) 554 686 554 686 494 2658 747 2675Starvation Cap Reductn 0 0 0 0 0 0 0 0Spillback Cap Reductn 0 0 0 0 0 0 0 0Storage Cap Reductn 0 0 0 0 0 0 0 0Reduced v/c Ratio 0.02 0.02 0.02 0.02 0.00 0.14 0.04 0.30
Intersection SummaryArea Type: OtherCycle Length: 60Actuated Cycle Length: 60Offset: 0 (0%), Referenced to phase 1:NBSB, Start of GreenNatural Cycle: 60Control Type: Actuated-CoordinatedMaximum v/c Ratio: 0.30Intersection Signal Delay: 5.8 Intersection LOS: AIntersection Capacity Utilization 37.5% ICU Level of Service AAnalysis Period (min) 15m Volume for 95th percentile queue is metered by upstream signal.

Lanes, Volumes, Timings14: Dewey & Eastman 4/10/2017
7:30 am 4/10/2017 No Build Synchro 8 ReportPage 3
Splits and Phases: 14: Dewey & Eastman

Lanes, Volumes, Timings22: Lake & Merrill/Kodak 4/10/2017
7:30 am 4/10/2017 No Build Synchro 8 ReportPage 4
Lane Group EBL EBT EBR WBL WBT WBR NBL NBT NBR SBL SBT SBRLane ConfigurationsVolume (vph) 10 2 143 2 0 0 52 412 10 4 1258 19Ideal Flow (vphpl) 1900 1900 1900 1900 1900 1900 1900 1900 1900 1900 1900 1900Lane Width (ft) 12 12 12 12 12 12 11 11 12 12 11 11Storage Length (ft) 125 0 0 0 125 0 125 0Storage Lanes 1 0 0 0 1 0 1 0Taper Length (ft) 25 25 25 25Lane Util. Factor 1.00 1.00 1.00 1.00 1.00 1.00 1.00 0.95 0.95 1.00 0.95 0.95Frt 0.852 0.996 0.998Flt Protected 0.950 0.950 0.950 0.950Satd. Flow (prot) 1770 1587 0 0 1770 0 1711 3408 0 1770 3414 0Flt Permitted 0.757 0.533 0.149 0.483Satd. Flow (perm) 1410 1587 0 0 993 0 268 3408 0 900 3414 0Right Turn on Red Yes Yes Yes YesSatd. Flow (RTOR) 159 4 2Link Speed (mph) 30 30 35 35Link Distance (ft) 2670 307 1041 3113Travel Time (s) 60.7 7.0 20.3 60.6Peak Hour Factor 1.00 0.90 0.90 0.90 0.90 0.90 0.90 0.90 0.90 0.90 0.90 0.90Adj. Flow (vph) 10 2 159 2 0 0 58 458 11 4 1398 21Shared Lane Traffic (%)Lane Group Flow (vph) 10 161 0 0 2 0 58 469 0 4 1419 0Enter Blocked Intersection No No No No No No No No No No No NoLane Alignment Left Left Right Left Left Right Left Left Right Left Left RightMedian Width(ft) 12 12 12 12Link Offset(ft) 0 0 0 0Crosswalk Width(ft) 16 16 16 16Two way Left Turn LaneHeadway Factor 1.00 1.00 1.00 1.00 1.00 1.00 1.04 1.04 1.00 1.00 1.04 1.04Turning Speed (mph) 15 9 15 9 15 9 15 9Number of Detectors 1 1 1 1 1 1 1 1Detector Template Leading Detector (ft) 10 50 50 50 50 19 19 19Trailing Detector (ft) -10 0 0 0 0 19 19 19Detector 1 Position(ft) -10 0 0 0 0 19 19 19Detector 1 Size(ft) 20 50 50 50 50 0 0 0Detector 1 Type Cl+Ex Cl+Ex Cl+Ex Cl+Ex Cl+Ex Cl+Ex Cl+Ex Cl+ExDetector 1 ChannelDetector 1 Extend (s) 0.0 0.0 0.0 0.0 0.0 0.0 0.0 0.0Detector 1 Queue (s) 0.0 0.0 0.0 0.0 0.0 0.0 0.0 0.0Detector 1 Delay (s) 0.0 0.0 0.0 0.0 0.0 0.0 0.0 0.0Turn Type Perm NA Perm NA pm+pt NA Perm NAProtected Phases 2 2 3 1 3 1Permitted Phases 2 2 1 3 1Detector Phase 2 2 2 2 3 1 3 1 1Switch PhaseMinimum Initial (s) 6.0 6.0 6.0 6.0 6.0 21.0 21.0Minimum Split (s) 31.0 31.0 31.0 31.0 11.5 27.0 27.0Total Split (s) 32.0 32.0 32.0 32.0 15.0 73.0 73.0

Lanes, Volumes, Timings22: Lake & Merrill/Kodak 4/10/2017
7:30 am 4/10/2017 No Build Synchro 8 ReportPage 5
Lane Group EBL EBT EBR WBL WBT WBR NBL NBT NBR SBL SBT SBRTotal Split (%) 26.7% 26.7% 26.7% 26.7% 12.5% 60.8% 60.8%Maximum Green (s) 26.0 26.0 26.0 26.0 9.5 67.0 67.0Yellow Time (s) 3.5 3.5 3.5 3.5 3.5 4.0 4.0All-Red Time (s) 2.5 2.5 2.5 2.5 2.0 2.0 2.0Lost Time Adjust (s) 0.0 0.0 0.0 0.0 0.0 0.0Total Lost Time (s) 6.0 6.0 6.0 5.5 6.0 6.0Lead/Lag Lag Lag Lag Lag Lead LeadLead-Lag Optimize?Vehicle Extension (s) 2.0 2.0 2.0 2.0 3.0 2.0 2.0Recall Mode None None None None Min C-Max C-MaxWalk Time (s) 7.0 7.0 7.0 7.0 10.0 10.0Flash Dont Walk (s) 18.0 18.0 18.0 18.0 11.0 11.0Pedestrian Calls (#/hr) 0 0 0 0 0 0Act Effct Green (s) 7.5 7.5 7.5 95.5 100.5 86.1 86.1Actuated g/C Ratio 0.06 0.06 0.06 0.80 0.84 0.72 0.72v/c Ratio 0.11 0.65 0.03 0.18 0.16 0.01 0.58Control Delay 55.0 23.7 52.0 4.4 3.5 5.8 9.2Queue Delay 0.0 0.0 0.0 0.0 0.0 0.0 0.0Total Delay 55.0 23.7 52.0 4.4 3.5 5.8 9.2LOS D C D A A A AApproach Delay 25.6 52.0 3.6 9.2Approach LOS C D A AQueue Length 50th (ft) 7 19 2 9 67 1 228Queue Length 95th (ft) 23 61 10 26 91 m1 393Internal Link Dist (ft) 2590 227 961 3033Turn Bay Length (ft) 125 125 125Base Capacity (vph) 305 468 215 335 2749 646 2450Starvation Cap Reductn 0 0 0 0 0 0 0Spillback Cap Reductn 0 0 0 0 0 0 0Storage Cap Reductn 0 0 0 0 0 0 0Reduced v/c Ratio 0.03 0.34 0.01 0.17 0.17 0.01 0.58
Intersection SummaryArea Type: OtherCycle Length: 120Actuated Cycle Length: 120Offset: 2 (2%), Referenced to phase 1:NBSB, Start of GreenNatural Cycle: 80Control Type: Actuated-CoordinatedMaximum v/c Ratio: 0.65Intersection Signal Delay: 9.2 Intersection LOS: AIntersection Capacity Utilization 62.2% ICU Level of Service BAnalysis Period (min) 15m Volume for 95th percentile queue is metered by upstream signal.
Splits and Phases: 22: Lake & Merrill/Kodak

Lanes, Volumes, Timings23: Lake & Eastman 4/10/2017
7:30 am 4/10/2017 No Build Synchro 8 ReportPage 6
Lane Group EBL EBT EBR WBL WBT WBR NBL NBT NBR SBL SBT SBRLane ConfigurationsVolume (vph) 0 3 6 5 19 294 33 187 3 658 737 0Ideal Flow (vphpl) 1900 1900 1900 1900 1900 1900 1900 1900 1900 1900 1900 1900Lane Width (ft) 10 10 10 12 12 12 11 11 11 11 11 11Storage Length (ft) 0 0 0 0 100 0 100 0Storage Lanes 0 0 0 1 1 0 1 0Taper Length (ft) 25 25 25 25Lane Util. Factor 0.95 0.95 0.95 1.00 1.00 1.00 1.00 0.95 0.95 1.00 0.95 0.95Frt 0.895 0.850 0.998Flt Protected 0.988 0.950 0.950Satd. Flow (prot) 0 2956 0 0 1840 1583 1711 3414 0 1711 3421 0Flt Permitted 0.914 0.343 0.583Satd. Flow (perm) 0 2956 0 0 1703 1583 618 3414 0 1050 3421 0Right Turn on Red Yes Yes Yes YesSatd. Flow (RTOR) 288 248 1Link Speed (mph) 30 30 35 35Link Distance (ft) 302 955 682 1041Travel Time (s) 6.9 21.7 13.3 20.3Peak Hour Factor 0.90 0.90 0.90 0.90 1.00 0.90 0.90 0.90 0.90 1.00 0.90 0.90Adj. Flow (vph) 0 3 7 6 19 327 37 208 3 658 819 0Shared Lane Traffic (%)Lane Group Flow (vph) 0 10 0 0 25 327 37 211 0 658 819 0Enter Blocked Intersection No No No No No No No No No No No NoLane Alignment Left Left Right Left Left Right Left Left Right Left Left RightMedian Width(ft) 0 0 11 11Link Offset(ft) 0 0 0 0Crosswalk Width(ft) 16 16 16 16Two way Left Turn LaneHeadway Factor 1.09 1.09 1.09 1.00 1.00 1.00 1.04 1.04 1.04 1.04 1.04 1.04Turning Speed (mph) 15 9 15 9 15 9 15 9Number of Detectors 1 1 2 2 2 1 1 1 1Detector Template Leading Detector (ft) 35 35 65 65 65 50 19 50 19Trailing Detector (ft) 30 30 -5 -5 -5 0 19 0 19Detector 1 Position(ft) 30 30 -5 -5 -5 0 19 0 19Detector 1 Size(ft) 5 5 6 6 6 50 0 50 0Detector 1 Type Cl+Ex Cl+Ex Cl+Ex Cl+Ex Cl+Ex Cl+Ex Cl+Ex Cl+Ex Cl+ExDetector 1 ChannelDetector 1 Extend (s) 0.0 0.0 0.0 0.0 0.0 0.0 0.0 0.0 0.0Detector 1 Queue (s) 0.0 0.0 0.0 0.0 0.0 0.0 0.0 0.0 0.0Detector 1 Delay (s) 0.0 0.0 0.0 0.0 0.0 0.0 0.0 0.0 0.0Detector 2 Position(ft) 59 59 59Detector 2 Size(ft) 6 6 6Detector 2 Type Cl+Ex Cl+Ex Cl+ExDetector 2 ChannelDetector 2 Extend (s) 0.0 0.0 0.0Turn Type NA Perm NA pm+ov pm+pt NA pm+pt NAProtected Phases 4 8 1 5 2 1 6Permitted Phases 4 8 8 2 6

Lanes, Volumes, Timings23: Lake & Eastman 4/10/2017
7:30 am 4/10/2017 No Build Synchro 8 ReportPage 7
Lane Group EBL EBT EBR WBL WBT WBR NBL NBT NBR SBL SBT SBRDetector Phase 4 4 8 8 1 5 2 1 6Switch PhaseMinimum Initial (s) 6.0 6.0 6.0 6.0 6.0 4.0 8.0 6.0 8.0Minimum Split (s) 30.5 30.5 30.5 30.5 11.0 9.0 26.0 11.0 26.0Total Split (s) 32.0 32.0 32.0 32.0 60.0 15.0 28.0 60.0 73.0Total Split (%) 26.7% 26.7% 26.7% 26.7% 50.0% 12.5% 23.3% 50.0% 60.8%Maximum Green (s) 25.5 25.5 25.5 25.5 55.0 10.0 22.0 55.0 67.0Yellow Time (s) 4.0 4.0 4.0 4.0 4.0 4.0 4.0 4.0 4.0All-Red Time (s) 2.5 2.5 2.5 2.5 1.0 1.0 2.0 1.0 2.0Lost Time Adjust (s) 0.0 0.0 0.0 0.0 0.0 0.0 0.0Total Lost Time (s) 6.5 6.5 5.0 5.0 6.0 5.0 6.0Lead/Lag Lead Lead Lag Lead LagLead-Lag Optimize?Vehicle Extension (s) 3.0 3.0 3.0 3.0 2.0 2.0 2.0 2.0 2.0Recall Mode None None None None None None C-Max None C-MaxWalk Time (s) 7.0 7.0 7.0 7.0 8.0 8.0Flash Dont Walk (s) 17.0 17.0 17.0 17.0 12.0 12.0Pedestrian Calls (#/hr) 0 0 0 0 0 0Act Effct Green (s) 7.4 7.4 26.3 88.6 82.7 106.1 101.4Actuated g/C Ratio 0.06 0.06 0.22 0.74 0.69 0.88 0.84v/c Ratio 0.02 0.24 0.61 0.07 0.09 0.64 0.28Control Delay 0.1 54.9 14.0 1.1 5.2 4.8 1.1Queue Delay 0.0 0.0 0.0 0.0 0.0 0.0 0.0Total Delay 0.1 54.9 14.0 1.1 5.2 4.8 1.1LOS A D B A A A AApproach Delay 0.1 16.9 4.6 2.7Approach LOS A B A AQueue Length 50th (ft) 0 17 33 1 22 11 12Queue Length 95th (ft) 0 43 134 4 35 79 22Internal Link Dist (ft) 222 875 602 961Turn Bay Length (ft) 100 100Base Capacity (vph) 854 361 958 573 2352 1231 2892Starvation Cap Reductn 0 0 0 0 0 0 0Spillback Cap Reductn 0 0 0 0 0 0 0Storage Cap Reductn 0 0 0 0 0 0 0Reduced v/c Ratio 0.01 0.07 0.34 0.06 0.09 0.53 0.28
Intersection SummaryArea Type: OtherCycle Length: 120Actuated Cycle Length: 120Offset: 73 (61%), Referenced to phase 2:NBTL and 6:SBTL, Start of GreenNatural Cycle: 80Control Type: Actuated-CoordinatedMaximum v/c Ratio: 0.64Intersection Signal Delay: 5.3 Intersection LOS: AIntersection Capacity Utilization 63.0% ICU Level of Service BAnalysis Period (min) 15

Lanes, Volumes, Timings23: Lake & Eastman 4/10/2017
7:30 am 4/10/2017 No Build Synchro 8 ReportPage 8
Splits and Phases: 23: Lake & Eastman

Lanes, Volumes, Timings14: Dewey & Eastman 4/10/2017
5:00 pm 4/10/2017 No Build Synchro 8 ReportPage 1
Lane Group EBL EBT EBR WBL WBT WBR NBL NBT NBR SBL SBT SBRLane ConfigurationsVolume (vph) 40 0 11 10 36 27 8 704 12 6 536 49Ideal Flow (vphpl) 1900 1900 1900 1900 1900 1900 1900 1900 1900 1900 1900 1900Lane Width (ft) 10 10 10 10 10 10 10 10 10 10 10 10Storage Length (ft) 280 0 0 0 50 0 230 0Storage Lanes 1 0 1 0 1 0 1 0Taper Length (ft) 25 25 25 25Lane Util. Factor 1.00 1.00 1.00 1.00 1.00 1.00 1.00 0.95 0.95 1.00 0.95 0.95Frt 0.850 0.936 0.998 0.988Flt Protected 0.950 0.950 0.950 0.950Satd. Flow (prot) 1652 1478 0 1652 1627 0 1652 3297 0 1652 3264 0Flt Permitted 0.711 0.750 0.405 0.346Satd. Flow (perm) 1236 1478 0 1304 1627 0 704 3297 0 602 3264 0Right Turn on Red Yes Yes Yes YesSatd. Flow (RTOR) 141 30 3 18Link Speed (mph) 30 30 30 30Link Distance (ft) 583 686 580 1020Travel Time (s) 13.3 15.6 13.2 23.2Peak Hour Factor 0.90 0.90 0.90 0.95 0.90 0.90 0.90 0.90 0.90 0.90 0.90 0.90Adj. Flow (vph) 44 0 12 11 40 30 9 782 13 7 596 54Shared Lane Traffic (%)Lane Group Flow (vph) 44 12 0 11 70 0 9 795 0 7 650 0Enter Blocked Intersection No No No No No No No No No No No NoLane Alignment Left Left Right Left Left Right Left Left Right Left Left RightMedian Width(ft) 10 10 10 10Link Offset(ft) 0 0 0 0Crosswalk Width(ft) 16 16 16 16Two way Left Turn LaneHeadway Factor 1.09 1.09 1.09 1.09 1.09 1.09 1.09 1.09 1.09 1.09 1.09 1.09Turning Speed (mph) 15 9 15 9 15 9 15 9Number of Detectors 1 1 2 2 1 1 1 1Detector Template Leading Detector (ft) 15 15 45 45 19 19 19 19Trailing Detector (ft) 0 0 -10 -10 19 19 19 19Detector 1 Position(ft) 0 0 -10 -10 19 19 19 19Detector 1 Size(ft) 15 15 6 6 0 0 0 0Detector 1 Type Cl+Ex Cl+Ex Cl+Ex Cl+Ex Cl+Ex Cl+Ex Cl+Ex Cl+ExDetector 1 ChannelDetector 1 Extend (s) 0.0 0.0 0.0 0.0 0.0 0.0 0.0 0.0Detector 1 Queue (s) 0.0 0.0 0.0 0.0 0.0 0.0 0.0 0.0Detector 1 Delay (s) 0.0 0.0 0.0 0.0 0.0 0.0 0.0 0.0Detector 2 Position(ft) 39 39Detector 2 Size(ft) 6 6Detector 2 Type Cl+Ex Cl+ExDetector 2 ChannelDetector 2 Extend (s) 0.0 0.0Turn Type Perm NA Perm NA Perm NA Perm NAProtected Phases 2 2 1 1Permitted Phases 2 2 1 1
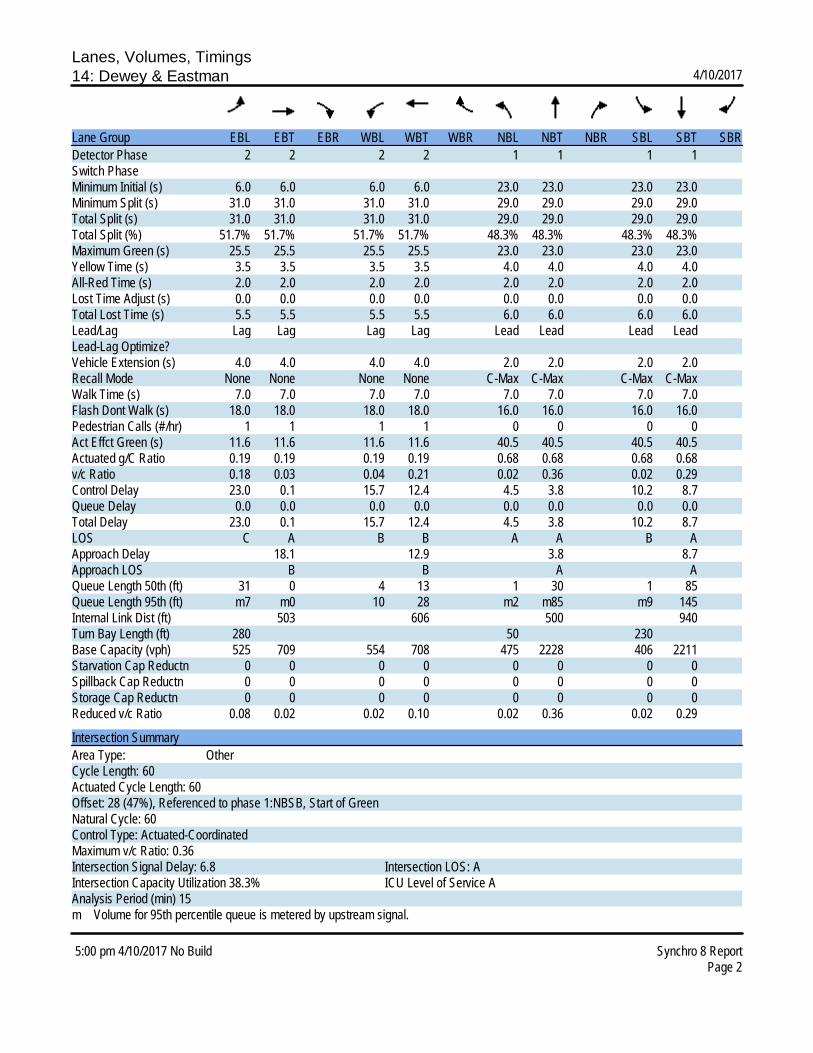
Lanes, Volumes, Timings14: Dewey & Eastman 4/10/2017
5:00 pm 4/10/2017 No Build Synchro 8 ReportPage 2
Lane Group EBL EBT EBR WBL WBT WBR NBL NBT NBR SBL SBT SBRDetector Phase 2 2 2 2 1 1 1 1Switch PhaseMinimum Initial (s) 6.0 6.0 6.0 6.0 23.0 23.0 23.0 23.0Minimum Split (s) 31.0 31.0 31.0 31.0 29.0 29.0 29.0 29.0Total Split (s) 31.0 31.0 31.0 31.0 29.0 29.0 29.0 29.0Total Split (%) 51.7% 51.7% 51.7% 51.7% 48.3% 48.3% 48.3% 48.3%Maximum Green (s) 25.5 25.5 25.5 25.5 23.0 23.0 23.0 23.0Yellow Time (s) 3.5 3.5 3.5 3.5 4.0 4.0 4.0 4.0All-Red Time (s) 2.0 2.0 2.0 2.0 2.0 2.0 2.0 2.0Lost Time Adjust (s) 0.0 0.0 0.0 0.0 0.0 0.0 0.0 0.0Total Lost Time (s) 5.5 5.5 5.5 5.5 6.0 6.0 6.0 6.0Lead/Lag Lag Lag Lag Lag Lead Lead Lead LeadLead-Lag Optimize?Vehicle Extension (s) 4.0 4.0 4.0 4.0 2.0 2.0 2.0 2.0Recall Mode None None None None C-Max C-Max C-Max C-MaxWalk Time (s) 7.0 7.0 7.0 7.0 7.0 7.0 7.0 7.0Flash Dont Walk (s) 18.0 18.0 18.0 18.0 16.0 16.0 16.0 16.0Pedestrian Calls (#/hr) 1 1 1 1 0 0 0 0Act Effct Green (s) 11.6 11.6 11.6 11.6 40.5 40.5 40.5 40.5Actuated g/C Ratio 0.19 0.19 0.19 0.19 0.68 0.68 0.68 0.68v/c Ratio 0.18 0.03 0.04 0.21 0.02 0.36 0.02 0.29Control Delay 23.0 0.1 15.7 12.4 4.5 3.8 10.2 8.7Queue Delay 0.0 0.0 0.0 0.0 0.0 0.0 0.0 0.0Total Delay 23.0 0.1 15.7 12.4 4.5 3.8 10.2 8.7LOS C A B B A A B AApproach Delay 18.1 12.9 3.8 8.7Approach LOS B B A AQueue Length 50th (ft) 31 0 4 13 1 30 1 85Queue Length 95th (ft) m7 m0 10 28 m2 m85 m9 145Internal Link Dist (ft) 503 606 500 940Turn Bay Length (ft) 280 50 230Base Capacity (vph) 525 709 554 708 475 2228 406 2211Starvation Cap Reductn 0 0 0 0 0 0 0 0Spillback Cap Reductn 0 0 0 0 0 0 0 0Storage Cap Reductn 0 0 0 0 0 0 0 0Reduced v/c Ratio 0.08 0.02 0.02 0.10 0.02 0.36 0.02 0.29
Intersection SummaryArea Type: OtherCycle Length: 60Actuated Cycle Length: 60Offset: 28 (47%), Referenced to phase 1:NBSB, Start of GreenNatural Cycle: 60Control Type: Actuated-CoordinatedMaximum v/c Ratio: 0.36Intersection Signal Delay: 6.8 Intersection LOS: AIntersection Capacity Utilization 38.3% ICU Level of Service AAnalysis Period (min) 15m Volume for 95th percentile queue is metered by upstream signal.

Lanes, Volumes, Timings14: Dewey & Eastman 4/10/2017
5:00 pm 4/10/2017 No Build Synchro 8 ReportPage 3
Splits and Phases: 14: Dewey & Eastman

Lanes, Volumes, Timings22: Lake & Merrill/Kodak 4/10/2017
5:00 pm 4/10/2017 No Build Synchro 8 ReportPage 4
Lane Group EBL EBT EBR WBL WBT WBR NBL NBT NBR SBL SBT SBRLane ConfigurationsVolume (vph) 25 2 60 6 2 3 168 1232 0 0 507 12Ideal Flow (vphpl) 1900 1900 1900 1900 1900 1900 1900 1900 1900 1900 1900 1900Lane Width (ft) 12 12 12 12 12 12 11 11 12 12 11 11Storage Length (ft) 125 0 0 0 125 0 125 0Storage Lanes 1 0 0 0 1 0 1 0Taper Length (ft) 25 25 25 25Lane Util. Factor 1.00 1.00 1.00 1.00 1.00 1.00 1.00 0.95 0.95 1.00 0.95 0.95Frt 0.854 0.966 0.997Flt Protected 0.950 0.972 0.950Satd. Flow (prot) 1770 1591 0 0 1749 0 1711 3421 0 1863 3411 0Flt Permitted 0.750 0.781 0.416Satd. Flow (perm) 1397 1591 0 0 1405 0 749 3421 0 1863 3411 0Right Turn on Red Yes Yes Yes YesSatd. Flow (RTOR) 67 3 3Link Speed (mph) 30 30 35 35Link Distance (ft) 2670 307 1041 3113Travel Time (s) 60.7 7.0 20.3 60.6Peak Hour Factor 1.00 0.90 0.90 0.90 0.90 0.90 0.90 0.90 0.90 0.90 0.90 0.90Adj. Flow (vph) 25 2 67 7 2 3 187 1369 0 0 563 13Shared Lane Traffic (%)Lane Group Flow (vph) 25 69 0 0 12 0 187 1369 0 0 576 0Enter Blocked Intersection No No No No No No No No No No No NoLane Alignment Left Left Right Left Left Right Left Left Right Left Left RightMedian Width(ft) 12 12 12 12Link Offset(ft) 0 0 0 0Crosswalk Width(ft) 16 16 16 16Two way Left Turn LaneHeadway Factor 1.00 1.00 1.00 1.00 1.00 1.00 1.04 1.04 1.00 1.00 1.04 1.04Turning Speed (mph) 15 9 15 9 15 9 15 9Number of Detectors 1 1 1 1 1 1 1 1Detector Template Leading Detector (ft) 10 50 50 50 50 19 19 19Trailing Detector (ft) -10 0 0 0 0 19 19 19Detector 1 Position(ft) -10 0 0 0 0 19 19 19Detector 1 Size(ft) 20 50 50 50 50 0 0 0Detector 1 Type Cl+Ex Cl+Ex Cl+Ex Cl+Ex Cl+Ex Cl+Ex Cl+Ex Cl+ExDetector 1 ChannelDetector 1 Extend (s) 0.0 0.0 0.0 0.0 0.0 0.0 0.0 0.0Detector 1 Queue (s) 0.0 0.0 0.0 0.0 0.0 0.0 0.0 0.0Detector 1 Delay (s) 0.0 0.0 0.0 0.0 0.0 0.0 0.0 0.0Turn Type Perm NA Perm NA pm+pt NA Perm NAProtected Phases 2 2 3 1 3 1Permitted Phases 2 2 1 3 1Detector Phase 2 2 2 2 3 1 3 1 1Switch PhaseMinimum Initial (s) 6.0 6.0 6.0 6.0 6.0 21.0 21.0Minimum Split (s) 31.0 31.0 31.0 31.0 11.5 27.0 27.0Total Split (s) 32.0 32.0 32.0 32.0 15.0 73.0 73.0

Lanes, Volumes, Timings22: Lake & Merrill/Kodak 4/10/2017
5:00 pm 4/10/2017 No Build Synchro 8 ReportPage 5
Lane Group EBL EBT EBR WBL WBT WBR NBL NBT NBR SBL SBT SBRTotal Split (%) 26.7% 26.7% 26.7% 26.7% 12.5% 60.8% 60.8%Maximum Green (s) 26.0 26.0 26.0 26.0 9.5 67.0 67.0Yellow Time (s) 3.5 3.5 3.5 3.5 3.5 4.0 4.0All-Red Time (s) 2.5 2.5 2.5 2.5 2.0 2.0 2.0Lost Time Adjust (s) 0.0 0.0 0.0 0.0 0.0 0.0Total Lost Time (s) 6.0 6.0 6.0 5.5 6.0 6.0Lead/Lag Lag Lag Lag Lag Lead LeadLead-Lag Optimize?Vehicle Extension (s) 2.0 2.0 2.0 2.0 3.0 2.0 2.0Recall Mode None None None None Min C-Max C-MaxWalk Time (s) 7.0 7.0 7.0 7.0 10.0 10.0Flash Dont Walk (s) 18.0 18.0 18.0 18.0 11.0 11.0Pedestrian Calls (#/hr) 0 0 0 0 0 0Act Effct Green (s) 7.2 7.2 7.2 98.2 104.4 75.7Actuated g/C Ratio 0.06 0.06 0.06 0.82 0.87 0.63v/c Ratio 0.30 0.44 0.14 0.24 0.46 0.27Control Delay 63.2 28.5 47.9 1.5 1.5 11.7Queue Delay 0.0 0.0 0.0 0.0 0.0 0.0Total Delay 63.2 28.5 47.9 1.5 1.5 11.7LOS E C D A A BApproach Delay 37.8 47.9 1.5 11.7Approach LOS D D A BQueue Length 50th (ft) 20 12 7 11 66 105Queue Length 95th (ft) m46 55 27 m16 m76 154Internal Link Dist (ft) 2590 227 961 3033Turn Bay Length (ft) 125 125Base Capacity (vph) 302 397 306 788 2976 2153Starvation Cap Reductn 0 0 0 0 0 0Spillback Cap Reductn 0 0 0 0 0 0Storage Cap Reductn 0 0 0 0 0 0Reduced v/c Ratio 0.08 0.17 0.04 0.24 0.46 0.27
Intersection SummaryArea Type: OtherCycle Length: 120Actuated Cycle Length: 120Offset: 8 (7%), Referenced to phase 1:NBSB, Start of GreenNatural Cycle: 70Control Type: Actuated-CoordinatedMaximum v/c Ratio: 0.46Intersection Signal Delay: 5.9 Intersection LOS: AIntersection Capacity Utilization 72.4% ICU Level of Service CAnalysis Period (min) 15m Volume for 95th percentile queue is metered by upstream signal.
Splits and Phases: 22: Lake & Merrill/Kodak

Lanes, Volumes, Timings23: Lake & Eastman 4/10/2017
5:00 pm 4/10/2017 No Build Synchro 8 ReportPage 6
Lane Group EBL EBT EBR WBL WBT WBR NBL NBT NBR SBL SBT SBRLane ConfigurationsVolume (vph) 2 26 23 6 3 839 3 587 3 300 285 0Ideal Flow (vphpl) 1900 1900 1900 1900 1900 1900 1900 1900 1900 1900 1900 1900Lane Width (ft) 10 10 10 12 12 12 11 11 11 11 11 11Storage Length (ft) 0 0 0 0 100 0 100 0Storage Lanes 0 0 0 1 1 0 1 0Taper Length (ft) 25 25 25 25Lane Util. Factor 0.95 0.95 0.95 1.00 1.00 1.00 1.00 0.95 0.95 1.00 0.95 0.95Frt 0.932 0.850 0.999Flt Protected 0.998 0.966 0.950 0.950Satd. Flow (prot) 0 3072 0 0 1799 1583 1711 3418 0 1711 3421 0Flt Permitted 0.944 0.754 0.560 0.214Satd. Flow (perm) 0 2906 0 0 1405 1583 1008 3418 0 385 3421 0Right Turn on Red Yes Yes Yes YesSatd. Flow (RTOR) 26 27Link Speed (mph) 30 30 35 35Link Distance (ft) 302 955 682 1041Travel Time (s) 6.9 21.7 13.3 20.3Peak Hour Factor 0.90 0.90 0.90 0.90 0.90 0.95 0.90 0.90 0.90 0.90 0.90 0.90Adj. Flow (vph) 2 29 26 7 3 883 3 652 3 333 317 0Shared Lane Traffic (%)Lane Group Flow (vph) 0 57 0 0 10 883 3 655 0 333 317 0Enter Blocked Intersection No No No No No No No No No No No NoLane Alignment Left Left Right Left Left Right Left Left Right Left Left RightMedian Width(ft) 0 0 11 11Link Offset(ft) 0 0 0 0Crosswalk Width(ft) 16 16 16 16Two way Left Turn LaneHeadway Factor 1.09 1.09 1.09 1.00 1.00 1.00 1.04 1.04 1.04 1.04 1.04 1.04Turning Speed (mph) 15 9 15 9 15 9 15 9Number of Detectors 1 1 2 2 2 1 1 1 1Detector Template Leading Detector (ft) 35 35 65 65 65 50 19 50 19Trailing Detector (ft) 30 30 -5 -5 -5 0 19 0 19Detector 1 Position(ft) 30 30 -5 -5 -5 0 19 0 19Detector 1 Size(ft) 5 5 6 6 6 50 0 50 0Detector 1 Type Cl+Ex Cl+Ex Cl+Ex Cl+Ex Cl+Ex Cl+Ex Cl+Ex Cl+Ex Cl+ExDetector 1 ChannelDetector 1 Extend (s) 0.0 0.0 0.0 0.0 0.0 0.0 0.0 0.0 0.0Detector 1 Queue (s) 0.0 0.0 0.0 0.0 0.0 0.0 0.0 0.0 0.0Detector 1 Delay (s) 0.0 0.0 0.0 0.0 0.0 0.0 0.0 0.0 0.0Detector 2 Position(ft) 59 59 59Detector 2 Size(ft) 6 6 6Detector 2 Type Cl+Ex Cl+Ex Cl+ExDetector 2 ChannelDetector 2 Extend (s) 0.0 0.0 0.0Turn Type Perm NA Perm NA pm+ov pm+pt NA pm+pt NAProtected Phases 4 8 1 5 2 1 6Permitted Phases 4 8 8 2 6

Lanes, Volumes, Timings23: Lake & Eastman 4/10/2017
5:00 pm 4/10/2017 No Build Synchro 8 ReportPage 7
Lane Group EBL EBT EBR WBL WBT WBR NBL NBT NBR SBL SBT SBRDetector Phase 4 4 8 8 1 5 2 1 6Switch PhaseMinimum Initial (s) 6.0 6.0 6.0 6.0 6.0 4.0 8.0 6.0 8.0Minimum Split (s) 30.5 30.5 30.5 30.5 11.0 9.0 26.0 11.0 26.0Total Split (s) 32.0 32.0 32.0 32.0 56.0 15.0 32.0 56.0 73.0Total Split (%) 26.7% 26.7% 26.7% 26.7% 46.7% 12.5% 26.7% 46.7% 60.8%Maximum Green (s) 25.5 25.5 25.5 25.5 51.0 10.0 26.0 51.0 67.0Yellow Time (s) 4.0 4.0 4.0 4.0 4.0 4.0 4.0 4.0 4.0All-Red Time (s) 2.5 2.5 2.5 2.5 1.0 1.0 2.0 1.0 2.0Lost Time Adjust (s) 0.0 0.0 0.0 0.0 0.0 0.0 0.0Total Lost Time (s) 6.5 6.5 5.0 5.0 6.0 5.0 6.0Lead/Lag Lead Lead Lag Lead LagLead-Lag Optimize?Vehicle Extension (s) 3.0 3.0 3.0 3.0 2.0 2.0 2.0 2.0 2.0Recall Mode None None None None None None C-Max None C-MaxWalk Time (s) 7.0 7.0 7.0 7.0 8.0 8.0Flash Dont Walk (s) 17.0 17.0 17.0 17.0 12.0 12.0Pedestrian Calls (#/hr) 0 0 0 0 0 0Act Effct Green (s) 6.7 6.7 72.1 42.4 36.9 104.3 102.6Actuated g/C Ratio 0.06 0.06 0.60 0.35 0.31 0.87 0.86v/c Ratio 0.31 0.13 0.92 0.01 0.62 0.33 0.11Control Delay 37.7 56.0 37.7 22.3 23.0 18.5 2.2Queue Delay 0.0 0.0 0.0 0.0 0.0 0.0 0.0Total Delay 37.7 56.0 37.7 22.3 23.0 18.5 2.2LOS D E D C C B AApproach Delay 37.7 37.9 23.0 10.6Approach LOS D D C BQueue Length 50th (ft) 12 6 545 1 104 137 15Queue Length 95th (ft) 34 m8 544 m2 #363 251 41Internal Link Dist (ft) 222 875 602 961Turn Bay Length (ft) 100 100Base Capacity (vph) 638 298 961 461 1051 1013 2925Starvation Cap Reductn 0 0 0 0 0 0 0Spillback Cap Reductn 0 0 0 0 0 0 0Storage Cap Reductn 0 0 0 0 0 0 0Reduced v/c Ratio 0.09 0.03 0.92 0.01 0.62 0.33 0.11
Intersection SummaryArea Type: OtherCycle Length: 120Actuated Cycle Length: 120Offset: 28 (23%), Referenced to phase 2:NBTL and 6:SBTL, Start of GreenNatural Cycle: 80Control Type: Actuated-CoordinatedMaximum v/c Ratio: 0.92Intersection Signal Delay: 25.7 Intersection LOS: CIntersection Capacity Utilization 87.9% ICU Level of Service EAnalysis Period (min) 15# 95th percentile volume exceeds capacity, queue may be longer.

Lanes, Volumes, Timings23: Lake & Eastman 4/10/2017
5:00 pm 4/10/2017 No Build Synchro 8 ReportPage 8
Queue shown is maximum after two cycles.m Volume for 95th percentile queue is metered by upstream signal.
Splits and Phases: 23: Lake & Eastman

Lanes, Volumes, Timings1: Lake & Maplewood Drive 4/10/2017
7:30 am 4/10/2017 Build Synchro 8 ReportPage 1
Lane Group WBL WBR NBT NBR SBL SBTLane ConfigurationsVolume (vph) 117 458 363 34 701 869Ideal Flow (vphpl) 1900 1900 1900 1900 1900 1900Storage Length (ft) 0 350 0 530Storage Lanes 1 2 0 1Taper Length (ft) 25 25Lane Util. Factor 1.00 0.88 0.95 0.95 1.00 0.95Frt 0.850 0.987Flt Protected 0.950 0.950Satd. Flow (prot) 1770 2787 3493 0 1770 3539Flt Permitted 0.950 0.365Satd. Flow (perm) 1770 2787 3493 0 680 3539Right Turn on Red Yes YesSatd. Flow (RTOR) 87 7Link Speed (mph) 30 35 35Link Distance (ft) 604 298 693Travel Time (s) 13.7 5.8 13.5Peak Hour Factor 0.90 0.90 0.90 0.90 0.90 0.90Adj. Flow (vph) 130 509 403 38 779 966Shared Lane Traffic (%)Lane Group Flow (vph) 130 509 441 0 779 966Enter Blocked Intersection No No No No No NoLane Alignment Left Right Left Right Left LeftMedian Width(ft) 12 12 12Link Offset(ft) 0 0 0Crosswalk Width(ft) 16 16 16Two way Left Turn LaneHeadway Factor 1.00 1.00 1.00 1.00 1.00 1.00Turning Speed (mph) 15 9 9 15Number of Detectors 1 1 1 1 1Detector Template Left Right Thru Left ThruLeading Detector (ft) 50 50 50 50 50Trailing Detector (ft) 0 0 0 0 0Detector 1 Position(ft) 0 0 0 0 0Detector 1 Size(ft) 50 50 50 50 50Detector 1 Type Cl+Ex Cl+Ex Cl+Ex Cl+Ex Cl+ExDetector 1 ChannelDetector 1 Extend (s) 0.0 0.0 0.0 0.0 0.0Detector 1 Queue (s) 0.0 0.0 0.0 0.0 0.0Detector 1 Delay (s) 0.0 0.0 0.0 0.0 0.0Turn Type Prot pm+ov NA pm+pt NAProtected Phases 8 1 2 1 6Permitted Phases 8 6Detector Phase 8 1 2 1 6Switch PhaseMinimum Initial (s) 3.0 3.0 3.0 3.0 3.0Minimum Split (s) 26.0 10.0 26.0 10.0 27.0Total Split (s) 28.0 66.0 26.0 66.0 92.0Total Split (%) 23.3% 55.0% 21.7% 55.0% 76.7%

Lanes, Volumes, Timings1: Lake & Maplewood Drive 4/10/2017
7:30 am 4/10/2017 Build Synchro 8 ReportPage 2
Lane Group WBL WBR NBT NBR SBL SBTMaximum Green (s) 23.0 61.0 21.0 61.0 87.0Yellow Time (s) 3.0 5.0 3.0 5.0 3.0All-Red Time (s) 2.0 0.0 2.0 0.0 2.0Lost Time Adjust (s) 0.0 0.0 0.0 0.0 0.0Total Lost Time (s) 5.0 5.0 5.0 5.0 5.0Lead/Lag Lead Lag LeadLead-Lag Optimize?Vehicle Extension (s) 6.0 3.0 3.0 3.0 3.0Recall Mode None None C-Max None C-MaxWalk Time (s) 7.0 7.0 7.0Flash Dont Walk (s) 14.0 14.0 14.0Pedestrian Calls (#/hr) 0 0 0Act Effct Green (s) 16.9 70.2 39.8 93.1 93.1Actuated g/C Ratio 0.14 0.58 0.33 0.78 0.78v/c Ratio 0.52 0.31 0.38 0.81 0.35Control Delay 54.8 9.8 39.7 23.8 3.6Queue Delay 0.0 0.0 0.3 0.5 0.0Total Delay 54.8 9.8 40.0 24.3 3.6LOS D A D C AApproach Delay 19.0 40.0 12.8Approach LOS B D BQueue Length 50th (ft) 95 82 157 407 42Queue Length 95th (ft) 152 68 237 525 164Internal Link Dist (ft) 524 218 613Turn Bay Length (ft) 350 530Base Capacity (vph) 339 1955 1164 1083 2746Starvation Cap Reductn 0 0 277 71 0Spillback Cap Reductn 0 0 0 0 9Storage Cap Reductn 0 0 0 0 0Reduced v/c Ratio 0.38 0.26 0.50 0.77 0.35
Intersection SummaryArea Type: OtherCycle Length: 120Actuated Cycle Length: 120Offset: 67 (56%), Referenced to phase 2:NBT and 6:SBTL, Start of GreenNatural Cycle: 90Control Type: Actuated-CoordinatedMaximum v/c Ratio: 0.81Intersection Signal Delay: 18.4 Intersection LOS: BIntersection Capacity Utilization 68.9% ICU Level of Service CAnalysis Period (min) 15
Splits and Phases: 1: Lake & Maplewood Drive

Lanes, Volumes, Timings14: Dewey & Eastman 4/10/2017
7:30 am 4/10/2017 Build Synchro 8 ReportPage 3
Lane Group EBL EBT EBR WBL WBT WBR NBL NBT NBR SBL SBT SBRLane ConfigurationsVolume (vph) 9 51 15 28 25 27 3 311 77 85 705 30Ideal Flow (vphpl) 1900 1900 1900 1900 1900 1900 1900 1900 1900 1900 1900 1900Lane Width (ft) 10 10 10 10 10 10 10 10 10 10 10 10Storage Length (ft) 280 0 0 0 50 0 230 0Storage Lanes 1 0 1 0 1 0 1 0Taper Length (ft) 25 25 25 25Lane Util. Factor 1.00 1.00 1.00 1.00 1.00 1.00 1.00 0.95 0.95 1.00 0.95 0.95Frt 0.966 0.922 0.970 0.994Flt Protected 0.950 0.950 0.950 0.950Satd. Flow (prot) 1652 1679 0 1652 1603 0 1652 3204 0 1652 3283 0Flt Permitted 0.719 0.709 0.337 0.501Satd. Flow (perm) 1250 1679 0 1233 1603 0 586 3204 0 871 3283 0Right Turn on Red Yes Yes Yes YesSatd. Flow (RTOR) 17 30 59 8Link Speed (mph) 30 30 30 30Link Distance (ft) 583 686 580 1020Travel Time (s) 13.3 15.6 13.2 23.2Peak Hour Factor 0.90 0.90 0.90 0.90 0.90 0.90 0.90 0.90 0.90 0.90 0.90 0.90Adj. Flow (vph) 10 57 17 31 28 30 3 346 86 94 783 33Shared Lane Traffic (%)Lane Group Flow (vph) 10 74 0 31 58 0 3 432 0 94 816 0Enter Blocked Intersection No No No No No No No No No No No NoLane Alignment Left Left Right Left Left Right Left Left Right Left Left RightMedian Width(ft) 10 10 10 10Link Offset(ft) 0 0 0 0Crosswalk Width(ft) 16 16 16 16Two way Left Turn LaneHeadway Factor 1.09 1.09 1.09 1.09 1.09 1.09 1.09 1.09 1.09 1.09 1.09 1.09Turning Speed (mph) 15 9 15 9 15 9 15 9Number of Detectors 1 1 2 2 1 1 1 1Detector Template Leading Detector (ft) 15 15 45 45 19 19 19 19Trailing Detector (ft) 0 0 -10 -10 19 19 19 19Detector 1 Position(ft) 0 0 -10 -10 19 19 19 19Detector 1 Size(ft) 15 15 6 6 0 0 0 0Detector 1 Type Cl+Ex Cl+Ex Cl+Ex Cl+Ex Cl+Ex Cl+Ex Cl+Ex Cl+ExDetector 1 ChannelDetector 1 Extend (s) 0.0 0.0 0.0 0.0 0.0 0.0 0.0 0.0Detector 1 Queue (s) 0.0 0.0 0.0 0.0 0.0 0.0 0.0 0.0Detector 1 Delay (s) 0.0 0.0 0.0 0.0 0.0 0.0 0.0 0.0Detector 2 Position(ft) 39 39Detector 2 Size(ft) 6 6Detector 2 Type Cl+Ex Cl+ExDetector 2 ChannelDetector 2 Extend (s) 0.0 0.0Turn Type Perm NA Perm NA Perm NA Perm NAProtected Phases 2 2 1 1Permitted Phases 2 2 1 1

Lanes, Volumes, Timings14: Dewey & Eastman 4/10/2017
7:30 am 4/10/2017 Build Synchro 8 ReportPage 4
Lane Group EBL EBT EBR WBL WBT WBR NBL NBT NBR SBL SBT SBRDetector Phase 2 2 2 2 1 1 1 1Switch PhaseMinimum Initial (s) 6.0 6.0 6.0 6.0 23.0 23.0 23.0 23.0Minimum Split (s) 31.0 31.0 31.0 31.0 29.0 29.0 29.0 29.0Total Split (s) 31.0 31.0 31.0 31.0 29.0 29.0 29.0 29.0Total Split (%) 51.7% 51.7% 51.7% 51.7% 48.3% 48.3% 48.3% 48.3%Maximum Green (s) 25.5 25.5 25.5 25.5 23.0 23.0 23.0 23.0Yellow Time (s) 3.5 3.5 3.5 3.5 4.0 4.0 4.0 4.0All-Red Time (s) 2.0 2.0 2.0 2.0 2.0 2.0 2.0 2.0Lost Time Adjust (s) 0.0 0.0 0.0 0.0 0.0 0.0 0.0 0.0Total Lost Time (s) 5.5 5.5 5.5 5.5 6.0 6.0 6.0 6.0Lead/Lag Lag Lag Lag Lag Lead Lead Lead LeadLead-Lag Optimize?Vehicle Extension (s) 4.0 4.0 4.0 4.0 2.0 2.0 2.0 2.0Recall Mode None None None None C-Max C-Max C-Max C-MaxWalk Time (s) 7.0 7.0 7.0 7.0 7.0 7.0 7.0 7.0Flash Dont Walk (s) 18.0 18.0 18.0 18.0 16.0 16.0 16.0 16.0Pedestrian Calls (#/hr) 1 1 1 1 0 0 0 0Act Effct Green (s) 11.6 11.6 11.6 11.6 40.6 40.6 40.6 40.6Actuated g/C Ratio 0.19 0.19 0.19 0.19 0.68 0.68 0.68 0.68v/c Ratio 0.04 0.22 0.13 0.17 0.01 0.20 0.16 0.37Control Delay 16.0 14.9 17.9 11.0 7.7 4.1 9.8 10.6Queue Delay 0.0 0.0 0.0 0.0 0.0 0.0 0.0 0.0Total Delay 16.0 14.9 17.9 11.0 7.7 4.1 9.8 10.6LOS B B B B A A A BApproach Delay 15.0 13.4 4.1 10.5Approach LOS B B A BQueue Length 50th (ft) 4 7 10 9 0 17 22 137Queue Length 95th (ft) m4 19 20 24 m2 47 61 195Internal Link Dist (ft) 503 606 500 940Turn Bay Length (ft) 280 50 230Base Capacity (vph) 531 723 524 698 396 2186 589 2222Starvation Cap Reductn 0 0 0 0 0 0 0 0Spillback Cap Reductn 0 0 0 0 0 0 0 0Storage Cap Reductn 0 0 0 0 0 0 0 0Reduced v/c Ratio 0.02 0.10 0.06 0.08 0.01 0.20 0.16 0.37
Intersection SummaryArea Type: OtherCycle Length: 60Actuated Cycle Length: 60Offset: 0 (0%), Referenced to phase 1:NBSB, Start of GreenNatural Cycle: 60Control Type: Actuated-CoordinatedMaximum v/c Ratio: 0.37Intersection Signal Delay: 9.1 Intersection LOS: AIntersection Capacity Utilization 62.4% ICU Level of Service BAnalysis Period (min) 15m Volume for 95th percentile queue is metered by upstream signal.

Lanes, Volumes, Timings14: Dewey & Eastman 4/10/2017
7:30 am 4/10/2017 Build Synchro 8 ReportPage 5
Splits and Phases: 14: Dewey & Eastman

Lanes, Volumes, Timings22: Lake & Merrill/Kodak 4/10/2017
7:30 am 4/10/2017 Build Synchro 8 ReportPage 6
Lane Group EBL EBT EBR WBL WBT WBR NBL NBT NBR SBL SBT SBRLane ConfigurationsVolume (vph) 10 2 143 2 0 0 52 486 10 4 1411 19Ideal Flow (vphpl) 1900 1900 1900 1900 1900 1900 1900 1900 1900 1900 1900 1900Lane Width (ft) 12 12 12 12 12 12 11 11 12 12 11 11Storage Length (ft) 125 0 0 0 125 0 125 0Storage Lanes 1 0 0 0 1 0 1 0Taper Length (ft) 25 25 25 25Lane Util. Factor 1.00 1.00 1.00 1.00 1.00 1.00 1.00 0.95 0.95 1.00 0.95 0.95Frt 0.852 0.997 0.998Flt Protected 0.950 0.950 0.950 0.950Satd. Flow (prot) 1770 1587 0 0 1770 0 1711 3411 0 1770 3414 0Flt Permitted 0.757 0.526 0.113 0.446Satd. Flow (perm) 1410 1587 0 0 980 0 203 3411 0 831 3414 0Right Turn on Red Yes Yes Yes YesSatd. Flow (RTOR) 157 4 2Link Speed (mph) 30 30 35 35Link Distance (ft) 2670 307 1041 3113Travel Time (s) 60.7 7.0 20.3 60.6Peak Hour Factor 1.00 0.90 0.90 0.90 0.90 0.90 0.90 0.90 0.90 0.90 0.90 0.90Adj. Flow (vph) 10 2 159 2 0 0 58 540 11 4 1568 21Shared Lane Traffic (%)Lane Group Flow (vph) 10 161 0 0 2 0 58 551 0 4 1589 0Enter Blocked Intersection No No No No No No No No No No No NoLane Alignment Left Left Right Left Left Right Left Left Right Left Left RightMedian Width(ft) 12 12 12 12Link Offset(ft) 0 0 0 0Crosswalk Width(ft) 16 16 16 16Two way Left Turn LaneHeadway Factor 1.00 1.00 1.00 1.00 1.00 1.00 1.04 1.04 1.00 1.00 1.04 1.04Turning Speed (mph) 15 9 15 9 15 9 15 9Number of Detectors 1 1 1 1 1 1 1 1Detector Template Leading Detector (ft) 10 50 50 50 50 19 19 19Trailing Detector (ft) -10 0 0 0 0 19 19 19Detector 1 Position(ft) -10 0 0 0 0 19 19 19Detector 1 Size(ft) 20 50 50 50 50 0 0 0Detector 1 Type Cl+Ex Cl+Ex Cl+Ex Cl+Ex Cl+Ex Cl+Ex Cl+Ex Cl+ExDetector 1 ChannelDetector 1 Extend (s) 0.0 0.0 0.0 0.0 0.0 0.0 0.0 0.0Detector 1 Queue (s) 0.0 0.0 0.0 0.0 0.0 0.0 0.0 0.0Detector 1 Delay (s) 0.0 0.0 0.0 0.0 0.0 0.0 0.0 0.0Turn Type Perm NA Perm NA pm+pt NA Perm NAProtected Phases 2 2 3 1 3 1Permitted Phases 2 2 1 3 1Detector Phase 2 2 2 2 3 1 3 1 1Switch PhaseMinimum Initial (s) 6.0 6.0 6.0 6.0 6.0 21.0 21.0Minimum Split (s) 31.0 31.0 31.0 31.0 11.5 27.0 27.0Total Split (s) 32.0 32.0 32.0 32.0 15.0 73.0 73.0

Lanes, Volumes, Timings22: Lake & Merrill/Kodak 4/10/2017
7:30 am 4/10/2017 Build Synchro 8 ReportPage 7
Lane Group EBL EBT EBR WBL WBT WBR NBL NBT NBR SBL SBT SBRTotal Split (%) 26.7% 26.7% 26.7% 26.7% 12.5% 60.8% 60.8%Maximum Green (s) 26.0 26.0 26.0 26.0 9.5 67.0 67.0Yellow Time (s) 3.5 3.5 3.5 3.5 3.5 4.0 4.0All-Red Time (s) 2.5 2.5 2.5 2.5 2.0 2.0 2.0Lost Time Adjust (s) 0.0 0.0 0.0 0.0 0.0 0.0Total Lost Time (s) 6.0 6.0 6.0 5.5 6.0 6.0Lead/Lag Lag Lag Lag Lag Lead LeadLead-Lag Optimize?Vehicle Extension (s) 2.0 2.0 2.0 2.0 3.0 2.0 2.0Recall Mode None None None None Min C-Max C-MaxWalk Time (s) 7.0 7.0 7.0 7.0 10.0 10.0Flash Dont Walk (s) 18.0 18.0 18.0 18.0 11.0 11.0Pedestrian Calls (#/hr) 0 0 0 0 0 0Act Effct Green (s) 7.6 7.6 7.6 95.4 100.4 85.2 85.2Actuated g/C Ratio 0.06 0.06 0.06 0.80 0.84 0.71 0.71v/c Ratio 0.11 0.65 0.03 0.20 0.19 0.01 0.66Control Delay 54.8 24.2 51.5 6.9 2.6 5.8 11.1Queue Delay 0.0 0.0 0.0 0.0 0.0 0.0 0.0Total Delay 54.8 24.2 51.5 6.9 2.6 5.8 11.1LOS D C D A A A BApproach Delay 26.0 51.5 3.1 11.1Approach LOS C D A BQueue Length 50th (ft) 7 15 2 7 37 1 286Queue Length 95th (ft) 22 61 10 18 63 m1 496Internal Link Dist (ft) 2590 227 961 3033Turn Bay Length (ft) 125 125 125Base Capacity (vph) 305 466 212 293 2771 589 2423Starvation Cap Reductn 0 0 0 0 0 0 0Spillback Cap Reductn 0 0 0 0 0 0 0Storage Cap Reductn 0 0 0 0 0 0 0Reduced v/c Ratio 0.03 0.35 0.01 0.20 0.20 0.01 0.66
Intersection SummaryArea Type: OtherCycle Length: 120Actuated Cycle Length: 120Offset: 2 (2%), Referenced to phase 1:NBSB, Start of GreenNatural Cycle: 90Control Type: Actuated-CoordinatedMaximum v/c Ratio: 0.66Intersection Signal Delay: 10.1 Intersection LOS: BIntersection Capacity Utilization 62.2% ICU Level of Service BAnalysis Period (min) 15m Volume for 95th percentile queue is metered by upstream signal.
Splits and Phases: 22: Lake & Merrill/Kodak
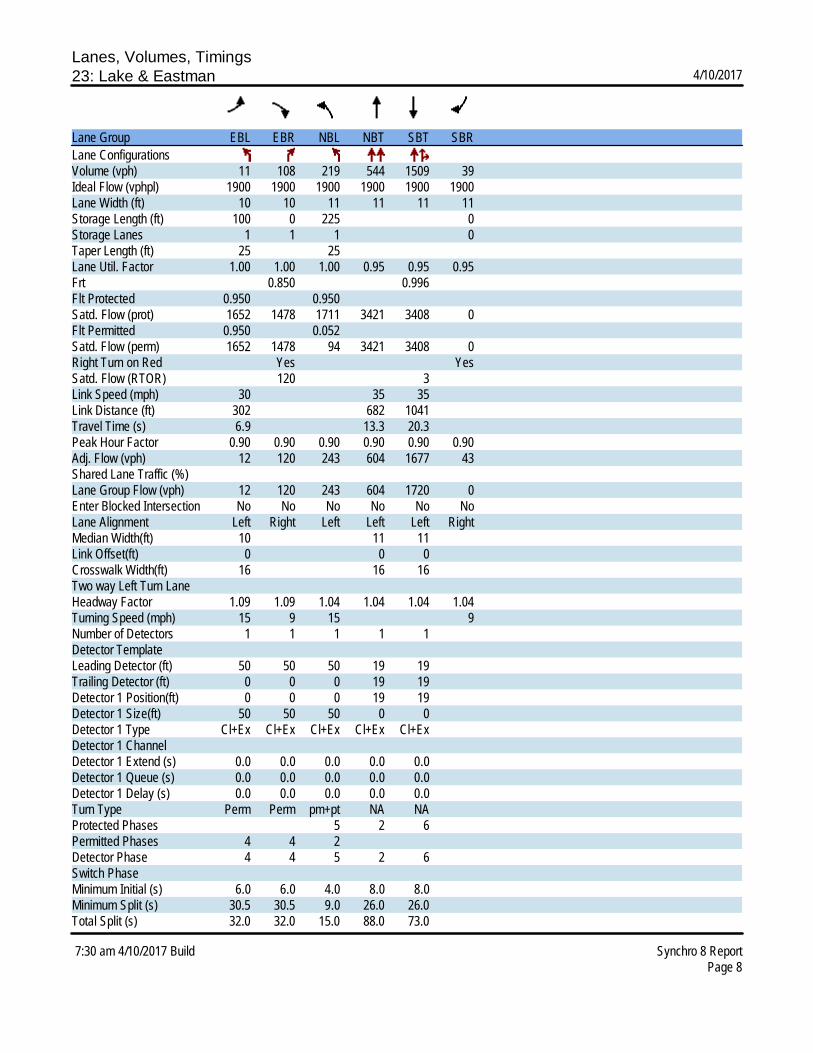
Lanes, Volumes, Timings23: Lake & Eastman 4/10/2017
7:30 am 4/10/2017 Build Synchro 8 ReportPage 8
Lane Group EBL EBR NBL NBT SBT SBRLane ConfigurationsVolume (vph) 11 108 219 544 1509 39Ideal Flow (vphpl) 1900 1900 1900 1900 1900 1900Lane Width (ft) 10 10 11 11 11 11Storage Length (ft) 100 0 225 0Storage Lanes 1 1 1 0Taper Length (ft) 25 25Lane Util. Factor 1.00 1.00 1.00 0.95 0.95 0.95Frt 0.850 0.996Flt Protected 0.950 0.950Satd. Flow (prot) 1652 1478 1711 3421 3408 0Flt Permitted 0.950 0.052Satd. Flow (perm) 1652 1478 94 3421 3408 0Right Turn on Red Yes YesSatd. Flow (RTOR) 120 3Link Speed (mph) 30 35 35Link Distance (ft) 302 682 1041Travel Time (s) 6.9 13.3 20.3Peak Hour Factor 0.90 0.90 0.90 0.90 0.90 0.90Adj. Flow (vph) 12 120 243 604 1677 43Shared Lane Traffic (%)Lane Group Flow (vph) 12 120 243 604 1720 0Enter Blocked Intersection No No No No No NoLane Alignment Left Right Left Left Left RightMedian Width(ft) 10 11 11Link Offset(ft) 0 0 0Crosswalk Width(ft) 16 16 16Two way Left Turn LaneHeadway Factor 1.09 1.09 1.04 1.04 1.04 1.04Turning Speed (mph) 15 9 15 9Number of Detectors 1 1 1 1 1Detector Template Leading Detector (ft) 50 50 50 19 19Trailing Detector (ft) 0 0 0 19 19Detector 1 Position(ft) 0 0 0 19 19Detector 1 Size(ft) 50 50 50 0 0Detector 1 Type Cl+Ex Cl+Ex Cl+Ex Cl+Ex Cl+ExDetector 1 ChannelDetector 1 Extend (s) 0.0 0.0 0.0 0.0 0.0Detector 1 Queue (s) 0.0 0.0 0.0 0.0 0.0Detector 1 Delay (s) 0.0 0.0 0.0 0.0 0.0Turn Type Perm Perm pm+pt NA NAProtected Phases 5 2 6Permitted Phases 4 4 2Detector Phase 4 4 5 2 6Switch PhaseMinimum Initial (s) 6.0 6.0 4.0 8.0 8.0Minimum Split (s) 30.5 30.5 9.0 26.0 26.0Total Split (s) 32.0 32.0 15.0 88.0 73.0

Lanes, Volumes, Timings23: Lake & Eastman 4/10/2017
7:30 am 4/10/2017 Build Synchro 8 ReportPage 9
Lane Group EBL EBR NBL NBT SBT SBRTotal Split (%) 26.7% 26.7% 12.5% 73.3% 60.8%Maximum Green (s) 25.5 25.5 10.0 82.0 67.0Yellow Time (s) 4.0 4.0 4.0 4.0 4.0All-Red Time (s) 2.5 2.5 1.0 2.0 2.0Lost Time Adjust (s) 0.0 0.0 0.0 0.0 0.0Total Lost Time (s) 6.5 6.5 5.0 6.0 6.0Lead/Lag Lead LagLead-Lag Optimize?Vehicle Extension (s) 3.0 3.0 2.0 2.0 2.0Recall Mode None None None C-Max C-MaxWalk Time (s) 7.0 7.0 8.0 8.0Flash Dont Walk (s) 17.0 17.0 12.0 12.0Pedestrian Calls (#/hr) 0 0 0 0Act Effct Green (s) 7.7 7.7 100.8 99.8 71.3Actuated g/C Ratio 0.06 0.06 0.84 0.83 0.59v/c Ratio 0.11 0.58 0.62 0.21 0.85Control Delay 53.6 20.8 26.6 1.8 20.0Queue Delay 0.0 0.0 0.0 0.0 0.0Total Delay 53.6 20.8 26.6 1.8 20.0LOS D C C A BApproach Delay 23.8 8.9 20.0Approach LOS C A BQueue Length 50th (ft) 9 0 70 18 566Queue Length 95th (ft) 28 57 222 49 590Internal Link Dist (ft) 222 602 961Turn Bay Length (ft) 100 225Base Capacity (vph) 351 408 395 2845 2027Starvation Cap Reductn 0 0 0 0 0Spillback Cap Reductn 0 0 0 0 0Storage Cap Reductn 0 0 0 0 0Reduced v/c Ratio 0.03 0.29 0.62 0.21 0.85
Intersection SummaryArea Type: OtherCycle Length: 120Actuated Cycle Length: 120Offset: 28 (23%), Referenced to phase 2:NBTL and 6:SBT, Start of GreenNatural Cycle: 100Control Type: Actuated-CoordinatedMaximum v/c Ratio: 0.85Intersection Signal Delay: 16.7 Intersection LOS: BIntersection Capacity Utilization 74.7% ICU Level of Service DAnalysis Period (min) 15
Splits and Phases: 23: Lake & Eastman
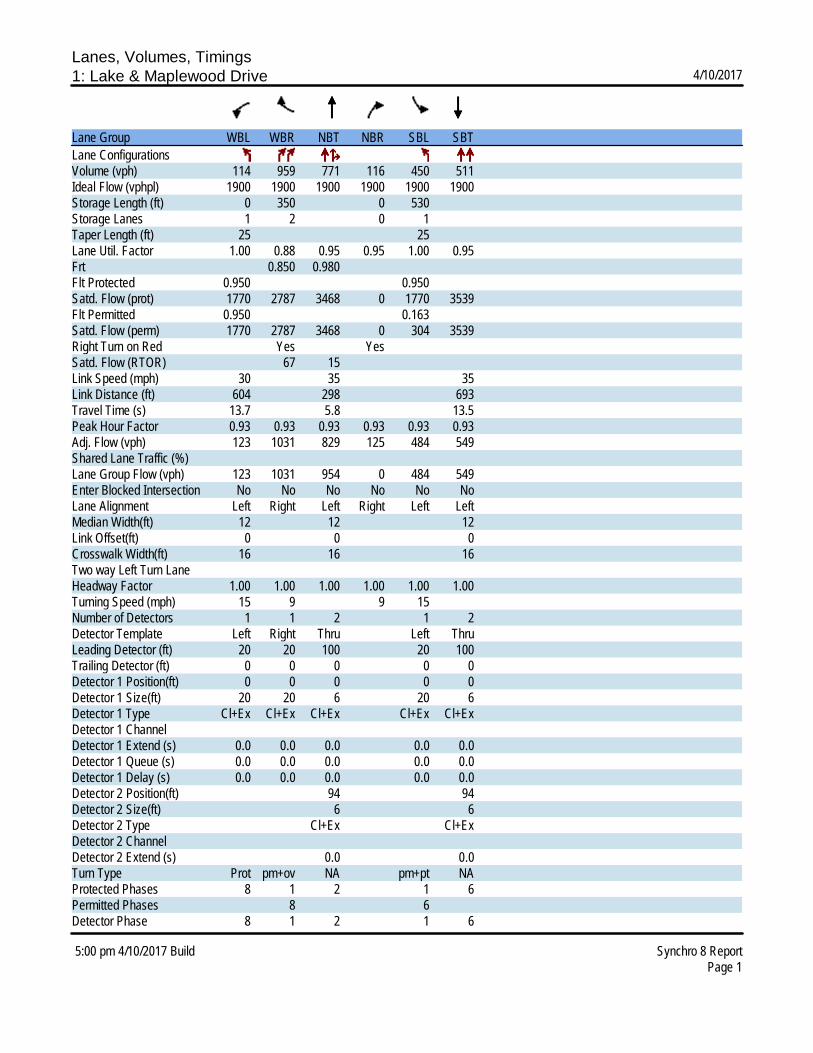
Lanes, Volumes, Timings1: Lake & Maplewood Drive 4/10/2017
5:00 pm 4/10/2017 Build Synchro 8 ReportPage 1
Lane Group WBL WBR NBT NBR SBL SBTLane ConfigurationsVolume (vph) 114 959 771 116 450 511Ideal Flow (vphpl) 1900 1900 1900 1900 1900 1900Storage Length (ft) 0 350 0 530Storage Lanes 1 2 0 1Taper Length (ft) 25 25Lane Util. Factor 1.00 0.88 0.95 0.95 1.00 0.95Frt 0.850 0.980Flt Protected 0.950 0.950Satd. Flow (prot) 1770 2787 3468 0 1770 3539Flt Permitted 0.950 0.163Satd. Flow (perm) 1770 2787 3468 0 304 3539Right Turn on Red Yes YesSatd. Flow (RTOR) 67 15Link Speed (mph) 30 35 35Link Distance (ft) 604 298 693Travel Time (s) 13.7 5.8 13.5Peak Hour Factor 0.93 0.93 0.93 0.93 0.93 0.93Adj. Flow (vph) 123 1031 829 125 484 549Shared Lane Traffic (%)Lane Group Flow (vph) 123 1031 954 0 484 549Enter Blocked Intersection No No No No No NoLane Alignment Left Right Left Right Left LeftMedian Width(ft) 12 12 12Link Offset(ft) 0 0 0Crosswalk Width(ft) 16 16 16Two way Left Turn LaneHeadway Factor 1.00 1.00 1.00 1.00 1.00 1.00Turning Speed (mph) 15 9 9 15Number of Detectors 1 1 2 1 2Detector Template Left Right Thru Left ThruLeading Detector (ft) 20 20 100 20 100Trailing Detector (ft) 0 0 0 0 0Detector 1 Position(ft) 0 0 0 0 0Detector 1 Size(ft) 20 20 6 20 6Detector 1 Type Cl+Ex Cl+Ex Cl+Ex Cl+Ex Cl+ExDetector 1 ChannelDetector 1 Extend (s) 0.0 0.0 0.0 0.0 0.0Detector 1 Queue (s) 0.0 0.0 0.0 0.0 0.0Detector 1 Delay (s) 0.0 0.0 0.0 0.0 0.0Detector 2 Position(ft) 94 94Detector 2 Size(ft) 6 6Detector 2 Type Cl+Ex Cl+ExDetector 2 ChannelDetector 2 Extend (s) 0.0 0.0Turn Type Prot pm+ov NA pm+pt NAProtected Phases 8 1 2 1 6Permitted Phases 8 6Detector Phase 8 1 2 1 6
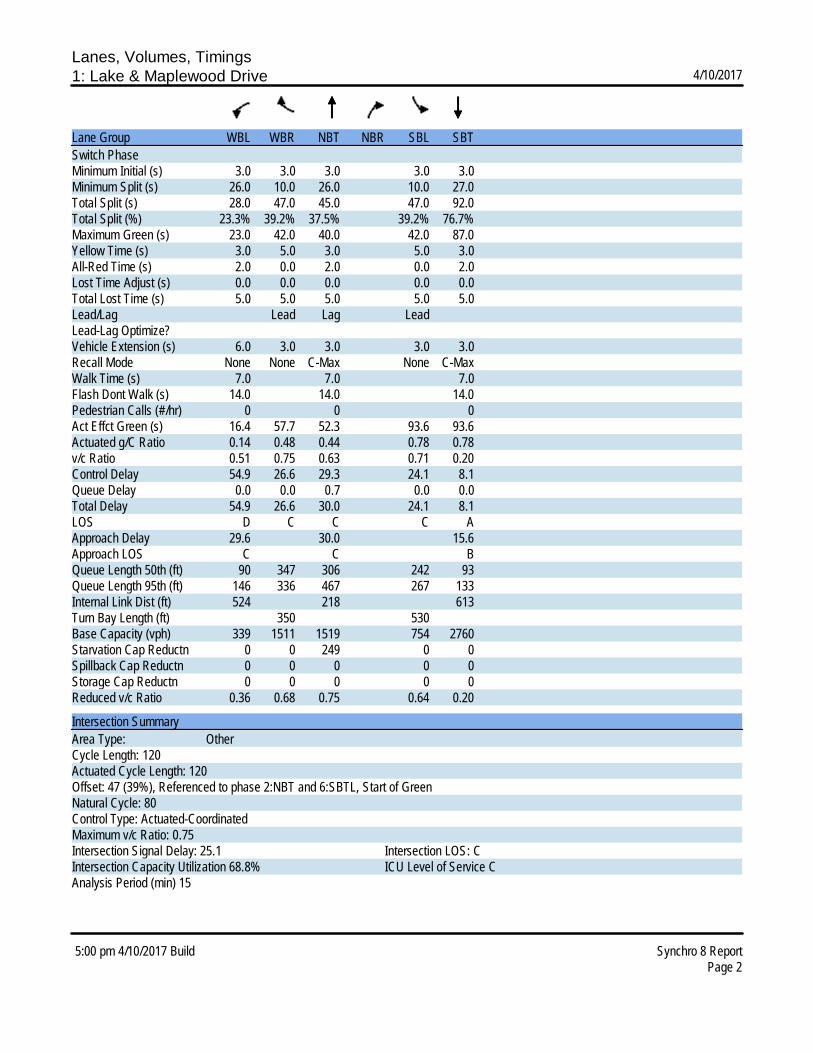
Lanes, Volumes, Timings1: Lake & Maplewood Drive 4/10/2017
5:00 pm 4/10/2017 Build Synchro 8 ReportPage 2
Lane Group WBL WBR NBT NBR SBL SBTSwitch PhaseMinimum Initial (s) 3.0 3.0 3.0 3.0 3.0Minimum Split (s) 26.0 10.0 26.0 10.0 27.0Total Split (s) 28.0 47.0 45.0 47.0 92.0Total Split (%) 23.3% 39.2% 37.5% 39.2% 76.7%Maximum Green (s) 23.0 42.0 40.0 42.0 87.0Yellow Time (s) 3.0 5.0 3.0 5.0 3.0All-Red Time (s) 2.0 0.0 2.0 0.0 2.0Lost Time Adjust (s) 0.0 0.0 0.0 0.0 0.0Total Lost Time (s) 5.0 5.0 5.0 5.0 5.0Lead/Lag Lead Lag LeadLead-Lag Optimize?Vehicle Extension (s) 6.0 3.0 3.0 3.0 3.0Recall Mode None None C-Max None C-MaxWalk Time (s) 7.0 7.0 7.0Flash Dont Walk (s) 14.0 14.0 14.0Pedestrian Calls (#/hr) 0 0 0Act Effct Green (s) 16.4 57.7 52.3 93.6 93.6Actuated g/C Ratio 0.14 0.48 0.44 0.78 0.78v/c Ratio 0.51 0.75 0.63 0.71 0.20Control Delay 54.9 26.6 29.3 24.1 8.1Queue Delay 0.0 0.0 0.7 0.0 0.0Total Delay 54.9 26.6 30.0 24.1 8.1LOS D C C C AApproach Delay 29.6 30.0 15.6Approach LOS C C BQueue Length 50th (ft) 90 347 306 242 93Queue Length 95th (ft) 146 336 467 267 133Internal Link Dist (ft) 524 218 613Turn Bay Length (ft) 350 530Base Capacity (vph) 339 1511 1519 754 2760Starvation Cap Reductn 0 0 249 0 0Spillback Cap Reductn 0 0 0 0 0Storage Cap Reductn 0 0 0 0 0Reduced v/c Ratio 0.36 0.68 0.75 0.64 0.20
Intersection SummaryArea Type: OtherCycle Length: 120Actuated Cycle Length: 120Offset: 47 (39%), Referenced to phase 2:NBT and 6:SBTL, Start of GreenNatural Cycle: 80Control Type: Actuated-CoordinatedMaximum v/c Ratio: 0.75Intersection Signal Delay: 25.1 Intersection LOS: CIntersection Capacity Utilization 68.8% ICU Level of Service CAnalysis Period (min) 15

Lanes, Volumes, Timings1: Lake & Maplewood Drive 4/10/2017
5:00 pm 4/10/2017 Build Synchro 8 ReportPage 3
Splits and Phases: 1: Lake & Maplewood Drive

Lanes, Volumes, Timings14: Dewey & Eastman 4/10/2017
5:00 pm 4/10/2017 Build Synchro 8 ReportPage 4
Lane Group EBL EBT EBR WBL WBT WBR NBL NBT NBR SBL SBT SBRLane ConfigurationsVolume (vph) 40 32 13 68 94 99 18 719 44 44 539 49Ideal Flow (vphpl) 1900 1900 1900 1900 1900 1900 1900 1900 1900 1900 1900 1900Lane Width (ft) 10 10 10 10 10 10 10 10 10 10 10 10Storage Length (ft) 280 0 0 0 50 0 230 0Storage Lanes 1 0 1 0 1 0 1 0Taper Length (ft) 25 25 25 25Lane Util. Factor 1.00 1.00 1.00 1.00 1.00 1.00 1.00 0.95 0.95 1.00 0.95 0.95Frt 0.958 0.923 0.991 0.988Flt Protected 0.950 0.950 0.950 0.950Satd. Flow (prot) 1652 1666 0 1652 1605 0 1652 3274 0 1652 3264 0Flt Permitted 0.592 0.724 0.404 0.310Satd. Flow (perm) 1029 1666 0 1259 1605 0 702 3274 0 539 3264 0Right Turn on Red Yes Yes Yes YesSatd. Flow (RTOR) 14 68 12 18Link Speed (mph) 30 30 30 30Link Distance (ft) 583 686 580 1020Travel Time (s) 13.3 15.6 13.2 23.2Peak Hour Factor 0.90 0.90 0.90 0.95 0.90 0.90 0.90 0.90 0.90 0.90 0.90 0.90Adj. Flow (vph) 44 36 14 72 104 110 20 799 49 49 599 54Shared Lane Traffic (%)Lane Group Flow (vph) 44 50 0 72 214 0 20 848 0 49 653 0Enter Blocked Intersection No No No No No No No No No No No NoLane Alignment Left Left Right Left Left Right Left Left Right Left Left RightMedian Width(ft) 10 10 10 10Link Offset(ft) 0 0 0 0Crosswalk Width(ft) 16 16 16 16Two way Left Turn LaneHeadway Factor 1.09 1.09 1.09 1.09 1.09 1.09 1.09 1.09 1.09 1.09 1.09 1.09Turning Speed (mph) 15 9 15 9 15 9 15 9Number of Detectors 1 1 2 2 1 1 1 1Detector Template Leading Detector (ft) 15 15 45 45 19 19 19 19Trailing Detector (ft) 0 0 -10 -10 19 19 19 19Detector 1 Position(ft) 0 0 -10 -10 19 19 19 19Detector 1 Size(ft) 15 15 6 6 0 0 0 0Detector 1 Type Cl+Ex Cl+Ex Cl+Ex Cl+Ex Cl+Ex Cl+Ex Cl+Ex Cl+ExDetector 1 ChannelDetector 1 Extend (s) 0.0 0.0 0.0 0.0 0.0 0.0 0.0 0.0Detector 1 Queue (s) 0.0 0.0 0.0 0.0 0.0 0.0 0.0 0.0Detector 1 Delay (s) 0.0 0.0 0.0 0.0 0.0 0.0 0.0 0.0Detector 2 Position(ft) 39 39Detector 2 Size(ft) 6 6Detector 2 Type Cl+Ex Cl+ExDetector 2 ChannelDetector 2 Extend (s) 0.0 0.0Turn Type Perm NA Perm NA Perm NA Perm NAProtected Phases 2 2 1 1Permitted Phases 2 2 1 1

Lanes, Volumes, Timings14: Dewey & Eastman 4/10/2017
5:00 pm 4/10/2017 Build Synchro 8 ReportPage 5
Lane Group EBL EBT EBR WBL WBT WBR NBL NBT NBR SBL SBT SBRDetector Phase 2 2 2 2 1 1 1 1Switch PhaseMinimum Initial (s) 6.0 6.0 6.0 6.0 23.0 23.0 23.0 23.0Minimum Split (s) 31.0 31.0 31.0 31.0 29.0 29.0 29.0 29.0Total Split (s) 31.0 31.0 31.0 31.0 29.0 29.0 29.0 29.0Total Split (%) 51.7% 51.7% 51.7% 51.7% 48.3% 48.3% 48.3% 48.3%Maximum Green (s) 25.5 25.5 25.5 25.5 23.0 23.0 23.0 23.0Yellow Time (s) 3.5 3.5 3.5 3.5 4.0 4.0 4.0 4.0All-Red Time (s) 2.0 2.0 2.0 2.0 2.0 2.0 2.0 2.0Lost Time Adjust (s) 0.0 0.0 0.0 0.0 0.0 0.0 0.0 0.0Total Lost Time (s) 5.5 5.5 5.5 5.5 6.0 6.0 6.0 6.0Lead/Lag Lag Lag Lag Lag Lead Lead Lead LeadLead-Lag Optimize?Vehicle Extension (s) 4.0 4.0 4.0 4.0 2.0 2.0 2.0 2.0Recall Mode None None None None C-Max C-Max C-Max C-MaxWalk Time (s) 7.0 7.0 7.0 7.0 7.0 7.0 7.0 7.0Flash Dont Walk (s) 18.0 18.0 18.0 18.0 16.0 16.0 16.0 16.0Pedestrian Calls (#/hr) 1 1 1 1 0 0 0 0Act Effct Green (s) 13.9 13.9 13.9 13.9 34.6 34.6 34.6 34.6Actuated g/C Ratio 0.23 0.23 0.23 0.23 0.58 0.58 0.58 0.58v/c Ratio 0.19 0.13 0.25 0.51 0.05 0.45 0.16 0.35Control Delay 17.3 14.5 18.2 16.1 5.0 5.3 12.6 11.0Queue Delay 0.0 0.0 0.0 0.0 0.0 0.0 0.0 0.0Total Delay 17.3 14.5 18.2 16.1 5.0 5.3 12.6 11.0LOS B B B B A A B BApproach Delay 15.8 16.6 5.3 11.1Approach LOS B B A BQueue Length 50th (ft) 26 22 22 47 2 34 11 92Queue Length 95th (ft) m7 m5 37 72 m5 m96 34 145Internal Link Dist (ft) 503 606 500 940Turn Bay Length (ft) 280 50 230Base Capacity (vph) 437 716 535 721 405 1895 311 1891Starvation Cap Reductn 0 0 0 0 0 0 0 0Spillback Cap Reductn 0 0 0 0 0 0 0 0Storage Cap Reductn 0 0 0 0 0 0 0 0Reduced v/c Ratio 0.10 0.07 0.13 0.30 0.05 0.45 0.16 0.35
Intersection SummaryArea Type: OtherCycle Length: 60Actuated Cycle Length: 60Offset: 28 (47%), Referenced to phase 1:NBSB, Start of GreenNatural Cycle: 60Control Type: Actuated-CoordinatedMaximum v/c Ratio: 0.51Intersection Signal Delay: 9.5 Intersection LOS: AIntersection Capacity Utilization 66.7% ICU Level of Service CAnalysis Period (min) 15m Volume for 95th percentile queue is metered by upstream signal.

Lanes, Volumes, Timings14: Dewey & Eastman 4/10/2017
5:00 pm 4/10/2017 Build Synchro 8 ReportPage 6
Splits and Phases: 14: Dewey & Eastman

Lanes, Volumes, Timings22: Lake & Merrill/Kodak 4/10/2017
5:00 pm 4/10/2017 Build Synchro 8 ReportPage 7
Lane Group EBL EBT EBR WBL WBT WBR NBL NBT NBR SBL SBT SBRLane ConfigurationsVolume (vph) 25 2 60 6 2 3 168 1429 0 0 620 12Ideal Flow (vphpl) 1900 1900 1900 1900 1900 1900 1900 1900 1900 1900 1900 1900Lane Width (ft) 12 12 12 12 12 12 11 11 12 12 11 11Storage Length (ft) 125 0 0 0 125 0 125 0Storage Lanes 1 0 0 0 1 0 1 0Taper Length (ft) 25 25 25 25Lane Util. Factor 1.00 1.00 1.00 1.00 1.00 1.00 1.00 0.95 0.95 1.00 0.95 0.95Frt 0.854 0.966 0.997Flt Protected 0.950 0.972 0.950Satd. Flow (prot) 1770 1591 0 0 1749 0 1711 3421 0 1863 3411 0Flt Permitted 0.750 0.781 0.350Satd. Flow (perm) 1397 1591 0 0 1405 0 630 3421 0 1863 3411 0Right Turn on Red Yes Yes Yes YesSatd. Flow (RTOR) 67 3 2Link Speed (mph) 30 30 35 35Link Distance (ft) 2670 307 1041 3113Travel Time (s) 60.7 7.0 20.3 60.6Peak Hour Factor 1.00 0.90 0.90 0.90 0.90 0.90 0.90 0.90 0.90 0.90 0.90 0.90Adj. Flow (vph) 25 2 67 7 2 3 187 1588 0 0 689 13Shared Lane Traffic (%)Lane Group Flow (vph) 25 69 0 0 12 0 187 1588 0 0 702 0Enter Blocked Intersection No No No No No No No No No No No NoLane Alignment Left Left Right Left Left Right Left Left Right Left Left RightMedian Width(ft) 12 12 12 12Link Offset(ft) 0 0 0 0Crosswalk Width(ft) 16 16 16 16Two way Left Turn LaneHeadway Factor 1.00 1.00 1.00 1.00 1.00 1.00 1.04 1.04 1.00 1.00 1.04 1.04Turning Speed (mph) 15 9 15 9 15 9 15 9Number of Detectors 1 1 1 1 1 1 1 1Detector Template Leading Detector (ft) 10 50 50 50 50 19 19 19Trailing Detector (ft) -10 0 0 0 0 19 19 19Detector 1 Position(ft) -10 0 0 0 0 19 19 19Detector 1 Size(ft) 20 50 50 50 50 0 0 0Detector 1 Type Cl+Ex Cl+Ex Cl+Ex Cl+Ex Cl+Ex Cl+Ex Cl+Ex Cl+ExDetector 1 ChannelDetector 1 Extend (s) 0.0 0.0 0.0 0.0 0.0 0.0 0.0 0.0Detector 1 Queue (s) 0.0 0.0 0.0 0.0 0.0 0.0 0.0 0.0Detector 1 Delay (s) 0.0 0.0 0.0 0.0 0.0 0.0 0.0 0.0Turn Type Perm NA Perm NA pm+pt NA Perm NAProtected Phases 2 2 3 1 3 1Permitted Phases 2 2 1 3 1Detector Phase 2 2 2 2 3 1 3 1 1Switch PhaseMinimum Initial (s) 6.0 6.0 6.0 6.0 6.0 21.0 21.0Minimum Split (s) 31.0 31.0 31.0 31.0 11.5 27.0 27.0Total Split (s) 32.0 32.0 32.0 32.0 15.0 73.0 73.0

Lanes, Volumes, Timings22: Lake & Merrill/Kodak 4/10/2017
5:00 pm 4/10/2017 Build Synchro 8 ReportPage 8
Lane Group EBL EBT EBR WBL WBT WBR NBL NBT NBR SBL SBT SBRTotal Split (%) 26.7% 26.7% 26.7% 26.7% 12.5% 60.8% 60.8%Maximum Green (s) 26.0 26.0 26.0 26.0 9.5 67.0 67.0Yellow Time (s) 3.5 3.5 3.5 3.5 3.5 4.0 4.0All-Red Time (s) 2.5 2.5 2.5 2.5 2.0 2.0 2.0Lost Time Adjust (s) 0.0 0.0 0.0 0.0 0.0 0.0Total Lost Time (s) 6.0 6.0 6.0 5.5 6.0 6.0Lead/Lag Lag Lag Lag Lag Lead LeadLead-Lag Optimize?Vehicle Extension (s) 2.0 2.0 2.0 2.0 3.0 2.0 2.0Recall Mode None None None None Min C-Max C-MaxWalk Time (s) 7.0 7.0 7.0 7.0 10.0 10.0Flash Dont Walk (s) 18.0 18.0 18.0 18.0 11.0 11.0Pedestrian Calls (#/hr) 0 0 0 0 0 0Act Effct Green (s) 7.2 7.2 7.2 98.2 104.4 73.1Actuated g/C Ratio 0.06 0.06 0.06 0.82 0.87 0.61v/c Ratio 0.30 0.44 0.14 0.25 0.53 0.34Control Delay 63.4 28.8 47.9 1.5 0.8 13.4Queue Delay 0.0 0.0 0.0 0.0 0.0 0.0Total Delay 63.4 28.8 47.9 1.5 0.8 13.4LOS E C D A A BApproach Delay 38.0 47.9 0.9 13.4Approach LOS D D A BQueue Length 50th (ft) 20 12 7 4 20 151Queue Length 95th (ft) m46 55 27 6 21 193Internal Link Dist (ft) 2590 227 961 3033Turn Bay Length (ft) 125 125Base Capacity (vph) 302 397 306 736 2976 2079Starvation Cap Reductn 0 0 0 0 0 0Spillback Cap Reductn 0 0 0 0 0 0Storage Cap Reductn 0 0 0 0 0 0Reduced v/c Ratio 0.08 0.17 0.04 0.25 0.53 0.34
Intersection SummaryArea Type: OtherCycle Length: 120Actuated Cycle Length: 120Offset: 8 (7%), Referenced to phase 1:NBSB, Start of GreenNatural Cycle: 70Control Type: Actuated-CoordinatedMaximum v/c Ratio: 0.53Intersection Signal Delay: 5.9 Intersection LOS: AIntersection Capacity Utilization 77.8% ICU Level of Service DAnalysis Period (min) 15m Volume for 95th percentile queue is metered by upstream signal.
Splits and Phases: 22: Lake & Merrill/Kodak

Lanes, Volumes, Timings23: Lake & Eastman 4/10/2017
5:00 pm 4/10/2017 Build Synchro 8 ReportPage 9
Lane Group EBL EBR NBL NBT SBT SBRLane ConfigurationsVolume (vph) 46 250 151 1579 679 19Ideal Flow (vphpl) 1900 1900 1900 1900 1900 1900Lane Width (ft) 10 10 11 11 11 11Storage Length (ft) 100 0 225 0Storage Lanes 1 1 1 0Taper Length (ft) 25 25Lane Util. Factor 1.00 1.00 1.00 0.95 0.95 0.95Frt 0.850 0.996Flt Protected 0.950 0.950Satd. Flow (prot) 1652 1478 1711 3421 3408 0Flt Permitted 0.950 0.322Satd. Flow (perm) 1652 1478 580 3421 3408 0Right Turn on Red Yes YesSatd. Flow (RTOR) 278 4Link Speed (mph) 30 35 35Link Distance (ft) 302 682 1041Travel Time (s) 6.9 13.3 20.3Peak Hour Factor 0.90 0.90 0.90 0.90 0.90 0.90Adj. Flow (vph) 51 278 168 1754 754 21Shared Lane Traffic (%)Lane Group Flow (vph) 51 278 168 1754 775 0Enter Blocked Intersection No No No No No NoLane Alignment Left Right Left Left Left RightMedian Width(ft) 10 11 11Link Offset(ft) 0 0 0Crosswalk Width(ft) 16 16 16Two way Left Turn LaneHeadway Factor 1.09 1.09 1.04 1.04 1.04 1.04Turning Speed (mph) 15 9 15 9Number of Detectors 1 1 1 1 1Detector Template Leading Detector (ft) 50 50 50 19 19Trailing Detector (ft) 0 0 0 19 19Detector 1 Position(ft) 0 0 0 19 19Detector 1 Size(ft) 50 50 50 0 0Detector 1 Type Cl+Ex Cl+Ex Cl+Ex Cl+Ex Cl+ExDetector 1 ChannelDetector 1 Extend (s) 0.0 0.0 0.0 0.0 0.0Detector 1 Queue (s) 0.0 0.0 0.0 0.0 0.0Detector 1 Delay (s) 0.0 0.0 0.0 0.0 0.0Turn Type Perm Perm pm+pt NA NAProtected Phases 5 2 6Permitted Phases 4 4 2Detector Phase 4 4 5 2 6Switch PhaseMinimum Initial (s) 6.0 6.0 4.0 8.0 8.0Minimum Split (s) 30.5 30.5 9.0 26.0 26.0Total Split (s) 32.0 32.0 15.0 88.0 73.0

Lanes, Volumes, Timings23: Lake & Eastman 4/10/2017
5:00 pm 4/10/2017 Build Synchro 8 ReportPage 10
Lane Group EBL EBR NBL NBT SBT SBRTotal Split (%) 26.7% 26.7% 12.5% 73.3% 60.8%Maximum Green (s) 25.5 25.5 10.0 82.0 67.0Yellow Time (s) 4.0 4.0 4.0 4.0 4.0All-Red Time (s) 2.5 2.5 1.0 2.0 2.0Lost Time Adjust (s) 0.0 0.0 0.0 0.0 0.0Total Lost Time (s) 6.5 6.5 5.0 6.0 6.0Lead/Lag Lead LagLead-Lag Optimize?Vehicle Extension (s) 3.0 3.0 2.0 2.0 2.0Recall Mode None None None C-Max C-MaxWalk Time (s) 7.0 7.0 8.0 8.0Flash Dont Walk (s) 17.0 17.0 12.0 12.0Pedestrian Calls (#/hr) 0 0 0 0Act Effct Green (s) 10.1 10.1 98.4 97.4 85.4Actuated g/C Ratio 0.08 0.08 0.82 0.81 0.71v/c Ratio 0.37 0.73 0.31 0.63 0.32Control Delay 57.9 17.9 3.1 4.6 7.0Queue Delay 0.0 0.0 0.0 0.4 0.0Total Delay 57.9 17.9 3.1 5.0 7.0LOS E B A A AApproach Delay 24.1 4.8 7.0Approach LOS C A AQueue Length 50th (ft) 38 0 11 90 99Queue Length 95th (ft) 75 82 27 393 143Internal Link Dist (ft) 222 602 961Turn Bay Length (ft) 100 225Base Capacity (vph) 351 533 569 2777 2427Starvation Cap Reductn 0 0 0 464 0Spillback Cap Reductn 0 0 0 0 0Storage Cap Reductn 0 0 0 0 0Reduced v/c Ratio 0.15 0.52 0.30 0.76 0.32
Intersection SummaryArea Type: OtherCycle Length: 120Actuated Cycle Length: 120Offset: 107 (89%), Referenced to phase 2:NBTL and 6:SBT, Start of GreenNatural Cycle: 80Control Type: Actuated-CoordinatedMaximum v/c Ratio: 0.73Intersection Signal Delay: 7.5 Intersection LOS: AIntersection Capacity Utilization 59.1% ICU Level of Service BAnalysis Period (min) 15
Splits and Phases: 23: Lake & Eastman


![Methods for the specification and verification of business ...didawiki.di.unipi.it/lib/exe/fetch.php/magistrale... · SAP R/3Workflow(SAP,[39]),Eastman(Eastman,[42]),andFLOWer(PallasAthena,](https://img.pdfslide.us/doc/110x75/61246c0979a98329dc17fdda/methods-for-the-specification-and-verification-of-business-sap-r3workiowsap39eastmaneastman42andflowerpallasathena.jpg)