Embed Size (px)
Citation preview
Project Number: MQP SJK - AAH4
EASTERN U.S. WINE AND YEAST STUDY
Kinetics and Composition
A Major Qualifying Project
Submitted to the Faculty of
WORCESTER POLYTECHNIC INSTITUTE
In partial fulfillments of the requirements for the
Chemical Engineering Bachelor of Science Degree
Sponsored by:
Zoll Cellars
110 Old Mill Rd
Shrewsbury, MA
Report Prepared By:
Justin Lagassey
_______________________________
Date: March 1, 2014
________________________________
Professor Stephen J. Kmiotek
Keywords:
1) Wine
2) Yeast
3) Flavor compounds
Eastern US Wine and Yeast Study Page 2
Abstract: Eastern US wine grapes vary considerably from old world styles and thus new methods must be
mastered to produce a new and distinct eastern style. Flavor active compounds produced by yeast
during fermentation leave a unique chemical signature and helps to determine the flavor and aromatic
profile in the finished wine. Identifying yeast strains that are compatible with these grapes is a challenge
to winemakers seeking to create commercially successful enterprises. This study developed methods for
evaluating commercially available strains of saccharomyces cerevisiae in representative grape varietals
grown in Eastern US vineyards. Gas chromatography, acid chemistry as well as dynamic mass balance
were used as analytical chemistry techniques to support the subjective sensory descriptions taken of
each wine. This research was sponsored by Zoll Cellars of Shrewsbury Massachusetts.
Acknowledgments I would like to thank first and foremost Frank Zoll for teaching me as a winemaker and dedicating his life
to the pursuit of a passion. I walk the path I am on today because of the mentorship and inspiration you
have inspired.
Professor Kmiotek, my advisor and academic steward, always ready at a moment’s notice to brainstorm
or hear an impromptu progress report. In having the confidence to allow me an independence in
pursuing tangential projects and ideas, which is a freedom I am sure led to the most interesting results.
Professor Timko for generously sharing his lab and equipment with this project and cooperating in the
most helpful way possible, literally putting my research first (1st run on the GC ever was a wine sample).
He was always helpful in the best ways with ideas, critical evaluation and offering his experience to me
every time it was needed. Alex Maag was also an invaluable asset in training me to use the GC/MS.
Professor Clark for his patience in sharing a lab with me. Brendon McKeogh for keeping me awake in my
final hours and generously offering his palate to the project.
Sarah Bronson, for teaching me an appreciation for wine and healthy alcohol consumption and funding
this research with tuition, time and patience beyond limit. Thanks Mom!
Eastern US Wine and Yeast Study Page 3
Contents Abstract: ........................................................................................................................................................ 2
Acknowledgments ......................................................................................................................................... 2
Section I ......................................................................................................................................................... 7
1. Purpose ................................................................................................................................................. 7
2. Background ........................................................................................................................................... 7
2.1 Process ................................................................................................................................................ 7
Botanical ............................................................................................................................................... 8
Microbial ............................................................................................................................................... 8
Physical.................................................................................................................................................. 8
Chemical ................................................................................................................................................ 8
2.2 Historical Knowledge .......................................................................................................................... 8
Noah’s Vine; The Origin Story of Wine ................................................................................................. 9
Ancient Process ..................................................................................................................................... 9
2.3 Modern Science Meets Enology ......................................................................................................... 9
Commercially Available Yeast ............................................................................................................. 10
Gas chromatography ........................................................................................................................... 10
2.4 Eastern Frontier ................................................................................................................................ 10
Local Demand ...................................................................................................................................... 10
Recent National Economic Trends ...................................................................................................... 11
3. Introduction ........................................................................................................................................ 11
3.1 Project Sponsor ................................................................................................................................. 11
3.2 Existing Wine Products ..................................................................................................................... 11
4. Areas of Interest.................................................................................................................................. 11
4.1 Research Process Variables ............................................................................................................... 11
4.2 Scalable Process Development ......................................................................................................... 12
4.3 Yeast Selection .................................................................................................................................. 12
5. Engineering Study Proposal ................................................................................................................ 12
5.1 Research ............................................................................................................................................ 12
5.2 Scale .................................................................................................................................................. 12
5.3 Yeast Selection .................................................................................................................................. 12
Section II ...................................................................................................................................................... 13
7. Engineering Objectives ....................................................................................................................... 13
Eastern US Wine and Yeast Study Page 4
7.1 Research ............................................................................................................................................ 13
7.2 Scalability .......................................................................................................................................... 13
7.3 Yeast .................................................................................................................................................. 13
8. Rationale ............................................................................................................................................. 14
8.1 Research ............................................................................................................................................ 14
8.2 Scalability .......................................................................................................................................... 14
8.3 Yeast .................................................................................................................................................. 14
9. State of the Art .................................................................................................................................... 14
9.1 Lab Bench Methods .......................................................................................................................... 14
9.2 Scaling Research ................................................................................................................................ 14
9.3 Yeast selection studies ...................................................................................................................... 15
10. Approach ......................................................................................................................................... 15
11. Methods .......................................................................................................................................... 15
11.1 Micro Fermentation ........................................................................................................................ 15
Method development ......................................................................................................................... 15
Wine Micro Fermentation .................................................................................................................. 16
Culture media ...................................................................................................................................... 17
Cider Studies ....................................................................................................................................... 18
11.2 Analytical Chemistry ....................................................................................................................... 19
Vintner’s Standard Tests ..................................................................................................................... 19
Gas Chromatography .......................................................................................................................... 20
11.3 Sensory Descriptions ....................................................................................................................... 21
12. Results ............................................................................................................................................. 21
Analytic Chemistry .................................................................................................................................. 21
Mass Balance .......................................................................................................................................... 22
Gas Chromatography .............................................................................................................................. 23
Cider chromatography runs .................................................................................................................... 26
Sensory Descriptors ................................................................................................................................ 28
13. Conclusions ..................................................................................................................................... 31
10.1 Research Method ............................................................................................................................ 31
10.2 Scalability ........................................................................................................................................ 31
10.3 Yeast selection ................................................................................................................................ 31
Section III ..................................................................................................................................................... 32
Eastern US Wine and Yeast Study Page 5
14. Recommendations .......................................................................................................................... 32
14.1 Beverage Engineering Lab Proposal ................................................................................................ 32
14.2 Project Topics .................................................................................................................................. 33
Gas Chromatography and Analytic Chemistry .................................................................................... 33
High Performance Liquid Chromatography ........................................................................................ 33
Micro Process Wine ............................................................................................................................ 33
Process Engineering Cider ................................................................................................................... 33
Sensory and Analytical Testing Survey ................................................................................................ 33
Home Brewing Design ......................................................................................................................... 33
12. Works Cited ........................................................................................................................................... 34
Eastern US Wine and Yeast Study Page 6
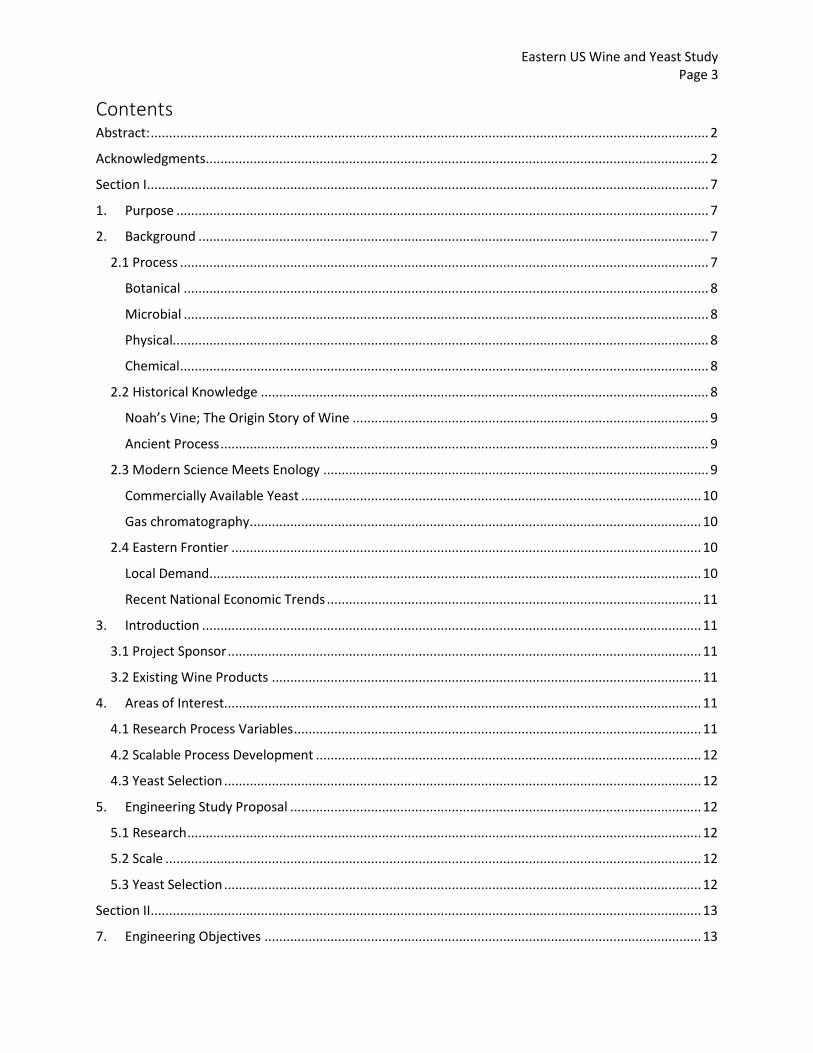
Table of Figures Figure 1: Process flow chart for the four major stages of wine production. Images: Frank Zoll (Zoll 2014) 7
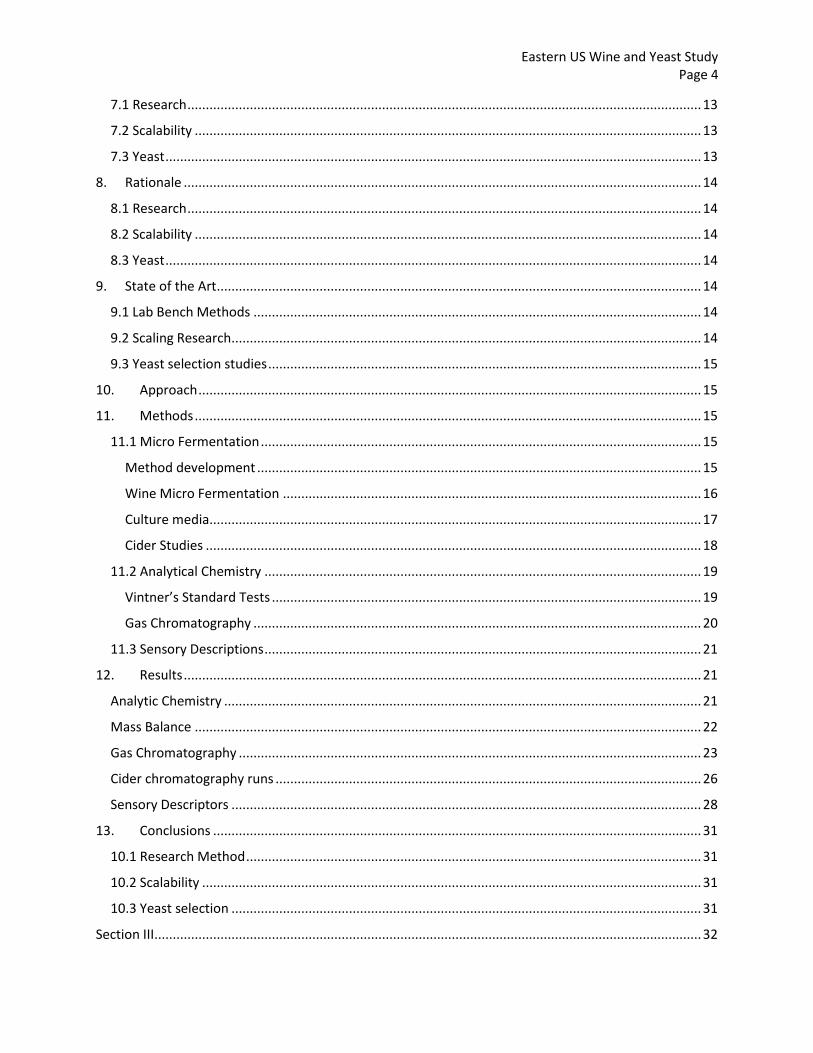
Figure 2: Oldest known winery site. Pictured is the press and a basin hypothesized to hold the wine
during fermentation. Photo credit: Gregory Areshian (Barnard, et al. 2011) ................................. 9
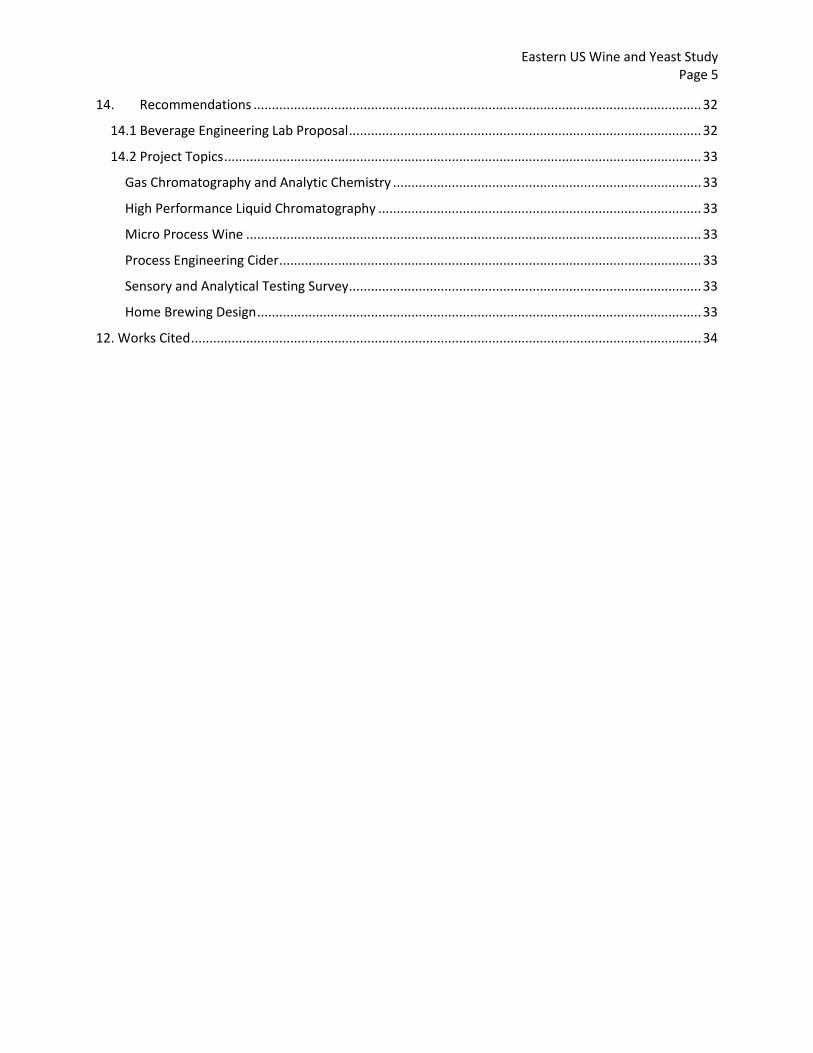
Figure 3: Diagram describing basic components present in all gas chromatography systems. Image credit:
(rune.welsh 2005) .......................................................................................................................... 10
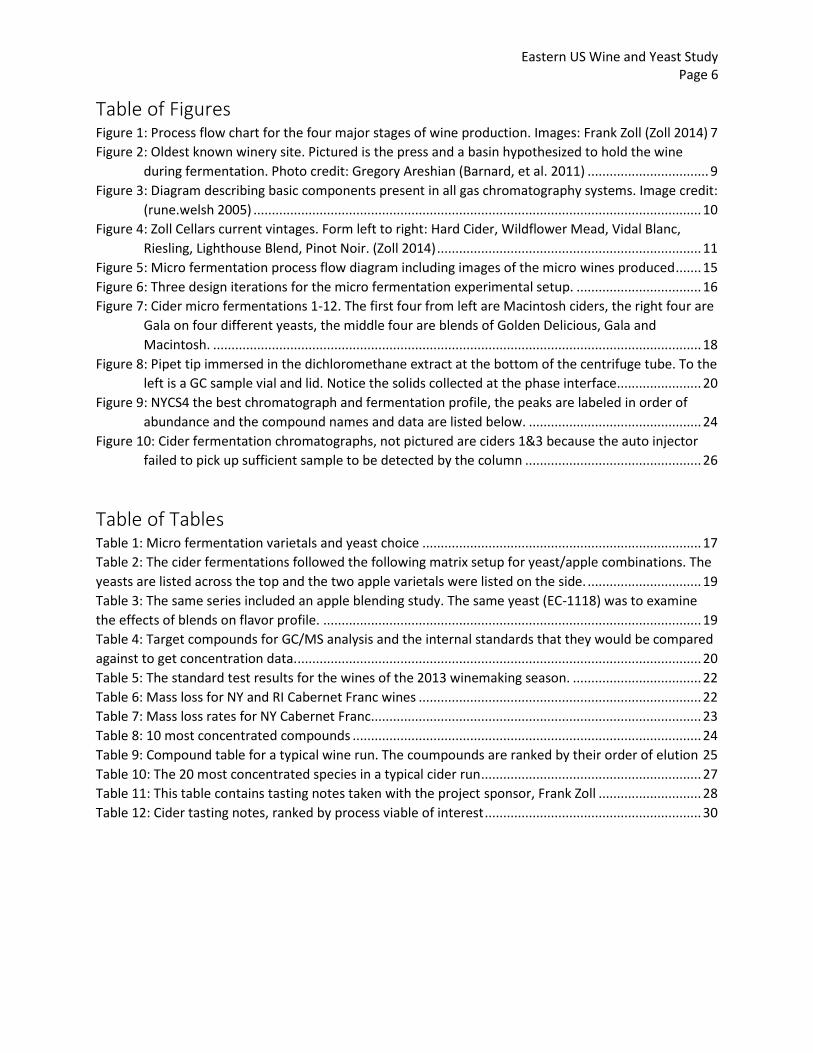
Figure 4: Zoll Cellars current vintages. Form left to right: Hard Cider, Wildflower Mead, Vidal Blanc,
Riesling, Lighthouse Blend, Pinot Noir. (Zoll 2014) ........................................................................ 11
Figure 5: Micro fermentation process flow diagram including images of the micro wines produced ....... 15
Figure 6: Three design iterations for the micro fermentation experimental setup. .................................. 16
Figure 7: Cider micro fermentations 1-12. The first four from left are Macintosh ciders, the right four are
Gala on four different yeasts, the middle four are blends of Golden Delicious, Gala and
Macintosh. ..................................................................................................................................... 18
Figure 8: Pipet tip immersed in the dichloromethane extract at the bottom of the centrifuge tube. To the
left is a GC sample vial and lid. Notice the solids collected at the phase interface ....................... 20
Figure 9: NYCS4 the best chromatograph and fermentation profile, the peaks are labeled in order of
abundance and the compound names and data are listed below. ............................................... 24
Figure 10: Cider fermentation chromatographs, not pictured are ciders 1&3 because the auto injector
failed to pick up sufficient sample to be detected by the column ................................................ 26
Table of Tables Table 1: Micro fermentation varietals and yeast choice ............................................................................ 17
Table 2: The cider fermentations followed the following matrix setup for yeast/apple combinations. The
yeasts are listed across the top and the two apple varietals were listed on the side. ............................... 19
Table 3: The same series included an apple blending study. The same yeast (EC-1118) was to examine
the effects of blends on flavor profile. ....................................................................................................... 19
Table 4: Target compounds for GC/MS analysis and the internal standards that they would be compared
against to get concentration data. .............................................................................................................. 20
Table 5: The standard test results for the wines of the 2013 winemaking season. ................................... 22
Table 6: Mass loss for NY and RI Cabernet Franc wines ............................................................................. 22
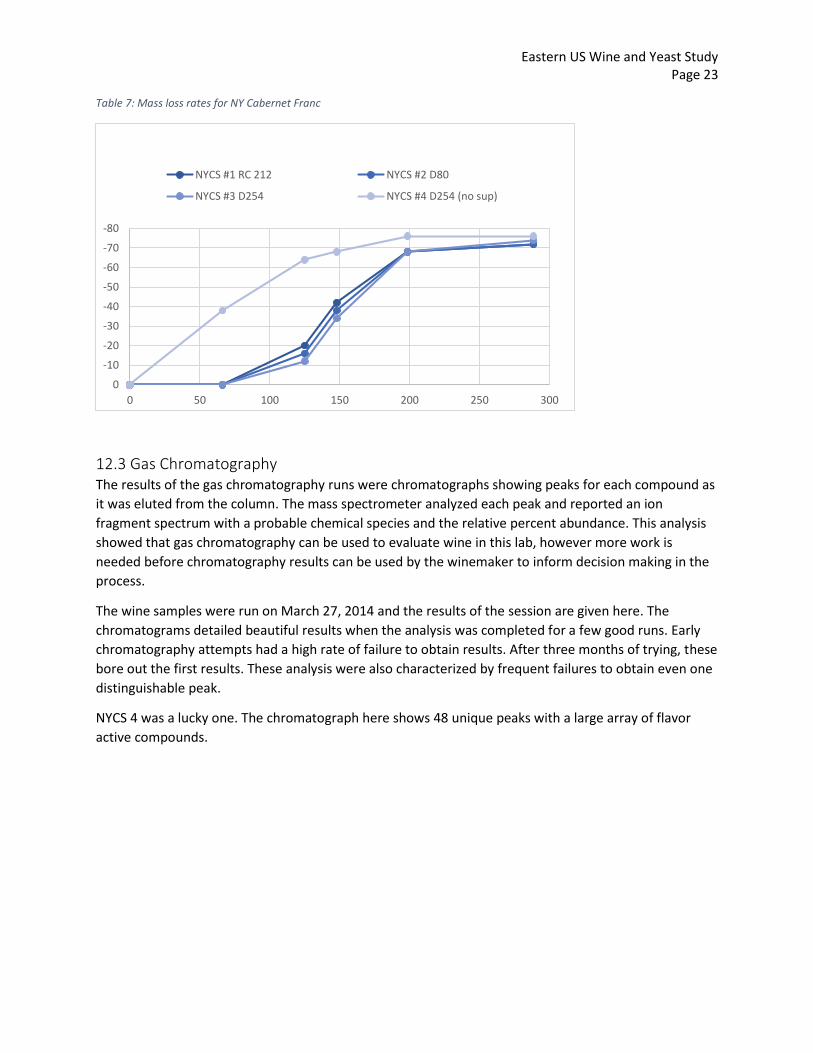
Table 7: Mass loss rates for NY Cabernet Franc.......................................................................................... 23
Table 8: 10 most concentrated compounds ............................................................................................... 24
Table 9: Compound table for a typical wine run. The coumpounds are ranked by their order of elution 25
Table 10: The 20 most concentrated species in a typical cider run ............................................................ 27
Table 11: This table contains tasting notes taken with the project sponsor, Frank Zoll ............................ 28
Table 12: Cider tasting notes, ranked by process viable of interest ........................................................... 30
Eastern US Wine and Yeast Study Page 7
Section I Wine is sunlight, held together by water
-Galileo
1. Purpose Wine is fun. Wine is to be closer to friends. Wine is a bonding element which serves to hold the fabric of
community a little tighter. That is why it’s worth making it better with engineering.
The purpose of this project is to learn how to produce better wines. This knowledge will be shared
among three principal groups; 1) Zoll Cellars, the sponsor of the project 2) the principal investigator,
namely myself and my palate, and 3) WPI’s wine project groups in the near and far future.
2. Background A primer on the winemaking process, history and science is provided in Section I for context.
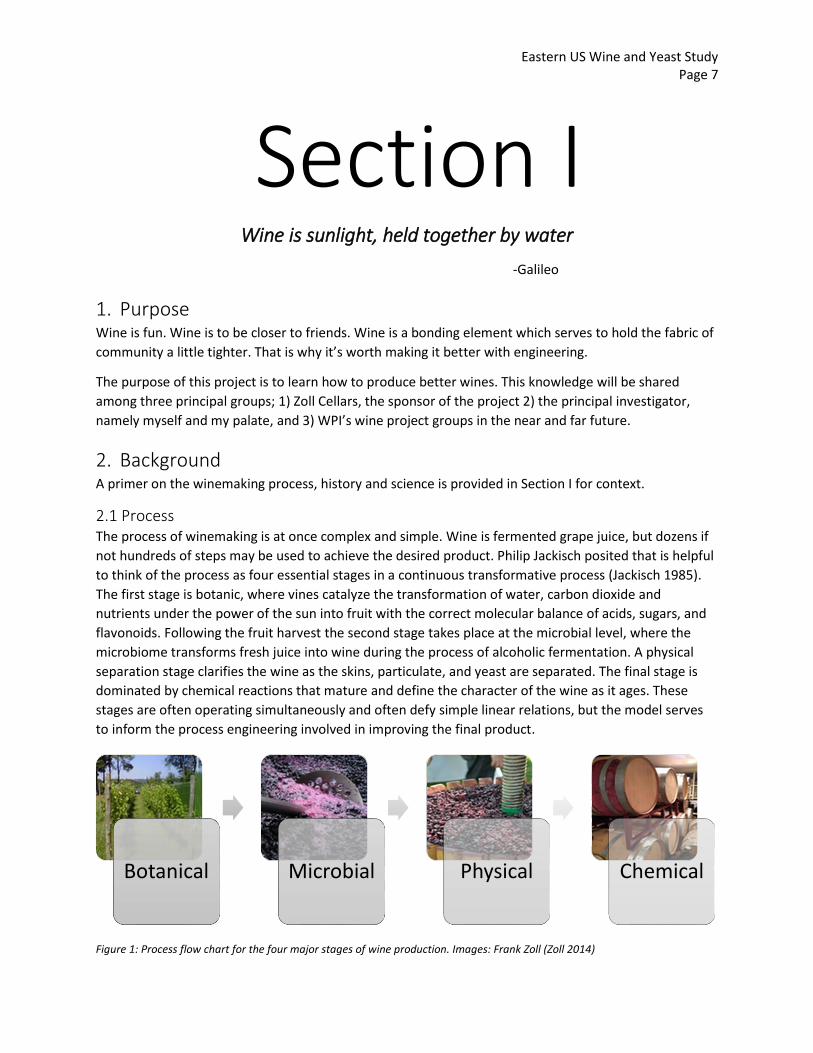
2.1 Process The process of winemaking is at once complex and simple. Wine is fermented grape juice, but dozens if
not hundreds of steps may be used to achieve the desired product. Philip Jackisch posited that is helpful
to think of the process as four essential stages in a continuous transformative process (Jackisch 1985).
The first stage is botanic, where vines catalyze the transformation of water, carbon dioxide and
nutrients under the power of the sun into fruit with the correct molecular balance of acids, sugars, and
flavonoids. Following the fruit harvest the second stage takes place at the microbial level, where the
microbiome transforms fresh juice into wine during the process of alcoholic fermentation. A physical
separation stage clarifies the wine as the skins, particulate, and yeast are separated. The final stage is
dominated by chemical reactions that mature and define the character of the wine as it ages. These
stages are often operating simultaneously and often defy simple linear relations, but the model serves
to inform the process engineering involved in improving the final product.
Figure 1: Process flow chart for the four major stages of wine production. Images: Frank Zoll (Zoll 2014)
Botanical Microbial Physical Chemical
Eastern US Wine and Yeast Study Page 8
Botanical It accepted almost universally that great wine is not made in a day. The process starts in planting a
vineyard of the right varietal in a hospitable climate with good soil (Phillips 2003). Add to the initial site
selection a trestle, a pruning regime, irrigation, nutrients, elbow grease, plenty of love, a touch of luck
and perhaps three to five years before vines yield serviceable fruit (Improved Grape and Wine Quality,
2013). An axiom of engineering is that mistakes compound over time, and this especially applies to
viniviticulture. Wines can only be as good as the fruit that are used to produce it, and it is important that
the winemaker is able to work with the vineyard manager to fully express the vision of the wine in the
raw ingredients.
Microbial Once the fruit is harvested from the vineyard and brought to the winery the process enters the
vinification phase. Strains of Saccharomyces Cerevisiae are the yeast most commonly utilized by
winemakers, but the results of fermentation are a complex interaction between yeast, bacteria and
other microbial species that may be present (Fleet 2003). Yeasts and other microbes metabolize the
compounds in the grape must, producing not just ethyl alcohol and carbon dioxide, but many of the
flavor compounds found in wine as well (Nykänen 1985), (Fuselsang & Edwards 2007). The results of
these metabolic reactions can add a tremendous array of chemical compounds including higher
alcohols, ethyl esters, acetate esters, phenols, volatile fatty acids, sulfides, monoterpenes, and thiols
(Cordente, et al. 2012). All of this adds complexity and character to the wine, further differentiating it
from the simple juice of grapes.
Physical The physical separation processes start with removing the stems and leaves from the berries to reduce
vegetal flavors in the finished wine (Phillips 2003). Crushing the berries to release the juice and bring the
pulp into contact with the microbiome is another important physical step. The press is where juice and
skins are separated. This may be done before fermentation to achieve a white wine or after
fermentation with dark skinned grapes to get a red wine (Sacchi, Bisson & Adams 2005). The final
separations serve to clarify the wine as particulates drop out by gravity or during filtration (Jackisch
1985).
Chemical Wines are typically aged between 6 months and 10 years before bottling to allow undesirable flavors to
dissipate (Tao 2014). During this period the winemaker may make minor adjustments to the wine by
acidifying/deacidifying, micro oxygenating, or adding sulfite to achieve a final balanced product. Once
the wine is bottled it continues to age and the slower kinetics take over.
2.2 Historical Knowledge Although the wine process has not fundamentally changed since humans discovered wine, the
techniques and methods have seen many improvements over the centuries. This has served to increase
quality, reproducibility and affordability, all to the benefit of the consumer. Wine making is likely the
oldest chemical process, with direct evidence of wine stored in pottery sealed with resins dating to
5,000 BCE (McGovern 1998). Knowledge of the processes necessary to turn soil, sunlight and water into
delicious nectar has passed from master to pupil in family tradition, regional styles, government
regulation and academic study. Not that the wine world is static; each year is a new canvas and
winemakers must adapt to variable consumer preferences, weather and fruit harvests just to stay
Eastern US Wine and Yeast Study Page 9
relevant. The challenge is thus to take everything the past has taught and combine it with a creative
vision of the future to make something worth doing in the present.
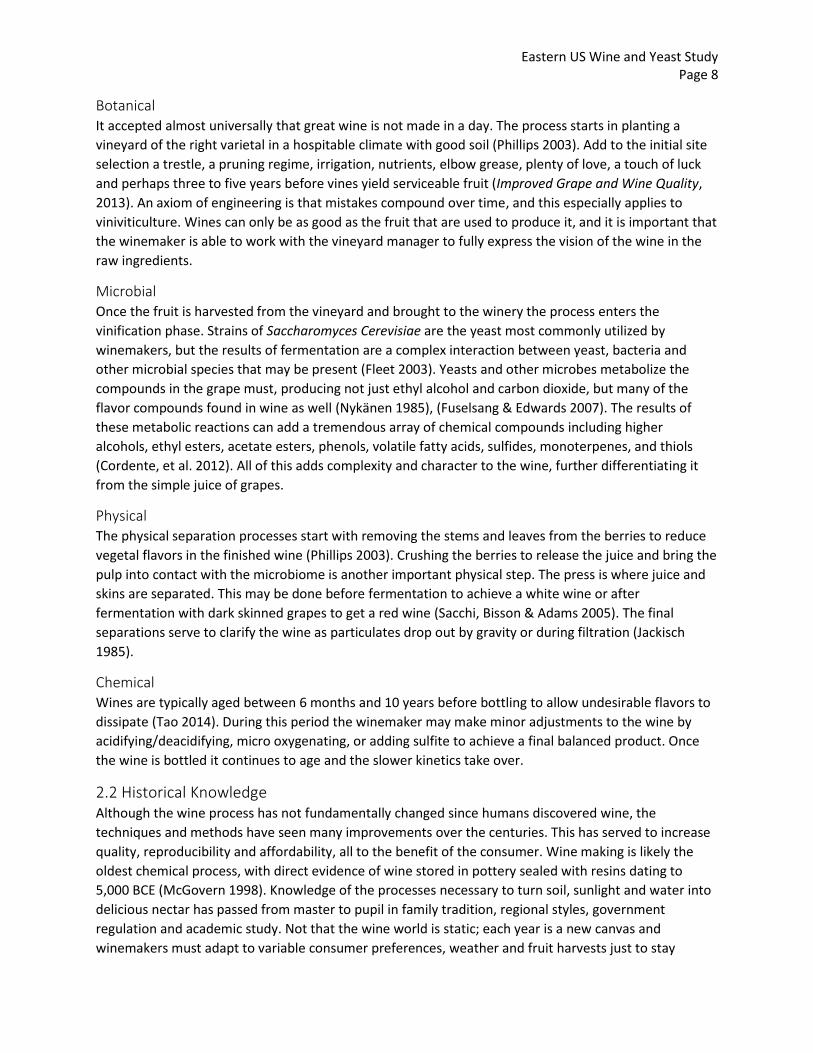
Noah’s Vine; The Origin Story of Wine The importance of wine in ancient culture is such that the when ancient Jewish scholars were writing
the biblical story of Noah they claimed the first thing he did upon landing the arc was to plant a vineyard
(McGovern 2013). Anthropologists believe that Transcaucasia, an area today comprised of Armenia,
Georgia and Azerbaijian, was the birthplace of wine culture and where humanity first domesticated the
grape vine. There is direct evidence of winery dating to 4,000 BCE discovered in Armenia (Barnard, et al.
2011). These techniques then traveled south to the Middle East and Egypt, throughout the Greek
peninsula and eventually to every corner of the Roman Empire (McGovern 2013).
Ancient Process In ancient history the winemaking process was rather crude. Grapes were crushed by stomping on them
to release the fermentable juice. The must was then pressed by spreading on limestone basins with
channels allowing the free run juice to flow into containers. Fermentation was left to naturally occurring
yeast present on the skins of the grapes. The finished wine was then stored in earthen pots sealed with
olive oil and resins (McGovern 1998). These limited processes did not allow ancient winemakers much
control in the process because they were unable to control the microbiome or introduce their own yeast
cultures.
2.3 Modern Science Meets Enology Winemakers today have access to specialized equipment for all aspects of winemaking, including
crushers, several styles of wine presses, stainless fermentation tanks, aging barrels, purpose built
filtration systems and high speed bottling lines (Phillips 2003). These systems and the process
Figure 2: Oldest known winery site. Pictured is the press and a basin hypothesized to hold the wine during fermentation. Photo credit: Gregory Areshian (Barnard, et al. 2011)
Eastern US Wine and Yeast Study Page 10
engineering to link each step in the process significantly reduces the time and labor required to produce
wines while greatly increasing the quality and availability.
Commercially Available Yeast Historically natural yeast present on the grape skins at harvest were the only microbes available to
induce alcoholic fermentation and thus winemakers had very little control over the process (McGovern
2013). Eventually winemakers discovered that yeast could be introduced by addition of must from
previous fermentation or the yeast could be isolated and grown from single colony cultures at the
winery. Difficultly in starting and growing yeast starter cultures led to the development of commercially
available dry yeast in 1963 (Fugelsang 2007). This development has greatly increased the choices
available to the winemaker in inoculating must with a specific strain to reach a targeted style and flavor
profile (Romano, et al. 1998). During fermentation yeast produce a wide array of flavor active
compounds that can affect the taste and aroma of the wine (Nykänen 1985). While this fact was
discovered 30 years ago, yeast are now credited with production of a far greater array of compounds
than originally believed (Cordente 2012). Targeting specific flavor profiles for individual wines by using
yeasts specific to that effort has thus become an important choice for the winemaker in crafting their
wine (Romano 2003).
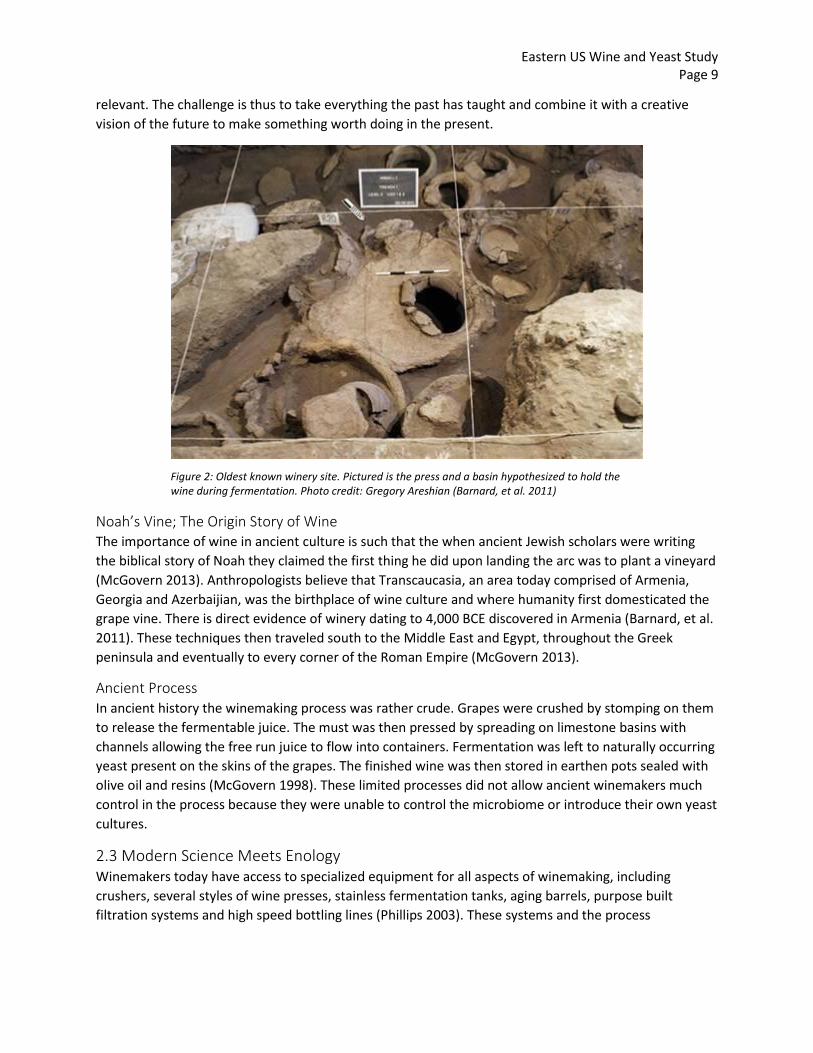
Gas chromatography With the invention of gas chromatography in the 1950’s a new analytical tool was added to enologist’s
arsenal (Kaiser 1963). Since then procedures for analyzing wine by GC have been well documented by
several groups (Skoog 1998). Typically an extraction is performed to move the analyte into an organic
solvent prior to injection into the column due to concerns regarding water contaminating the column or
associated detectors. One group has developed a method to directly inject wine into their column
without an extraction step (Villen 1995).
2.4 Eastern Frontier
Local Demand The demand for local artisanal products has been strong enough to support a growing Eastern wine
market (Bettini, 2013). Although Massachusetts ranks 24th in the nation for wine production by volume,
there is a growing number of craft wineries and high quality producers (2013 Statistical Report – Wine).
The Southeastern New England AVA is home to 23 wineries (American Winery Guide 2014). This
geographic area is located at the same latitude as some of the world’s best wine regions and enjoys a
moderating oceanic effect (AVA §9.72 2013).
Figure 3: Diagram describing basic components present in all gas chromatography systems. Image credit: (rune.welsh 2005)
Eastern US Wine and Yeast Study Page 11
Recent National Economic Trends Production and consumption trends have increasingly flavored United States wine producers as
European vineyard surface area fell by 13% from 2000 to 2011, while United States vineyard surface
area grew by a modest 2% (Bettini 2013). This trend coincides with an increase in consumption by the
US wine market by 34% over the same (OIV Statistical Report 2012). This combined with the US
Supreme Court Granholm decision increasing interstate competition in the wine market has led to a
“perfect storm” where producers are increasingly driven to produce better quality wines at an
accessible price point (Hinman, 2005). This makes winemaking a particularly promising professional field
for young engineering students.
3. Introduction
3.1 Project Sponsor Zoll Cellars is a winery located in Shrewsbury, MA owned and operated by Frank Zoll since 2008. Zoll
Cellars is a micro-winery with production at approximately 600 cases of high to premium quality of wine
per year. Wines are sold at local wine boutiques and restaurants, such as the Wine Vine on West Street
and the Sole Proprietor on Highland St in Worcester, Massachusetts. Frank and Justin also sell the wine
at about a dozen farmer’s markets every week across the state during the sales season. The wine can
also be purchased directly through the website, zollwine.com.
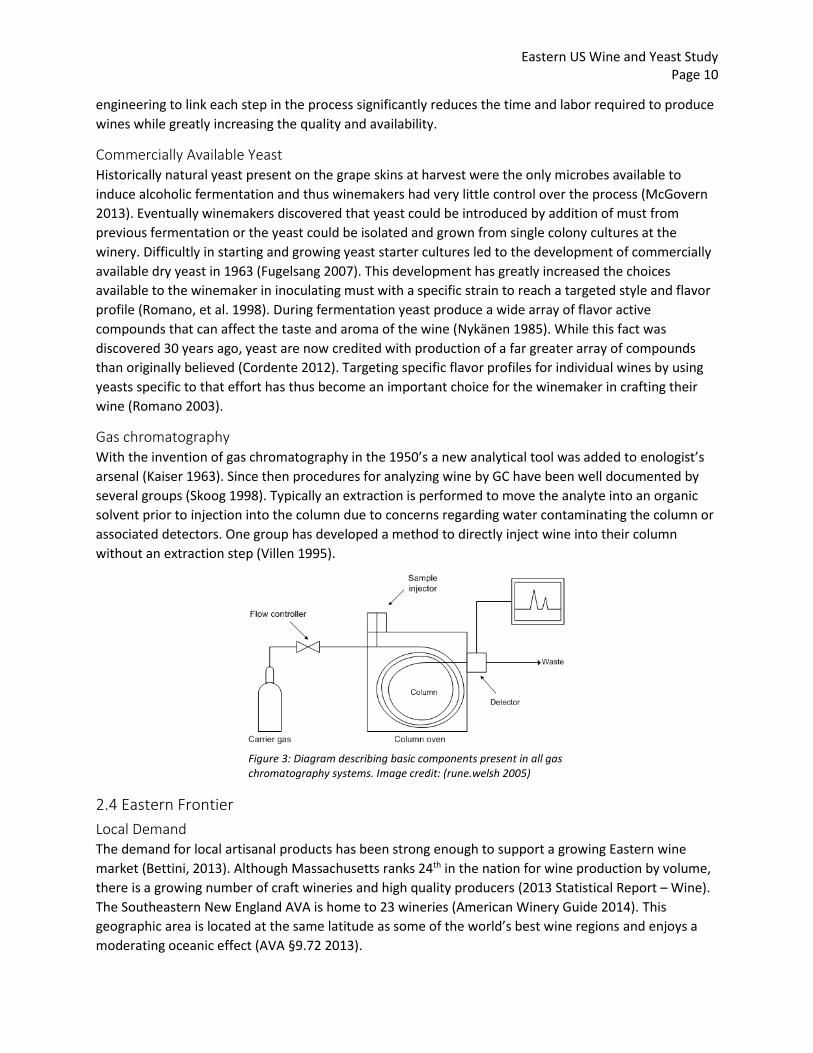
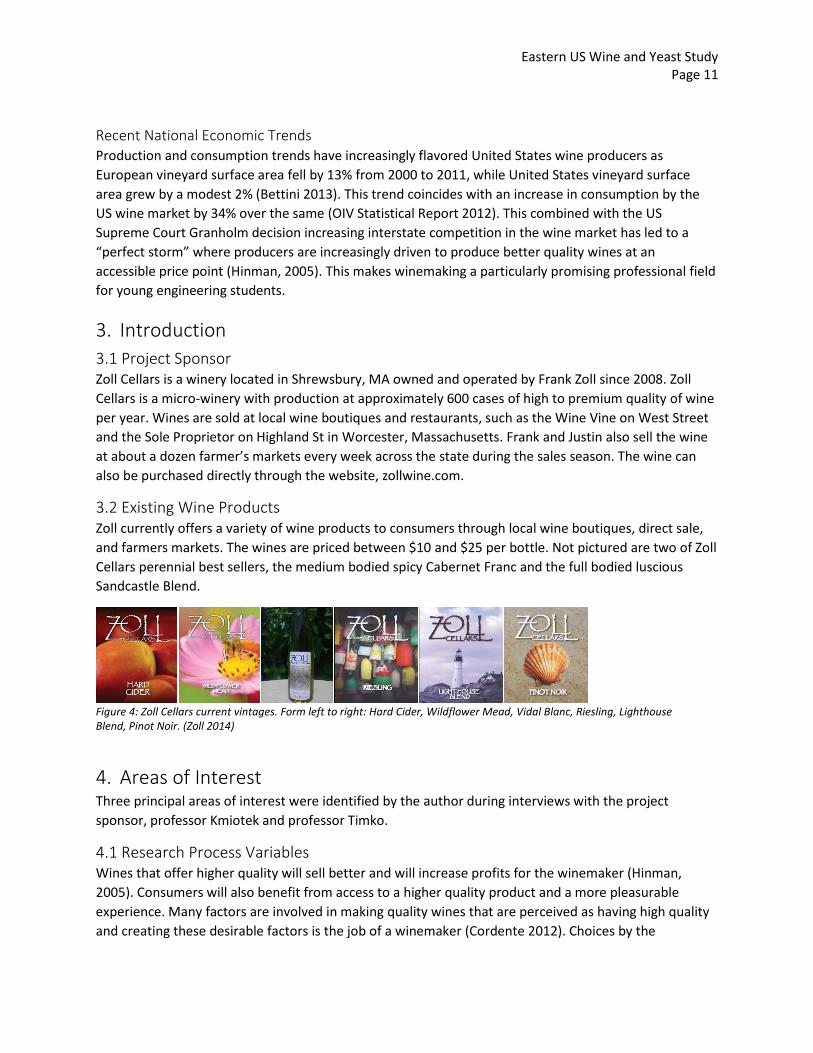
3.2 Existing Wine Products Zoll currently offers a variety of wine products to consumers through local wine boutiques, direct sale,
and farmers markets. The wines are priced between $10 and $25 per bottle. Not pictured are two of Zoll
Cellars perennial best sellers, the medium bodied spicy Cabernet Franc and the full bodied luscious
Sandcastle Blend.
4. Areas of Interest Three principal areas of interest were identified by the author during interviews with the project
sponsor, professor Kmiotek and professor Timko.
4.1 Research Process Variables Wines that offer higher quality will sell better and will increase profits for the winemaker (Hinman,
2005). Consumers will also benefit from access to a higher quality product and a more pleasurable
experience. Many factors are involved in making quality wines that are perceived as having high quality
and creating these desirable factors is the job of a winemaker (Cordente 2012). Choices by the
Figure 4: Zoll Cellars current vintages. Form left to right: Hard Cider, Wildflower Mead, Vidal Blanc, Riesling, Lighthouse Blend, Pinot Noir. (Zoll 2014)
Eastern US Wine and Yeast Study Page 12
winemaker can include yeast selection, added supplements, grape skin contact time, oak aging, sulfite
addition, filtration and a host of additional techniques. By using scientific and engineering principals to
identify the methods, materials, and processes to craft better wines, the product can be optimized to
meet consumer needs.
4.2 Scalable Process Development Developing new wine styles can be an expensive proposition for a commercial winery. Uncertainty in
process variables in addition to market instability can inhibit the introduction of new products. However
as markets shift the winery must be able to capitalize on emerging trends and introduce new products
to the market (Hinman 2005). The number of new recipes or methods that can be evaluated is limited
by the volume of grapes from the harvest that can be spared and time required to prepare and evaluate
research projects. Creating a research and development program to identify new winemaking
techniques at a minimum capital cost wit quick turnaround and a small fruit investment will greatly
benefit the winemaker in making informed choices for each vintage.
4.3 Yeast Selection Wine yeasts have been studied extensively with grapes from other wine regions and have been
characterized well. However Eastern US grapes vary considerably from those produced in other regions
in tartaric acid content and several other factors, thus the characteristics of fermentation and finish
quality will also be affected (Rodriguez-Nogales, Fernandez, & Vila-Crespo 2009). Studying these effects
on yeast performance can give winemakers a better sense of which yeasts will produce favorable
characteristics in their wines.
5. Engineering Study Proposal The conclusion of Section I is a one-to-one proposal to Engineering objectives in Section II.
5.1 Research This will be an engineering study of the process variables of interest to Zoll Cellars.
5.2 Scale Develop a sustainable winemaking research program to evaluate scalable processes.
5.3 Yeast Selection Yeast selection in winemaking is a principal interest of the engineering study.
Eastern US Wine and Yeast Study Page 13
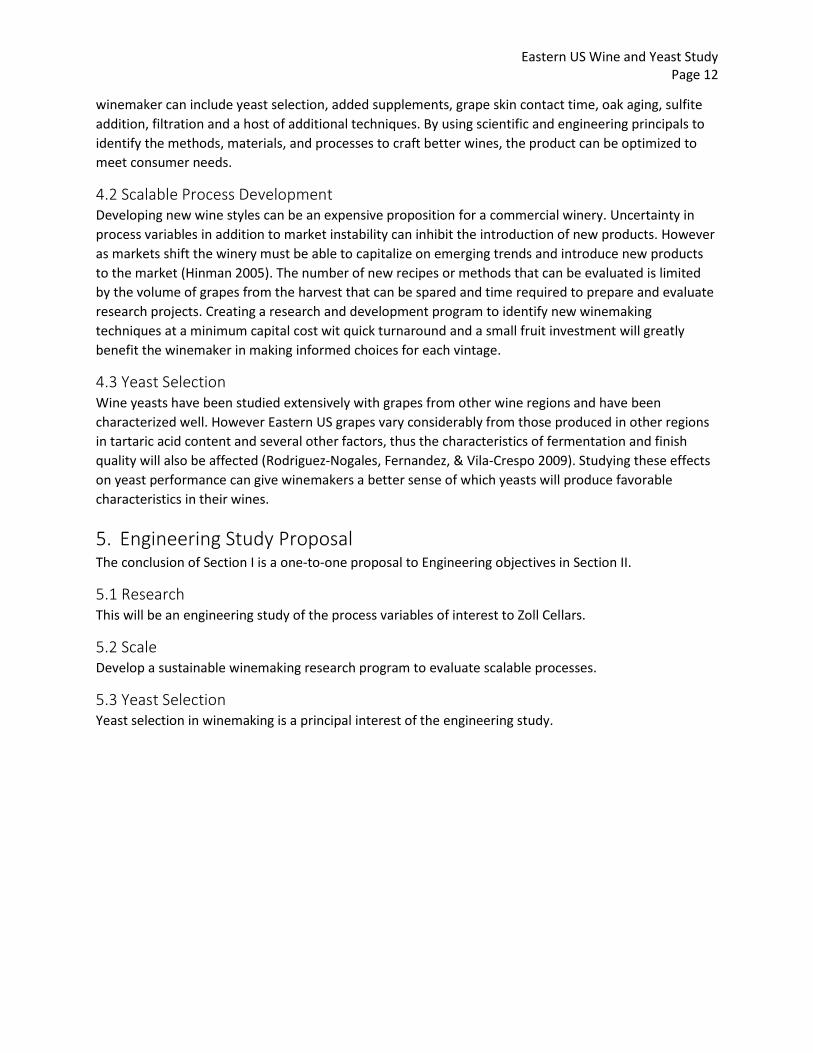
Section II
7. Engineering Objectives
7.1 Research Develop methods for testing process variables
7.2 Scalability Evaluate scalability of research methods to commercial processes
7.3 Yeast Study yeasts strain as a process variable in winemaking process
Eastern US Wine and Yeast Study Page 14
8. Rationale 8.1 Research
This engineering study is valuable because it offers a high information to cost ratio when evaluating
wine making process variables. The number of process variable that are possible to evaluate effectively
per liter of invested wine is a measure of information. The median price per bottle of Zoll Cellars wine is
$15 (Zoll 2014). Maximizing the return in information from invested research wine is the soft metric for
success for the research program.
8.2 Scalability Better wine products that can be produced in a commercial scale is the final goal of the research
program. Honing product variables in a development program is the offers a more consistent product
upon launch to consumer market. This research program will be considered successful if
recommendations are implemented and commercial scale processes reflect learned knowledge in the
lab.
8.3 Yeast Knowing which yeast strains produce good wine from the fruit that Zoll Cellars is using is an important
process variable. This engineering study will better equip Zoll cellars to produce improved wine and will
inform the author’s winemaking style. The metric for this process variable will be reflected in notes each
strain that will serve as reference material during winemaking season in subsequent years.
9. State of the Art
9.1 Lab Bench Methods Bench scale studies of using the micro fermentation method were developed in the late 90’s and
reported in the literature. Romano was the first to report a procedure where grape musts were
sterilized and fermented in 250 mL Erlenmeyer flasks under a layer of mineral oil (Romano, et al. 1998).
The effects of grape varietal and growing region were studied using micro fermentation in a study
published by Sarmento, et al. (2001). Similar research has also been reported by a Portugal group with a
clearer focus on the analytic chemistry and grape growing processes (Coelho, et al. 2006).
Modern analytical chemistry techniques offer a means to evaluate wine in greater detail than ever
before. Because wine is a complex solution of many compounds, separation by gas chromatography is
the most common technique used for analysis (López 2002). Analysis by direct injection of wine has
been reported but has not gained widespread use (Villen, et al. 1995). The “fast” methodology that has
been reported and adopted by several groups requires a liquid extraction of analyte with
dichloromethane (Ortega 2001). Most recently a number of groups report using SPME extraction to
prepare analytes for injection into their chromatography column (López 2002), (Coelho 2006), (Gonzalez
2011), (Torrens 2004).
9.2 Scaling Research The research published of micro fermentation also notes the importance of scaling effects, where
Romano followed there 1998 publication with a scale studies in 2003, concluding that differences
between commercial and micro reactors were not significant. Torrens, et al. examined semi industrial
fermentation and these performed relative to commercially available major producers (Torrens 2008).
Eastern US Wine and Yeast Study Page 15
Vilanova in 2012 utilized 16 L intermediate size fermenters are concluded that the wine produced was
not significantly different than comparable commercial fermentations carried out in the same winery.
9.3 Yeast selection studies The assessment of commercially available yeast in winemaking by various groups has been a very active
area of research. Some groups focus on the assessment of commercial strains in unique varietals
(Vilanova 2012) (Torrens 2008). Others have isolated and grown cultures of wild yeast strains for
characterization and possible commercialization (Romano 2003) (Ortiz‐Muñiz 2010). These studies most
often use sensory analysis by expert palates combined with analytical chemistry techniques to
characterize the wines and produce a recommendation (Torrens 2008) (Vilanova 2012) (Rodriguez 2009)
and (González 2011). These methods will be employed to make yeast selection recommendations for
future winemaking projects.
10. Approach Wine was be studied by setting up micro batches and manipulating variables independently to identify
targets for commercialization. The primary variable of interest was selection of commercially available
yeast strain, while nutrient addition and blending properties of small batches were also explored. The
resulting wines and ciders were analyzed using standard vintner’s tests and by gas chromatography with
mass spectrometer detection. Finally a procedure for rapid prototyping of hard cider was developed.
11. Methods The methods utilized in this engineering study were chosen after consulting the literature and were
improved throughout the study by iteration of the method. The designs were evaluated using axiomatic
design to inform the process.
11.1 Micro Fermentation
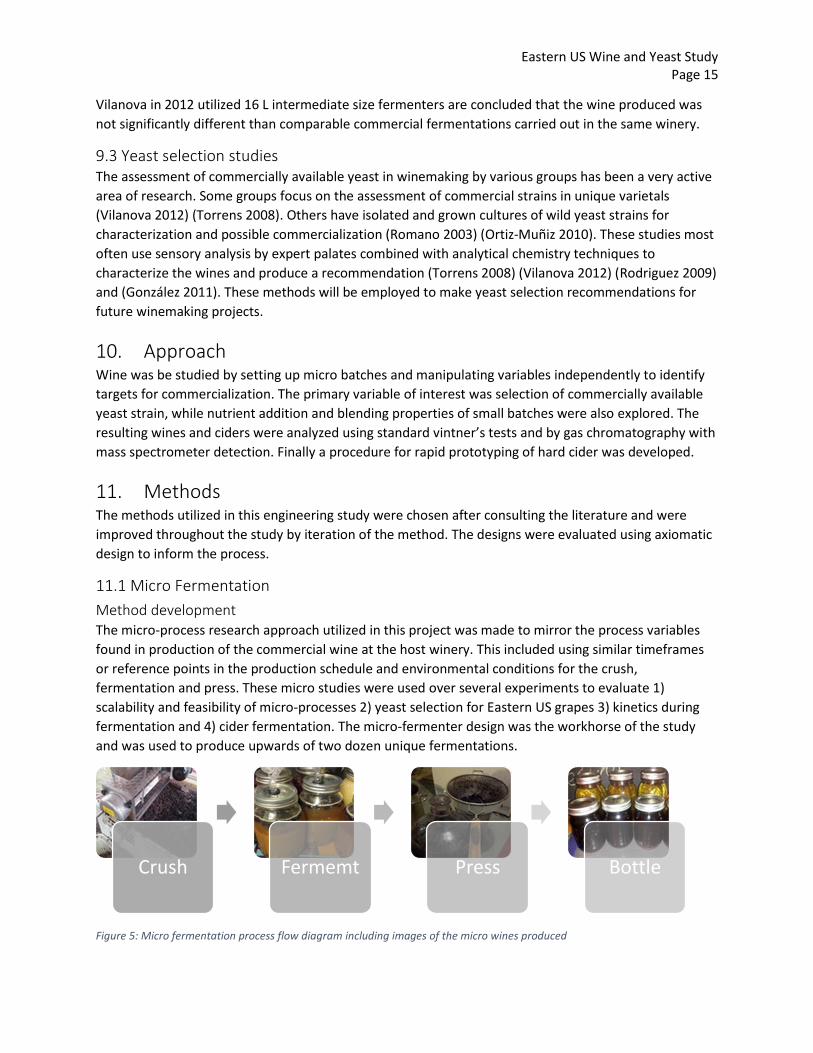
Method development The micro-process research approach utilized in this project was made to mirror the process variables
found in production of the commercial wine at the host winery. This included using similar timeframes
or reference points in the production schedule and environmental conditions for the crush,
fermentation and press. These micro studies were used over several experiments to evaluate 1)
scalability and feasibility of micro-processes 2) yeast selection for Eastern US grapes 3) kinetics during
fermentation and 4) cider fermentation. The micro-fermenter design was the workhorse of the study
and was used to produce upwards of two dozen unique fermentations.
Figure 5: Micro fermentation process flow diagram including images of the micro wines produced
Crush Fermemt Press Bottle
Eastern US Wine and Yeast Study Page 16
The micro fermentation process was conducted in quart sized Mason Jars fitted with an air lock. White
wines were fermented as juice while red wines were fermented with about 100 mL of skins. The jars
were weighed at the beginning of the fermentation and periodically throughout the fermentation to
determine the mass of carbon dioxide evolved from the system. This gave an indication as to the overall
progress of the fermentation and the total amount of ethanol present in the wine.
The micro fermenters were constructed from mason jars in quart, pint and 8 oz mason jars at different
points in the study. Different lid designs were tried were tried as well eventually producing a design that
was easier to make, sealed the contents better and cost less. The lid serves two main functions; to seal
the wine from contaminants present in the atmosphere and to allow the release of carbon dioxide
produced during fermentation.
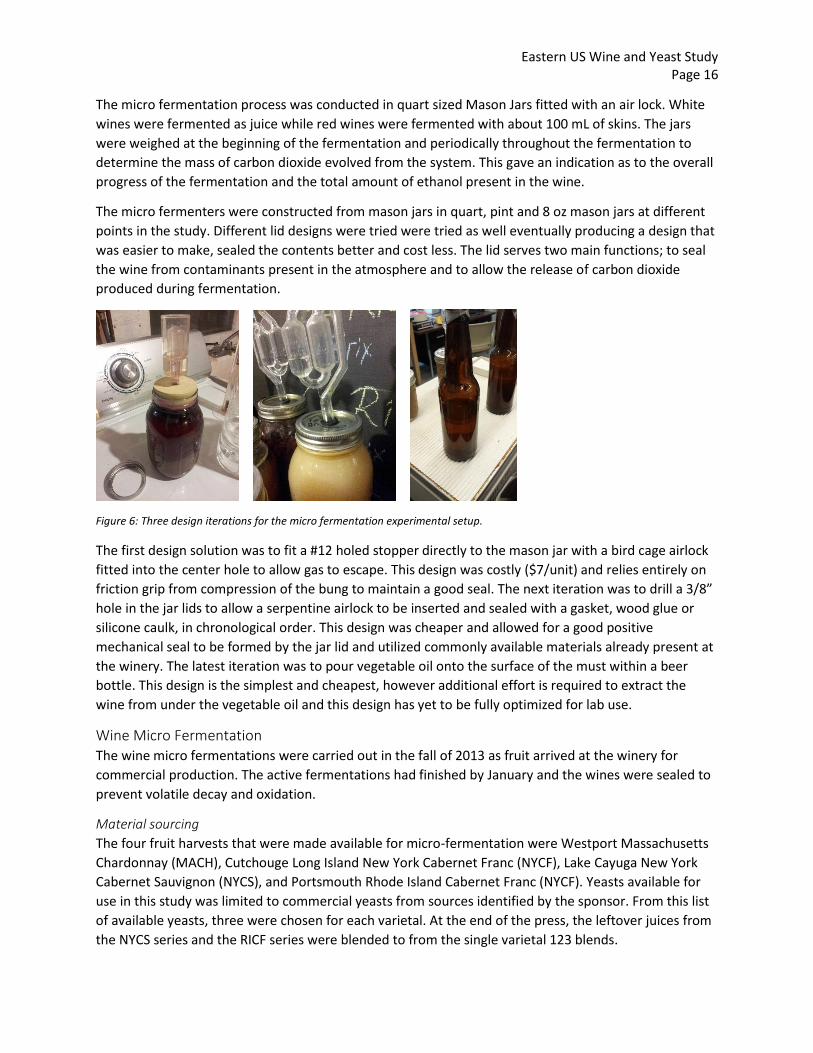
Figure 6: Three design iterations for the micro fermentation experimental setup.
The first design solution was to fit a #12 holed stopper directly to the mason jar with a bird cage airlock
fitted into the center hole to allow gas to escape. This design was costly ($7/unit) and relies entirely on
friction grip from compression of the bung to maintain a good seal. The next iteration was to drill a 3/8”
hole in the jar lids to allow a serpentine airlock to be inserted and sealed with a gasket, wood glue or
silicone caulk, in chronological order. This design was cheaper and allowed for a good positive
mechanical seal to be formed by the jar lid and utilized commonly available materials already present at
the winery. The latest iteration was to pour vegetable oil onto the surface of the must within a beer
bottle. This design is the simplest and cheapest, however additional effort is required to extract the
wine from under the vegetable oil and this design has yet to be fully optimized for lab use.
Wine Micro Fermentation The wine micro fermentations were carried out in the fall of 2013 as fruit arrived at the winery for
commercial production. The active fermentations had finished by January and the wines were sealed to
prevent volatile decay and oxidation.
Material sourcing
The four fruit harvests that were made available for micro-fermentation were Westport Massachusetts
Chardonnay (MACH), Cutchouge Long Island New York Cabernet Franc (NYCF), Lake Cayuga New York
Cabernet Sauvignon (NYCS), and Portsmouth Rhode Island Cabernet Franc (NYCF). Yeasts available for
use in this study was limited to commercial yeasts from sources identified by the sponsor. From this list
of available yeasts, three were chosen for each varietal. At the end of the press, the leftover juices from
the NYCS series and the RICF series were blended to from the single varietal 123 blends.
Eastern US Wine and Yeast Study Page 17
Fermentation
The fermentation schedule was determined by the time of arrival of fruit at the winery. Once fruit
arrived and were crushed as commercially sized batches, samples of must were taken for micro
fermentation. By completing the crush with the commercial batches the micro process was as close to
the commercial process as possible. Dried yeast (0.5 g) was rehydrated in 10mL of warm water for 15
minutes. An addition of 15mL of juice for 5 minutes was then performed to acclimatize the yeast before
pitching in the micro fermenters and stirring to homogeneity. This procedure is given in the yeast
manufacturer’s instructions, scaled proportionally to the volume of juice in the micro fermenters.
Fermentation was monitored and was judged to end by the movement of gas bubbles through the
airlock.
Table 1: Micro fermentation varietals and yeast choice
Racking, Pressing and Aging
The red wines were pressed to separate skins from finished wine 5-10 days after the end of
fermentation. The press was a basket screen strainer placed in a funnel with a collection jar at the
bottom. Due to the reduction in volume (~250 mL) from the removal of the skins, the wines were stored
in smaller pint (500 mL) mason jars. This resulted in a surplus of 250 mL of finished for each
fermentation. To complete an exploratory study, these remains were mixed in equal parts from for each
series and the resulting blends were stored in 500 mL jars. The chardonnay and vidal were not racked
and were allowed to age on the lees, which is common in white wines to increase body and mouth feel.
Culture media A series of kinetics studies were conducted in a culture media inoculated with sugar. Sucrose was added
to distilled water up to 22 brix and the solution was buffered with three salts; KH2PO4 [8.0 g/L],
(NH4)2SO4 5.0 [g/L], and MgSO4*7 H2O [1.0 g/L]. Yeast process variables were studied in round one with
four yeast strains were used being studied at the 0.2 g inoculation level (RC212, D80, VIN13, and EC-
1118) and one micro fermenter inoculated with 1 g of EC-1118 to examine effect of yeast mass on the
rate. Round two examined sucrose concentration, doubling the salt and a low yeast inoculation. These
fermentations were weighed daily to measure fermentation progress by emission of CO2.
Micro Fermentation
Date 1 2 3 4 123
MB October 5 D 254
MACH October 10 D 47 D 254 K1-V1116
NYCF October 22 RC 212 D 80 BM 4x4 NYCF(1+2+3)
RICF October 26 RC 212 D 80 BM 4x4 RICF(1+2+3)
NYCS November 8 RC 212 D 80 D 254 D254
VB November 5 D 47
Eastern US Wine and Yeast Study Page 18
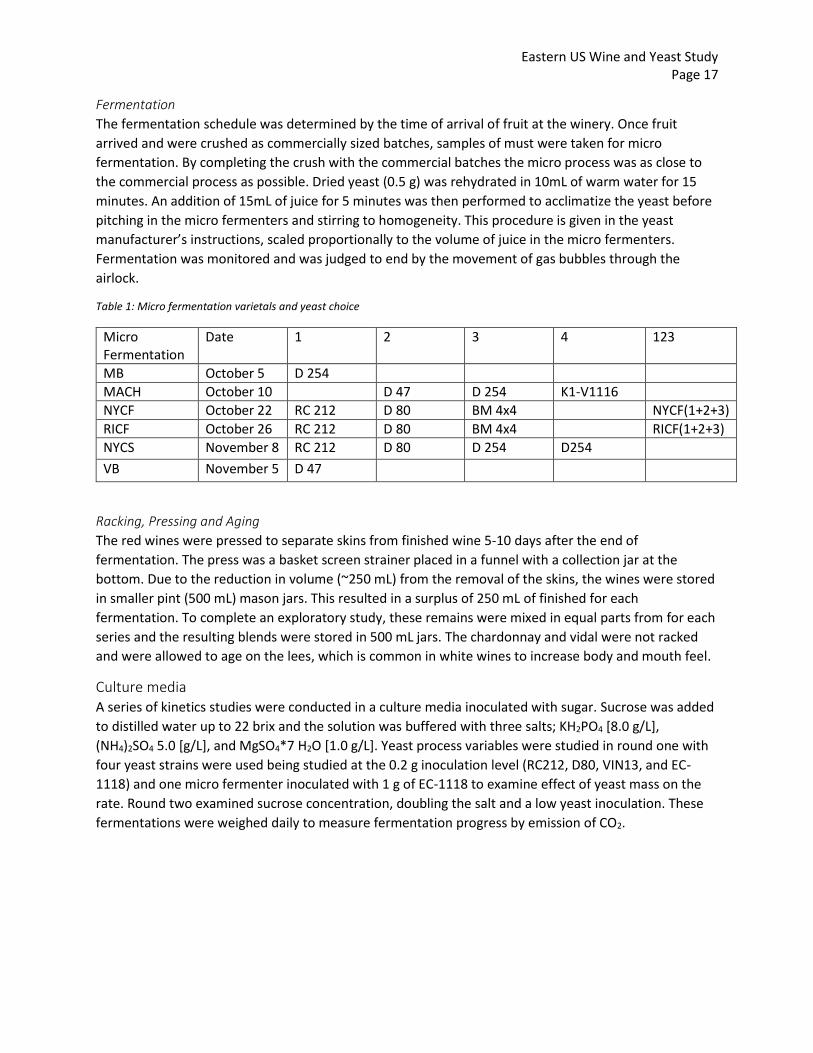
Cider Studies The micro fermentation method was applied to hard apple ciders in the spring of 2014. Three iterations
of the method were exercised with the second attempt being most successful
Apple sourcing
Gala and Macintosh apples were sourced from Ricker Hill Orchards in Turner Maine. Golden Delicious
apples were purchased at Price Chopper on park Ave Worcester Massachusetts.
Figure 7: Cider micro fermentations 1-12. The first four from left are Macintosh ciders, the right four are Gala on four different yeasts, the middle four are blends of Golden Delicious, Gala and Macintosh.
Micro process adapted
The micro fermentation procedure developed for the hard ciders followed the same principal steps as
the wine making for white grapes, however a micro crush and press procedure was also developed to
enable the process to be commercial batch independent. This means that micro fermentations can be
conducted year round from store bought apples. The crush was completed using a food processor to
blend whole apples into pulp. The pulp was then sandwiched between paper towel sheets and pressed
with a rolling pin to extract juice. From there the fermentation followed the white wine procedure. The
fermenters were massed daily to measure fermentation progress until airlocks settled.
Micro process execution
The cider studies that were most intriguing were started on April 4 2014. A series of 12 micro
fermenters were prepared using 8 oz mason jars and the most advanced lid design to date. Two process
variables were identified for study; yeast selection and blending properties of apple varietals.
Eastern US Wine and Yeast Study Page 19
Yeast selection matrix
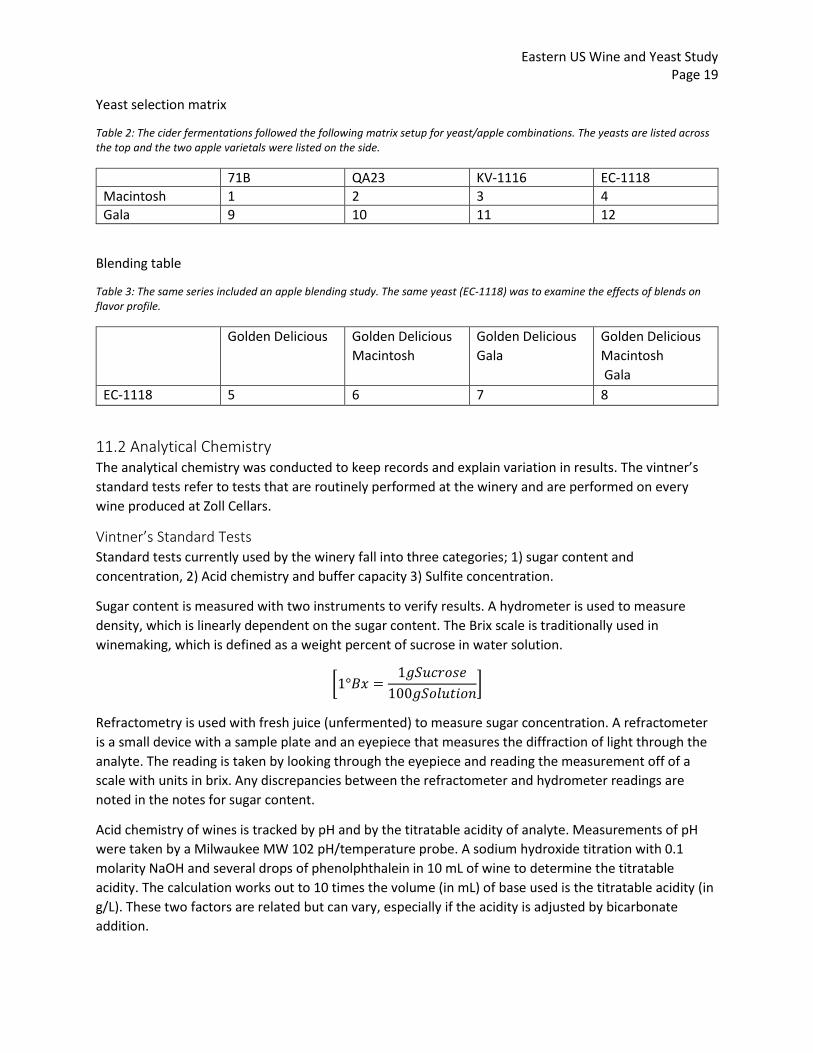
Table 2: The cider fermentations followed the following matrix setup for yeast/apple combinations. The yeasts are listed across the top and the two apple varietals were listed on the side.
71B QA23 KV-1116 EC-1118
Macintosh 1 2 3 4
Gala 9 10 11 12
Blending table
Table 3: The same series included an apple blending study. The same yeast (EC-1118) was to examine the effects of blends on flavor profile.
Golden Delicious Golden Delicious
Macintosh
Golden Delicious
Gala
Golden Delicious
Macintosh
Gala
EC-1118 5 6 7 8
11.2 Analytical Chemistry The analytical chemistry was conducted to keep records and explain variation in results. The vintner’s
standard tests refer to tests that are routinely performed at the winery and are performed on every
wine produced at Zoll Cellars.
Vintner’s Standard Tests Standard tests currently used by the winery fall into three categories; 1) sugar content and
concentration, 2) Acid chemistry and buffer capacity 3) Sulfite concentration.
Sugar content is measured with two instruments to verify results. A hydrometer is used to measure
density, which is linearly dependent on the sugar content. The Brix scale is traditionally used in
winemaking, which is defined as a weight percent of sucrose in water solution.
[1°𝐵𝑥 =1𝑔𝑆𝑢𝑐𝑟𝑜𝑠𝑒
100𝑔𝑆𝑜𝑙𝑢𝑡𝑖𝑜𝑛]
Refractometry is used with fresh juice (unfermented) to measure sugar concentration. A refractometer
is a small device with a sample plate and an eyepiece that measures the diffraction of light through the
analyte. The reading is taken by looking through the eyepiece and reading the measurement off of a
scale with units in brix. Any discrepancies between the refractometer and hydrometer readings are
noted in the notes for sugar content.
Acid chemistry of wines is tracked by pH and by the titratable acidity of analyte. Measurements of pH
were taken by a Milwaukee MW 102 pH/temperature probe. A sodium hydroxide titration with 0.1
molarity NaOH and several drops of phenolphthalein in 10 mL of wine to determine the titratable
acidity. The calculation works out to 10 times the volume (in mL) of base used is the titratable acidity (in
g/L). These two factors are related but can vary, especially if the acidity is adjusted by bicarbonate
addition.
Eastern US Wine and Yeast Study Page 20
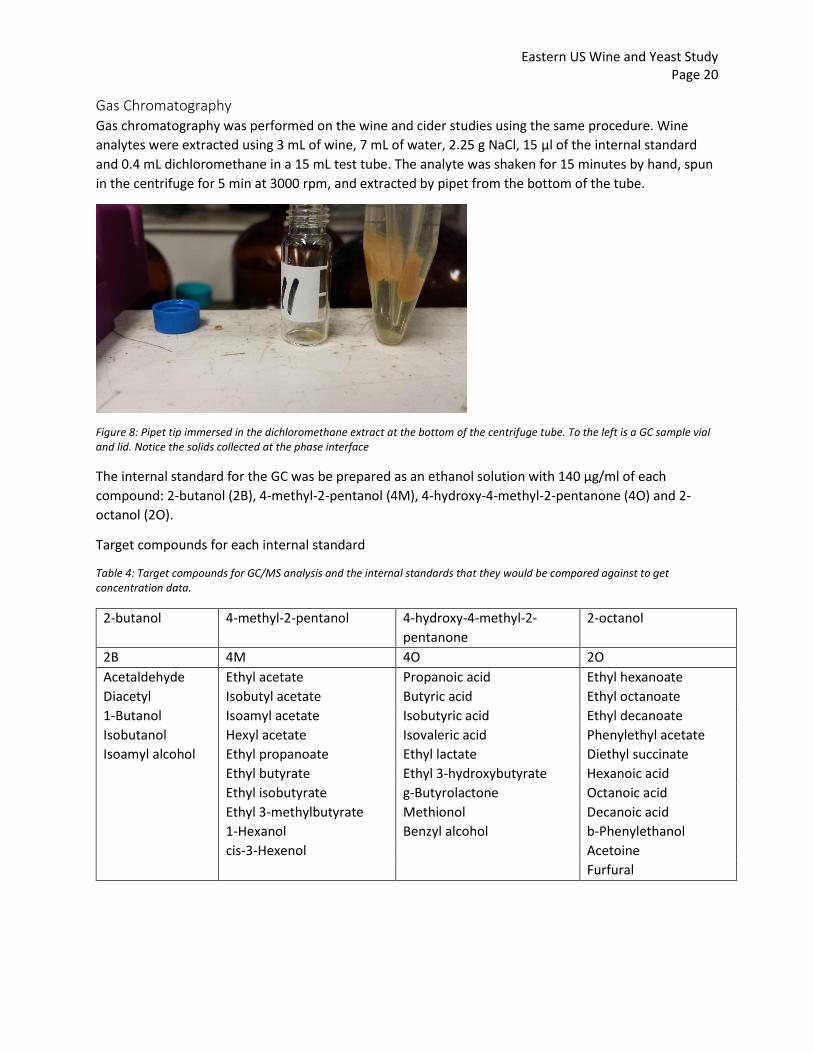
Gas Chromatography Gas chromatography was performed on the wine and cider studies using the same procedure. Wine
analytes were extracted using 3 mL of wine, 7 mL of water, 2.25 g NaCl, 15 µl of the internal standard
and 0.4 mL dichloromethane in a 15 mL test tube. The analyte was shaken for 15 minutes by hand, spun
in the centrifuge for 5 min at 3000 rpm, and extracted by pipet from the bottom of the tube.
Figure 8: Pipet tip immersed in the dichloromethane extract at the bottom of the centrifuge tube. To the left is a GC sample vial and lid. Notice the solids collected at the phase interface
The internal standard for the GC was be prepared as an ethanol solution with 140 µg/ml of each
compound: 2-butanol (2B), 4-methyl-2-pentanol (4M), 4-hydroxy-4-methyl-2-pentanone (4O) and 2-
octanol (2O).
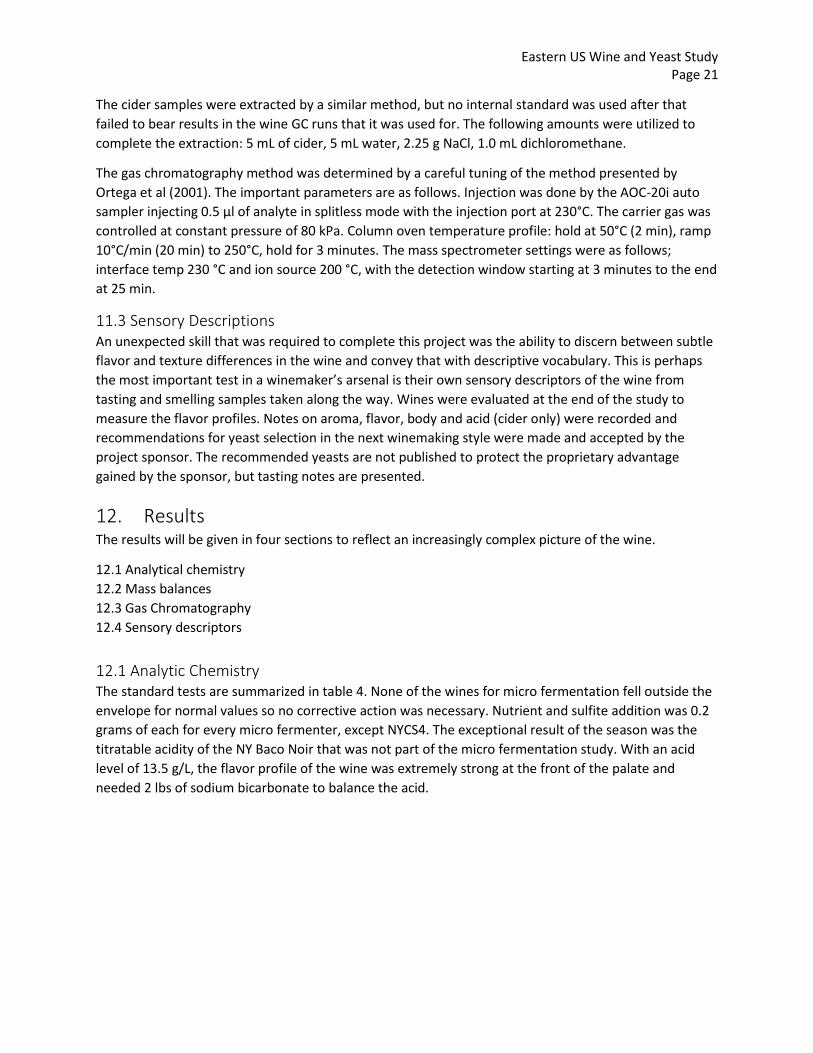
Target compounds for each internal standard
Table 4: Target compounds for GC/MS analysis and the internal standards that they would be compared against to get concentration data.
2-butanol 4-methyl-2-pentanol 4-hydroxy-4-methyl-2-
pentanone
2-octanol
2B 4M 4O 2O
Acetaldehyde Ethyl acetate Propanoic acid Ethyl hexanoate
Diacetyl Isobutyl acetate Butyric acid Ethyl octanoate
1-Butanol Isoamyl acetate Isobutyric acid Ethyl decanoate
Isobutanol Hexyl acetate Isovaleric acid Phenylethyl acetate
Isoamyl alcohol Ethyl propanoate Ethyl lactate Diethyl succinate
Ethyl butyrate Ethyl 3-hydroxybutyrate Hexanoic acid
Ethyl isobutyrate g-Butyrolactone Octanoic acid
Ethyl 3-methylbutyrate Methionol Decanoic acid
1-Hexanol Benzyl alcohol b-Phenylethanol
cis-3-Hexenol Acetoine
Furfural
Eastern US Wine and Yeast Study Page 21
The cider samples were extracted by a similar method, but no internal standard was used after that
failed to bear results in the wine GC runs that it was used for. The following amounts were utilized to
complete the extraction: 5 mL of cider, 5 mL water, 2.25 g NaCl, 1.0 mL dichloromethane.
The gas chromatography method was determined by a careful tuning of the method presented by
Ortega et al (2001). The important parameters are as follows. Injection was done by the AOC-20i auto
sampler injecting 0.5 µl of analyte in splitless mode with the injection port at 230°C. The carrier gas was
controlled at constant pressure of 80 kPa. Column oven temperature profile: hold at 50°C (2 min), ramp
10°C/min (20 min) to 250°C, hold for 3 minutes. The mass spectrometer settings were as follows;
interface temp 230 °C and ion source 200 °C, with the detection window starting at 3 minutes to the end
at 25 min.
11.3 Sensory Descriptions An unexpected skill that was required to complete this project was the ability to discern between subtle
flavor and texture differences in the wine and convey that with descriptive vocabulary. This is perhaps
the most important test in a winemaker’s arsenal is their own sensory descriptors of the wine from
tasting and smelling samples taken along the way. Wines were evaluated at the end of the study to
measure the flavor profiles. Notes on aroma, flavor, body and acid (cider only) were recorded and
recommendations for yeast selection in the next winemaking style were made and accepted by the
project sponsor. The recommended yeasts are not published to protect the proprietary advantage
gained by the sponsor, but tasting notes are presented.
12. Results The results will be given in four sections to reflect an increasingly complex picture of the wine.
12.1 Analytical chemistry
12.2 Mass balances
12.3 Gas Chromatography
12.4 Sensory descriptors
12.1 Analytic Chemistry The standard tests are summarized in table 4. None of the wines for micro fermentation fell outside the
envelope for normal values so no corrective action was necessary. Nutrient and sulfite addition was 0.2
grams of each for every micro fermenter, except NYCS4. The exceptional result of the season was the
titratable acidity of the NY Baco Noir that was not part of the micro fermentation study. With an acid
level of 13.5 g/L, the flavor profile of the wine was extremely strong at the front of the palate and
needed 2 lbs of sodium bicarbonate to balance the acid.
Eastern US Wine and Yeast Study Page 22
Table 5: The standard test results for the wines of the 2013 winemaking season.
Date Temp (F) Sugar (°Bx) pH Tartaric acid (g/L)
Westport MA Chardonnay 11-Oct 55 21 3.8 7.9
Cutchouge NY Cab Franc 22-Oct 55 22.5 3.8 7.5
Portsmouth RI Cab Franc 23-Oct 60 21.5 4.1 6.7
Portsmouth RI Vidal Blanc 3-Nov 60 21.5 8.25
Lake Cayuga NY Cab. Sauv. 8-Nov 50 23 3.5 5
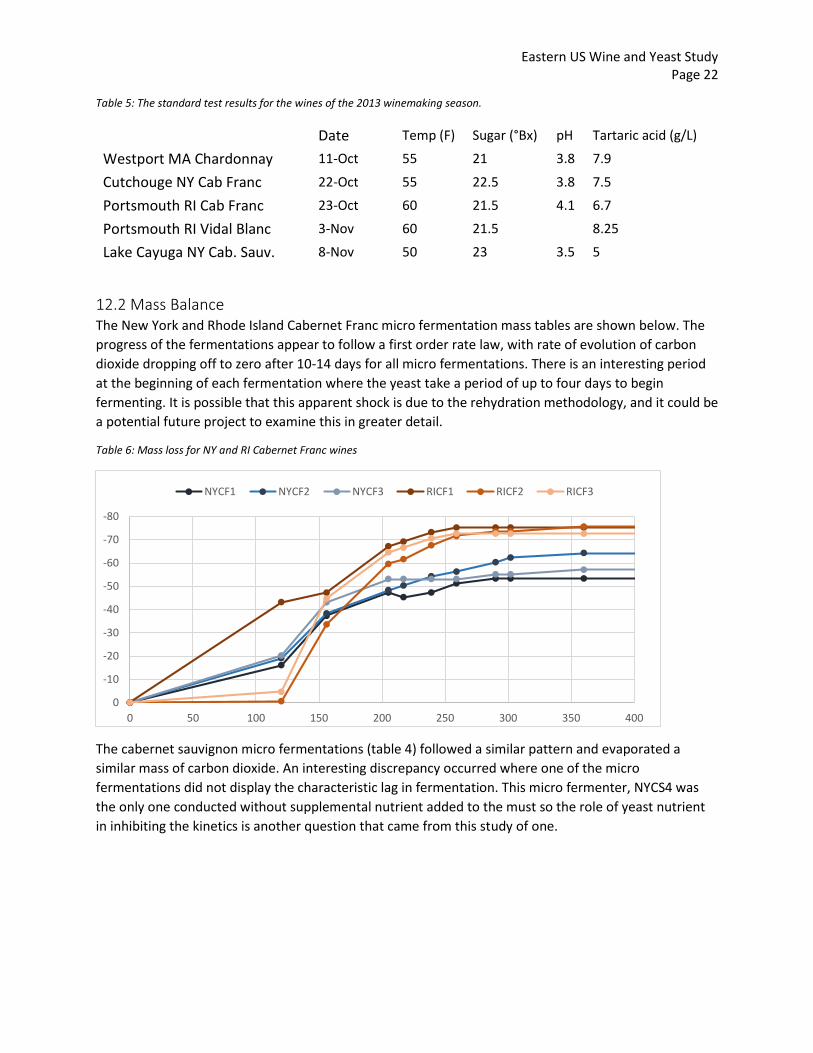
12.2 Mass Balance The New York and Rhode Island Cabernet Franc micro fermentation mass tables are shown below. The
progress of the fermentations appear to follow a first order rate law, with rate of evolution of carbon
dioxide dropping off to zero after 10-14 days for all micro fermentations. There is an interesting period
at the beginning of each fermentation where the yeast take a period of up to four days to begin
fermenting. It is possible that this apparent shock is due to the rehydration methodology, and it could be
a potential future project to examine this in greater detail.
Table 6: Mass loss for NY and RI Cabernet Franc wines
The cabernet sauvignon micro fermentations (table 4) followed a similar pattern and evaporated a
similar mass of carbon dioxide. An interesting discrepancy occurred where one of the micro
fermentations did not display the characteristic lag in fermentation. This micro fermenter, NYCS4 was
the only one conducted without supplemental nutrient added to the must so the role of yeast nutrient
in inhibiting the kinetics is another question that came from this study of one.
-80
-70
-60
-50
-40
-30
-20
-10
0
0 50 100 150 200 250 300 350 400
NYCF1 NYCF2 NYCF3 RICF1 RICF2 RICF3
Eastern US Wine and Yeast Study Page 23
Table 7: Mass loss rates for NY Cabernet Franc
12.3 Gas Chromatography The results of the gas chromatography runs were chromatographs showing peaks for each compound as
it was eluted from the column. The mass spectrometer analyzed each peak and reported an ion
fragment spectrum with a probable chemical species and the relative percent abundance. This analysis
showed that gas chromatography can be used to evaluate wine in this lab, however more work is
needed before chromatography results can be used by the winemaker to inform decision making in the
process.
The wine samples were run on March 27, 2014 and the results of the session are given here. The
chromatograms detailed beautiful results when the analysis was completed for a few good runs. Early
chromatography attempts had a high rate of failure to obtain results. After three months of trying, these
bore out the first results. These analysis were also characterized by frequent failures to obtain even one
distinguishable peak.
NYCS 4 was a lucky one. The chromatograph here shows 48 unique peaks with a large array of flavor
active compounds.
-80
-70
-60
-50
-40
-30
-20
-10
0
0 50 100 150 200 250 300
NYCS #1 RC 212 NYCS #2 D80
NYCS #3 D254 NYCS #4 D254 (no sup)
Eastern US Wine and Yeast Study Page 24
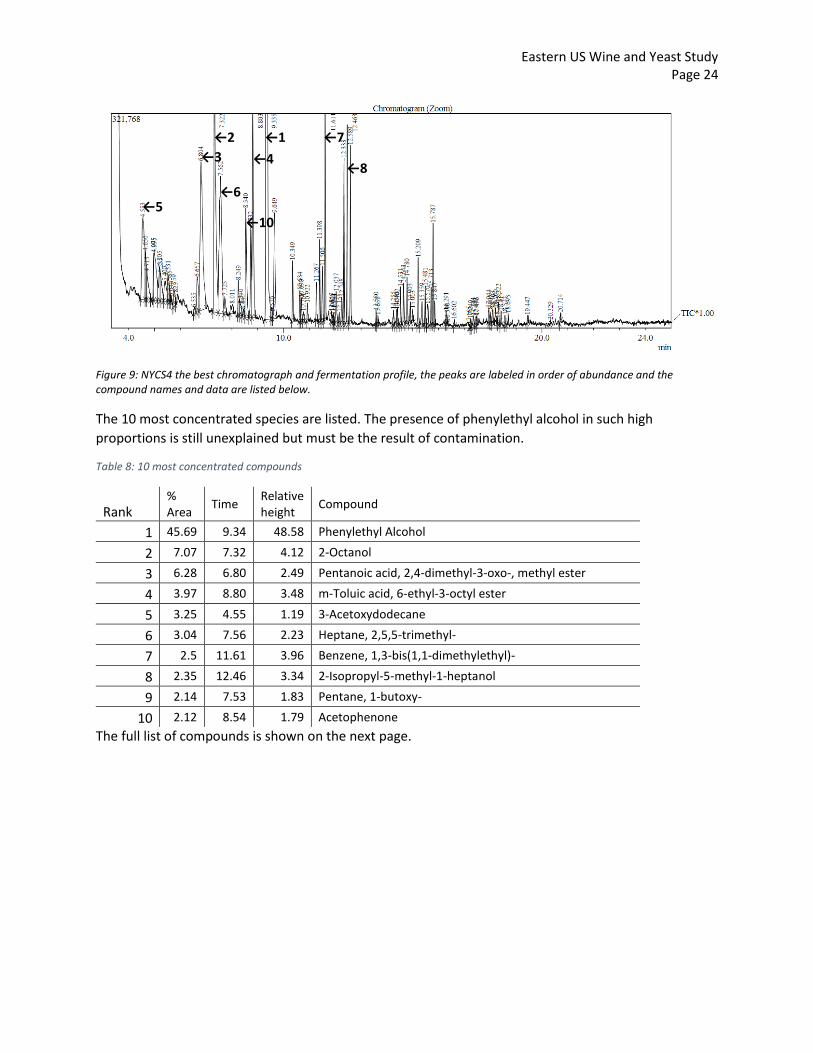
Figure 9: NYCS4 the best chromatograph and fermentation profile, the peaks are labeled in order of abundance and the compound names and data are listed below.
The 10 most concentrated species are listed. The presence of phenylethyl alcohol in such high
proportions is still unexplained but must be the result of contamination.
Table 8: 10 most concentrated compounds
Rank % Area
Time Relative height
Compound
1 45.69 9.34 48.58 Phenylethyl Alcohol
2 7.07 7.32 4.12 2-Octanol
3 6.28 6.80 2.49 Pentanoic acid, 2,4-dimethyl-3-oxo-, methyl ester
4 3.97 8.80 3.48 m-Toluic acid, 6-ethyl-3-octyl ester
5 3.25 4.55 1.19 3-Acetoxydodecane
6 3.04 7.56 2.23 Heptane, 2,5,5-trimethyl-
7 2.5 11.61 3.96 Benzene, 1,3-bis(1,1-dimethylethyl)-
8 2.35 12.46 3.34 2-Isopropyl-5-methyl-1-heptanol
9 2.14 7.53 1.83 Pentane, 1-butoxy-
10 2.12 8.54 1.79 Acetophenone
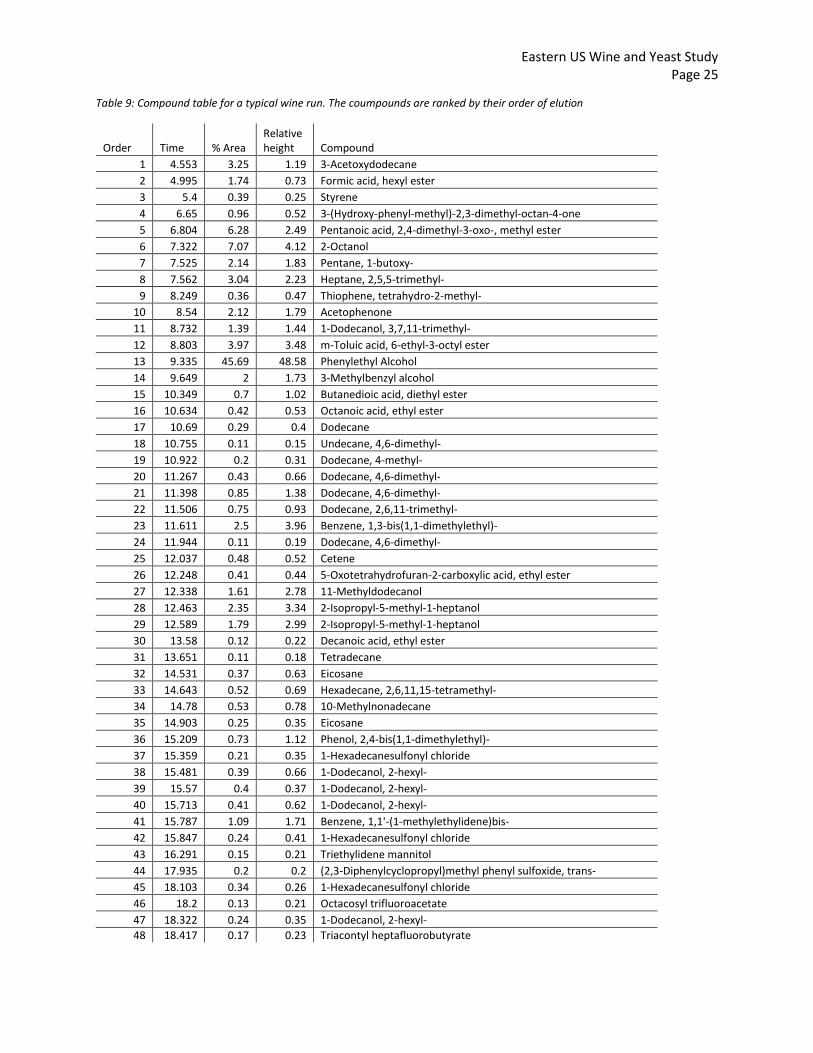
The full list of compounds is shown on the next page.
←1 ←2
←3
←4
←3
←3
←5
←3
←3
←6
←3
←3
←7
←3
←3
←8
←3
←3
←10
←3
←3
Eastern US Wine and Yeast Study Page 25
Table 9: Compound table for a typical wine run. The coumpounds are ranked by their order of elution
Order Time % Area Relative height Compound
1 4.553 3.25 1.19 3-Acetoxydodecane
2 4.995 1.74 0.73 Formic acid, hexyl ester
3 5.4 0.39 0.25 Styrene
4 6.65 0.96 0.52 3-(Hydroxy-phenyl-methyl)-2,3-dimethyl-octan-4-one
5 6.804 6.28 2.49 Pentanoic acid, 2,4-dimethyl-3-oxo-, methyl ester
6 7.322 7.07 4.12 2-Octanol
7 7.525 2.14 1.83 Pentane, 1-butoxy-
8 7.562 3.04 2.23 Heptane, 2,5,5-trimethyl-
9 8.249 0.36 0.47 Thiophene, tetrahydro-2-methyl-
10 8.54 2.12 1.79 Acetophenone
11 8.732 1.39 1.44 1-Dodecanol, 3,7,11-trimethyl-
12 8.803 3.97 3.48 m-Toluic acid, 6-ethyl-3-octyl ester
13 9.335 45.69 48.58 Phenylethyl Alcohol
14 9.649 2 1.73 3-Methylbenzyl alcohol
15 10.349 0.7 1.02 Butanedioic acid, diethyl ester
16 10.634 0.42 0.53 Octanoic acid, ethyl ester
17 10.69 0.29 0.4 Dodecane
18 10.755 0.11 0.15 Undecane, 4,6-dimethyl-
19 10.922 0.2 0.31 Dodecane, 4-methyl-
20 11.267 0.43 0.66 Dodecane, 4,6-dimethyl-
21 11.398 0.85 1.38 Dodecane, 4,6-dimethyl-
22 11.506 0.75 0.93 Dodecane, 2,6,11-trimethyl-
23 11.611 2.5 3.96 Benzene, 1,3-bis(1,1-dimethylethyl)-
24 11.944 0.11 0.19 Dodecane, 4,6-dimethyl-
25 12.037 0.48 0.52 Cetene
26 12.248 0.41 0.44 5-Oxotetrahydrofuran-2-carboxylic acid, ethyl ester
27 12.338 1.61 2.78 11-Methyldodecanol
28 12.463 2.35 3.34 2-Isopropyl-5-methyl-1-heptanol
29 12.589 1.79 2.99 2-Isopropyl-5-methyl-1-heptanol
30 13.58 0.12 0.22 Decanoic acid, ethyl ester
31 13.651 0.11 0.18 Tetradecane
32 14.531 0.37 0.63 Eicosane
33 14.643 0.52 0.69 Hexadecane, 2,6,11,15-tetramethyl-
34 14.78 0.53 0.78 10-Methylnonadecane
35 14.903 0.25 0.35 Eicosane
36 15.209 0.73 1.12 Phenol, 2,4-bis(1,1-dimethylethyl)-
37 15.359 0.21 0.35 1-Hexadecanesulfonyl chloride
38 15.481 0.39 0.66 1-Dodecanol, 2-hexyl-
39 15.57 0.4 0.37 1-Dodecanol, 2-hexyl-
40 15.713 0.41 0.62 1-Dodecanol, 2-hexyl-
41 15.787 1.09 1.71 Benzene, 1,1'-(1-methylethylidene)bis-
42 15.847 0.24 0.41 1-Hexadecanesulfonyl chloride
43 16.291 0.15 0.21 Triethylidene mannitol
44 17.935 0.2 0.2 (2,3-Diphenylcyclopropyl)methyl phenyl sulfoxide, trans-
45 18.103 0.34 0.26 1-Hexadecanesulfonyl chloride
46 18.2 0.13 0.21 Octacosyl trifluoroacetate
47 18.322 0.24 0.35 1-Dodecanol, 2-hexyl-
48 18.417 0.17 0.23 Triacontyl heptafluorobutyrate
Eastern US Wine and Yeast Study Page 26
The analysis revealed an tremendous result of 48 compounds where before only the one was thought to
exist. The general functional groups found were esters, ethers, higher alcohols, alkanes and sulfonyls.
One compound was found far in excess of every other peak; phenylethyl alcohol accounted for 45% of
the peak area. This made all of the gas chromatography runs look as though there was one peak until
the baseline was sufficiently magnified. This has been encountered on every run since and needs to be
addressed as a study refinement for next year. The results of the wine gas chromatography runs was
that practice improves results and that the first runs rarely work the best. Practice, especially perfect
practice, makes perfect.
Cider chromatography runs
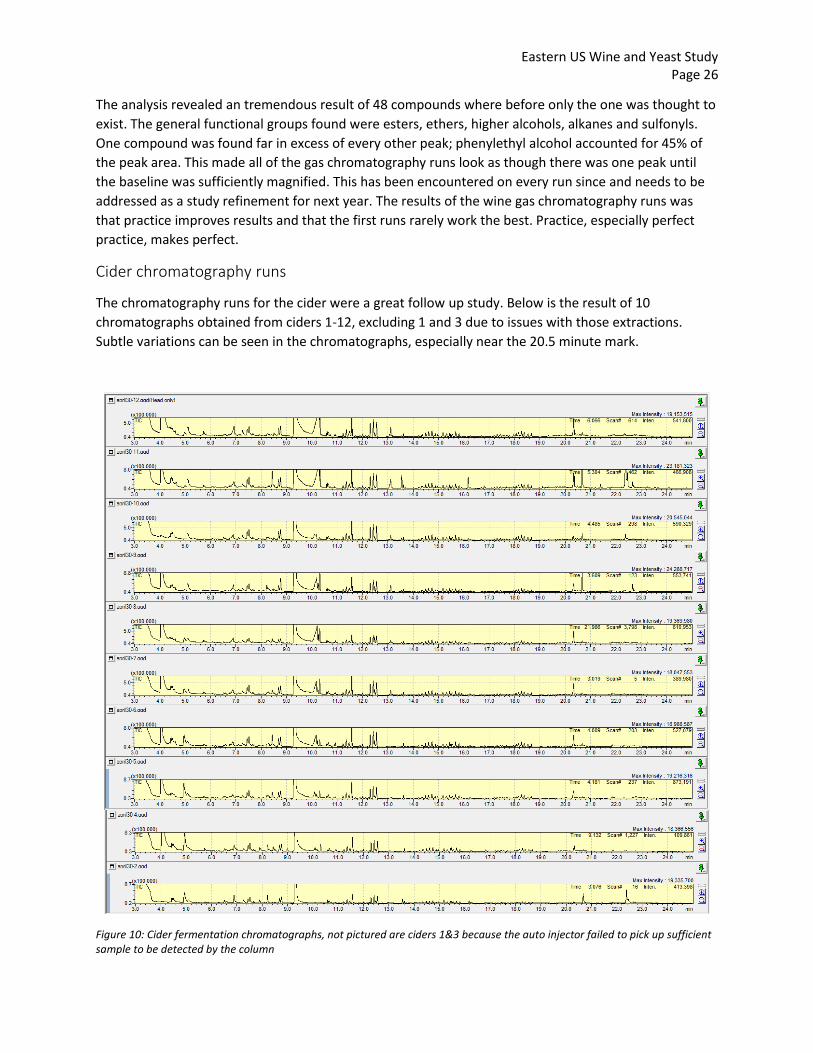
The chromatography runs for the cider were a great follow up study. Below is the result of 10
chromatographs obtained from ciders 1-12, excluding 1 and 3 due to issues with those extractions.
Subtle variations can be seen in the chromatographs, especially near the 20.5 minute mark.
Figure 10: Cider fermentation chromatographs, not pictured are ciders 1&3 because the auto injector failed to pick up sufficient sample to be detected by the column
Eastern US Wine and Yeast Study Page 27
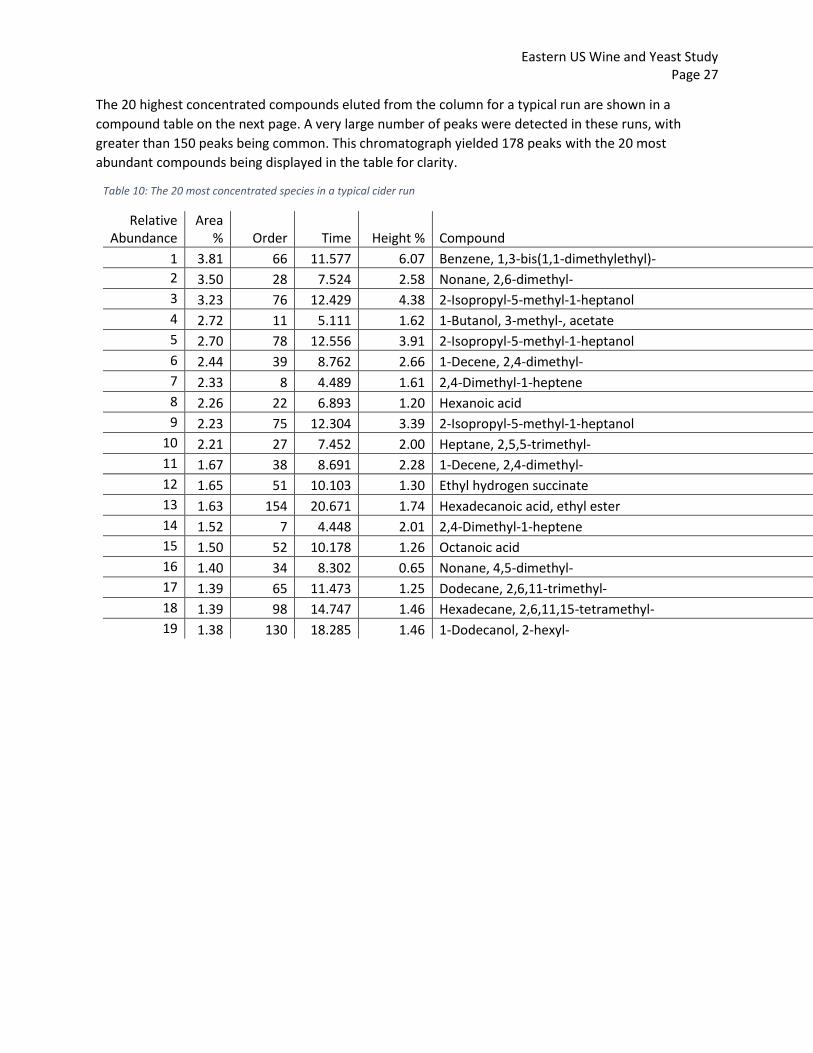
The 20 highest concentrated compounds eluted from the column for a typical run are shown in a
compound table on the next page. A very large number of peaks were detected in these runs, with
greater than 150 peaks being common. This chromatograph yielded 178 peaks with the 20 most
abundant compounds being displayed in the table for clarity.
Table 10: The 20 most concentrated species in a typical cider run
Relative Abundance
Area % Order Time Height % Compound
1 3.81 66 11.577 6.07 Benzene, 1,3-bis(1,1-dimethylethyl)-
2 3.50 28 7.524 2.58 Nonane, 2,6-dimethyl-
3 3.23 76 12.429 4.38 2-Isopropyl-5-methyl-1-heptanol
4 2.72 11 5.111 1.62 1-Butanol, 3-methyl-, acetate
5 2.70 78 12.556 3.91 2-Isopropyl-5-methyl-1-heptanol
6 2.44 39 8.762 2.66 1-Decene, 2,4-dimethyl-
7 2.33 8 4.489 1.61 2,4-Dimethyl-1-heptene
8 2.26 22 6.893 1.20 Hexanoic acid
9 2.23 75 12.304 3.39 2-Isopropyl-5-methyl-1-heptanol
10 2.21 27 7.452 2.00 Heptane, 2,5,5-trimethyl-
11 1.67 38 8.691 2.28 1-Decene, 2,4-dimethyl-
12 1.65 51 10.103 1.30 Ethyl hydrogen succinate
13 1.63 154 20.671 1.74 Hexadecanoic acid, ethyl ester
14 1.52 7 4.448 2.01 2,4-Dimethyl-1-heptene
15 1.50 52 10.178 1.26 Octanoic acid
16 1.40 34 8.302 0.65 Nonane, 4,5-dimethyl-
17 1.39 65 11.473 1.25 Dodecane, 2,6,11-trimethyl-
18 1.39 98 14.747 1.46 Hexadecane, 2,6,11,15-tetramethyl-
19 1.38 130 18.285 1.46 1-Dodecanol, 2-hexyl-
Eastern US Wine and Yeast Study Page 28
12.4 Sensory Descriptors
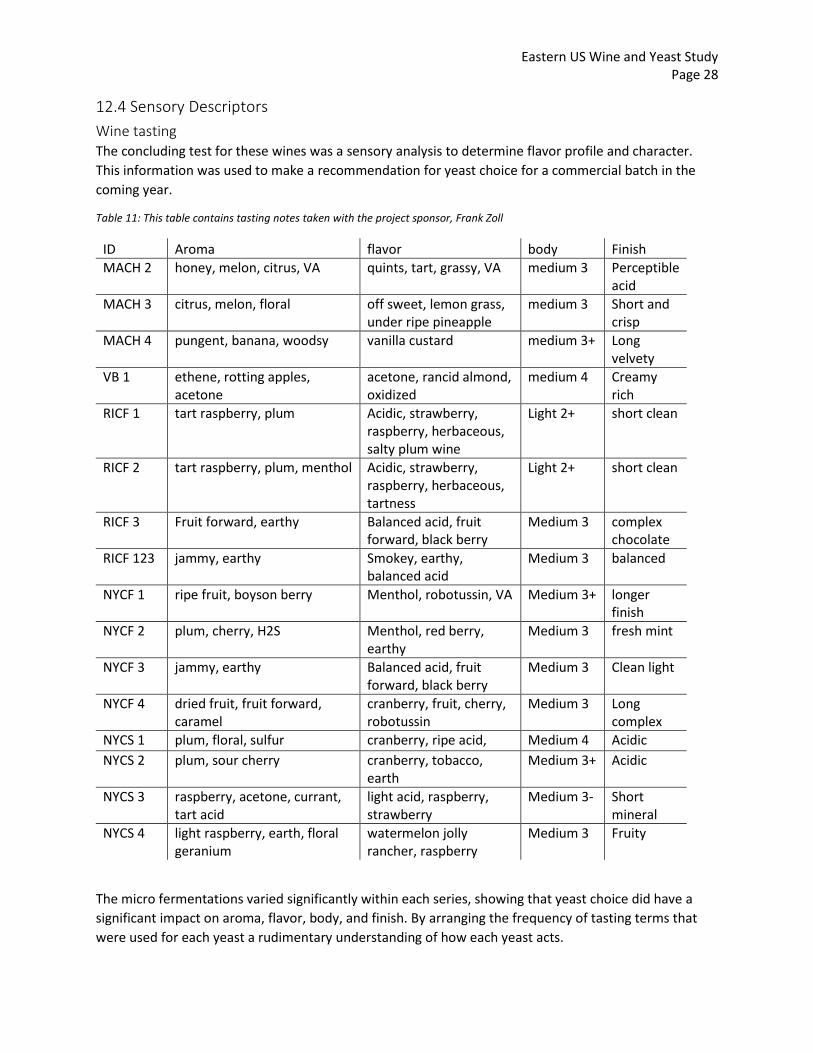
Wine tasting The concluding test for these wines was a sensory analysis to determine flavor profile and character.
This information was used to make a recommendation for yeast choice for a commercial batch in the
coming year.
Table 11: This table contains tasting notes taken with the project sponsor, Frank Zoll
ID Aroma flavor body Finish
MACH 2 honey, melon, citrus, VA quints, tart, grassy, VA medium 3 Perceptible acid
MACH 3 citrus, melon, floral off sweet, lemon grass, under ripe pineapple
medium 3 Short and crisp
MACH 4 pungent, banana, woodsy vanilla custard medium 3+ Long velvety
VB 1 ethene, rotting apples, acetone
acetone, rancid almond, oxidized
medium 4 Creamy rich
RICF 1 tart raspberry, plum Acidic, strawberry, raspberry, herbaceous, salty plum wine
Light 2+ short clean
RICF 2 tart raspberry, plum, menthol Acidic, strawberry, raspberry, herbaceous, tartness
Light 2+ short clean
RICF 3 Fruit forward, earthy Balanced acid, fruit forward, black berry
Medium 3 complex chocolate
RICF 123 jammy, earthy Smokey, earthy, balanced acid
Medium 3 balanced
NYCF 1 ripe fruit, boyson berry Menthol, robotussin, VA Medium 3+ longer finish
NYCF 2 plum, cherry, H2S Menthol, red berry, earthy
Medium 3 fresh mint
NYCF 3 jammy, earthy Balanced acid, fruit forward, black berry
Medium 3 Clean light
NYCF 4 dried fruit, fruit forward, caramel
cranberry, fruit, cherry, robotussin
Medium 3 Long complex
NYCS 1 plum, floral, sulfur cranberry, ripe acid, Medium 4 Acidic
NYCS 2 plum, sour cherry cranberry, tobacco, earth
Medium 3+ Acidic
NYCS 3 raspberry, acetone, currant, tart acid
light acid, raspberry, strawberry
Medium 3- Short mineral
NYCS 4 light raspberry, earth, floral geranium
watermelon jolly rancher, raspberry
Medium 3 Fruity
The micro fermentations varied significantly within each series, showing that yeast choice did have a
significant impact on aroma, flavor, body, and finish. By arranging the frequency of tasting terms that
were used for each yeast a rudimentary understanding of how each yeast acts.
Eastern US Wine and Yeast Study Page 29
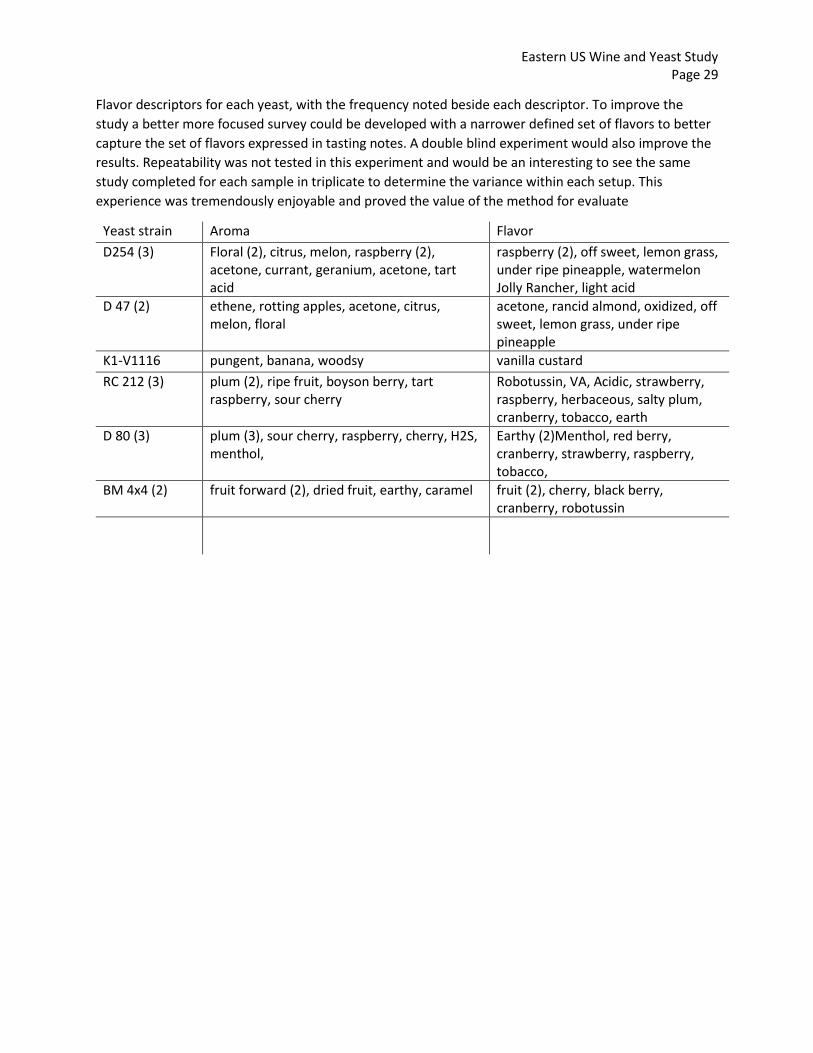
Flavor descriptors for each yeast, with the frequency noted beside each descriptor. To improve the
study a better more focused survey could be developed with a narrower defined set of flavors to better
capture the set of flavors expressed in tasting notes. A double blind experiment would also improve the
results. Repeatability was not tested in this experiment and would be an interesting to see the same
study completed for each sample in triplicate to determine the variance within each setup. This
experience was tremendously enjoyable and proved the value of the method for evaluate
Yeast strain Aroma Flavor
D254 (3) Floral (2), citrus, melon, raspberry (2), acetone, currant, geranium, acetone, tart acid
raspberry (2), off sweet, lemon grass, under ripe pineapple, watermelon Jolly Rancher, light acid
D 47 (2) ethene, rotting apples, acetone, citrus, melon, floral
acetone, rancid almond, oxidized, off sweet, lemon grass, under ripe pineapple
K1-V1116 pungent, banana, woodsy vanilla custard
RC 212 (3) plum (2), ripe fruit, boyson berry, tart raspberry, sour cherry
Robotussin, VA, Acidic, strawberry, raspberry, herbaceous, salty plum, cranberry, tobacco, earth
D 80 (3) plum (3), sour cherry, raspberry, cherry, H2S, menthol,
Earthy (2)Menthol, red berry, cranberry, strawberry, raspberry, tobacco,
BM 4x4 (2) fruit forward (2), dried fruit, earthy, caramel fruit (2), cherry, black berry, cranberry, robotussin
Eastern US Wine and Yeast Study Page 30
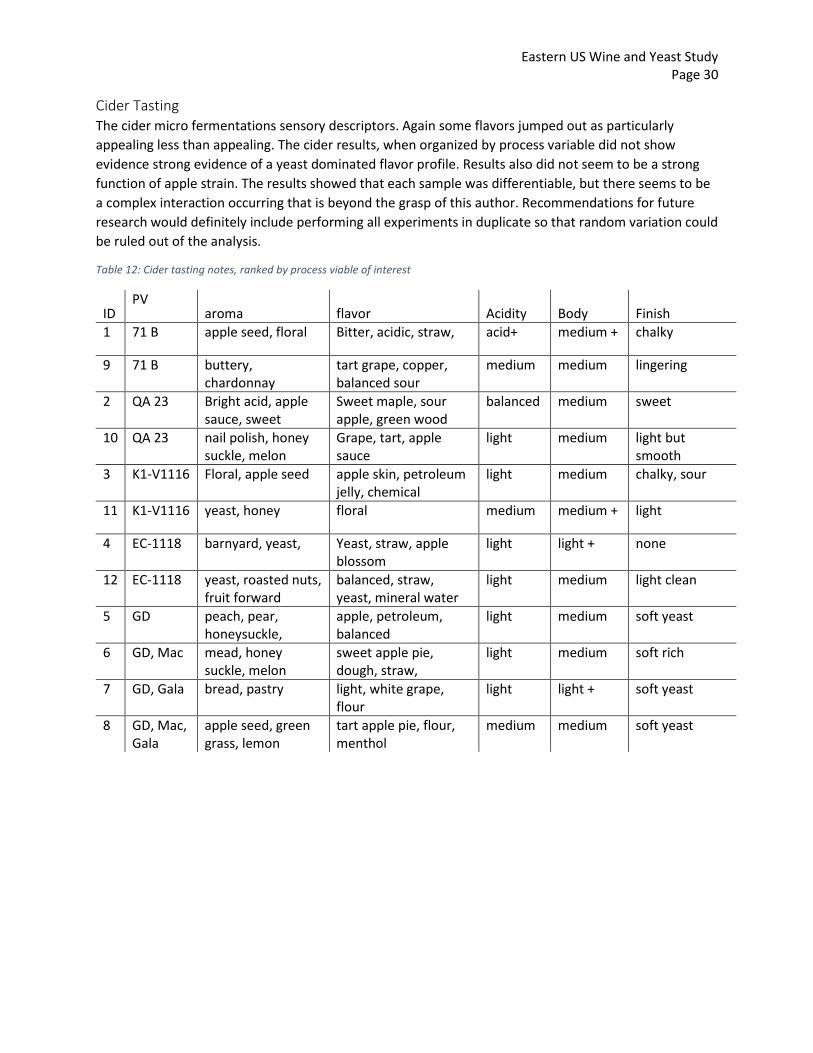
Cider Tasting The cider micro fermentations sensory descriptors. Again some flavors jumped out as particularly
appealing less than appealing. The cider results, when organized by process variable did not show
evidence strong evidence of a yeast dominated flavor profile. Results also did not seem to be a strong
function of apple strain. The results showed that each sample was differentiable, but there seems to be
a complex interaction occurring that is beyond the grasp of this author. Recommendations for future
research would definitely include performing all experiments in duplicate so that random variation could
be ruled out of the analysis.
Table 12: Cider tasting notes, ranked by process viable of interest
ID PV
aroma flavor Acidity Body Finish
1 71 B apple seed, floral Bitter, acidic, straw, acid+ medium + chalky
9 71 B buttery, chardonnay
tart grape, copper, balanced sour
medium medium lingering
2 QA 23 Bright acid, apple sauce, sweet
Sweet maple, sour apple, green wood
balanced medium sweet
10 QA 23 nail polish, honey suckle, melon
Grape, tart, apple sauce
light medium light but smooth
3 K1-V1116 Floral, apple seed apple skin, petroleum jelly, chemical
light medium chalky, sour
11 K1-V1116 yeast, honey floral medium medium + light
4 EC-1118 barnyard, yeast, Yeast, straw, apple blossom
light light + none
12 EC-1118 yeast, roasted nuts, fruit forward
balanced, straw, yeast, mineral water
light medium light clean
5 GD peach, pear, honeysuckle,
apple, petroleum, balanced
light medium soft yeast
6 GD, Mac mead, honey suckle, melon
sweet apple pie, dough, straw,
light medium soft rich
7 GD, Gala bread, pastry light, white grape, flour
light light + soft yeast
8 GD, Mac, Gala
apple seed, green grass, lemon
tart apple pie, flour, menthol
medium medium soft yeast
Eastern US Wine and Yeast Study Page 31
13. Conclusions
13.1 Research Method Micro fermentation is a useful method for creating and evaluating process variables.
Better temperature and process control could yield better results.
Gas chromatography is a viable method for determining the concentration of compounds in the wine.
48 compounds were characterized in wine, and 178 compounds were found in a hard cider.
Improvements in chromatography could come from installing a better column or better analytics.
13.2 Scalability The scalability of the process was confirmed by tasting the commercial, test and micro fermentations.
This could be further refined by controlling for additional environmental variables, such as light,
temperature and filtration in the future.
13.3 Yeast selection Recommendations for yeast were made based upon the results of the micro fermentations.
The yeast strains D-47, K1-V1116 and BM 4x4 were associated with more ripe fruit flavors and creamier
textures.
The yeast strains RC 212 and D80 brought more acidic and fruity flavors to mind
Eastern US Wine and Yeast Study Page 32
Section III 14. Recommendations
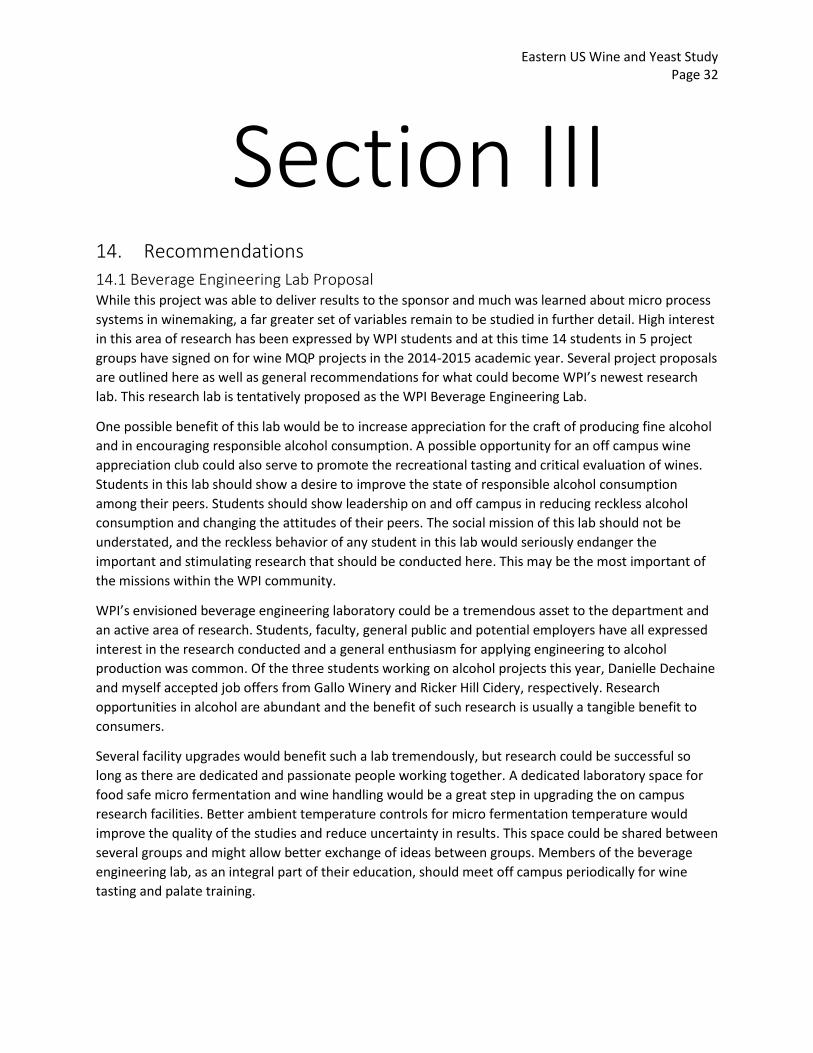
14.1 Beverage Engineering Lab Proposal While this project was able to deliver results to the sponsor and much was learned about micro process
systems in winemaking, a far greater set of variables remain to be studied in further detail. High interest
in this area of research has been expressed by WPI students and at this time 14 students in 5 project
groups have signed on for wine MQP projects in the 2014-2015 academic year. Several project proposals
are outlined here as well as general recommendations for what could become WPI’s newest research
lab. This research lab is tentatively proposed as the WPI Beverage Engineering Lab.
One possible benefit of this lab would be to increase appreciation for the craft of producing fine alcohol
and in encouraging responsible alcohol consumption. A possible opportunity for an off campus wine
appreciation club could also serve to promote the recreational tasting and critical evaluation of wines.
Students in this lab should show a desire to improve the state of responsible alcohol consumption
among their peers. Students should show leadership on and off campus in reducing reckless alcohol
consumption and changing the attitudes of their peers. The social mission of this lab should not be
understated, and the reckless behavior of any student in this lab would seriously endanger the
important and stimulating research that should be conducted here. This may be the most important of
the missions within the WPI community.
WPI’s envisioned beverage engineering laboratory could be a tremendous asset to the department and
an active area of research. Students, faculty, general public and potential employers have all expressed
interest in the research conducted and a general enthusiasm for applying engineering to alcohol
production was common. Of the three students working on alcohol projects this year, Danielle Dechaine
and myself accepted job offers from Gallo Winery and Ricker Hill Cidery, respectively. Research
opportunities in alcohol are abundant and the benefit of such research is usually a tangible benefit to
consumers.
Several facility upgrades would benefit such a lab tremendously, but research could be successful so
long as there are dedicated and passionate people working together. A dedicated laboratory space for
food safe micro fermentation and wine handling would be a great step in upgrading the on campus
research facilities. Better ambient temperature controls for micro fermentation temperature would
improve the quality of the studies and reduce uncertainty in results. This space could be shared between
several groups and might allow better exchange of ideas between groups. Members of the beverage
engineering lab, as an integral part of their education, should meet off campus periodically for wine
tasting and palate training.
Eastern US Wine and Yeast Study Page 33
14.2 Project Topics
Gas Chromatography and Analytic Chemistry A group should be dedicated to analytic chemistry and the analysis of the data produced by it. A new
column for the GC, tentatively identified as the carbowax type, should be purchased to improve the
sensitivity of the GC to the flavor compounds of interest. Analytical tests described by OIV methods
could also be used to study wines
High Performance Liquid Chromatography A group could explore the possibility of using HPLC to measure sugar profiles of wine must and finished
wines to measure sugar content. One barrier for this project is obtaining HPLC time and the training
required to use the technique.
Micro Process Wine The list of process variables of interest in micro vinification are of no end. Zoll cellars has grape vines, so
harvest date and sun exposure on the vine could be a micro study. Fermentation factors that could yield
informative results include changing the pH, temperature, nutrient levels, addition of oak, and skin
contact time. The blending properties, container variation and post fermentation processing are
elements of winemaking finished wine that is an interesting field.
Process Engineering Cider The author of this project is going to work for Ricker Hill Farms in Turner, Maine to design and run a hard
cider process. The first year of operation at the cidery is bound reveal problems in production that
students may be interested in solving as a project. Challenges to this project are physical distance to the
project site and the undetermined nature of the project. The candidate sponsor has expressed interest
in hosting a project. This project may be considered more suitable for students with an interest in plant
startup or process troubleshooting, skills that are highly valued by employers in an increasingly
competitive labor market
Sensory and Analytical Testing Survey One of the more interesting aspects of this project was the tasting evaluation. For students with a strong
interest in winemaking as a profession a trained palate is critical. Developing methods to evaluate wine
character using the literature and analytical chemistry methods would benefit other groups in the
beverage engineering lab by giving them a tool to evaluate their creations.
Home Brewing Design Students may wish to broaden the audience of brewers by designing home brewing setups and
popularizing the craft among the general campus community. Outreach and popularization of home
brewing could be an important goal of this project. Recipe design, cost analysis and marketing strategies
would be primary design goals.

Eastern US Wine and Yeast Study Page 34
15. Works Cited In alphabetical order by author last name.
2013. Statistical Report - Wine, Reporting Period: January 2012 - December 2012. In: DEPARTMENT OF
THE TREASURY, A. A. T. T. A. T. B. (ed.).
2014. §9.72 Southeastern New England. In: ALCOHOL, T. A. F. (ed.) Title 27: Alcohol, Tobacco and
Firearms; PART 9—AMERICAN VITICULTURAL AREAS; Subpart C—Approved American Viticultural Areas.
USDA. October 2013. Progress Report: Improved grape and wine quality in a challenging environment:
An eastern US model for sustainability and economic vitality. Grape & Wine Quality Eastern U.S.
Initiative.
BETTINI, O. & SLOOP, C. 2013. Wine Annual Report and Statistics. GAIN Report. IT1307 ed.
COELHO, E., ROCHA, S. M., DELGADILLO, I. & COIMBRA, M. A. 2006. Headspace-SPME applied to varietal
volatile components evolution during Vitis vinifera L. cv. ‘Baga’ ripening. Analytica Chimica Acta, 563,
204-214.
CORDENTE, A. G., CURTIN, C. D., VARELA, C. & PRETORIUS, I. S. 2012. Flavour-active wine yeasts. Applied
Microbiology and Biotechnology, 96, 601-618.
FLEET, G. H. 2003. Yeast interactions and wine flavour. International Journal of Food Microbiology, 11-
22.
GONZÁLEZ ÁLVAREZ, M., GONZÁLEZ-BARREIRO, C., CANCHO-GRANDE, B. & SIMAL-GÁNDARA, J. 2011.
Relationships between Godello white wine sensory properties and its aromatic fingerprinting obtained
by GC–MS. Food Chemistry, 129, 890-898.
HINMAN, J. & STEINTHAL, D. 2005. Perfect Storm Forming: U.S. wine market liberalization by 2015.
Practical Winery & Vineyard Magazine.
KAISER, R., SPRINGERLINK (ONLINE SERVICE) & SPRINGERLINK EBOOKS - CHEMISTRY AND MATERIALS
SCIENCE (ARCHIVE) 1995. Gas Phase Chromatography
Volume I Gas Chromatography. Boston, MA: Springer US,.
LÓPEZ, R., AZNAR, M., CACHO, J. & FERREIRA, V. 2002. Determination of minor and trace volatile
compounds in wine by solid-phase extraction and gas chromatography with mass spectrometric
detection. Journal of Chromatography A, 966, 167-177.
NYKÄNEN, L. 1985. Formation and occurrence of flavor compounds in alcoholic beverages. American
Journal of Eneology and Viticulture, 37, 84-96.
ORTEGA, C., LÓPEZ, R., CACHO, J. & FERREIRA, V. 2001. Fast analysis of important wine volatile
compounds: Development and validation of a new method based on gas chromatographic–flame
ionisation detection analysis of dichloromethane microextracts. Journal of Chromatography A, 923, 205-
214.
Eastern US Wine and Yeast Study Page 35
ORTIZ‐MUÑIZ, B., CARVAJAL‐ZARRABAL, O., TORRESTIANA‐SANCHEZ, B. & AGUILAR‐USCANGA, M. G.
2010. Kinetic study on ethanol production using Saccharomyces cerevisiae ITV‐01 yeast isolated from
sugar cane molasses. Journal of Chemical Technology & Biotechnology, 85, 1361-1367.
RODRIGUEZ-NOGALES, J. M., FERNANDEZ-FERNANDEZ, E. & VILA-CRESPO, J. 2009. Characterisation and
classification of Spanish Verdejo young white wines by volatile and sensory analysis with chemometric
tools. JOURNAL OF THE SCIENCE OF FOOD AND AGRICULTURE, 89, 1927-1935.
ROLAND, A., SCHNEIDER, R., RAZUNGLES, A. & CAVELIER, F. 2011. Varietal thiols in wine: discovery,
analysis and applications. Chemical reviews, 111, 7355-7376.
ROMANO, P., FIORE, C., PARAGGIO, M., CARUSO, M. & CAPECE, A. 2003. Function of yeast species and
strains in wine flavour. International journal of food microbiology, 86, 169-180.
ROMANO, P., MONTELEONE, E., PARAGGIO, M., MARCHESE, R., CAPORALE, G. & CARLUCCI, A. 1998. A
methodological approach to the selection of Saccharomyces cerevisiae wine strains. FOOD
TECHNOLOGY AND BIOTECHNOLOGY, 36, 69-74.
SKOOG, D. A., HOLLER, F. J. & NIEMAN, T. A. 1998. Principles of instrumental analysis, Philadelphia
Orlando, Fla., Saunders College Pub. Harcourt Brace College Publishers.
TORRENS, J., RIU-AUMATELL, M., LÓPEZ-TAMAMES, E. & BUXADERAS, S. 2004. Volatile Compounds of
Red and White Wines by Headspace - Solid-Phase Microextraction Using Different Fibers. Journal of
Chromatographic Science, 42, 310-310.
TORRENS, J., URPÍ, P., RIU-AUMATELL, M., VICHI, S., LÓPEZ-TAMAMES, E. & BUXADERAS, S. 2008.
Different commercial yeast strains affecting the volatile and sensory profile of cava base wine.
International Journal of Food Microbiology, 124, 48-57.
VILANOVA, M., CAMPO, E., ESCUDERO, A., GRAÑA, M., MASA, A. & CACHO, J. 2012. Volatile composition
and sensory properties of Vitis vinifera red cultivars from North West Spain: Correlation between
sensory and instrumental analysis. Analytica Chimica Acta, 720, 104-111.
VILLEN, J., SEIIORANS, F. J., REGLERO, G. & HERRAIZ, M. 1995, 43, 71 7-722. Analysis of Wine Aroma by
Direct Injection in Gas Chromatography without Previous Extraction. Journal of Agricultural and Food
Chemistry, 43, 717-722.