Embed Size (px)
Citation preview
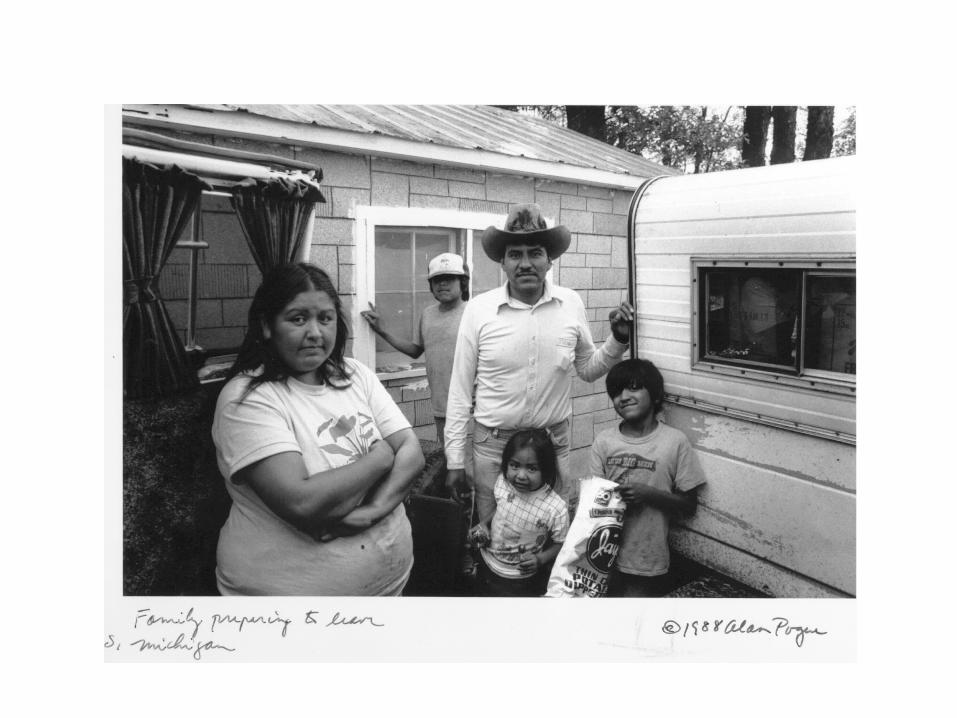
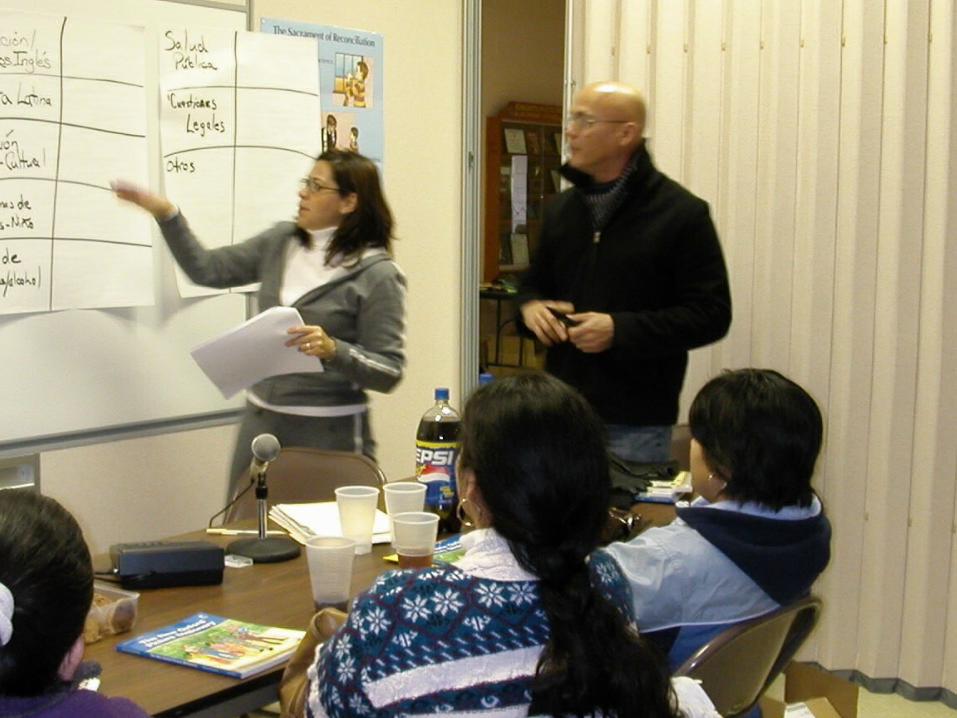
Eastern Shore Meeting of the Task Force to Study Driver Licensing
Documentation Agenda
June 28, 2004
Welcome—Delegate D. Page ElmoreWords from the Task Force Chairman
—Geoffrey S. TobiasBienvenidos Overview—Amy K.
LiebmanEastern Shore Needs Assessment—
Tim DunnInvited Testimony
Changing Face of Delmarva
Tim Dunn, Ph.D. Assistant Professor of Sociology
Amy K. Liebman, MPABEACON ConsultantSalisbury University
June 28, 2004
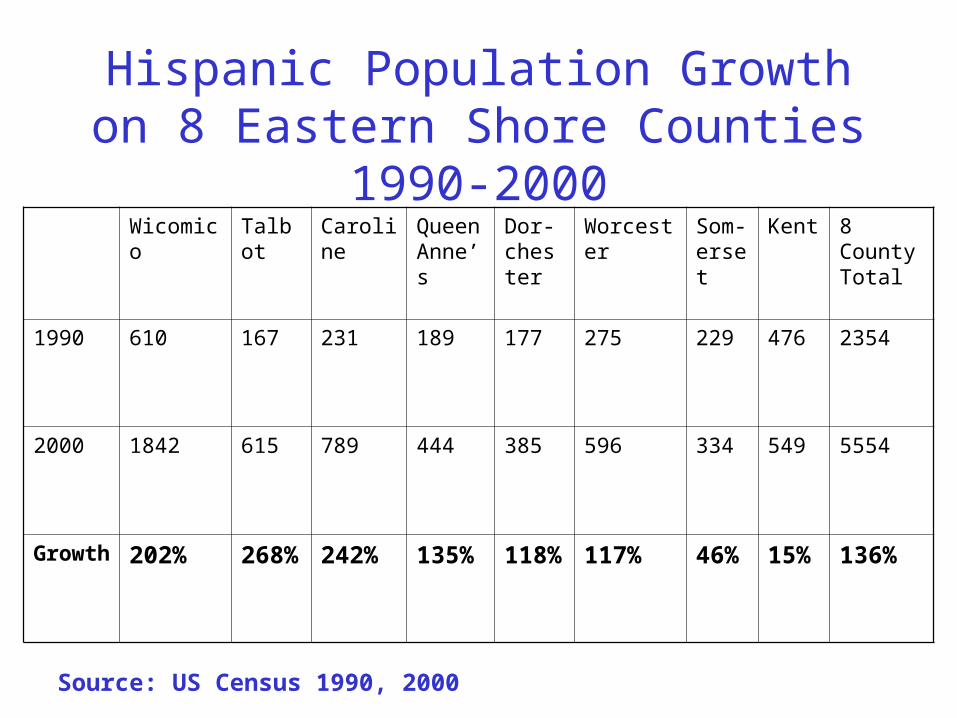
Hispanic Population Growth on 8 Eastern Shore Counties 1990-
2000Wicomico Talbot Caroline Queen
Anne’sDor-chester
Worcester Som-erset
Kent 8 County Total
1990 610 167 231 189 177 275 229 476 2354
2000 1842 615 789 444 385 596 334 549 5554
Growth 202% 268% 242% 135% 118% 117% 46% 15% 136%
Source: US Census 1990, 2000
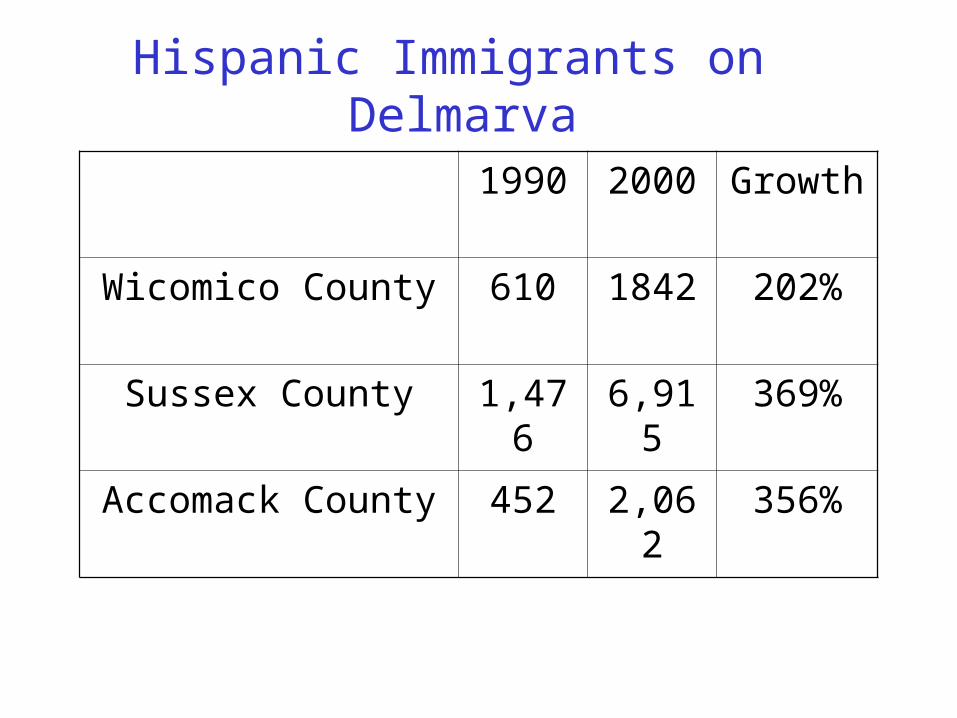
Hispanic Immigrants on Delmarva
1990 2000 Growth
Wicomico County 610 1842 202%
Sussex County 1,476 6,915 369%
Accomack County 452 2,062 356%
BIENVENIDOS A DELMARVA
Network of over 70 service providing organizations on the Delmarva Peninsula preparing to meet the needs of our immigrant communities
Housed at BEACON of Salisbury University—http://beacon.salisbury.edu/
ActivitiesMeet Monthly to
oExchange InformationoDiscuss Problems and NeedsoWork on Solutions
Raise AwarenessConduct OutreachConduct ResearchFacilitate Training
oCultural Competency
Needs AssessmentAssessed the needs and service
gaps among Hispanic immigrants on Maryland’s Eastern Shore to to improve the provision of services to this population and to reduce barriers to these services
Funded by Eastern Shore Regional Library
Conducted by BEACON, Salisbury University and Horizon Marketing
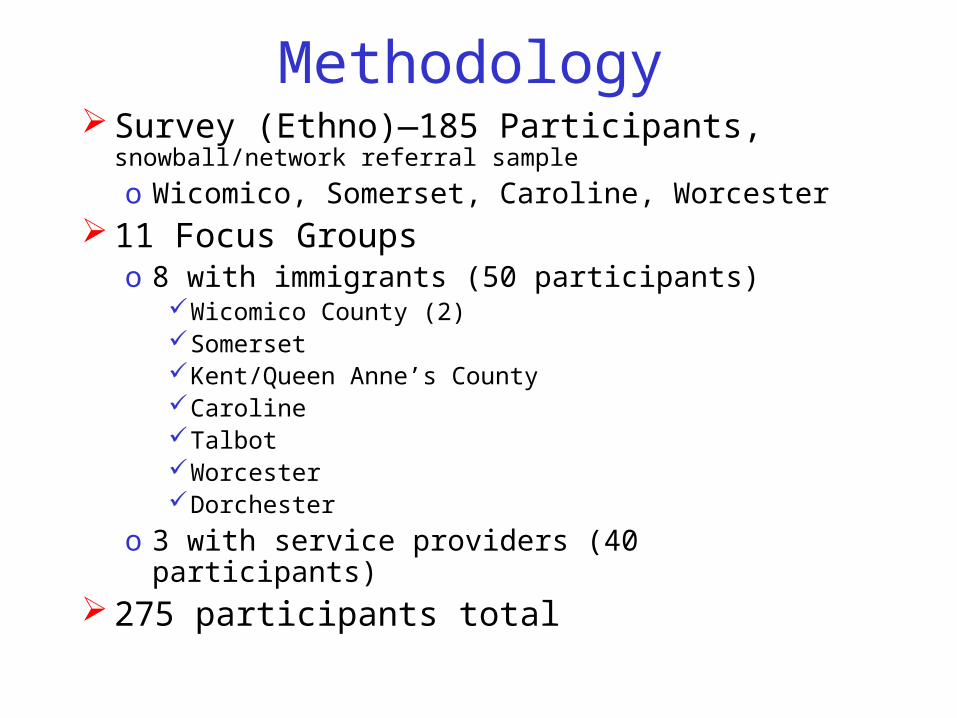
Methodology Survey (Ethno)—185 Participants,
snowball/network referral sample
o Wicomico, Somerset, Caroline, Worcester 11 Focus Groups
o 8 with immigrants (50 participants)Wicomico County (2)SomersetKent/Queen Anne’s CountyCarolineTalbotWorcesterDorchester
o 3 with service providers (40 participants) 275 participants total
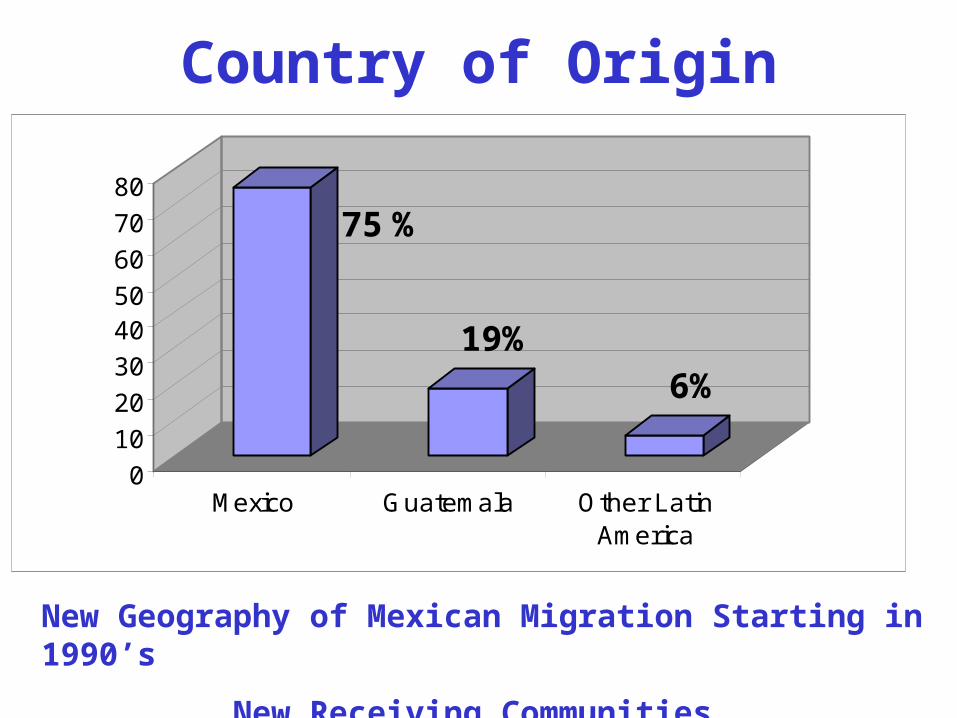
Country of Origin
75 %
19%6%
0
10
20
30
4050
60
70
80
Mexico Guatemala Other LatinAmerica
New Geography of Mexican Migration Starting in 1990’s
New Receiving Communities
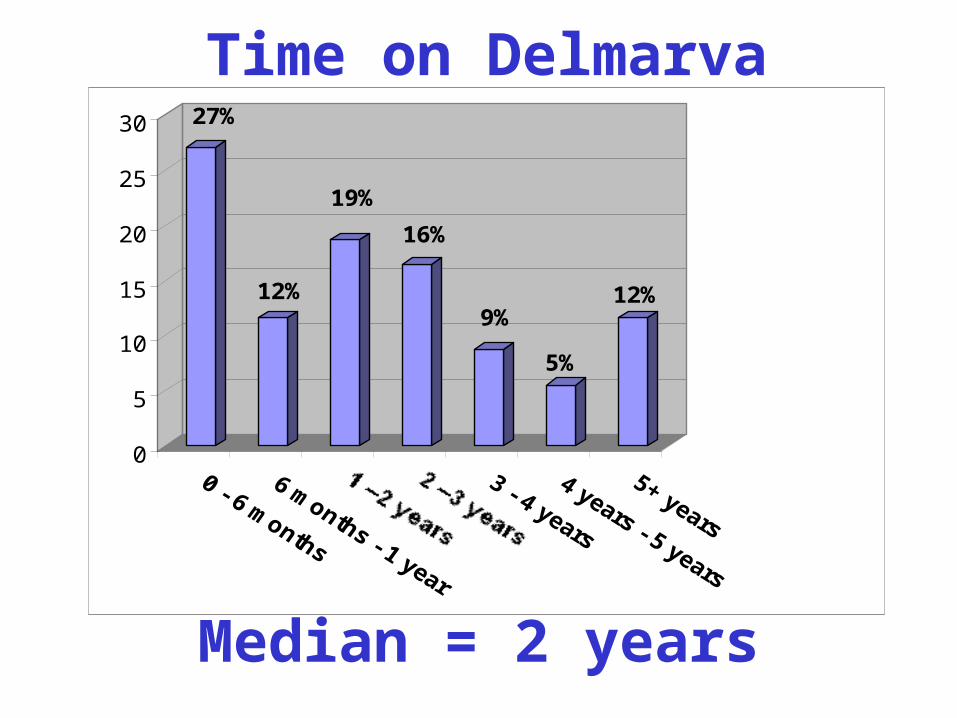
Time on Delmarva27%
12%
19%
16%
9%
5%
12%
0
5
10
15
20
25
30
Median = 2 years
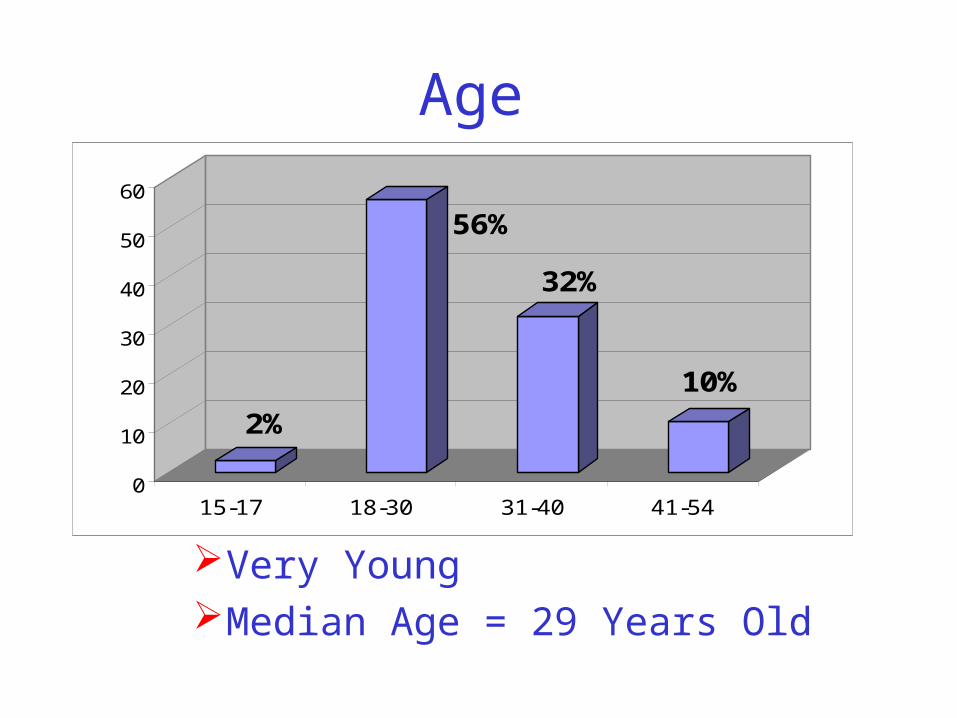
Age
Very Young Median Age = 29 Years Old
2%
56%
32%
10%
0
10
20
30
40
50
60
15-17 18-30 31-40 41-54
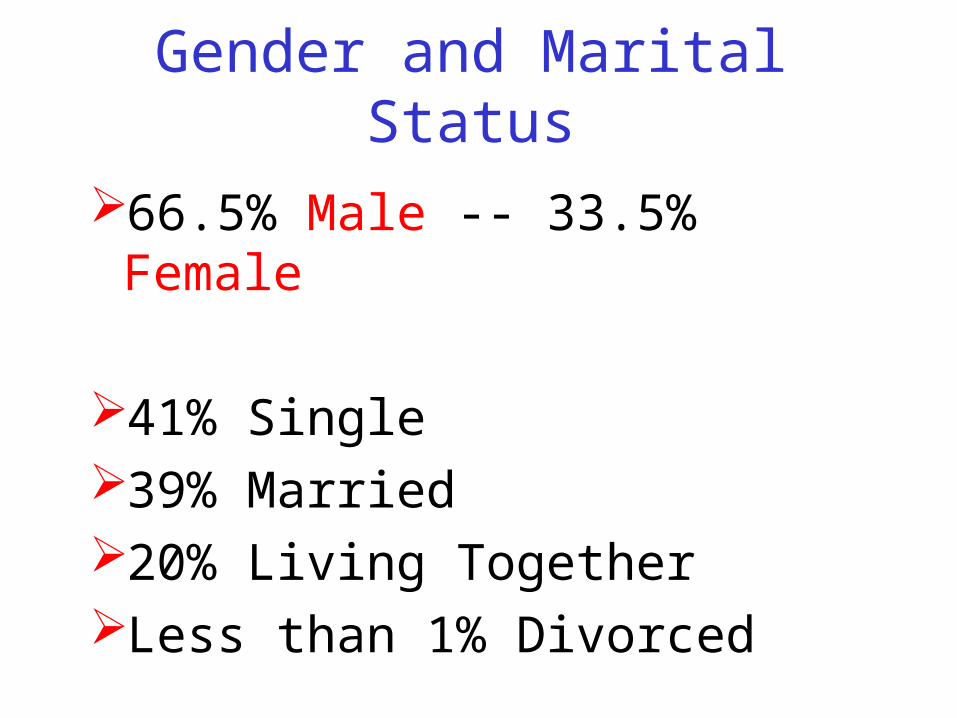
Gender and Marital Status
66.5% Male -- 33.5% Female
41% Single39% Married20% Living TogetherLess than 1% Divorced
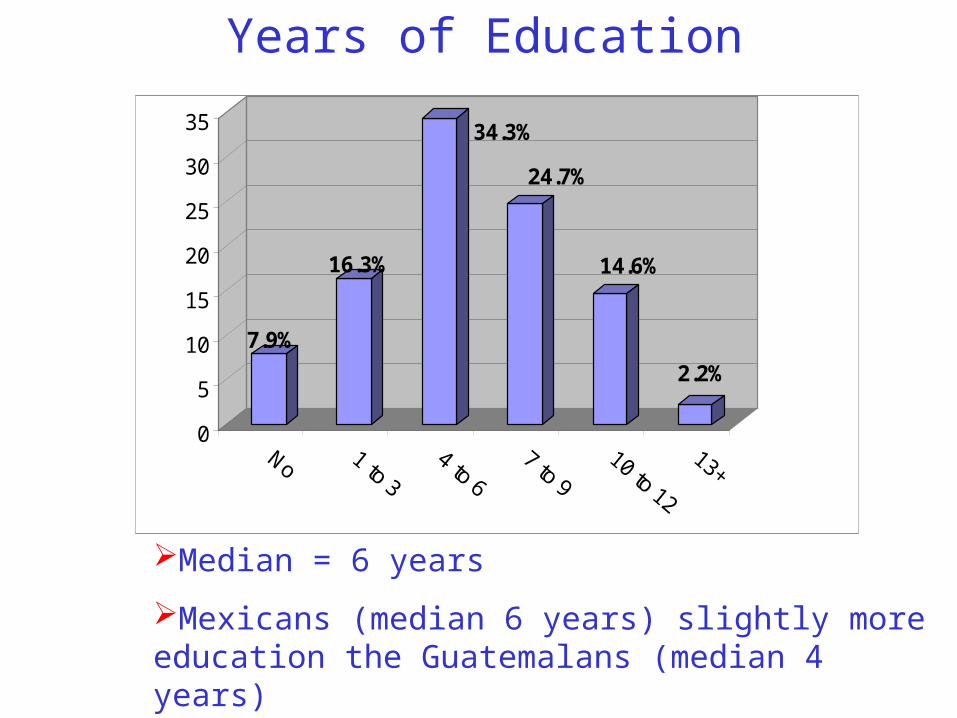
7.9%
16.3%
34.3%
24.7%
14.6%
2.2%
0
5
10
15
20
25
30
35
Years of Education
Median = 6 years
Mexicans (median 6 years) slightly more education the Guatemalans (median 4 years)
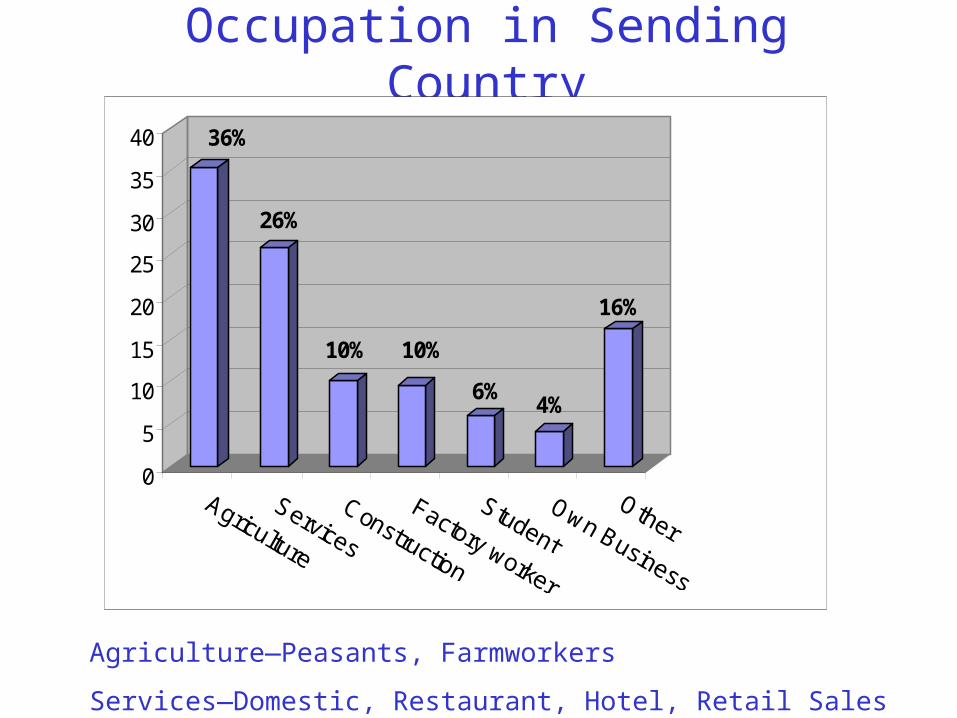
Occupation in Sending Country
Agriculture—Peasants, Farmworkers
Services—Domestic, Restaurant, Hotel, Retail Sales
36%
26%
10% 10%
6%4%
16%
0
5
10
15
20
25
30
35
40
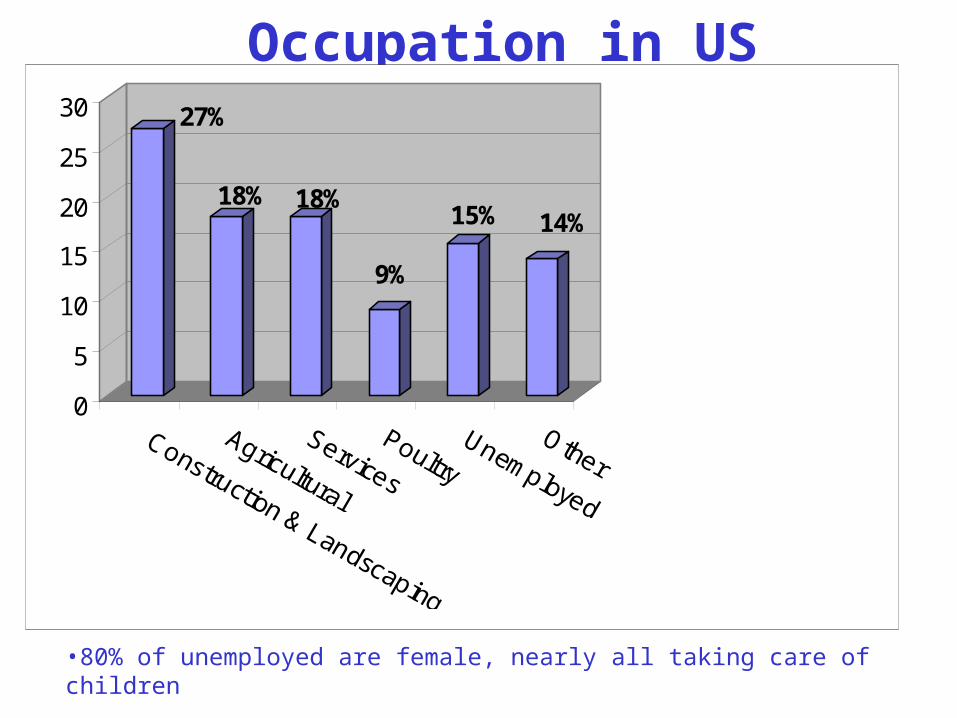
Occupation in US27%
18% 18%
9%
15% 14%
0
5
10
15
20
25
30
•80% of unemployed are female, nearly all taking care of children
•Services = Restaurant, Hotel, Domestic, Maintenance
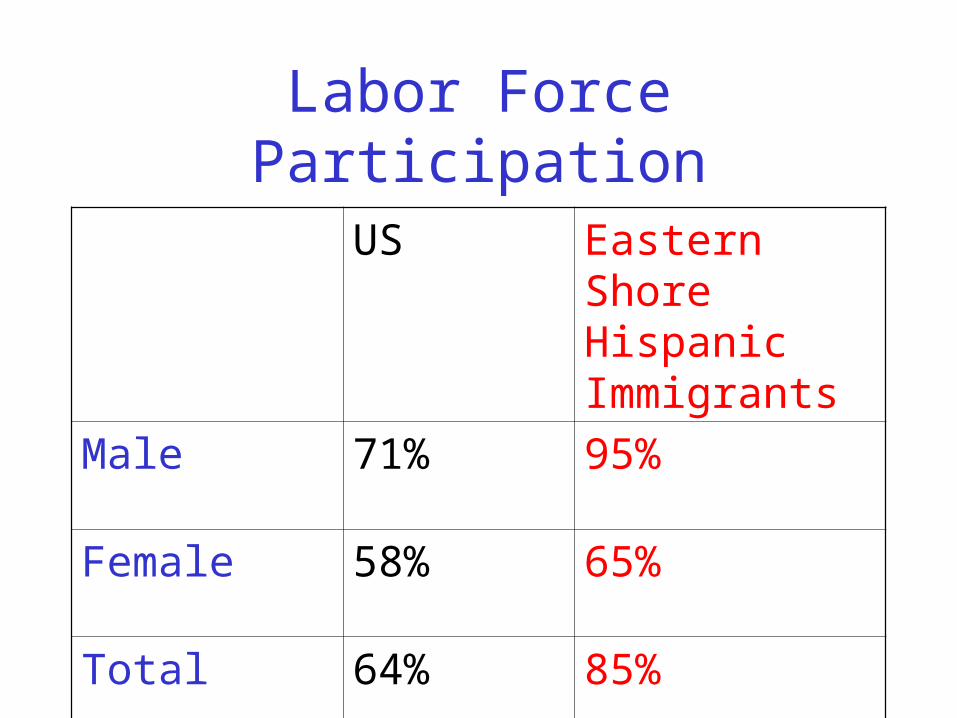
Labor Force Participation
US Eastern Shore Hispanic Immigrants
Male 71% 95%
Female 58% 65%
Total 64% 85%
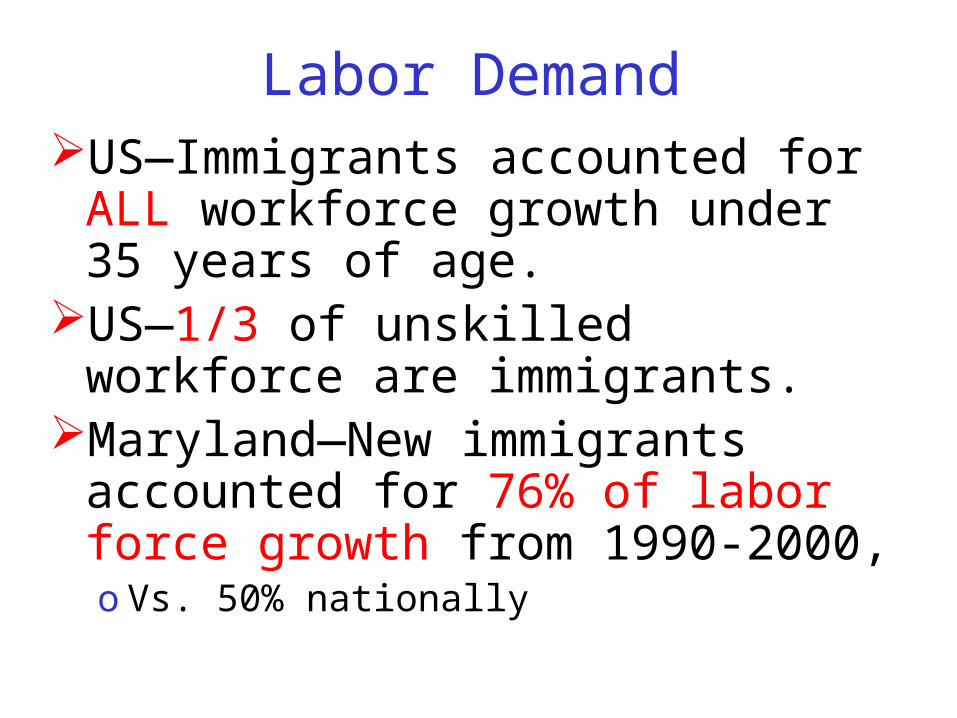
Labor DemandUS—Immigrants accounted for
ALL workforce growth under 35 years of age.
US—1/3 of unskilled workforce are immigrants.
Maryland—New immigrants accounted for 76% of labor force growth from 1990-2000, o Vs. 50% nationally
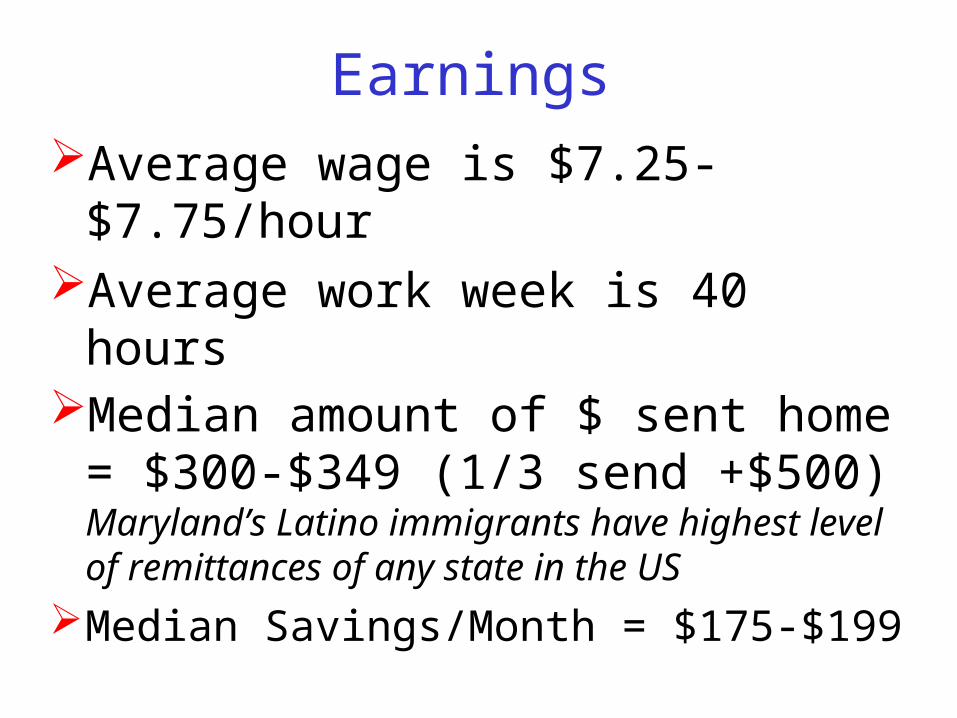
EarningsAverage wage is
$7.25-$7.75/hour Average work week is 40 hoursMedian amount of $ sent home =
$300-$349 (1/3 send +$500) Maryland’s Latino immigrants have highest level of remittances of any state in the US
Median Savings/Month = $175-$199
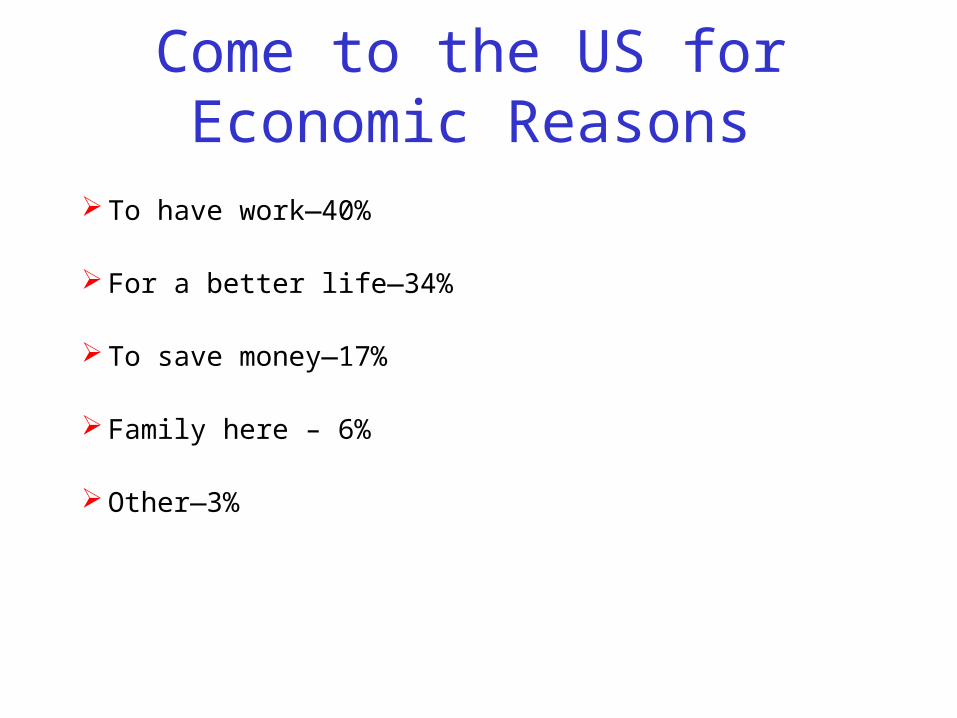
Come to the US for Economic Reasons
To have work—40%
For a better life—34%
To save money—17%
Family here – 6%
Other—3%
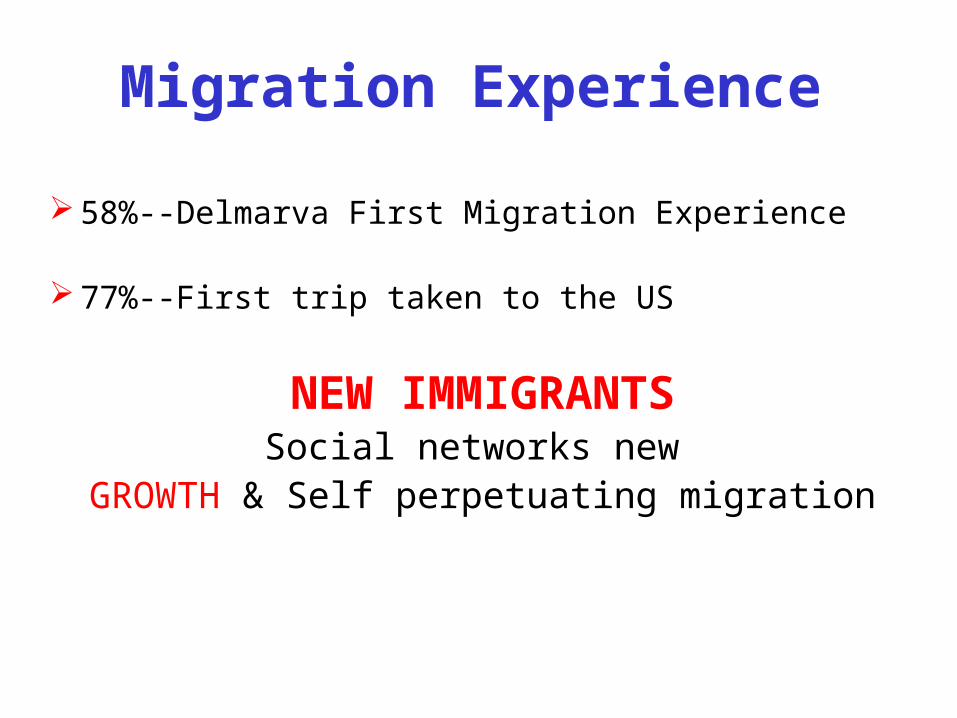
Migration Experience
58%--Delmarva First Migration Experience
77%--First trip taken to the US
NEW IMMIGRANTSSocial networks new
GROWTH & Self perpetuating migration
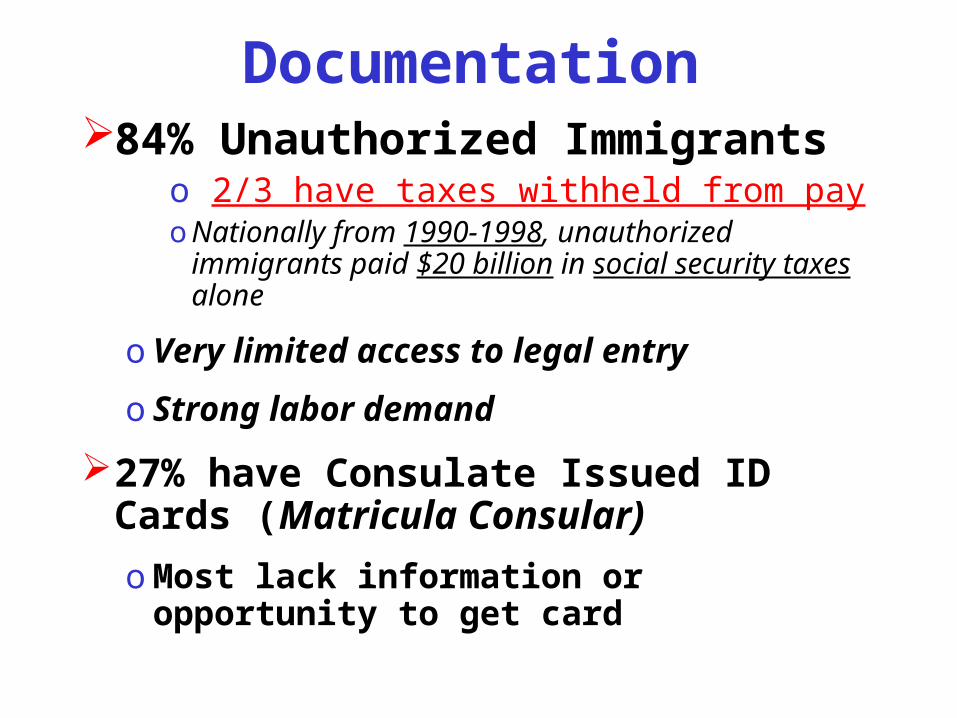
Documentation84% Unauthorized Immigrants
o 2/3 have taxes withheld from payo Nationally from 1990-1998, unauthorized immigrants
paid $20 billion in social security taxes alone
o Very limited access to legal entry
o Strong labor demand
27% have Consulate Issued ID Cards (Matricula Consular)
o Most lack information or opportunity to get card
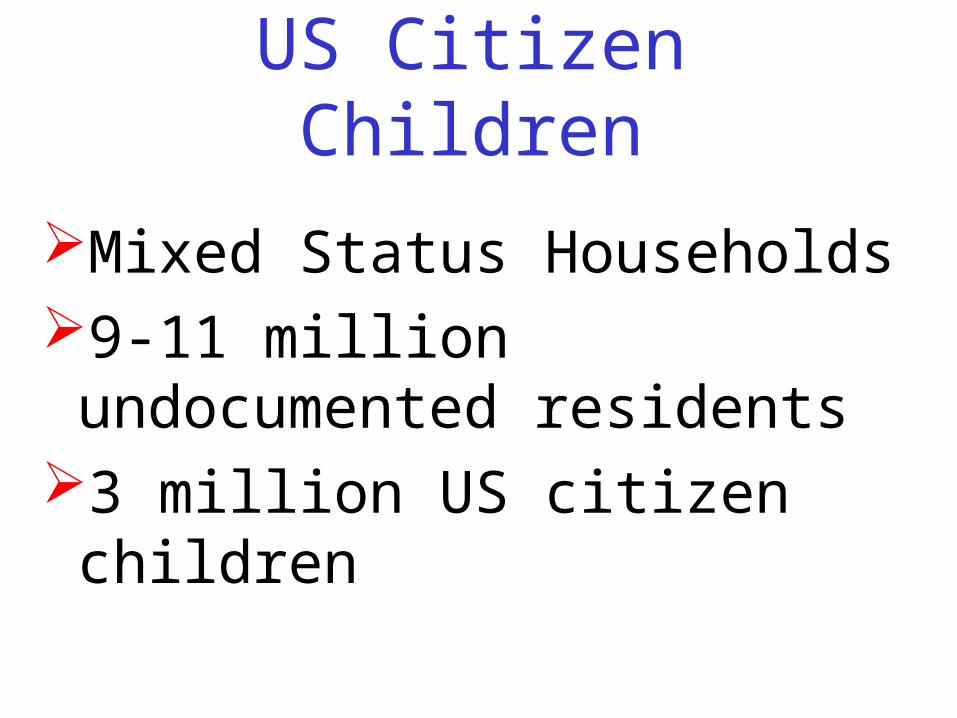
US Citizen Children
Mixed Status Households9-11 million undocumented residents
3 million US citizen children

Future Plans
Plan to be in same town/city in 3 yearso 57% plan to remaino Unusually high
Return to country of origin in 3 yearso 42% plan to move back
Plan to Stay
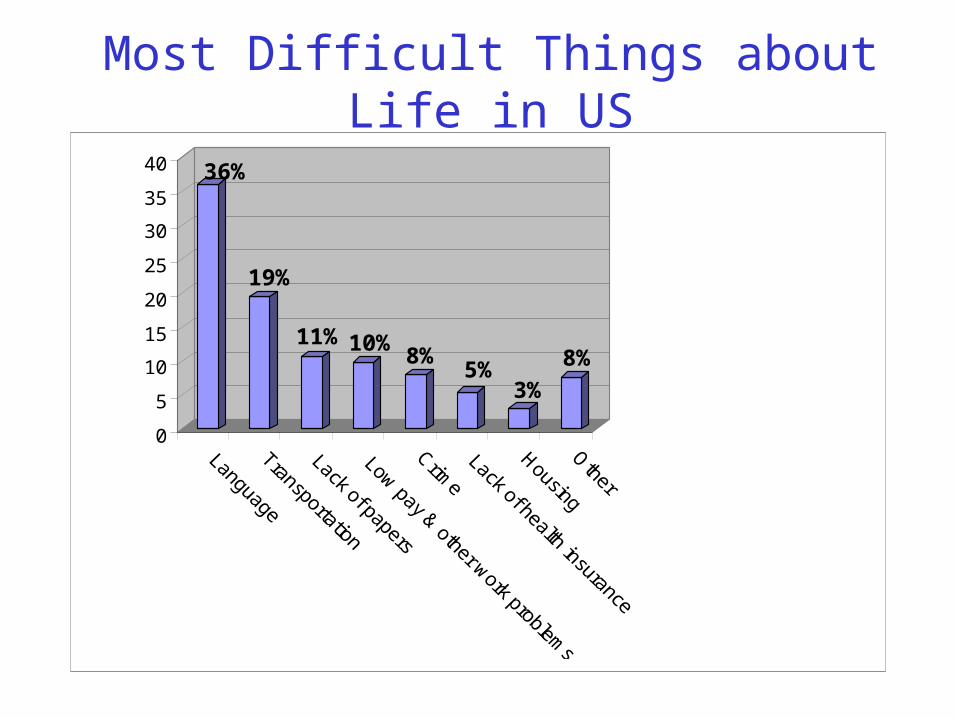
Most Difficult Things about Life in US
36%
19%
11% 10%8%
5%3%
8%
0
5
10
15
20
25
30
35
40
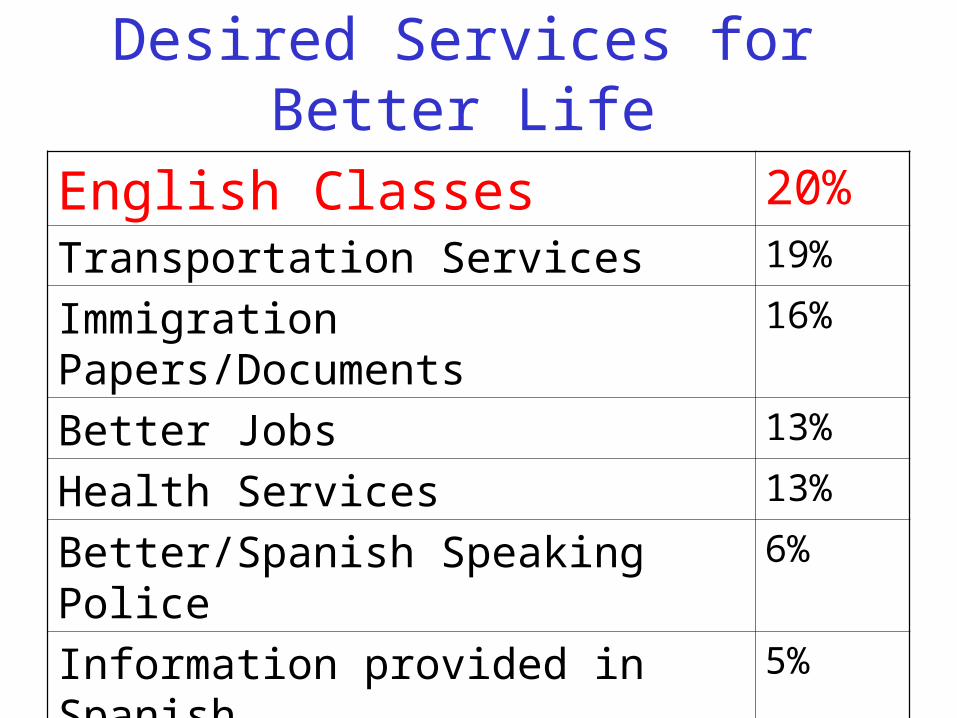
Desired Services for Better Life
English Classes 20%Transportation Services 19%
Immigration Papers/Documents 16%
Better Jobs 13%
Health Services 13%
Better/Spanish Speaking Police 6%
Information provided in Spanish 5%
Other 8%
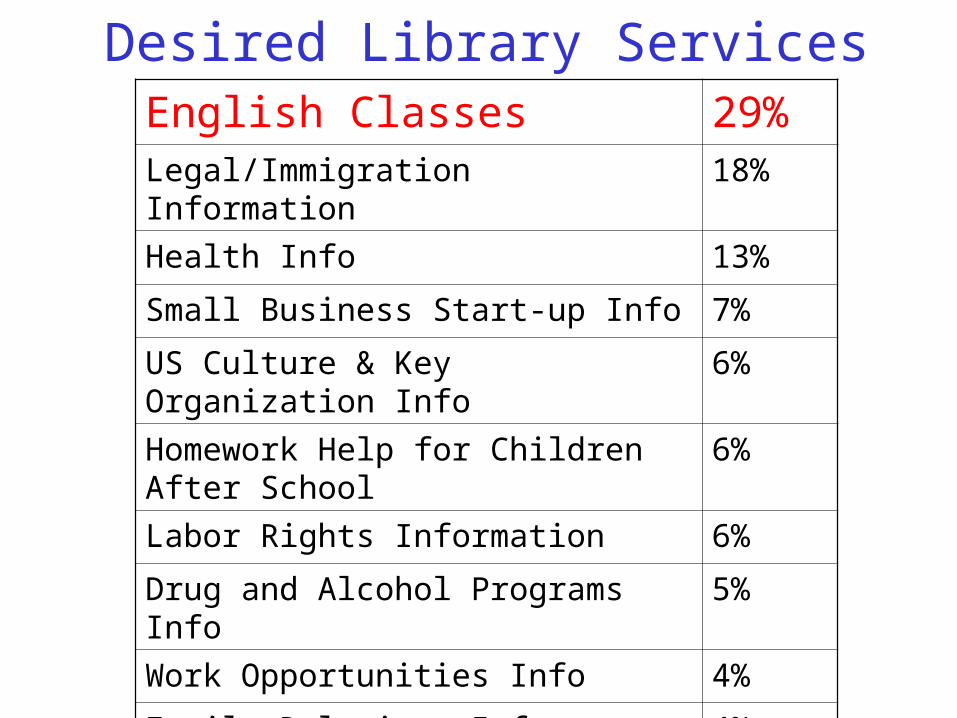
Desired Library ServicesEnglish Classes 29%Legal/Immigration Information 18%
Health Info 13%
Small Business Start-up Info 7%
US Culture & Key Organization Info
6%
Homework Help for Children After School
6%
Labor Rights Information 6%
Drug and Alcohol Programs Info 5%
Work Opportunities Info 4%
Family Relations Info 4%
Housing Info 2%
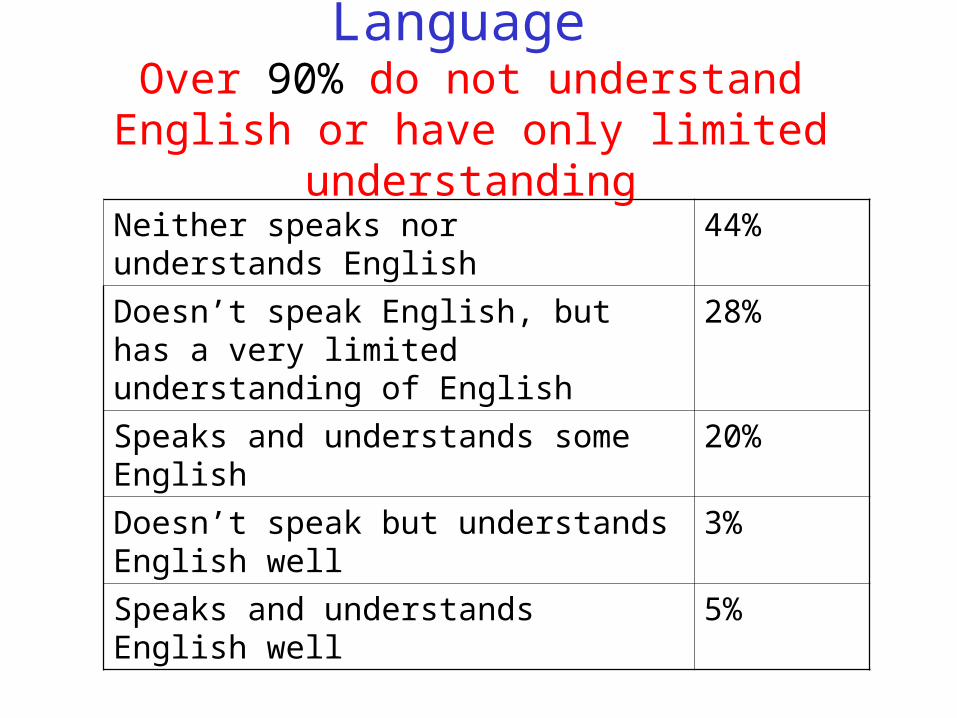
Language Over 90% do not understand English or have only limited understanding
Neither speaks nor understands English
44%
Doesn’t speak English, but has a very limited understanding of English
28%
Speaks and understands some English
20%
Doesn’t speak but understands English well
3%
Speaks and understands English well
5%
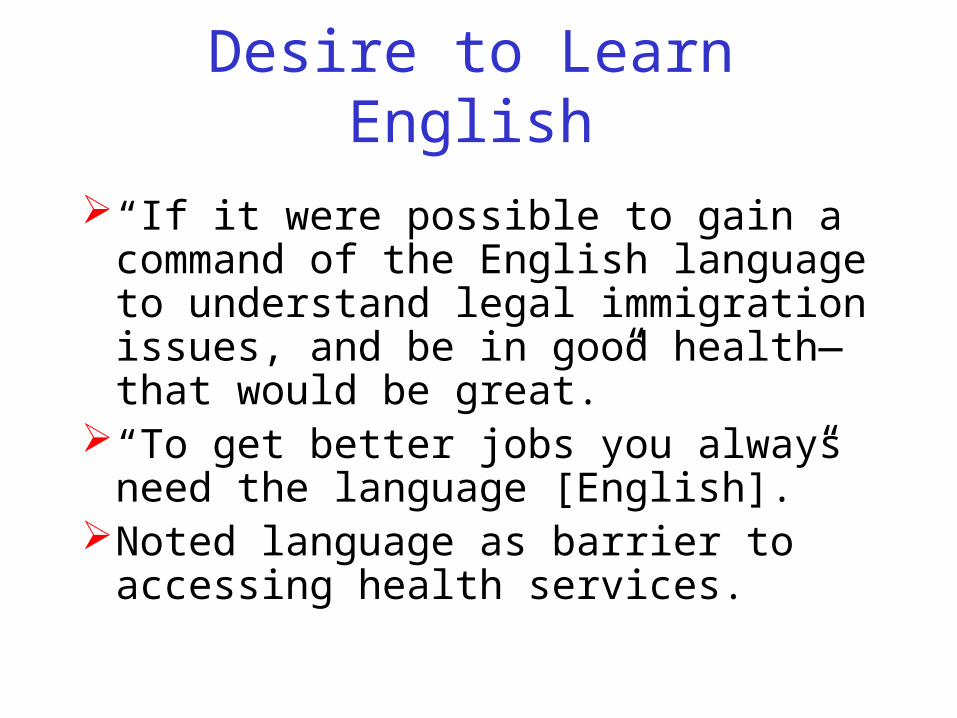
Desire to Learn English
“If it were possible to gain a command of the English language to understand legal immigration issues, and be in good health—that would be great.”
“To get better jobs you always need the language [English].”
Noted language as barrier to accessing health services.
LanguageTypical learning cycle for non-
English speaking immigrants in the US is 3 generationso1st generation learns enough to
get byo2nd generation is bilingualo3rd generation monolingual
English
TransportationFocus group participants noted:
lack of transportation as barrier to accessing services.
risks of driving a car. Drive only when it is essential—work, food. Can’t legally obtain a driver’s license if undocumented.
public transportation limited.poor treatment by bus drivers.racial tension between riders and
drivers.
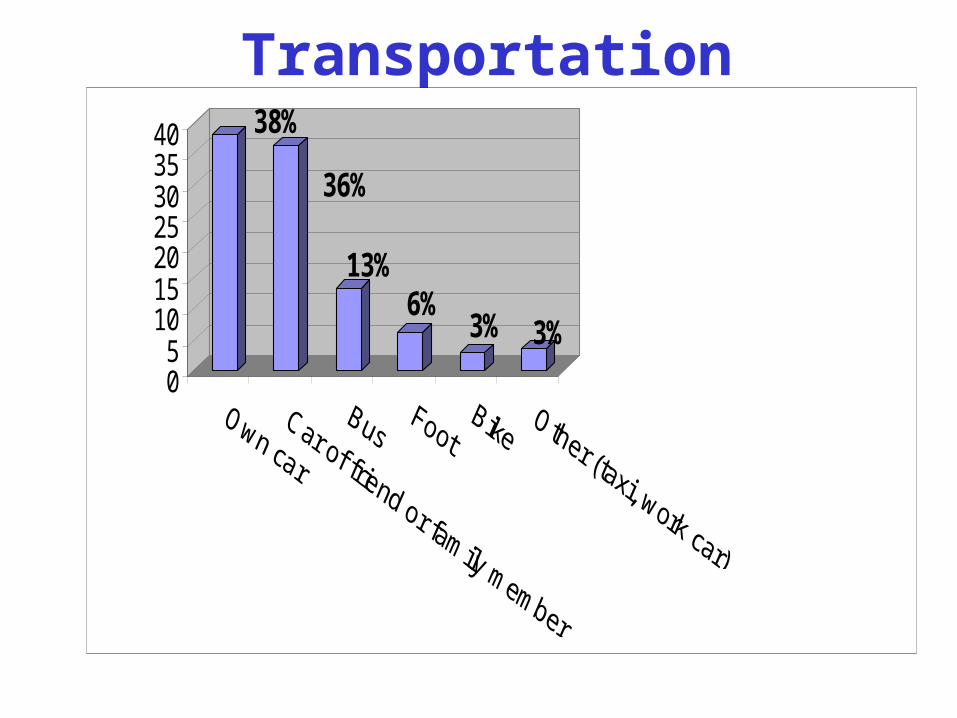
Transportation38%
36%
13%6%
3% 3%
05
10152025303540
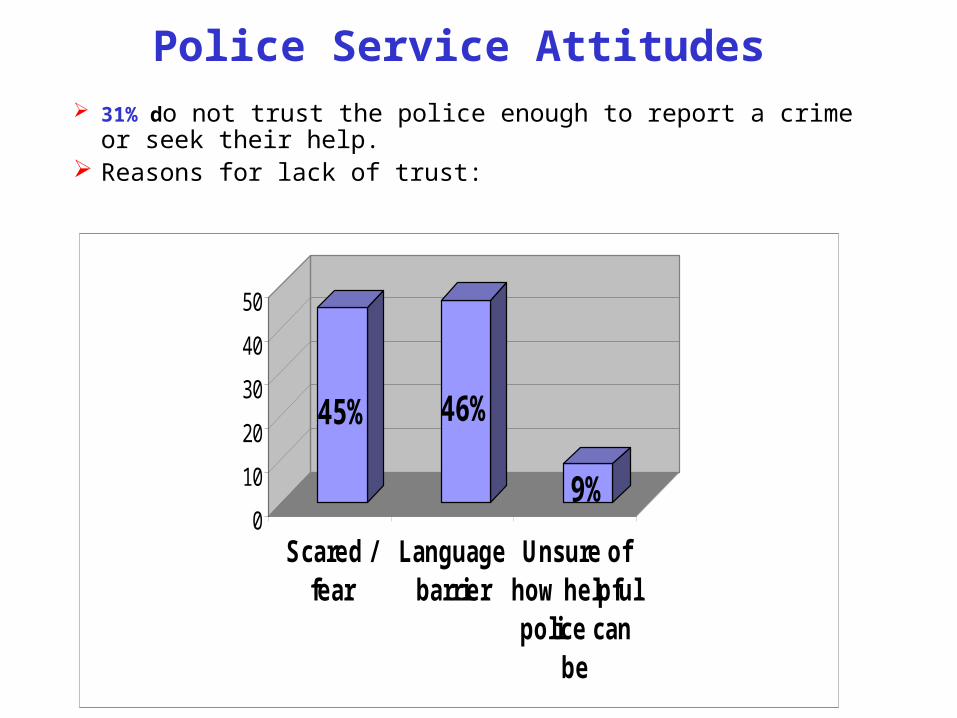
Police Service Attitudes 31% do not trust the police enough to report a crime or seek
their help. Reasons for lack of trust:
45% 46%
9%0
10
20
30
40
50
Scared /fear
Languagebarrier
Unsure ofhow helpfulpolice can
be
Victims of CrimeEvery focus group mentioned tensions
between African-Americans and immigrants
Immigrants are easy targetso Languageo A lot of CASH o Can’t open bank accounts b/c of lack of
documentation (banks now accepting matricula consular identification cards)
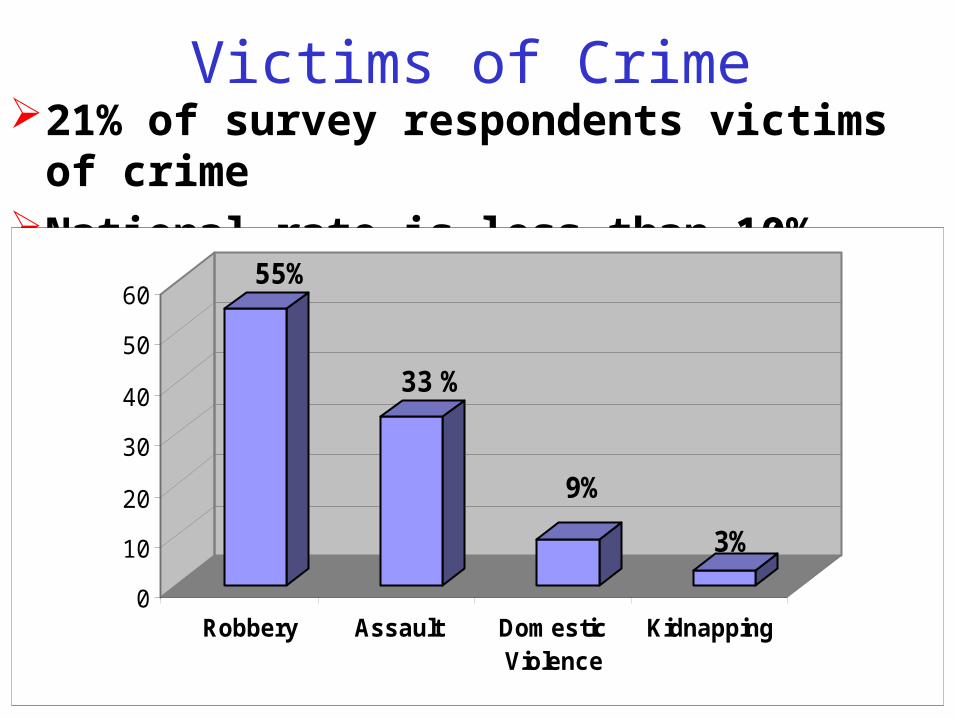
Victims of Crime21% of survey respondents victims of crimeNational rate is less than 10%
55%
33 %
9%
3%
0
10
20
30
40
50
60
Robbery Assault DomesticViolence
Kidnapping
Employment HardshipBecause they are undocumented,
feel vulnerable at work:o“If you’re illegal, you can’t do
anything; otherwise they’ll call the ‘migra.’”
Risk of deportation too great to seek redress:o“One comes to this country to work,
not to look for problems.”
Housing Median Number of People per
Household = 6o 15% live in households with 10-16
peopleAverage Number of People per
Household in Maryland 2.6Median Number of People per
Bedroom = 2.6
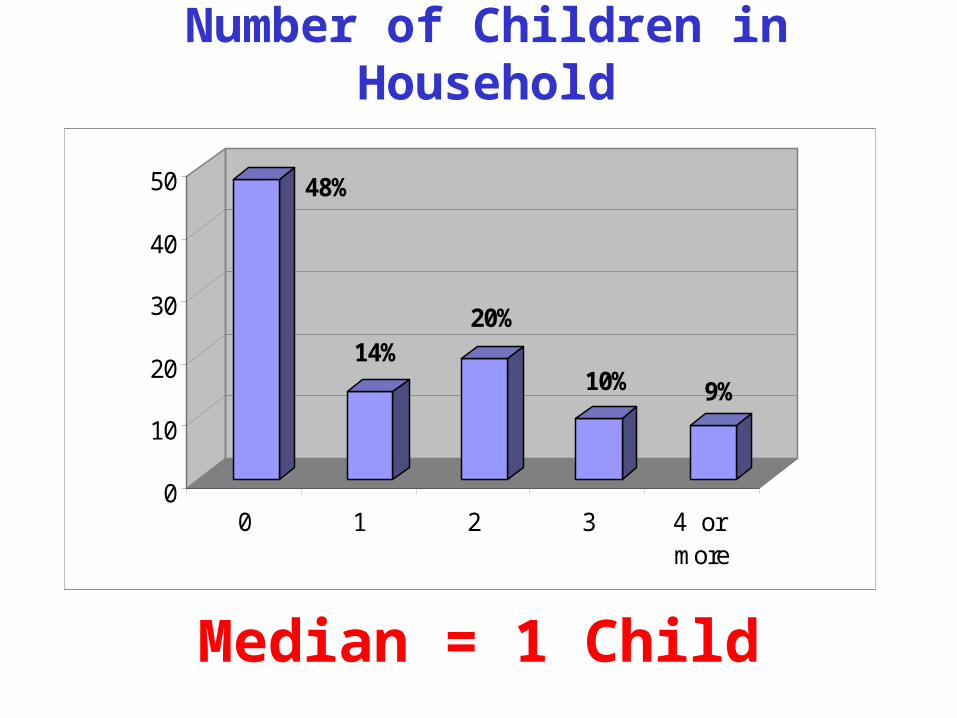
Number of Children in Household
Median = 1 Child
48%
14%20%
10% 9%
0
10
20
30
40
50
0 1 2 3 4 or more
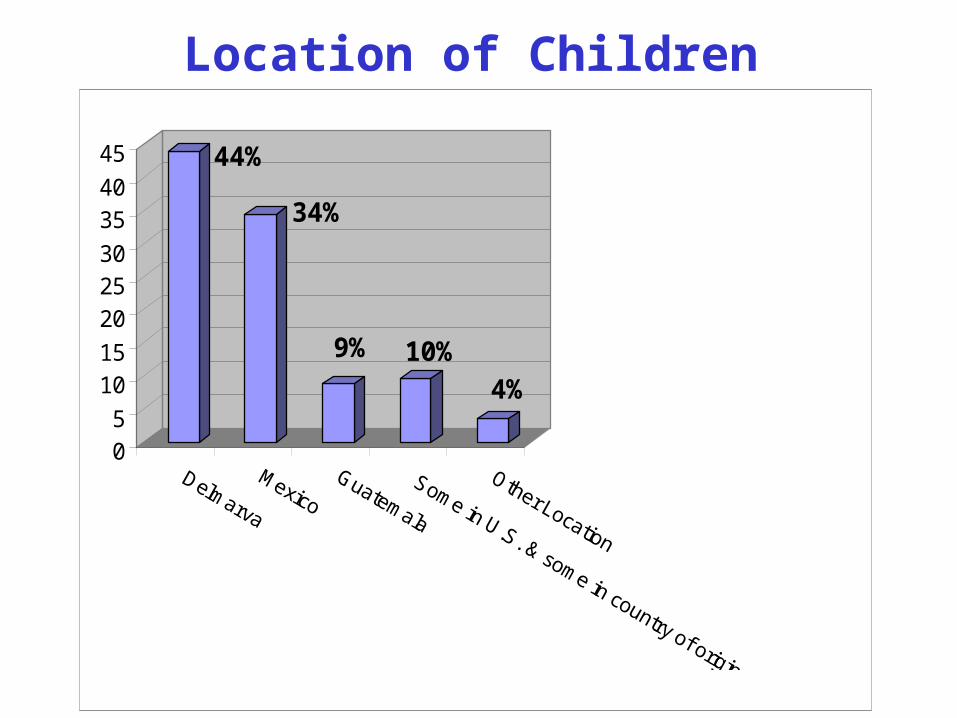
Location of Children
44%
34%
9% 10%4%
05
1015
202530
3540
45
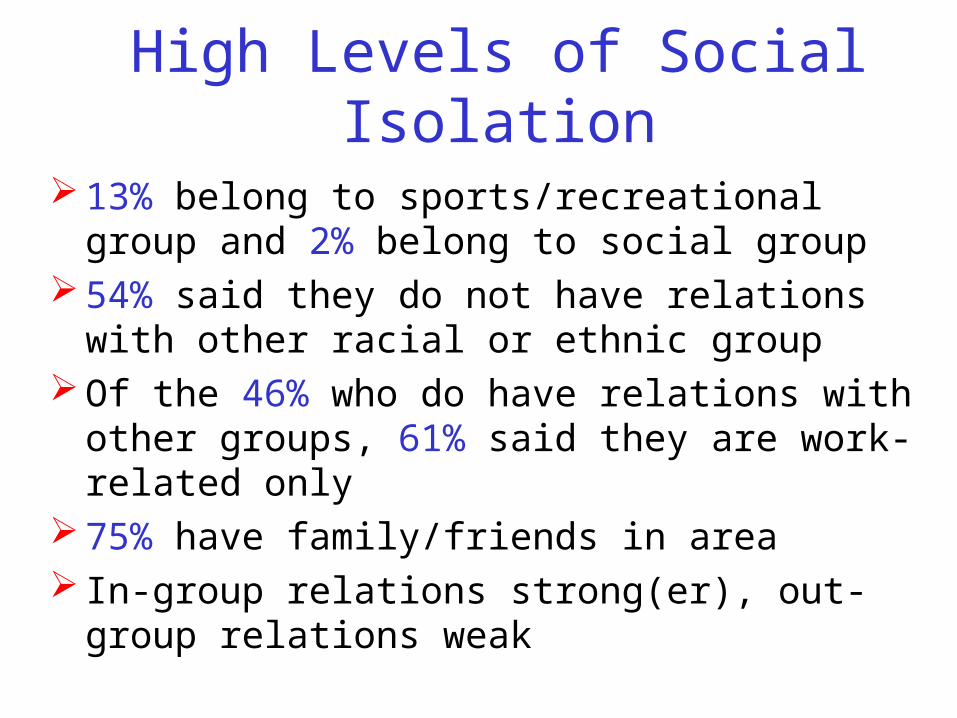
High Levels of Social Isolation
13% belong to sports/recreational group and 2% belong to social group
54% said they do not have relations with other racial or ethnic group
Of the 46% who do have relations with other groups, 61% said they are work-related only
75% have family/friends in area In-group relations strong(er), out-group
relations weak
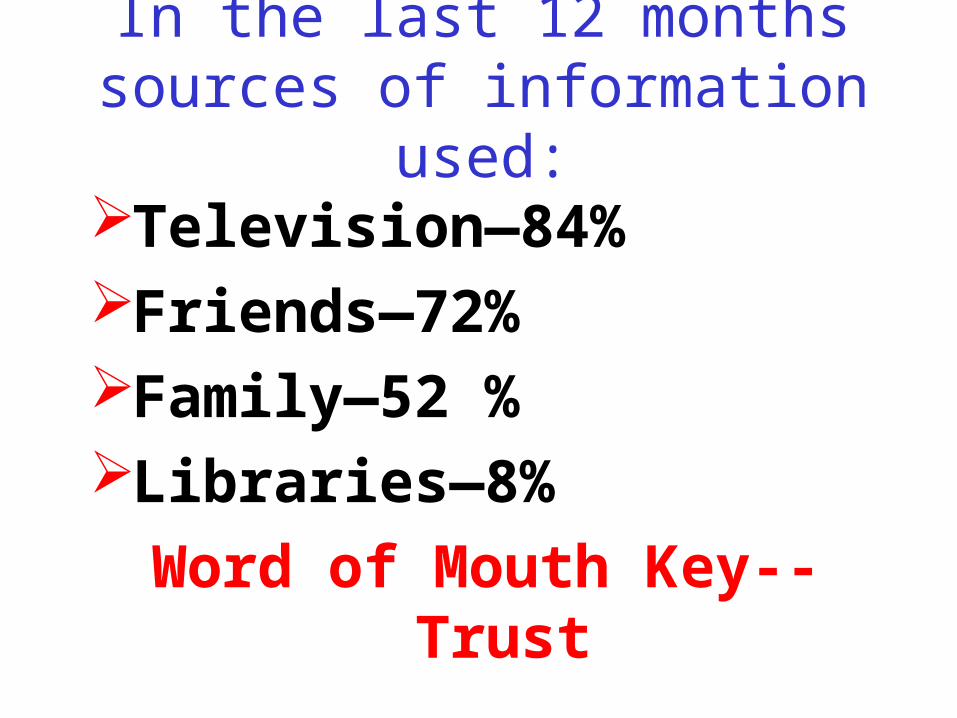
In the last 12 months sources of information
used:Television—84%Friends—72%Family—52 %Libraries—8%
Word of Mouth Key--Trust
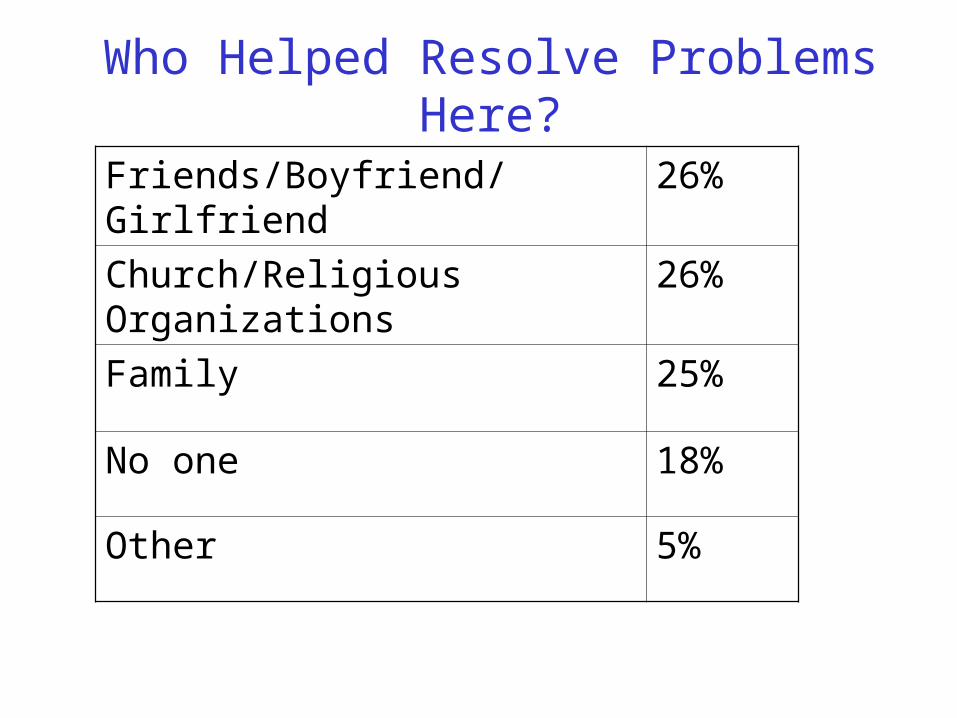
Who Helped Resolve Problems Here?
Friends/Boyfriend/Girlfriend 26%
Church/Religious Organizations
26%
Family 25%
No one 18%
Other 5%
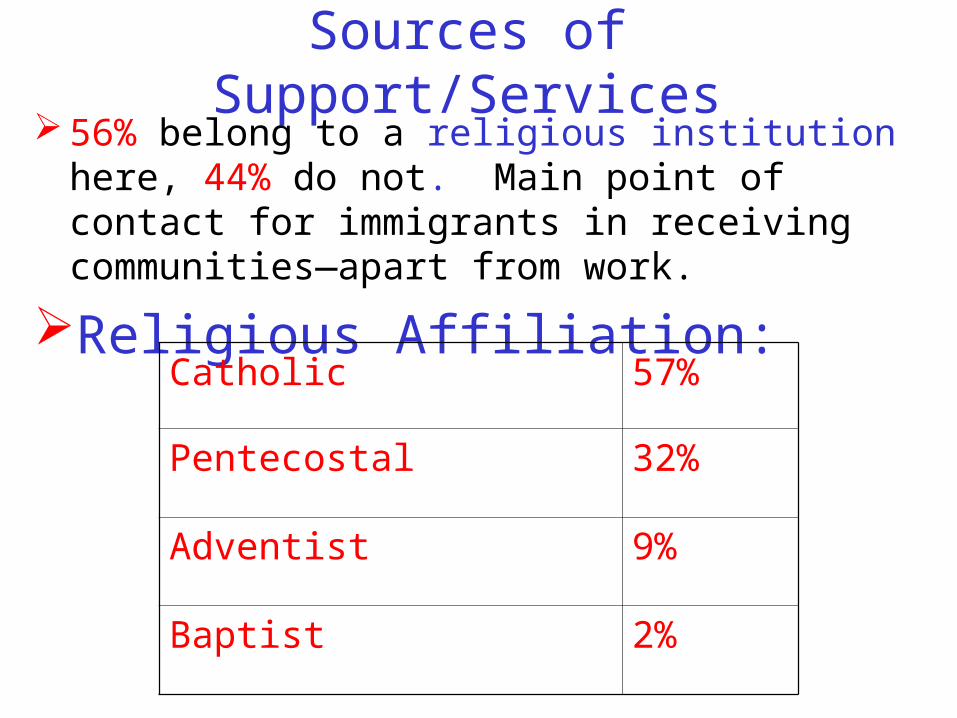
Sources of Support/Services56% belong to a religious institution here,
44% do not. Main point of contact for immigrants in receiving communities—apart from work.
Religious Affiliation:Catholic 57%
Pentecostal 32%
Adventist 9%
Baptist 2%
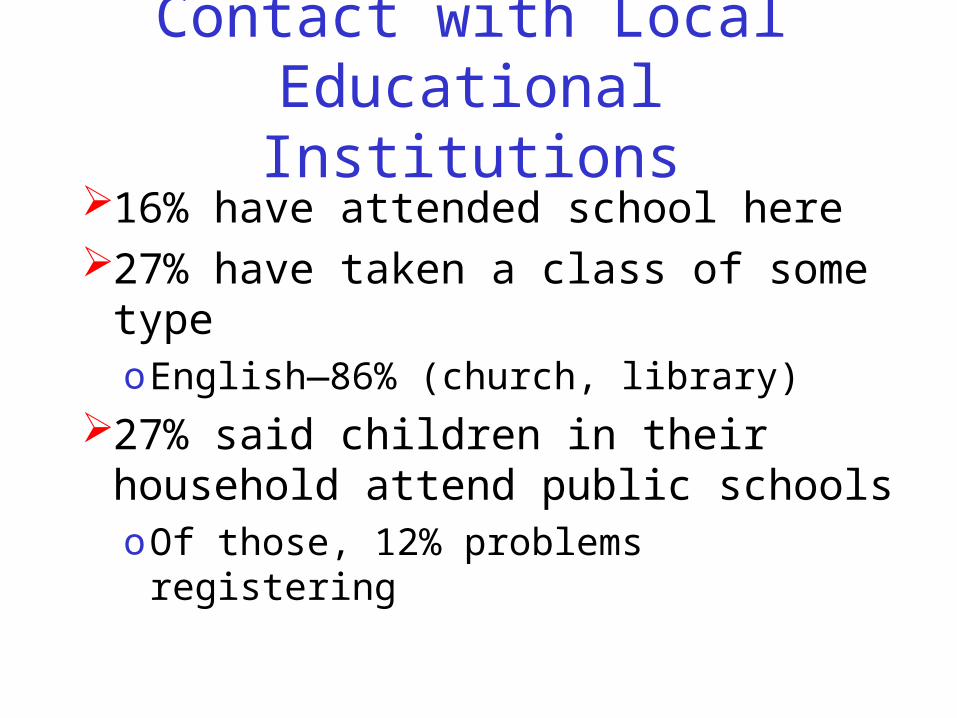
Contact with Local Educational Institutions
16% have attended school here27% have taken a class of some
typeo English—86% (church, library)
27% said children in their household attend public schoolso Of those, 12% problems registering
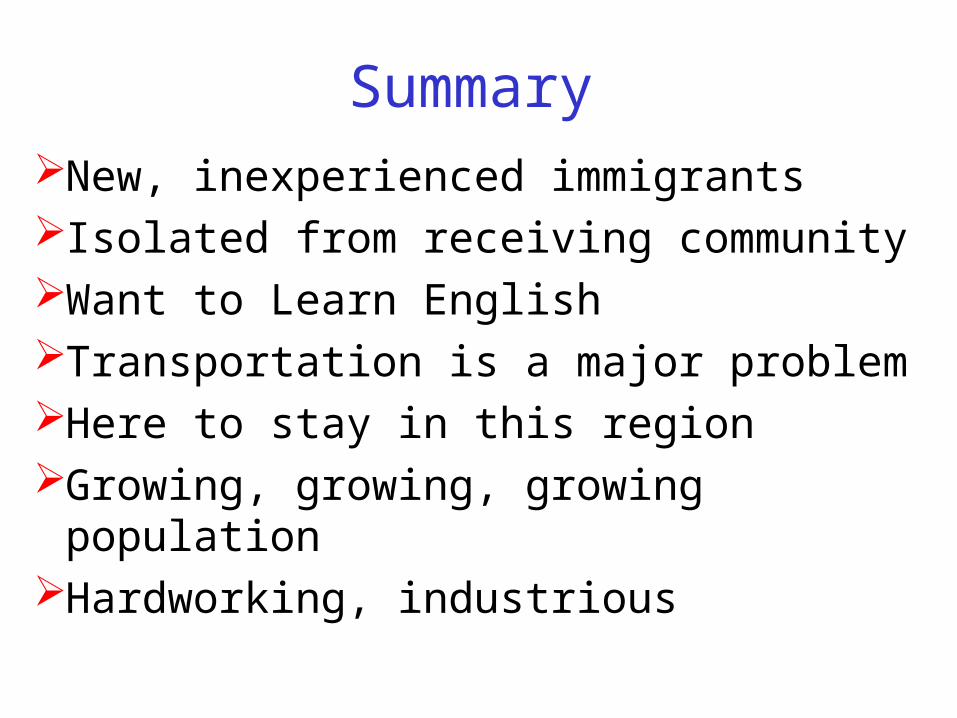
SummaryNew, inexperienced immigrantsIsolated from receiving communityWant to Learn EnglishTransportation is a major problemHere to stay in this regionGrowing, growing, growing populationHardworking, industrious