Embed Size (px)
Citation preview
F E B R U A R Y 2 0 , 2 0 1 5 / W E S T B O R O U G H , M A
Mark Babula P R I N C I P A L E N G I N E E R – S Y S T E M P L A N N I N G
Target 2 Results (Revised and reposted on 02/20/15 to correct errors)
Eastern Interconnection Planning Collaborative’s (EIPC) Gas -Electric System Interface Study

Gas-Electric System Interface Study
Target 2 Capability of the Natural Gas Systems to
Satisfy the Needs of the Electric Systems
February 12, 2015
Targ
et
2 R
esu
lts
2
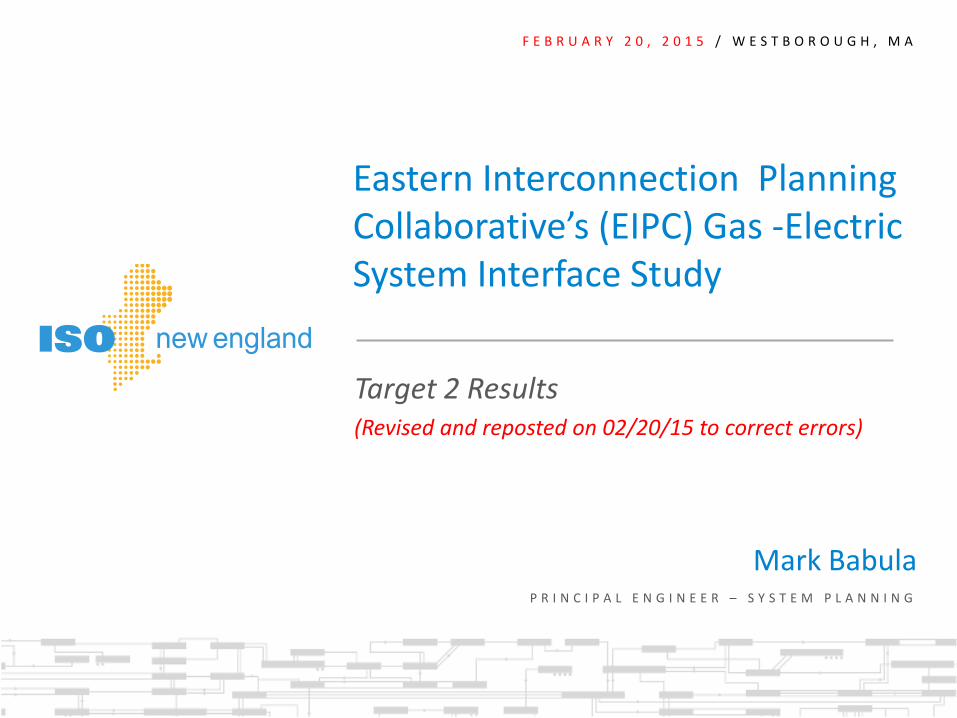
Acknowledgement and Disclaimer
The EIPC appreciates and acknowledges the support of DOE for the Eastern
Interconnections Studies Project
Acknowledgement:
This material is based upon work supported by the Department of Energy, National Energy Technology
Laboratory, under Award Number DE-OE0000343.
Disclaimers:
This report was prepared as an account of work sponsored by an agency of the United States
Government. Neither the United States Government nor any agency thereof, nor any of their employees,
makes any warranty, express or implied, or assumes any legal liability or responsibility for the accuracy,
completeness, or usefulness of any information, apparatus, product, or process disclosed, or represents
that its use would not infringe privately owned rights. Reference herein to any specific commercial
product, process, or service by trade name, trademark, manufacturer, or otherwise does not necessarily
constitute or imply its endorsement, recommendation, or favoring by the United States Government or
any agency thereof. The views and opinions of authors expressed herein do not necessarily state or
reflect those of the United States Government or any agency thereof.
Targ
et
2 R
esu
lts
3
Agenda
Introduction
Research goals
Method
Highlights
• Study Region
• Individual PPAs
Milestone Schedule
Targ
et
2 R
esu
lts
4
Target 2 Primary Research Objective
Evaluate the adequacy of the interstate and
interprovincial natural gas pipeline network to meet the
coincident peak demands of LDCs serving residential,
commercial and industrial (RCI) customers, as well as
gas-capable electric generators across the Study
Region
Targ
et
2 R
esu
lts
5
Target 2 Approach
Derive hourly gas demands of electric generation
Combine electric generator and RCI gas demands
Quantify unserved gas demand for the peak hour on
the summer and winter peak days, 2018 and 2023
Identify gas transportation constraints affecting
generation during the peak hour under the assumptions
of the three Scenarios and numerous Case Sensitivities
Analyze the frequency and duration (F-D) of the
transportation constraints affecting gas-fired generators
Identify potential mitigation measures
Targ
et
2 R
esu
lts
6
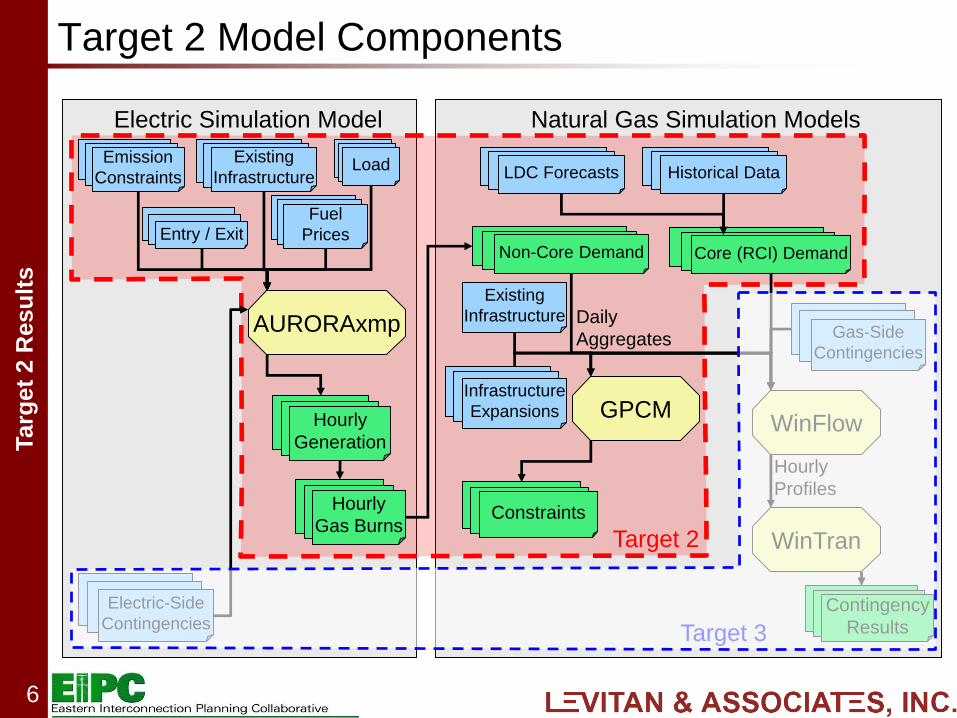
Target 2 Model Components
Electric Simulation Model Natural Gas Simulation Models
AURORAxmp
Existing
Infrastructure
Hourly
Generation
Load
Fuel
PricesEntry / Exit
Hourly
Gas Burns
Non-Core Demand
GPCM
Constraints
WinTran
Contingency
Results
LDC Forecasts Historical Data
Daily
Aggregates
Hourly
Profiles
WinFlow
Existing
Infrastructure
Target 2
Target 3
Core (RCI) Demand
Electric-Side
Contingencies
Gas-Side
Contingencies
Infrastructure
Expansions
Emission
Constraints
Targ
et
2 R
esu
lts
7
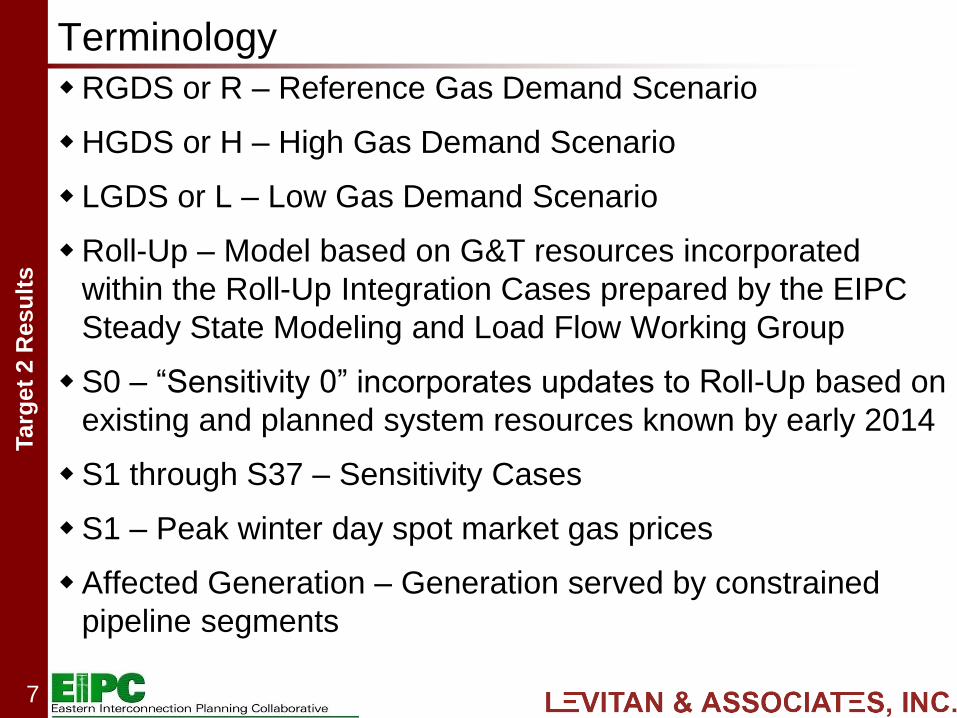
Terminology
RGDS or R – Reference Gas Demand Scenario
HGDS or H – High Gas Demand Scenario
LGDS or L – Low Gas Demand Scenario
Roll-Up – Model based on G&T resources incorporated
within the Roll-Up Integration Cases prepared by the EIPC
Steady State Modeling and Load Flow Working Group
S0 – “Sensitivity 0” incorporates updates to Roll-Up based on
existing and planned system resources known by early 2014
S1 through S37 – Sensitivity Cases
S1 – Peak winter day spot market gas prices
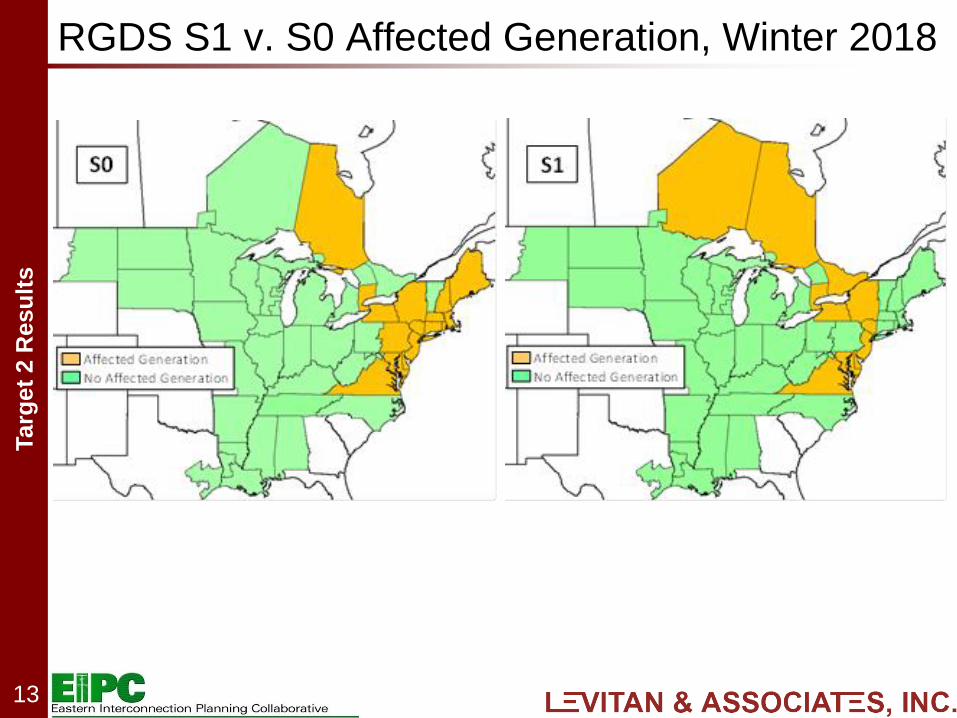
Affected Generation – Generation served by constrained
pipeline segments
Targ
et
2 R
esu
lts
8
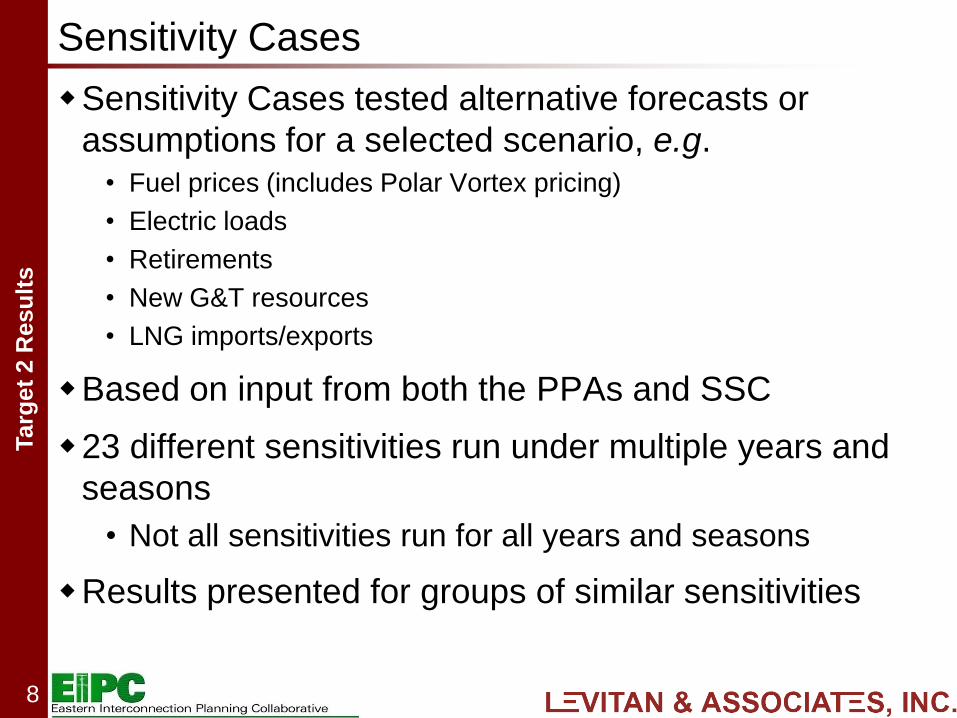
Sensitivity Cases
Sensitivity Cases tested alternative forecasts or
assumptions for a selected scenario, e.g. • Fuel prices (includes Polar Vortex pricing)
• Electric loads
• Retirements
• New G&T resources
• LNG imports/exports
Based on input from both the PPAs and SSC
23 different sensitivities run under multiple years and
seasons
• Not all sensitivities run for all years and seasons
Results presented for groups of similar sensitivities
Targ
et
2 R
esu
lts
9
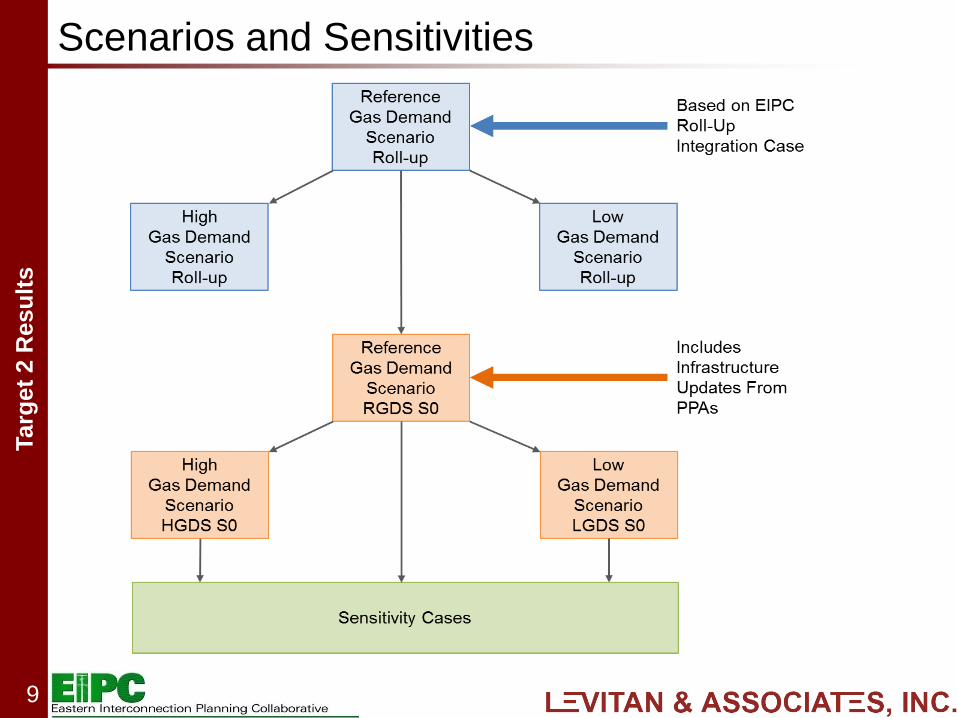
Scenarios and Sensitivities
Targ
et
2 R
esu
lts
10
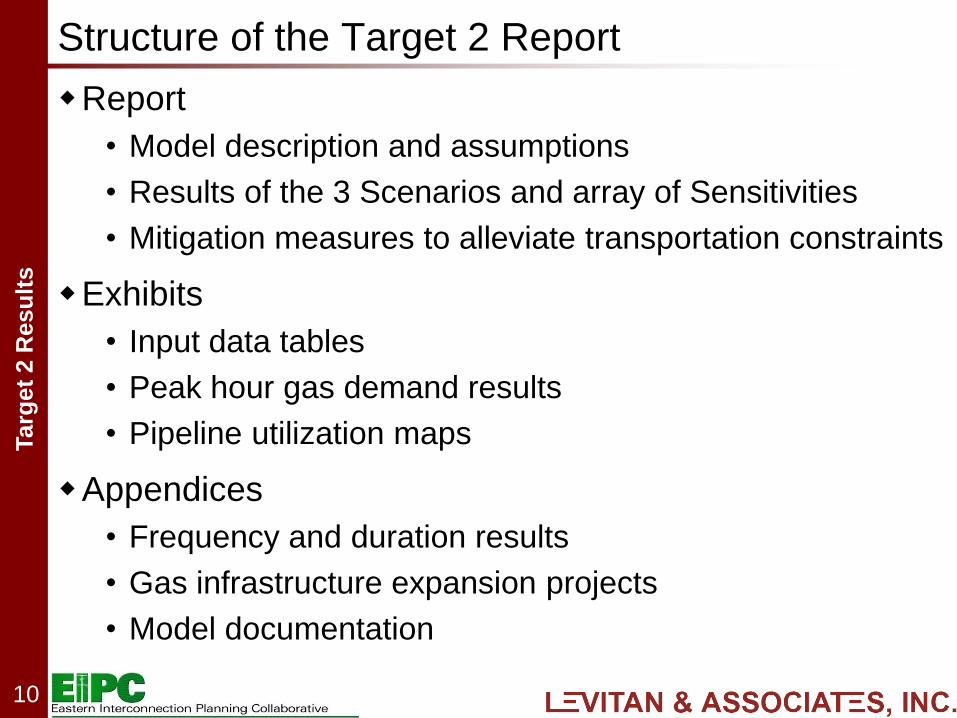
Structure of the Target 2 Report
Report
• Model description and assumptions
• Results of the 3 Scenarios and array of Sensitivities
• Mitigation measures to alleviate transportation constraints
Exhibits
• Input data tables
• Peak hour gas demand results
• Pipeline utilization maps
Appendices
• Frequency and duration results
• Gas infrastructure expansion projects
• Model documentation
Targ
et
2 R
esu
lts
11
Target 2 Highlights
Targ
et
2 R
esu
lts
12
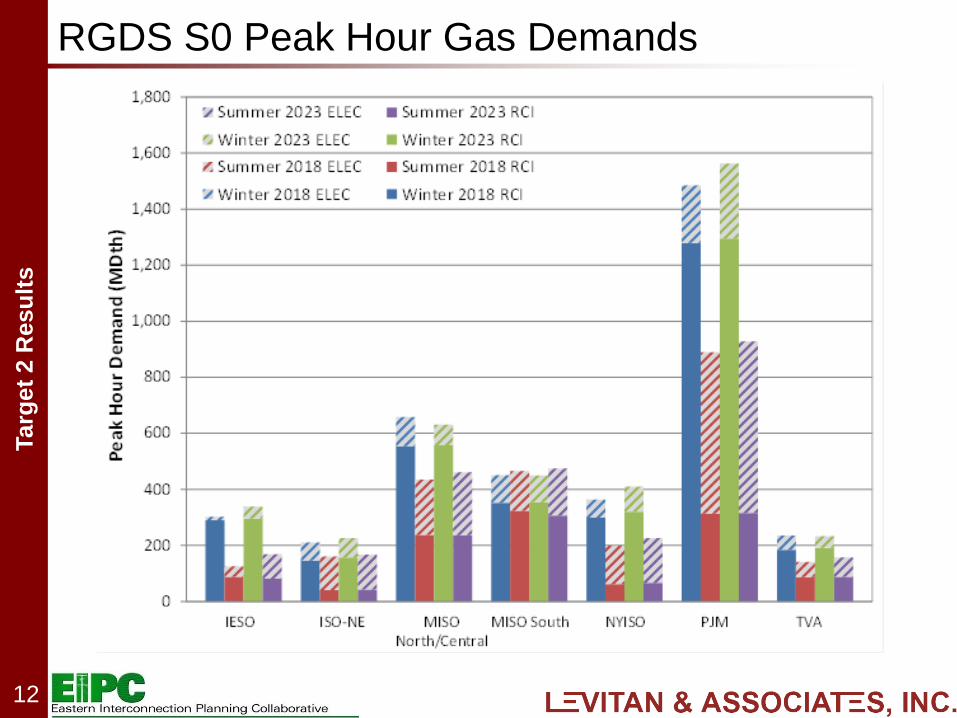
RGDS S0 Peak Hour Gas Demands
Targ
et
2 R
esu
lts
13
RGDS S1 v. S0 Affected Generation, Winter 2018
Targ
et
2 R
esu
lts
14
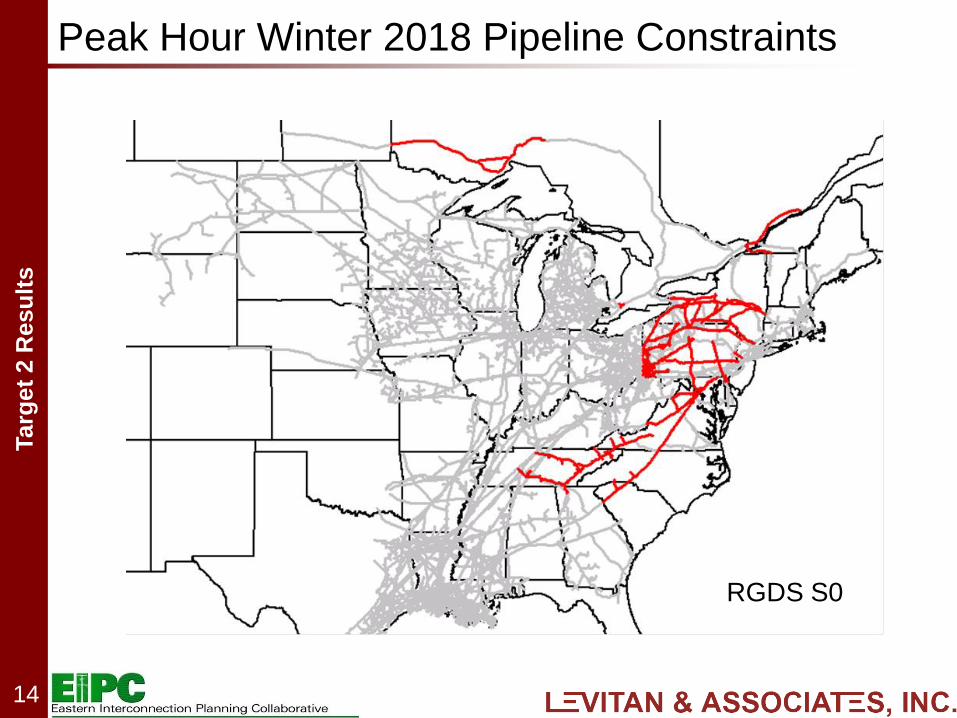
Peak Hour Winter 2018 Pipeline Constraints
RGDS S0
Targ
et
2 R
esu
lts
15
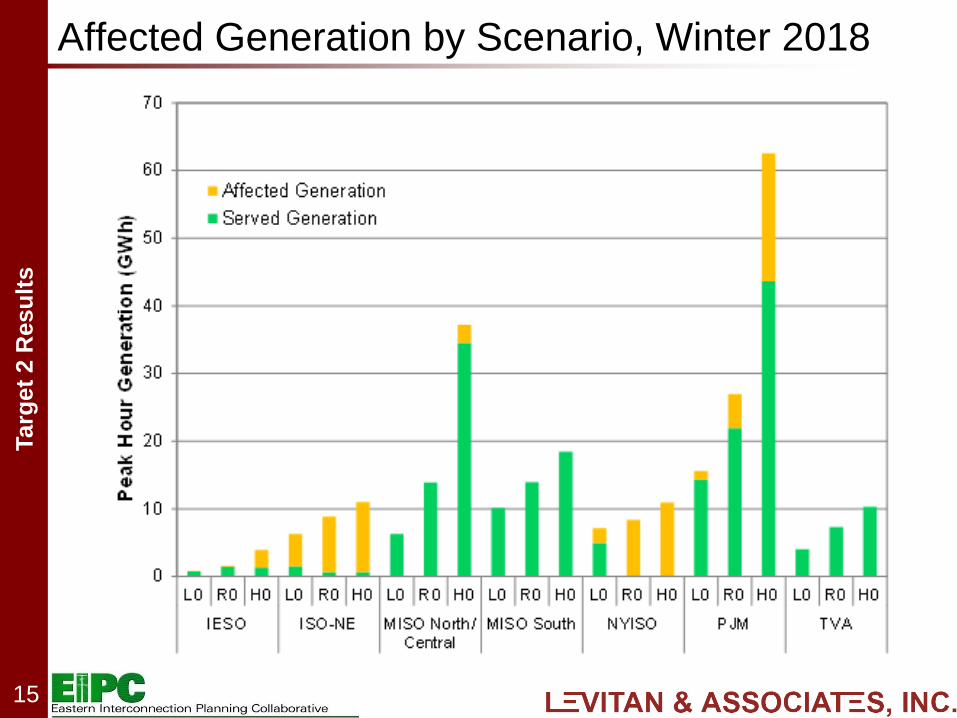
Affected Generation by Scenario, Winter 2018
Targ
et
2 R
esu
lts
16
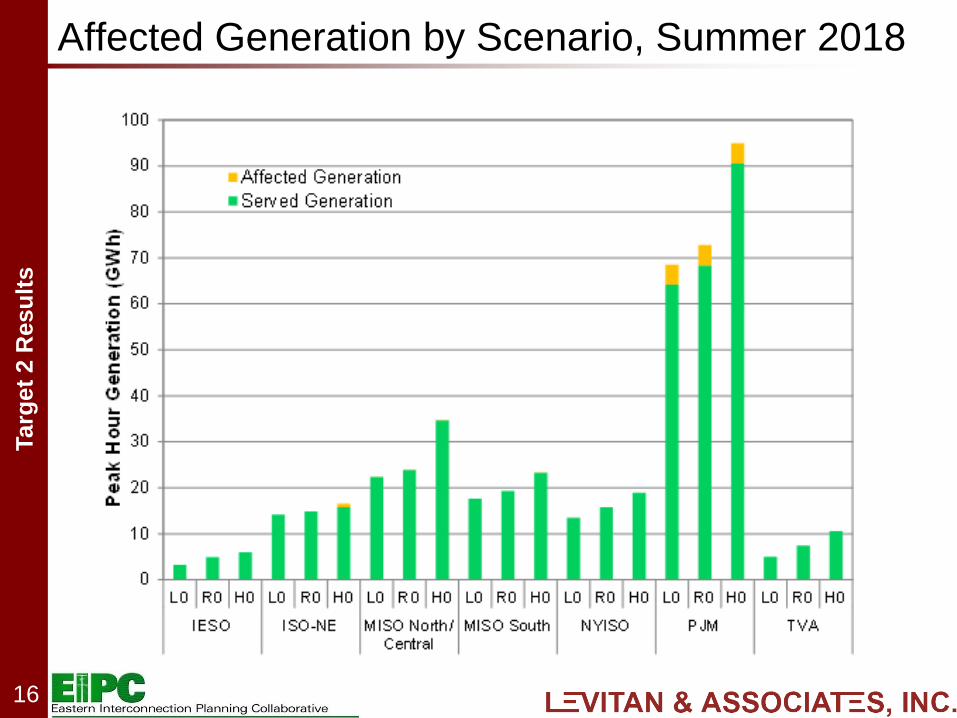
Affected Generation by Scenario, Summer 2018
Targ
et
2 R
esu
lts
17
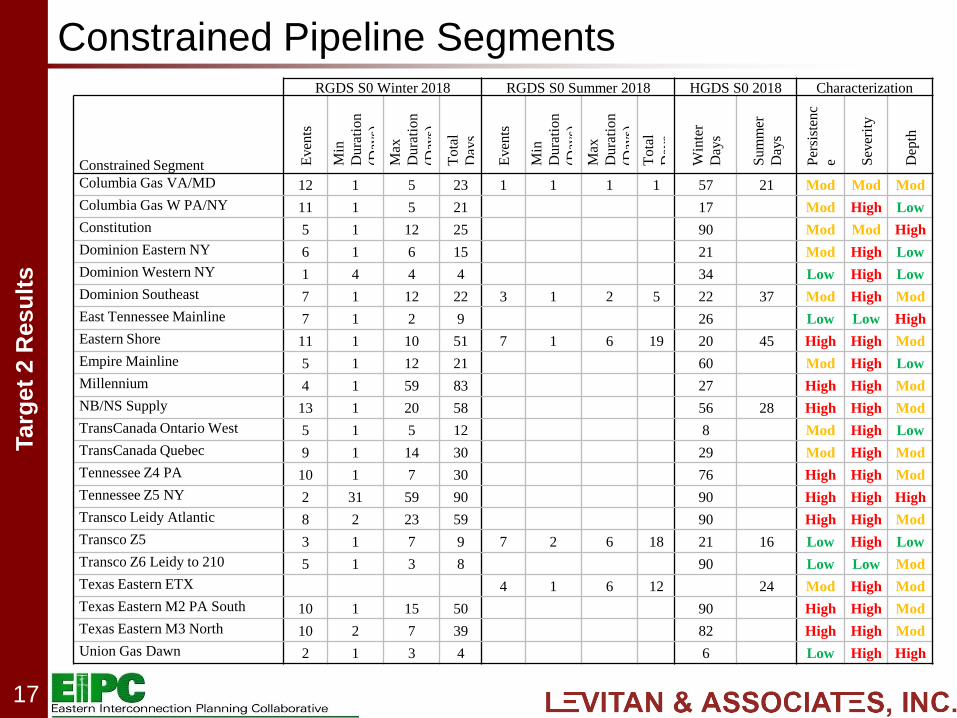
Constrained Pipeline Segments RGDS S0 Winter 2018 RGDS S0 Summer 2018 HGDS S0 2018 Characterization
Constrained Segment Even
ts
Min
Dura
tion
(Day
s)
Max
Dura
tion
(Day
s)
To
tal
Day
s
Even
ts
Min
Dura
tion
(Day
s)
Max
Du
rati
on
(Day
s)
Tota
l
Day
s
Win
ter
Day
s
Sum
mer
Day
s
Per
sist
enc
e Sev
erit
y
Dep
th
Columbia Gas VA/MD 12 1 5 23 1 1 1 1 57 21 Mod Mod Mod
Columbia Gas W PA/NY 11 1 5 21 17 Mod High Low
Constitution 5 1 12 25 90 Mod Mod High
Dominion Eastern NY 6 1 6 15 21 Mod High Low
Dominion Western NY 1 4 4 4 34 Low High Low
Dominion Southeast 7 1 12 22 3 1 2 5 22 37 Mod High Mod
East Tennessee Mainline 7 1 2 9 26 Low Low High
Eastern Shore 11 1 10 51 7 1 6 19 20 45 High High Mod
Empire Mainline 5 1 12 21 60 Mod High Low
Millennium 4 1 59 83 27 High High Mod
NB/NS Supply 13 1 20 58 56 28 High High Mod
TransCanada Ontario West 5 1 5 12 8 Mod High Low
TransCanada Quebec 9 1 14 30 29 Mod High Mod
Tennessee Z4 PA 10 1 7 30 76 High High Mod
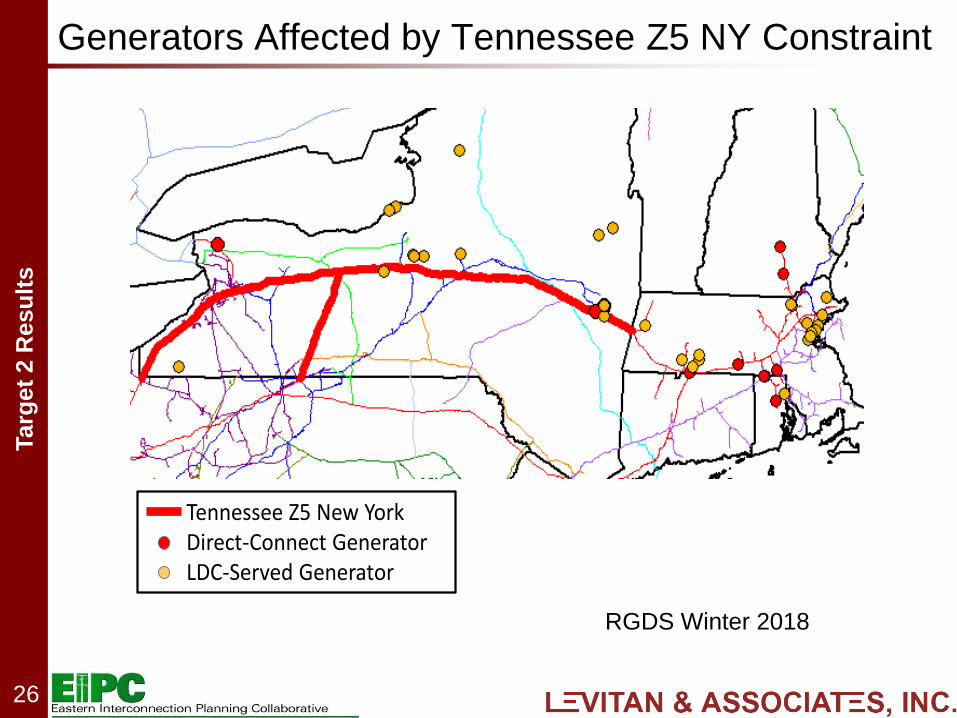
Tennessee Z5 NY 2 31 59 90 90 High High High
Transco Leidy Atlantic 8 2 23 59 90 High High Mod
Transco Z5 3 1 7 9 7 2 6 18 21 16 Low High Low
Transco Z6 Leidy to 210 5 1 3 8 90 Low Low Mod
Texas Eastern ETX 4 1 6 12 24 Mod High Mod
Texas Eastern M2 PA South 10 1 15 50 90 High High Mod
Texas Eastern M3 North 10 2 7 39 82 High High Mod
Union Gas Dawn 2 1 3 4 6 Low High High

Targ
et
2 R
esu
lts
18
Target 2 PPA Results

Targ
et
2 R
esu
lts
19
ISO-NE
Targ
et
2 R
esu
lts
20
ISO-NE – PPA Highlights
Gas infrastructure is constrained during the winter under
nearly all tested market conditions and resource mixes
Deliverability shortfall due to material decline in region’s
portfolio diversity:
• Upstream bottlenecks into New England from Marcellus
• Continued decline of imports from Western and Atlantic
Canada
• Anticipated underutilization of LNG import facilities
Targ
et
2 R
esu
lts
21
ISO-NE – PPA Highlights (cont’d)
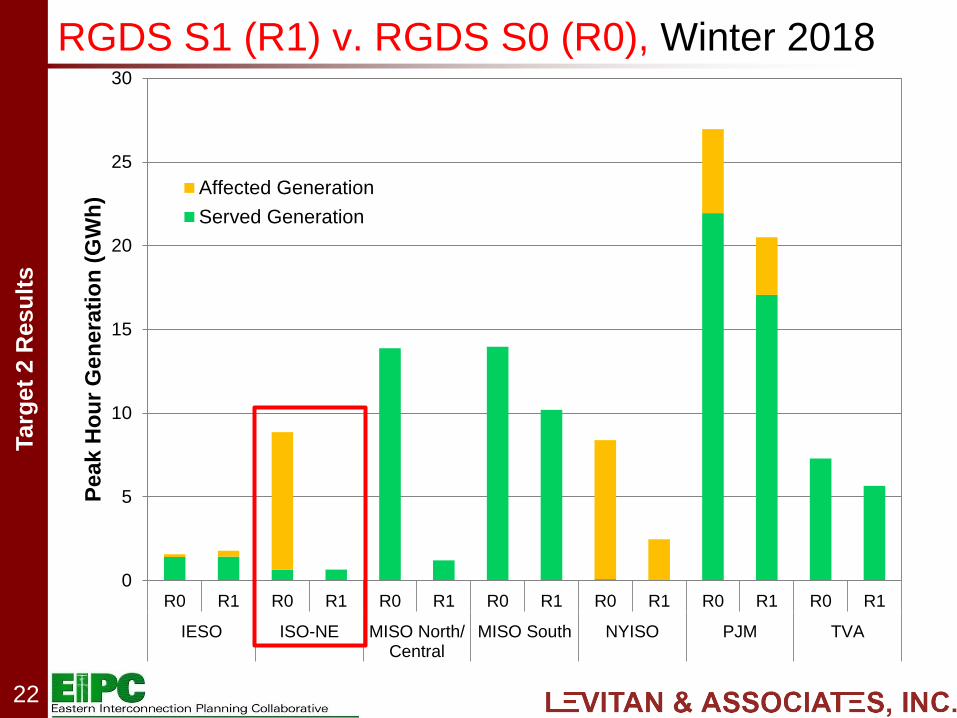
Affected generation is mitigated fully in 2018 and 2023
in sensitivity S1 with high daily spot prices on cold days
Increased imports at Canaport and Distrigas LNG
terminals materially decrease affected generation
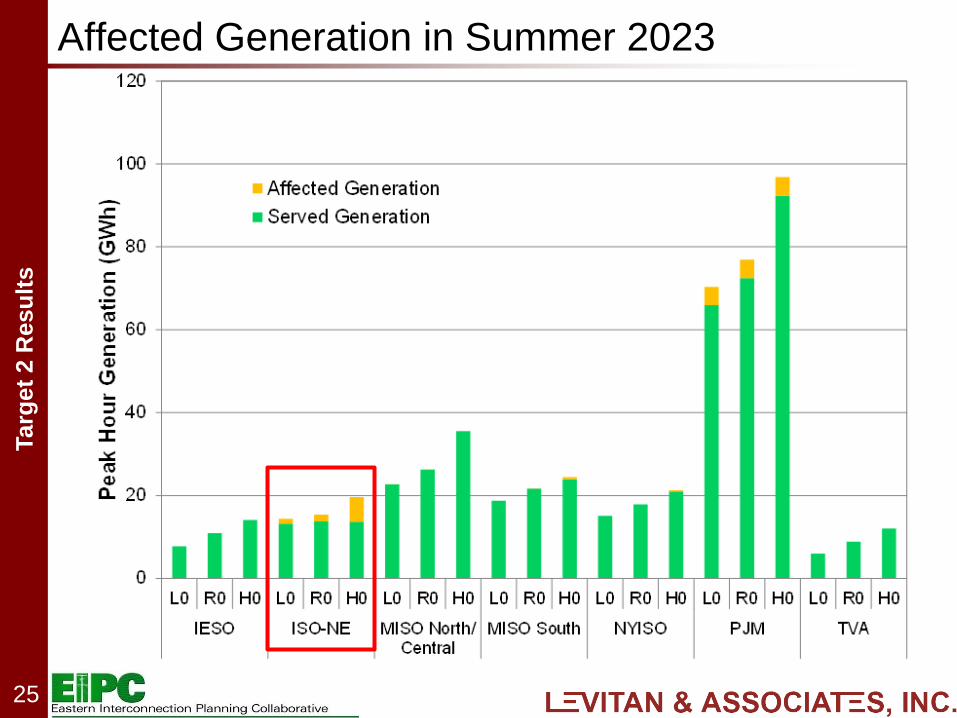
Summer 2023 constraints materialize (low impact)
Targ
et
2 R
esu
lts
22
RGDS S1 (R1) v. RGDS S0 (R0), Winter 2018
0
5
10
15
20
25
30
R0 R1 R0 R1 R0 R1 R0 R1 R0 R1 R0 R1 R0 R1
IESO ISO-NE MISO North/Central
MISO South NYISO PJM TVA
Peak H
ou
r G
en
era
tio
n (
GW
h) Affected Generation
Served Generation
Targ
et
2 R
esu
lts
23
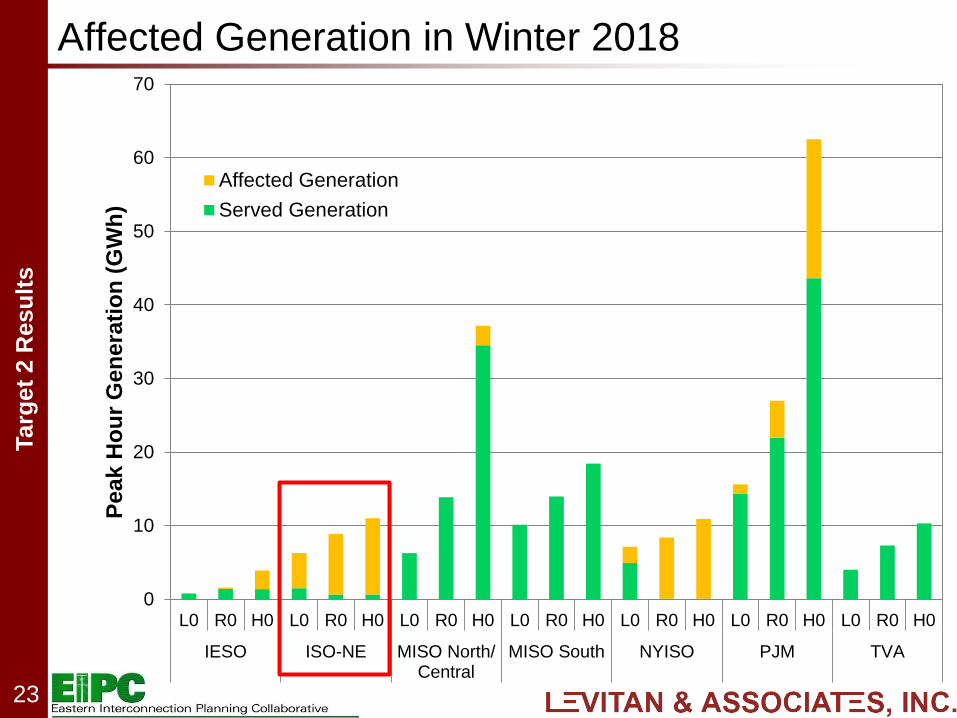
Affected Generation in Winter 2018
0
10
20
30
40
50
60
70
L0 R0 H0 L0 R0 H0 L0 R0 H0 L0 R0 H0 L0 R0 H0 L0 R0 H0 L0 R0 H0
IESO ISO-NE MISO North/Central
MISO South NYISO PJM TVA
Pea
k H
ou
r G
en
era
tio
n (
GW
h)
Affected Generation
Served Generation
Targ
et
2 R
esu
lts
24
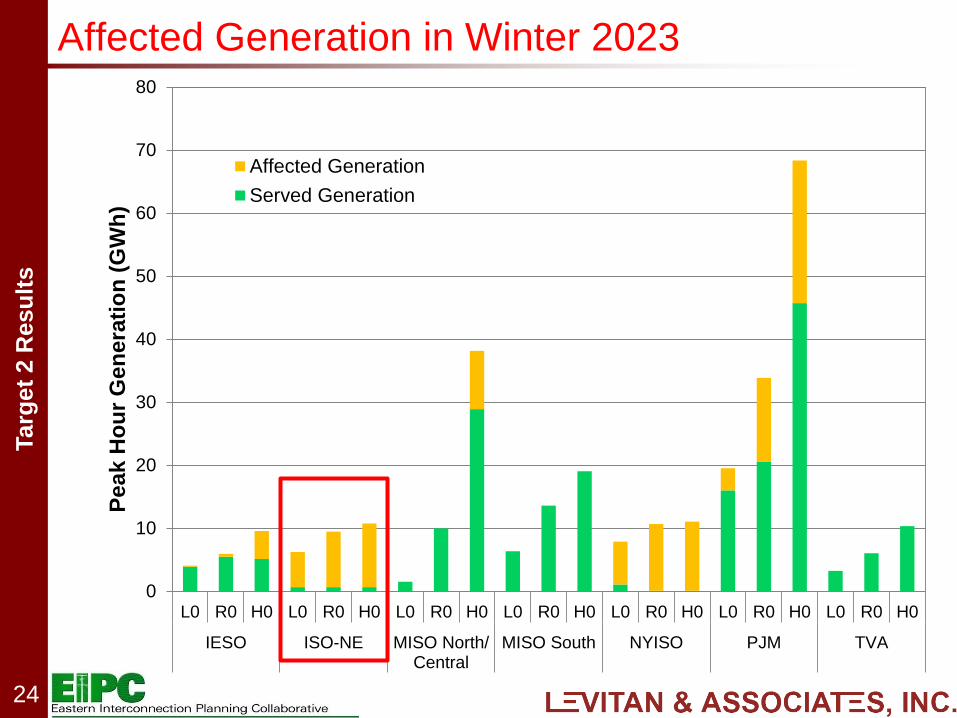
Affected Generation in Winter 2023
0
10
20
30
40
50
60
70
80
L0 R0 H0 L0 R0 H0 L0 R0 H0 L0 R0 H0 L0 R0 H0 L0 R0 H0 L0 R0 H0
IESO ISO-NE MISO North/Central
MISO South NYISO PJM TVA
Pea
k H
ou
r G
en
era
tio
n (
GW
h)
Affected Generation
Served Generation
Targ
et
2 R
esu
lts
25
Affected Generation in Summer 2023
Targ
et
2 R
esu
lts
26
Generators Affected by Tennessee Z5 NY Constraint
Tennessee Z5 New YorkDirect-Connect GeneratorLDC-Served Generator
RGDS Winter 2018
Targ
et
2 R
esu
lts
27
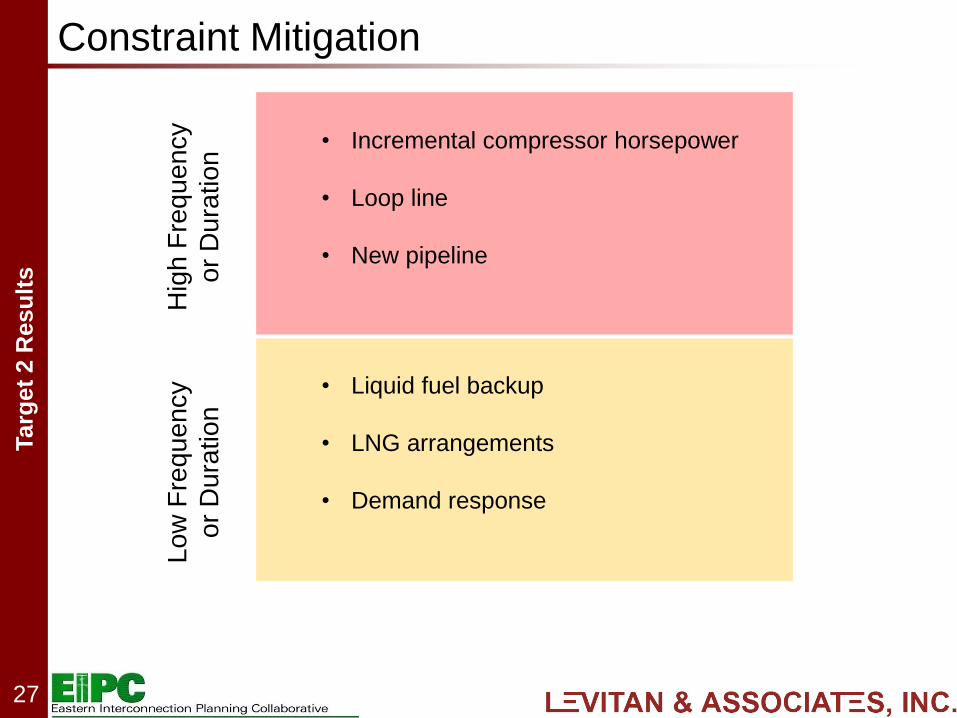
Constraint Mitigation
• Incremental compressor horsepower
• Loop line
• New pipeline
• Liquid fuel backup
• LNG arrangements
• Demand response
Hig
h F
req
ue
ncy
or
Du
ratio
n
Lo
w F
req
ue
ncy
or
Du
ratio
n
Targ
et
2 R
esu
lts
28
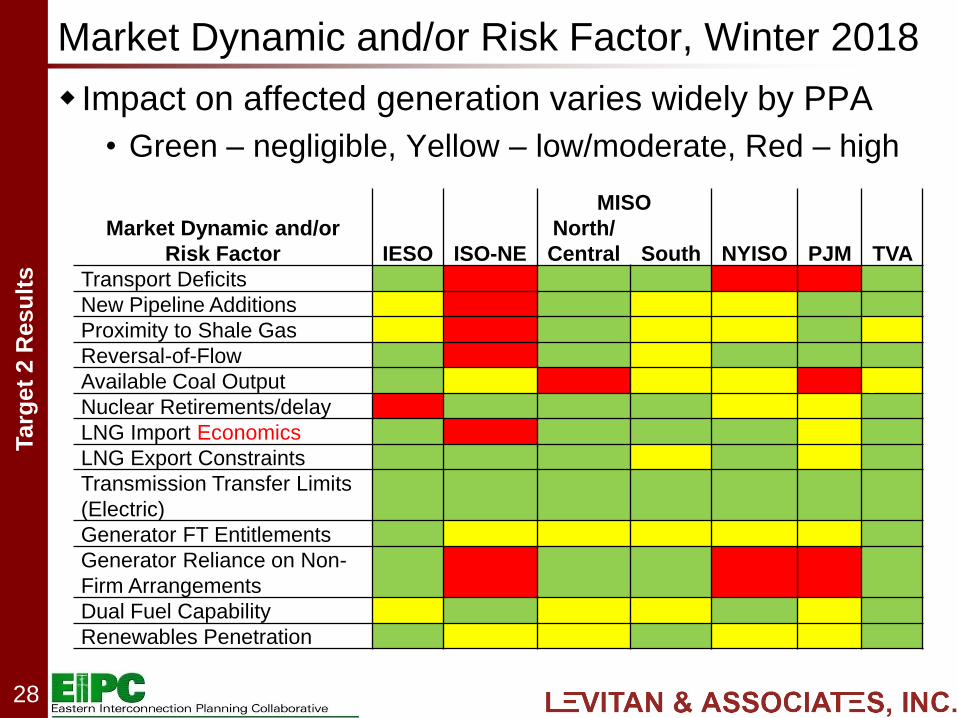
Market Dynamic and/or Risk Factor, Winter 2018
Impact on affected generation varies widely by PPA
• Green – negligible, Yellow – low/moderate, Red – high
MISO
Market Dynamic and/or
Risk Factor IESO ISO-NE
North/
Central South NYISO PJM TVA
Transport Deficits
New Pipeline Additions
Proximity to Shale Gas
Reversal-of-Flow
Available Coal Output
Nuclear Retirements/delay
LNG Import Economics
LNG Export Constraints
Transmission Transfer Limits
(Electric)
Generator FT Entitlements
Generator Reliance on Non-
Firm Arrangements
Dual Fuel Capability
Renewables Penetration
Targ
et
2 R
esu
lts
29
Target 2 Production Schedule
Proposed key milestones
• Stakeholder comments due: 2/27/2015
• Final draft report to DOE: 3/13/2015

Targ
et
2 R
esu
lts
30
QUESTIONS
Targ
et
2 R
esu
lts
31
Appendices
Additional PPA Target 2 Results
• IESO
• MISO North/Central
• NYISO
• PJM
• TVA
Targ
et
2 R
esu
lts
32
Additional Target 2
PPA Results

Targ
et
2 R
esu
lts
33
IESO
Targ
et
2 R
esu
lts
34
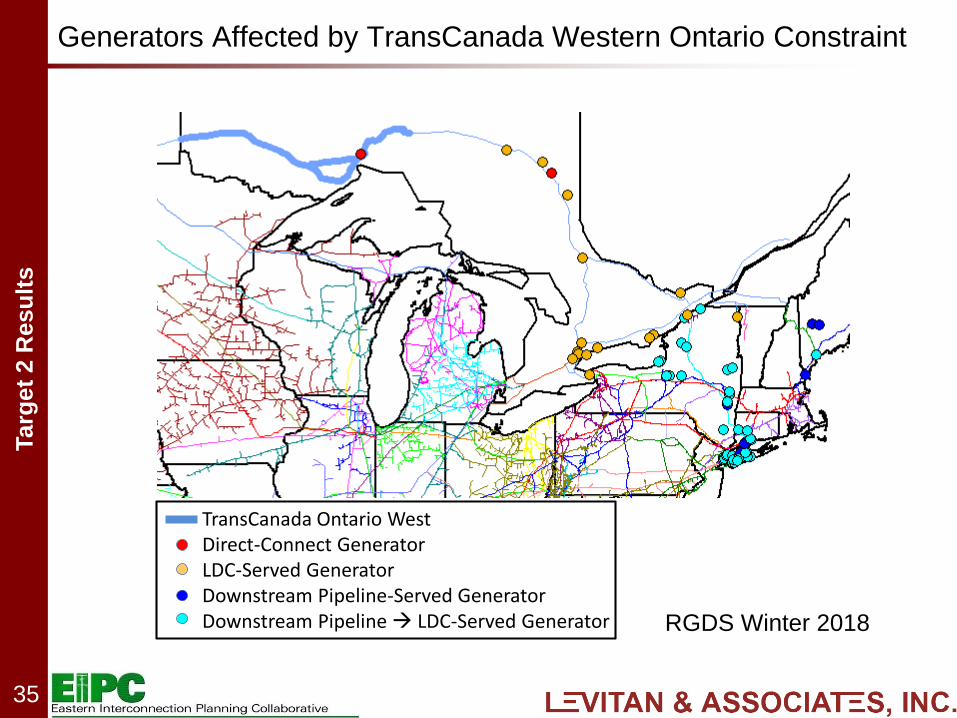
IESO – PPA Highlights
Gas infrastructure is adequate
Affected generation is negligible in winter 2018
Small increase in affected generation in winter 2023
Winter pipeline constraints located on TransCanada’s
Western Delivery Area and on Union Gas at the Dawn
storage hub
Targ
et
2 R
esu
lts
35
Generators Affected by TransCanada Western Ontario Constraint
TransCanada Ontario WestDirect-Connect GeneratorLDC-Served GeneratorDownstream Pipeline-Served GeneratorDownstream Pipeline LDC-Served Generator RGDS Winter 2018
Targ
et
2 R
esu
lts
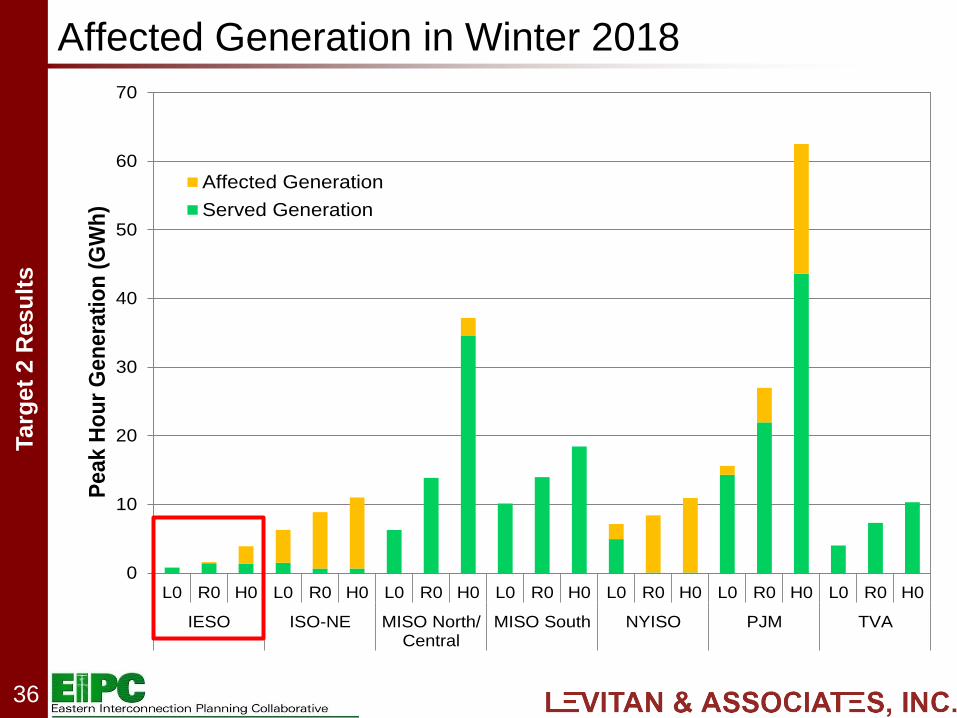
36
Affected Generation in Winter 2018
0
10
20
30
40
50
60
70
L0 R0 H0 L0 R0 H0 L0 R0 H0 L0 R0 H0 L0 R0 H0 L0 R0 H0 L0 R0 H0
IESO ISO-NE MISO North/Central
MISO South NYISO PJM TVA
Peak H
ou
r G
en
era
tio
n (
GW
h)
Affected Generation
Served Generation
Targ
et
2 R
esu
lts
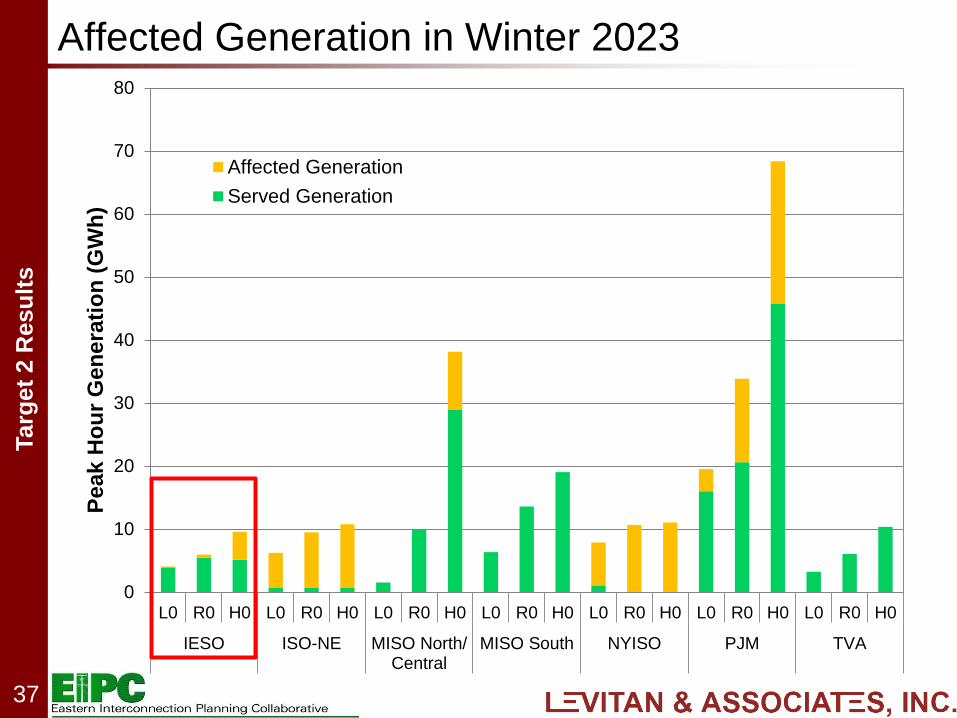
37
Affected Generation in Winter 2023
0
10
20
30
40
50
60
70
80
L0 R0 H0 L0 R0 H0 L0 R0 H0 L0 R0 H0 L0 R0 H0 L0 R0 H0 L0 R0 H0
IESO ISO-NE MISO North/Central
MISO South NYISO PJM TVA
Pea
k H
ou
r G
en
era
tio
n (
GW
h)
Affected Generation
Served Generation

Targ
et
2 R
esu
lts
38
MISO
Targ
et
2 R
esu
lts
39
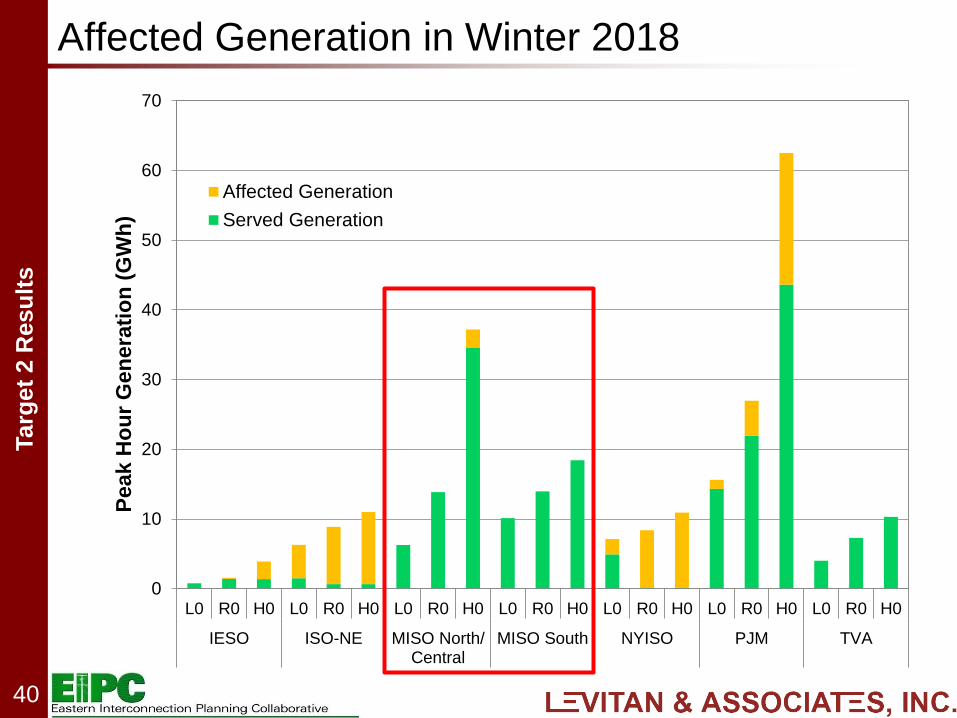
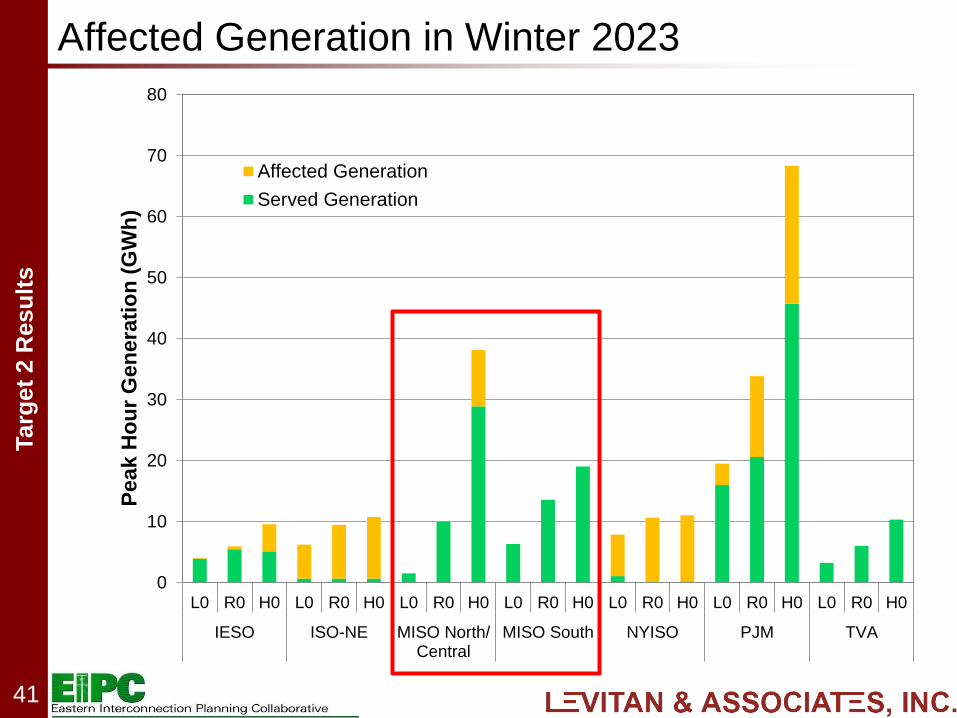
MISO – PPA Highlights
Extensive pipeline and storage deliverability result in
gas infrastructure adequacy under almost all market
conditions and resource mixes
Small transportation deficit in North/Central in winter
2018 and 2023 when additional attrition of coal-fired
capacity is replaced by gas-fired capacity (HGDS)
Anticipated commercialization of LNG export facilities in
Gulf of Mexico does not increase F-D of transport
constraints
Targ
et
2 R
esu
lts
40
Affected Generation in Winter 2018
0
10
20
30
40
50
60
70
L0 R0 H0 L0 R0 H0 L0 R0 H0 L0 R0 H0 L0 R0 H0 L0 R0 H0 L0 R0 H0
IESO ISO-NE MISO North/Central
MISO South NYISO PJM TVA
Peak H
ou
r G
en
era
tio
n (
GW
h)
Affected Generation
Served Generation
Targ
et
2 R
esu
lts
41
Affected Generation in Winter 2023
0
10
20
30
40
50
60
70
80
L0 R0 H0 L0 R0 H0 L0 R0 H0 L0 R0 H0 L0 R0 H0 L0 R0 H0 L0 R0 H0
IESO ISO-NE MISO North/Central
MISO South NYISO PJM TVA
Peak H
ou
r G
en
era
tio
n (
GW
h)
Affected Generation
Served Generation
Targ
et
2 R
esu
lts
42
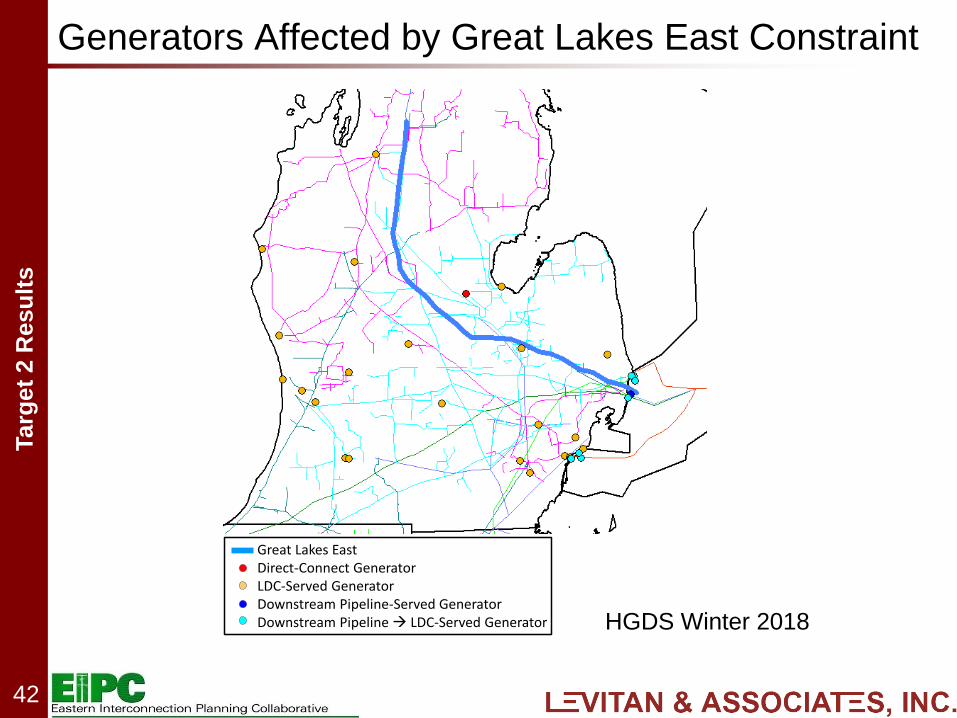
Generators Affected by Great Lakes East Constraint
HGDS Winter 2018
Great Lakes EastDirect-Connect GeneratorLDC-Served GeneratorDownstream Pipeline-Served GeneratorDownstream Pipeline LDC-Served Generator
Targ
et
2 R
esu
lts
43
NYISO
Targ
et
2 R
esu
lts
44
NYISO – PPA Highlights
Gas infrastructure is constrained in winter 2018 and
2023 under nearly all market conditions and resource
mixes
Despite large pipeline buildout in New York, nearly all
pipelines are fully utilized at the winter peak hour
Constrained Transco segments in PJM also affect
downstream generators located on the NYFS
Significant dual-fuel capacity mitigates constraints under
high daily gas prices (Polar Vortex pricing)
Expanded pipeline capacity to accommodate Marcellus
production materially decreases affected generation
Targ
et
2 R
esu
lts
45
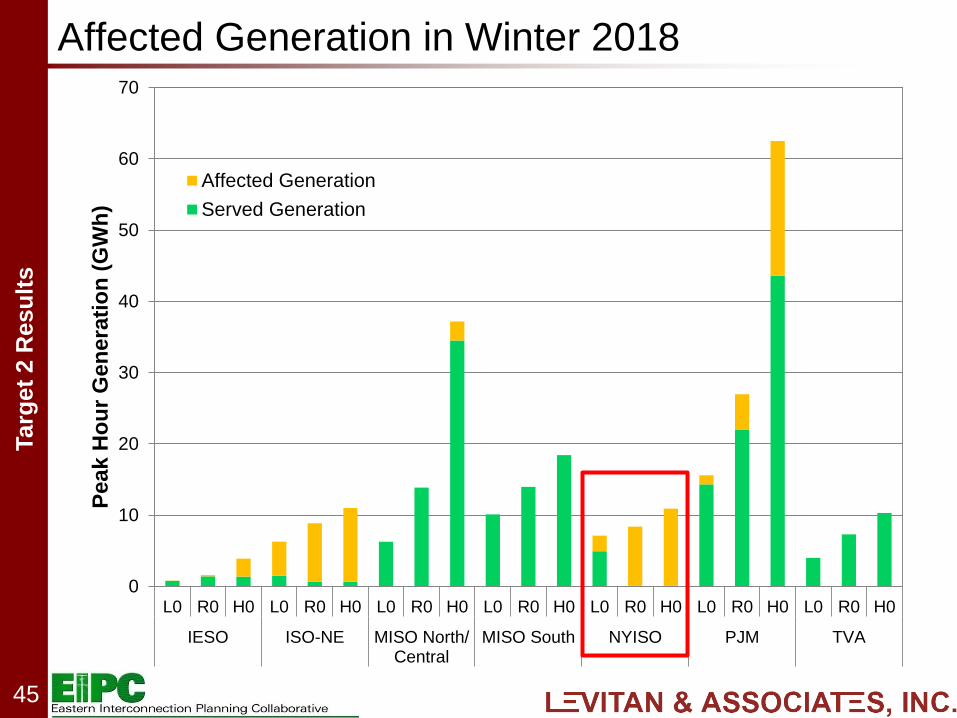
Affected Generation in Winter 2018
0
10
20
30
40
50
60
70
L0 R0 H0 L0 R0 H0 L0 R0 H0 L0 R0 H0 L0 R0 H0 L0 R0 H0 L0 R0 H0
IESO ISO-NE MISO North/Central
MISO South NYISO PJM TVA
Pea
k H
ou
r G
en
era
tio
n (
GW
h)
Affected Generation
Served Generation
Targ
et
2 R
esu
lts
46
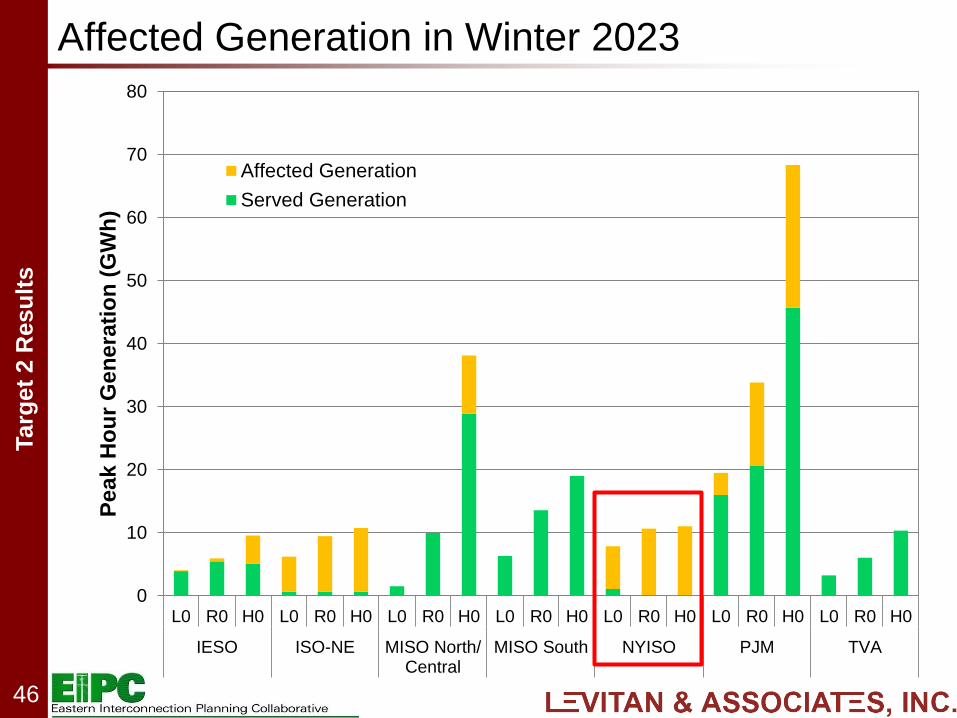
Affected Generation in Winter 2023
0
10
20
30
40
50
60
70
80
L0 R0 H0 L0 R0 H0 L0 R0 H0 L0 R0 H0 L0 R0 H0 L0 R0 H0 L0 R0 H0
IESO ISO-NE MISO North/Central
MISO South NYISO PJM TVA
Pea
k H
ou
r G
en
era
tio
n (
GW
h)
Affected Generation
Served Generation
Targ
et
2 R
esu
lts
47
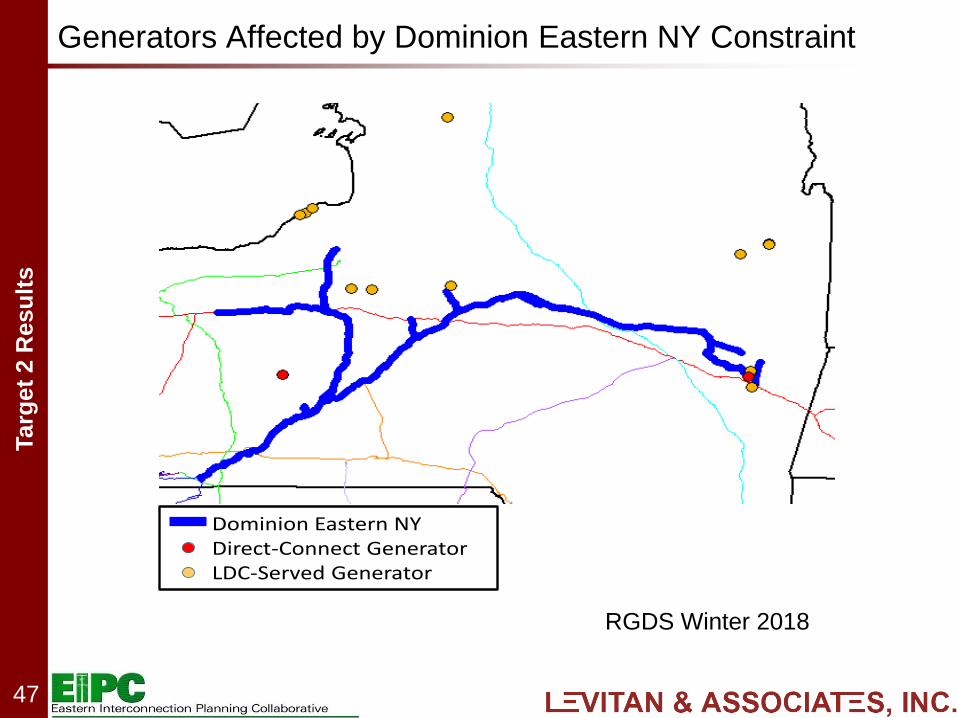
Generators Affected by Dominion Eastern NY Constraint
Dominion Eastern NYDirect-Connect GeneratorLDC-Served Generator
RGDS Winter 2018
Targ
et
2 R
esu
lts
48
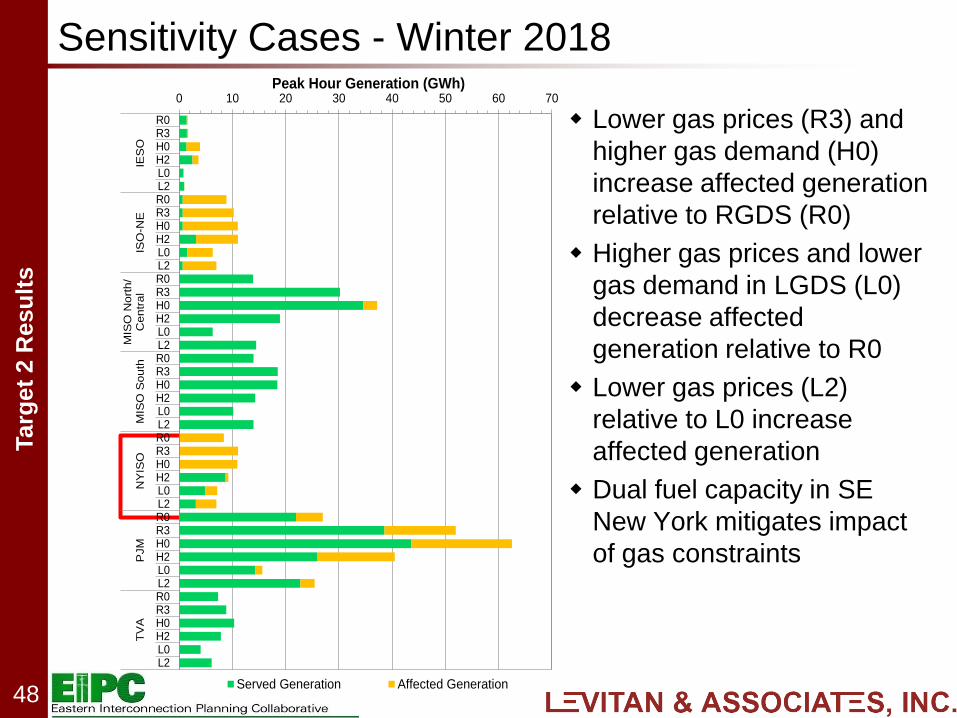
Sensitivity Cases - Winter 2018
Lower gas prices (R3) and
higher gas demand (H0)
increase affected generation
relative to RGDS (R0)
Higher gas prices and lower
gas demand in LGDS (L0)
decrease affected
generation relative to R0
Lower gas prices (L2)
relative to L0 increase
affected generation
Dual fuel capacity in SE
New York mitigates impact
of gas constraints
0 10 20 30 40 50 60 70
R0R3H0H2L0L2R0R3H0H2L0L2R0R3H0H2L0L2R0R3H0H2L0L2R0R3H0H2L0L2R0R3H0H2L0L2R0R3H0H2L0L2
IES
OIS
O-N
EM
ISO
No
rth
/C
en
tra
lM
ISO
So
uth
NY
ISO
PJM
TV
A
Peak Hour Generation (GWh)
Served Generation Affected Generation

Targ
et
2 R
esu
lts
49
PJM
Targ
et
2 R
esu
lts
50
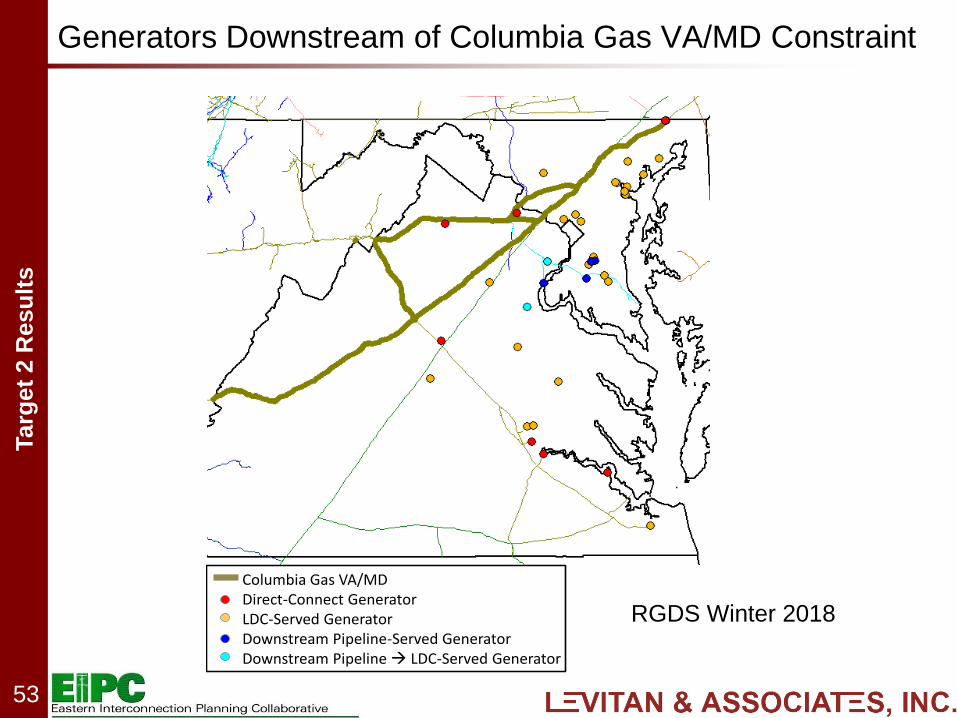
PJM – PPA Highlights
Gas infrastructure is adequate or constrained in winter,
depending on location
• Most affected generation in MD, VA, Eastern PA, NJ, DE
• Adequate deliverability elsewhere, including Chicago
• Amount of affected generation reduced when high spot
gas prices put more coal- and oil-fired generation in merit
• Heightened attrition of coal-fired capacity and high load
increases affected generation in 2018 and 2023
• Incremental pipeline additions to accommodate increased
Marcellus production decreases affected generation
Moderate affected generation in summer 2018 and 2023
in DE, MD, VA
Targ
et
2 R
esu
lts
51
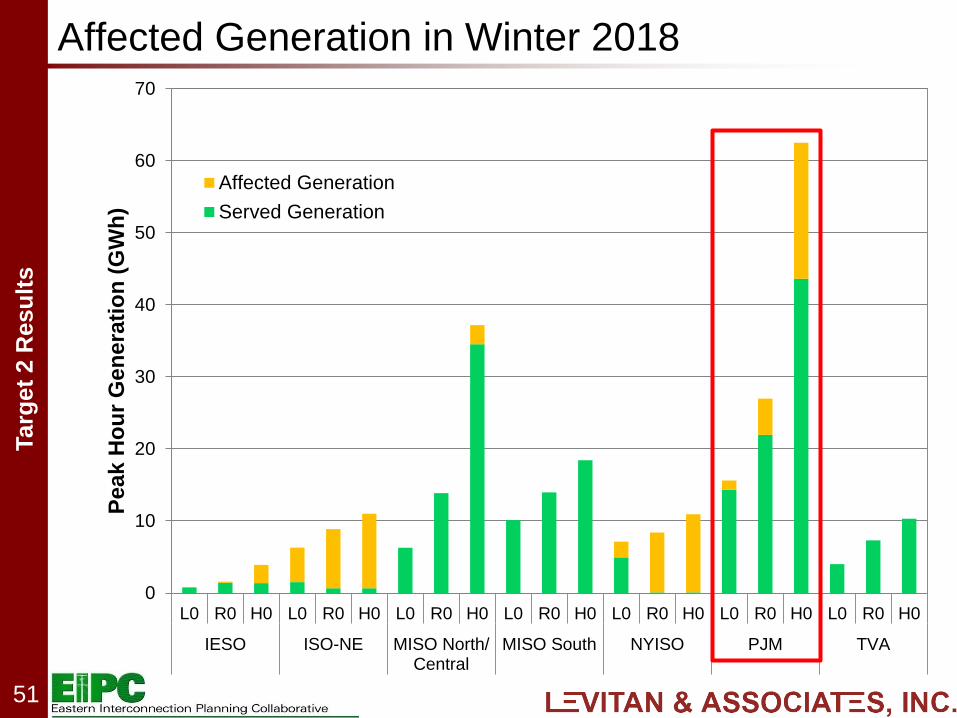
Affected Generation in Winter 2018
0
10
20
30
40
50
60
70
L0 R0 H0 L0 R0 H0 L0 R0 H0 L0 R0 H0 L0 R0 H0 L0 R0 H0 L0 R0 H0
IESO ISO-NE MISO North/Central
MISO South NYISO PJM TVA
Pea
k H
ou
r G
en
era
tio
n (
GW
h)
Affected Generation
Served Generation
Targ
et
2 R
esu
lts
52
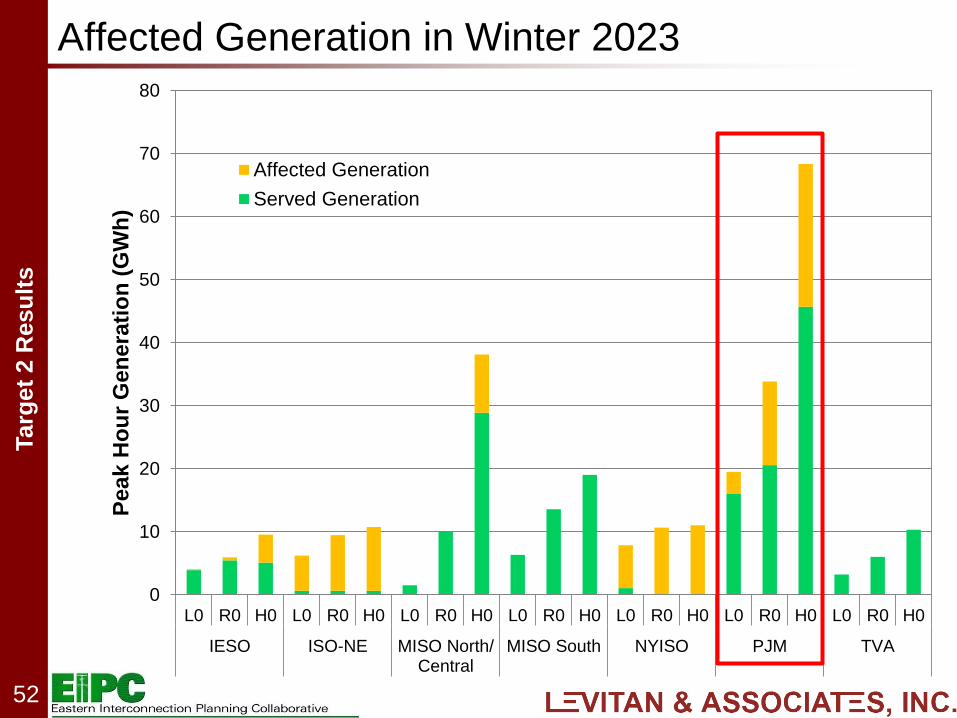
Affected Generation in Winter 2023
0
10
20
30
40
50
60
70
80
L0 R0 H0 L0 R0 H0 L0 R0 H0 L0 R0 H0 L0 R0 H0 L0 R0 H0 L0 R0 H0
IESO ISO-NE MISO North/Central
MISO South NYISO PJM TVA
Pea
k H
ou
r G
en
era
tio
n (
GW
h)
Affected Generation
Served Generation
Targ
et
2 R
esu
lts
53
Generators Downstream of Columbia Gas VA/MD Constraint
Columbia Gas VA/MDDirect-Connect GeneratorLDC-Served GeneratorDownstream Pipeline-Served GeneratorDownstream Pipeline LDC-Served Generator
RGDS Winter 2018
Targ
et
2 R
esu
lts
54
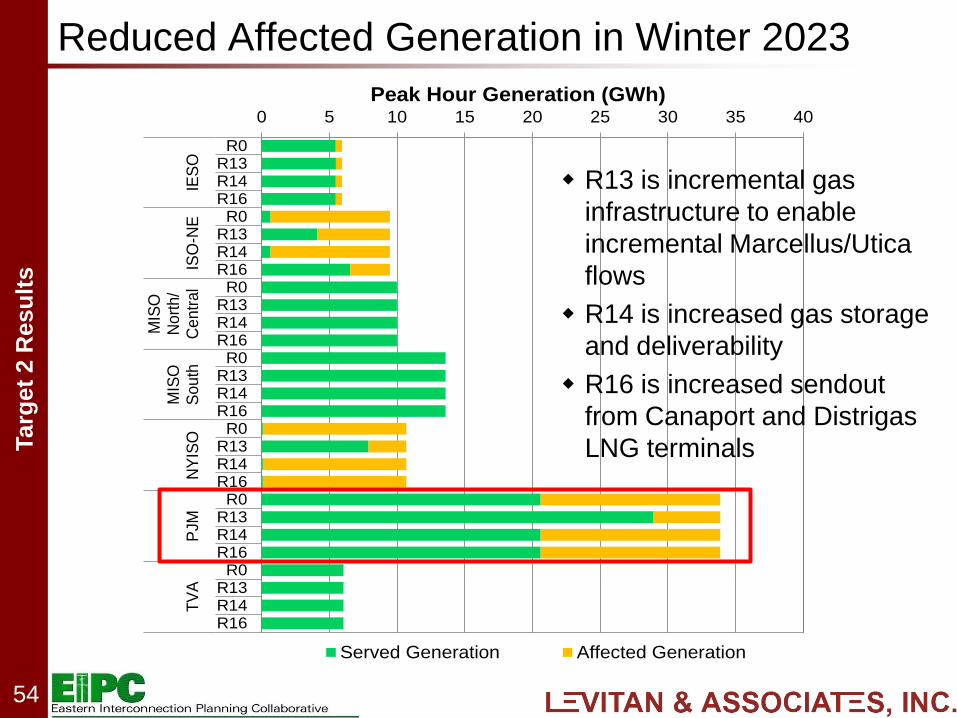
Reduced Affected Generation in Winter 2023
0 5 10 15 20 25 30 35 40
R0R13R14R16R0
R13R14R16R0
R13R14R16R0
R13R14R16R0
R13R14R16R0
R13R14R16R0
R13R14R16
IES
OIS
O-N
E
MIS
ON
ort
h/
Ce
ntr
al
MIS
OS
ou
thN
YIS
OP
JMT
VA
Peak Hour Generation (GWh)
Served Generation Affected Generation
R13 is incremental gas
infrastructure to enable
incremental Marcellus/Utica
flows
R14 is increased gas storage
and deliverability
R16 is increased sendout
from Canaport and Distrigas
LNG terminals
Targ
et
2 R
esu
lts
55
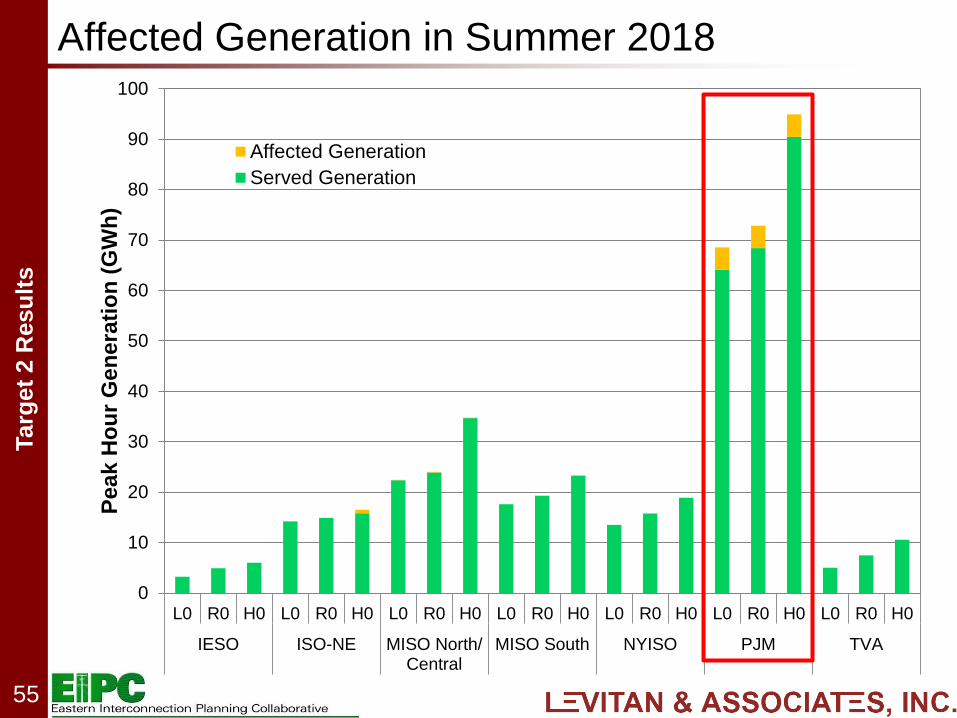
Affected Generation in Summer 2018
0
10
20
30
40
50
60
70
80
90
100
L0 R0 H0 L0 R0 H0 L0 R0 H0 L0 R0 H0 L0 R0 H0 L0 R0 H0 L0 R0 H0
IESO ISO-NE MISO North/Central
MISO South NYISO PJM TVA
Pea
k H
ou
r G
en
era
tio
n (
GW
h)
Affected Generation
Served Generation
Targ
et
2 R
esu
lts
56
TVA
Targ
et
2 R
esu
lts
57
TVA – PPA Highlights
Gas infrastructure is adequate under all market
conditions and resource mixes tested
Extensive network of pipelines serves TVA
TVA holds firm transportation entitlements to meet most
of its daily gas demands and has significant dual-fuel
capability
Targ
et
2 R
esu
lts
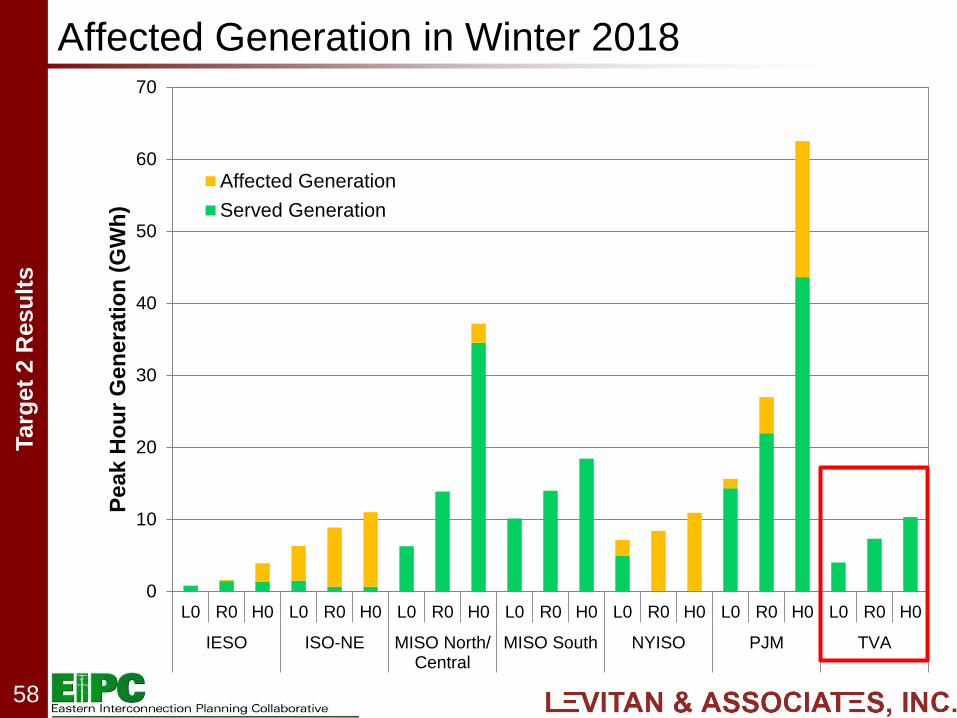
58
Affected Generation in Winter 2018
0
10
20
30
40
50
60
70
L0 R0 H0 L0 R0 H0 L0 R0 H0 L0 R0 H0 L0 R0 H0 L0 R0 H0 L0 R0 H0
IESO ISO-NE MISO North/Central
MISO South NYISO PJM TVA
Pea
k H
ou
r G
en
era
tio
n (
GW
h)
Affected Generation
Served Generation
Targ
et
2 R
esu
lts
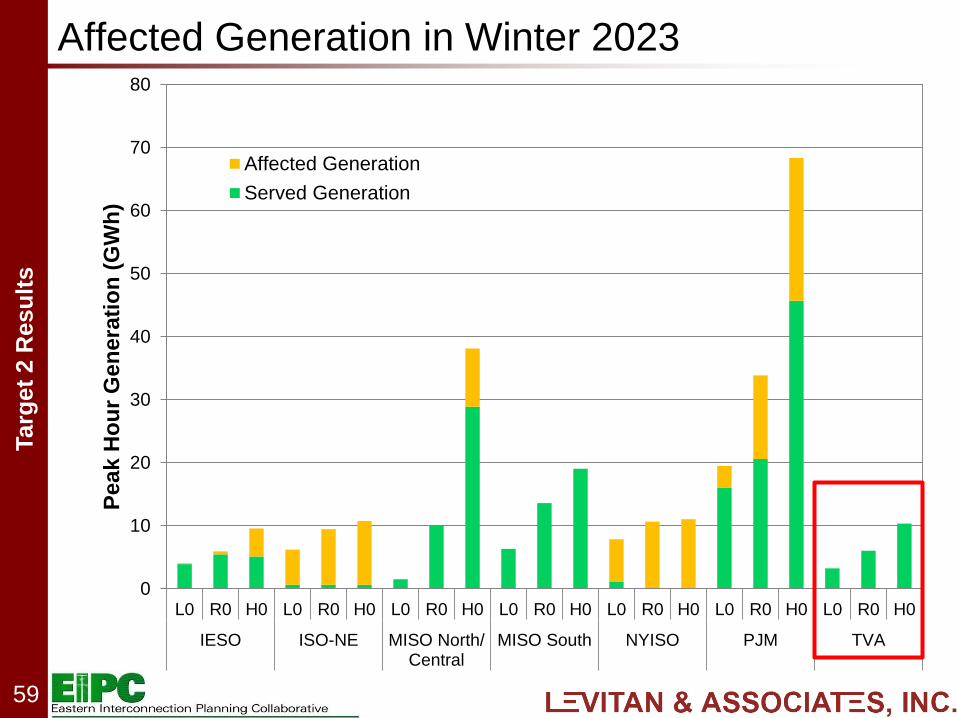
59
Affected Generation in Winter 2023
0
10
20
30
40
50
60
70
80
L0 R0 H0 L0 R0 H0 L0 R0 H0 L0 R0 H0 L0 R0 H0 L0 R0 H0 L0 R0 H0
IESO ISO-NE MISO North/Central
MISO South NYISO PJM TVA
Pea
k H
ou
r G
en
era
tio
n (
GW
h)
Affected Generation
Served Generation