Embed Size (px)
Citation preview
S
Columbia Basi Wildlife Comp Progra
Nelson,
Trevor
East Kootenay Badger Project 2004-2005 Update:
Ecology, Translocation, ightings and Communications
March, 2005
n Fish and Parks Canada Ministry of Water, Landensation Agency and Air Protection m BC Radium Hot Springs, BC Cranbrook, BC
Prepared by: A. Kinley, RPBio and Nancy J. Newhouse, RPBio
Sylvan Consulting Ltd. RR5, 3519 Toby Creek Road
Invermere, BC V0A 1K5 (250) 342-3205
Photo: Tim McAllister
i
Table of Contents Chapter 1. Spatial and Temporal Variability in the Ecology of the American Badger
at its Northwestern Range Limit 1 Abstract 1 Introduction 2 Study Area 2 Methods 5
Trapping and Monitoring 6 Litter Size Determination 6 Survivorship Determination and Population Projection 6 Diet Analysis 7 Home Range Determination 7 Juvenile Dispersal Measurement 8
Results 8 Capture and Age Summary 8 Reproductive Success 9 Mortality Causes and Survivorship 10 Population Projection 11 Diet 12 Home Ranges 13 Juvenile Dispersal 16
Discussion 17 Acknowledgements 20 Literature Cited 21 FIGURES Figure 1. Badger radiotelemetry study area in southeastern British Columbia. 3 Figure 2. Age at capture of 19 adult badgers. 9 Figure 3. Mean litter size as a function of maternal den location and year. 9 Figure 4. Kaplan-Meier survivorship for juvenile badgers. 10 Figure 5. Kaplan-Meier survivorship for adult badgers. 11 Figure 6. Effect of UTM northing and data on minimum number of ground squirrels per badger scat
or stomach. 13 Figure 7. Effect of UTM northing and data on minimum number of prey types in badger stomachs
or scats. 13 Figure 8. Fixed-kernel home ranges of resident adult badgers, maximum dispersals of juvenile
badgers, and telemetry locations of all adult and juvenile badgers. 14 Figure 9. Badger home range size in relation to median UTM northing of telemetry locations. 15 Figure 10. Badger home range size in relation to median date of telemetry locations. 16 Figure 11. Median UTM northing in relation to median date of telemetry locations. 16 Figure 12. Effect on observed dispersal distance of monitoring period. 17 TABLES Table 1. Age-class and sex summary of badgers captured in southeastern British Columbia. 8 Table 2. Annual survivorship of radiotagged adult badgers. 10 Table 3. Estimated rate of badger population increase based on 2 survivorship estimators. 12 Table 4. Incidence of prey items in badger scats and stomachs. 12 Table 5. Home ranges among radiotagged resident badgers. 15 Table 6. Dispersal from point of capture for badgers radiotagged as juveniles. 17 Table 7. Mean home ranges in relation to those reported in other studies. 19
2004-2005 Annual Update for the East Kootenay Badger Project March, 2005
ii
Chapter 2. Translocation to Aid Recovery of Badgers in the Rocky Mountain Trench, British Columbia. 23
Abstract 23 Introduction 23 Study Area 25 Methods 28
Translocation and Monitoring 28 Litter Size Determination and Tagging of Locally Born Offspring 29 Survivorship Determination and Population Projection 29 Diet Analysis 30 Adult Home Range and Post-Release Movement Determination 30 Measurement of Juvenile Dispersal or Post-Release Movement 31
Results 31 Releases and Monitoring 31 Kit Production 33 Survivorship 33 Diet 34 Adult Home Ranges and Post-Release Movements 34 Juvenile Dispersal or Post-Release Movement 35
Discussion 37 Acknowledgements 40 Literature Cited 40 FIGURES Figure 1. Target area for badgers translocated to the Rocky Mountain Trench. 27 Figure 2. Dates of release of badgers and of radiotagged juveniles born to those animals. 31 Figure 3. Maximum known movements of adult and juvenile translocated badgers. 32 Figure 4. Kaplan-Meier weekly survivorship curves for adult badgers with known fates. 34 Figure 5. Fixed-kernel home ranges (95%) of adult badgers and radiolocations of adult and
juvenile badgers. 36 TABLES Table 1. Incidence of prey items in badger diets form capture area and relocation area. 35 Table 2. Home ranges of translocated adult badgers. 35 Chapter 3. Badger Sightings Reported by the Public 43 Figure 1. Locations of badger sightings reported by the public within the East Kootenay region
and west slope of Purcell Mountains to February 2005. 44 Chapter 4. Communications Update 45 Introduction 45 Badger Hotline 45 Websites 46 Portable Display 46 Presentations 47 Television, Radio, Magazine, Brochure and Newspaper Coverage 47 FIGURES Figure 1. Badger sightings notice from BC Hunting and Trapping Regulations 2004/05. 46 Figure 2. Badger translocation article from The Force (Golden). 47 Figure 3. Badger translocation article from The Golden Star. 48 Figure 4. Badger translocation article from East Kootenay Extra (Cranbrook). 49 Figure 5. Badger translocation article from The Valley Echo (Invermere). 50
2004-2005 Annual Update for the East Kootenay Badger Project March, 2005
1
Chapter 1. Spatial and Temporal Variability in the Ecology of the American Badger
at its Northwestern Range Limit
This chapter updates methods and results presented in 2004 and is intended to be submitted, with minor
modifications, as a journal manuscript.
Abstract
American badgers (Taxidea taxus) are federally endangered and provincially red-listed in British
Columbia (jeffersonii subspecies). We radiotagged and monitored 31 badgers near their range limit in
southeastern BC to determine local ecological characteristics, with an emphasis on illustrating expected
variability, both temporal (from 1996 through 2005) and spatial (from north to south within the Rocky
Mountain Trench). The median age at capture was 3 years in the north and 4 years in the south.
Mortality causes among residents included: unknown, roadkill, probable or possible predation, train kill,
probable starvation (a juvenile), and probable old age. For the northern and southern areas combined,
annual home ranges of resident adults averaged 3 to 150 times larger than reported from previous
studies conducted in the USA, with 95% fixed-kernel means of 18 km2 for females and 64 km2 for males.
Juvenile dispersals were longer and occurred later for males than females. Space-use and demography
varied along a north-south gradient, with southern animals having higher reproductive output, lower
mortality, and smaller home ranges. Population projections from the south suggested population growth
of over 20% annually, and female home ranges there were as small as recorded in several studies
conducted in the USA. In contrast, projections from the north indicated rapid population decline (annual
adult survivorship of < 70%, no recruitment). However, monitoring shifted southward over the course of
the study, so demographic and home-range trends correlate to the same degree with time as with space.
This suggests that changes in ecological conditions over the period of this study may have played as
strong a role in badger ecology as intrinsic differences from north to south. Continued monitoring of
residents in the south and recently translocated animals in the north should indicate which of the space-
difference versus time-difference scenarios is more likely. Our research suggests that demographic and
space-use conditions may vary over both space and time at the range limit of species, long-term
monitoring may be required to detect this, and augmenting populations may act as a test of whether
current range limits are determined by a long-term or temporary lack of suitability. For any taxon, short-
term observations suggesting range-limit areas have lost the capability to support populations should be
considered in light of these results.
2004-2005 Annual Update for the East Kootenay Badger Project March, 2005
2
Introduction
The northwestern limit of American badger (Taxidea taxus) distribution is within south-central and
southeastern British Columbia (Newhouse and Kinley 2000). The subspecies present there (T. t.
jeffersonii) has recently been listed as endangered in Canada (COSEWIC 2003). It is also “red-listed” by
the provincial Conservation Data Centre due to large home ranges, declining populations, loss of habitat
and prey, and potential for high mortality from roadkills and shooting (Cannings et al. 1999).
Badger research from other jurisdictions has been conducted in open, often agricultural landscapes (Salt
1976, Todd 1980, Lampe 1982, Warner and Ver Steeg 1995) and grassland or shrub-steppe habitats
(Messick and Hornocker 1981, Goodrich 1994, Hoff 1998), although they are known to occur from below
sea level to elevations over 3,600 m (Lindzey 1982). In British Columbia, they are believed to occur
mainly within open habitats at lower elevations (Rahme et al. 1995). There is considerable regional
variation in home range size, but all studies have found males to have larger home ranges than females
(Messick and Hornocker 1981, Minta 1993, Goodrich 1994, Warner and Ver Steeg 1995, Hoff 1998).
Fossorial prey is the primary diet in most locations (Salt 1976, Lampe 1982), but badgers also eat a wide
variety of mammals, birds, eggs, reptiles, amphibians, invertebrates, and plants (Messick 1987). Data
from Idaho suggests that conception generally occurs in late July and August, with litters of 1 to 4 born
from mid-March to mid-April (Messick and Hornocker 1981).
Given British Columbia’s peripheral location within badger range and the its population of only 250-600
animals distributed over 120,000 km2 (Newhouse and Kinley 2000), we anticipated that badger ecology
might differ from that reported from other jurisdictions more central to badger range and might also vary
over space and time within our study area. Therefore, we initiated telemetry-based research in 1996 to
gain an understanding of space-use characteristics, diet, and demographic trends of this range-limit
population, particularly with reference to temporal and spatial variability. We have since developed a
spatially-explicit resource selection function spanning 2 spatial scales (Apps et al. 2002). Translocation of
badgers from northwestern Montana to the northern portion of our study area began in 2002, but final
results are not yet available.
Study Area
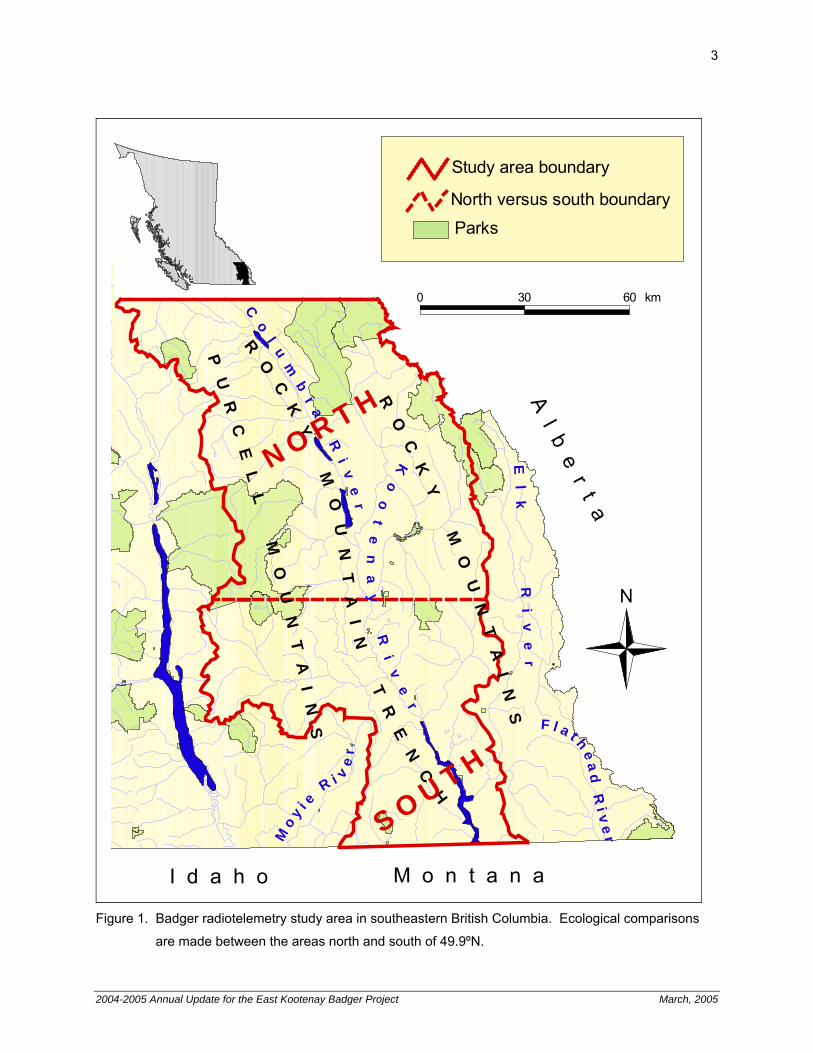
Our study area in southeastern British Columbia (Figure 1) extended east-west between the heights-of-
land of the Rocky and Purcell mountains, and from the USA border (49°N) to 51°N, with the exception of
the Elk, Flathead and Moyie river drainages. Elevations within the 2 mountain ranges extend to 3,618
and 3,457 m respectively. The Rocky Mountain Trench separates the Rockies from the Purcells and has
2004-2005 Annual Update for the East Kootenay Badger Project March, 2005
3
RO
CK
Y
MO
UN
TA
IN
S
PU
RC
E
Y
CH
N O R T H
S O U T H
LL
M
OU
NT
AI
NS
RO
CK
M
OU
NT
AI
N
TR
EN
M o n t a n aI d a h o
Al
be
rt
a
F l a t he
ad
Ri v
er
El
k
Ri
ve
rM
oy i e
Ri v
er
Co
lu
mb
ia
Ri
ve
r
Ko
ot
en
ay
R
iv
er
Parks
Study area boundary
North versus south boundary
0 30 km60
N
Figure 1. Badger radiotelemetry study area in southeastern British Columbia. Ecological comparisons
are made between the areas north and south of 49.9ºN.
2004-2005 Annual Update for the East Kootenay Badger Project March, 2005
4
a minimum elevation of 695 m. Along the Trench floor, the Columbia River flows north from Columbia
Lake, while the Kootenay River enters the Trench immediately south of Columbia Lake and flows
southward. Biogeoclimatic zones follow an elevation sequence from the Ponderosa Pine (PP) at the
lowest elevations in the warmest, driest areas, through the Interior Douglas-fir (IDF), Montane Spruce
(MS), Engelmann Spruce – Subalpine Fir (ESSF) and Alpine Tundra (AT) zones. In some tributaries of
the Trench receiving higher precipitation, the Interior Cedar – Hemlock (ICH) zone occurs in place of the
MS (Braumandl and Curran 1992). The distribution of the PP and IDF correspond approximately to the
Rocky Mountain Trench. These zones were historically dominated by open forests of ponderosa pine
(Pinus ponderosa) and Douglas-fir (Pseudotsuga menziesii) respectively on zonal sites, grasslands or
grass-shrublands on more xeric sites, and extensive marsh and forested riparian habitat along rivers.
However, human settlement within the IDF and PP has resulted in much residential, recreational, road,
and agricultural development along the valley bottoms, along with conifer encroachment into former open
forest and grassland due to fire suppression (Gayton 1996). Climax forests in the MS are closed-canopy
stands of hybrid white spruce (Picea glauca x engelmannii), in the Interior Cedar Hemlock are western
redcedar (Thuja plicata) and western hemlock (Tsuga heterophylla) and in the ESSF are Engelmann
spruce (Picea engelmannii) and subalpine fir (Abies lasiocarpa). However, the MS, ICH and ESSF have
an extensive history of fire and timber harvesting, so also include roads, cutblocks, burns, and forest
stands of varying ages with a high proportion of lodgepole pine (Pinus contorta) and other tree species.
The AT is non-forested.
Potential fossorial and semi-fossorial prey species using open habitats include Columbian ground
squirrels (Spermophilus columbianus), which occur in natural or human-caused openings in all
biogeoclimatic zones; northern pocket gophers (Thomomys talpoides), which are patchily distributed at
the lowest elevations in the PP and IDF in the southern end of the study area; meadow voles (Microtus
pennsylvanicus) which occur on moist sites in all biogeoclimatic zones; and hoary marmots (Marmota
caligata) which occur sporadically in the AT. Other carnivores within the study area include coyotes
(Canis latrans), bobcats (Lynx rufus) and cougars (Puma concolor), which occur in all biogeoclimatic
zones during summer but are mainly restricted to the MS, ICH and especially PP and IDF during winter;
wolves (Canis lupus) and grizzly bears (Ursus arctos), which are widespread but less common in the PP
and IDF than in other zones; red foxes (Vulpes vulpes), which are rare and localized in the PP, IDF, MS
and ICH and are nearly absent from the northern part of the study area; Canada lynx (Lynx canadensis),
which occur mainly in the ICH, MS and ESSF; and black bears (Ursus americanus), which are
widespread in all zones except the AT. There is no legal hunting or trapping season for badgers in our
study area.
While the study area covered about 20,000 km2 and we monitored radiotagged badgers making forays
into the Rocky and Purcell mountains, almost all research and badger activity occurred within a 4,000-km2
2004-2005 Annual Update for the East Kootenay Badger Project March, 2005
5
area in the Rocky Mountain Trench or at the mouths of major tributary valleys. The northern and southern
portions of the Trench differ in several respects. North of the confluence of the Kootenay River with the
Lussier River (49.9ºN), the Rocky Mountain Trench is narrower (3-12 km versus 12-30 km wide), lacks
pocket gophers, lacks the PP zone, has slightly higher valley-bottom elevations, includes several
locations where villages or resort communities extend across at least 1 side of the Trench from valley
floor to mountainside, and includes the normal limit of badger distribution. Several comparisons in this
paper are drawn between these 2 portions of the study area, hereafter referred to as “north” and “south”.
Methods
Trapping and Monitoring
We identified trap sites by field-checking locations of previous sightings (see Chapter 3) or known
colonies of Columbian ground squirrels. We trapped badgers at burrow entrances, generally using
unbaited #11/2 soft-catch leghold traps, and checked traps at least daily. We noosed and hand-injected
trapped badgers with either 10 mg/kg of tiletamine hydrochloride/zolazepam hydrochloride mixed at 100
mg/ml, or a combination of 0.3 mg/kg of midazolam mixed at 1.0 mg/ml and 9 mg/kg of ketamine
hydrochloride mixed at 100 mg/ml. Surgical implantation of intraperitoneal transmitters (Advanced
Telemetry Systems, Isanti, Minnesota) was conducted either in a veterinary clinic or in the field following
Hoff (1988). While badgers were immobilized, we took samples of blood, feces and hair, and an upper
premolar tooth. When badgers were alert, we released them either at the original trap sites if the burrow
was still intact, or at nearby burrows. Teeth of adult study animals were sent to Matson’s Lab (Milltown,
Montana) for aging. All methods were approved by the British Columbia Animal Care Committee.
Generally, we located animals weekly from April through September and twice-monthly to monthly from
October through March, although the schedule varied with budget and weather. We located animals from
the air using a telemetry-equipped Cessna 172 aircraft. For approximately half of locations used in this
analysis, we then employed ground-based telemetry to locate badgers in their burrows. Locations were
marked on 1:20,000 air photos and transferred to 1:20,000 provincial forest inventory planning maps,
from which Universal Transverse Mercator (UTM) grid coordinates were determined. With the possible
exception of some air-only locations, all data points were of badgers in burrows rather than above ground.
When the mortality sensor on a radioimplant was motionless for 4 hours, it caused a doubling of the
implant’s pulse frequency. When detected, the site was visited and carcass or implant recovered to
confirm that a mortality had occurred. Data reported here were collected from June 1996 to November
2003 for the north, and July 1997 to February 2005 for the south.
2004-2005 Annual Update for the East Kootenay Badger Project March, 2005
6
Litter Size Determination
We determined minimum initial litter sizes from direct observations of burrows of all females 1 year and
older. Females with litters tended to have large natal burrows (evident from large mounds of recently
excavated soil), use a small area over several weeks, be active throughout the day, and bring prey back
to the burrow. The most obvious indications of kit presence and numbers were that the kits typically
spent considerable time playing aboveground at the burrow site. In addition, we checked all females at
the time of capture for signs of lactation (swollen nipples with worn hair around them). We developed
linear regressions of litter size in relation to both UTM northing and year, and conducted F-tests for
significance of regression equations. All statistical tests were performed with the program JMP IN (SAS
Institute, Inc., Cary, North Carolina).
Survivorship Determination and Population Projection
The modified Kaplan-Meier method was employed to determine juvenile survivorship, following the
staggered-entry technique described by Pollock et al. (1989). We assumed a 15 April birthdate, analyzed
the data as if all animals had been born in the same year, and terminated the analysis at 52 weeks. The
survivorship function and 95% confidence intervals for each week were calculated and plotted. Badgers
tagged as juveniles but surviving to 15 April were included in the adult sample thereafter. We also
employed the modified Kaplan-Meier method to determine adult survivorship. The survivorship function
and 95% confidence intervals for each week were calculated and plotted. Following this, annual adult
survivorship was extrapolated by taking the nth root of the cumulative weekly survivorship, where n is the
number of years. This was determined for all animals combined, all males, all females, all animals from
the north, and all animals in the south. All study animals from the north died prior to the analysis
completion date, so an extrapolation of annual rates using Kaplan-Meier methods would have either
yielded a result of 0 (if done after the final mortality) or would have been unrealistically high (if calculated
immediately prior to the final mortality). Thus, annual adult survivorship was also calculated for all
classes using the Mayfield method (Winterstein et al. 2001). For both methods, the date of death was
assumed to be the midway point between the last live telemetry date and the date on which the animal
was found dead, unless there was evidence of the exact time of death (i.e. report of the animal being hit
by a train or car). For data censored due to telemetry contact being lost, the censure date was assumed
to be the midway point between the last successful telemetry location and the first failed attempt at
telemetry thereafter. Doing so resulted in an unknown degree of error but prevented the negative bias
associated with using the last telemetry location or last live date as the censure or mortality date. One
tagged female hit by a vehicle was treated and successfully released, but would otherwise have died, so
was considered a mortality for the purposes of survivorship calculations and mortality-cause
determination. She was re-entered into the survivorship database on the date she was released after
recovery. We analyzed data only from animals living within the Rocky Mountain Trench (others may not
have been part of the same population) and surviving ≥ 1 week after radiotagging.
2004-2005 Annual Update for the East Kootenay Badger Project March, 2005
7
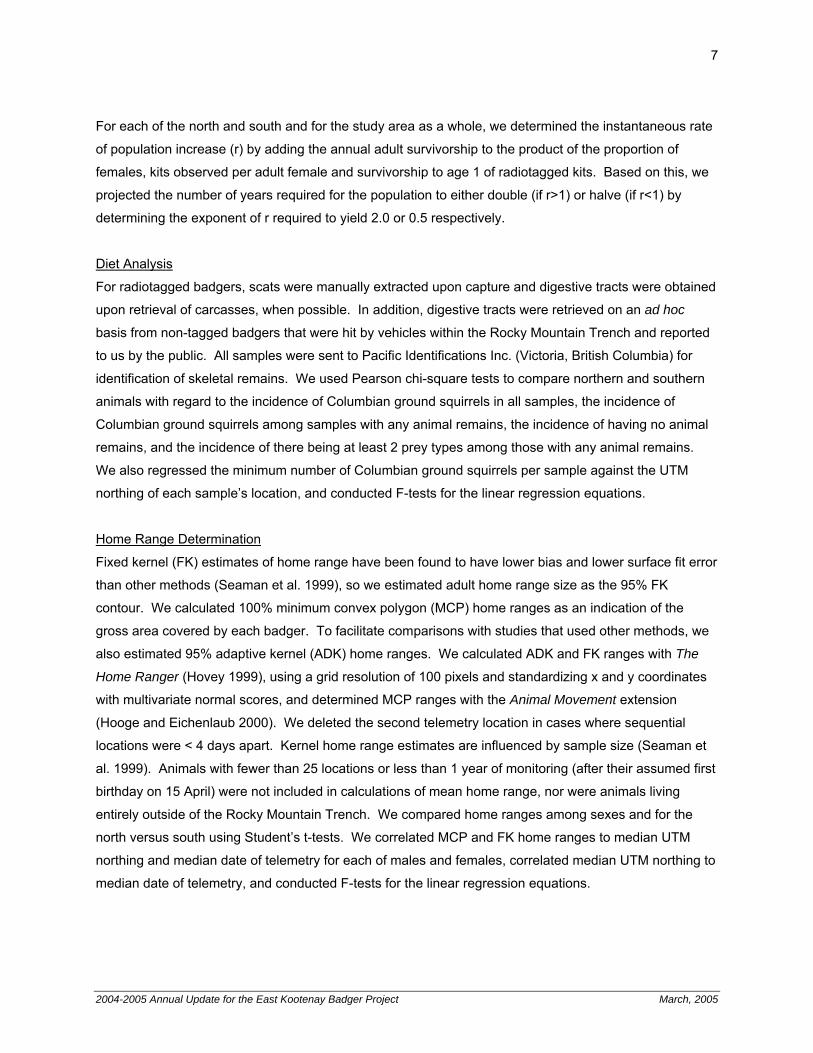
For each of the north and south and for the study area as a whole, we determined the instantaneous rate
of population increase (r) by adding the annual adult survivorship to the product of the proportion of
females, kits observed per adult female and survivorship to age 1 of radiotagged kits. Based on this, we
projected the number of years required for the population to either double (if r>1) or halve (if r<1) by
determining the exponent of r required to yield 2.0 or 0.5 respectively.
Diet Analysis
For radiotagged badgers, scats were manually extracted upon capture and digestive tracts were obtained
upon retrieval of carcasses, when possible. In addition, digestive tracts were retrieved on an ad hoc
basis from non-tagged badgers that were hit by vehicles within the Rocky Mountain Trench and reported
to us by the public. All samples were sent to Pacific Identifications Inc. (Victoria, British Columbia) for
identification of skeletal remains. We used Pearson chi-square tests to compare northern and southern
animals with regard to the incidence of Columbian ground squirrels in all samples, the incidence of
Columbian ground squirrels among samples with any animal remains, the incidence of having no animal
remains, and the incidence of there being at least 2 prey types among those with any animal remains.
We also regressed the minimum number of Columbian ground squirrels per sample against the UTM
northing of each sample’s location, and conducted F-tests for the linear regression equations.
Home Range Determination
Fixed kernel (FK) estimates of home range have been found to have lower bias and lower surface fit error
than other methods (Seaman et al. 1999), so we estimated adult home range size as the 95% FK
contour. We calculated 100% minimum convex polygon (MCP) home ranges as an indication of the
gross area covered by each badger. To facilitate comparisons with studies that used other methods, we
also estimated 95% adaptive kernel (ADK) home ranges. We calculated ADK and FK ranges with The
Home Ranger (Hovey 1999), using a grid resolution of 100 pixels and standardizing x and y coordinates
with multivariate normal scores, and determined MCP ranges with the Animal Movement extension
(Hooge and Eichenlaub 2000). We deleted the second telemetry location in cases where sequential
locations were < 4 days apart. Kernel home range estimates are influenced by sample size (Seaman et
al. 1999). Animals with fewer than 25 locations or less than 1 year of monitoring (after their assumed first
birthday on 15 April) were not included in calculations of mean home range, nor were animals living
entirely outside of the Rocky Mountain Trench. We compared home ranges among sexes and for the
north versus south using Student’s t-tests. We correlated MCP and FK home ranges to median UTM
northing and median date of telemetry for each of males and females, correlated median UTM northing to
median date of telemetry, and conducted F-tests for the linear regression equations.
2004-2005 Annual Update for the East Kootenay Badger Project March, 2005
8
Juvenile Dispersal Measurement
Dispersal distance of animals tagged as juveniles was considered to be the maximum distance from the
point of capture (generally the maternal burrow) recorded for the animal, regardless of the age at which
this occurred. We used Student’s t-tests to compare between sexes the age of initial dispersal (i.e. ≥ 1
km from the point of capture), maximum dispersal distance, and age at maximum dispersal. We also
used a Student’s t-test to compare length of monitoring periods between sexes. We developed linear
regressions of maximum dispersal distance in relation to monitoring period for males and females
separately, and conducted F-tests for significance of regression equations. The age at first dispersal
(assuming a birth date of 15 April) was based on the midpoint between the last telemetry location at the
maternal burrow and the first telemetry location > 1 km from it.
Results
Capture and Age Summary
Between June 1996 and June 2002, we successfully radiotagged and monitored 30 badgers within the
Rocky Mountain Trench (Table 1). Another adult female was radiotagged but died from a complication of
surgery, 2 juvenile males were eartagged only as they were too small for implants, and 1 adult male was
captured in the Rocky Mountains and subsequently remained there. Eight study animals were from the
northern portion of the study area, of which only 1 was captured after 1998 because we detected burrows
of only 1 non-tagged badger there from 1999 through 2002. Captures in the south were from 1997
through 2002. Including those not monitored, 17 of each sex were captured; within the Trench there were
16 males and 17 females. No significant trap-related injuries were detected.
Table 1. Age-class and sex summary of badgers captured in southeastern British Columbia, 1996 - 2002.
Juveniles are those < 1 year old on the date of capture.
Area - Category Adult M Adult F Juvenile M Juvenile F Total
North - radiotagged 3 3 0 0 6
North - other a 1 1 0 0 2
South - radiotagged 7 6 4 7 24
South - other a 0 0 2 0 2
TOTAL 11 10 6 7 34 a not radiotagged, died from surgery complications, or home range outside of Rocky Mountain Trench
Ages of adults at the time of capture varied from 1 to 12 years (Figure 2). Juveniles are excluded from
the chart as we specifically targeted them for capture in many cases. The age of 1 adult male could not
be determined. A comparison of the north to the south was limited by the small sample in relation to the
2004-2005 Annual Update for the East Kootenay Badger Project March, 2005
9
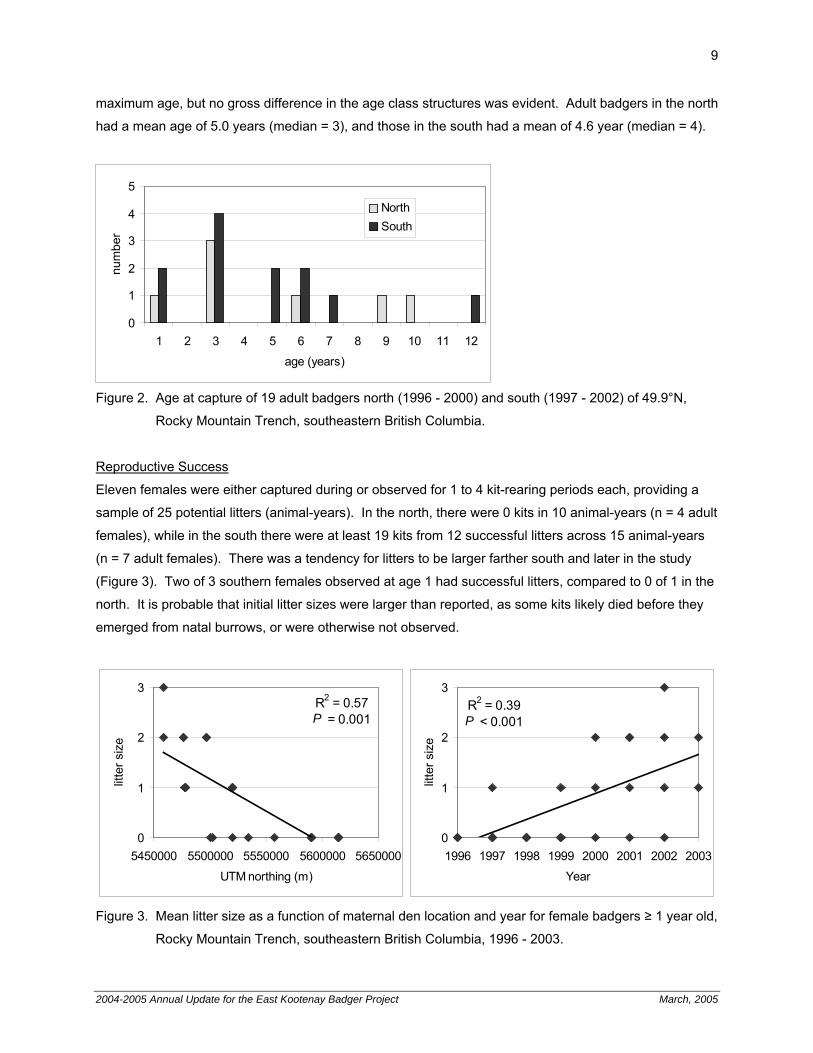
maximum age, but no gross difference in the age class structures was evident. Adult badgers in the north
had a mean age of 5.0 years (median = 3), and those in the south had a mean of 4.6 year (median = 4).
0
1
2
3
4
5
1 2 3 4 5 6 7 8 9 10 11 12
age (years)
num
ber
NorthSouth
Figure 2. Age at capture of 19 adult badgers north (1996 - 2000) and south (1997 - 2002) of 49.9°N,
Rocky Mountain Trench, southeastern British Columbia.
Reproductive Success
Eleven females were either captured during or observed for 1 to 4 kit-rearing periods each, providing a
sample of 25 potential litters (animal-years). In the north, there were 0 kits in 10 animal-years (n = 4 adult
females), while in the south there were at least 19 kits from 12 successful litters across 15 animal-years
(n = 7 adult females). There was a tendency for litters to be larger farther south and later in the study
(Figure 3). Two of 3 southern females observed at age 1 had successful litters, compared to 0 of 1 in the
north. It is probable that initial litter sizes were larger than reported, as some kits likely died before they
emerged from natal burrows, or were otherwise not observed.
R2 = 0.57P = 0.001
0
1
2
3
5450000 5500000 5550000 5600000 5650000
UTM northing (m)
litte
r siz
e
R2 = 0.39P < 0.001
0
1
2
3
1996 1997 1998 1999 2000 2001 2002 2003
Year
litte
r siz
e
Figure 3. Mean litter size as a function of maternal den location and year for female badgers ≥ 1 year old,
Rocky Mountain Trench, southeastern British Columbia, 1996 - 2003.
2004-2005 Annual Update for the East Kootenay Badger Project March, 2005
10
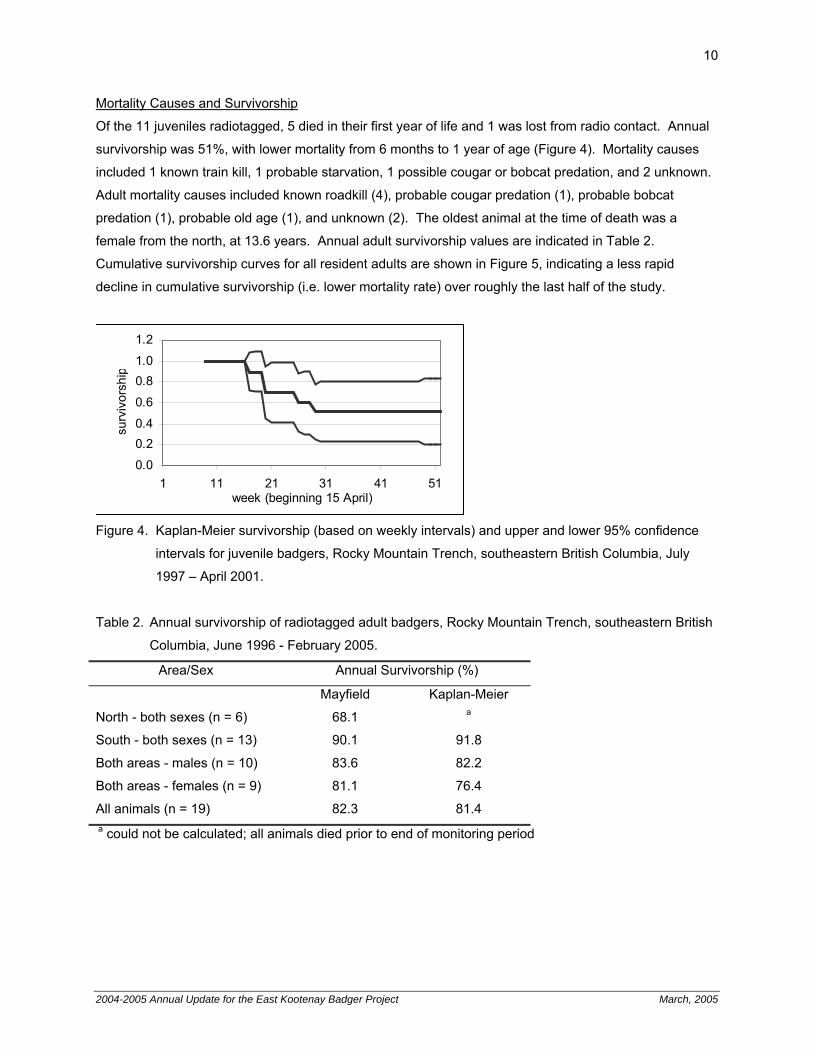
Mortality Causes and Survivorship
Of the 11 juveniles radiotagged, 5 died in their first year of life and 1 was lost from radio contact. Annual
survivorship was 51%, with lower mortality from 6 months to 1 year of age (Figure 4). Mortality causes
included 1 known train kill, 1 probable starvation, 1 possible cougar or bobcat predation, and 2 unknown.
Adult mortality causes included known roadkill (4), probable cougar predation (1), probable bobcat
predation (1), probable old age (1), and unknown (2). The oldest animal at the time of death was a
female from the north, at 13.6 years. Annual adult survivorship values are indicated in Table 2.
Cumulative survivorship curves for all resident adults are shown in Figure 5, indicating a less rapid
decline in cumulative survivorship (i.e. lower mortality rate) over roughly the last half of the study.
0.0
0.20.4
0.6
0.81.0
1.2
1 11 21 31 41 51week (beginning 15 April)
surv
ivor
ship
Figure 4. Kaplan-Meier survivorship (based on weekly intervals) and upper and lower 95% confidence
intervals for juvenile badgers, Rocky Mountain Trench, southeastern British Columbia, July
1997 – April 2001.
Table 2. Annual survivorship of radiotagged adult badgers, Rocky Mountain Trench, southeastern British
Columbia, June 1996 - February 2005.
Area/Sex Annual Survivorship (%)
Mayfield Kaplan-Meier
North - both sexes (n = 6) 68.1 a
South - both sexes (n = 13) 90.1 91.8
Both areas - males (n = 10) 83.6 82.2
Both areas - females (n = 9) 81.1 76.4
All animals (n = 19) 82.3 81.4 a could not be calculated; all animals died prior to end of monitoring period
2004-2005 Annual Update for the East Kootenay Badger Project March, 2005
11
both areasmales
-0.4-0.20.00.20.40.60.81.01.21.4
0 100 200 300 400
week (beginning 20 June 1996)
surv
ivor
ship
both areasfemales
-0.4-0.20.00.20.40.60.81.01.21.4
0 100 200 300 400
week (beginning 20 June 1996)
surv
ivor
ship
northboth sexes
-0.4-0.20.00.20.40.60.81.01.21.4
0 100 200 300 400
week (beginning 20 June 1996)
surv
ivor
ship
southboth sexes
-0.4-0.20.00.20.40.60.81.01.21.4
0 100 200 300 400
week (beginning 20 June 1996)
surv
ivor
ship
both areasboth sexes
-0.4-0.20.00.20.40.60.81.01.21.4
0 100 200 300 400
week (beginning 20 June 1996)
surv
ivor
ship
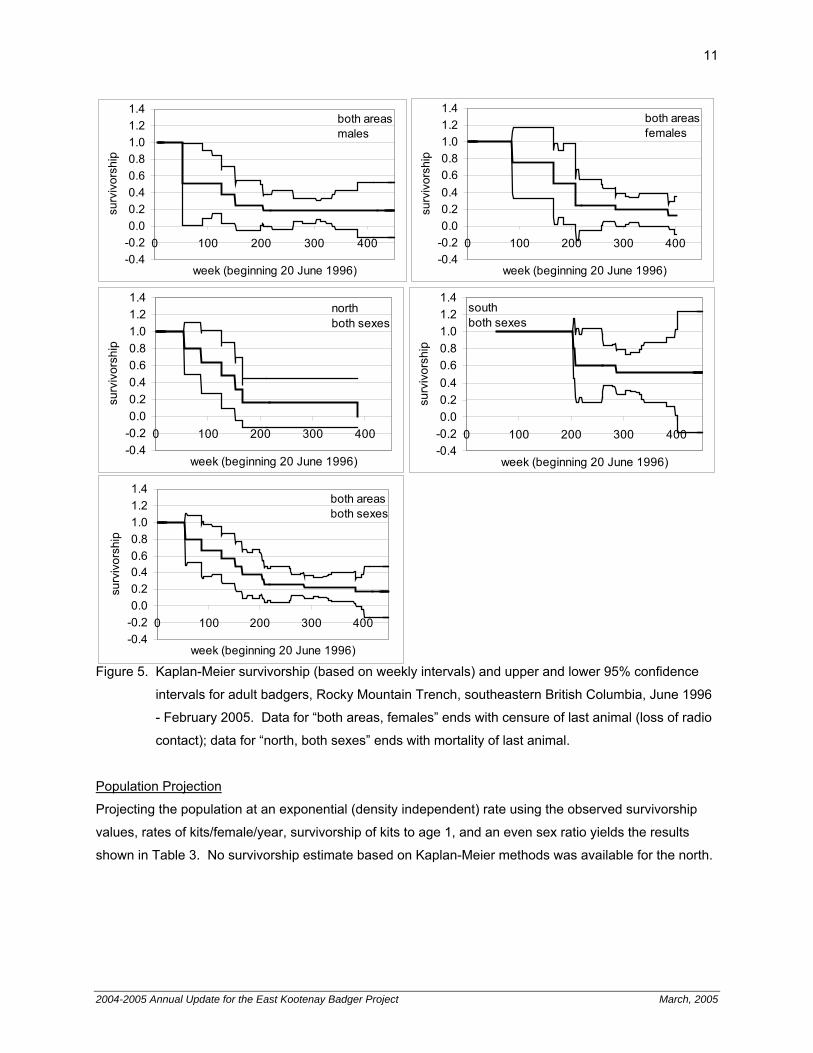
Figure 5. Kaplan-Meier survivorship (based on weekly intervals) and upper and lower 95% confidence
intervals for adult badgers, Rocky Mountain Trench, southeastern British Columbia, June 1996
- February 2005. Data for “both areas, females” ends with censure of last animal (loss of radio
contact); data for “north, both sexes” ends with mortality of last animal.
Population Projection
Projecting the population at an exponential (density independent) rate using the observed survivorship
values, rates of kits/female/year, survivorship of kits to age 1, and an even sex ratio yields the results
shown in Table 3. No survivorship estimate based on Kaplan-Meier methods was available for the north.
2004-2005 Annual Update for the East Kootenay Badger Project March, 2005
12
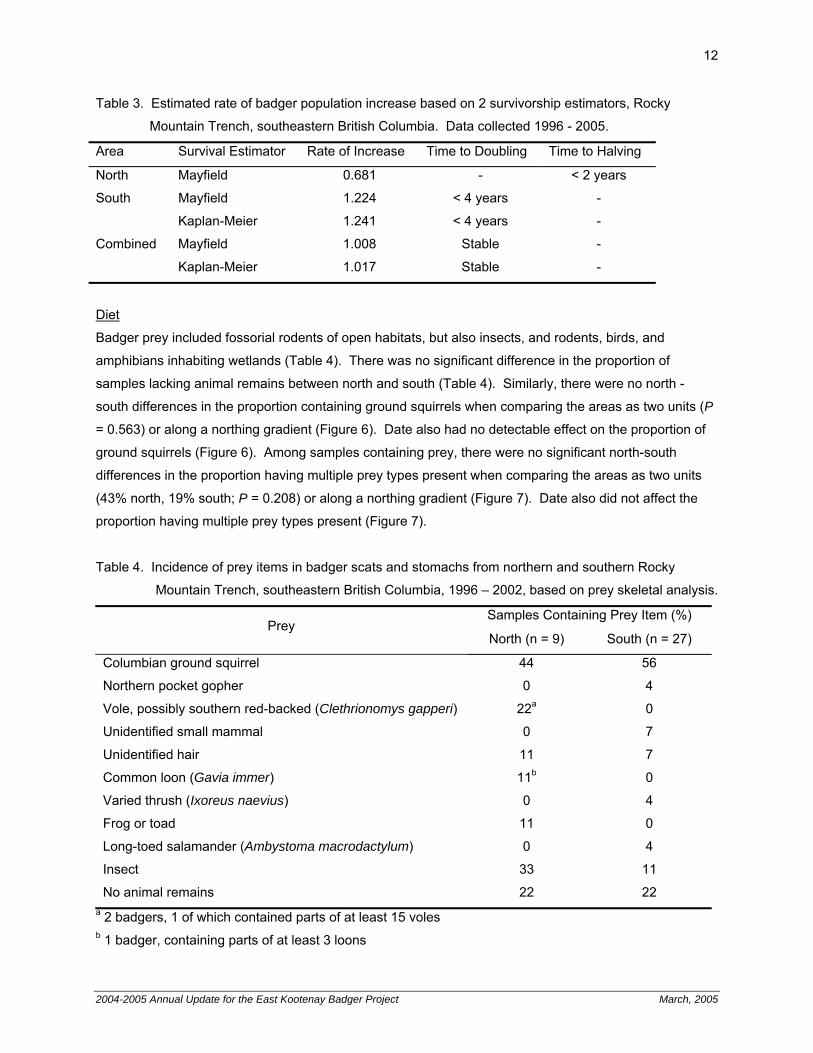
Table 3. Estimated rate of badger population increase based on 2 survivorship estimators, Rocky
Mountain Trench, southeastern British Columbia. Data collected 1996 - 2005.
Area Survival Estimator Rate of Increase Time to Doubling Time to Halving
North Mayfield 0.681 - < 2 years
South Mayfield 1.224 < 4 years -
Kaplan-Meier 1.241 < 4 years -
Combined Mayfield 1.008 Stable -
Kaplan-Meier 1.017 Stable -
Diet
Badger prey included fossorial rodents of open habitats, but also insects, and rodents, birds, and
amphibians inhabiting wetlands (Table 4). There was no significant difference in the proportion of
samples lacking animal remains between north and south (Table 4). Similarly, there were no north -
south differences in the proportion containing ground squirrels when comparing the areas as two units (P
= 0.563) or along a northing gradient (Figure 6). Date also had no detectable effect on the proportion of
ground squirrels (Figure 6). Among samples containing prey, there were no significant north-south
differences in the proportion having multiple prey types present when comparing the areas as two units
(43% north, 19% south; P = 0.208) or along a northing gradient (Figure 7). Date also did not affect the
proportion having multiple prey types present (Figure 7).
Table 4. Incidence of prey items in badger scats and stomachs from northern and southern Rocky
Mountain Trench, southeastern British Columbia, 1996 – 2002, based on prey skeletal analysis.
Samples Containing Prey Item (%) Prey
North (n = 9) South (n = 27)
Columbian ground squirrel 44 56
Northern pocket gopher 0 4
Vole, possibly southern red-backed (Clethrionomys gapperi) 22a 0
Unidentified small mammal 0 7
Unidentified hair 11 7
Common loon (Gavia immer) 11b 0
Varied thrush (Ixoreus naevius) 0 4
Frog or toad 11 0
Long-toed salamander (Ambystoma macrodactylum) 0 4
Insect 33 11
No animal remains 22 22 a 2 badgers, 1 of which contained parts of at least 15 voles b 1 badger, containing parts of at least 3 loons
2004-2005 Annual Update for the East Kootenay Badger Project March, 2005
13
R2 = 0.09P = 0.079
0
1
2
3
5450000 5500000 5550000 5600000 5650000UTM northing of sample (m)
grd.
squ
irrel
s/sa
mpl
e R2 = 0.07P = 0.112
0
1
2
3
15-May-96
15-May-97
15-May-98
15-May-99
14-May-00
14-May-01
14-May-02
14-May-03
date of sample
grd.
squ
irrel
s/sa
mpl
e
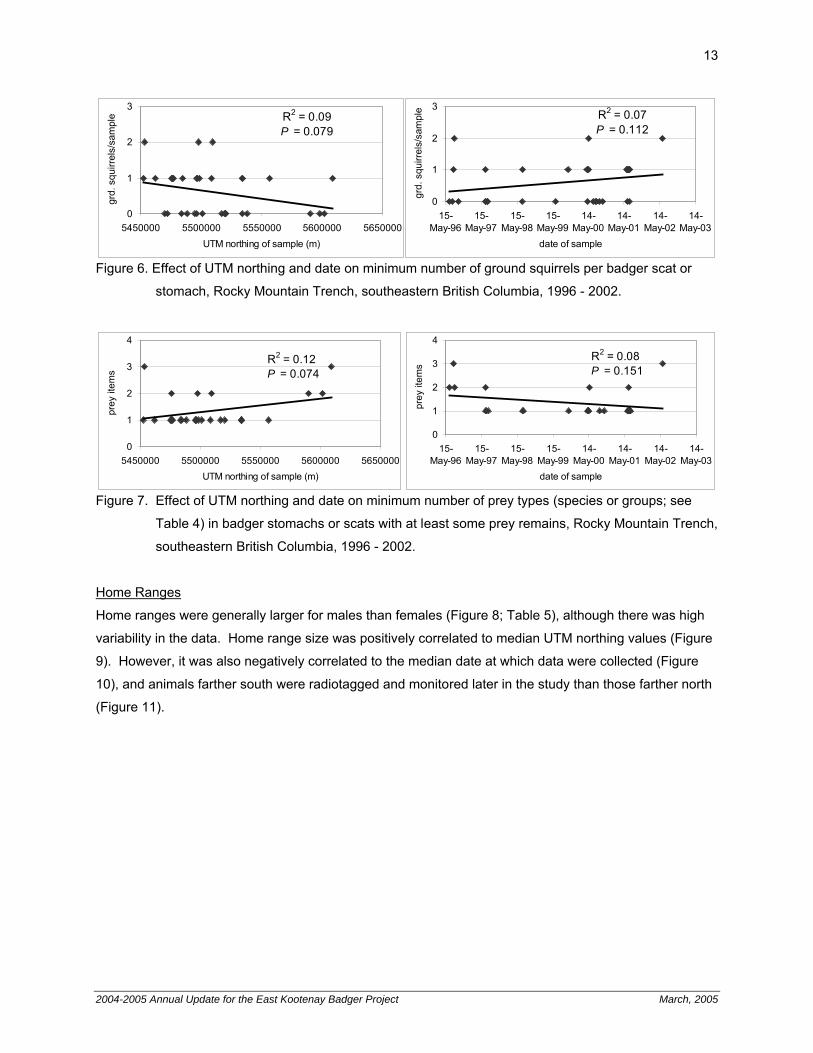
Figure 6. Effect of UTM northing and date on minimum number of ground squirrels per badger scat or
stomach, Rocky Mountain Trench, southeastern British Columbia, 1996 - 2002.
R2 = 0.08P = 0.151
0
1
2
3
4
15-May-96
15-May-97
15-May-98
15-May-99
14-May-00
14-May-01
14-May-02
14-May-03
date of sample
prey
item
sR2 = 0.12P = 0.074
0
1
2
3
4
5450000 5500000 5550000 5600000 5650000UTM northing of sample (m)
prey
item
s
Figure 7. Effect of UTM northing and date on minimum number of prey types (species or groups; see
Table 4) in badger stomachs or scats with at least some prey remains, Rocky Mountain Trench,
southeastern British Columbia, 1996 - 2002.
Home Ranges
Home ranges were generally larger for males than females (Figure 8; Table 5), although there was high
variability in the data. Home range size was positively correlated to median UTM northing values (Figure
9). However, it was also negatively correlated to the median date at which data were collected (Figure
10), and animals farther south were radiotagged and monitored later in the study than those farther north
(Figure 11).
2004-2005 Annual Update for the East Kootenay Badger Project March, 2005
14
#####
##
#
#
##
#
#
#
#
##
##
#
#
#
#
#
#
#
#
#
#
#
#
#
#
#
#
#
### ##
#
#
#
#
#
#
#
#
#
#
#
#
#
#
#
#
#
##
#
#
#
#
##
#
#
#
##########
#
#
#
#
#
#
#
#
#
#
#
#
#
#
#
#
#
#
#####
#
#
#
#
#
#
#
#
#
###
#
##
#
#
#
#
#
#
#
##
#
#
#
#
##
#
#
#
#
#
##
##
#
#
#
## #
###
##
#
# ###
#
##
#
#
####
#
##
###
#
#
#
#
#
#
#
#
#
###
##
#
# #
#
#
#
##
##
#
#
#
#
#
#
#
#
###
#
#
#
#
#
#
#
#
#
#
#
#
#
##
#
#
#
#
#
#
#
##
## #
#
#
#
##
##
#
##
###
#
#
#
#
#
#
#
#
##
#
#
#
##
#
#
#
######
#
#
#
#
# #
#
#
#
##
#
#
#
#
#
#
#
#
#
#
#
#
#
#
#
##
#
#
#
#
#
#
#
#
#
##
#
# ####### ###
#
#
##
###
#
#
#
#
#
#
#
#
#
#
#
#
#
#
#
#
#
##
#
##
#
#
#
##
#
##
#
#
#
#####
#
#
#
#
##
#
#
#
#
#
#
#
#
#
####
#
#
#
#
#
#
#
#
#
#
#
#
#
##
#
#
#
#
#
#
#
#
#
#
#
#
#
#
#
#
#
##
#
#
#
#
##
#
#
#
##
##################
#
#
#
#
#
#
#
#
#
#
#
#
#
#
#
#
#
#
#
#
#
#
#
#
#
#
##
#
#
#
##
#
#
#
#
#
#
##
#######
##
##
#
#
#
#
#
#
#
#
#
#
##
#
#
#
#
#
#
#
#
#
#
#
#
#
#
#
#
#
#
#
#
####
#
#
#
#
#
#
#
#
#
#
#
#
#
#
#
#
#
#
#
#
#
#
#
#
#
#
#
##
#
#
#
#
#
#
#
#
##
#
##
#
#
#
#
#
#
###
#
###
#
##
#
#
#
#
#
#
#
#
#
#
#
#
#
#
#
#
#
#
#
#
#
#
#
##
##
#
###
###
#
##
#
#
#
#
#
#
#
#
#
##
#
#
#
#
#
#
#
#
#
##
##
#
#
#
#
## ###
#
#
#
#
##
#
#
#
#
#
#
# #
#
##
##
#
#
#
#
#
#
#
#
#
#
#
#
#
#
############
###
#
#
#
#
#
#
#
#
#
#
#
##
#
#
#
#
#
#
#
#
##
##
#
#
#
#
####
#
#
##
#
##
##
##
#
##
#
#
#
#
#
#
#
#
#
#
#
#
##
#
##
#
#
#
#
#
#
#
#
#
#
##
#
#
#
#
#
#
#
######
# ####
#
##
##
##
#
#
#
#
#
#
##
#
#
####
#
#
#
#
#
#
#
#
##
#
##
#
#
#
#
#
#
#
#
#
#
#
#
#
#
##
#
#
#
#
#
#
##
#
###
#
#
#
#
#
#
#
#
#
#
#
#
#
#
#
#
#
#
#
#
#
#
#
#
# #
#
#
#
#
#
#
#
#####
#
##
#
#
#
#
#
#
#
#
##
#
##
##
#
#
#
#
#
###
# #
#
##
# ##
#
#
#
##
#
##
#
##
#
#
#
#
#
##
#
#
#
#
# #
##
#
#
#### #
#
##
#
#
#
#
#
#
#
##
#
##
##
##
##
###########
#
#
##
#
#
#####
#
#
#
#
#
# #####
#####
#
#
####
###### #
#
#
## ####
#
#
##
#
##
######
#
#
#
#
###
#
#
#
###
#
#
###
#### ##############
#
#
#
#
#
#
#
#
#
#
#
#
#
#
##
#
#
#
#
######
#
#
#
#
#
#
#
#
##
#
##
##
#
# ## ##
###
#
#
#
#
######
##
##
#
#
#
#
#####
#
#
##
#
#
#
###
#
#
#####
#
#
# #
#
###
#
#
#
#
##
###
########
#
#
##
#
#
#
#
#
#
#
#
#
#
#
#
####
#
#
#
#
#
#
#
#
#
#
########
####
##
#
##
#
#
#
#
#
#
#
#
#
#
#
#
#
#
#
##
#
#
#
##
##
#
#
#
####
#
#
#
#
#
#
#######
#
#
# #
##
#
#
#
#
#
#
##
####
#
#
##
#
#
##
#
#
#
#
##
#
#
#
#
#
#
#
#
#
#
###
#
#
#
###
#
# #
##
#
#
#
#
#
###
###
#
#### #
#########
##
###
# ####
## ##
###
#
###################
##
#
#
###
#
#
#
#
#
#
#
#
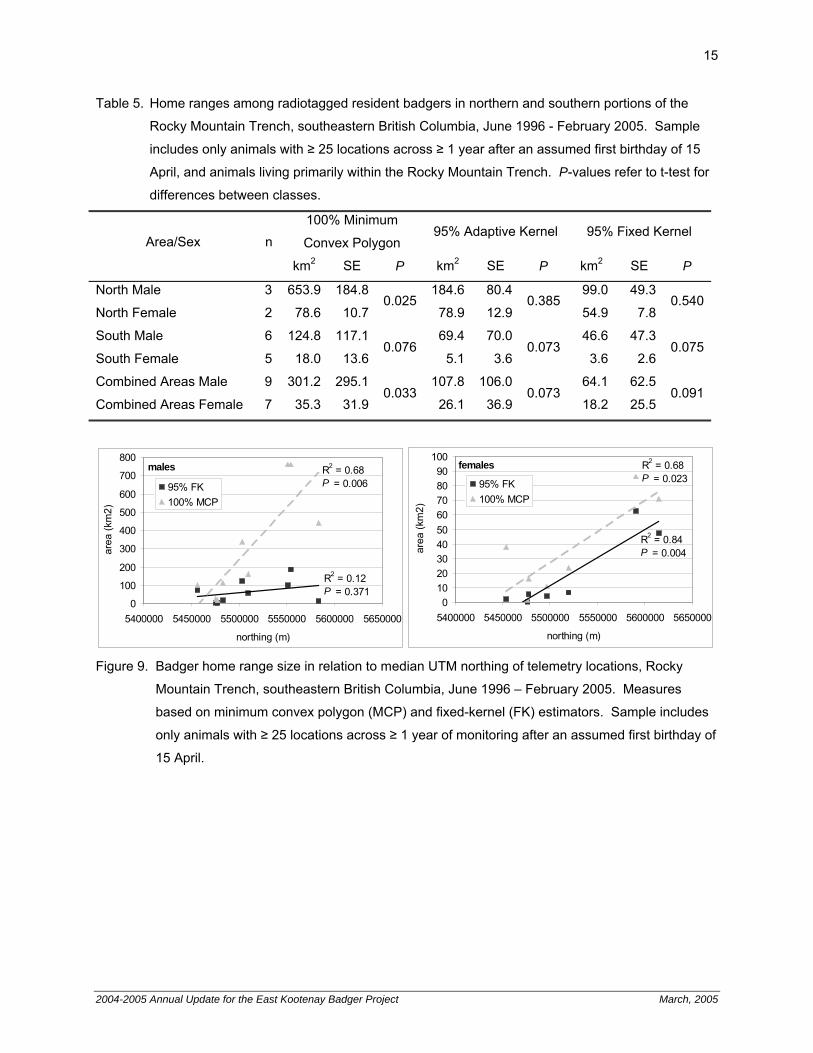
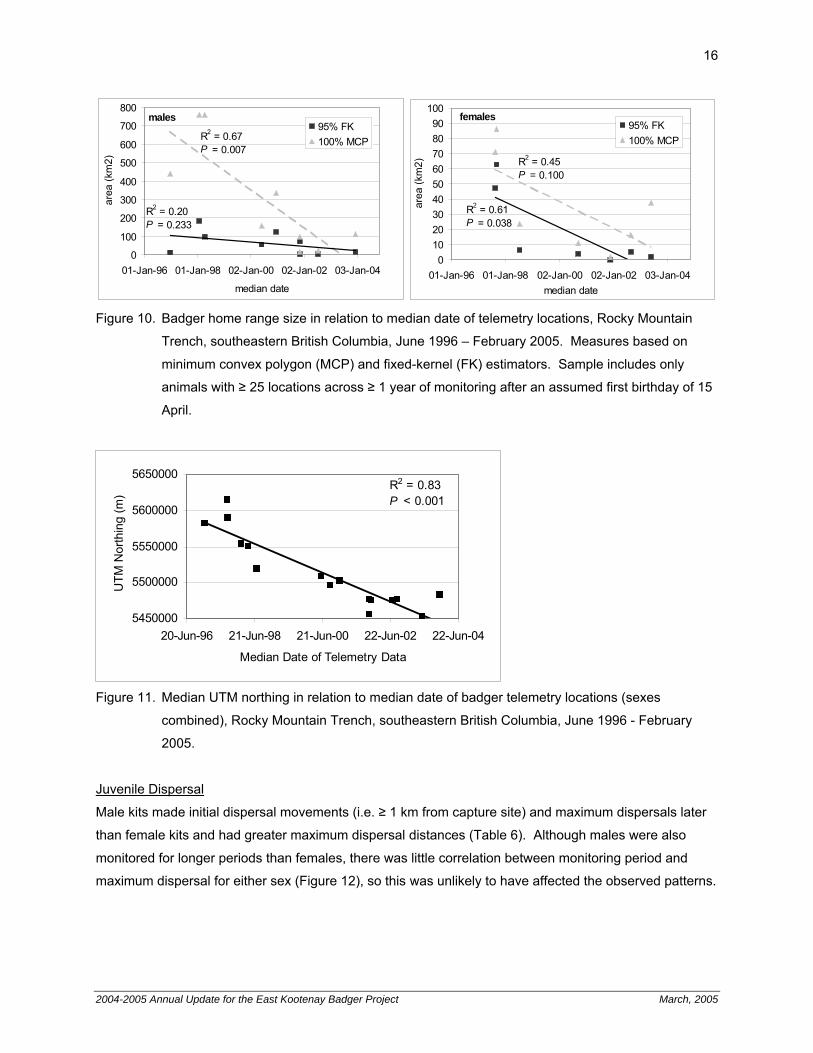
#
#
#
#
#
#
#
#
#
#
##
#
#
#
#
########
#
## # #
#
#
##
##
#
#
#
#
#
# #
#
#
#
###
#
#
##############
##
#
#
#
##
#
#
#
##
#
###
##
#
#
#
#
#
#
#####
# #
#
#
#
#
#####
#
#
#
##
##
##
##
###
#
#
###
##
##
#
#
#
#
##
#
#
#
# #
###
#
#
######
#
#
#
#
#
#
##
#### ####
##
#
Juvenile female maximum dispersal
# All radiolocations
Male home range
Female home range
Juvenile male maximum dispersal
0 10 20 km
N
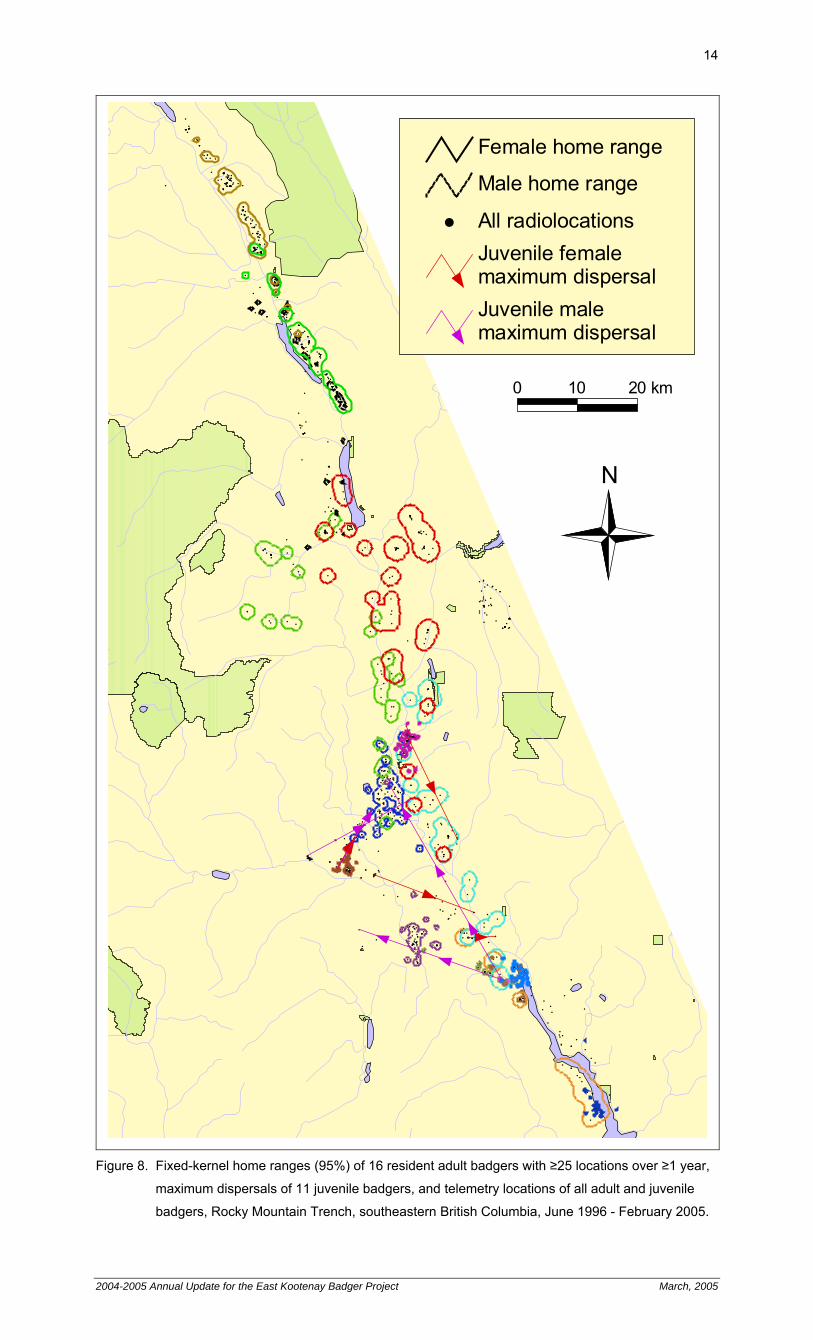
Figure 8. Fixed-kernel home ranges (95%) of 16 resident adult badgers with ≥25 locations over ≥1 year,
maximum dispersals of 11 juvenile badgers, and telemetry locations of all adult and juvenile
badgers, Rocky Mountain Trench, southeastern British Columbia, June 1996 - February 2005.
2004-2005 Annual Update for the East Kootenay Badger Project March, 2005
15
Table 5. Home ranges among radiotagged resident badgers in northern and southern portions of the
Rocky Mountain Trench, southeastern British Columbia, June 1996 - February 2005. Sample
includes only animals with ≥ 25 locations across ≥ 1 year after an assumed first birthday of 15
April, and animals living primarily within the Rocky Mountain Trench. P-values refer to t-test for
differences between classes.
100% Minimum
Convex Polygon 95% Adaptive Kernel 95% Fixed Kernel
Area/Sex n
km2 SE P km2 SE P km2 SE P
North Male 3 653.9 184.8 184.6 80.4 99.0 49.3
North Female 2 78.6 10.70.025
78.9 12.90.385
54.9 7.80.540
South Male 6 124.8 117.1 69.4 70.0 46.6 47.3
South Female 5 18.0 13.60.076
5.1 3.60.073
3.6 2.60.075
Combined Areas Male 9 301.2 295.1 107.8 106.0 64.1 62.5
Combined Areas Female 7 35.3 31.90.033
26.1 36.90.073
18.2 25.50.091
females
R2 = 0.84P = 0.004
R2 = 0.68P = 0.023
0102030405060708090
100
5400000 5450000 5500000 5550000 5600000 5650000
northing (m)
area
(km
2)
95% FK100% MCP
males
R2 = 0.12P = 0.371
R2 = 0.68P = 0.006
0
100
200
300
400
500
600
700
800
5400000 5450000 5500000 5550000 5600000 5650000
northing (m)
area
(km
2)
95% FK100% MCP
Figure 9. Badger home range size in relation to median UTM northing of telemetry locations, Rocky
Mountain Trench, southeastern British Columbia, June 1996 – February 2005. Measures
based on minimum convex polygon (MCP) and fixed-kernel (FK) estimators. Sample includes
only animals with ≥ 25 locations across ≥ 1 year of monitoring after an assumed first birthday of
15 April.
2004-2005 Annual Update for the East Kootenay Badger Project March, 2005
16
females
R2 = 0.61P = 0.038
R2 = 0.45P = 0.100
0102030405060708090
100
01-Jan-96 01-Jan-98 02-Jan-00 02-Jan-02 03-Jan-04median date
area
(km
2)
95% FK100% MCP
males
R2 = 0.67P = 0.007
R2 = 0.20P = 0.233
0
100
200
300
400
500
600
700
800
01-Jan-96 01-Jan-98 02-Jan-00 02-Jan-02 03-Jan-04
median date
area
(km
2)
95% FK100% MCP
Figure 10. Badger home range size in relation to median date of telemetry locations, Rocky Mountain
Trench, southeastern British Columbia, June 1996 – February 2005. Measures based on
minimum convex polygon (MCP) and fixed-kernel (FK) estimators. Sample includes only
animals with ≥ 25 locations across ≥ 1 year of monitoring after an assumed first birthday of 15
April.
R2 = 0.83P < 0.001
5450000
5500000
5550000
5600000
5650000
20-Jun-96 21-Jun-98 21-Jun-00 22-Jun-02 22-Jun-04
Median Date of Telemetry Data
UTM
Nor
thin
g (m
)
Figure 11. Median UTM northing in relation to median date of badger telemetry locations (sexes
combined), Rocky Mountain Trench, southeastern British Columbia, June 1996 - February
2005.
Juvenile Dispersal
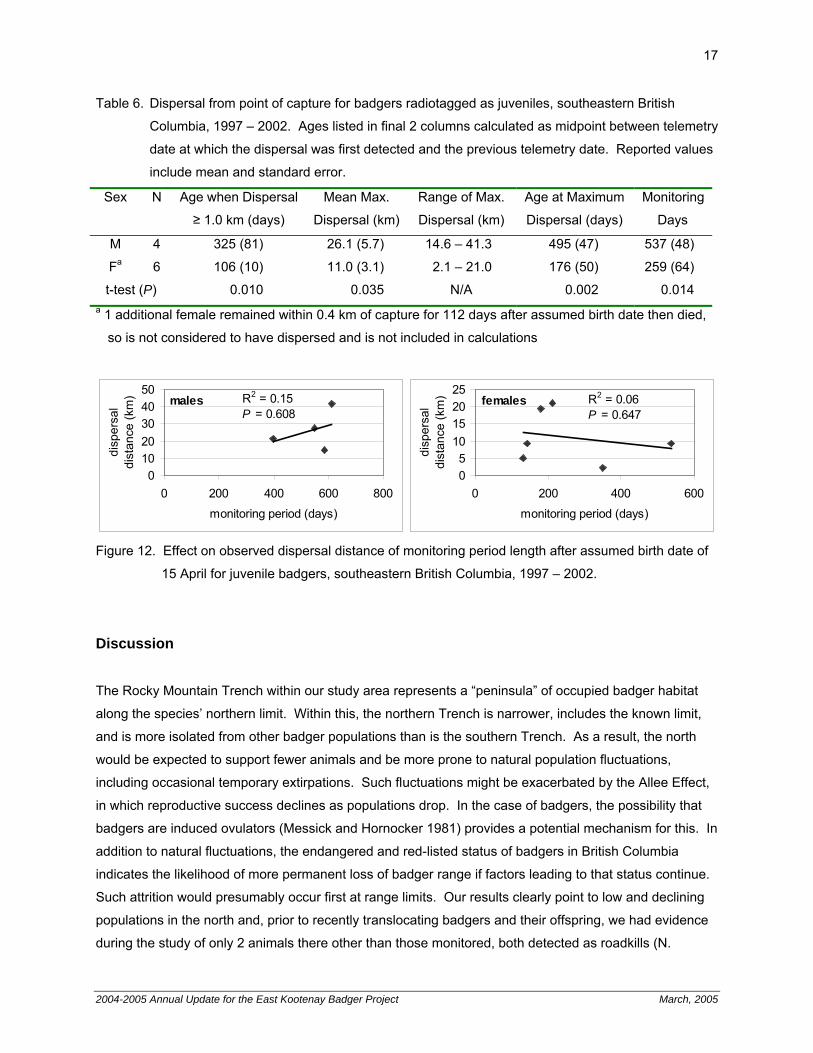
Male kits made initial dispersal movements (i.e. ≥ 1 km from capture site) and maximum dispersals later
than female kits and had greater maximum dispersal distances (Table 6). Although males were also
monitored for longer periods than females, there was little correlation between monitoring period and
maximum dispersal for either sex (Figure 12), so this was unlikely to have affected the observed patterns.
2004-2005 Annual Update for the East Kootenay Badger Project March, 2005
17
Table 6. Dispersal from point of capture for badgers radiotagged as juveniles, southeastern British
Columbia, 1997 – 2002. Ages listed in final 2 columns calculated as midpoint between telemetry
date at which the dispersal was first detected and the previous telemetry date. Reported values
include mean and standard error.
Sex N Age when Dispersal
≥ 1.0 km (days)
Mean Max.
Dispersal (km)
Range of Max.
Dispersal (km)
Age at Maximum
Dispersal (days)
Monitoring
Days
M 4 325 (81) 26.1 (5.7) 14.6 – 41.3 495 (47) 537 (48)
Fa 6 106 (10) 11.0 (3.1) 2.1 – 21.0 176 (50) 259 (64)
t-test (P) 0.010 0.035 N/A 0.002 0.014 a 1 additional female remained within 0.4 km of capture for 112 days after assumed birth date then died,
so is not considered to have dispersed and is not included in calculations
males R2 = 0.15P = 0.608
01020304050
0 200 400 600 800
monitoring period (days)
disp
ersa
l di
stan
ce (k
m) females R2 = 0.06
P = 0.647
05
10152025
0 200 400 600
monitoring period (days)
disp
ersa
l di
stan
ce (k
m)
Figure 12. Effect on observed dispersal distance of monitoring period length after assumed birth date of
15 April for juvenile badgers, southeastern British Columbia, 1997 – 2002.
Discussion
The Rocky Mountain Trench within our study area represents a “peninsula” of occupied badger habitat
along the species’ northern limit. Within this, the northern Trench is narrower, includes the known limit,
and is more isolated from other badger populations than is the southern Trench. As a result, the north
would be expected to support fewer animals and be more prone to natural population fluctuations,
including occasional temporary extirpations. Such fluctuations might be exacerbated by the Allee Effect,
in which reproductive success declines as populations drop. In the case of badgers, the possibility that
badgers are induced ovulators (Messick and Hornocker 1981) provides a potential mechanism for this. In
addition to natural fluctuations, the endangered and red-listed status of badgers in British Columbia
indicates the likelihood of more permanent loss of badger range if factors leading to that status continue.
Such attrition would presumably occur first at range limits. Our results clearly point to low and declining
populations in the north and, prior to recently translocating badgers and their offspring, we had evidence
during the study of only 2 animals there other than those monitored, both detected as roadkills (N.
2004-2005 Annual Update for the East Kootenay Badger Project March, 2005
18
Newhouse, unpubl. data). A key question is whether this recent local extirpation is indicative of ecological
or anthropogenic conditions having more-or-less permanently changed in a way that will preclude badger
populations from occurring in the north in the future, or whether the extirpation was a result of temporary
events or conditions typical of any range limit. The implications are, respectively, that recovery attempts
may be futile, especially if population augmentation is the tool used, or alternatively that recovery is likely,
particularly with the translocation of additional animals to initiate the process. We found that space-use
and demography varied in relation to both northing (latitude) and time; i.e. that negative trends in the
north were observed prior to conducting research that identified positive trends in the south. In light of
this, it is not initially clear whether north-south differences in home range size, adult survivorship and kit
production reflected spatial variation (permanent or long-term loss of productivity in the north compared to
ongoing high productivity in the south) or temporal variation (short-term fluctuation in productivity of both
the north and south, with the south not being extirpated due to a higher initial population). This has
implications for badgers locally, at other locations along their range limits, and at the range limits of other
species.
In seeking evidence for spatial variability, there may be some persisting ecological or anthropogenic
differences from north to south within the study area, but there is no ready explanation for trends moving
in opposite directions in the north relative to the south. Diet data did not indicate that northern pocket
gophers, present only in the south, played a major role within our study area. In contrast, looking at the
possibility of temporal variability, there is some evidence that the growth apparent in the south had only
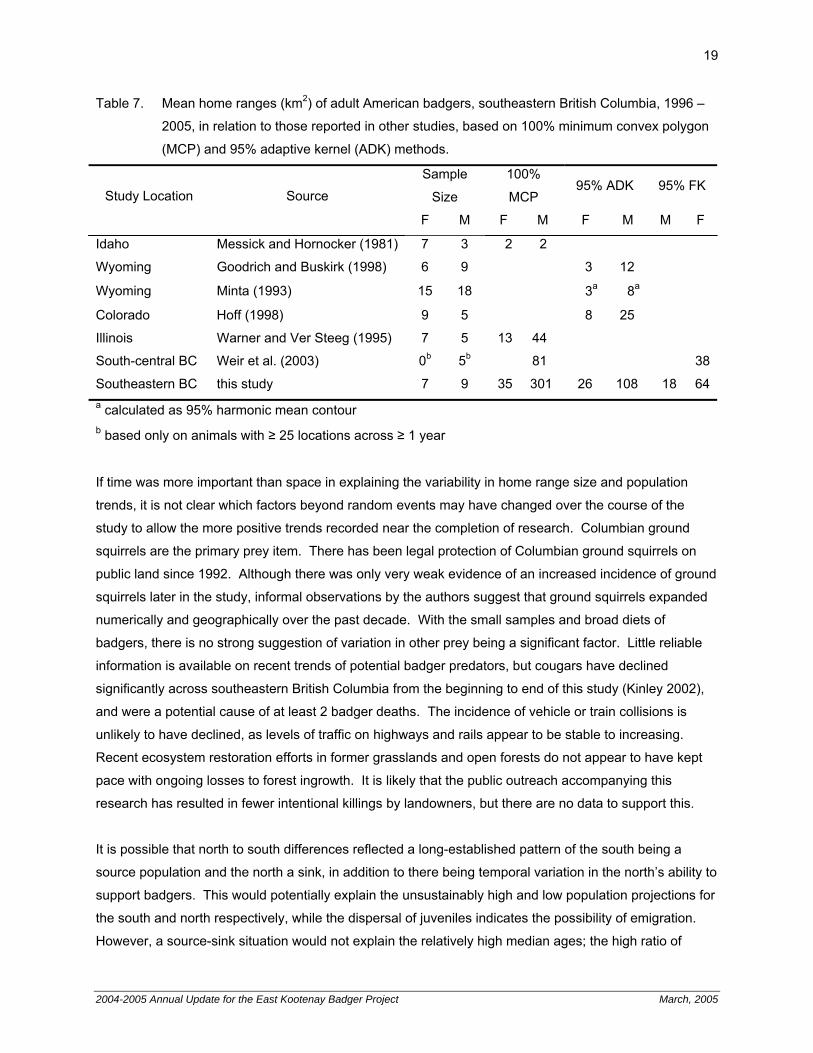
recently begun. Mean home range sizes documented in the Rocky Mountain Trench as a whole were 2
to 150 times larger than any reported in the literature (Table 7). While ranges of females in the south
were similar to those reported for Colorado and Illinois (Table 5, Table 7), southern male home ranges
were 4-7x larger than reported in those studies. If female home ranges are dictated mainly by food
resources and males by the number of females, this suggests that there was a reasonable food supply
but low female numbers, consistent with a lag in population growth following recently improved
conditions. The late dates of dispersal, as compared to dispersal ages of roughly 60 - 75 days and 70 -
120 days in 2 Idaho populations (Messick et al. 1981), are indicative of habitat that is currently capable of
providing adequate food for a mother and adult kits within a small area over an extended period. This
should have resulted in a very large badger population and small home ranges for both sexes had it been
the norm over the long term. A long-term growing population would also be expected to have a low
median age due to a continuous influx of kits. Our observed median adult ages in the south (4 years) and
north (3 years) compare to adult medians of 3 years in Illinois (Warner and Ver Steeg 1995), about 4.5
years in Wyoming (Goodrich 1994), and 2 years in Idaho (Messick and Hornocker 1981). The trend to
higher survivorship later in the study also held for the north. Thus, it is likely that much of the north-south
variation reflected temporal rather than spatial variability in key ecological or anthropogenic factors.
2004-2005 Annual Update for the East Kootenay Badger Project March, 2005
19
Table 7. Mean home ranges (km2) of adult American badgers, southeastern British Columbia, 1996 –
2005, in relation to those reported in other studies, based on 100% minimum convex polygon
(MCP) and 95% adaptive kernel (ADK) methods.
Sample
Size
100%
MCP 95% ADK 95% FK
Study Location Source
F M F M F M M F
Idaho Messick and Hornocker (1981) 7 3 2 2
Wyoming Goodrich and Buskirk (1998) 6 9 3 12
Wyoming Minta (1993) 15 18 3a 8a
Colorado Hoff (1998) 9 5 8 25
Illinois Warner and Ver Steeg (1995) 7 5 13 44
South-central BC Weir et al. (2003) 0b 5b 81 38
Southeastern BC this study 7 9 35 301 26 108 18 64a calculated as 95% harmonic mean contour b based only on animals with ≥ 25 locations across ≥ 1 year
If time was more important than space in explaining the variability in home range size and population
trends, it is not clear which factors beyond random events may have changed over the course of the
study to allow the more positive trends recorded near the completion of research. Columbian ground
squirrels are the primary prey item. There has been legal protection of Columbian ground squirrels on
public land since 1992. Although there was only very weak evidence of an increased incidence of ground
squirrels later in the study, informal observations by the authors suggest that ground squirrels expanded
numerically and geographically over the past decade. With the small samples and broad diets of
badgers, there is no strong suggestion of variation in other prey being a significant factor. Little reliable
information is available on recent trends of potential badger predators, but cougars have declined
significantly across southeastern British Columbia from the beginning to end of this study (Kinley 2002),
and were a potential cause of at least 2 badger deaths. The incidence of vehicle or train collisions is
unlikely to have declined, as levels of traffic on highways and rails appear to be stable to increasing.
Recent ecosystem restoration efforts in former grasslands and open forests do not appear to have kept
pace with ongoing losses to forest ingrowth. It is likely that the public outreach accompanying this
research has resulted in fewer intentional killings by landowners, but there are no data to support this.
It is possible that north to south differences reflected a long-established pattern of the south being a
source population and the north a sink, in addition to there being temporal variation in the north’s ability to
support badgers. This would potentially explain the unsustainably high and low population projections for
the south and north respectively, while the dispersal of juveniles indicates the possibility of emigration.
However, a source-sink situation would not explain the relatively high median ages; the high ratio of
2004-2005 Annual Update for the East Kootenay Badger Project March, 2005
20
male:female home range sizes in the south; the sightings of family groups in the north from 1992 to 1995
(Chapter 3); the initial indications of successful translocations to the north (Chapter 2); or the fact that we
did not record shifts of tagged animals northward. Thus, there is no clear evidence of an ongoing source-
sink process.
Regardless of the factors responsible for differences observed to date along a north-south gradient, future
monitoring will show whether earlier indications of a rapidly declining population were due to more-or-less
permanent conditions now typifying the north, a result of specific events in the recent past within both
zones, or simply reflect occasional and unpredictable oscillations along the species’ range limit. The
translocation of animals into the north from 2002 to 2004 has provided a means to test current conditions
there. If those badgers and their offspring thrive, then it can be assumed that the north does generally
retain the capability of supporting badger populations, and that temporal variation explains much of the
variability in badger population trends. Similarly, continued monitoring of residents within the south would
indicate whether positive population trends there continue. Our results point to the value of long-term
monitoring of populations at range limits, or endangered populations generally. If trends relating to
persistence vary dramatically over time, then short-term observations indicating that certain areas have
lost their ability to support a taxon may be misleading. Population augmentation provides a test of
whether long-term, deterministic factors have made a given area unsuitable, or whether observed losses
are the result of short-term fluctuations that can more readily be overcome with an influx of animals.
1.7 Acknowledgements
We thank M. Belcher, S. Crowley, A. Dibb, L. Ingham, A. Levesque, M. Panian and I. Teske for
administrative and technical support; A. Candy, A. Davidson, R. DeGraff, R. Franken, C. Holschuh, M.
Kaneen, R. Klafki, K. Martell, T. McAllister and H. Page for field work; S. Crockford and G. Frederick for
identifying prey remains; M. Zehnder for implanting radiotransmitters, and the pilots at Babin Air for
telemetry flights. Financial, technical, and administrative support was provided by the Columbia Basin
Fish and Wildlife Compensation Program, Columbia Basin Trust, East Kootenay Environmental Society,
Forest Investment Account, Forest Renewal BC, Invermere Veterinary Hospital, Ministry of Water, Land
and Air Protection, Parks Canada, and Tembec Industries Inc. Versions of this manuscript from earlier
years benefited from reviews by A. Dibb, L. Ingham, J. Krebs and E. Lofroth.
Funds for this project were provided (in part) by the Parks Canada Species at Risk Recovery Action and
Education Fund, a program supported by the National Strategy for the Protection of Species at Risk.
Ce projet est financé [en partie] par le Fonds de rétablissement des espèces en péril de Parcs Canada,
un programme à l’appui de la Stratégie nationale pour la protection des espèces en péril.
2004-2005 Annual Update for the East Kootenay Badger Project March, 2005
21
1.8 Literature Cited
Apps, C. D., N. J. Newhouse, and T. A. Kinley. 2002. Habitat associations of American badgers in
southeast British Columbia. Canadian Journal of Zoology 80:1228-1239.
Braumandl, T. F., and M. P. Curran. 1992. A field guide for site identification and interpretation for the
Nelson Forest Region. British Columbia Ministry of Forests Land Management Handbook 20.
Cannings, S. G., L. R. Ramsay, D. F. Fraser, and M. A. Fraker. 1999. Rare amphibians, reptiles and
mammals of British Columbia. Ministry of Environment, Lands and Parks, Victoria, British Columbia,
Canada.
COSEWIC. 2003. Canadian species at risk May 2003. Committee on the Status of Endangered Wildlife
in Canada, Ottawa, Ontario.
Gayton, D. 1996. Fire-maintained ecosystems and the effects of forest ingrowth. British Columbia
Ministry of Forests, Nelson, British Columbia.
Goodrich, J. M. 1994. North American badgers (Taxidea taxus) and black-footed ferrets (Mustela
nigripes): abundance, rarity, and conservation in a white-tailed prairie dog (Cynomys leucurus)-based
community. Dissertation, University of Wyoming, Laramie, Wyoming, USA.
Goodrich, J. M., and S. W. Buskirk. 1998. Spacing and ecology of North American badgers (Taxidea
taxus) in a prairie-dog (Cynomys leucurus) complex. Journal of Mammalogy 79:171-179.
Hoff, D. J. 1998. Integrated laboratory and field investigations assessing contaminant risk to American
badgers (Taxidea taxus) on the Rocky Mountain Arsenal National Wildlife Refuge. Dissertation,
Clemson University, Clemson, South Carolina, USA.
Hooge, P. N., and B. Eichenlaub. 2000. Animal Movement extension to ArcView. Version 2.04. U.S.
Geological Survey, Anchorage, Alaska.
Hovey, F. 1999. The Home Ranger. Version 1.5. Research Branch, Ministry of Forests, Revelstoke,
British Columbia, Canada.
Kie, J. G., J. A. Baldwin, and C. J. Evans. 1994. Calhome home range analysis program electronic
user’s manual. U.S. Forest Service, Pacific Southwest Research Station, Fresno, California, USA.
Kinley, T. A. 2002. Background information for public consultation regarding the proposed translocation
of caribou from the Itcha-Ilgachuz Mountains to the southern Purcell Mountains. Columbia Basin Fish
and Wildlife Compensation Program, Nelson, British Columbia, and Ministry of Water, Land and Air
Protection, Nelson, British Columbia, Canada
Lampe, R. 1982. Food habits of badgers in east central Minnesota. Journal of Wildlife Management
46:790-795.
Lindzey, F. G. 1982. Badger. Pages 653-663 in J. A. Chapman and G. A. Feldhammer, editors. Wild
mammals of North America. Johns Hopkins University, Baltimore, Maryland, USA.
Minta, S. C. 1993. Sexual differences in spatio-temporal interaction among badgers. Oecologia 96:402-
409.
2004-2005 Annual Update for the East Kootenay Badger Project March, 2005
22
Messick, J. P. 1987. North American badger. Pages 586-597 in M. Novak, J. A. Baker, M. E. Obbard,
and B. Malloch, editors. Wild furbearer management and conservation in North America. Ontario
Trappers Association, and Ontario Ministry of Natural Resources, Toronto, Ontario, Canada.
Messick, J. P., and M. G. Hornocker. 1981. Ecology of the badger in southwestern Idaho. Wildlife
Monographs 76.
Messick, J. P., M. C. Todd, and M. G. Hornocker. 1981. Comparative ecology of two badger populations.
Pages 1290-1304 in J. A. Chapman, and D. Pursley, editors. Proceedings of the Worldwide
Furbearer Conference, Frostburg, Maryland.
Newhouse, N., and T. Kinley. 2000. Update COSEWIC status report on the American badger in Canada.
Committee on the Status of Endangered Wildlife in Canada, Ottawa, Ontario.
Pollock, K. H., S. R. Winterstein, C. M. Bunck, and P. D. Curtis. 1989. Survival analysis in telemetry
studies: the staggered entry design. Journal of Wildlife Management 53:7-15.
Rahme, A. H., A. S. Harestad, and F. L. Bunnell. 1995. Status of the badger in British Columbia. British
Columbia Ministry of Environment, Lands and Parks Wildlife Working Report WR-72.
Salt, J. R. 1976. Seasonal food and prey relationships of badgers in east-central Alberta. Blue Jay
34:119-123.
Seaman, D. E., J. J. Millspaugh, B. J. Kernohan, G. C. Brundige, K. J. Raedeke, and R. A. Gitzen. 1999.
Effects of sample size of kernel home range estimates. Journal of Wildlife Management 63:739-747.
Todd, M. C. 1980. Ecology of badgers in southcentral Idaho with additional notes on raptors. Thesis,
University of Idaho, Moscow, Idaho, USA.
Warner, R. E., and B. Ver Steeg. 1995. Illinois badger studies. Division of Wildlife Resources, Illinois
Department of Natural Resources, Springfield, Illinois, USA.
Weir, R. D., H. Davis, and C. Hoodicoff. 2003. Conservation strategies for North American badgers in
the Thompson and Okanagan regions. Artemis Wildlife Consultants, Armstrong, British Columbia.
Winterstein, S. R., K. H. Pollack, and C. M. Bunck. 2001. Analysis of survival data from radiotelemetry
studies. Pages 351-380 in J. J. Millspaugh, and J. M. Marzluff, editors. Radio tracking and animal
populations. Academic Press, San Diego, California, USA.
2004-2005 Annual Update for the East Kootenay Badger Project March, 2005
23
Chapter 2. Translocation to Aid Recovery of Badgers
in the Rocky Mountain Trench, British Columbia
Abstract
The subspecies of American badger present in British Columbia (Taxidea taxus jeffersonii) is listed by
COSEWIC as endangered and is on the provincial “red list”. Within the East Kootenay Trench, the
badger population in the south appears to be stable to possibly increasing slightly, but that of the north
recently reached extirpation or nearly so. It is not clear whether trends in the north were a product of a
long-term loss in the area’s ability to support badgers, suggesting recovery would be unlikely, or simply
the result of random events in a low-density population, indicating recovery is possible under appropriate
conditions. As a means of fast-tracking population recovery while testing the area’s ability to support a
recovering population, we translocated badgers into the Trench from Findlay Creek northward. In the
summers of 2002 through 2004, we radiotagged and translocated 16 badgers that were of the same
subspecies and genetically similar to those in the East Kootenay from the Kalispell, Montana area. These
included 8 adult males, 4 adult females, 2 juvenile males, and 2 juvenile females. As of February 2005,
at least 4 of the badgers were alive, 6 were dead, and 6 could no longer be radiolocated. Annual
survivorship was greater for females than males, with a combined-sex survival rate of 75%. Kit
production appears to have exceeded that of residents, both those formerly inhabiting the release area
and those of the southern Trench. Females have had small home ranges with limited post-release
movements. All adult females and most adult males remained within the release area. Although only
preliminary data are available, indications are that the population derived from translocated animals is
growing rapidly. Thus, it appears that the northern Trench remains capable of supporting a badger
population, and translocation has so far been an effective means of enabling or speeding recovery.
Introduction
American badgers (Taxidea taxus) occur throughout much of the conterminous United States and south-
central to southwestern Canada (Newhouse and Kinley 2000). Of the four subspecies (Long 1972,
Newhouse and Kinley 2000), those in the western mountains are classified as T. t. jeffersonii. In Canada,
this subspecies occurs only within British Columbia, where it is considered nationally endangered
(COSEWIC 2003) and is on the provincial “red list” (Cannings et al. 1999). Ecological research on
badgers in British Columbia began during 1996 in the Rocky Mountain Trench and adjacent Rocky and
Purcell mountains (Chapter 1). That area represents a northern range limit for the species, and near the
northern end of it the badger population declined until there were no known residents by 2003. Based on
2004-2005 Annual Update for the East Kootenay Badger Project March, 2005
24
anecdotal reports from long-time residents, it appears that badgers were formerly relatively common there
at low elevations (N. Newhouse, unpubl. data). Reasons for the decline are not clear, but possibilities
include shooting of problem animals, control of badger prey (primarily Columbian ground squirrels;
Spermophilus columbianus), habitat alteration through fire suppression and real estate development,
increasing roadkills as road density and traffic volume have risen, increasing barriers to movement
caused by development, or simply the effect of random events on a small population. In contrast, the
badger population appears to be small but recently stable within the southern portion of the Rocky
Mountain Trench, and is possibly increasing there over the short term (Chapter 1). Despite the apparent
potential for the south to act as a source population, the chances of rapid natural re-colonization of the
northern Trench appear slight, given the relatively small source population in the south (probably <60
breeding adults; N. Newhouse, unpubl. data); the potentially ephemeral nature of conditions supporting
increases within southeastern British Columbia; the degradation of burrows over time (with reference to
the importance of existing burrows to badgers; Newhouse and Kinley 2001); the partial barriers (primarily
human developments) in moving northward; and the lack of connections to potential source populations in
Alberta, as implied by subspecific differences.
The draft national recovery strategy for badgers (The jeffersonii Badger Recovery Team 2003), identified
translocation as a possible method of augmenting populations and initiating recovery. Subpopulation
delimitations (Newhouse and Kinley 2000) suggest that the portion of Montana west of the Continental
Divide supports the same subspecies of badgers as British Columbia. The results of genetic research are
consistent with this, as similarities between badgers in western Montana and those of southeastern
British Columbia are greater than similarities between either of those two populations and badgers in
eastern Montana or Alberta (Kyle et al. 2004). Thus, we began discussions with representatives of
Montana Fish, Wildlife and Parks (FWP) in 2001 regarding possibilities for obtaining source animals for a
translocation from the northwestern portion of that state. In Montana, badgers are classified as non-game
wildlife with commercial value (Montana Fish, Wildlife and Parks 2002), so are subject to trapping and
shooting without bag limits or seasons and (on private land) can be legally poisoned. The population
status of T. t. jeffersonii in Montana has not been determined, although anecdotal observations suggest
that badgers are considerably more abundant in northwestern Montana than in southeastern British
Columbia. Thus, Montana officials were willing to permit the removal of badgers for translocation. We
developed a plan to move 15 animals from Montana to roughly the northern half of the portion of the
Rocky Mountain Trench in British Columbia falling within badger range, based on the following rationale:
• the population status within the target area was extremely poor;
• natural re-colonization was likely to be slow to nonexistent;
• a suitable source population for translocations was available;
• there was an opportunity to gain experience with translocation techniques;
2004-2005 Annual Update for the East Kootenay Badger Project March, 2005
25
• results of translocation might indicate whether the previous population decline was the result of
ephemeral versus permanent factors (Chapter 1); and
• translocation was included as an option within the national recovery strategy.
One initial concern of using translocation as a recovery tool might be the apparent poor prognosis for
badgers released into an area where the original population had become extirpated. However, we felt
that several factors had recently changed. These included a general increase in public awareness and
interest in badgers (Newhouse and Kinley 2004) and the assumed reduction in intentional killing of
badgers, the protection of Columbian ground squirrels on Crown land since 1992, anecdotal evidence of
increases in the ground squirrel population, and ongoing efforts to address the growth of trees into former
open forests and grasslands (Machmer et al. 2001). This indicated an increased likelihood of
translocations being successful. In addition, population fluctuations can be due to random or other non-
mechanistic factors. If this were the case for badgers in the northern portion of the Trench, then there
would be further reason to expect that past declines did not necessarily indicate an ongoing inability of
the area to support badgers. Ultimately, there appeared to be little chance of local recovery without
translocations but some chance with them, so translocation appeared warranted.
Study Area
Our target area in southeastern British Columbia (Figure 1) was defined as extending east-west between
the heights-of-land of the Rocky and Purcell mountains, and from 50.1°N (junction of Findlay Creek and
the Kootenay River) to 51.0°N, with the exception of the Elk River drainage. However, some movements
of badgers released within that area extended farther south and north. Maximum elevations are 3,618 m
in the Rockies and 3,457 m in the Purcells. The Rocky Mountain Trench separates the 2 mountain
ranges. Within our study area it ranges from 3 to 12 km wide and has a minimum elevation of 780 m.
Along the Trench floor, the Columbia River flows north from Columbia Lake, while the Kootenay River
enters the Trench immediately south of Columbia Lake and flows southward. Biogeoclimatic zones follow
an elevation sequence from the Ponderosa Pine (PP) at the lowest elevations in the warmest, driest
areas, through the Interior Douglas-fir (IDF), Montane Spruce (MS), Engelmann Spruce – Subalpine Fir
(ESSF) and Alpine Tundra (AT) zones. In some tributaries of the Trench receiving higher precipitation,
the Interior Cedar – Hemlock (ICH) zone occurs in place of the MS (Braumandl and Curran 1992). The
distribution of the PP and IDF correspond approximately to the Rocky Mountain Trench. These zones
were historically dominated by open forests of ponderosa pine (Pinus ponderosa) and Douglas-fir
(Pseudotsuga menziesii) respectively on zonal sites, grasslands or grass-shrublands on more xeric sites,
and extensive marsh and forested riparian habitat along rivers. However, human settlement within the
IDF and PP has resulted in much residential, recreational, road, and agricultural development along the
2004-2005 Annual Update for the East Kootenay Badger Project March, 2005
26
valley bottoms, along with conifer encroachment into former open forest and grassland due to fire
suppression (Gayton 1996). Climax forests in the MS are closed-canopy stands of hybrid white spruce
(Picea glauca x engelmannii), in the Interior Cedar Hemlock are western redcedar (Thuja plicata) and
western hemlock (Tsuga heterophylla) and in the ESSF are Engelmann spruce (Picea engelmannii) and
subalpine fir (Abies lasiocarpa). However, the MS, ICH and ESSF have an extensive history of fire and
timber harvesting, so also include roads, cutblocks, burns, and forest stands of varying ages with a high
proportion of lodgepole pine (Pinus contorta) and other tree species. The AT is non-forested.
Potential fossorial and semi-fossorial prey species using open habitats include Columbian ground
squirrels (Spermophilus columbianus), which occur in natural or human-caused openings in all
biogeoclimatic zones; meadow voles (Microtus pennsylvanicus) which occur on moist sites in all
biogeoclimatic zones; and hoary marmots (Marmota caligata) which occur sporadically in the AT.
Northern pocket gophers (Thomomys talpoides), do not occur within the study area, but are patchily
distributed at the lowest elevations in the PP and IDF in areas farther south occupied temporarily by at
least 1 badger and also occur in the area from which translocated badgers were trapped. Carnivores
within the study area include coyotes (Canis latrans), bobcats (Lynx rufus) and cougars (Puma concolor),
which occur in all biogeoclimatic zones during summer but are mainly restricted to the MS, ICH and
especially PP and IDF during winter; wolves (Canis lupus) and grizzly bears (Ursus arctos), which are
widespread but less common in the PP and IDF than in other zones; red foxes (Vulpes vulpes), which are
rare and localized in the PP, IDF, MS and ICH and are nearly absent from the northern part of the study
area; Canada lynx (Lynx canadensis), which occur mainly in the ICH, MS and ESSF; and black bears
(Ursus americanus), which are widespread in all zones except the AT. There is no legal hunting or
trapping season for badgers in our study area, although problem-animal control is permitted.
All but 2 translocated badgers were trapped at the southern end of the Salish Mountains, 30-50 km west
of Kalispell, Montana. One was trapped within Kalispell and 1 in Whitefish, 23 km north of Kalispell.
Kalispell is the approximate southern limit of the Rocky Mountain Trench. All badgers were trapped in
areas classified as IDF (Demarchi et al. 2000).
2004-2005 Annual Update for the East Kootenay Badger Project March, 2005
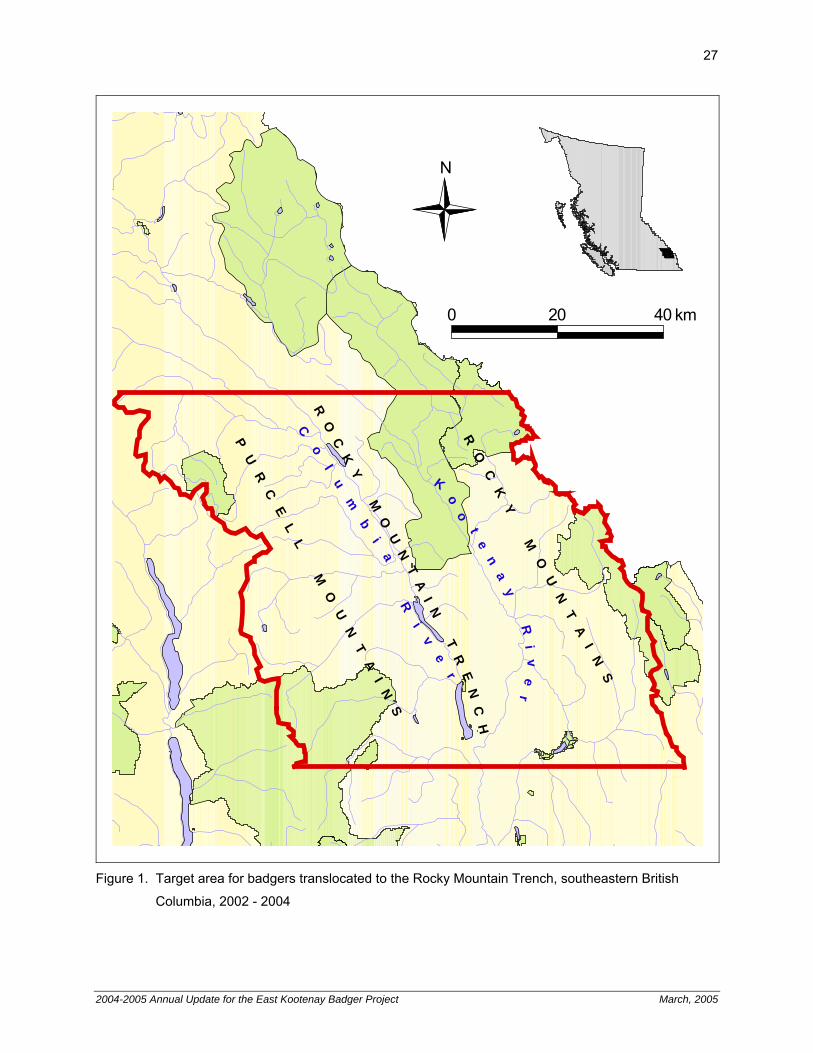
27
Co
lu
mb
ia
R
iv
er
K
oo
te
na
y
Ri
ve
r
PU
RC
EL
L
MO
UN
TA
IN
S
RO
CK
Y
MO
UN
TA
IN
S
RO
CK
Y
MO
UN
TA
IN
T
RE
NC
H
N
0 20 40 km
Figure 1. Target area for badgers translocated to the Rocky Mountain Trench, southeastern British
Columbia, 2002 - 2004
2004-2005 Annual Update for the East Kootenay Badger Project March, 2005
28
Methods
Translocation and Monitoring
The general location for trapping source animals was selected by FWP biologists based on high-density
badger populations. The animals captured within Kalispell and Whitefish were targeted due to complaints
arising from badgers burrowing in urban areas. We set and checked traps in cooperation with a contract
trapper from Montana and a FWP biologist, following methods outlined in Chapter 1. There were 935
trap-nights on 65 days between May and August 2002 and in July 2003 in the regular trapping area, plus
2 nights in Kalispell during August 2002 and 2 nights in Whitefish during June 2004. After capture, we
transported badgers to Kalispell for veterinary examination and implantation of radiotransmitters. In 2002,
a variety of brands, models and specifications of transmitters that were surplus from other research
projects were implanted due to a temporary inability to license new radiotransmitters. Transmitters used
in 2003 and 2004 were manufactured by Advanced Telemetry Systems (Isanti, MN) and were rated at >3
years battery life. All badgers were de-wormed and had topical flea ointment applied. We then
transported them to the border for Canadian Food Inspection Agency (CFIA) veterinarian examination.
Seven of the translocated badgers were released the day after capture, while 7 were released after 2
days and 2 after 3 days due to the temporary unavailability of veterinarian services or inspection
personnel.
We selected release sites based on the following criteria:
• in the area defined as the northern part of the Rocky Mountain Trench (Chapter 1), particularly in or
adjacent to the Columbia River drainage;
• high habitat quality extending over a large area, as indicated by recent habitat suitability modeling
(Apps et al. 2002) and subjective assessments incorporating recent or imminent changes to habitat
conditions;
• evidence of abundant ground squirrel populations;
• evidence of recent use by badgers;
• low risk of vehicle collisions (few roads and/or roads with little traffic); and
• relatively low levels of human settlement.
We released badgers at existing but currently unoccupied badger burrows within active Columbian
ground squirrel colonies. Several frozen ground squirrels were provided to each released badger to
ensure it had food immediately and an opportunity to develop familiarity with the release site. We
monitored badgers aerially using standard radiotelemetry techniques (Samuel and Fuller 1996). The
monitoring schedule varied by season, weather, aircraft availability and budget. In searching for badgers
that were not readily located, we periodically extended monitoring flights in the Rocky Mountain Trench
2004-2005 Annual Update for the East Kootenay Badger Project March, 2005
29
from 80 km northwest of the northernmost release site southward to the trapping locations, and up to 15
km into both the Purcell and Rocky mountains, an area of about 12,000 km2. This report summarizes
results through February 2005.
We used the following procedures and obtained the following permits to conduct the augmentation:
• The British Columbia Ministry of Water, Land and Air Protection (WLAP) provincially approved an
“Application for Permit to Conduct Badger Translocation” by The jeffersonii Badger Recovery Team.
• WLAP provincially issued a permit to import, transport and release badgers.
• WLAP regionally issued a scientific permit for collecting samples, radiotagging and tracking.
• A scientific collecting permit was issued by FWP.
• For each badger, a United States Fish and Wildlife Service (USFWS) “Declaration for Importation of
Exportation of Fish or Wildlife (Form 3-177) was completed.
• Each badger was inspected by a veterinarian in Montana and issued a Health Certificate titled
“Official Certificate of Interstate Movement”.
• Each badger was checked at the border by a CFIA veterinarian.
• Following augmentation, the Canadian Wildlife Service provided a permit under the Species at Risk
Act to capture the kit of a translocated female occurring on federal land.
Litter Size Determination and Tagging of Locally Born Offspring
We determined minimum initial litter sizes from direct observations of burrows of all females, both in
Montana prior to capture and in British Columbia in years subsequent to the release year. Females with
litters tended to have large natal burrows (evident from large mounds of recently excavated soil), use a
small area over several weeks, be active throughout the day, and bring prey back to the burrow. The
most obvious indications of kit presence and numbers were that the kits typically spent considerable time
playing aboveground at the burrow site. In addition, we checked all females at the time of initial capture
or re-capture for signs of lactation (swollen nipples with worn hair around them). We compared litter sizes
from Montana and British Columbia using a Pearson’s t-test. All statistical tests were performed using the
program JMP IN (SAS Institute, Inc., Cary, North Carolina). In the years following release, we attempted
to trap and radioimplant all kits of translocated females, using the methods described above. When
adults with failed or failing transmitters were opportunistically captured while targeting kits for capture,
their radiotransmitters were replaced.
Survivorship Determination and Population Projection
The modified Kaplan-Meier method was employed to determine juvenile survivorship, following the
staggered-entry technique described by Pollock et al. (1989). We assumed a 15 April birthdate, analyzed
the data as if all animals had been born in the same year, and terminated the analysis at 52 weeks. The
survivorship function and 95% confidence intervals for each week were calculated and plotted. We also
2004-2005 Annual Update for the East Kootenay Badger Project March, 2005
30
employed the modified Kaplan-Meier method to determine adult survivorship. The survivorship function
and 95% confidence intervals for each week were calculated and plotted. Following this, annual adult
survivorship was extrapolated by taking the nth root of the cumulative weekly survivorship, where n is the
number of years. This was determined for all adult animals combined and for males and females
separately. The date of death was assumed to be the midway point between the last live telemetry date
and the date on which the animal was found dead, unless there was evidence of the exact time of death
(e.g. report of the animal being hit by a car). For data censored due to telemetry contact being lost, the
censure date was the midway point between the last successful telemetry location and the first failed
attempt at telemetry thereafter. Doing so resulted in an unknown degree of error but prevented the
negative bias associated with using the last telemetry location or last live date as the censure or mortality
date. We then determined the instantaneous rate of population increase (r) by adding the annual adult
survivorship to the product of the proportion of females (assumed to stabilize at 0.5; Chapter 1), kits
observed per adult female and annual survivorship of radiotagged kits. We also compared the proportion
of animals lost from radio contact between juveniles and adults, using a Pearson chi-square test.
Diet Analysis
Scats were manually extracted upon capture in Montana or recapture in British Columbia, and digestive
tracts were obtained upon retrieval of carcasses, when possible. All samples were sent to Pacific
Identifications Inc. (Victoria, British Columbia) for identification of skeletal remains. The incidences of
samples lacking prey remains and containing the major identifiable prey species were compared between
Montana and British Columbia samples using Pearson chi-square tests.
Adult Home Range and Post-Release Movement Determination
Fixed kernel (FK) estimates of home range have been found to have lower bias and lower surface fit error
than other methods (Seaman et al. 1999), so we estimated adult home range size as the 95% FK
contour. We also calculated 100% minimum convex polygon (MCP) home ranges as an indication of the
gross area covered by each badger. We calculated FK ranges with The Home Ranger (Hovey 1999),
using a grid resolution of 100 pixels and standardizing x and y coordinates with multivariate normal
scores, and determined MCP ranges with the Animal Movement extension (Hooge and Eichenlaub 2000).
We deleted the second telemetry location in cases where sequential locations were < 4 days apart.
Kernel home range estimates are influenced by sample size (Seaman et al. 1999). Animals with fewer
than 25 locations or less than 1 year of monitoring (after their assumed first birthday on 15 April) were not
included in calculations of mean home range. We compared home ranges between sexes using
Student’s t-tests. Adult dispersal distances were recorded as the maximum distance to which badgers
were recorded moving from release sites.
2004-2005 Annual Update for the East Kootenay Badger Project March, 2005
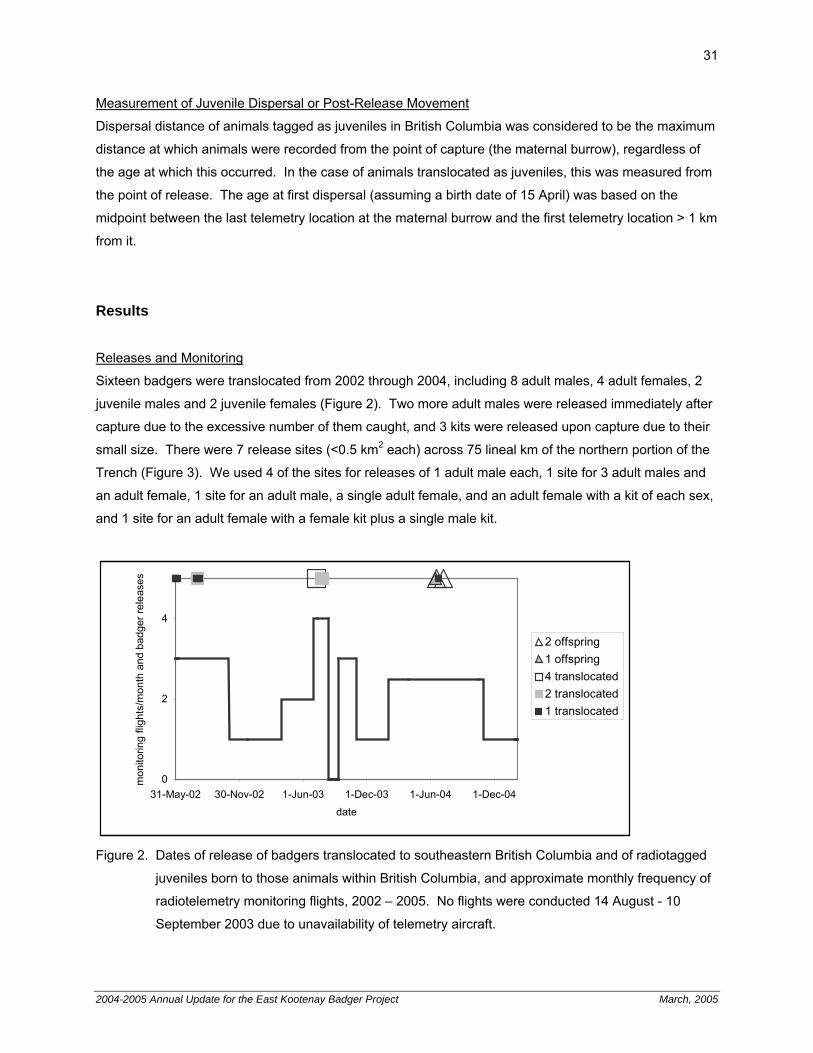
31
Measurement of Juvenile Dispersal or Post-Release Movement
Dispersal distance of animals tagged as juveniles in British Columbia was considered to be the maximum
distance at which animals were recorded from the point of capture (the maternal burrow), regardless of
the age at which this occurred. In the case of animals translocated as juveniles, this was measured from
the point of release. The age at first dispersal (assuming a birth date of 15 April) was based on the
midpoint between the last telemetry location at the maternal burrow and the first telemetry location > 1 km
from it.
Results
Releases and Monitoring
Sixteen badgers were translocated from 2002 through 2004, including 8 adult males, 4 adult females, 2
juvenile males and 2 juvenile females (Figure 2). Two more adult males were released immediately after
capture due to the excessive number of them caught, and 3 kits were released upon capture due to their
small size. There were 7 release sites (<0.5 km2 each) across 75 lineal km of the northern portion of the
Trench (Figure 3). We used 4 of the sites for releases of 1 adult male each, 1 site for 3 adult males and
an adult female, 1 site for an adult male, a single adult female, and an adult female with a kit of each sex,
and 1 site for an adult female with a female kit plus a single male kit.
0
2
4
31-May-02 30-Nov-02 1-Jun-03 1-Dec-03 1-Jun-04 1-Dec-04date
mon
itorin
g fli
ghts
/mon
th a
nd b
adge
r rel
ease
s
2 offspring1 offspring4 translocated2 translocated1 translocated
Figure 2. Dates of release of badgers translocated to southeastern British Columbia and of radiotagged
juveniles born to those animals within British Columbia, and approximate monthly frequency of
radiotelemetry monitoring flights, 2002 – 2005. No flights were conducted 14 August - 10
September 2003 due to unavailability of telemetry aircraft.
2004-2005 Annual Update for the East Kootenay Badger Project March, 2005
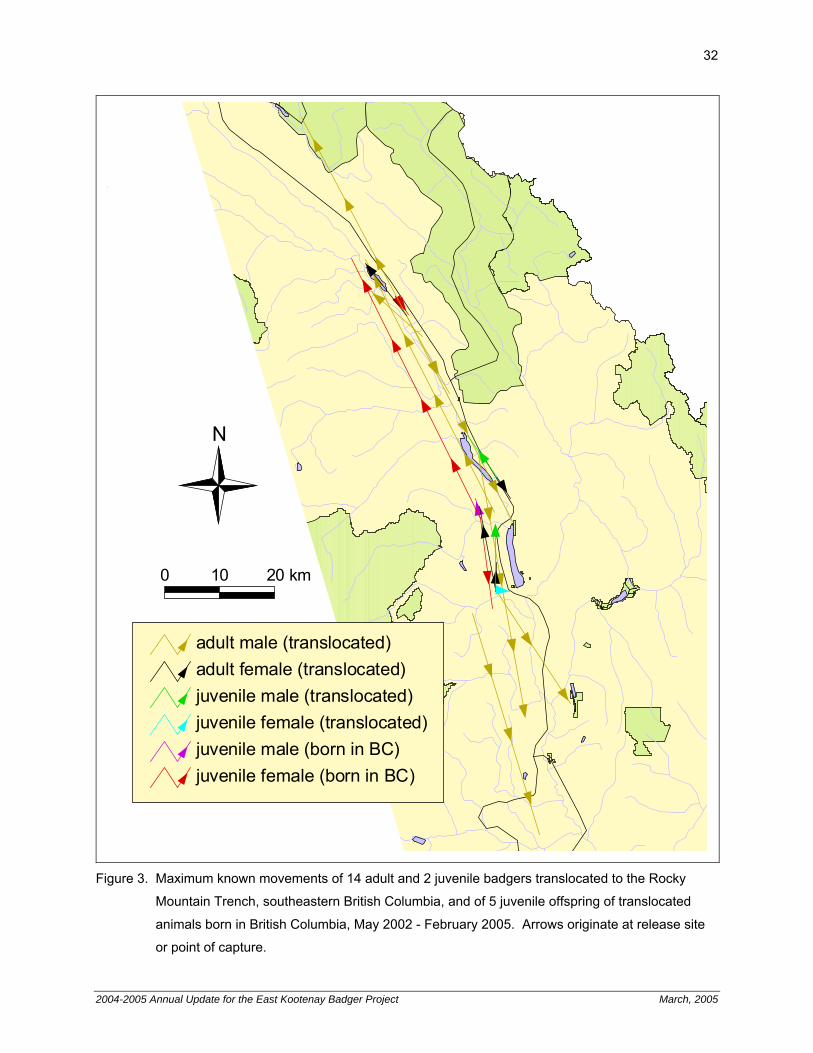
32
adult male (translocated)adult female (translocated)juvenile male (translocated)juvenile female (translocated)juvenile male (born in BC)juvenile female (born in BC)
N
0 10 km20
Figure 3. Maximum known movements of 14 adult and 2 juvenile badgers translocated to the Rocky
Mountain Trench, southeastern British Columbia, and of 5 juvenile offspring of translocated
animals born in British Columbia, May 2002 - February 2005. Arrows originate at release site
or point of capture.
2004-2005 Annual Update for the East Kootenay Badger Project March, 2005
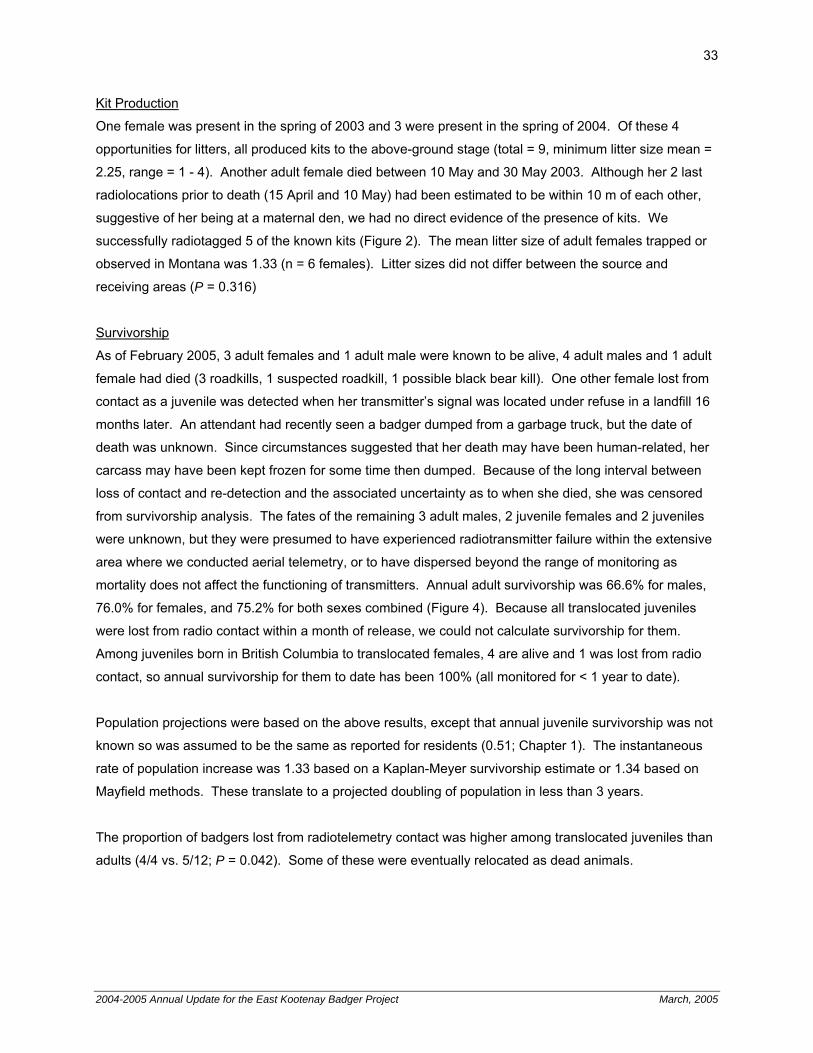
33
Kit Production
One female was present in the spring of 2003 and 3 were present in the spring of 2004. Of these 4
opportunities for litters, all produced kits to the above-ground stage (total = 9, minimum litter size mean =
2.25, range = 1 - 4). Another adult female died between 10 May and 30 May 2003. Although her 2 last
radiolocations prior to death (15 April and 10 May) had been estimated to be within 10 m of each other,
suggestive of her being at a maternal den, we had no direct evidence of the presence of kits. We
successfully radiotagged 5 of the known kits (Figure 2). The mean litter size of adult females trapped or
observed in Montana was 1.33 (n = 6 females). Litter sizes did not differ between the source and
receiving areas (P = 0.316)
Survivorship
As of February 2005, 3 adult females and 1 adult male were known to be alive, 4 adult males and 1 adult
female had died (3 roadkills, 1 suspected roadkill, 1 possible black bear kill). One other female lost from
contact as a juvenile was detected when her transmitter’s signal was located under refuse in a landfill 16
months later. An attendant had recently seen a badger dumped from a garbage truck, but the date of
death was unknown. Since circumstances suggested that her death may have been human-related, her
carcass may have been kept frozen for some time then dumped. Because of the long interval between
loss of contact and re-detection and the associated uncertainty as to when she died, she was censored
from survivorship analysis. The fates of the remaining 3 adult males, 2 juvenile females and 2 juveniles
were unknown, but they were presumed to have experienced radiotransmitter failure within the extensive
area where we conducted aerial telemetry, or to have dispersed beyond the range of monitoring as
mortality does not affect the functioning of transmitters. Annual adult survivorship was 66.6% for males,
76.0% for females, and 75.2% for both sexes combined (Figure 4). Because all translocated juveniles
were lost from radio contact within a month of release, we could not calculate survivorship for them.
Among juveniles born in British Columbia to translocated females, 4 are alive and 1 was lost from radio
contact, so annual survivorship for them to date has been 100% (all monitored for < 1 year to date).
Population projections were based on the above results, except that annual juvenile survivorship was not
known so was assumed to be the same as reported for residents (0.51; Chapter 1). The instantaneous
rate of population increase was 1.33 based on a Kaplan-Meyer survivorship estimate or 1.34 based on
Mayfield methods. These translate to a projected doubling of population in less than 3 years.
The proportion of badgers lost from radiotelemetry contact was higher among translocated juveniles than
adults (4/4 vs. 5/12; P = 0.042). Some of these were eventually relocated as dead animals.
2004-2005 Annual Update for the East Kootenay Badger Project March, 2005
34
females
-0.4-0.20.00.20.40.60.81.01.21.4
0 20 40 60 80 100 120 140
week (beginning 30 May 2002)
cum
ulat
ive
surv
ivor
ship
males
-0.4
-0.2
0.0
0.2
0.4
0.6
0.8
1.0
1.2
0 20 40 60 80 100 120 140
week (beginning 30 May 2002)
cum
ulat
ive
surv
ivor
ship
both sexes
0.0
0.2
0.4
0.6
0.8
1.0
1.2
0 20 40 60 80 100 120 140week (beginning 30 May 2002)
cum
ulat
ive
surv
ivor
ship
Figure 4. Kaplan-Meier weekly survivorship curves and upper and lower 95% confidence intervals for
adult badgers with known fates translocated to the Rocky Mountain Trench, southeastern
British Columbia, May 2002 - February 2005.
Diet
Badgers consumed a variety of prey. This included fossorial rodents of open habitats, but also forest-
dwelling rodents, and fish and insects (Table 1). The incidence of the main prey item (Columbian ground
squirrels) was similar among badgers at their source and release areas (P = 0.751), and the incidence of
samples with no prey remains was also similar (P = 0.142).
Adult Home Ranges and Post-Release Movements
Known movements of translocated badgers extended beyond the target area to the north and south
(Figure 3, Figure 5). Home range sizes were variable but generally considerably larger for males than
females (Figure 5, Table 2). Maximum recorded movements from the point of release were greater (P =
0.013) for adult males (mean = 47.0 km, SE = 7.0 km, n = 8) than for adult females (mean = 15.7 km, SE
= 3.0 km, n = 4).
2004-2005 Annual Update for the East Kootenay Badger Project March, 2005
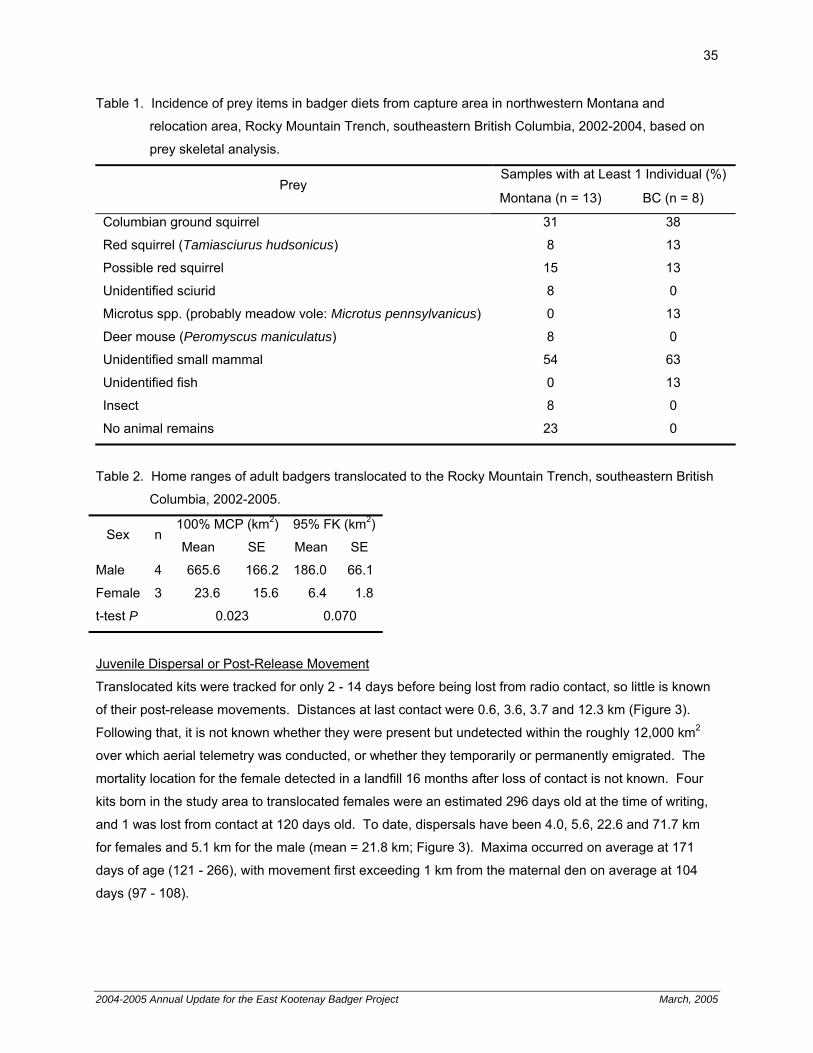
35
Table 1. Incidence of prey items in badger diets from capture area in northwestern Montana and
relocation area, Rocky Mountain Trench, southeastern British Columbia, 2002-2004, based on
prey skeletal analysis.
Samples with at Least 1 Individual (%) Prey
Montana (n = 13) BC (n = 8)
Columbian ground squirrel 31 38
Red squirrel (Tamiasciurus hudsonicus) 8 13
Possible red squirrel 15 13
Unidentified sciurid 8 0
Microtus spp. (probably meadow vole: Microtus pennsylvanicus) 0 13
Deer mouse (Peromyscus maniculatus) 8 0
Unidentified small mammal 54 63
Unidentified fish 0 13
Insect 8 0
No animal remains 23 0
Table 2. Home ranges of adult badgers translocated to the Rocky Mountain Trench, southeastern British
Columbia, 2002-2005.
100% MCP (km2) 95% FK (km2)Sex n
Mean SE Mean SE
Male 4 665.6 166.2 186.0 66.1
Female 3 23.6 15.6 6.4 1.8
t-test P 0.023 0.070
Juvenile Dispersal or Post-Release Movement
Translocated kits were tracked for only 2 - 14 days before being lost from radio contact, so little is known
of their post-release movements. Distances at last contact were 0.6, 3.6, 3.7 and 12.3 km (Figure 3).
Following that, it is not known whether they were present but undetected within the roughly 12,000 km2
over which aerial telemetry was conducted, or whether they temporarily or permanently emigrated. The
mortality location for the female detected in a landfill 16 months after loss of contact is not known. Four
kits born in the study area to translocated females were an estimated 296 days old at the time of writing,
and 1 was lost from contact at 120 days old. To date, dispersals have been 4.0, 5.6, 22.6 and 71.7 km
for females and 5.1 km for the male (mean = 21.8 km; Figure 3). Maxima occurred on average at 171
days of age (121 - 266), with movement first exceeding 1 km from the maternal den on average at 104
days (97 - 108).
2004-2005 Annual Update for the East Kootenay Badger Project March, 2005
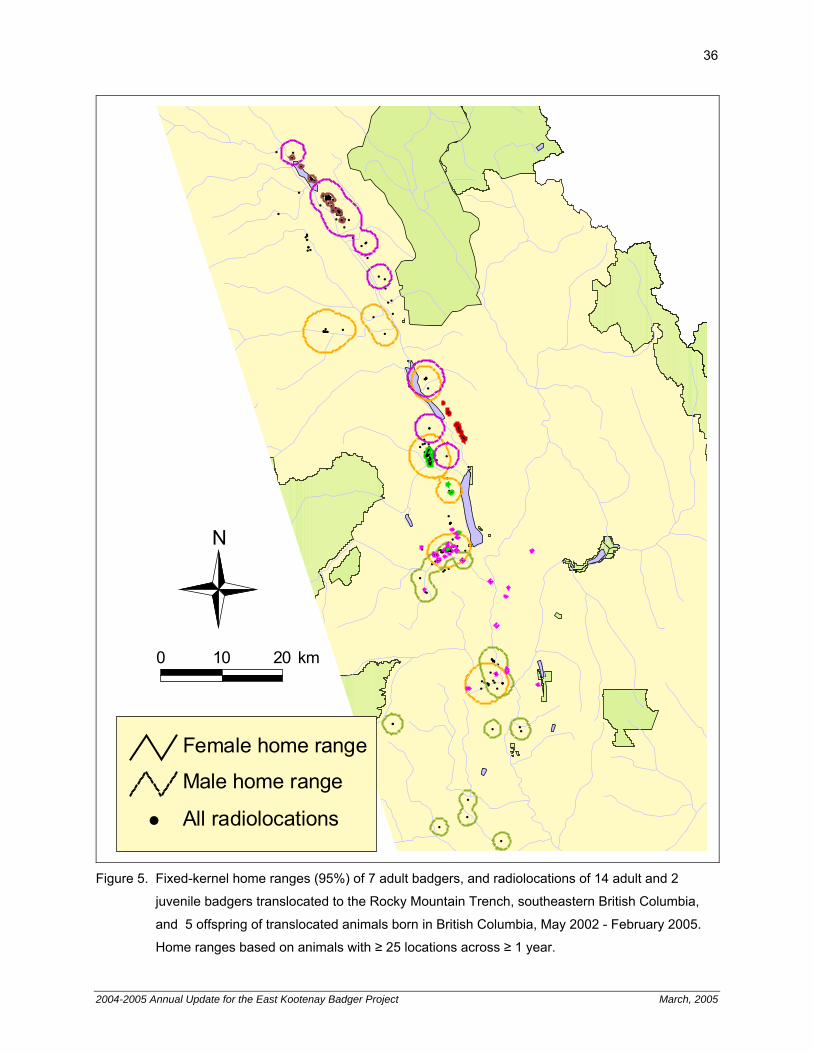
36
##
###
#
##
#
#
#
#
#
#
### ###
#
#
#
###
#
#### ############
#
# ##
#
#
##
#
#
#
#
#
#
### ###
#
#
#
#
#
#
#
#
#
##
#
#
#
#
#
#
#
#
#
#
##########
#
#
##
#
#
#
##
#
########
#
#
#
#
#
##
###
##
#
#
#
#
#
#
#
#
#
#
#
#
#
###
##
#
#
#
#
#
####
###
##
#
#
##############
#
##
#
#
##
##
#########
#####
# #
##
#
#
#
#
####
#
#
#
#
#
#
#
#
###
#
##########
######
##
#####
#
##
#
#
#
#
#
# #
#
##
#
#
#
##
#
#######
####
######
#
#######
####
#
#
#
#
#
#
#
#
###
#
###
#
#
#
################
#
#
###
##
#
#
#
#
#
#
#
#
#
######
#
#
######
#
#
######
#
###
## #####
######
#
#
##
#
#
#
#
#
##
#
#
#
#
#
#
#
#
#
##
# ##
###
#######
##
# ##
#
#
##
#
#
#
###
# All radiolocations
Male home range
Female home range
0 10 20 km
N
Figure 5. Fixed-kernel home ranges (95%) of 7 adult badgers, and radiolocations of 14 adult and 2
juvenile badgers translocated to the Rocky Mountain Trench, southeastern British Columbia,
and 5 offspring of translocated animals born in British Columbia, May 2002 - February 2005.
Home ranges based on animals with ≥ 25 locations across ≥ 1 year.
2004-2005 Annual Update for the East Kootenay Badger Project March, 2005
37
Discussion
A key limitation in assessing the success of the translocation program is that 6 of 16 animals had
unknown fates. However, it is likely that few if any of these animals died within the normal monitoring
area at the time of lost contact, as transmitters continue to function regardless of an animal’s death.
Dead residents with implanted transmitters have been readily detected when up to several metres
underground, following a train collision, and after being struck by vehicles (Chapter 1). Thus, even if
translocated animals had died, repeated attempts to locate them should have eventually been successful
had they remained within the roughly 12,000-km2 monitoring area. Three badgers with failed or failing
transmitters were recaptured or detected much later as roadkills reported by the public and 1 was located
in a landfill, suggesting the likelihood of high transmitter failure rates that would have made translocated
badgers undetectable under normal circumstances. However, the proportion of animals lost from
radiotelemetry contact was higher among juveniles than adults, which is consistent with the expectation
that juvenile badgers normally disperse (Messick and Hornocker 1981), so may suggest that at least part
of the observation relates to long-distance dispersal by translocated badgers. Furthermore, several of the
animals are known to have made movements well away from the release area, including some that were
at high elevations and 1 recovered just beyond the monitoring area, and each of the translocated animals
went undetected on at least 1 monitoring flight. These observations are consistent with some of the “lost”
animals having simply dispersed farther than those that remained in contact. Our best estimation is that
some portion of unknown fates represented animals that made long-distance dispersals, and most of the
remainder probably had transmitter failures. Full necropsies should be performed on all badgers picked
up as roadkills or shot as nuisance animals until at least 2010, to maximize the opportunity to learn the
fate of translocated animals.
Despite the apparent dispersal of some or all of the translocated juveniles and the preliminary nature of
our data, initial indications are that translocation has been relatively successful. Interpretation of badger
movements must be tempered by the fact that most were lost from radio contact, but at least half (likely
more) of badgers remained entirely or largely within the release area. Most activity was in the Rocky
Mountain Trench within areas predicted to have medium to high habitat quality (Apps et al. 2002), with
several animals making use of sites farther into and higher up in the Rocky or Purcell mountains. This
matches the pattern of resident animals (Chapter 1). The exploratory movements associated with release
in a new environment appeared to result in large male home ranges. However, female home ranges
were smaller than those of resident females formerly inhabiting the same portion of the Trench and only
slightly larger than those from the southern Trench (Chapter 1). This was likely related to the
translocated females having kits. The combined-sex survivorship of translocated animals was greater
than that of former residents of the northern (68%), though not as high as for the southern trench (90-
92%; Chapter 1). Whereas males had higher survivorship among residents, females did among
2004-2005 Annual Update for the East Kootenay Badger Project March, 2005
38
translocated animals. This may have been related to the long post-release movements of males in
relation to females, and the larger home ranges of translocated male badgers in relation to former
residents of either the northern or southern Trench. The mean number of kits per potentially reproductive
female, though from a small sample, was noteworthy in apparently being higher than recorded for
residents in either the northern or southern Trench, or from the source population. Survivorship of kits
born to translocated females has also been excellent to date. Within the limits of available data, it
appears that diets of translocated animals in British Columbia was similar to that of both residents
(Chapter 1) and diet prior to translocation.
There have been no other American badger translocation programs with which to compare results, but in
2 fisher (Martes pennanti) translocation programs in British Columbia, Weir (1995) found that 9 to 14 of
the 15 collared animals established home ranges in the target area (mean < 42 km from release site) and
Fontana et al. (1999) reported that 56% remained within the study area (mean < 26 km from release site)
until losing radiocollars an average of 5 months post-release. Among grassland-dependent carnivores,
dispersal data are available from the release of captive-reared and translocated wild-caught swift foxes
(Vulpes velox) in Alberta and Saskatchewan, and captive-reared black-footed ferrets (Mustela nigripes) in
Wyoming. In a year of apparent prey abundance, captive-reared foxes that survived from fall through
spring had mean maximum dispersal distances of 9.3 km, with den sites averaging 4.5 km from release
sites. In contrast, in a year of low food availability, 9 of 12 collared captive-reared foxes appeared to have
dispersed beyond radiotelemetry contact within 2 weeks of release, while the remainder averaged 8 km
dispersals in the same period (Herrero et al. 1991). Wild swift foxes captured in Wyoming and released in
Alberta or Saskatchewan moved an average of 7.2 km from the release site within 2 days, 17.3 km after 4
days, and 27.2 km (adults) or 19.3 km (pups) during the multi-year monitoring period. In addition, daily
movements were over twice as large for translocated as resident foxes during the first 50 days after
release. Of the 29 foxes translocated in the fall, 11 survived within the target area to the following June
(Moehrenschlager and Macdonald 2003). Many released ferrets were lost from radiotelemetry contact,
but the locations of known-fate animals were within a rectangle of 1200 km2 around the release site 2
months after release, with a maximum known dispersal distance of 26.5 km (Biggins et al. 2004). Within
the constraints of having many animals of unknown fate, our results appear to be within the range of
these 5 studies.
Based on comparisons of translocated badgers to both local resident badgers and other carnivore
species, translocation appears to be a promising tool to “kick-start” the recovery of extirpated or nearly
extirpated badger populations. Our positive results also suggest that the original loss of the badger
population at the northernmost portion of its range limit in the Rocky Mountain Trench may have been
due to factors that were not permanent, i.e. the decline prior to translocations does not necessarily
indicate that the area has permanently lost its capability to support badgers.
2004-2005 Annual Update for the East Kootenay Badger Project March, 2005
39
Conducting translocations as soon as possible after population declines is important, for several reasons.
Burrows in which badgers are found are more often re-used than freshly dug (Newhouse and Kinley
2001). From a social perspective, having a collective public memory and recognition of badgers as part
of the ecosystem probably improves the likelihood of support for both translocation and the necessary
management actions (such as habitat restoration, protection of prey, and improving the public’s
perception of the value of badgers). In fact, rather than viewing translocation as being appropriate only
when land and resource management actions have already been taken to maximize the likelihood of
success, we argue that the presence of badgers through translocation in itself acts as a catalyst for
appropriate management activities. With no badgers present, it would probably be more difficult to
convince government agencies and the public of the need to take other steps needed for the conservation
of badgers. Thus, translocation of badgers into historic range from which they have been lost likely
contributes to a positive feedback cycle leading to further badger conservation actions. This may be
appropriate where badgers occur at low and potentially reduced densities elsewhere in British Columbia,
such as parts of the Thompson-Okanagan region (Weir et al. 2003), or for badgers of the endangered T.
t. jacksoni subspecies in southern Ontario (Newhouse and Kinley 2000).
Two recommendations for future translocations relate to sex ratio and the use of juveniles. Even with the
rejection of 2 males at the point of trapping, 67% of adults released in the upper Columbia were male.
This sex ratio was skewed relative to the balanced population reported in other badger capture samples
(Messick and Hornocker 1981, Chapter 1) and is obviously problematic from the perspective of
maximizing the number of reproductive females. However, the lower survivorship and longer dispersals
of males indicate that translocating a preponderance of males, while fortuitous in our situation, might be a
goal in other situations. This imbalance would presumably help ensure pregnancy among translocated
females, and might increase litter size, given the polygamous mating pattern. Unless our conclusions
about juveniles having dispersed well out of the release area are wrong, preliminary indications are that
the use of kits (family groups) had no significant benefit. We had initially expected that juveniles might be
less attached than adults to their point of origin, potentially making them less likely to “go home” and
therefore perhaps more likely to remain in the vicinity of release sites. Among fishers translocated to the
East Kootenay, family groups were found to be more likely than individuals to remain near the release site
(Fontana et al. 1999). From our limited data, we cannot determine whether the presence of kits improved
fidelity to release sites among adult females, but preliminary indications are that the kits did not remain
nearby. Site fidelity and family group cohesiveness among translocated kits and their mothers might be
improved by forcing all members of family groups into the same burrow upon release. We released
groups together but animals sometimes entering separate burrows, and we observed kits and mothers
diverging from each other soon afterward. Using boards to funnel each member of a family group from
the transport barrel into a single burrow would ensure that they did not immediately become separated. If
2004-2005 Annual Update for the East Kootenay Badger Project March, 2005
40
translocations continue in future years or at other locations, monitoring the success of channeling family
groups into a common burrow would be worthwhile. However, if future results indicate that translocated
juveniles are not typically successful in establishing home ranges within target areas and their presence
does not improve site fidelity among their mothers, then conservation goals might ultimately be best
served by leaving juveniles in the source area (assuming adult females were only removed late enough in
the season that the kits would be independent or nearly so). This would facilitate juveniles establishing
home ranges in areas vacated by captured animals, thus presumably increasing survivorship of the
source population and allowing a higher future removal of animals for translocation.
2.7 Acknowledgements
We wish to thank R. Klafki and T. McAllister for trapping and monitoring, J. Williams, T. Their and E.
Wenum, FWP, for advice and logistical support; D. Wallace for assistance in trapping; R. Washtak,
USFWS, for providing field accommodations; Dr. C. Esch, Ashley Creek Animal Clinic and Dr. M.
Zehnder, Invermere Veterinary Hospital, for implanting radiotransmitters, S. Crockford and G. Frederick
for identifying prey remains; M. Badry, R. Forbes, Dr. H. Schwantje and I. Teske, WLAP, and K. Fort,
CWS, for assistance in obtaining permits; Dr. S. McDonald, CFIA, for inspection of badgers; H. Page for
transporting badgers; the crew at Babin Air for telemetry flights; and L. Ingham and J. Krebs of the
Columbia Basin Fish and Wildlife Compensation Program, A. Dibb of Parks Canada, M. Belcher of
Tembec Industries Inc., and I. Teske of WLAP for funding, encouragement and administrative support.
An earlier year’s version of this report was reviewed by A. Dibb, L. Ingham, E. Lofroth and J. Krebs.
Funds for this project were provided (in part) by the Parks Canada Species at Risk Recovery Action and
Education Fund, a program supported by the National Strategy for the Protection of Species at Risk.
Ce projet est financé [en partie] par le Fonds de rétablissement des espèces en péril de Parcs Canada,
un programme à l’appui de la Stratégie nationale pour la protection des espèces en péril.
Literature Cited
Apps, C. D., N. J. Newhouse, and T. A. Kinley. 2002. Habitat associations of American badgers in
southeastern British Columbia. Canadian Journal of Zoology 80:1228-1239.
Biggins, D. E., A. Vargas, J. L. Godbey, and S. H. Anderson. 2004. Influence of prerelease experience
on reintroduced black-footed ferrets (Mustela nigripes). Biological Conservation 89:121-129.
2004-2005 Annual Update for the East Kootenay Badger Project March, 2005
41
Braumandl, T. F., and M. P. Curran, editors and compilers. 1992. A field guide for site identification and
interpretation for the Nelson Forest Region. Land Management Handbook 20, Ministry of Forests,
Victoria, British Columbia.
Cannings, S. G., L. R. Ramsay, D. F. Fraser, and M. A. Fraker. 1999. Rare amphibians, reptiles and
mammals of British Columbia. Ministry of Environment, Lands and Parks, Victoria, British Columbia.
COSEWIC. 2003. Canadian species at risk May 2003. Committee on the Status of Endangered Wildlife
in Canada, Ottawa, Ontario.
Demarchi, D. A., E. C. Lea, and A. A. Button. 2000. Regional and zonal ecosystems of the Shining
Mountains (annotated map). Ministry of Environment, Lands and Parks, Victoria, British Columbia.
Fontana, A., I. Teske, K. Pritchard, and M. Evans. 1999. East Kootenay fisher reintroduction program
final report 1996-1999. Prepared for Ministry of Environment, Lands and Parks, Cranbrook, British
Columbia.
Gayton, D. 1996. Fire-maintained ecosystems and the effects of forest ingrowth. British Columbia
Ministry of Forests, Nelson, British Columbia.
Herrero, S., C. Mamo, L. Carbyn, and M. Scott-Brown. 1991. Swift fox reintroduction into Canada.
Pages 246-418252 in G. L. Holroyd, G. Burns, and H. C. Smith, editors. Proceedings of the second
endangered species and prairie conservation workshop. Provincial Museum of Alberta Natural
History Occasional Paper No. 15. Provincial Museum of Alberta, Edmonton, Alberta.
Hooge, P. N., and B. Eichenlaub. 2000. Animal Movement extension to ArcView. Version 2.04. U.S.
Geological Survey, Anchorage, Alaska.
Hovey, F. 1999. The Home Ranger. Version 1.5. Research Branch, Ministry of Forests, Revelstoke,
British Columbia, Canada.
The jeffersonii Badger Recovery Team. 2003. National recovery strategy for American badger, jeffersonii
subspecies (Taxidea taxus jeffersonii). Corvus Communications, Cranbrook, British Columbia.
Kyle, C. J., R. D. Weir, N. J. Newhouse, H. Davis, and C. Strobeck. 2004. Genetic structure of sensitive
and endangered northwestern badger populations (Taxidea taxus taxus and T. t. jeffersonii). Journal
of Mammalogy:in press.
Long, C. A. 1972. Taxonomic revision of the North American badger, Taxidea taxus. Journal of
Mammalogy 53:725-759.
Machmer, M., H. Page, and C. Steeger. 2001. An effectiveness monitoring plan for NDT4 ecosystem
restoration in the East Kootenay Trench. Prepared for Ministry of Water, Land and Air Protection,
Victoria, British Columbia.
Messick, J. P., and M. G. Hornocker. 1981. Ecology of the badger in southwestern Idaho. Wildlife
Monographs 76.
Moehrenschlager, A., and D. W. Macdonald. 2003. Movement and survival parameters of translocated
and resident swift foxes Vulpes velox. Animal Conservation 6:199-206.
2004-2005 Annual Update for the East Kootenay Badger Project March, 2005
42
Montana Fish, Wildlife and Parks. 2002. Furbearer trapping regulations July 1, 2002 to June 30, 2004.
http://www.fwp.state.mt.us/hunting/regs_furbearer.asp. Viewed 09 December 2003.
Newhouse, N., and T. Kinley. 2000. COSEWIC assessment and update status report on the American
badger Taxidea taxus in Canada. Committee on the Status of Endangered Wildlife in Canada,
Ottawa, Ontario.
Newhouse, N. J., and T. A. Kinley. 2001. Ecology of badgers near a range limit in British Columbia.
Prepared for Columbia Basin Fish and Wildlife Compensation Program, Nelson, British Columbia,
and Parks Canada, Radium Hot Springs, British Columbia.
Newhouse, N. J., and T. A. Kinley. 2004. East Kootenay Badger Project 2003-2004 update: population
ecology, translocation, sightings and communications. Prepared for Columbia Basin Fish and Wildlife
Compensation Program, Nelson, British Columbia, and Parks Canada, Radium Hot Springs, British
Columbia.
Pollock, K. H., S. R. Winterstein, C. M. Bunck, and P. D. Curtis. 1989. Survival analysis in telemetry
studies: the staggered entry design. Journal of Wildlife Management 53:7-15.
Samuel, M. D., and M. R. Fuller. 1996. Wildlife radio telemetry. Pages 370-418 in T. A. Bookhout,
editor. Research and management techniques of wildlife and habitats. The Wildlife Society,
Bethesda, Maryland.
Seaman, D. E., J. J. Millspaugh, B. J. Kernohan, G. C. Brundige, K. J. Raedeke, and R. A. Gitzen. 1999.
Effects of sample size of kernel home range estimates. Journal of Wildlife Management 63:739-747.
Weir, R. D. 1995. Diet, spatial organization, and habitat relationships of fishers in south-central British
Columbia. M.Sc. thesis, University of British Columbia, Vancouver, British Columbia.
Weir, R. D., H. Davis, and C. Hoodicoff. 2003. Conservation strategies for North American badgers in
the Thompson & Okanagan regions. Artemis Wildlife Consultants, Armstrong, British Columbia.
2004-2005 Annual Update for the East Kootenay Badger Project March, 2005

43
Chapter 3. Badger Sightings Reported by the Public
Sightings were collected through the toll-free line for reporting badger sightings (1-866-EK-BADGER;
Chapter 4) and through informal communications. Many of the sightings this year were reported in
response to a notice in the hunting regulations (Chapter 4). The hotline served both as a tool to receive
information about badger locations and as a valuable opportunity for researchers to convey ecological
and conservation messages to callers. Our target area for sightings was the East Kootenay, i.e. the area
between the heights-of-land of the Purcell and Rocky mountains, including the Rocky Mountain Trench,
from the Montana border to the northern tip of the Purcells. However, we also received reports from the
West Kootenay and Boundary areas. Sightings recorded here include only those from the East Kootenay
and the west slope of the Purcell Mountains (Figure 1).
Almost 200 additional sightings were recorded from March 2004 to February 2005, bringing the total
number of sightings to about 850 (Figure 1). Badger sightings have been concentrated in the major, low-
elevation valleys, particularly the Rocky Mountain Trench. However, there are scattered locations at
higher elevations with single to many sightings, extending well into the Purcell and Rocky mountains.
Sighting locations are no doubt biased to areas with greater numbers of people and along transportation
corridors.
Twelve family groups were recorded in the East Kootenay in the summer of 2004. Of these, 3 were
known through radiotelemetry (translocated females) and the remaining 9 were documented as a result of
reports from the public. Family groups were reported in 2004 in the Ta Ta Creek, Meadowbrook, Wycliffe,
Cranbrook, Elko and Elkford areas.
There were 6 records of non-tagged roadkilled badgers during 2004-2005 (all in 2004), in addition to the
28 non-tagged badgers reported as roadkills in previous years since 1996. Roadkills have occurred
throughout the study area from Edgewater south, but were concentrated on Highway 3 from Cranbrook to
Elko, and on Highway 43 near Sparwood. Kills occurred in every month from April to November, with
peak rates in June and August.
2004-2005 Annual Update for the East Kootenay Badger Project March, 2005
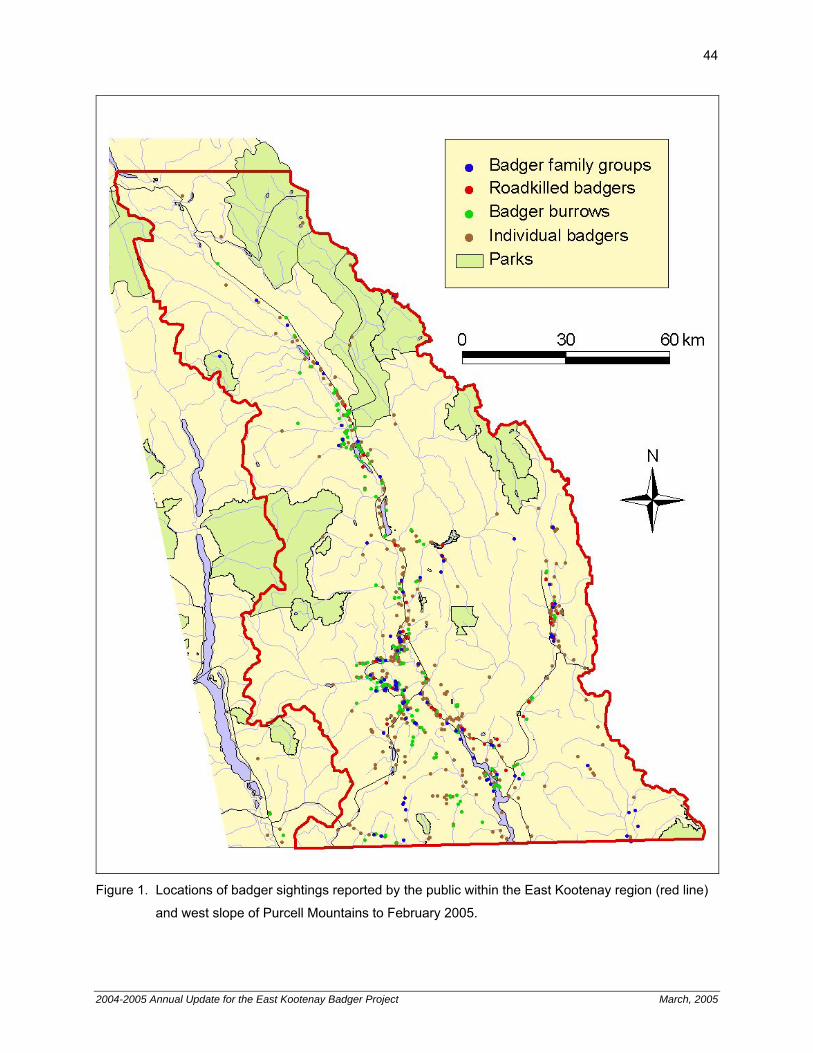
44
Figure 1. Locations of badger sightings reported by the public within the East Kootenay region (red line)
and west slope of Purcell Mountains to February 2005.
2004-2005 Annual Update for the East Kootenay Badger Project March, 2005
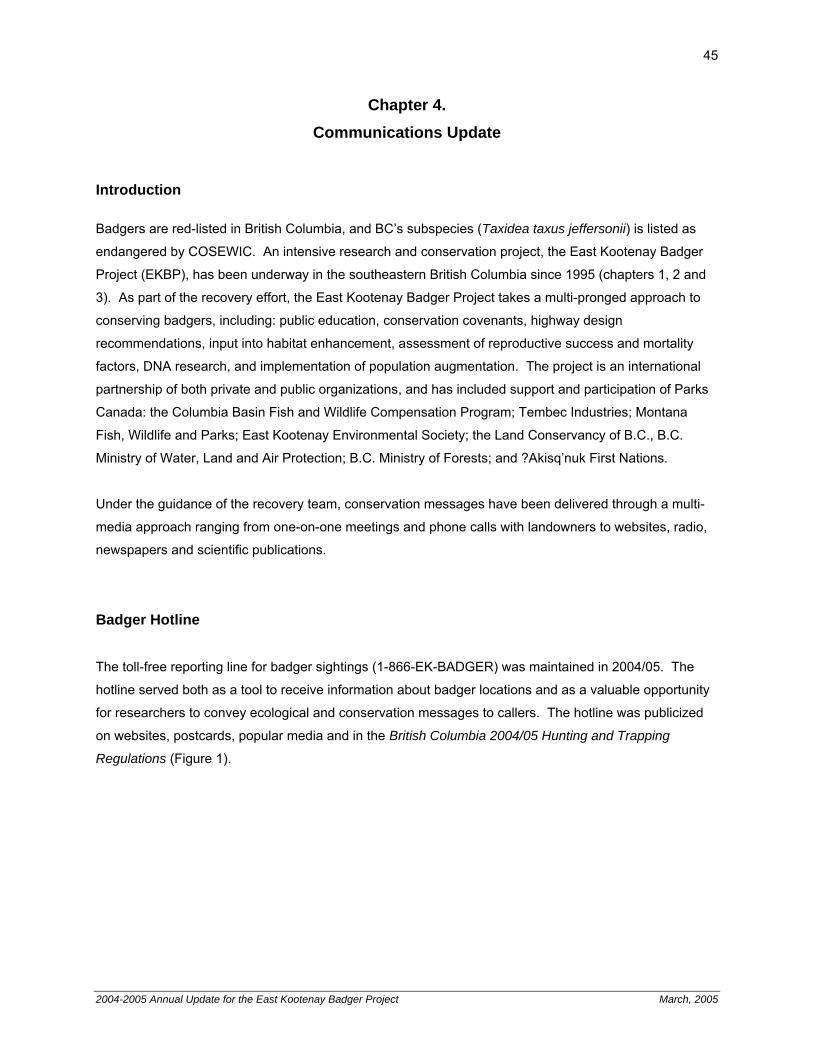
45
Chapter 4. Communications Update
Introduction
Badgers are red-listed in British Columbia, and BC’s subspecies (Taxidea taxus jeffersonii) is listed as
endangered by COSEWIC. An intensive research and conservation project, the East Kootenay Badger
Project (EKBP), has been underway in the southeastern British Columbia since 1995 (chapters 1, 2 and
3). As part of the recovery effort, the East Kootenay Badger Project takes a multi-pronged approach to
conserving badgers, including: public education, conservation covenants, highway design
recommendations, input into habitat enhancement, assessment of reproductive success and mortality
factors, DNA research, and implementation of population augmentation. The project is an international
partnership of both private and public organizations, and has included support and participation of Parks
Canada: the Columbia Basin Fish and Wildlife Compensation Program; Tembec Industries; Montana
Fish, Wildlife and Parks; East Kootenay Environmental Society; the Land Conservancy of B.C., B.C.
Ministry of Water, Land and Air Protection; B.C. Ministry of Forests; and ?Akisq’nuk First Nations.
Under the guidance of the recovery team, conservation messages have been delivered through a multi-
media approach ranging from one-on-one meetings and phone calls with landowners to websites, radio,
newspapers and scientific publications.
Badger Hotline
The toll-free reporting line for badger sightings (1-866-EK-BADGER) was maintained in 2004/05. The
hotline served both as a tool to receive information about badger locations and as a valuable opportunity
for researchers to convey ecological and conservation messages to callers. The hotline was publicized
on websites, postcards, popular media and in the British Columbia 2004/05 Hunting and Trapping
Regulations (Figure 1).
2004-2005 Annual Update for the East Kootenay Badger Project March, 2005
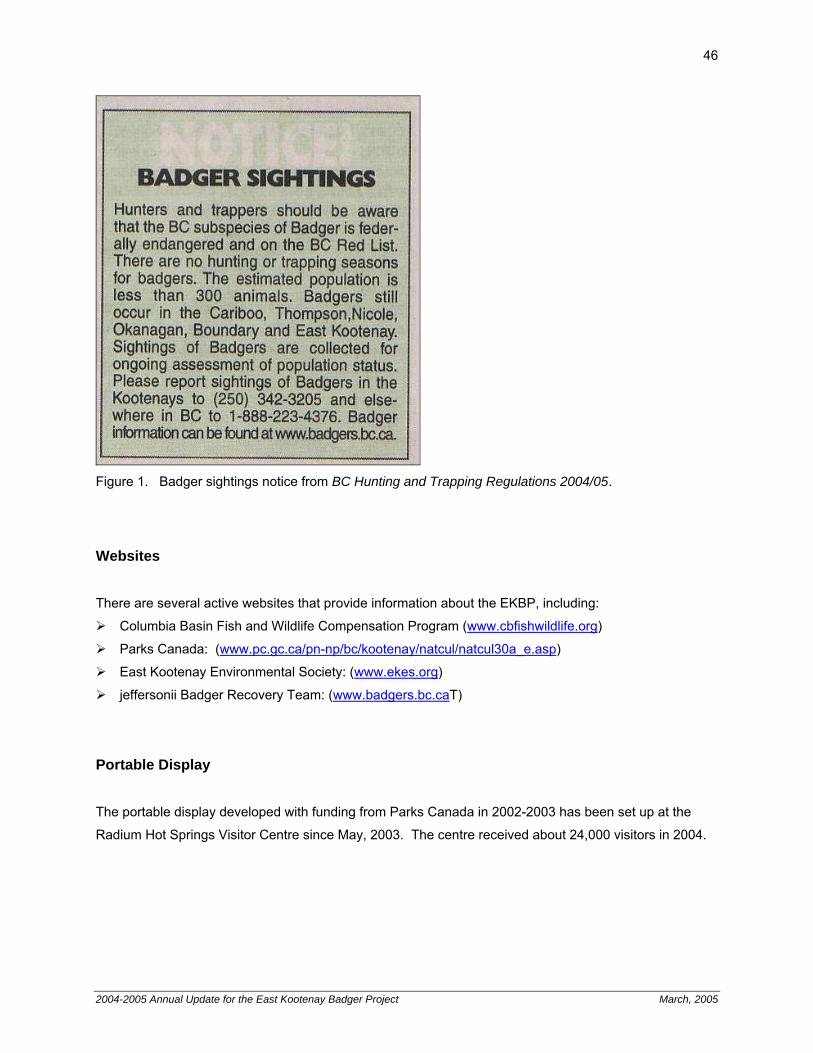
46
Figure 1. Badger sightings notice from BC Hunting and Trapping Regulations 2004/05.
Websites
There are several active websites that provide information about the EKBP, including:
Columbia Basin Fish and Wildlife Compensation Program (www.cbfishwildlife.org)
Parks Canada: (www.pc.gc.ca/pn-np/bc/kootenay/natcul/natcul30a_e.asp)
East Kootenay Environmental Society: (www.ekes.org)
jeffersonii Badger Recovery Team: (www.badgers.bc.caT)
Portable Display
The portable display developed with funding from Parks Canada in 2002-2003 has been set up at the
Radium Hot Springs Visitor Centre since May, 2003. The centre received about 24,000 visitors in 2004.
2004-2005 Annual Update for the East Kootenay Badger Project March, 2005
47
Presentations During the 2004-2005 year, presentations on the research results and conservation implications of the
EKBP were made at:
• Carnivores 2004, Santa Fe, New Mexico (presented by Alan Dibb, Parks Canada)
• J. A. Laird Elementary School, Invermere, British Columbia
• Western Forest Carnivore Committee meetings, Spokane, Washington
Television, Radio, Magazine, Brochure and Newspaper Coverage
Education efforts continued in 2004 through television, radio, magazine, brochures, and newspapers.
Highlights included re-broadcasts of the “Champions of the Wild” documentary on the Knowledge
Network, a radio interview with CBC’s Marian Barshal on “Daybreak”, and several local newspaper
articles (Figure 2, Figure 3, Figure 4, Figure 5). We cooperated with the Land Conservancy of BC’s
“Adopt a Badger” program, a fund-raising program to purchase properties in the Wycliffe area, by
supplying project brochures for mail-outs to 30 donors.
Figure 2. Badger translocation article from The Force (Golden).
2004-2005 Annual Update for the East Kootenay Badger Project March, 2005
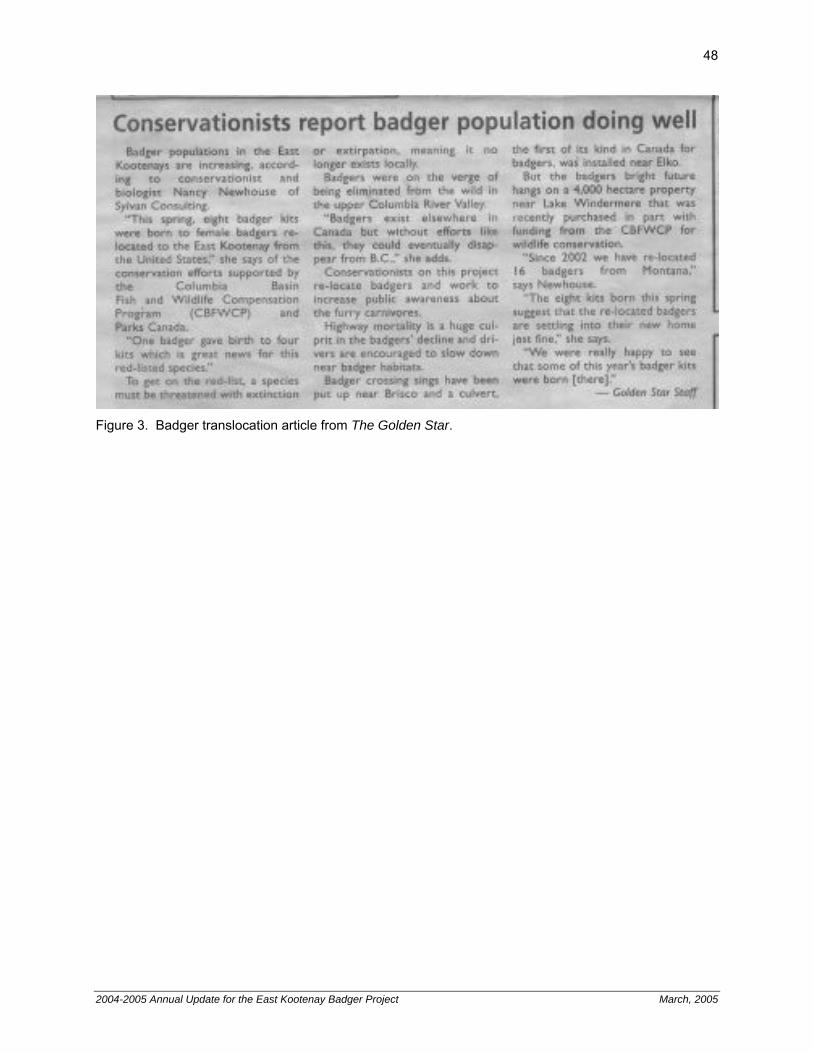
48
Figure 3. Badger translocation article from The Golden Star.
2004-2005 Annual Update for the East Kootenay Badger Project March, 2005
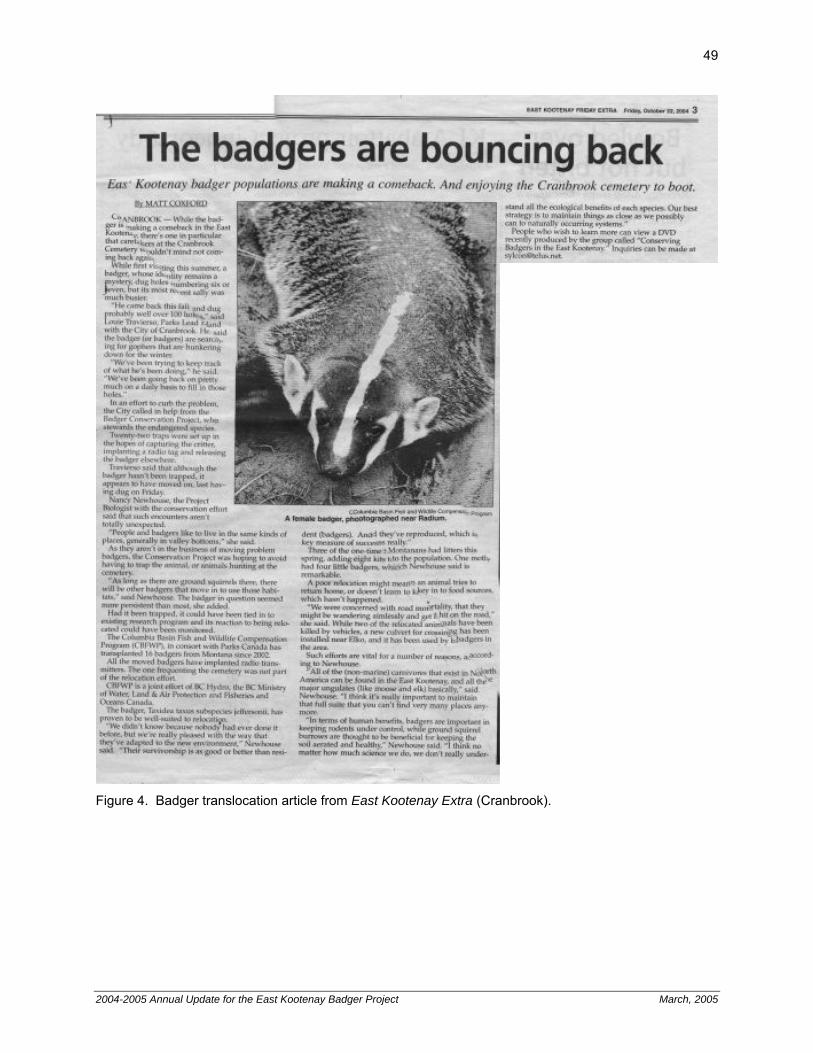
49
Figure 4. Badger translocation article from East Kootenay Extra (Cranbrook).
2004-2005 Annual Update for the East Kootenay Badger Project March, 2005
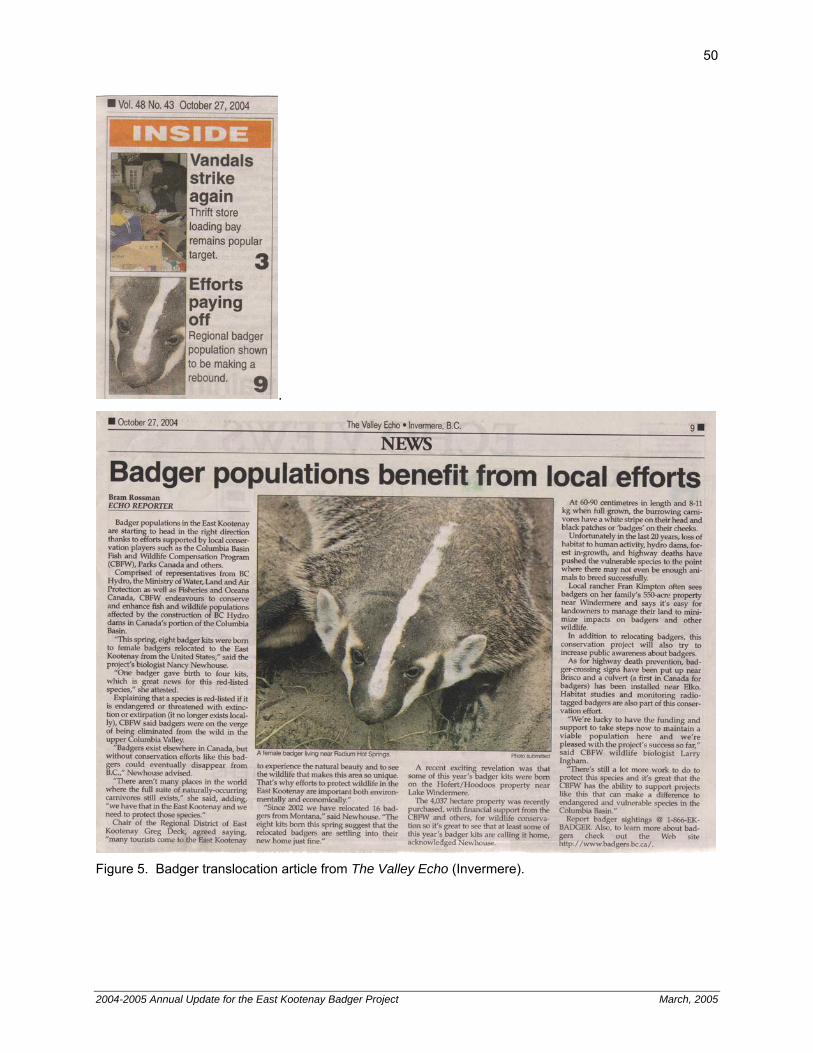
50
.
Figure 5. Badger translocation article from The Valley Echo (Invermere).
2004-2005 Annual Update for the East Kootenay Badger Project March, 2005