Embed Size (px)
Citation preview

East Herts District Council 2020/21
Treasury Management Strategy Statement Minimum Revenue Provision Policy Statement and Annual Investment Strategy
Including commercial activities / non treasury investments

2
INDEX
1 INTRODUCTION
1.1 Background ................................................................................................................................ 5
1.2 Reporting requirements ............................................................................................................ 5
1.3 Treasury Management Strategy for 2020/21 .......................................................................... 7
1.4 Training ........................................................................................................................................ 7
1.5 Treasury management consultants ........................................................................................ 7
2 THE CAPITAL PRUDENTIAL INDICATORS 2020/21 – 2022/23 ........................................... 9
2.1 Capital expenditure .................................................................................................................... 9
2.2 The Council’s borrowing need (the Capital Financing Requirement) ............................... 9
2.3 Core funds and expected investment balances ................................................................. 10
2.4 Minimum revenue provision (MRP) policy statement ........................................................ 11
3 BORROWING ............................................................................................................................ 12
3.1 Current portfolio position ....................................................................................................... 12
3.2 Treasury Indicators: limits to borrowing activity ................................................................ 13
3.3 Prospects for interest rates .................................................................................................... 15
3.4 Borrowing strategy .................................................................................................................. 17
3.5 Policy on borrowing in advance of need ............................................................................. 17
3.6 Debt rescheduling .................................................................................................................... 18
4 ANNUAL INVESTMENT STRATEGY ..................................................................................... 19
4.1 Investment policy – management of risk ............................................................................. 19
4.2 Creditworthiness policy .......................................................................................................... 20
4.3 Country limits ........................................................................................................................... 23
4.4 Investment strategy ................................................................................................................. 24
4.5 Investment performance / risk benchmarking .................................................................... 25
4.6 End of year investment report ............................................................................................... 25
5 APPENDICES ............................................................................................................................ 26
5.2.1 Capital expenditure .................................................................................................................. 28
5.2.2 Affordability prudential indicators ........................................................................................ 28
a. Ratio of financing costs to net revenue stream .................................................................. 28
5.3 INTEREST RATE FORECASTS 2019 – 2021 ........................................................................ 30
PWLB forecasts are based on PWLB certainty rates. ................................................................... 30
5.4 ECONOMIC BACKGROUND .................................................................................................. 31
5.5 TREASURY MANAGEMENT PRACTICE (TMP1) – CREDIT AND COUNTERPARTY RISK MANAGEMENT OPTION 1 ............................................................................................ 37
5.7 APPROVED COUNTRIES FOR INVESTMENTS .................................................................. 42
5.8 TREASURY MANAGEMENT SCHEME OF DELEGATION ................................................. 43
5.9 THE TREASURY MANAGEMENT ROLE OF THE SECTION 151 OFFICER .................... 44

3
ABBREVIATIONS USED IN THIS REPORT ALMO: an Arm’s Length Management Organisation is a not-for-profit company that provides housing services on behalf of a local authority. Usually an ALMO is set up by the authority to manage and improve all or part of its housing stock. LAS: Link Asset Services, Treasury solutions – the council’s treasury management advisers. CE: Capital Economics - is the economics consultancy that provides Link Asset Services, Treasury solutions, with independent economic forecasts, briefings and research. CFR: capital financing requirement - the Council’s annual underlying borrowing need to finance capital expenditure and a measure of the council’s total outstanding indebtedness. CIPFA: Chartered Institute of Public Finance and Accountancy – the professional accounting body that oversees and sets standards in local authority finance and treasury management. CPI: consumer price index – the official measure of inflation adopted as a common standard by countries in the EU. It is a measure that examines the weighted average of prices of a basket of consumer goods and services, such as transportation, food and medical care. It is calculated by taking price changes for each item in the predetermined basket of goods and averaging them. ECB: European Central Bank - the central bank for the Eurozone EU: European Union EZ: Eurozone -those countries in the EU that use the Euro as their currency Fed: the Federal Reserve System, often referred to simply as "the Fed," is the central bank of the United States. It was created by the Congress to provide the nation with a stable monetary and financial system. FOMC: the Federal Open Market Committee – this is the branch of the Federal Reserve Board which determines monetary policy in the USA by setting interest rates and determining quantitative easing policy. It is composed of 12 members--the seven members of the Board of Governors and five of the 12 Reserve Bank presidents. GDP: gross domestic product – a measure of the growth and total size of the economy. G7: the group of seven countries that form an informal bloc of industrialised democracies--the United States, Canada, France, Germany, Italy, Japan, and the United Kingdom--that meets annually to discuss issues such as global economic governance, international security, and energy policy. Gilts: gilts are bonds issued by the UK Government to borrow money on the financial markets. Interest paid by the Government on gilts is called a coupon and is at a rate that is fixed for the duration until maturity of the gilt, (unless a gilt is index linked to inflation); while the coupon rate is fixed, the yields will change inversely to the price of gilts i.e. a rise in the price of a gilt will mean that its yield will fall. HRA: housing revenue account.

4
IMF: International Monetary Fund - the lender of last resort for national governments that get into financial difficulties. LIBID: the London Interbank Bid Rate is the rate bid by banks on deposits i.e., the rate at which a bank is willing to borrow from other banks. It is the "other end" of the LIBOR (an offered, hence "ask" rate, the rate at which a bank will lend). MHCLG: the Ministry of Housing, Communities and Local Government -the Government department that directs local authorities in England. MPC: the Monetary Policy Committee is a committee of the Bank of England, which meets for one and a half days, eight times a year, to determine monetary policy by setting the official interest rate in the United Kingdom, (the Bank of England Base Rate, commonly called Bank Rate), and by making decisions on quantitative easing. MRP: minimum revenue provision -a statutory annual minimum revenue charge to reduce the total outstanding CFR, (the total indebtedness of a local authority). PFI: Private Finance Initiative – capital expenditure financed by the private sector i.e. not by direct borrowing by a local authority. PWLB: Public Works Loan Board – this is the part of H.M. Treasury which provides loans to local authorities to finance capital expenditure. QE: quantitative easing – is an unconventional form of monetary policy where a central bank creates new money electronically to buy financial assets, such as government bonds, (but may also include corporate bonds). This process aims to stimulate economic growth through increased private sector spending in the economy and aims to return inflation to target. These purchases increase the supply of liquidity to the economy; this policy is employed when lowering interest rates has failed to stimulate economic growth to an acceptable level and to lift inflation to target. Once QE has achieved its objectives of stimulating growth and inflation, QE will be reversed by selling the bonds the central bank had previously purchased, or by not replacing debt that it held which matures. The aim of this reversal is to ensure that inflation does not exceed its target once the economy recovers from a sustained period of depressed growth and inflation. Economic growth, and increases in inflation, may threaten to gather too much momentum if action is not taken to ‘cool’ the economy. RPI: the Retail Price Index is a measure of inflation that measures the change in the cost of a representative sample of retail goods and services. It was the UK standard for measurement of inflation until the UK changed to using the EU standard measure of inflation – CPI. The main differences between RPI and CPI is in the way that housing costs are treated and that the former is an arithmetical mean whereas the latter is a geometric mean. RPI is often higher than CPI for these reasons. TMSS: the annual treasury management strategy statement reports that all local authorities are required to submit for approval by the full council before the start of each financial year. VRP: a voluntary revenue provision to repay debt, in the annual budget, which is additional to the annual MRP charge, (see above definition).

1. INTRODUCTION
1.1 Background
The Council is required to operate a balanced budget, which broadly means that cash raised during the year will meet cash expenditure. Part of the treasury management operation is to ensure that this cash flow is adequately planned with cash being available when it is needed. Surplus monies are invested in low risk counterparties or instruments commensurate with the Council’s low risk appetite, providing adequate liquidity initially before considering investment return. The second main function of the treasury management service is the funding of the Council’s capital plans. These capital plans provide a guide to the borrowing need of the Council, essentially the longer-term cash flow planning, to ensure that the Council can meet its capital spending obligations. This management of longer-term cash may involve arranging long or short-term loans, or using longer-term cash flow surpluses. On occasions, when it is prudent and economic, any debt previously drawn may be restructured to meet Council risk or cost objectives. The contribution the treasury management function makes to the authority is critical, as the balance of debt and investment operations ensure liquidity or the ability to meet spending commitments as they fall due, either on day-to-day revenue or for larger capital projects. The treasury operations will see a balance of the interest costs of debt and the investment income arising from cash deposits affecting the available budget. Since cash balances generally result from reserves and balances, it is paramount to ensure adequate security of the sums invested, as a loss of principal will in effect result in a loss to the General Fund Balance. Whilst any commercial initiatives or loans to third parties will impact on the treasury function, these activities are generally classed as non-treasury activities, (arising usually from capital expenditure), and are separate from the day-to-day treasury management activities. CIPFA defines treasury management as:
“The management of the local authority’s borrowing, investments and cash flows, its banking, money market and capital market transactions; the effective control of the risks associated with those activities; and the pursuit of optimum performance consistent with those risks.”
1.2 Reporting requirements
1.2.1 Capital Strategy The CIPFA 2017 Prudential and Treasury Management Codes require all local authorities to prepare a capital strategy report, which will provide the following:
a high-level long term overview of how capital expenditure, capital financing and treasury management activity contribute to the provision of services
an overview of how the associated risk is managed
the implications for future financial sustainability The aim of this capital strategy is to ensure that all elected members on the full council understand the overall long-term policy objectives and resulting capital strategy requirements, governance procedures and risk appetite.

6
This Capital Strategy is reported separately from the Treasury Management Strategy Statement; non-treasury investments will be reported through the former. This ensures the separation of the core treasury function under security, liquidity and yield principles, and the policy and commercialism investments usually driven by expenditure on an asset. The capital strategy will show:
The corporate governance arrangements for these types of activities;
Any service objectives relating to the investments;
The expected income, costs and resulting contribution;
The debt related to the activity and the associated interest costs;
The payback period (MRP policy);
For non-loan type investments, the cost against the current market value;
The risks associated with each activity. Where a physical asset is being bought, details of market research, advisers used, (and their monitoring), ongoing costs and investment requirements, and any credit information will be disclosed, including the ability to sell the asset and realise the investment cash. Where the Council has borrowed to fund any non-treasury investment, there should also be an explanation of why borrowing was required and why the MHCLG Investment Guidance and CIPFA Prudential Code have not been adhered to. If any non-treasury investment sustains a loss during the final accounts and audit process, the strategy and revenue implications will be reported through the same procedure as the capital strategy. To demonstrate the proportionality between the treasury operations and the non-treasury operation, high-level comparators are shown throughout this report. 1.2.2 Treasury Management reporting The Council is currently required to receive and approve, as a minimum, three main treasury reports each year, which incorporate a variety of policies, estimates and actuals.
a. Prudential and treasury indicators and treasury strategy (this report) - The first, and most important report is forward looking and covers:
the capital plans, (including prudential indicators);
a minimum revenue provision (MRP) policy, (how residual capital expenditure is charged to revenue over time);
the treasury management strategy, (how the investments and borrowings are to be organised), including treasury indicators; and
an investment strategy, (the parameters on how investments are to be managed).
b. A mid-year treasury management report – This is primarily a progress
report and will update members on the capital position, amending prudential indicators as necessary, and whether any policies require revision.
c. An annual treasury report – This is a backward looking review document and provides details of a selection of actual prudential and treasury indicators and actual treasury operations compared to the estimates within the strategy.

7
Scrutiny
The above reports are required to be adequately scrutinised before being recommended to the Council. This role is undertaken by the Performance, Audit, Governance and Oversight Committee.
1.3 Treasury Management Strategy for 2020/21
The Strategy for 2020/21 covers two main areas: Capital issues
the capital expenditure plans and the associated prudential indicators;
the minimum revenue provision (MRP) policy.
Treasury Management issues
the current treasury position;
treasury indicators which limit the treasury risk and activities of the Council;
prospects for interest rates;
the borrowing strategy;
policy on borrowing in advance of need;
debt rescheduling;
the investment strategy;
creditworthiness policy; and
the policy on use of external service providers.
These elements cover the requirements of the Local Government Act 2003, the CIPFA Prudential Code, MHCLG MRP Guidance, the CIPFA Treasury Management Code and MHCLG Investment Guidance.
1.4 Training
The CIPFA Code requires the responsible officer to ensure that members with responsibility for treasury management receive adequate training in treasury management. This especially applies to members responsible for scrutiny. Training will be arranged before the end of the financial year.
The training needs of treasury management officers are periodically reviewed, with relevant seminars and workshops regularly attended.
1.5 Treasury Management Consultants
The Council uses Link Asset Services, Treasury Solutions as its external treasury management advisors. The Council recognises that responsibility for treasury management decisions remains with the organisation at all times and will ensure that undue reliance is not placed upon the services of our external service providers. All decisions will be undertaken with regards to all available information, including, but not solely, our treasury advisers.

8
It also recognises that there is value in employing external providers of treasury management services in order to acquire access to specialist skills and resources. The Council will ensure that the terms of their appointment and the methods by which their value will be assessed are properly agreed and documented, and subjected to regular review. The scope of investments within the Council’s operations now includes both conventional treasury investments, (the placing of residual cash from the Council’s functions), and more commercial type investments, such as investment properties. The commercial type investments require specialist advisers, and the Council uses its in-house property and estates team, who follow a process, set out within the Financial Sustainability Strategy 2019-2025. This Strategy proposes the implementation of an investment board with an established annually agreed budget. The Board will consist of elected members and officers. It shall have two permanent individuals on it: the portfolio holder for Finance and Support Services and the Head of Strategic Finance. Other officers will contribute to the board as and when required. The Board’s delegated budget will be available for investment opportunities and they will review opportunities and assess them according to risk and return. The Board will be looking purely for financial return with an emphasis on safe and secure investments. A structure and analysis of any potential opportunity must pass a set of pre-determined risk matrix included as appendix 5.1. East Herts aims to be one of a number of financially sustainable councils that achieve independence from central government funding. Such councils are diverse and take a wide range of approaches to achieve financially independence. However, one thing they all have in common is investments in commercial properties for a given rate of return. East Herts has the appetite to consider opportunities inside and outside of the district as there are limited options internally and this could constrain the portfolio of investments to either result in reduced returns, excessive risk, or both.

9
2 THE CAPITAL PRUDENTIAL INDICATORS 2020/21 – 2022/23 The Council’s capital expenditure plans are the key driver of treasury management activity. The output of the capital expenditure plans is reflected in the prudential indicators, which are designed to assist members’ overview and confirm capital expenditure plans.
2.1 Capital expenditure
This prudential indicator is a summary of the Council’s capital expenditure plans, both those agreed previously, and those forming part of this budget cycle. Members are asked to approve the capital expenditure forecasts:
Capital expenditure
£m
2018/19
Actual
2019/20
Estimate
2020/21
Estimate*
2021/22
Estimate*
2022/23
Estimate*
Services 3.7 8.8 33.8 28.8 19.9
Commercial activities / non-financial investments **
2.5 6.3 24.5 2.9 1.1
Total 6.2 15.1 58.3 31.7 21.0
* Provision figures to be approved at Full Council 29th January 2020.
** Commercial activities / non-financial investments relate to areas such as capital expenditure on investment properties, loans to third parties etc.
Other long-term liabilities - The above financing need excludes other long-term liabilities, such as PFI and leasing arrangements that already include borrowing instruments.
The table below summarises the above capital expenditure plans and how these plans are being financed by capital or revenue resources. Any shortfall of resources results in a funding need.
Financing of capital expenditure £m
2018/19
Actual
2019/20
Estimate
2020/21
Estimate
2021/22
Estimate
2022/23
Estimate
Capital receipts 3.4 3.0 1.0 1.0 1.0
Capital grants 0.1 2.1 7.7 0.6 0.0
Capital reserves 2.7 0.6 0.2 0.2 0.2
Revenue 0.0 0.0 0.0 0.0 0.0
Net financing need for the year
0.0 9.4 49.4 29.9 19.8
2.2 The Council’s borrowing need (the Capital Financing Requirement)
The second prudential indicator is the Council’s Capital Financing Requirement (CFR). The CFR is simply the total historic outstanding capital expenditure which has not yet been paid for from either revenue or capital resources. It is essentially a measure of the Council’s indebtedness and so it’s underlying borrowing need.

10
Any capital expenditure above, which has not immediately been paid for through a revenue or capital resource, will increase the CFR.
The CFR does not increase indefinitely, as the minimum revenue provision (MRP) is a statutory annual revenue charge which broadly reduces the indebtedness in line with each assets life, and so charges the economic consumption of capital assets as they are used.
The CFR includes any other long-term liabilities (e.g. PFI schemes, finance leases). Whilst these increase the CFR, and therefore the Council’s borrowing requirement, these types of scheme include a borrowing facility by the PFI, PPP lease provider and so the Council is not required to separately borrow for these schemes. The Council currently has no such schemes within the CFR.
The Council is asked to approve the CFR projections below:
£m 2018/19
Actual
2019/20
Estimate
2020/21
Estimate
2021/22
Estimate
2022/23
Estimate
Capital Financing Requirement
Total CFR (23.1) (13.7) 35.7 65.6 85.4
Net financing need for the year (above)
0.0 9.4 49.4 29.9 19.8
A key aspect of the regulatory and professional guidance is that elected members are aware of the size and scope of any commercial activity in relation to the authority’s overall financial position. The capital expenditure figures shown in 2.1 and the details above demonstrate the scope of this activity and, by approving these figures, members consider the scale proportionate to the Authority’s remaining activity.
2.3 Core funds and expected investment balances
The application of resources (capital receipts, reserves etc.) to either finance capital expenditure or other budget decisions to support the revenue budget will have an ongoing impact on investments unless resources are supplemented each year from new sources (asset sales etc.). Detailed below are estimates of the year-end balances for each resource and anticipated day-to-day cash flow balances.
Year End Resources
£m
2018/19
Actual
2019/20
Estimate
2020/21
Estimate
2021/22
Estimate
2022/23
Estimate
Fund balances / reserves
13.9 15.4 15.9 16.3 16.6
Capital receipts 1.9 0.0 0.0 0.0 0.0
Provisions 0.0 0.0 0.0 0.0 0.0
Other 0.0 0.0 0.0 0.0 0.0
Total core funds 15.8 15.4 15.9 16.3 16.6
Working capital* 37.2 27.8 (7.4) (7.3) (8.1)
(Under)/over borrowing 7.5 7.5 (4.2) (4.1) (4.9)
Expected investments 60.5 50.7 10.0 10.5 10.0
* Working capital balances shown are estimated year-end; these may be higher mid-year

11
2.4 Minimum revenue provision (MRP) policy statement
The Council is required to pay off an element of the accumulated General Fund capital spend each year (the CFR) through a revenue charge (the minimum revenue provision - MRP), although it is also allowed to undertake additional voluntary payments if required (voluntary revenue provision - VRP).
MHCLG regulations have been issued which require the full Council to approve an MRP Statement in advance of each year. A variety of options are provided to councils, so long as there is a prudent provision.
Following the disposal of the Council’s Housing stock, the calculated MRP is currently nil and it is not anticipated that any MRP will be required for 2020/21.

12
3 BORROWING The capital expenditure plans set out in Section 2 provide details of the service activity of the Council. The treasury management function ensures that the Council’s cash is organised in accordance with the relevant professional codes, so that sufficient cash is available to meet this service activity and the Council’s capital strategy. This will involve both the organisation of the cash flow and, where capital plans require, the organisation of appropriate borrowing facilities. The strategy covers the relevant treasury / prudential indicators, the current and projected debt positions and the annual investment strategy.
3.1 Current portfolio position
The overall treasury management portfolio as at 31 March 2019 and the position as at 30 November 2019 are shown below for both borrowing and investments.
TREASURY PORTFOLIO
actual actual current current
31.3.19 31.3.19 30.11.19 30.11.19
Treasury investments £000 % £000 %
banks 40,700 67% 47,685 70%
building societies - unrated 0 0% 0 0%
building societies - rated 0 0% 0 0%
local authorities 0 0% 0 0%
DMADF (H.M.Treasury) 0 0% 0 0%
money market funds 0 0% 0 0%
certificates of deposit 0 0% 0 0%
Total managed in house 40,700 67% 47,685 70%
bond funds
0%
0%
property funds 20,000 33% 20,000 30%
Total managed externally 20,000 33% 20,000 30%
Total treasury investments 60,700 100% 67,685 100%
Treasury external borrowing
local authorities
0%
0%
PWLB (1,500) 20% (1,500) 20%
LOBOs 0 0% 0 0%
BOND (6,000) 80% (6,000) 80%
Total external borrowing (7,500) 100% (7,500) 100%
Net treasury investments / (borrowing) 53,200
60,185
The Council’s forward projections for borrowing are summarised below. The table shows the actual external debt, against the underlying capital borrowing need, (the Capital Financing Requirement - CFR), highlighting any over or under borrowing.
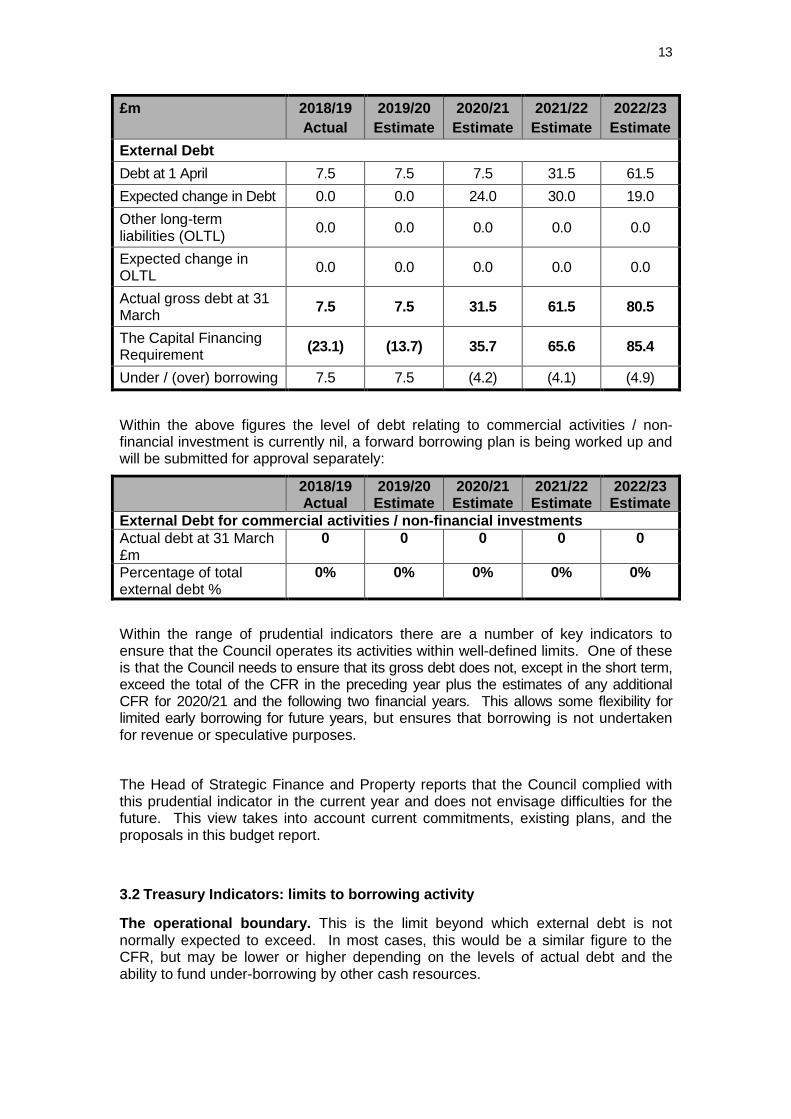
13
£m 2018/19
Actual
2019/20
Estimate
2020/21
Estimate
2021/22
Estimate
2022/23
Estimate
External Debt
Debt at 1 April 7.5 7.5 7.5 31.5 61.5
Expected change in Debt 0.0 0.0 24.0 30.0 19.0
Other long-term liabilities (OLTL)
0.0 0.0 0.0 0.0 0.0
Expected change in OLTL
0.0 0.0 0.0 0.0 0.0
Actual gross debt at 31 March
7.5 7.5 31.5 61.5 80.5
The Capital Financing Requirement
(23.1) (13.7) 35.7 65.6 85.4
Under / (over) borrowing 7.5 7.5 (4.2) (4.1) (4.9)
Within the above figures the level of debt relating to commercial activities / non-financial investment is currently nil, a forward borrowing plan is being worked up and will be submitted for approval separately:
2018/19 Actual
2019/20 Estimate
2020/21 Estimate
2021/22 Estimate
2022/23 Estimate
External Debt for commercial activities / non-financial investments
Actual debt at 31 March £m
0 0 0 0 0
Percentage of total external debt %
0%
0% 0% 0% 0%
Within the range of prudential indicators there are a number of key indicators to ensure that the Council operates its activities within well-defined limits. One of these is that the Council needs to ensure that its gross debt does not, except in the short term, exceed the total of the CFR in the preceding year plus the estimates of any additional CFR for 2020/21 and the following two financial years. This allows some flexibility for limited early borrowing for future years, but ensures that borrowing is not undertaken for revenue or speculative purposes.
The Head of Strategic Finance and Property reports that the Council complied with this prudential indicator in the current year and does not envisage difficulties for the future. This view takes into account current commitments, existing plans, and the proposals in this budget report.
3.2 Treasury Indicators: limits to borrowing activity
The operational boundary. This is the limit beyond which external debt is not normally expected to exceed. In most cases, this would be a similar figure to the CFR, but may be lower or higher depending on the levels of actual debt and the ability to fund under-borrowing by other cash resources.

14
Operational boundary £m
2019/20
Estimate
2020/21
Estimate
2021/22
Estimate
2022/23
Estimate
Debt 7.5 32.0 62.0 81.0
Other long term liabilities 0.0 0.5 0.5 0.5
Commercial activities / non-financial investments
0.0 0.0 0.0 0.0
Total 7.5 32.5 62.5 81.5
The authorised limit for external debt. This is a key prudential indicator and represents a control on the maximum level of borrowing. This represents a legal limit beyond which external debt is prohibited, and this limit needs to be set or revised by the full Council. It reflects the level of external debt which, while not desired, could be afforded in the short term, but is not sustainable in the longer term.
1. This is the statutory limit determined under section 3 (1) of the Local Government Act 2003. The Government retains an option to control either the total of all councils’ plans, or those of a specific council, although this power has not yet been exercised.
2. The Council is asked to approve the following authorised limit:
Authorised limit £m 2019/20
Estimate
2020/21
Estimate
2021/22
Estimate
2022/23
Estimate
Debt 9.5 32.0 62.0 82.0
Other long term liabilities 2.0 1.5 1.5 1.5
Commercial activities/ non-financial investments
0.0 4.2 4.1 3.9
Total 11.5 37.7 67.6 87.4
15
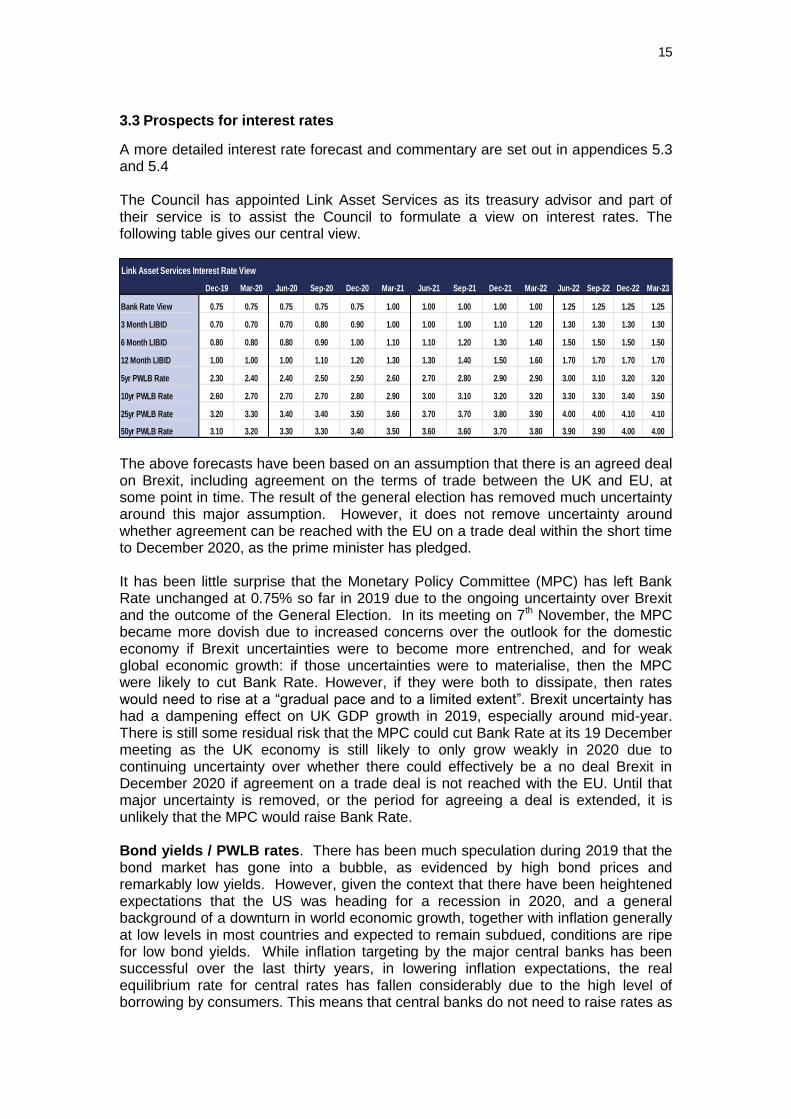
3.3 Prospects for interest rates
A more detailed interest rate forecast and commentary are set out in appendices 5.3 and 5.4 The Council has appointed Link Asset Services as its treasury advisor and part of their service is to assist the Council to formulate a view on interest rates. The following table gives our central view.
The above forecasts have been based on an assumption that there is an agreed deal on Brexit, including agreement on the terms of trade between the UK and EU, at some point in time. The result of the general election has removed much uncertainty around this major assumption. However, it does not remove uncertainty around whether agreement can be reached with the EU on a trade deal within the short time to December 2020, as the prime minister has pledged. It has been little surprise that the Monetary Policy Committee (MPC) has left Bank Rate unchanged at 0.75% so far in 2019 due to the ongoing uncertainty over Brexit and the outcome of the General Election. In its meeting on 7th November, the MPC became more dovish due to increased concerns over the outlook for the domestic economy if Brexit uncertainties were to become more entrenched, and for weak global economic growth: if those uncertainties were to materialise, then the MPC were likely to cut Bank Rate. However, if they were both to dissipate, then rates would need to rise at a “gradual pace and to a limited extent”. Brexit uncertainty has had a dampening effect on UK GDP growth in 2019, especially around mid-year. There is still some residual risk that the MPC could cut Bank Rate at its 19 December meeting as the UK economy is still likely to only grow weakly in 2020 due to continuing uncertainty over whether there could effectively be a no deal Brexit in December 2020 if agreement on a trade deal is not reached with the EU. Until that major uncertainty is removed, or the period for agreeing a deal is extended, it is unlikely that the MPC would raise Bank Rate. Bond yields / PWLB rates. There has been much speculation during 2019 that the bond market has gone into a bubble, as evidenced by high bond prices and remarkably low yields. However, given the context that there have been heightened expectations that the US was heading for a recession in 2020, and a general background of a downturn in world economic growth, together with inflation generally at low levels in most countries and expected to remain subdued, conditions are ripe for low bond yields. While inflation targeting by the major central banks has been successful over the last thirty years, in lowering inflation expectations, the real equilibrium rate for central rates has fallen considerably due to the high level of borrowing by consumers. This means that central banks do not need to raise rates as
Link Asset Services Interest Rate View
Dec-19 Mar-20 Jun-20 Sep-20 Dec-20 Mar-21 Jun-21 Sep-21 Dec-21 Mar-22 Jun-22 Sep-22 Dec-22 Mar-23
Bank Rate View 0.75 0.75 0.75 0.75 0.75 1.00 1.00 1.00 1.00 1.00 1.25 1.25 1.25 1.25
3 Month LIBID 0.70 0.70 0.70 0.80 0.90 1.00 1.00 1.00 1.10 1.20 1.30 1.30 1.30 1.30
6 Month LIBID 0.80 0.80 0.80 0.90 1.00 1.10 1.10 1.20 1.30 1.40 1.50 1.50 1.50 1.50
12 Month LIBID 1.00 1.00 1.00 1.10 1.20 1.30 1.30 1.40 1.50 1.60 1.70 1.70 1.70 1.70
5yr PWLB Rate 2.30 2.40 2.40 2.50 2.50 2.60 2.70 2.80 2.90 2.90 3.00 3.10 3.20 3.20
10yr PWLB Rate 2.60 2.70 2.70 2.70 2.80 2.90 3.00 3.10 3.20 3.20 3.30 3.30 3.40 3.50
25yr PWLB Rate 3.20 3.30 3.40 3.40 3.50 3.60 3.70 3.70 3.80 3.90 4.00 4.00 4.10 4.10
50yr PWLB Rate 3.10 3.20 3.30 3.30 3.40 3.50 3.60 3.60 3.70 3.80 3.90 3.90 4.00 4.00

16
much now to have a major impact on consumer spending, inflation, etc. which has pulled down the overall level of interest rates and bond yields in financial markets over the last thirty years. We have therefore seen over the last year, many bond yields up to ten years in the Eurozone actually turn negative. In addition, there has, at times, been an inversion of bond yields in the US whereby ten-year yields have fallen below shorter-term yields. In the past, this has been a precursor of a recession. The other side of this coin is that bond prices are elevated, as investors would be expected to be moving out of riskier assets i.e. shares, in anticipation of a downturn in corporate earnings and so selling out of equities. However, stock markets are also currently at high levels as some investors have focused on chasing returns in the context of dismal ultra-low interest rates on cash deposits. During the first half of 2019-20 to 30 September, gilt yields plunged and caused a near halving of longer term PWLB rates to completely unprecedented historic low levels. (See paragraph 3.7 for comments on the increase in the PWLB rates margin over gilt yields of 100bps introduced on 9.10.19.) There is though, an expectation that financial markets have gone too far in their fears about the degree of the downturn in US and world growth. If, as expected, the US only suffers a mild downturn in growth, bond markets in the US are likely to sell off and that would be expected to put upward pressure on bond yields, not only in the US, but also in the UK due to a correlation between US treasuries and UK gilts. At various times this correlation has been strong but at other times weak. However, forecasting the timing of this, and how strong the correlation is likely to be, is very difficult to forecast with any degree of confidence. Changes in UK Bank Rate will also impact on gilt yields. One potential danger that may be lurking in investor minds is that Japan has become mired in a twenty-year bog of failing to get economic growth and inflation up off the floor, despite a combination of massive monetary and fiscal stimulus by both the central bank and government. Investors could be fretting that this condition might become contagious to other western economies. Another danger is that unconventional monetary policy post 2008, (ultra-low interest rates plus quantitative easing), may end up doing more harm than good through prolonged use. Low interest rates have encouraged a debt-fuelled boom that now makes it harder for central banks to raise interest rates. Negative interest rates could damage the profitability of commercial banks and so impair their ability to lend and / or push them into riskier lending. Banks could also end up holding large amounts of their government’s bonds and so create a potential doom loop. (A doom loop would occur where the credit rating of the debt of a nation was downgraded which would cause bond prices to fall, causing losses on debt portfolios held by banks and insurers, so reducing their capital and forcing them to sell bonds – which, in turn, would cause further falls in their prices etc.). In addition, the financial viability of pension funds could be damaged by low yields on holdings of bonds. The overall longer run future trend is for gilt yields, and consequently PWLB rates, to rise, albeit gently. From time to time, gilt yields, and therefore PWLB rates, can be subject to exceptional levels of volatility due to geo-political, sovereign debt crisis, emerging market developments and sharp changes in investor sentiment. Such volatility could occur at any time during the forecast period. In addition, PWLB rates are subject to ad hoc decisions by H.M. Treasury to change the margin over gilt yields charged in PWLB rates: such changes could be up or down. It is not clear that if gilt yields were to rise back up again by over 100bps within the next year or so, whether H M Treasury would remove the extra 100 bps margin implemented on 9.10.19.

17
Economic and interest rate forecasting remains difficult with so many influences weighing on UK gilt yields and PWLB rates. The above forecasts, (and MPC decisions), will be liable to further amendment depending on how economic data and developments in financial markets transpire over the next year. Geopolitical developments, especially in the EU, could also have a major impact. Forecasts for average investment earnings beyond the three-year time horizon will be heavily dependent on economic and political developments. Investment and borrowing rates
Investment returns are likely to remain low during 2020/21 with little increase in the following two years. However, if major progress was made with an agreed Brexit, then there is upside potential for earnings.
Borrowing interest rates were on a major falling trend during the first half of 2019-20 but then jumped up by 100 bps on 9.10.19. The policy of avoiding new borrowing by running down spare cash balances has served local authorities well over the last few years. However, the unexpected increase of 100 bps in PWLB rates requires a major rethink of local authority treasury management strategy and risk management.
While this authority will not be able to avoid borrowing to finance new capital expenditure, there will be a cost of carry, (the difference between higher borrowing costs and lower investment returns), to any new short or medium-term borrowing that causes a temporary increase in cash balances as this position will, most likely, incur a revenue cost.
3.4 Borrowing Strategy
The Council is currently in a negative CFR position. This means that the capital borrowing need (the Capital Financing Requirement), has not been reached due to the level of the Council’s reserves.
Against this background and the risks within the economic forecast, caution will be adopted with the 2019/20 treasury operations. The Head of Strategic Finance and Property will monitor interest rates in financial markets and adopt a pragmatic approach to changing circumstances.
Any decisions which will result in a significant change to the CFR and this Council’s need to borrow, will be reported to Full Council at the next available opportunity.
3.5 Policy on borrowing in advance of need
The Council will not borrow more than or in advance of its needs purely in order to profit from the investment of the extra sums borrowed. Any decision to borrow in advance will be within forward approved Capital Financing Requirement estimates, and will be considered carefully to ensure that value for money can be demonstrated and that the Council can ensure the security of such funds. Risks associated with any borrowing in advance activity will be subject to prior appraisal and subsequent reporting through the mid-year or annual reporting mechanism.

18
3.6 Debt rescheduling
Rescheduling of current borrowing in our debt portfolio is unlikely to occur as the 100 bps increase in PWLB rates only applied to new borrowing rates and not to premature debt repayment rates. The historic loan (bond) taken out by the council in 1995 for £6m, is due to mature in May 2020 and will be fully repaid.
3.7 New financial institutions as a source of borrowing and / or types of borrowing
Following the decision by the PWLB on 9 October 2019 to increase their margin over gilt yields by 100 bps to 180 basis points on loans lent to local authorities, consideration will also need to be given to sourcing funding at cheaper rates from the following:
Local authorities (primarily shorter dated maturities)
Financial institutions (primarily insurance companies and pension funds but also some banks, out of spot or forward dates)
Municipal Bonds Agency (no issuance at present but there is potential) The degree which any of these options proves cheaper than PWLB Certainty Rate is still evolving at the time of writing but our advisors will keep us informed.
3.8 Approved Sources of Long and Short term Borrowing
On Balance Sheet Fixed Variable
PWLB
Municipal bond agency
Local authorities
Banks
Pension funds
Market (long-term)
Market (temporary)
Local temporary
Local Bonds
Local authority bills
Overdraft
Negotiable Bonds
Internal (capital receipts & revenue balances)
Finance leases

19
4 ANNUAL INVESTMENT STRATEGY
4.1 Investment policy – management of risk
The MHCLG and CIPFA have extended the meaning of ‘investments’ to include both financial and non-financial investments. This report deals solely with financial investments, (as managed by the treasury management team). Non-financial investments, essentially the purchase of income yielding assets, are covered in the Capital Strategy, (a separate report). The Council’s investment policy has regard to the following: -
MHCLG’s Guidance on Local Government Investments (“the Guidance”)
CIPFA Treasury Management in Public Services Code of Practice and Cross Sectoral Guidance Notes 2017 (“the Code”)
CIPFA Treasury Management Guidance Notes 2018
The Council’s investment priorities will be security first, portfolio liquidity second and then yield, (return). The above guidance from the MHCLG and CIPFA place a high priority on the management of risk. This authority has adopted a prudent approach to managing risk and defines its risk appetite by the following means: -
1. Minimum acceptable credit criteria are applied in order to generate a list of highly creditworthy counterparties. This also enables diversification and thus avoidance of concentration risk. The key ratings used to monitor counterparties are the short term and long-term ratings.
2. Other information: ratings will not be the sole determinant of the quality of
an institution; it is important to continually assess and monitor the financial sector on both a micro and macro basis and in relation to the economic and political environments in which institutions operate. The assessment will also take account of information that reflects the opinion of the markets. To achieve this consideration the Council will engage with its advisors to maintain a monitor on market pricing such as “credit default swaps” and overlay that information on top of the credit ratings.
3. Other information sources used will include the financial press, share price
and other such information pertaining to the financial sector in order to establish the most robust scrutiny process on the suitability of potential investment counterparties.
4. This authority has defined the list of types of investment instruments that the treasury management team are authorised to use. There are two lists in appendix 5.5 under the categories of ‘specified’ and ‘non-specified’ investments.
Specified investments are those with a high level of credit quality and subject to a maturity limit of one year.
Non-specified investments are those with less high credit quality, may be for periods in excess of one year, and/or are more complex instruments which require greater consideration by members and officers before being authorised for use. Once an investment is classed as non-

20
specified, it remains non-specified all the way through to maturity i.e. an 18 month deposit would still be non-specified even if it has only 11 months left until maturity.
5. Non-specified investments limit. The Council has determined that it will
limit the maximum total exposure to non-specified investments as being 50% of the total investment portfolio, (see paragraph 4.3).
6. Lending limits, (amounts and maturity), for each counterparty will be set
through applying the matrix table in paragraph 4.2. 7. Transaction limits are set for each type of investment in 4.2. 8. This authority will set a limit for the amount of its investments which are
invested for longer than 365 days, (see paragraph 4.4). 9. Investments will only be placed with counterparties from countries with a
specified minimum sovereign rating, (see paragraph 4.3). 10. This authority has engaged external consultants, (see paragraph 1.5), to
provide expert advice on how to optimise an appropriate balance of security, liquidity and yield, given the risk appetite of this authority in the context of the expected level of cash balances and need for liquidity throughout the year.
11. All investments will be denominated in sterling. 12. As a result of the change in accounting standards for 2019/20 under IFRS 9,
this authority will consider the implications of investment instruments which could result in an adverse movement in the value of the amount invested and resultant charges at the end of the year to the General Fund. (In November 2018, the Ministry of Housing, Communities and Local Government, [MHCLG], concluded a consultation for a temporary override to allow English local authorities time to adjust their portfolio of all pooled investments by announcing a statutory override to delay implementation of IFRS 9 for five years commencing from 1.4.18.)
However, this authority will also pursue value for money in treasury management and will monitor the yield from investment income against appropriate benchmarks for investment performance, (see paragraph 4.5). Regular monitoring of investment performance will be carried out during the year. Changes in risk management policy from last year. The above criteria are unchanged from last year.
4.2 Creditworthiness policy
This Council applies the creditworthiness service provided by Link Asset Services. This service employs a sophisticated modelling approach utilising credit ratings from the three main credit rating agencies - Fitch, Moody’s and Standard & Poor’s. The credit ratings of counterparties are supplemented with the following overlays:
“watches” and “outlooks” from credit rating agencies;
CDS spreads that may give early warning of likely changes in credit ratings;

21
sovereign ratings to select counterparties from only the most creditworthy countries.
This modelling approach combines credit ratings, and any assigned Watches and Outlooks in a weighted scoring system, which is then combined with an overlay of CDS spreads. The end product of this is a series of colour coded bands which indicate the relative creditworthiness of counterparties. These colour codes are used by the Council to determine the suggested duration for investments. The Council will, therefore, use counterparties within the following durational bands:
Yellow 5 years *
Dark pink 5 years for Ultra-Short Dated Bond Funds with a credit score of 1.25
Light pink 5 years for Ultra-Short Dated Bond Funds with a credit score of 1.5
Purple 2 years
Blue 1 year (only applies to nationalised or semi nationalised UK Banks)
Orange 1 year
Red 6 months
Green 100 days
No colour not to be used The Link Asset Services’ creditworthiness service uses a wider array of information other than just primary ratings. Furthermore, by using a risk weighted scoring system, it does not give undue preponderance to just one agency’s ratings. Typically, the minimum credit ratings criteria the Council use will be a short term rating (Fitch or equivalents) of F1 and a long-term rating of A-. There may be occasions when the counterparty ratings from one rating agency are marginally lower than these ratings but may still be used. In these instances, consideration will be given to the whole range of ratings available, or other topical market information, to support their use. All credit ratings will be monitored on a daily basis. The Council is alerted to changes to ratings of all three agencies through its use of the Link Asset Services’ creditworthiness service.
if a downgrade results in the counterparty / investment scheme no longer meeting the Council’s minimum criteria, its further use as a new investment will be withdrawn immediately.
in addition to the use of credit ratings the Council will be advised of information in movements in Credit Default Swap spreads against the iTraxx European Financials benchmark and other market data on a daily basis via its Passport website, provided exclusively to it by Link Asset Services. Extreme market movements may result in downgrade of an institution or removal from the Council’s lending list.
Sole reliance will not be placed on the use of this external service. In addition this Council will also use market data and market information, as well as information on any external support for banks to help support its decision making process.

22
Y Pi1 Pi2 P B O R G N/C
1 1.25 1.5 2 3 4 5 6 7
Up to 5yrs Up to 5yrs Up to 5yrs Up to 2yrs Up to 1yr Up to 1yr Up to 6mths Up to 100days No Colour
Colour (and long term rating
where applicable)
Money limit per banking group
Transaction limit
Time
Limit
Banks * yellow £10m £10m 5yrs
Banks purple £10m £10m 2 yrs
Banks orange £10m £10m 1 yr
Banks – part nationalised blue £20m £20m 1 yr
Banks red £10m £10m 6 mths
Banks green £10m £10m 100 days
Banks No colour Not to be
used
Not to be
used
Limit 3 category – Council’s banker (where “No Colour”)
XXX £20m 1 day 1 day
Property Funds - £20m £10m Not a fixed term
investment so no time
limit
DMADF UK sovereign rating
unlimited unlimited 6 months
Local authorities n/a £10m (per local
authority)
£10m unlimited
Fund rating** Money and/or %
Limit
Time
Limit
Money Market Funds CNAV AAA £10m (per
fund)
£10m liquid
Money Market Funds LVNAV
AAA £10m (per
fund)
£10m liquid
Money Market Funds VNAV AAA £10m (per
fund)
£10m liquid
Ultra-Short Dated Bond Funds with a credit score of 1.25
Dark pink / AAA £10m (per
fund)
£10m liquid
Ultra-Short Dated Bond Funds with a credit score of 1.50
Light pink / AAA £10m (per
fund)
£10m liquid

23
* Please note: the yellow colour category is for UK Government debt, or its equivalent, money market funds and collateralised deposits where the collateral is UK Government debt –see appendix 5.4.
** Please note: “fund” ratings are different to individual counterparty ratings, coming under either specific “MMF” or “Bond Fund” rating criteria. UK banks – ring fencing
The largest UK banks, (those with more than £25bn of retail / Small and Medium-sized Enterprise (SME) deposits), are required, by UK law, to separate core retail banking services from their investment and international banking activities by 1st January 2019. This is known as “ring-fencing”. Whilst smaller banks with less than £25bn in deposits are exempt, they can choose to opt up. Several banks are very close to the threshold already and so may come into scope in the future regardless. Ring-fencing is a regulatory initiative created in response to the global financial crisis. It mandates the separation of retail and SME deposits from investment banking, in order to improve the resilience and resolvability of banks by changing their structure. In general, simpler activities offered from within a ring-fenced bank, (RFB), will be focused on lower risk, day-to-day core transactions, whilst more complex and “riskier” activities are required to be housed in a separate entity, a non-ring-fenced bank, (NRFB). This is intended to ensure that an entity’s core activities are not adversely affected by the acts or omissions of other members of its group. While the structure of the banks included within this process may have changed, the fundamentals of credit assessment have not. The Council will continue to assess the new-formed entities in the same way that it does others and those with sufficiently high ratings, (and any other metrics considered), will be considered for investment purposes.
4.3 Country limits
Due care will be taken to consider the exposure of the Council’s total investment portfolio to non-specified investments, countries, groups and sectors.
a) Non-specified investment limit. The Council has determined that it will limit the maximum total exposure to non-specified investments as being 75% of the total investment portfolio.
b) Country limit. The Council has determined that it will only use approved counterparties from the UK and from countries with a minimum sovereign credit rating of AA- from Fitch. The list of countries that qualify using this credit criteria as at the date of this report are shown in Appendix 5.6. This list will be added to, or deducted from, by officers should ratings change in accordance with this policy.
c) Other limits. In addition:
limits in place above will apply to a group of companies;
sector limits will be monitored regularly for appropriateness.

24
4.4 Investment strategy
In-house funds. Investments will be made with reference to the core balance and cash flow requirements and the outlook for short-term interest rates (i.e. rates for investments up to 12 months). Greater returns are usually obtainable by investing for longer periods. While most cash balances are required in order to manage the ups and downs of cash flow, where cash sums can be identified that could be invested for longer periods, the value to be obtained from longer term investments will be carefully assessed.
If it is thought that the Bank Rate is likely to rise significantly within the time horizon being considered, then consideration will be given to keeping most investments as being short term or variable.
Conversely, if it is thought that Bank Rate is likely to fall within that time period, consideration will be given to locking in higher rates currently obtainable, for longer periods.
Investment returns expectations.
On the assumption that the UK and EU agree a Brexit deal including the terms of trade by the end of 2020 or soon after, then Bank Rate is forecast to increase only slowly over the next few years to reach 1.00% by quarter 1 2023. Bank Rate forecasts for financial year ends (March) are:
Q1 2021 0.75%
Q1 2022 1.00%
Q1 2023 1.00%
The suggested budgeted investment earnings rates for returns on investments placed for periods up to about three months during each financial year are as follows:
2019/20 0.75%
2020/21 0.75%
2021/22 1.00%
2022/23 1.25%
2023/24 1.50%
2024/25 1.75%
Later years 2.25%
The overall balance of risks to economic growth in the UK is probably to the downside due to the weight of all the uncertainties over Brexit, as well as a softening global economic picture.
The balance of risks to increases in Bank Rate and shorter term PWLB rates are broadly similarly to the downside.
In the event that a Brexit deal is agreed with the EU and approved by Parliament, the balance of risks to economic growth and to increases in Bank Rate is likely to change to the upside.
Investment treasury indicator and limit - total principal funds invested for greater than 365 days. These limits are set with regard to the Council’s liquidity requirements and to reduce the need for early sale of an investment, and are based on the availability of funds after each year-end.

25
The Council is asked to approve the following treasury indicator and limit:
Upper limit for principal sums invested for longer than 365 days
Current investments as at 30.11.19 in excess of 1 year maturing in each
year
2020/21 2021/22 2022/23
£m £m £m £m
20.0 40.0 40.0 40.0
For its cash flow generated balances, the Council will seek to utilise its business reserve instant access and notice accounts, money market funds and short-dated deposits, (overnight to 100 days), in order to benefit from the compounding of interest.
4.5 Investment performance / risk benchmarking
This Council will use an investment benchmark to assess the investment performance of its investment portfolio of 7 day, 1, 3, 6 or 12 month LIBID compounded / uncompounded
4.6 End of year investment report
At the end of the financial year, the Council will report on its investment activity as part of its Annual Treasury Report.

26
5 APPENDICES
1. Risk Matrix and acceptable levels of return for investment in commercial properties.
2. Prudential and treasury indicators and MRP statement
3. Interest rate forecasts
4. Economic background
5. Treasury management practice 1 – credit and counterparty risk management
6. Approved countries for investments
7. Treasury management scheme of delegation
8. The treasury management role of the section 151 officer

27
5.1 RISK MATRIX AND ACCEPTABLE LEVELS OF RETURN FOR INVESTMENT IN COMMERCIAL PROPERTIES
Example of Risk Scoring Investment table based on feedback from the Financial Sustainability Group.
This table can be updated and re-aligned as the Councils appetite for risk changes
The Risk Matrix supports member and officer decision making by flagging up the potential risk levels of any type of investment.
In turn the level of risk can be compared to a defined investment level required as referred to in the table below:
5.2 THE CAPITAL PRUDENTIAL AND TREASURY INDICATORS 2020/21 – 2022/23 AND MRP STATEMENT
The Council’s capital expenditure plans are the key driver of treasury management activity. The output of the capital expenditure plans is reflected in the prudential indicators, which are designed to assist members’ overview and confirm capital expenditure plans.
Financial Sustainability Investment Decision table
Category Information Score
What is the Location of the site considered to be ? Micro prime 12
What is the Tenant Covenant within the site? Single tenant with good financial covenant 16
What are the current Lease Terms? unencumbered lease 15
What is the Occupational Lease Length? Greater than 20 years 15
How is the Building Quality rated? Modern or recently refurbished with nominal
capex required 10
What is the Tenure offered ? Freehold 10
What are the Tenant Repair obligations? FRI 10
What is the Lot Size valauation? Between £4m and £6m 5
Total 93
If all information present:
MAX Score = 100
MIN Score = 20
Risk/purpose Minimum acceptable
return
Scoring levels based
on risk table above
Higher risk/reward 6% 30 -50
Standard risk/reward 5% 50-70
Low risk/reward 3% 70-90
Wider community benefits 2% Not included above

28
5.2.1 Capital expenditure
Capital expenditure
£m
2018/19
Actual
2019/20
Estimate
2020/21
Estimate
2021/22
Estimate
2022/23
Estimate
Head of Strategic Finance and Property
0.1 1.2 7.0 9.8 10.3
Head of Shared Business & Technology Services
0.5 0.9 0.8 0.5 0.5
Head of Operations 1.8 6.0 25.8 18.3 8.9
Head of Housing & Health
0.3 0.3 0.2 0.2 0.2
Head of Planning & Building Control
0.9 0.2 0.0 0.0 0.0
Head of Communications, Strategy & Policy
0.1 0.2 0.0 0.0 0.0
Total services 3.7 8.8 33.8 28.8 19.9
Commercial activities/ non-financial investments
2.5 6.3 24.5 2.9 1.1
Total 6.2 15.1 58.3 31.7 21.0
5.2.2 Affordability prudential indicators
The previous sections cover the overall capital and control of borrowing prudential indicators, but within this framework prudential indicators are required to assess the affordability of the capital investment plans. These provide an indication of the impact of the capital investment plans on the Council’s overall finances. The Council is asked to approve the following indicators:
a. Ratio of financing costs to net revenue stream
This indicator identifies the trend in the cost of capital, (borrowing and other long term obligation costs net of investment income), against the net revenue stream.
% 2018/19
Actual
2019/20
Estimate
2020/21
Estimate
2021/22
Estimate
2022/23
Estimate
Services 4.49% 1.29% 1.42% 2.89% 4.24%
The estimates of financing costs include current commitments and the proposals in this budget report.

29
5.2.3 Maturity structure of borrowing
Maturity structure of borrowing. These gross limits are set to reduce the Council’s exposure to large fixed rate sums falling due for refinancing, and are required for upper and lower limits.
The Council is asked to approve the following treasury indicators and limits:
Maturity structure of fixed interest rate borrowing 2020/21
Under 12 months 80% £6.0m
12 months to 2 years 0% £0.0m
2 years to 5 years 0% £0.0m
5 years to 10 years 0% £0.0m
10 years to 20 years 0% £0.0m
20 years to 30 years 0% £0.0m
30 years to 40 years 20% £1.5m
40 years to 50 years 0% £0.0m
Maturity structure of variable interest rate borrowing 2020/21
Under 12 months 0% £0.0m
12 months to 2 years 0% £0.0m
2 years to 5 years 0% £0.0m
5 years to 10 years 0% £0.0m
10 years to 20 years 0% £0.0m
20 years to 30 years 0% £0.0m
30 years to 40 years 0% £0.0m
40 years to 50 years 0% £0.0m
5.2.4. Control of interest rate exposure
Please see paragraphs 3.3, 3.4 and 4.4.

30
5.3 INTEREST RATE FORECASTS 2019 – 2021
PWLB forecasts are based on PWLB certainty rates.
Bank Rate
Now Dec-19 Mar-20 Jun-20 Sep-20 Dec-20 Mar-21 Jun-21 Sep-21 Dec-21 Mar-22 Jun-22 Sep-22 Dec-22 Mar-23
Link Asset Services 0.75% 0.75% 0.75% 0.75% 0.75% 0.75% 1.00% 1.00% 1.00% 1.00% 1.00% 1.25% 1.25% 1.25% 1.25%
Capital Economics 0.75% 0.75% 0.75% 0.50% 0.50% 0.50% - - - - - - - -
5yr PWLB Rate
Now Dec-19 Mar-20 Jun-20 Sep-20 Dec-20 Mar-21 Jun-21 Sep-21 Dec-21 Mar-22 Jun-22 Sep-22 Dec-22 Mar-23
Link Asset Services 2.36% 2.30% 2.40% 2.40% 2.50% 2.50% 2.60% 2.70% 2.80% 2.90% 2.90% 3.00% 3.10% 3.20% 3.20%
Capital Economics 2.36% 2.40% 2.40% 2.40% 2.40% 2.40% - - - - - - - -
10yr PWLB Rate
Now Dec-19 Mar-20 Jun-20 Sep-20 Dec-20 Mar-21 Jun-21 Sep-21 Dec-21 Mar-22 Jun-22 Sep-22 Dec-22 Mar-23
Link Asset Services 2.61% 2.60% 2.70% 2.70% 2.70% 2.80% 2.90% 3.00% 3.10% 3.20% 3.20% 3.30% 3.30% 3.40% 3.50%
Capital Economics 2.61% 2.60% 2.60% 2.60% 2.60% 2.60% - - - - - - - -
25yr PWLB Rate
Now Dec-19 Mar-20 Jun-20 Sep-20 Dec-20 Mar-21 Jun-21 Sep-21 Dec-21 Mar-22 Jun-22 Sep-22 Dec-22 Mar-23
Link Asset Services 3.18% 3.20% 3.30% 3.40% 3.40% 3.50% 3.60% 3.70% 3.70% 3.80% 3.90% 4.00% 4.00% 4.10% 4.10%
Capital Economics 3.18% 2.90% 2.90% 2.90% 2.90% 2.90% - - - - - - - - -
50yr PWLB Rate
Now Dec-19 Mar-20 Jun-20 Sep-20 Dec-20 Mar-21 Jun-21 Sep-21 Dec-21 Mar-22 Jun-22 Sep-22 Dec-22 Mar-23
Link Asset Services 3.04% 3.10% 3.20% 3.30% 3.30% 3.40% 3.50% 3.60% 3.60% 3.70% 3.80% 3.90% 3.90% 4.00% 4.00%
Capital Economics 3.04% 3.00% 3.00% 3.00% 3.00% 3.00% - - - - - - - -

5.4 ECONOMIC BACKGROUND
UK. Brexit. 2019 has been a year of upheaval on the political front as Theresa May resigned as Prime Minister to be replaced by Boris Johnson on a platform of the UK leaving the EU on 31 October 2019, with or without a deal. However, MPs blocked leaving on that date and the EU agreed an extension to 31 January 2020. In late October, MPs approved an outline of a Brexit deal to enable the UK to leave the EU on 31 January. Now that the Conservative Government has gained a large overall majority in the General Election on 12th December, this outline deal will be passed by Parliament by that date. However, there will still be much uncertainty as the detail of a trade deal will need to be negotiated by the current end of the transition period in December 2020, which the Prime Minister has pledged he will not extend. This could prove to be an unrealistically short timetable for such major negotiations that leaves open two possibilities; one, the need for an extension of negotiations, probably two years, or, a no deal Brexit in December 2020. While the Bank of England went through the routine of producing another quarterly Inflation Report, (now renamed the Monetary Policy Report), on 7 November, it is very questionable how much all the writing and numbers were worth when faced with the uncertainties of where the UK will be after the general election. The Bank made a change in their Brexit assumptions to now include a deal being eventually passed. Possibly the biggest message that was worth taking note of from the Monetary Policy Report, was an increase in concerns among MPC members around weak global economic growth and the potential for Brexit uncertainties to become entrenched and so delay UK economic recovery. Consequently, the MPC voted 7-2 to maintain Bank Rate at 0.75% but two members were sufficiently concerned to vote for an immediate Bank Rate cut to 0.5%. The MPC warned that if global growth does not pick up or Brexit uncertainties intensify, then a rate cut was now more likely. Conversely, if risks do recede, then a more rapid recovery of growth will require gradual and limited rate rises. The speed of recovery will depend on the extent to which uncertainty dissipates over the final terms for trade between the UK and EU and by how much global growth rates pick up. The Bank revised its inflation forecasts down – to 1.25% in 2019, 1.5% in 2020, and 2.0% in 2021; hence, the MPC views inflation as causing little concern in the near future. If economic growth were to weaken considerably, the MPC has relatively little room to make a big impact with Bank Rate still only at 0.75%. It would therefore, probably suggest that it would be up to the Chancellor to provide help to support growth by way of a fiscal boost by e.g. tax cuts, increases in the annual expenditure budgets of government departments and services and expenditure on infrastructure projects, to boost the economy. The Government has already made moves in this direction and it made significant promises in its election manifesto to increase government spending by up to £20bn p.a., (this would add about 1% to GDP growth rates), by investing primarily in infrastructure. This is likely to be announced in the next Budget, probably in February 2020. The Chancellor has also amended the fiscal rules in November to allow for an increase in government expenditure. As for inflation itself, CPI has been hovering around the Bank of England’s target of 2% during 2019, but fell again in October to 1.5%. It is likely to remain close to or under 2% over the next two years and so, it does not pose any immediate concern to the MPC at the current time. However, if there was a no deal Brexit, inflation could rise towards 4%, primarily because of imported inflation on the back of a weakening pound.

32
With regard to the labour market, growth in numbers employed has been quite resilient through 2019 until the three months to September where it fell by 58,000. However, this was about half of what had been expected. The unemployment rate fell back again to a 44 year low of 3.8% on the Independent Labour Organisation measure in September, despite the fall in numbers employed, due to numbers leaving the work force. Wage inflation has been edging down from a high point of 3.9% in July to 3.8% in August and now 3.6% in September, (3 month average regular pay, excluding bonuses). This meant that in real terms, (i.e. wage rates higher than CPI inflation), earnings grew by about 1.9%. As the UK economy is very much services sector driven, an increase in household spending power is likely to feed through into providing some support to the overall rate of economic growth in the coming months. The other message from the fall in wage growth is that employers are beginning to find it easier to hire suitable staff, indicating that supply pressure in the labour market is easing. USA. President Trump’s massive easing of fiscal policy in 2018 fuelled a temporary boost in consumption in that year which generated an upturn in the rate of growth to a robust 2.9% y/y. Growth in 2019 has been falling after a strong start in quarter 1 at 3.1%, (annualised rate), to 2.0% in quarter 2 and then 1.9% in quarter 3; it is expected to fall further. The strong growth in employment numbers during 2018 has weakened during 2019, indicating that the economy is cooling, while inflationary pressures are also weakening; CPI inflation fell from 2.3% to 2.0% in September. The Fed finished its series of increases in rates to 2.25 – 2.50% in December 2018. In July 2019, it cut rates by 0.25% as a ‘midterm adjustment’ but flagged up that this was not intended to be seen as the start of a series of cuts to ward off a downturn in growth. It also ended its programme of quantitative tightening in August, (reducing its holdings of treasuries etc.). It then cut rates by 0.25% again in September and by another 0.25% in its October meeting to 1.50 – 1.75%. At its September meeting it also said it was going to start buying Treasuries again, although this was not to be seen as a resumption of quantitative easing but rather an exercise to relieve liquidity pressures in the repo market. Despite those protestations, this still means that the Fed is again expanding its balance sheet holdings of government debt. In the first month, it will buy $60bn, whereas it had been reducing its balance sheet by $50bn per month during 2019. As it will be buying only short-term (under 12 months) Treasury bills, it is technically correct that this is not quantitative easing (which is purchase of long term debt). Investor confidence has been badly rattled by the progressive ramping up of increases in tariffs President Trump has made on Chinese imports and China has responded with increases in tariffs on American imports. This trade war is seen as depressing US, Chinese and world growth. In the EU, it is also particularly impacting Germany as exports of goods and services are equivalent to 46% of total GDP. It will also impact developing countries dependent on exporting commodities to China. However, in November / December, progress has been made on agreeing a phase one deal between the US and China to roll back some of the tariffs which gives some hope of resolving this dispute. EUROZONE. Growth has been slowing from +1.8 % during 2018 to around half of that in 2019. Growth was +0.4% q/q (+1.2% y/y) in quarter 1, +0.2% q/q (+1.2% y/y) in quarter 2 and then +0.2% q/q, +1.1% in quarter 3; there appears to be little upside potential in the near future. German GDP growth has been struggling to stay in positive territory in 2019 and fell by -0.1% in quarter 2; industrial production was down 4% y/y in June with car production down 10% y/y. Germany would be

33
particularly vulnerable to a no deal Brexit depressing exports further and if President Trump imposes tariffs on EU produced cars. The European Central Bank (ECB) ended its programme of quantitative easing purchases of debt in December 2018, which then meant that the central banks in the US, UK and EU had all ended the phase of post financial crisis expansion of liquidity supporting world financial markets by quantitative easing purchases of debt. However, the downturn in EZ growth in the second half of 2018 and into 2019, together with inflation falling well under the upper limit of its target range of 0 to 2%, (but it aims to keep it near to 2%), has prompted the ECB to take new measures to stimulate growth. At its March meeting it said that it expected to leave interest rates at their present levels “at least through the end of 2019”, but that was of little help to boosting growth in the near term. Consequently, it announced a third round of TLTROs; this provides banks with cheap borrowing every three months from September 2019 until March 2021 that means that, although they will have only a two-year maturity, the Bank was making funds available until 2023, two years later than under its previous policy. As with the last round, the new TLTROs will include an incentive to encourage bank lending, and they will be capped at 30% of a bank’s eligible loans. However, since then, the downturn in EZ and world growth has gathered momentum. At its meeting on 12 September, it cut its deposit rate further into negative territory, from -0.4% to -0.5%, and announced a resumption of quantitative easing purchases of debt for an unlimited period; (at its October meeting it said this would start in November at €20bn per month - a relatively small amount compared to the previous buying programme). It also increased the maturity of the third round of TLTROs from two to three years. However, it is doubtful whether this loosening of monetary policy will have much impact on growth and, unsurprisingly, the ECB stated that governments will need to help stimulate growth by ‘growth friendly’ fiscal policy. On the political front, Austria, Spain and Italy have been in the throes of forming coalition governments with some unlikely combinations of parties i.e. this raises questions around their likely endurance. The latest results of German state elections has put further pressure on the frail German CDU/SDP coalition government and on the current leadership of the CDU. The results of the Spanish general election in November have not helped the prospects of forming a stable coalition. CHINA. Economic growth has been weakening over successive years, despite repeated rounds of central bank stimulus; medium term risks are increasing. Major progress still needs to be made to eliminate excess industrial capacity and the stock of unsold property, and to address the level of non-performing loans in the banking and shadow banking systems. In addition, there still needs to be a greater switch from investment in industrial capacity, property construction and infrastructure to consumer goods production. JAPAN - has been struggling to stimulate consistent significant GDP growth and to get inflation up to its target of 2%, despite huge monetary and fiscal stimulus. It is also making little progress on fundamental reform of the economy. WORLD GROWTH. Until recent years, world growth has been boosted by increasing globalisation i.e. countries specialising in producing goods and commodities in which they have an economic advantage and which they then trade with the rest of the world. This has boosted worldwide productivity and growth, and, by lowering costs, has also depressed inflation. However, the rise of China as an economic superpower over the last thirty years, which now accounts for nearly 20% of total world GDP, has unbalanced the world economy. The Chinese government

34
has targeted achieving major world positions in specific key sectors and products, especially high tech areas and production of rare earth minerals used in high tech products. It is achieving this by massive financial support (i.e. subsidies) to state owned firms, government directions to other firms, technology theft, restrictions on market access by foreign firms and informal targets for the domestic market share of Chinese producers in the selected sectors. This is regarded as being unfair competition that is putting western firms at an unfair disadvantage or even putting some out of business. It is also regarded with suspicion on the political front as China is an authoritarian country that is not averse to using economic and military power for political advantage. The current trade war between the US and China therefore needs to be seen against that backdrop. It is, therefore, likely that we are heading into a period where there will be a reversal of world globalisation and a decoupling of western countries from dependence on China to supply products. This is likely to produce a backdrop in the coming years of weak global growth and so weak inflation. Central banks are, therefore, likely to come under more pressure to support growth by looser monetary policy measures and this will militate against central banks increasing interest rates. The trade war between the US and China is a major concern to financial markets due to the synchronised general weakening of growth in the major economies of the world, compounded by fears that there could even be a recession looming up in the US, though this is probably overblown. These concerns resulted in government bond yields in the developed world falling significantly during 2019. If there were a major worldwide downturn in growth, central banks in most of the major economies will have limited ammunition available, in terms of monetary policy measures, when rates are already very low in most countries, (apart from the US). There are also concerns about how much distortion of financial markets has already occurred with the current levels of quantitative easing purchases of debt by central banks and the use of negative central bank rates in some countries. The latest PMI survey statistics of economic health for the US, UK, EU and China have all been predicting a downturn in growth; this confirms investor sentiment that the outlook for growth during the year ahead is weak. INTEREST RATE FORECASTS The interest rate forecasts provided by Link Asset Services in paragraph 3.3 are predicated on an assumption of an agreement being reached on Brexit between the UK and the EU. On this basis, while GDP growth is likely to be subdued in 2019 and 2020 due to all the uncertainties around Brexit depressing consumer and business confidence, an agreement on the detailed terms of a trade deal is likely to lead to a boost to the rate of growth in subsequent years. This could, in turn, increase inflationary pressures in the economy and so cause the Bank of England to resume a series of gentle increases in Bank Rate. Just how fast, and how far, those increases will occur and rise to, will be data dependent. The forecasts in this report assume a modest recovery in the rate and timing of stronger growth and in the corresponding response by the Bank in raising rates.
In the event of an orderly non-agreement exit in December 2020, it is likely that the Bank of England would take action to cut Bank Rate from 0.75% in order to help economic growth deal with the adverse effects of this situation. This is also likely to cause short to medium term gilt yields to fall.
If there was a disorderly Brexit, then any cut in Bank Rate would be likely to last for a longer period and also depress short and medium gilt yields correspondingly. Quantitative easing could also be restarted by the Bank of England. It is also possible that the government could act to protect economic growth by implementing fiscal stimulus.
35
The balance of risks to the UK
The overall balance of risks to economic growth in the UK is probably even, but dependent on a successful outcome of negotiations on a trade deal.
The balance of risks to increases in Bank Rate and shorter term PWLB rates are broadly similarly to the downside.
In the event that a Brexit deal was agreed with the EU and approved by Parliament, the balance of risks to economic growth and to increases in Bank Rate is likely to change to the upside.
One risk that is both an upside and downside risk, is that all central banks are now working in very different economic conditions than before the 2008 financial crash as there has been a major increase in consumer and other debt due to the exceptionally low levels of borrowing rates that have prevailed since 2008. This means that the neutral rate of interest in an economy, (i.e. the rate that is neither expansionary nor deflationary), is difficult to determine definitively in this new environment, although central banks have made statements that they expect it to be much lower than before 2008. Central banks could therefore either over or under do increases in central interest rates. Downside risks to current forecasts for UK gilt yields and PWLB rates currently include:
Brexit – if it were to cause significant economic disruption and a major downturn in the rate of growth.
Bank of England takes action too quickly, or too far, over the next three years to raise Bank Rate and causes UK economic growth, and increases in inflation, to be weaker than we currently anticipate.
A resurgence of the Eurozone sovereign debt crisis. In 2018, Italy was a major concern due to having a populist coalition government which made a lot of anti-austerity and anti-EU noise. However, in September 2019 there was a major change in the coalition governing Italy which has brought to power a much more EU friendly government; this has eased the pressure on Italian bonds. Only time will tell whether this new coalition based on an unlikely alliance of two very different parties will endure.
Weak capitalisation of some European banks, particularly Italian banks.
German minority government. In the German general election of September 2017, Angela Merkel’s CDU party was left in a vulnerable minority position dependent on the fractious support of the SPD party, as a result of the rise in popularity of the anti-immigration AfD party. The CDU has done badly in recent state elections but the SPD has done particularly badly and this has raised a major question mark over continuing to support the CDU. Angela Merkel has stepped down from being the CDU party leader but she intends to remain as Chancellor until 2021.
Other minority EU governments. Austria, Finland, Sweden, Spain, Portugal, Netherlands and Belgium also have vulnerable minority governments dependent on coalitions which could prove fragile.
Austria, the Czech Republic, Poland and Hungary now form a strongly anti-immigration bloc within the EU. There has also been rising anti-immigration sentiment in Germany and France.
In October 2019, the IMF issued a report on the World Economic Outlook which flagged up a synchronised slowdown in world growth. However, it also flagged

36
up that there was potential for a rerun of the 2008 financial crisis, but his time centred on the huge debt binge accumulated by corporations during the decade of low interest rates. This now means that there are corporates who would be unable to cover basic interest costs on some $19trn of corporate debt in major western economies, if world growth was to dip further than just a minor cooling. This debt is mainly held by the shadow banking sector i.e. pension funds, insurers, hedge funds, asset managers etc., who, when there is $15trn of corporate and government debt now yielding negative interest rates, have been searching for higher returns in riskier assets. Much of this debt is only marginally above investment grade so any rating downgrade could force some holders into a fire sale, which would then depress prices further and so set off a spiral down. The IMF’s answer is to suggest imposing higher capital charges on lending to corporates and for central banks to regulate the investment operations of the shadow banking sector. In October 2019, the deputy Governor of the Bank of England also flagged up the dangers of banks and the shadow banking sector lending to corporates, especially highly leveraged corporates, which had risen back up to near pre-2008 levels.
Geopolitical risks, for example in North Korea, but also in Europe and the Middle East, which could lead to increasing safe haven flows.
Upside risks to current forecasts for UK gilt yields and PWLB rates
Brexit – if agreement was reached all round that removed all threats of economic and political disruption between the EU and the UK.
The Bank of England is too slow in its pace and strength of increases in Bank Rate and, therefore, allows inflationary pressures to build up too strongly within the UK economy, which then necessitates a later rapid series of increases in Bank Rate faster than we currently expect.
UK inflation, whether domestically generated or imported, returning to sustained significantly higher levels causing an increase in the inflation premium inherent to gilt yields.

37
5.5 TREASURY MANAGEMENT PRACTICE (TMP1) – CREDIT AND COUNTERPARTY RISK MANAGEMENT
SPECIFIED INVESTMENTS: All such investments will be sterling denominated, with maturities up to maximum of 1 year, meeting the minimum ‘high’ quality criteria where applicable. (If a deposit is made for say 2 years, it starts as being a non-specified investment and remains as a non-specified investment even when its time to maturity falls under 12 months.) NON-SPECIFIED INVESTMENTS: These are any investments that do not meet the specified investment criteria. A maximum of 75% will be held in aggregate in non-specified investment. A variety of investment instruments will be used, subject to the credit quality of the institution, and depending on the type of investment made, it will fall into one of the above categories. The criteria, time limits and monetary limits applying to institutions or investment vehicles are:
Minimum credit criteria / colour
band
** Max % of total
investments / £ limit per institution
Max. maturity period
DMADF – UK Government N/A 100% 6 months (max. is set by the
DMO*)
UK Government gilts UK sovereign
rating 100% 12 months
UK Government Treasury bills
UK sovereign rating
100% 364 days (max. is set by the
DMO*)
Bonds issued by multilateral development banks
AAA 40% 12 months
Money Market Funds CNAV AAA 95% Liquid
Money Market Funds LNVAV
AAA 95% Liquid
Money Market Funds VNAV AAA 95% Liquid
Ultra-Short Dated Bond Funds
with a credit score of 1.25
AAA 95% Liquid
Ultra-Short Dated Bond Funds with a credit score of 1.5
AAA 95% Liquid

38
Minimum credit criteria / colour
band
** Max % of total
investments / £ limit per institution
Max. maturity period
Local authorities N/A 100% Unlimited
Term deposits with banks and building societies
Green 100% 24 months
CDs or corporate bonds with banks and building societies
Green 100% 24 months
Gilt funds UK sovereign
rating 100% 12 months
* DMO – is the Debt Management Office of H.M.Treasury. SPECIFIED INVESTMENTS:
(All such investments will be sterling denominated, with maturities up to maximum of 1 year, meeting the minimum ‘high’ rating criteria where applicable)
Minimum ‘High’ Credit
Criteria Use
Debt Management Agency Deposit Facility -- In-house
Term deposits – local authorities -- In-house
Term deposits – housing associations -- In-house
Term deposits – banks and building societies
Green In-house

Term deposits with Nationalised Banks and Banks and Building Societies
Minimum Credit
Criteria Use
Max % of total investm
ents
Max. maturity period
UK part nationalised banks Blue In-house 80 12 months
UK part nationalised banks Blue Fund
Managers 80 12 months
Banks part nationalised by high credit rated (sovereign rating) countries – non UK
Blue In-house and
Fund Managers
40 12 months
UK Government Gilts UK sovereign
rating In-house buy and hold and Fund Managers
Bonds issued by multilateral development banks
AAA In-house buy and hold and Fund Managers
Bonds issued by a financial institution which is explicitly guaranteed by the UK Government e.g. National Rail
UK sovereign
rating In-house buy and hold and Fund Managers
Sovereign bond issues (other than the UK govt)
AAA In-house buy and hold and Fund Managers
Treasury Bills UK sovereign
rating In house and Fund Managers
Collective Investment Schemes structured as Open Ended Investment Companies (OEICs): -
1a. Money Market Funds (CNAV) AAA MMF rating In-house and Fund Managers
1b. Money Market Funds (LVNAV) AAA MMF rating In-house and Fund Managers
1c. Money Market Funds (VNAV) AAA MMF rating In-house and Fund Managers
2a. Ultra-Short Dated Bond Funds with a credit
score of 1.25 AAA Bond fund rating
In-house and Fund Managers
2b. Ultra-Short Dated Bond Funds with a credit
score of 1.5 AAA Bond fund rating
In-house and Fund Managers
3. Bond Funds AAA Bond fund rating In-house and Fund Managers
4. Gilt Funds AAA UK sovereign rating In-house and Fund Managers
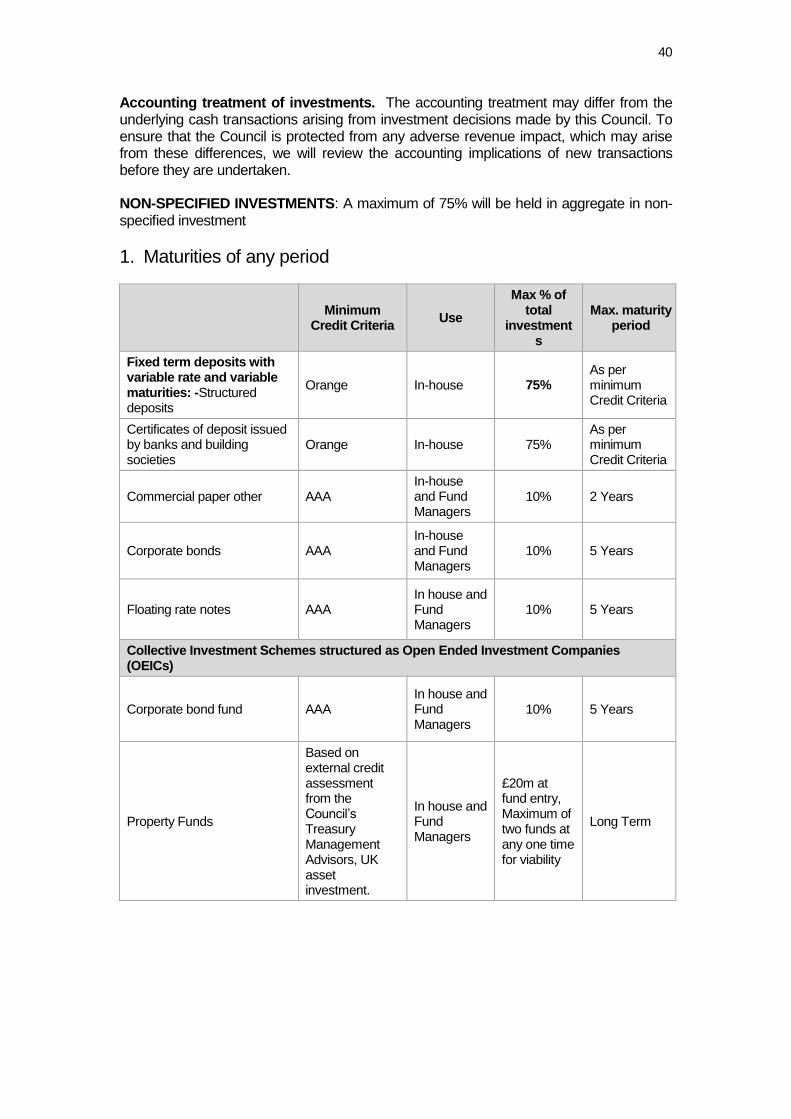
40
Accounting treatment of investments. The accounting treatment may differ from the underlying cash transactions arising from investment decisions made by this Council. To ensure that the Council is protected from any adverse revenue impact, which may arise from these differences, we will review the accounting implications of new transactions before they are undertaken. NON-SPECIFIED INVESTMENTS: A maximum of 75% will be held in aggregate in non-specified investment
1. Maturities of any period
Minimum
Credit Criteria Use
Max % of total
investments
Max. maturity period
Fixed term deposits with variable rate and variable maturities: -Structured deposits
Orange In-house 75% As per minimum Credit Criteria
Certificates of deposit issued by banks and building societies
Orange In-house 75% As per minimum Credit Criteria
Commercial paper other AAA In-house and Fund Managers
10% 2 Years
Corporate bonds AAA In-house and Fund Managers
10% 5 Years
Floating rate notes AAA In house and Fund Managers
10% 5 Years
Collective Investment Schemes structured as Open Ended Investment Companies (OEICs)
Corporate bond fund AAA In house and Fund Managers
10% 5 Years
Property Funds
Based on external credit assessment from the Council’s Treasury Management Advisors, UK asset investment.
In house and Fund Managers
£20m at fund entry, Maximum of two funds at any one time for viability
Long Term
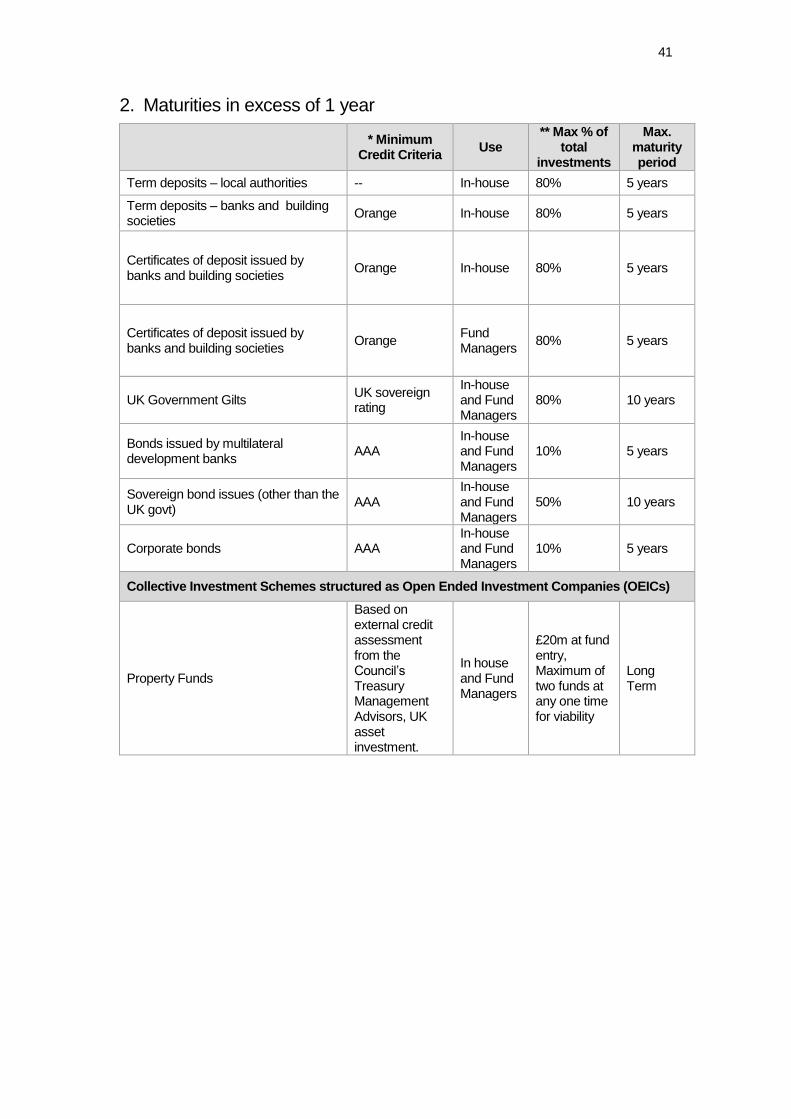
41
2. Maturities in excess of 1 year
* Minimum
Credit Criteria Use
** Max % of total
investments
Max. maturity period
Term deposits – local authorities -- In-house 80% 5 years
Term deposits – banks and building societies
Orange In-house 80% 5 years
Certificates of deposit issued by banks and building societies
Orange In-house 80% 5 years
Certificates of deposit issued by banks and building societies
Orange Fund Managers
80% 5 years
UK Government Gilts UK sovereign rating
In-house and Fund Managers
80% 10 years
Bonds issued by multilateral development banks
AAA In-house and Fund Managers
10% 5 years
Sovereign bond issues (other than the UK govt)
AAA In-house and Fund Managers
50% 10 years
Corporate bonds AAA In-house and Fund Managers
10% 5 years
Collective Investment Schemes structured as Open Ended Investment Companies (OEICs)
Property Funds
Based on external credit assessment from the Council’s Treasury Management Advisors, UK asset investment.
In house and Fund Managers
£20m at fund entry, Maximum of two funds at any one time for viability
Long Term

42
5.7 APPROVED COUNTRIES FOR INVESTMENTS
This list outlined below, is based on those countries which have sovereign ratings of AA- or higher, (we show the lowest rating from Fitch, Moody’s and S&P) and (except - at the time of writing - for Hong Kong, Norway and Luxembourg), have banks operating in sterling markets that have credit ratings of green or above in the Link Asset Services credit worthiness service.
Based on lowest available rating
AAA
Australia
Canada
Denmark
Germany
Luxembourg
Netherlands
Norway
Singapore
Sweden
Switzerland
AA+
Finland
U.S.A.
AA
Abu Dhabi (UAE)
Hong Kong
France
U.K.
AA-
Belgium
Qatar
THIS LIST IS AS AT 16.12.19

43
5.8 TREASURY MANAGEMENT SCHEME OF DELEGATION
(i) Full Council
receiving and reviewing reports on treasury management policies, practices and activities;
approval of annual strategy.
(ii) Executive / Full Council
approval of/amendments to the organisation’s adopted clauses, treasury management policy statement and treasury management practices;
budget consideration and approval;
approval of the division of responsibilities;
receiving and reviewing regular monitoring reports and acting on recommendations;
approving the selection of external service providers and agreeing terms of appointment.
(iii) Performance, Audit and Governance Overview Committee
reviewing the treasury management policy and procedures and making recommendations to the responsible body.

44
5.9 THE TREASURY MANAGEMENT ROLE OF THE SECTION 151 OFFICER
The S151 (responsible) officer
recommending clauses, treasury management policy/practices for approval, reviewing the same regularly, and monitoring compliance;
submitting regular treasury management policy reports;
submitting budgets and budget variations;
receiving and reviewing management information reports;
reviewing the performance of the treasury management function;
ensuring the adequacy of treasury management resources and skills, and the effective division of responsibilities within the treasury management function;
ensuring the adequacy of internal audit, and liaising with external audit;
recommending the appointment of external service providers.
preparation of a capital strategy to include capital expenditure, capital financing, non-financial investments and treasury management, with a long term timeframe
ensuring that the capital strategy is prudent, sustainable, affordable and prudent in the long term and provides value for money
ensuring that due diligence has been carried out on all treasury and non-financial investments and is in accordance with the risk appetite of the authority
ensure that the authority has appropriate legal powers to undertake expenditure on non-financial assets and their financing
ensuring the proportionality of all investments so that the authority does not undertake a level of investing which exposes the authority to an excessive level of risk compared to its financial resources
ensuring that an adequate governance process is in place for the approval, monitoring and ongoing risk management of all non-financial investments and long term liabilities
provision to members of a schedule of all non-treasury investments including material investments in subsidiaries, joint ventures, loans and financial guarantees
ensuring that members are adequately informed and understand the risk exposures taken on by an authority
ensuring that the authority has adequate expertise, either in house or externally provided, to carry out the above
creation of Treasury Management Practices which specifically deal with how non treasury investments will be carried out and managed, to include the following: -
o Risk management (TMP1 and schedules), including investment and risk management criteria for any material non-treasury investment portfolios;
o Performance measurement and management (TMP2 and schedules), including methodology and criteria for assessing the performance and success of non-treasury investments;
o Decision making, governance and organisation (TMP5 and schedules), including a statement of the governance requirements for decision making in relation to non-treasury investments; and arrangements to ensure that appropriate professional due diligence is carried out to support decision making;

45
o Reporting and management information (TMP6 and schedules), including where and how often monitoring reports are taken;
o Training and qualifications (TMP10 and schedules), including how the relevant knowledge and skills in relation to non-treasury investments will be arranged.