Embed Size (px)
Citation preview

MPRAMunich Personal RePEc Archive
Ease of Doing Business: Emphasis onCorruption and Rule of Law
Dalal Karama
16. September 2014
Online at http://mpra.ub.uni-muenchen.de/58662/MPRA Paper No. 58662, posted 17. September 2014 05:20 UTC

i
TABLE OF CONTENTS
Abstract .................................................................................................................................. iv
Acknowledgments .................................................................................................................. v
List of Tables .......................................................................................................................viii
List of Figures ........................................................................................................................ ix
List of Terms .......................................................................................................................... x
Chapter
1. Introduction .............................................................................................................. 1
2. Literature review ...................................................................................................... 7
Part I: Corruption ................................................................................................... 13
Part II: Rule of Law ............................................................................................... 16
3. Methodology, Data Selection, and Problems Encountered ................................... 18
Methodology .......................................................................................................... 18
Data Selection ........................................................................................................ 19
Problems Encountered ........................................................................................... 23
4. Results, Analysis, and Outcome of Regression Models ........................................ 26
Results ................................................................................................................... 26
Analysis ................................................................................................................. 26
Regression Models and Results ............................................................................. 28
Model 1 ......................................................................................................... 29
Model 2 ......................................................................................................... 30
Model 3 ......................................................................................................... 31
Model 4 ......................................................................................................... 32
5. Conclusion ............................................................................................................. 37

ii
References ............................................................................................................................ 40
Appendices
A. Definition of Rule of Law indices ......................................................................... 44
B. Definition of Corruption indices ............................................................................ 46
C. List of countries by region ..................................................................................... 48
D. List of countries based on the Bribe Payers Index ................................................. 52
E. Scatter plot figures ................................................................................................. 53

iii
LIST OF TABLES
1. Statistical Summary of all models............................................................................34
2. Summary of coefficients of the regression equations of all models…….................35

iv
LIST OF FIGURES
Figures
1. Relationship between EDBI and CPI ..................................................................... 53
2. Relationship between EDBI and BPI ..................................................................... 53
3. Relationship between EDBI and RoL .................................................................... 54
4. Relationship between EDBI and GDPG ................................................................ 54
5. Relationship between GDPG and CPI ................................................................... 55
6. Relationship between GDPG and BPI .................................................................... 55
7. Relationship between GDPG and RoL ................................................................... 56
8. Relationship between GDPPC and CPI.................................................................. 56
9. Relationship between GDPPC and BPI .................................................................57
10. Relationship between GDPPC and RoL ................................................................ 57
11. Relationship between EDBI and GDPPC .............................................................. 58

v
LIST OF TERMS/ABBREVIATIONS
EDBI Ease of doing business index.
BPI Bribe payers index.
CPI Corruption perception index.
GDPG Gross domestic product growth.
GDPPC Gross domestic product per capita.
TAC Transparency, accountability, and corruption in the public
sector.
FGGMTO Firms expected to give gifts when meeting with tax
officials.
QPA Quality of public administration.
CPIA Country policy and institutional assessment.
IPO Informal payments to officials.
FATMTO Firms average time meeting with tax officials
SLRI Strength of legal rights.
TRSB Time required to start a business.
DI Business extent disclosures.
SPRB Startup procedures to register a business.
PEC Procedure to enforce a contract.
PR Property rights and rule-based governance.
BRE Business regulatory environment.

6
CHAPTER 1
Introduction
Generally, an Ease of doing business index (EDBI) is a composite measure of the various
ways an economy facilitates production and a vital consideration that governs a country’s ability
to realize potential GDP. Improved EDBI might result from many interactive changes in
countries’ business environments as they affect both domestic economies' activity and
international trade. For example, an improved EDBI in a country might cause an increase in
foreign direct investment, which in turn might increase competition in domestic markets. The
latter lowers domestic prices, leads to an increase in local purchasing power, and thereby
increases consumption. Ultimately, this dynamic scenario results in faster economic growth.
Specifically, this study relies on the Ease of Doing Business Indexi, an index that is a
measure of the extent to which a country’s regulatory environment is conducive to business
operation. The Index, which is provided by the World Bank, ranks economies from 1 to 189
with first place being the best. For example, with regards to the Least Developed Countries,
LDCii, Chad ranked worse at 185 in 2011, it improved by 0.5% in 2012. In contrast, while
Rwanda ranked better than Chad at 48 in 2011, it worsened by 8.3% in 2012. As for the Newly
Industrialized Economies, NIEiii
, the Philippines, India, and Brazil ranked worse than South
Africa, Thailand, and Malaysia. As expected, emerging and developing economies rank better
than lesser-developed economies, no doubt the result of reform and technology to name a few.
The issues addressed in this study involve relationships between: 1) societies’ realized
economic efficiency and growth; and 2) those societies’ levels of rule of law, ease of doing
business, and the prevalence of corruption and bribery.
7
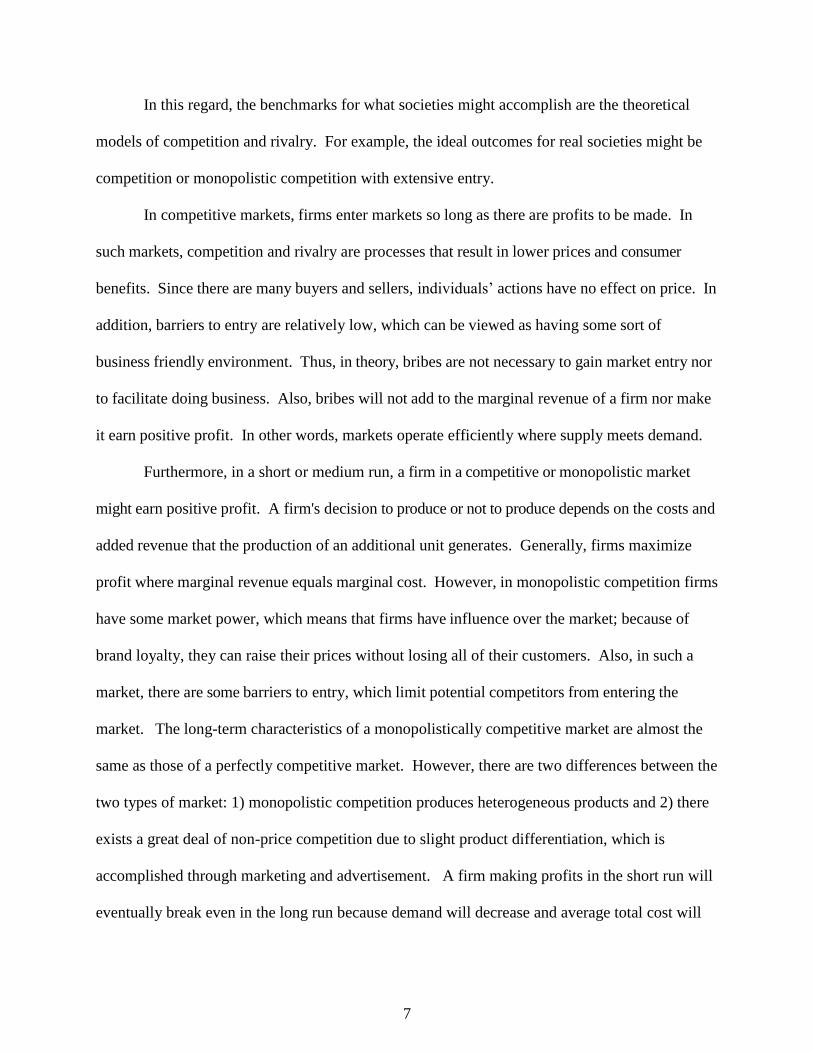
In this regard, the benchmarks for what societies might accomplish are the theoretical
models of competition and rivalry. For example, the ideal outcomes for real societies might be
competition or monopolistic competition with extensive entry.
In competitive markets, firms enter markets so long as there are profits to be made. In
such markets, competition and rivalry are processes that result in lower prices and consumer
benefits. Since there are many buyers and sellers, individuals’ actions have no effect on price. In
addition, barriers to entry are relatively low, which can be viewed as having some sort of
business friendly environment. Thus, in theory, bribes are not necessary to gain market entry nor
to facilitate doing business. Also, bribes will not add to the marginal revenue of a firm nor make
it earn positive profit. In other words, markets operate efficiently where supply meets demand.
Furthermore, in a short or medium run, a firm in a competitive or monopolistic market
might earn positive profit. A firm's decision to produce or not to produce depends on the costs and
added revenue that the production of an additional unit generates. Generally, firms maximize
profit where marginal revenue equals marginal cost. However, in monopolistic competition firms
have some market power, which means that firms have influence over the market; because of
brand loyalty, they can raise their prices without losing all of their customers. Also, in such a
market, there are some barriers to entry, which limit potential competitors from entering the
market. The long-term characteristics of a monopolistically competitive market are almost the
same as those of a perfectly competitive market. However, there are two differences between the
two types of market: 1) monopolistic competition produces heterogeneous products and 2) there
exists a great deal of non-price competition due to slight product differentiation, which is
accomplished through marketing and advertisement. A firm making profits in the short run will
eventually break even in the long run because demand will decrease and average total cost will

8
increase. This means in the long run, a monopolistically competitive firm will make zero
economic profit. With that said, an individual firm's demand curve is downward sloping, in
contrast to perfect competition, which has a perfectly elastic demand schedule where price equals
marginal cost equals marginal revenue and has a horizontal demand curve that touches its
average total cost curve at its lowest point.
Moreover, in the presence of a coercive government, monopolistic competition falls into
government-granted monopoly, where governments grant exclusivity to a firm to be the sole
provider of a good or service via law, regulation, or other mechanisms of government
enforcement, which keeps potential competitors out of the market. Such firms, without barriers
to entry, have a lot to lose because the start up costs associated with economies of scale, research
and development (R&D), and patents are generally high and ease of entry can make those costs
unrecoverable. That being said, the incumbent firm has an incentive to create a less than friendly
business environment with modest to severe barriers to entry. Consequently, such a business
environment is fertile ground for bribery and corruption where bribery becomes a fee paid to
elevate or support these barriers thus resulting in high prices and creating a deadweight loss due
to market inefficiency.
This study establishes causal links between ease of doing business, corruption, rule of
law, and growth. The first link is about the negative implication that corruption and bribery have
on ease of doing business, a phenomenon present in the Least Developed Countries as well as in
Newly Industrialized countries like India, Brazil, and Philippines. Those countries are labeled
emerging developing economies according to IMF (2011). In fact, in the absence of rule of law,
corruption and bribery can go undetected to where it becomes part of doing business. For
example, in India, as explained by Ernst & Young (2012), a corporation needs to factor in the

9
cost of bribing officials into its overall cost to establish and operate a business. The second link
is how, in the presence of rule of law, corruption and bribery come to the surface and are
exposed, often times in the Most Developed Countries, through scandals. Consequently,
government officials and other individuals taking part in unethical practices are held accountable
for their actions and forced to pay fines or imprisoned. For example, multinational corporations
like DaimlerChrysler, as evident in Ernst & Young (2012), paid a fine for bribing Russian public
officials. The third link is how the presence of corruption and/or rule of law affect growth in an
economy, both on the macro and micro level.
While much of the literature prepared previously examines ease of doing business,
corruption, and rule of law from the point of view of investment and trade, my paper is different
in that it examines the impact of corruption and rule of law on ease of doing business and
economic growth. Because ease of doing business relies mainly on business friendly regulations,
the existence of political turmoil, economic uncertainties, as well as poor quality of the judicial
systems makes it difficult for Africa and some other developing countries to attract foreign
investors. For example, the Arab Spring, which was viewed as a long awaited event in hope of
moving the region to more democratic regimes, turned out to be a nightmare as it has moved the
countries' economies backwards and created major chaos and doubts with regards to political
stability in the region. The result is a dramatic reduction in foreign direct investment. Based on
personal interviews with businessmen of Middle Eastern descent with over 20 years experience
in the region, they all, unanimously, agreed to the fact that ease of doing business is generally
dependent on the amount of bribe. For example, to do business in Saudi Arabia or UAE, it is a
necessity to have local partners in order to facilitate and speed up the process of starting and
operating a business. One story of corruption involves a Saudi Arabian prince and a Thai

10
domestic worker who allegedly stole $20 million dollars worth of jewelry from the Saudi prince
and fled to his home country, Thailand. Given the diplomatic ties the prince had with the
foreign ministries of both countries, the two resolved the issue amicably by having the jewels
returned to their rightful owner. After examination of the returned stolen jewels, the prince finds
out that he got back fake jewelry. When asked, the culpable end's explanation of the switch was
that Thailand is as corrupt as Saudi Arabia and the case closed at that. Additionally, United
Arab Emirates offers employment opportunities for people from neighboring countries like
Lebanon, Syria, and Egypt to name a few. Incidents that those people encounter often times
have to do with immigration, contracts, permits, and pay. If, at any time workers seek the help
of the judicial system to resolve some personal issues and demand what is rightfully theirs, they
are threatened with deportation if not worse. A perfect example is the recent controversy over
the Kafala system in Qatar.
Although ample studies are done on the three main variables of my paper, a recently
published work by Pollard, Piffaut, and Shackman (2013) does examine the relationship that
exists between the business infrastructure and ease of doing business. In that study, two of the
ten independent variables used that make up Business Infrastructure are corruption and rule of
law.
An in-depth analysis on that topic is offered, in this paper, in two parts. Part 1 examines
the complex relationships that exist between corruption, gross domestic product growth, gross
domestic product per capita, and ease of doing business. The corruption explanatory variables
used are transparency, accountability, corruption in the public sector; firms expectations to give
gifts in meeting with tax officials (% of firms); corruption perception index; CPIAiv
quality of
public administration; informal payments to officials; firms average time meeting with tax

11
officials; and the bribe payers index to determine the magnitude of the presence, the influence,
and the type of relationship corruption has on the ease of doing business, gross domestic product
growth rate, and gross domestic product per capita. It is important to note that Corruption
Perception Index as well as Bribe Payers Index are based on perception only and thus are
unreliable. Although an undependable source, they have shown evidence of bribery between
firms as well as between public officials. Bribery is mostly common in public works, contracts,
and the construction sector as evident in Olken (2009).
Part II validates a claim made by many economists on the importance of institutions and
rule of law as a promoter of growth. This paper examines rule of law indices such as procedures
to enforce a contract, time required to enforce a contract, startup procedure to register a business,
strength of legal rights, time required to start a business, CPIA business regulatory environment,
CPIA property rights and rule- based governance rating, and business extent of disclosure in order
to determine their relevance in explaining ease of doing business, gdp growth rate, and gdp per
capita in the world.
Chapter two covers literature review and chapter three presents methodology used, data
selection, and problems encountered. Chapter four covers results, analysis, and outcome of the
regression models as well as provides an understanding of the dynamic that exists between the
chosen variables. This study’s goal is to explain the variations present in order to determine the
magnitude and how well the indices explain growth or lack of growth in an economy. In chapter
five, a summary is provided along with a conclusion that incorporates some policy suggestions in
order to assist policy makers, legislators, and those concerned with the well being of constituents
and state of the economy to make better informed decisions with regards to the allocation of
scarce resources.

12
CHAPTER 2
Literature review
There are two major predictors, which influence ease of doing business. They are
corruption and rule of law. The existing literature on ease of doing business mainly assesses its
importance relative to investment. Ease of doing business, a World Bank Indicator, uses 41
variables to compare business environment of different countries. It is a ranking system widely
used by policy makers, researchers, and multinational corporations (Oliveira and Alves, 2010-
12). In terms of corporations, the index is a vital tool used as a benchmark prior to making
investment decision (Alves and Oliveira, 2012). Other studies found that there exists a positive
relationship between ease of doing business and foreign direct investment (Corcoran and
Gillanders, 2012). Besides a friendly business regulatory environment, good trade regulations
are essential if investors, particularly American ones, are to place their capital in foreign
countries. A cross-section analysis of about 150 countries covering 1990-2004 is used to show
that a correlation exists between economic regulations and economic growth. In other words,
countries with business friendly regulations experience faster growth. Furthermore, to improve
trade and export competitiveness, trade officials need to take the initiative to work cooperatively
with other ministries and institutions to lower behind and at-the-border trade costs in Asia-
Pacific (Duval and Utoktham, 2009). More studies are done in which the necessity to have
suitable rules and regulations in conditioning favorable business environments are highlighted in
Bahrain (Pillai, 2009). Also, the presence of good institutions that favor economic freedom play
a large role in determining the magnitude of the inward flow of foreign direct investment in
Europe. In particular, Júlio, Alves, and Tavares, (2011) assess the required reform effort for
Portugal prior to it joining the European Union. In addition, they determine that geography,

13
market size, and labor costs are also determinant factors in bilateral inward FDI.
The existing literature widely focuses on corruption with regards to investment, growth,
trade, and culture. Olken (2009) shows that corruption and bribery are in fact real after an
examination of a road-building project in a village in Indonesia. Discrepancy between the
anticipated expenditure and an actual estimate of the cost of the project proved that the villagers'
perception of corruption is accurate. According to Smarzynska and Wei (2002), corruption can
have a negative effect on cross-border investment because it acts as a tax and, as a consequence,
reduces the volume of foreign direct investment (FDI). The necessity to have to bribe also
affects the structure and formation in ownership where, in order to reduce local bureaucracy
hurdles, foreign investors might take on local partners. However, to have a local partner in a
corrupt country might be a solution to penetrate the market for small and less technologically
advanced firms but not to firms that are technologically advanced. The latter are less also likely
to engage in joint ventures, but are more likely to bribe high-ranking public officials to get the
job done. Further studies analyze a sample of bilateral investment from fourteen source
countries to forty-five host countries during the period 1990-91 (Wei, 1997). The results show
that a rise in either the tax rate on multinational firms or the corruption level in a host country
reduces the inflow of capital from foreign investors. In other words, tax and corruption
discourage investment thereby negatively impacting economic growth in the host country. Wei
(1997) also examines the behavior of American and Japanese investors in East Asia with regards
to dealing with corruption in that region. The result was that both investors dealt with corruption
the same way they would if it was in any other part of the world. Knack and Azfar (2000) make
it evident that the size of a country is also a determinant factor in assessing the level of
corruption. The larger the country is the more corrupt its government seems to be.

14
Other factors that can explain the presence of corruption and bribery in some countries
more than others are associated with human traits. Regardless of the nationality and cultural
background of the perpetrator, an analysis shows the impact of migration on destination-country
corruption level, although insignificant, that immigration from corruption-ridden countries
heighten corruption in the destination country. The study was done using a data set that consists
of 207 OECD countries of origin for the period 1984-2008 (Dimant, Krieger, and Redlin, 2013).
It is a fact that corruption is present everywhere whether it is in Africa, Europe, or even
the Russian region. With regards to Africa, the common perception is that most governments in
this region are corrupt, but how to fight corruption across the African countries and why some
are more effective in combating it than others is examined in Asongu (2012). A review of
sample of 46 African countries for the period 2002-2010 suggests that current corruption control
policies need to be reexamined and should be a priority to the local governments in both the least
corrupt and the most corrupt nations in the region. Any delay in the revisions of existing policies
reduces the effectiveness of future policies. Also, the more active role the government takes in
fighting corruption the more positive effect institutional reforms have on these countries. To
fight corruption in Africa, corruption control policies need to be tailored to fit each country
taking into consideration its culture, religion, degree of democracy, economic prosperity and
growth level.
As for Europe, corruption is found to be increasing. An analysis of the legal system,
political stability, and history was used to determine the cause of corruption (MacDonald and
Majeed, 2011-12). Not much has previously been done on examining the cause of corruption in
European countries perhaps because of the assumption that dealing with the West implies less
corruption. Cross-country data is used to observe the many aspects that make up the basic

15
structure of a country like the legal system, history and political stability and the influence they
have on corruption. The outcome of the study is that there exist a negative relationship between
corruption and the strength of the legal system, and that the size of government matters in
affecting corruption levels because political stability is a significant determinant in judging
peoples' behavior. With that said, one can foresee that a positive relationship exists between
economic uncertainty and corruption and is in fact evident in Goel and Ram (2013). Moreover,
increased political rights and civil liberties appear to reduce corruption. Conversely,
transitioning economies tend to have more corruption due to the temporary chaos created by the
reorganization process.
Further literature examines the cause of corruption in the Russian region. For example,
an examination of corruption determinants, a comparison between perceived and actual
corruption, and the influence of market competition on corruption show that economic
prosperity, population, market competition, and urbanization are all significant determinants of
corruption in Russia (Veronika, Goel, and Korhonen, 2011-12).
Transparency seems to be the famous word for many politicians, presidential candidates,
and even chief operating officers of multinational and national corporations. What is meant by
transparency is the existence of well-established rules and regulations that are enforced and
individuals, who like to operate under their own sets of rules and regulations, are held
accountable for their actions. Voigt, 2009 argues that there are many dimensions to rule of law.
He contrasts an ideal approach with a pragmatic approach in order to make the concept
assessable and provides a list of desirable variables that can be used to obtain a more accurate
measure of various aspects of the rule of law. In addition, economic advancement does not
imply presence of rule of law as is evident in a study that examines East Asia and South East

16
Asia. Lane, 2011 points out that despite the latter regions enormous economic advances, there
exist a deficit in rule of law. The analysis looks at rule of law from two perspectives 1) judicial
autonomy and legal integrity and 2) voice and accountability using data from the World Bank
Governance project, which link them to different measures on socio-economic development and
economic growth. Results show that more effort and research needs to be done in order to
understand economic advances in the presence of a less than perfect rule of law system.
Zywicki, 2002 brings to the forefront the importance of rule of law and its contribution to society
as a whole. The study analyzes its impact on transition and developing economies in
establishing a framework for economic growth and individual liberty. The premise of the paper
revolves around the Supreme Court's controversial decision in Bush v. Gore concluding that rule
of law is crucial for having a free and prosperous society in America and abroad.
Dawson 2013, analyzes the social determinants between two similar countries, Jamaica
and Barbados, to help explain the conflicting outcome of rule of law post-independence. It is
suggested that it takes the cooperation of both the state and society if countries are to recover and
prosper both economically and socially. Moreover, Classical Political economists argue that
corruption undermines rule of law (Smith 2001, chap 5), while modern Public Choice proponents
argue that corruption and lobbying might influence efficiency of rule of law. Chicago Public
Choice presents a model on how legal lobbying, which is viewed as corruption from the
perspective of Virginia Public choice, improves efficiency of rule of law and thereby improves
economic efficiency on the macro level. Conversely, Virginia Public Choice explains that
corruption reduces rule of law and as a consequence negatively affects the overall economic
efficiency (Grochová and Otáhal, 2012). The outcome of this literature work is that corruption
reduces efficiency of the rule of law and thereby reduces overall economic efficiency because it

17
influences bureaucratic rent seeking. More research related to growth is done in which some
support the idea of a positive relationship between trade opennessv
and growth (Edwards [1997]),
Krueger [1997], and Wacziarg and Horn Welch [2003]) and some analyze the level of education,
productivity, and growthvi (Coulombe and Tremblay [2006]).
Although literature on corruption, rule of law, and ease of doing business is plentiful
when it comes to explaining relationships between corruption and foreign direct investment, ease
of doing business and foreign direct investment, ease of doing business and its effect on trade,
rule of law and corruption, corruption and economic efficiency, even gdp growth (GDPG) and
gdp per capita (GDPPC) and corruption, it fails to show how the presence of corruption and lack
of rule of law influences ease of doing business. It is important to note that a country with a
friendly regulatory environment is more conducive to business operation and experience
economic growth because of lesser degree of corruption and the presence of an effective judicial
system.
The amount of scholarly literature on the issue is scarce to none that further exploration
of ease of doing business from a different angle is warranted because it is nucleus to economic
growth and its presence leads to investment, innovation, and profitability thereby benefiting
society on the macro level. In terms of the influence ease of doing business has on the micro
level, investment leads to job creation, which in turn leads to an increase in employment
opportunities thereby benefiting individuals. Addressing the relationship that exists among ease
of doing business, corruption, and rule of law adds to the field of economics in that it provides a
clearer view on how to prioritize and maximize the benefit received as a result of a more
efficient allocation of scarce resource.

18
In this paper, an in-depth analysis of the relationship that exists among ease of doing
business, corruption, and rule of law is provided in two parts.
Part 1: Corruption
Corruption and bribery are a major problem since they are very complicated, and difficult
to prove. Because the putative goal of government is to have society, business, and daily lives of
constituents free of corruption or at least minimized, many countries have decided to take an
active role in combating it through the establishment of organizations such as Transparency
International, which was created in 1993 to attempt reduce if not eliminate corruption around the
world. Transparency International is a non-governmental organization with headquarters located
in Berlin, Germany. It monitors and publicizes corporate and political corruption in international
development. The organization measures the level of corruption with the use of many indices.
This paper uses the Corruption Perception Index, first launched in 1995, and the Bribe Payers
Index, with its first report printed in 1999, to examine the type of externality corruption is to ease
of doing business and growth.
The Corruption Perception Index (CPI)vii
ranks, on a scale of 0 to 100, a total of 176
countries based on how corrupt their public sector is perceived to be; the lower the rank the
better. It also scores the same number of countries on a scale of 0 to 10. The higher the score is,
the cleaner the country’s public sector is perceived to be. For example, in 2011 Netherlands
achieved a score of 8.9 followed by Switzerland with a score of 8.8.
As for the ranking, in 2011, the best countries were New Zealand, Denmark, and
Finland with a rank of 1, 2, and 2 respectively. The worst
countries were Afghanistan,
Myanmar, North Korea, and Somalia with a rank of 180, 180, 182, and 182 respectively.

19
The Bribe Payers Indexviii
scores, on a scale of 0 to 10, a total of 28ix
of the world’s
leading economies based on the likelihood that firms from these countries are to engage in
bribery when doing business abroad in order to gain an advantage over already established and
existing firms. For example, in Mexico, where La Mordidax or the bite of the dog is evidently
present, Mexicans paid close to $2.58 billion in bribes in 2007 compared to $115 million in 2005.
The bribe however was smaller; $13 in 2007 compared to $17 in 2005. In fact, in Mexico in
2005 "nearly 10 percent of the requests for public services like the simple request for connecting
electricity to a house or changing vehicle ownership, involved bribes"xi
. The top 3 scoring
countries on the bribe payers’ list were the Netherlands, Switzerland, and Belgium with scores of
8.8, 8.8, and 8.7 respectively. The bottom 3 scoring countries were Russia, China, and Mexico
with scores of 6.1, 6.5, and 7 respectively. Mexico scored better than Russia and China in terms
of bribery, but China scored better than Mexico in terms of corruption with a score of 3.6 and 3.0
respectively. Also in terms of corruption, Mexico scored better than Russia with a score of 3.0
and 2.4 respectively. As for ease of doing business, Mexico ranked 53 whilst China and Russia
ranked 91 and 118 respectively. Of course, the higher the ranking on the EDBI, the less friendly
business regulations can be in that country. Thus, the results show that Mexico is less likely to
bribe abroad and had friendlier business regulations than China and Russia, but Mexico was more
corrupt than China and less corrupt than Russia.
The difficulty in properly measuring corruption and bribes is that it is often times viewed
as a cultural issue (Barr and Serra [2010]), and many people accept it as a common and necessary
practice to do business. According to Barr and Serra, “while corruption may, in part, be a cultural
phenomenon, individuals should not be prejudged with reference to their country of origin”. In
India like in Mexico corruption is regarded as part of doing business. However in India,
20
corruption begins at the bottom echelon of the business creation process, from the incorporation
level to the construction level, to the import of raw materials as well as to the export of finished
goods. It is said that to do business in India, as in Egypt and other countries in the Middle East
and Asia, a corporation should factor in the cost of bribing officials into its overall cost of
establishing and operating a business. An anecdote from a reliable source that works in the
aviation industry, which wishes not to be named, recounted his experiences in doing business in
China, Indonesia, and Malaysia. It seems that in order to do business, whether in the public or
private sector, a percentage of the total cost of the commissioned job has to be agreed upon prior
to any deals being approved. What’s important to note is that corruption and bribery are
widespread in high-ranking positions and are pretty common that they are openly practiced and
not incognito.
With regards to ease of doing business, The Doing Businessxii
initial goal is to
provide an unbiased foundation for understanding and improving the regulatory environment for
business around the world. The Doing Business project was established in 2002 with its first
report published in 2003. It covers 185 economies on a scale of 1 to 185. A low ranking on the
Ease of Doing Business index means the regulatory environment is business friendly and
conducive to starting and operating a business. For example, the top four scoring countriesxiii
in its
ease of doing business are Singapore, Hong Kong, New Zealand, and the United States with
scores of 1, 2, 3, and 4 respectively. The bottom four scoring countriesxiv
are Chad, Congo
Republic, Central African Republic, and Eritrea with scores of 185, 184, 183, and 182
respectively. The index provides a measure that encourages countries to compete towards more
efficient regulations and thus creates an incentive for regulatory reform if countries are to move
up on the ranking scale.

21
Part II: Rule of Law
With the presence of rule of law and not to mention the help of whistle blowers, it is
possible to reduce, deter, and possibly eliminate corruption and bribery through accountability.
For example, The U.S. Securities and Exchange Commission (SEC) penalized Nature’s Sunshine
Products (NSP) because their subsidiary in Brazil paid a bribe in order to illegally import certain
vitamins and herbal products into Brazil. NSP paid a civil fine in the amount of $600,000 in
2009. In Russia, an investigation by Russian authorities for violations under the Foreign Corrupt
Practices Act (FCPA) alleged that DaimlerChrysler, a German auto company, bribed public
Russian officials. Daimler paid a fine in the amount of $185 million imposed by the US
Department of Justice and SEC. Also, Daimler’s employee also allegedly bribed Chinese
officials by offering commissions, travel, and gifts benefits. Hewlett-Packard in 2010 was
investigated for having employees’ involved in kickbacks worth $10.9 million. Hewlett-Packard
(HP) settled by paying a fine close to $55 million, which is about five times the amount of the
kickbacks. In fact, the investigation into HP was a cooperating effort initiated by Russian
authorities and German prosecutors. Dow Chemical in Mumbai bribed officials of India’s
Central Insecticides Board in order to speed up the registration process of its products. Dow
Chemical settled outside of court and paid a fine in the amount of $325,000 [Ernest & Young,
2012)]. Very recently, November 2013, in an ongoing case, a British businessman Victor
Dahdaleh paid bribes in the amount of $64 million to the former CEO, Bruce Hall, of Aluminum
Bahrain BSC, known as ALBA and to Sheikh Issa Bin Ali Al Khalifa, then chairman, in order to
win contracts. It seems that Mr. Dahdaleh paid bribes to officials in the amount of $7.75 million
between 1998 and 2006xv
. It is evident that multinational corporations are tempted to bribe
abroad as part of doing business however, one way or another they end up caught in the act, held

22
accountable, and penalized.
With that said, if ease of doing business is at the core of economic growth, then it is
important to identify the level of influence the presence of corruption and rule of law have on
this key element. Thus, based on the review presented, my hypothesizes is that, depending on
the type of market, competitive or monopolistic, there exist zero to negative correlation between
ease of doing business, the dependent variable, and corruption, bribery, and rule of law the
independent variables. However, in terms of gdp growth with regards to corruption, bribery, and
rule of law the relationship is negative on the macro level and positive on the micro level.
Furthermore, the relationship between ease of doing business and growth is positive on the
macro level and negative on the micro level. Thus, in terms of externalities, corruption, bribery,
and rule of law can be viewed as positive or negative depending on the circumstances.

23
CHAPTER 3
Methodology, Data Selection, and Problems Encountered
Methodology
This study used cross-sectional data to assess the extent of the relationship that exists
among ease of doing business, corruption, rule of law, gdp growth, and gdp per capita. The data
selection was based on data availability, observations range from 12 to 178. In this empirical
study, regression analysis is used to show the effect corruption and rule of law has on ease of
doing business, gdp growth, and gdp per capita. Also, scatter plots are used to show the
relationship that exist between Ease of Doing Business (EDBI), Corruption Perception Index
(CPI), Bribe Payers Index (BPI), and Rule of Law (RoL); GDP Growth (GDPG), CPI, BPI, and
RoL; GDP per Capita (GDPPC), CPI, BPI, and RoL; GDPG vs. EDBI; GDPCC vs. EDBI.
My model specification is an OLS regression and is the following:
DV = α + β1C + β2RoL +ε
Where DV is a vector representing the dependent variables, C is a vector of variables measuring
corruption, RoL is a vector of variables measuring rule of law, and ε is a random variable that is
assumed to be normally distributed with a constant variance and zero mean.
A total of four OLS regressions models are presented to assist in quantifying the
relationship between the explained and the explanatory variables as well as the hope of being
able to determine the factors that weighs heavily and have high magnitude effect on influencing
growth whether on the macro or micro level of an economy.

24
Data Selection
The total number of observations used in this study ranged from 12 to 178 depending on
the model and depending on the explanatory variables used in the model.
The dependent variables examined in this study are Ease of Doing Business, GDP
Growth, and GDP per Capita. The independent variables are Corruption and Rule of Law
vectors.
The corruption vector includes the following: Corruption Perception Index; Bribe Payers
Index; Transparency, Accountability, and Corruption; Firms Giving Gifts when Meeting with
Tax Officials; Firms Average Time Meeting with Tax Officials; Informal Payment to Public
Officials; Quality of Public Administration, which are described below:
Transparency, accountability, corruption in the public sector (TAC) assesses the extent
to which the executive can be held accountable for its use of funds and for the results of
its actions by the electorate and by the legislature and judiciary, and the extent to which
public employees within the executive are required, it measures on a scale of 1 to 6
where 1=low and 6=high; 77 countries were surveyed in 2011 and the assortment is as
follows: 13 countries from Asia, 38 from Africa, and 26 from the rest of the world.
Firms expectations to give gifts in meeting with tax officials (% of firms) (FGGMTO)
is the percentage of firms that answered positively to the question "was a gift or
informal payment expected or requested during a meeting with tax officials; It is
important to note that in 2010 a total of 33 countries were surveyed of which only 4
where from Africa, Congo, Dem. Rep., Angola, Mali, Botswana, and 29 from the rest
of the world. On the other hand, in 2011 only 6 countries where surveyed: 4 from
Africa: Zimbabwe, Rwanda, Ethiopia, and Central African Republic, 1 from Asia: Sri

25
Lanka, and 1 from Middle East and North Africa (MENA) Iraq.
CPIA quality of public administration (QPA) assesses the extent to which civilian
central government staff is structured to design and implement government policy and
deliver services effectively, it measures on a scale of 1 to 6 where 1=low and 6= high;
this index consist of a total of 78 observations: 13 are from Asia, 38 from Africa, and
27 are from the rest of the world.
Informal payments to officials (IPO) are the percentage of firms expected to make
informal payments to public officials to "get things done" with regard to customs,
taxes, licenses, regulations, services, and the like; The sample of observations are
similar to that of FGGMTO in both 2010 and in 2011.
Firm’s average time meeting with tax officials (FATMTO) is the average number of
visits or required meetings with tax officials, as the independent variables. The
sample of observations is similar to that of FGGMTO and IPO in both 2010 and in
2011.
A sample of 12 countries, Angola, Bolivia, Congo, Dem. Rep., Dominica, Grenada,
Guyana, Honduras, Mali, Nicaragua, St Lucia, St. Vincent and the Grenadines, and Yemen, is
used in this cross-sectional analysis because of data being available for that number of
countries as well as the parameters in the corruption vector.
It is important to note that year 2011 is used in EDBI and 2010 is used in the other five
chosen parameters because any reforms, to help improve corruption or ease of doing business,
takes a long time to reflect in the numbers. For that reason, it is appropriate to use two different
time periods, 2010 and 2011, to analyze the effect of the different corruption explanatory
variables in order to assess the relationship that exists between EDBI and the abovementioned

26
measures of corruption.
The data on TAC, FGGMTO, FATMTO, IPO, and QPA is obtained from the World
Bank.
The rule of law vector includes the following: Property Rights and Rule-Based
Governance (PR), Start-Up Procedure to Register Business (SPRB), Strength of Legal Rights
Index (SLRI), Procedure to Enforce a Contract (PEC), Time Required to Obtain an Operating
License (TROOL), Time Required to Start a Business (TRSB), Disclosure Index (DI), Business
Regulatory Environment (BRE), and Rule of Law Index (RoL), which are described below:
Property rights and rule-based governance (PR) assesses the extent to which private
activity is facilitated by an effective legal system and rule-based governance structure
in which property and contract rights are reliably respected and enforced;
Start up procedures to register a business (SPRB) are those required to start a business,
including interactions to obtain necessary permits and licenses and to complete all
inscriptions, verifications, and notifications to start operations. Data are for businesses
with specific characteristics of ownership, size, and type of production;
Strength of legal rights index (SLRI) measures the degree to which collateral and
bankruptcy laws protect the rights of borrowers and lenders and thus facilitate lending.
The index ranges from 0 to 10, with higher scores indicating that these laws are better
designed to expand access to credit;
Numbers of procedures to enforce (PEC) a contract are the number of independent
actions, mandated by law or courts, that demand interaction between the parties of a
contract or between them and the judge or court officer;
Time required to obtain operating license (TROOL) is the average wait to obtain an

27
operating license from the day the establishment applied for it to the day it was
granted.
Time required to start a business (TRSB) is the number of calendar days needed to
complete the procedures to legally operate a business. If a procedure can be speeded
up at additional cost, the fastest procedure, independent of cost, is chosen;
Disclosure index (DI) measures the extent to which investors are protected through
disclosure of ownership and financial information. The index ranges from 0 to 10,
with higher values indicating more disclosures;
Business regulatory environment (BRE) assesses the extent to which the legal,
regulatory, and policy environments help or hinder private businesses in investing,
creating jobs, and becoming more productive;
The Rule of Law Index is designed by the World Justice Project and measures the
extent to which countries adhere to the rule of law in practice. The index is made up of
nine factors and each factor covers a range between three and seven sub factors.
However no data is available on the ninth factor, informal justice. In my study I use
the average of the eight factors: limited government power, absence of corruption,
order and security, fundamental rights, open government, regulatory enforcement, civil
justice, and criminal justice.
All of the variables used in this paper are taken from the World Bank except for the rule
of law index, which is taken from the World Justice Project. The World Justice Project is an
independent non-profit organization that develops communities of opportunity and equity by

28
advancing the rule of law worldwide. Also, CPI and BPI are taken from Transparency
International, a non-governmental organization that monitors and publicizes corporate and
political corruption in international development.
It is important to note that Ease of Doing Business index measures relative change and
takes the simple average of 10 topics: starting a business, dealing with construction permits,
getting electricity, registering property, getting credit, protecting investors, paying taxes, trading
across borders, enforcing contracts, and resolving insolvencies.
The data covers years 2010, 2011,2012, and 2013. Given the fact that corruption and rule
of law are slow changing, a combination of years is used to increase the number of
observations. For example, in Model 1, 2010 data is used, while in Model 2 the average of year
2010 and 2011 is used in order to increase the number of observations. The choice behind the
time period is the availability of the most recent data collected.
Problems Encountered
This study is a cross-sectional one. A drawback to using cross-sectional data is the
small numbers of observations available. Also the adjusted R2 is often times low. Rule of law
and corruption have become the focus and concern of politicians and citizens in general that
more and more studies are being made in order to determine the best ways to implement the
existing rules of law and the best ways to reduce corruption to a minimum. Thus, given that not
enough data is available to do a time series analysis, the method of choice is a cross-sectional
analysis. The number of observations in the models depends on the explanatory variables
used.
The first model, Model 1, uses corruption variables (See Appendix B), excluding
corruption perception index and bribe payers index. It is made up of twelve observations of

29
which 25% are African countries and 75% are from the rest of the world. The time period
covered in this model is 2010 for the independent variables. The time periods used in the
dependent variables are 2010 for gdp growth and gdp per capita and 2011 for ease of doing
business.
The second model, Model 2, uses rule of law variables, excluding the rule of law index.
The data used is the average of years 2010 and 2011 for each of the independent variables
except for Business Regulatory Environment (BRE), and Disclosure Index (DI), which covers
year 2011. The time periods used in the dependent variables are 2010 for gdp growth and gdp
per capita and 2011 for ease of doing business.
This model, rule of law, is made up of seventeen observations of which 70% are African
countries, 5% are Asian countries, and are 25% from the rest of the world.
The third model, Model 3, used corruption perception index for the year 2011, bribe
payers index for the year 2011, and rule of law index year for the year 2012-13 because that is
the only data available for download. The time periods used in the dependent variables are
2010 for gdp growth and gdp per capita and 2011 for ease of doing business.
A total of 24 observations out of 28 are utilized due to data availability. The countries
are those included in the Bribe Payers Index (see Appendix D). The sample is made up of
30.7% European countries, 26.9% Asian countries, 3.8% African countries, and 38.6% from the
rest of the World.
The fact that the Bribe Payers Index ranks only 28 of the world's largest economies
according to the perceived likelihood that companies from these countries pay bribes abroad,
restricts the number of observations in the study to 28. Another problem with BPI is that it
measures only the largest economies and those are mainly European countries, a select few are

30
Asian countries, Turkey and UAE. The other explanatory variables measure corruption and
rule of law in the Least Developed Countries as well as the Developing ones. The data is
obtained by Transparency International (TI) and is based on the views of surveyed business
executives.
The last model, Model 4, is made up of 178 observations (see Appendix C) and has the
following independent rule of law variables: Strength of legal rights index, time required to start
a business, and start-up procedure to register a business. The latter is made up of 13.5% Asian
countries, 27% African countries, 9% European countries, and 50.5% from the rest of the
world. The data used is the average of years 2010 and 2011.

31
CHAPTER 4
Results, Analysis, and Outcome of Regression Models
Results
As hypothesized previously in section two of this study, the scatter plots presented in
Appendix E show that the relationship between the dependent variable, Ease of Doing Business
(EDBI), and the independent variables Corruption Perception Index (CPI), Bribe Payers Index
(BPI), and Rule of Law (RoL) is negative in nature as shown in figures E1, E2, and E3
respectively.
Furthermore, there exist a negative relationship between GDP Growth (GDPG) and CPI,
BPI, RoL as shown in figures E5, E6, and E7 respectively. However, the relationship is
positive when it comes to GDP per Capita (GDPPC) and CPI, BPI, RoL as shown in figures E8,
E9, and E10.
As for the relationship between EDBI vs. GDPG and EDBI vs. GDPPC, the correlation is
positive in EDBI vs. GDPG and negative in EDBI vs. GDPPC as it is evident in figures E4 and
E11.
Analysis
The outcome of the observed relationships does verify that business friendly regulations
are conducive to growth and more likely to encourage foreign direct investments thereby
benefiting the economy on the macro level.
However, corruption and bribery have an inverse outcome in that it makes doing business
harder. The negative consequence that rule of law exhibits on ease of doing business can be
interpreted as too much bureaucracy and red tape which justifies the presence of corruption and
bribery.

32
One can infer that the presence of corruption and bribery give rise to discriminatory
behaviors. For example, a bribed official that creates barriers to entry to the market in order to
give existing and established firms monopoly power hence hindering if not eliminating
competition.
With that said, the negative relationship between the Ease of Doing Business
Index (EDBI) vs. Bribe Payers Index (BPI) and EDBI vs. Corruption Perception Index
(CPI) respectively, brings to the spotlight an empirical investigation of corruption and
product market competition [Alekseev and Song (2013)] in which they show, using firm
level information, that competition is associated with corruption. Also, Shleifer and
Vishny (1993) find that cost-reducing corruption is promoted by market competition.
Contrary to the latter is the finding of Ades and Di Tella (1999) and Emerson (2006),
which show that greater competition leads to less corruption.
One can deduce based on figures E1 and E2 that the presence of corruption and
bribery negatively impacts ease of doing business and thus hinders competition by
creating barrier to entry as a result of discriminatory behavior on the part of public
officials. With that said, bribery and corruption have a damaging effect on growth,
which is viewed as a negative externality on the macro level.
Furthermore, corruption is ambiguous, difficult to prove, and depends on various
factors like the information that unethical and corrupt public officials have on firms, the
probability of punishment for their unethical behavior, and technologies employed by firms to
name a few. Moreover, corruption could be coercive where it becomes a criminal behavior in
that it distorts prices, or could be collusive in that it results in cost reduction. In another word,

33
corrupt officials may exercise their power to limit competition in order to give incumbent firms
monopoly power and thus increasing the firm’s profit, which in turn can be extorted through
bribes. Moreover, the firm's decision to bribe or not to bribe still depends on the size of the
bribe and whether or not the amount requested is less than or greater than the rent the firm
receives. If the demand is greater than the profit earned, the firm exits the market. With that in
mind, the corrupt official has to have inside knowledge of the profit earned by the firm, a task
made easier with the presence of technology, social media, and voluntary information that
publicly traded corporations have to make available in order to satisfy investors.
The latter implies that the existence of corruption, bribery, and rule of law each have, to
some degree, restrictive characteristics with regards to the economy on the macro level.
However, the results can be interpreted such that corruption, bribery, and too much bureaucracy
benefit the economy on the micro level. Their presence increases the cost of doing business and
impedes growth in the economy on the macro level. Conversely, ease of doing business benefits
the economy on the macro level and hinders it on the micro level. So, if the goal is to improve
gdp growth then the focus should be on improving ease of doing business, but if the goal is to
improve gdp per capita then the focus should be on rule of law, corruption, and bribery.
Regression Models and Results
In the regression analysis, the coefficient represents the effect of a one-unit increase in the
independent variable on the dependent variable. For example, a popular variable used by many
of the World Bank studies is the percent of firms that make informal payments to public officials
(IPO) in order to facilitate their business affairs, like obtaining business licenses and speeding up
customs services to name a few. So a 1% increase in the number of firms that have to make
informal payments will have either a positive or negative effect on EDBI.

34
Model 1
A multiple linear regression model, Model 1, is used in order to quantify the strength or
existence of the relationship between the explained variable, EDBI and the explanatory variables
TAC, FGGMTO, FATMTO, IPO, and QPA.
The least squares approach is used in this instance resulting in the following estimated
equation, equation 1:
EDBI = 488.7461 – 28.1257TAC +0.119618FGGMTO – 18.783FATMTO
+1.144687IPO -91.2252QPA; (equa.1)
The regression specification tells us, based on the above equation, that a one unit increase
in TAC lowers EDBI by 28.1257 units, which is reasonable to say that if officials are held
accountable for their actions then more rules are followed and that will slow things down in terms of
doing business. In addition, a one-unit increase in FGGMTO increases EDBI by 0.119618 units, a
one-unit increase FATMTO lowers EDBI by 18.783 units, a one-unit increase in IPO increases
EDBI by 1.14468 units, and one unit increase in QPA decreases EDBI by 91.2252 units. EDBI
is predicted to be at 488.7461 if the explanatory variables used in this model are zero.
The intuitive assumptions made earlier are evident in equation (1), which shows that
transparency and bureaucracy restricts ease of doing business whilst payoff and bribery improves
it. However, to further solidify the results, it is important to test the overall fit of the model.
Thus, a look at the adjusted R2 tells us that only 64.18% of the variation in EDBI is explained by
the TAC, FGGMTO, FATMTO, IPO, and QPA. It is important to note that when cross-sectional
data is used, often times the produced R2 seem quite low.
Another tool to examine the fit of the model is to form and test a Null Hypothesis where
the Null states that TAC (β2), FGGMTO (β3), FATMTO (β4), IPO (β5), and QPA (β6) are not

35
associated with EDBI thus β2=β3=β4=β5=β6=0 and the alternative hypothesis which states that at
least one of the βs, is associated thus β2, β3, β4, β5 , β6, ǂ 0. In the summary output of the model the
Significance F = 0.038611 < 0.05 (confidence level). Thus, the Null hypothesis is rejected in
favor of the alternative. In other words, the model is statistically significant at least at the 95%
level.
Moreover, two other version of Model 1 using GDPG and GDPPC as the explained
variables result in the following Significance F: 0.14938 and 0.229206 respectively and leads us
to the conclude that Model 1 using GDPG and GDPPC as dependent variables are not
statistically significant. In other words we do not reject the Null Hypothesis and the parameters
are equal to zero. The two versions of Model 1 are not good models and therefore rejected.
Model 2
Model 2 analyses EDBI as the explained variable and TROOL, PR, PEC, SPRB, SLRI,
TRSB, DI, and BRE. The total number of observations is 17 and resulted in equation 2:
EDBI = 310.7624 – 0.203621TROOL +40.93676PR – 80.76985PEC
+ 2.655914SPRB - 0.82126SLRI - 0.052535TRSB – 2.756807DI – 19.50584BRE;
(equa.2)
The adjusted R2 = 0.72008 thus 72% of the variation in EDBI is explained by the selected
explanatory variables. The Significance F =0.009424 < 0.05 and that is a good fit.
Consequently the Null Hypothesis can be rejected in favor of the Alternative. The Null
Hypothesis and the Alternative take the same format as that of Model 1 except with added
parameters (8 in Model 2 as opposed to 5 in Model 1).
Moreover, two other versions of Model 2 using GDPG and GDPPC as the explained
variables result in the following Significance F: 0.493179 and 0.132067 respectively and leads us

36
to conclude that Model 2 using GDPG and GDPPC as dependent variables are not statistically
significant. In other words we do not reject the Null Hypothesis and the parameters are equal to
zero. The interpretation of the coefficients follows the same interpretation as in Model 1, where
a one unit increase in the explanatory variable results in either an increase or decrease in the
explained variable depending on the sign preceding it.
Model 3
Model 3 analyses EDBI as the explained variable and RoL, CPI, and BPI as the
explanatory variables. A total of 24 observations are used resulting in equation 3:
EDBI = 84.22905 – 50.4473RoL – 17.1286CPI + 12.54718BPI, (equa.3)
The adjusted R2 = 0.702029, thus 70% of the variation in EDBI is explained by the
selected explanatory variables. The Significance F =4.41E-06 < 0.05 and that is a good fit.
Accordingly the Null Hypothesis can be rejected in favor of the Alternative. The Null
Hypothesis and the Alternative take the same format as that of Model 1 except with fewer
parameters (3 in Model 3 as opposed to 5 in Model 1).
Additionally, two other versions of Model 3 using GDPG and GDPPC as explained
variables resulted in equations 4 and 5 respectively:
GDPG = 24.81993 – 38.0328RoL + 2.050634CPI – 1.07143BPI, (equa.4)
GDPPC= -32033.30 + 109280.6RoL + 1757.355CPI - 2651.78BPI, (equa.5)
With regards to GDPG, the adjusted R2 = 0.517557, which means that 52% of the variation in
GDPG is explained by RoL, CPI, and BPI. The Significance F = 0.000491 and is indicative of a
good fit given the small number of observations. The Null Hypothesis takes the same format as
in Model 1 and is rejected in favor of the Alternative. In other words, the model is statistically
significant at least at 95% confidence level.

37
With regards to GDPPC, the adjusted R2 = 0.826069, which means that 82.6% of the
variation in GDPPC is explained by RoL, CPI, and BPI. The Significance F = 2.15E-08 and is
indicative of a good fit. The Null Hypothesis takes the same format as in Model 1 and is rejected
in favor of the Alternative. In other words, the model is statistically significant at least at 95%
confidence level.
Model 4
Model 4 analyses EDBI as the explained variable and SPRB, SLRI, and TRSB as the
explanatory variables. A total of 178 observations are used resulting in equation 6:
EDBI = 93.35153 + 5.68496SPRB – 8.37992SLRI + 0.137056TRSB, (equa.6)
The adjusted R2 = 0.412586 thus 42% of the variation in EDBI is explained by the
selected explanatory variables. The Significance F =1.24E-20 < 0.05. Hence the Null
Hypothesis can be rejected in favor of the Alternative. The Null Hypothesis and the Alternative
take the same format as that of Model 1 except with fewer parameters (3 in Model 4 as opposed
to 5 in Model 1).
Although the model returned a good Significance F, one should keep in mind the low
adjusted R2, which means that Start-up Procedure to Register a Business, Strength of Legal
Rights, and Time Required to Start a Business are not sufficient to explain the variations in Ease
of Doing Business.
Moreover, two other versions of Model 4 using GDPG and GDPPC as the explained
variables result in the following Significance F: 0.608947 and 0.003983 respectively and leads us
to conclude that Model 4 using GDPG and GDPPC as dependent variables is not statistically
significant in terms of GDPG but statistically significant in terms of GDPPC. In other words,
with regards to GDPG we do not reject the Null Hypothesis and the parameters are equal to zero,

38
but with regards to GDPPC we reject the Null Hypothesis in favor of the Alternative. The
estimated regression equation with regards to GDPPC is equation 7:
GDPPC = 14027.62 – 976.554SPRB + 1273.624SLRI – 11.8137TRSB, (equa.7)
The interpretation of the coefficients follows the same interpretation as in Model 1, where
a one unit increase in the explanatory variable results in either an increase or decrease in the
explained variable depending on the sign preceding it.
A summary of all four models is presented in Table 1 below. It shows the adjusted R2
and the Significance F values, the number of observations in each model, the dependent variable
used in the model, and whether or not the model is jointly statistically significant using the
chosen variables. The abbreviations used for statistical significance are JSS for jointly
statistically significant at the 95% confidence level and NJSS for not jointly statistically
significant.

39
Table 1
Summary of results for Models 1 through 4: table 1 shows the adjusted R2, Significance F, and
Statistical significance.
Model # Number
of obs.
Dependent
variable
Adjusted R2 Significance F Statistical
Significance
1 12 EDBI 0.641833 0.038611 JSS
1 12 GDPG 0.402826508 0.14938 NJSS
1 12 GDPPC 0.289425 0.229206 NJSS
2 17 EDBI 0.72008 0.009424 JSS
2 17 GDPG 0.006237 0.493179 NJSS
2 17 GDPPC 0.390817 0.132067 NJSS
3 24 EDBI 0.702029 4.41E-06 JSS
3 24 GDPG 0.517557 0.000491 JSS
3 24 GDPPC 0.826069 2.15E-08 JSS
4 178 EDBI 0.412586 1.24E-20 JSS
4 178 GDPG -0.00664 0.608947 NJSS
4 178 GDPPC 0.057549 0.003983 NJSS

40
Table 2
Summary of coefficients of regression equations for Models 1 through 4. Note: figures in
parentheses beneath coefficients are t-statistic value. The * indicates a 95% significance level.
Model 1 Model 2 Model 3 Model 4
EDBI EDBI EDBI GDPG GDPPC EDBI
Constant 488.7461*
(2.829526)
310.7624*
(2.043216)
84.22905*
(0.982737)
24.81993*
(3.997618)
-32033.3*
(-1.17835)
93.35153*
(7.02661)
TAC -28.1257*
(-0.81251)
FGGMTO 0.119618*
(0.051094)
FATMTO -18.783*
(-1.66133)
IPO 1.133687*
(0.45585)
QPA -91.2252 *
(-1.47465)
TROOL -
0.203621*
(-0.21789)
PR 40.93676*
(0.559287)
PEC -
80.76985*
(-0.90628)
SPRB 2.655914*
(0.431127)
5.684916*
(5.121434)
SLRI -
0.821926*
(-0.24695)
-8.37992*
(-6.06288)
TRSB -
0.052535*
(-0.12589)
0.137056*
(2.303404)
DI -
2.756807*
(-0.28928)
BRE -
19.50584*
(-0.7491)
ROL -50.4473*
(-0.33698)
-38.0328*
(-3.50707)
109280.6*
(2.301446)
Table 2
(cont’d)
Model 1 Model 2 Model 3 Model 4

41
EDBI EDBI EDBI GDPG GDPPC EDBI
CPI -17.1286*
(-2.19497)
2.050634*
(3.627621)
1757.355*
(0.710009)
BPI 12.54718*
(0.819249)
-1.07143*
(-0.96574)
-2651.78*
(-0.54589)
n 12 17 24 24 24 178
Adj. R2
0.641833 0.72008 0.702029 0.517557 0.826069 0.412586
F-Statistic 4.942378 6.144899 19.06289 9.224683 37.41211 42.44022
Sig. F 0.038611 0.009424 4.41E-06 0.000491 2.15E-08 1.24E-20

42
CHAPTER 5
Conclusion
This paper investigates the impact of corruption and rule of law on ease of doing
business, gdp growth, and gdp per capita. Using the countries from the Bribe Payers Index
reduced the number of observations from 214 to 28 thereby limiting the sample size. Although
there are many variables that influence a country’s ease of doing business like political turmoil,
elections, uncertainties in the business environment, and the efficiency of the public sector to
name a few; the chosen explanatory variables that cover both corruption and rule of law did a
good job in explaining the variations in the case of ease of doing business, however not so well
in expressing the discrepancies in gdp growth and gdp per capita. Conversely, the use of Rule of
Law Index, the Corruption Perception Index, and the Bribe Payers Index showed the best results
in explaining the variations in all three: EDBI, GDPG, and GDPPC.
This analysis provides an overview that exposes the negative effect corruption, bribery,
and rule of law have on the ease of doing business in a country as well as on a country’s
economy on the macro level. It also shows the positive effect corruption, bribery, and rule of
law have on a country’s economy on the micro level. The World Justice Project measures the
actual degree that the rule of law is practiced in the surveyed countries; the same should apply to
corruption where the Index should be an actual measure rather than a perceived value. It is
understandable that it is hard to prove corruption and bribery as they are quite intangible and
consequences associated with it are severe and often time viewed as means to an end. The fact
that variation in ease of doing business, gdp per capita, and gdp growth using Rule of Law Index,
Corruption Perception Index, and Bribe Payers Index is explained 83% of the time, 70% of the
time, and 52% of the time respectively, shows the order of importance that scarce resources

43
should be allocated. It is clear that those benefiting on the micro level are without a doubt
multinational corporations and their followers, while society, as a whole does not benefit as
much. Thus, one can infer that corruption, bribery, and rule of law indices weigh heavily and
have a higher magnitude effect on ease of doing business and gdp per capita than on gdp growth.
Furthermore, if we are to improve gdp growth then examination of other factors such as
education, fertility rate, population rate, life expectancy, and productivity levels is recommended.
Although economic growth is influenced by many factors like productivity, population,
and education to name a few, in terms of this paper however, the focus is on rule of law,
corruption, and bribery and how they influence ease of doing business, gdp per capita, and gdp
growth. Thus, since rule of law can be viewed as a public good and thereby controllable, we
should think of it as a positive externality and make bureaucracy friendly to foreign investors and
locals alike. With that said, it is important to allocate our scarce resources toward the
improvement and simplification of rules and regulations in order to improve the economy on the
macro level via ease of doing business. As a result, although realistically speaking corruption
and bribery cannot be eliminated since they are tightly woven into the fabric we so call society,
friendly regulations will minimize corruption and bribery.
Since the chosen explanatory variables used in this paper proved to be imperfect in
measuring growth in all models except Model 4, a possible way to better examine potential
growth in a future paper is to use Cobb-Douglas production function Yp =AKα
pLβ
p
where α +β =1 represent constant return to scale and the assumption that A=ApCΘR
1-Θ where “C”
and “R” represent corruption and rule of law. The latter economic approach is used by the
European Unionxvi
and merits future consideration.
In conclusion, depending on which end of the spectrum one is and from what perspective

44
one looks at corruption and rule of law, both are viewed as externalities that can be either
characterized as positive or as negative.

45
i http://doingbusiness.org/rankings, the World Bank
ii Chad and Rwanda are considered one of the Least Developed Countries per the World Trade
Organization. http://www.wto.org/english/thewto_e/whatis_e/tif_e/org7_e.htm
iii The IMF considers Philippines, India, Brazil, South Africa, Thailand, and Malaysia Newly
Industrialized Economies. http://www.imf.org/
iv The World's Bank Country Policy and Institutional Assessment
v Trade openness is measured as (Export-Import)/ gdp
vi https://www.gov.uk/government/publications/graduates-and-economic-growth-across-
countries
vii http://www.transparency.org/cpi2011/interactive
viii http://bpi.transparency.org/bpi2011/
ix See Appendix D for the list of countries used in this study
x http://prairiepundit.blogspot.com/2008/04/high-cost-of-mordita-in-
mexico.html#!/2008/04/high-cost-of-mordita-in-mexico.html.
xi Transparency and Rule of Law in Latin America,
http://webharvest.gov/congress109th/20061114105003/http://www.internationalrelations.
house.gov/archives/109/21398.pdf
xii http://www.doingbusiness.org/
xiii http://databank.worldbank.org/data/views/reports/tableview.aspx, retrieved 10/24/2013
xivDatabank.worldbank.org/data/views/reports/tableview.aspx, retrieved 10/24/2013
xv http://www.bloomberg.com/news/2014-01-09/alcoa-pays-384-million-to-resolve-foreign-
bribery-probe.html

46
xvi Denis, Grenouilleau, Mc. Morrow, Röger, (2006). Calculating potential growth rates and
output gaps – A revised production function approach.
http://europa.eu.int/comm/economy_finance