Embed Size (px)
Citation preview

EASA AEMT Study of Motor Repair Impact on Efficiency
Thomas H. Bishop, Electrical Apparatus Service Association
ABSTRACT
Along with the growing use of energy efficient electric motors since the United States adoption of the Energy Policy Act (EPAct) in 1992, there have been widely varied claims about the effects of rewinding on electric motor efficiency. No comprehensive study was available to confirm or refute these claims for motors larger than 40 hp. The Electrical Apparatus Service Association (EASA), in conjunction with the Association of Electrical and Mechanical Trades (AEMT), undertook a scientific study to determine the effects of repair on the efficiency of larger electric motors. The study was divided into three parts, in order to compare various repair practices that might be encountered around the globe. Multiple rewinds were included in the study. The primary objective of this study was to determine the effect of rewinding/repair on motor efficiency. A secondary goal was to identify procedures that help maintain � or possibly improve � motor efficiency. The study involved measuring the efficiency, before & after rewind, of twenty-three motors ranging in size from 50 to 300 hp (37.5 to 225 kW). Testing was conducted in the United Kingdom at the University of Nottingham, with one motor tested at six different facilities to verify consistency of the test methods. Efficiency testing was performed in accordance with IEEE 112 Method B. This paper reports the results of the 2-year study, with detailed information about which practices do, and do not, affect efficiency. Introduction: Reasons for the Study
Claims that rewinding inevitably decreases the efficiency of induction motors are
mythic. Based in part on a handful of studies of mostly smaller motors (up to 30 hp or 22.5 kW), they often assert that efficiency drops 1% to 5% each time a motor is rewound. (See Table 1 for comparison of previous studies.)
The electric motor repair industry, led by EASA and AEMT, undertook the present study to find definitive answers to efficiency questions for customers and others. This research focused on motors with higher power ratings than those in previous studies (i.e., those most likely to be rewound). The results are based upon independent efficiency testing before and after rewinding.
A key finding of the study was that best rewind/repair procedures maintain motor efficiency within ± 0.2%. The multiple rewind stage of the study determined that on average efficiency improved 0.2% by following best practices.
4-34

Table 1. Empirical Studies Of Efficiency Loss During Motor Repair Study Sample Size Comments
McGovern (1984) 27 Motors ranged from 3 to 150 hp; wide range of motor age and rewind histories (General Electric)
Colby & Flora (1990) 4 Standard- and premium- efficiency 5-10 hp motors (North Carolina)
Zeller (1992) 10 Controlled test; identical 20 hp premium-efficiency motor shops (British Columbia)
Dederer (1991) 9 Controlled test; identical standard-efficiency motor shops (Ontario)
Ontario Hydro (1992) 2 Motors rewound four times each Reprinted from Energy-Efficient Motor Systems: A Handbook on Technology, Program and Policy
Opportunities, Second Edition. American Council for an Energy-Efficient Economy, 2002. Objectives of the Study
The major objectives of the study were to:
• Determine the impact of rewinding/repair on motor efficiency. • Investigate the impact of repeated rewinds on several motors. • Determine if the impact of rewinding on efficiency is similar for low- and medium-
voltage motors. • Identify and compile a set of rewind/repair procedures that maintain motor efficiency. • Determine if certain rewind/repair procedures could improve motor efficiency. • Identify and compile a set of best practices for motor rewinds.
The study also sought to:
• Determine the effect on motor efficiency if motors are rewound with no specific controls on stripping and rewind procedures.
• Evaluate the impact that physical damage to the stator core has on efficiency. • Correlate the results obtained with the running core loss test and static core loss tests. • Determine the effect of over-greased bearings on efficiency. • Determine the effect on efficiency when motors are rewound using different winding
configurations and slot fills. Scope of Product Evaluated
The study involved 23 motors ranging from 50 to 300 hp (37.5 to 225 kW) and included:
• 50 and 60 Hz motors. • Low- and medium-voltage motors. • IEC and NEMA designs. • Open dripproof (IP 23) and totally enclosed fan-cooled enclosures (IP 54). • 2- and 4-pole speeds.
4-35

Project Sponsors
The sponsors of the project were:
• Electrical Apparatus Service Association (EASA) • Association of Electrical and Mechanical Trades (AEMT) • British Nuclear Fuels (BNF) • United States Department of Energy (DOE) • Energy Efficient Best Practice Program (EEBPP), UK • Ministry of Defense Ships Support Agency (MoD SSA), UK • UK Water Industry Research Ltd. (UKWIR) Participating Manufacturers and Institutions
• Ten motor manufacturers provided motors, technical data and assistance for the
study: ABB, Baldor, Brook Crompton, GEC, Leeson, Reliance, Siemens, Toshiba, U.S. Electrical Motors and VEM.
• The Dowding and Mills facility in Birmingham, UK, carried out all motor rewinds and repairs.
• The University of Nottingham performed efficiency testing on their dynamometers in Nottingham, UK (see Figure 1).
Round Robin Testing and Test Protocol
To ensure accurate test results, a 30 kW Brook Crompton IEC motor was efficiency tested first by the University of Nottingham and then by three other test facilities. The other test facilities were: U.S. Electrical Motors, St. Louis, Missouri; Baldor Electric Co., Fort Smith, Arkansas; and Oregon State University, Corvallis, Oregon.
The IEEE 112 Method B (IEEE 112B) method of efficiency testing was used. All testing used the loss-segregation method (at no load and full load), which allowed for detailed analysis. Table 2 provides the test results for the 30 kW motor when tested at 50 and at 60 Hz. The average loss distribution at 60 Hz for all of the motors in the study is given in Table 3.
As a benchmark, the results were compared with those of round robin test programs previously conducted by members of the National Electrical Manufacturers Association (NEMA). Interestingly, the first NEMA tests were done without standardized test procedures and also yielded results that varied by 1.7 points of efficiency. This variation was subsequently reduced to 0.5 points of efficiency when NEMA members used standardized test procedures.
As Table 2 shows, the efficiency variation (per IEEE 112B) for the round robin tests of the 30 kW motor did not exceed 1.7 points. This was achieved without standardization and compares favorably with the results of the NEMA tests.
These results also show that the University of Nottingham�s testing protocol for determining the impact of rewinding on motor efficiency are in accord with approved industry practices and that the results obtained in this study are not skewed by the method of evaluation.
4-36
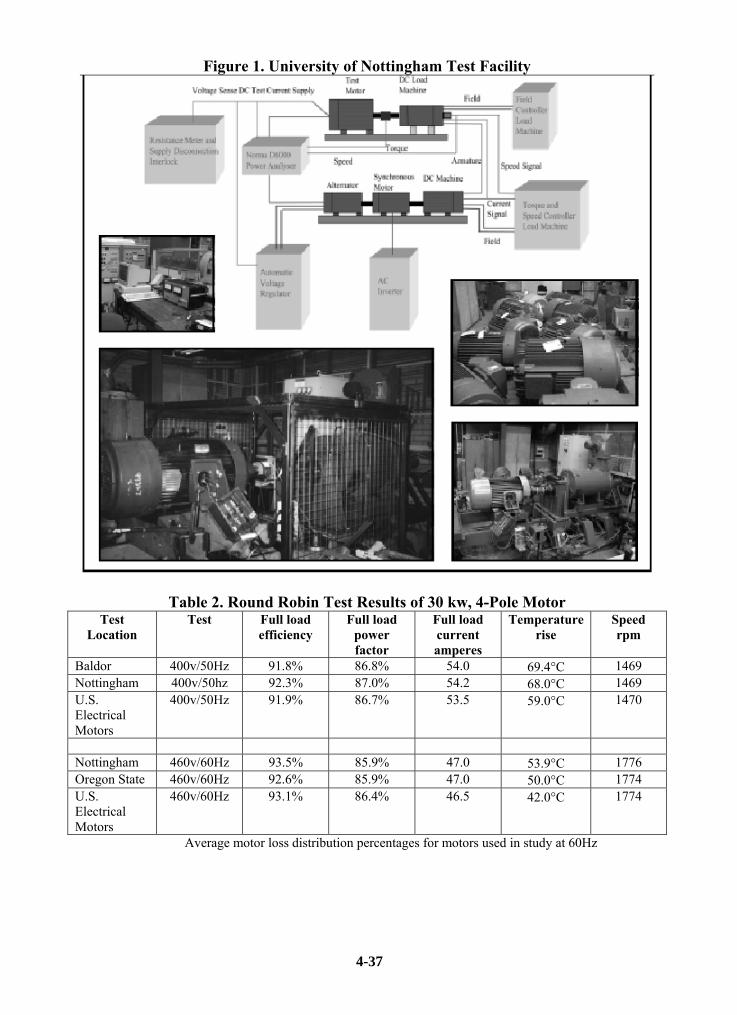
Figure 1. University of Nottingham Test Facility
Table 2. Round Robin Test Results of 30 kw, 4-Pole Motor Test
Location Test Full load
efficiency Full load
power factor
Full load current amperes
Temperature rise
Speed rpm
Baldor 400v/50Hz 91.8% 86.8% 54.0 69.4°C 1469 Nottingham 400v/50hz 92.3% 87.0% 54.2 68.0°C 1469 U.S. Electrical Motors
400v/50Hz 91.9% 86.7% 53.5 59.0°C 1470
Nottingham 460v/60Hz 93.5% 85.9% 47.0 53.9°C 1776 Oregon State 460v/60Hz 92.6% 85.9% 47.0 50.0°C 1774 U.S. Electrical Motors
460v/60Hz 93.1% 86.4% 46.5 42.0°C 1774
Average motor loss distribution percentages for motors used in study at 60Hz
4-37

Table 3. Typical Horizontal TEFC Motor Losses Losses 2 pole average 4 pole average Factors affecting losses
Core losses 19% 21% Electrical steels, air gap, saturation
Friction and windage losses
25% 10% Fan efficiency, lubrication, bearing
Stator I2R losses 26% 34% Conductor area, mean length of turn, heat dissipation
Rotor I2R losses 19% 21% Bar and endring area and material
Stray load losses 11% 14% Manufacturing processes, slot design, air gap
AC Squirrel Cage Induction Motor Load Testing: Comparison of IEC 60034-2 and IEEE 112-1996 Standards
The most significant difference between IEC 60034-2 and IEEE 112B standards with
regard to motor efficiency is the way they handle stray losses. IEEE 112B calculates the stray losses by loss separation at no load and at different load points with input and output power measurement. IEC 60034-2, using input power measurement only, separates the losses at no load but assumes 0.5% of input power as stray losses. So essentially, IEEE 112B is the more stringent standard. (For an example of IEEE 112B, see Appendix, Item 1.)
For instance, using the IEC 60034-2 method as opposed to IEEE 112B could overstate the reported efficiency by 0.5% to 1.5%, depending upon what percentage the stray losses are of the total losses. In reality, the efficiency of the machine is always the same; only the calculated efficiency changes. Given the impact of certain repair practices on stray losses that would not be identified by the IEC 60034-2 test method, the study participants determined that the IEEE 112B method was more accurate. Stator Core Loss Analysis
One objective of the study was to correlate the actual stator core loss as tested in accordance with IEEE 112B and the results obtained with various test methods used by the service centers to determine the condition of the stator core before and after rewind. The test methods evaluated were the loop test and two commercial devices from different manufacturers.
The evaluation was inconclusive, based on the following:
• Results obtained with the three test methods varied significantly. • In some cases test data showed a drop in core loss after rewind. • Some difficulty in operating the commercial testers may have contributed to the
erratic results. • The sample size was too small to draw any accurate conclusions.
4-38

Accurate comparison of commercial testers and the IEEE loop test method will require additional testing and evaluation. Stray Loss Analysis
This study was conducted in three stages: 6 motors were stripped and rewound in Stage 1; 10 low- and medium-voltage motors and 1 high-voltage motor were stripped and rewound in Stage 2; and in Stage 3, 4 motors were stripped and rewound multiple times, and 2 motors were burned out 5 times and then rewound. Test results for all three stages are provided in Table 4.
Stage 1. A low burnout temperature of 660° F (350° C) was used, which made it difficult to remove the coils and clean the slots. This resulted in mechanical damage to the stator core (e.g., flared teeth at the ends of the stator laminations), which increased the pulsating or zig-zag losses. The result was that stray load losses increased significantly for these machines. No attempt to control winding resistance was made for the 6 machines rewound in Stage 1.
Stage 2. The burnout temperature was increased to 680° F (360°C), which made the coils easier to remove and required less cleaning of the stator slots. The winding resistance of the new coils also was controlled to avoid appreciable increases in stator I2R losses.
Stage 3. The burnout temperature and the winding resistance controls were the same as in Stage 2.
Table 4. Test Results Stage 1: Motors rewound with no specific control on stripping or rewind
Motor description
Efficiency before rewind
Efficiency after
rewind
Efficiency change*
Winding before
Winding after
Comments
-1.0% Bearings regreased -0.8% Drive end bearing
cleaned -0.6% Both bearings
cleaned
1A 100hp, 60Hz, 4 pole
94.1% 93.1%
-0.5%
3TC-1L 3TC-1L
Bearings changed 2B 100 hp, 60Hz, 4 pole
92.9% 92.4% -0.5% L-2L L-2L 575 volt machine
-1.0% Bearings regreased -0.5% Drive end bearing
cleaned
3C 100 hp, 60Hz, 2 pole
94.5% 93.5%
-0.5%
GC-2L L-2L
Both bearings cleaned
4D 100 hp, 60Hz, 2 pole
95.0% 94.5% -0.5% L-2L L-2L ___
5E 150 hp, 60Hz, 2 pole
92.3% 92.0% -0.3% L-2L L-2L ___
7B 150 hp, 60Hz, 2 pole
93.7% 93.3% -0.4% L-2L L-2L ___
4-39
Stage 2: Motors rewound with control on rewind process Motor
description Efficiency
before rewind
Efficiency after
rewind
Efficiency change*
Winding before
Winding after
Comments
6F 150 hp, 60Hz, 2 pole
94.4% 94.3% -0.1% L-2L L-2L ___
9E 60 hp, 60Hz, 2 pole
90.1% 89.9% -0.2% L-2L L-2L No core cleaning
10D 125 hp, 60Hz, 4 pole
95.4% 95.2% -0.2% L-2L L-2L ___
11F 200 hp, 60Hz, 2 pole
96.4% 96.3% -0.1% L-2L L-2L ___
14H 55 kW, 50Hz, 4 pole
89.9% 89.2% -0.7% 2TC-1L L-2L Defective core (OEM)
16H 150 kW, 50Hz, 4 pole
95.4% 95.6% +0.2% GC-2L L-2L ___
18G 55 kW, 50Hz, 4 pole
94.2% 94.2% 0.0% 3TC-1L 3TC-1L ___
19H 132 kW, 50Hz, 2 pole
93.0% 93.0% 0.0% 3TC-2L L-2L ___
20H 45 kW, 50Hz, 2 pole
93.9% 93.9% 0.0% 3TC-1L 3TC-1L ___
21J 75 kW, 50Hz, 2 pole
93.7% 93.9% +0.2% GC-2L L-2L ___
23K 225 kW, 50Hz, 4 pole
95.7% 95.5% -0.2% L-2L L-2L 3300 volt motor
Stage 3: Multiple rewinds under controlled conditions
Motor description
Efficiency before rewind
Efficiency after
rewind
Efficiency change*
Winding before
Winding after
Comments
95.1% -0.6% GC-1L 1st rewind 8C 200hp, 60Hz, 4 pole
95.7%
95.6% -0.1%
GC-2L
L-2L 2nd rewind
95.9% 0.0% L-2L 1st rewind 95.9% 0.0% L-2L 2nd rewind
12F 150 hp, 60Hz, 2 pole
95.9%
95.8% -0.1%
L-2L
L-2L 3rd rewind 94.6% -0.2% 3TC-1L 1st rewind 13G 110 kW,
50Hz, 4 pole 94.8%
94.6% -0.2%
3TC-1L
GC-1L 2nd rewind
93.6% +0.6% L-2L 1st rewind 93.6% +0.6% L-2L 2nd rewind
15J 75 kW, 50Hz, 4 pole
93.0%
93.7% +0.7%
GC-2L
L-2L 3rd rewind 17H 5.5 kW, 50Hz, 4 pole
86.7% 86.9% +0.2% 2TC-1L L-2L 5 burnouts at 360° C, one rewind only
22H 5.5 kW, 50Hz, 4 pole
83.2% 84.0% +0.8% 2TC-1L L-2L 5 burnouts at 360° C, one rewind only
* Each of the percent changes is relative to the �before rewind� efficiency.
4-40

Key to winding configuration abbreviations: 3TC-1L Three tier concentric 1 coil side per slot 2TC-1L Two tier concentric 1 coil side per slot 2TC-2L Two tier concentric 2 coil sides per slot L-2L Lap winding 2 coil sides per slot GC-2L Concentric coil groups placed in slots in rotational sequence 2 coil sides per slot GC-1L Concentric coil groups placed in slots in rotational sequence 1 coil side per slot Loss Analysis
• The efficiency variation for Stage 1 ranged from -0.3% to -0.5%. • The efficiency variation for Stage 2 ranged from -0.7% to +0.2%. • The efficiency variation for Stage 3 ranged -0.6 to +0.8%. • The losses affected were:
o Copper loss�Due to lack of control of mean length of turn. o Stray loss�Due to stripping damage but influenced by tooth design. o Core loss�Due to burn-out process. o Friction loss�Due to over-greasing bearings.
• The best results were obtained in Stages 2 and 3 when process controls were implemented.
• Stripping the motor, if burned out at too low a temperature, may increase the stray loss.
• Copper content of winding, coil geometry and winding pattern must be controlled to reduce stator I2R losses.
Recommendations
The following are some recommendations that can help repairers maintain the
efficiency of rewound motors. These are based on best practices that were followed during the course of the study. The results of some of the objectives of the study served to reinforce a number of the recommendations. Burnout Process
It is important that this process be tightly controlled (see Figure 2). During the study it was found that burning out at a temperature below 680° F (360° C) may not adequately break down the varnish, requiring more force to remove the coils. The additional force could cause mechanical damage (e.g., splayed teeth) that will increase the stray losses. Further, it was found that burning out at more than 680° F (360° C) for organic coreplate or 750° F (400° C) for inorganic coreplate may increase the risk of damaging the interlaminar insulation and increase the core losses if the interlaminar insulation is not inorganic coreplate material.
4-41

Figure 2. Burnout Oven With Temperature Suppression Controls
Coil Removal
Cutting the endwinding with an air chisel resting against the core end laminations or causing the end laminations to flare when pulling the coils out of the slot will increase the stray losses. The study found that flared endwindings increased the stray losses. Conductor Cross-Sectional Area
When changing wire gauge due to stock availability never reduce cross-sectional area, as this will increase stator I2R losses. Require that the cross-sectional area be increased whenever possible to reduce stator I2R losses (see Figure 3). Fewer wires of larger diameter in parallel may be preferable to a larger number of smaller gauge wires with the same cross-sectional area.
Figure 3. Examples Of Slot Fill
Poor slot fill Good slot fill
Mean Length of Turn
Failure to control mean length of turn (MLT) may increase stator I2R losses. Whenever possible, decrease the MLT to reduce stator I2R losses. Reduce the straight section of the coil where it exits the slot to the minimum required for the slot liner cuff or tracking length. Keep coil extensions as short as possible.
4-42

Changing Winding Configuration
Do not change a two-layer winding to a single-layer winding. This may appear attractive since there are half the coils to wind and connect. However, this could increase stator I2R losses and will increase stray losses. Any winding change should not increase stator I2R losses, core losses or stray losses. Suitably trained personnel should control all winding conversions.
Bearing Lubrication
Over-lubrication of bearings will increase friction losses and shorten bearing life. Increased friction losses due to over-lubrication were detected in the study. Mixing incompatible greases will increase friction losses and impair lubrication. Use sealed-for-life bearings (do not replace open or shielded bearings with sealed bearings unless they are the non-contact type) or open bearings with manufacturer�s recommended grease fill. Ensure that bearings have the same internal clearance as original bearings (for example, C3). Decreasing the clearances could increase the friction losses. (See Appendix, Item 3.) Fans
Replacing a fan with one of a different design than the original could increase windage losses, temperature rise and I2R losses. Replacement fans should be interchangeable and meet the designer�s original intent. Catastrophic Damage
It may be unwise to repair motors with catastrophic damage (see Figure 4) since there
could be a reduction in efficiency. The customer�s operational needs, however, may necessitate the repair even though they are aware that there may be a reduction in efficiency. The cost of lost production may greatly exceed the cost of lower efficiency. In such cases encourage the customer to purchase a new motor as soon as practical after the repair.
Figure 4. Two Examples Of Catastrophic Winding Damage
4-43
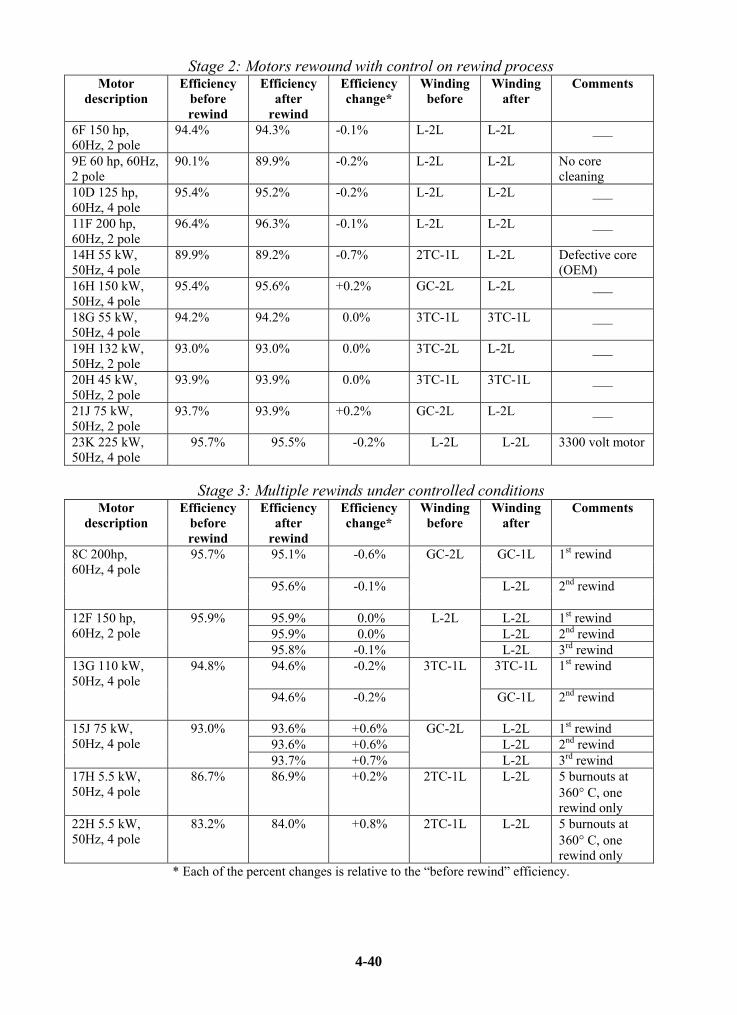
Core Losses
Due to the wide variety of electrical magnetic steels used by manufacturers, it is impossible to set rigid rules for core test acceptance. However, measuring core loss before burnout and after core stripping and cleaning will identify significant increases in core losses. (See Appendix, Item 4.)
Efficiency Improvements
One of the easiest ways to improve motor efficiency is to increase the relative slot fill (conductor cross-sectional area) of stators originally wound with low or moderate slot fills. Table 5 shows examples where efficiency could be improved.
Table 5. Random Wound, 4 Pole, Lap Windings, Open Dripproof, Pre-Epact Efficiencies
Frame Horsepower Space factor*
Full load efficiency
Nominal nameplate efficiency
EPAct** efficiency
Original 365T 75 48% 92.7% 92.4% 94.1% Rewound 59% 93.7%
Original 404T 100 39% 92.7% 92.4% 94.1% Rewound 60% 94.1%
Original 405T 125 43% 93.4% 93.0% 94.5% Rewound 59% 94.3%
Original 444T 150 58% 93.9% 93.6% 95.0% Rewound 63% 94.1%
Original 445T 200 55% 94.1% 94.1% 95.0% Rewound 63% 94.1%
*Space factor is the percentage of wire conductor area versus available slot space. **EPAct is the U.S. Energy Policy Act of 1992 (federal law) mandating minimum energy efficiency levels for manufactured electric motors. Conclusion
This study has taken almost 4 years to complete, and has been the work of a team that
included leading international personnel from academia and industry. The primary finding was that the results demonstrate clearly that motor efficiency can be maintained during repair provided service centers follow the best practices that were identified in the course of the study. It was also found that multiple rewinds do not have a cumulative impact on repaired motor efficiency.
4-44

References
Bonnett, A. and Yung, C. 2001 Guidelines for Repair/Replace Decisions and Performance Optimization. Electrical Apparatus Service Association (EASA).
EASA Standard AR100-1998: Recommended Practice for the Repair of Rotating Electrical
Apparatus. Electrical Apparatus Service Association. IEC 60034-2: Rotating electrical machines. Part 2: Methods for determining losses and
efficiency of rotating electrical machinery from tests (excluding machines for traction vehicles). International Electrotechnical Commission.
IEEE Std 112-1996: IEEE Standard Test Procedure for Polyphase Induction Motors and
Generators. Institute of Electrical and Electronics Engineers (IEEE). Good Practice Guide. 1998 The Repair of Induction Motors�Best Practices to Maintain
Energy Efficiency. Association of Electrical and Mechanical Trades. Nadel, S.; Elliott, R.N.; Shepard, M.; Greenberg, S.; Katz, G. and Almeida, A.T. 2001.
Energy-Efficient Motor Systems: A Handbook on Technology, Program, and Policy Opportunities. American Council for an Energy-Efficient Economy.
The Repair of Induction Motors. 1998. Best Practices to Maintain Energy Efficiency.
Association of Electrical and Mechanical Trades (AEMT).
4-45
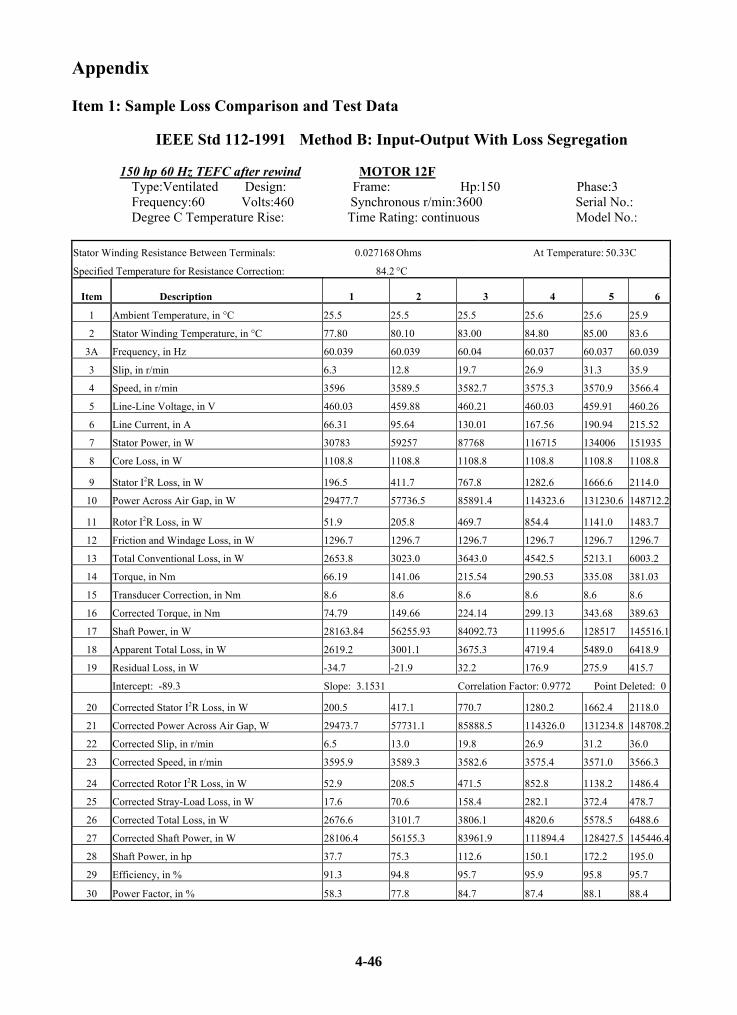
Appendix Item 1: Sample Loss Comparison and Test Data
IEEE Std 112-1991 Method B: Input-Output With Loss Segregation
150 hp 60 Hz TEFC after rewind MOTOR 12F
Type:Ventilated Design: Frame: Hp:150 Phase:3 Frequency:60 Volts:460 Synchronous r/min:3600 Serial No.: Degree C Temperature Rise: Time Rating: continuous Model No.:
Stator Winding Resistance Between Terminals: 0.027168 Ohms At Temperature: 50.33C
Specified Temperature for Resistance Correction: 84.2 °C
Item Description 1 2 3 4 5 6
1 Ambient Temperature, in °C 25.5 25.5 25.5 25.6 25.6 25.9
2 Stator Winding Temperature, in °C 77.80 80.10 83.00 84.80 85.00 83.6
3A Frequency, in Hz 60.039 60.039 60.04 60.037 60.037 60.039
3 Slip, in r/min 6.3 12.8 19.7 26.9 31.3 35.9
4 Speed, in r/min 3596 3589.5 3582.7 3575.3 3570.9 3566.4
5 Line-Line Voltage, in V 460.03 459.88 460.21 460.03 459.91 460.26
6 Line Current, in A 66.31 95.64 130.01 167.56 190.94 215.52
7 Stator Power, in W 30783 59257 87768 116715 134006 151935
8 Core Loss, in W 1108.8 1108.8 1108.8 1108.8 1108.8 1108.8
9 Stator I2R Loss, in W 196.5 411.7 767.8 1282.6 1666.6 2114.0
10 Power Across Air Gap, in W 29477.7 57736.5 85891.4 114323.6 131230.6 148712.2
11 Rotor I2R Loss, in W 51.9 205.8 469.7 854.4 1141.0 1483.7
12 Friction and Windage Loss, in W 1296.7 1296.7 1296.7 1296.7 1296.7 1296.7
13 Total Conventional Loss, in W 2653.8 3023.0 3643.0 4542.5 5213.1 6003.2
14 Torque, in Nm 66.19 141.06 215.54 290.53 335.08 381.03
15 Transducer Correction, in Nm 8.6 8.6 8.6 8.6 8.6 8.6
16 Corrected Torque, in Nm 74.79 149.66 224.14 299.13 343.68 389.63
17 Shaft Power, in W 28163.84 56255.93 84092.73 111995.6 128517 145516.1
18 Apparent Total Loss, in W 2619.2 3001.1 3675.3 4719.4 5489.0 6418.9
19 Residual Loss, in W -34.7 -21.9 32.2 176.9 275.9 415.7
Intercept: -89.3 Slope: 3.1531 Correlation Factor: 0.9772 Point Deleted: 0
20 Corrected Stator I2R Loss, in W 200.5 417.1 770.7 1280.2 1662.4 2118.0
21 Corrected Power Across Air Gap, W 29473.7 57731.1 85888.5 114326.0 131234.8 148708.2
22 Corrected Slip, in r/min 6.5 13.0 19.8 26.9 31.2 36.0
23 Corrected Speed, in r/min 3595.9 3589.3 3582.6 3575.4 3571.0 3566.3
24 Corrected Rotor I2R Loss, in W 52.9 208.5 471.5 852.8 1138.2 1486.4
25 Corrected Stray-Load Loss, in W 17.6 70.6 158.4 282.1 372.4 478.7
26 Corrected Total Loss, in W 2676.6 3101.7 3806.1 4820.6 5578.5 6488.6
27 Corrected Shaft Power, in W 28106.4 56155.3 83961.9 111894.4 128427.5 145446.4
28 Shaft Power, in hp 37.7 75.3 112.6 150.1 172.2 195.0
29 Efficiency, in % 91.3 94.8 95.7 95.9 95.8 95.7
30 Power Factor, in % 58.3 77.8 84.7 87.4 88.1 88.4
4-46

Summary of Characteristics 1 Load, in % of Rated 25 50 75 100 115 130
1A Precise Load, in % of Rated 25.1 50.2 75.1 100.0 114.8 130.0 2 Power Factor, in % 58.3 77.8 84.7 87.4 88.1 88.4 3 Efficiency, in % 91.3 94.8 95.7 95.9 95.8 95.7 4 Speed, in r/min 3596 3589.5 3582.7 3575.3 3570.9 3566.4 5 Line Current, in A 66.31 95.64 130.01 167.56 190.94 215.52
This is typical data obtained for each of the before and after rewind testing done at the University of Nottingham. Item 2: Impact of Controlling End Turn Length
Since the stator loss (I2R) can be the largest loss (ranging from 30% to 45% for the
motors in the study), it is critical to control the length of end turns. In Stage 1 of this study, no particular emphasis was placed on this factor, and in many cases the stator losses increased after the rewind. In Stages 2 and 3, controls were used to assure that the rewound coils closely replicated or improved on the original designs. The results were that the stator loss was equal to or lower than the original loss prior to rewind.
Data for six example motors (see accompanying tabulation) illustrates the impact that a 10% change in end turn length�approximately a 5% change in mean length of turn (MLT)�has on motor efficiency for typical TEFC motors. Also note that, in those cases where it was feasible, a reduction in MLT improved the efficiency over the nominal value.
Item 3: Impact of Too Much Bearing Grease
A number of tests conducted over the years illustrate the impact of over-greasing of bearings on the friction losses. On two of the units tested in Stage 1, grease was added to the bearings after rewinding. On all other motors tested no change was made to the lubrication. As expected, the bearing friction loss increased on the regreased motors. The impact on the efficiency of the respective motors was -0.3% and -0.5%. Item 4: Electrical Steel Considerations
The ability to maintain efficiency or to minimize any depreciation in efficiency when
rewinding a motor is directly tied to the quality of the stacked stator core and its laminations. The following factors may affect the quality of the laminations:
• Shape and rigidity (thickness and width of laminations) of teeth and back iron. • The quality of the interlaminar insulation. • Damage to laminations caused by the motor failure. • Damage to interlaminar insulation caused by the burn out process. • Damage caused by the removal of coils from the slots. • Damage due to excessive grinding and filing on the laminations.
4-47
The motor industry uses a wide variety of electrical steels, so it is difficult to generalize their characteristics. Some of the most common differences include:
• Fully processed vs. semi-processed steel. • Carbon vs. silicon steel content. • Grain orientation or non-orientation. • Hysteresis and eddy current losses range from 1.5 to 6 watts/lb (3.3 to 13.2 watts/kg). • Thickness ranges from .015� to .035� (.4 to .9 mm). • Interlaminar insulation (core plate) materials range from C-0 to C-5. Special Issues
• Semi-processed steels are usually good candidates for oven burnouts. • Safe burnout temperature depends on the inter-laminar insulation. Differences in
available NEMA and IEC steels complicate this discussion, but the quality of the interlaminar insulation is the key issue. Laminations coated with organic material (varnish, resin) can usually be safely burned out at temperatures up to 680° F (360° C). Laminations with substantial inorganic coating (phosphate, oxide) can be safely burned out at temperatures up to 750° F (400° C). There are lower grade lamination insulation processes, such as steam-bluing and water-borne varnishes, that require extreme caution. Careful inspection of the laminations may offer some clue as to the type of coating, but when in doubt, the safest course is to contact the motor manufacturer.
• Burnout temperatures that are too low may lead to lamination damage if additional procedures are needed to remove the coils or clean the slots.
• Thin laminations and narrow or unsupported teeth are more susceptible to tooth distortion than other designs.
• Laminations that have significant damage and hot spots may not be good candidates for rewind, particularly when efficiency is a major consideration.
Item 5: Levels of Repair
When there is irreparable damage, not all motors can be restored to their original
efficiency levels. Motors that require Levels 1 through 3, as outlined below, usually can be rebuilt and maintain their original efficiencies. Motors that require Levels 4 and 5 repairs should be evaluated individually based on the amount of damage that cannot be completely repaired.
Level 1: Basic reconditioning. Includes replacing bearings, cleaning all parts and replacing lubricant. Also adds seals and other accessories as agreed with customer.
Level 2: Includes Level 1 with the addition of varnish treatment of stator windings, repair of worn bearing fits and straightening of bent shafts.
4-48

Level 3: Includes Level 1 as well as rewinding the stator (replacing windings and insulation).
Level 4: Includes rewinding of the stator plus major lamination repair or rotor rebarring. May include replacement of the stator laminations or restacking of laminations. Shaft replacement would normally fall into this category. In short, Level 4 involves major repairs that are costly enough to justify examining the option of replacement.
Level 5: Motors that would normally be replaced except for special circumstances faced by the customer (i.e., no spare or unacceptable lead time for a replacement). Level 5 includes misapplied motors, inadequate enclosures and pre U-frame motors; and motors that should be replaced, if not for the owner�s inability to operate without them.
As these five levels imply, the damage resulting from a motor failure varies widely,
as do the associated repair costs. An evaluation process that fails to consider the various levels of �repair� is too simplistic to yield an accurate assessment.
4-49