Embed Size (px)
Citation preview

EARTO Annual Conference
“Innovation in SME’s”
Lisbon, 3 March 2006
Lino Gomes Fernandes

Evolution of total R&D spending, at constant prices, by sector of execution (1982-2001)
0
50 000
100 000
150 000
200 000
250 000
300 000
350 000
1982 1984 1986 1988 1990 1992 1995 b) 1997 1999 2001 Years
Thousand Euros
Enterprises
State
Higher Education
Public Non Profit
“Innovation in SME’s”

Business R&D Annual growth rate, 1995-2001
(1995 PPP dollars)
0,0 2,0 4,0 6,0 8,0 10,0 12,0 14,0 16,0 18,0 20,0
France (1997-2001)
Italy
Netherlands (1996-2001)
Germany
EU
Norw ay
Belgium (1995-2000)
Ireland
Sw eden
Spain
Austria (1993-1998)
Denmark (1995-1999)
Greece (1995-1999)
Finland
Portugal
EU
Co
un
trie
s
Annual growth rate, 1995-2001
OECD Science, Technology and Industry Scoreboard 2003 - Towards a knowledge-based economy
“Innovation in SME’s”

Favorable Evolution of the Technological BalanceDegree of Coverage of External Balances
0,00
0,10
0,20
0,30
0,40
0,50
0,60
0,70
0,80
1996 1997 1998 1999 2000 2001 2002
Year
Ex
po
rts
/Imp
ort
s
Merchandise Trade Balance
Technological Balance
“Innovation in SME’s”

Distribution of Enterprises between “Traditional R&D Executers” and “New” according to Type and Source of
Capital
Traditional R&D Executers
“New”
SMEs 56% 70%
Large National Groups
13% 7%
Public Enterprises 10% 5%
Foreign Enterprises
21% 18%
100% 100%
Source: Science & Technology Observatory
“Innovation in SME’s”

11%
15%
23%
32% 18%
0%
5%
10%
15%
20%
25%
30%
35%
0% 5% 10% 15% 20% 25% 30% 35% 40%
Spending A.G.R.
11%
15%
A.G
.R o
f R
esea
rch
ers
(FT
E)
SME
Large National Groups
Public Enterprises
Foreign Enterprises
SME Groups
2001
Types of Enterprise According to Source of Capital – A.G.R. of R&D Spending and Researchers (1995 – 2001), Weight of Spending on R&D
Source: Science & Technology Observatory
“Innovation in SME’s”

Growth of Innovative Enterprises
fostered by the organisation of SME´s into Enterprise Groups
Total Small Medium LargeCIS 3 13% 6% 29% 67%CIS 2 12% 6% 17% 50%
ServicesTotal Small Medium Large
CIS 3 26% 21% 49% 76%CIS 2 19% 15% 46% 62%
Portugal
CIS3, Eurostat
Manufacturing
Enterprises that integrate an Economic Group (%)
Total Small Medium LargeCIS 3 12% 7% 30% 76%CIS 2 15% 7% 28% 73%
Spain
Enterprises that intgrate an Economic Group (%)
Spain: Processing Industry
SME Groups
“Innovation in SME’s”

Increase of the Number of Innovative Enterprises
“Innovation in SME’s”

37%
31%32%
24%
52%
37%
49%
15%
7%
4%
25%
0%
10%
20%
30%
40%
50%
60%
SME SME Groups Large National Groups Public Enterprises Foreign Enterprises Total
% Enterprises without support Distribution of Enterprises without support
Percentage of “Traditional” R&D Performers and “New” Enterprises without Public Support and their Distribution by Category
and Source of Capital
“Innovation in SME’s”
Source: OCES -Science & Technology Observatory

Intramural R&D Activity
Portugal Spain continuously engaged in intramural R&D 26,5% 47,7% occasionally engaged in intramural R&D 73,5% 52,3%
Enterprises with innovation activitiesEnterprises, engaged in intramural R&D
CIS 3
“Innovation in SME’s”

Public Support for the promotion of Cooperation towards Innovation
Group Enterprises
Suppliers Customers Competitors ConsultantsR&D
EnterprisesUniversities
State Labs., Non-Profit
Organisations
With Public Support 27% 27% 49% 46% 42% 52% 74% 72% 81%Without Public Support 73% 73% 51% 54% 58% 48% 26% 28% 19%
Total100% 100% 100% 100% 100% 100% 100% 100% 100%
Source: CIS 3; OCES(Sample File)
No Cooperation
Cooperation with:
Cooperation with National Entities
“Innovation in SME’s”

... with International Entities
Group Enterprises
Suppliers Clients Competitors ConsultantsR&D
EnterprisesUniversities
State Labs.,
Non-Profit
National27% 49% 46% 42% 52% 74% 72% 81%
EU/EFTA43% 59% 66% 78% 60% 85% 93% 75%
Source: CIS 3; OCES(Sample File)
Cooperation with:
Cooperation with National Entities and EU/EFTA - Percentage of Enterprises with Public Support
Public Support for the promotion of Cooperation towards Innovation
“Innovation in SME’s”

Distribution of Spin-offs by Founding Date
Source: OCES (preliminary data), 2006
5%
14%
26%
56%
0%
10%
20%
30%
40%
50%
60%
1980-1990 1990-1995 1995-2000 2000-2005
Nº
“Innovation in SME’s”
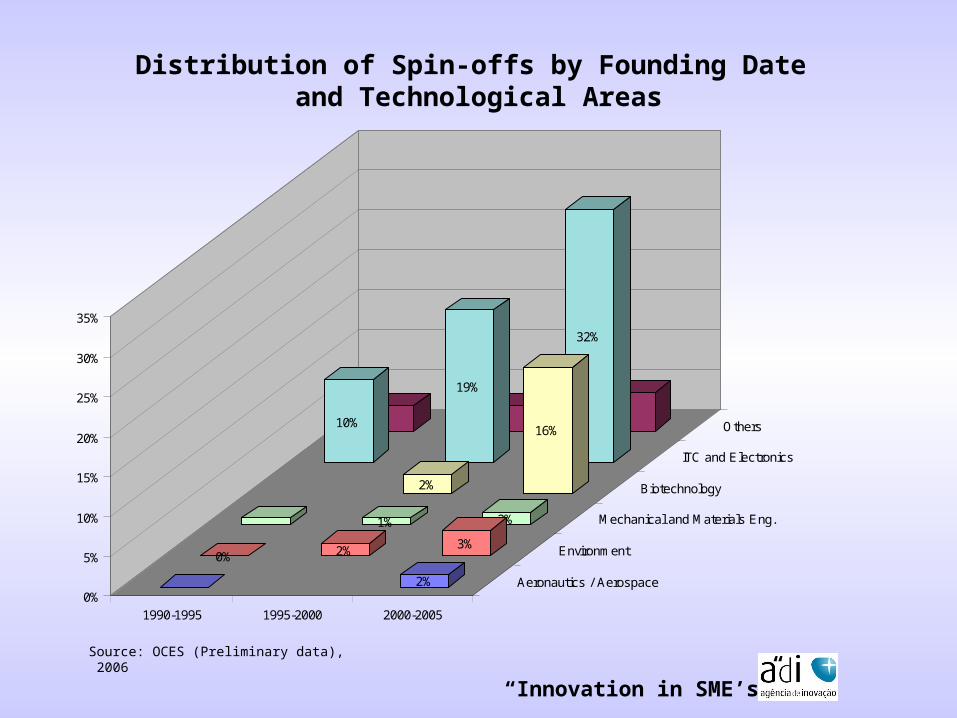
Distribution of Spin-offs by Founding Date and Technological Areas
10%
19%
32%
2%
16%
1% 2%
0% 2% 3%
2%0%
5%
10%
15%
20%
25%
30%
35%
1990-1995 1995-2000 2000-2005
Aeronautics / Aerospace
Environment
Mechanical and Materials Eng.
Biotechnology
ITC and Electronics
Others
Source: OCES (Preliminary data), 2006
“Innovation in SME’s”

NEOTEC Program – New Technology Based Enterprises
Application Sectors
Source: AdI, 2006
Agro, Food, Forest 13%
Transforming Industry 29%
Construction 8%
Internet 13%
Health 17%
Tourism 8%
Other Services 8%
Productive Means 96%
Consumer Goods 4%
Total 100%
“Innovation in SME’s”