Embed Size (px)
Citation preview

Earth’s Changing EnvironmentLecture 13Energy Calculation Review& Some Important Quantities.

Per Capita Value
Compare the per capita energy consumption in the US with per capita energy consumption in China.
US: 97 x 1015 Btu/ 284x106 = 342 million Btu
China:40 x 1015 Btu/ 1.29x109 = 31 million Btu

Unit Conversion
Annual hydroelectric energy consumed in the US equals 209 billion kWh
Convert this value to Btu, using the conversion factor:
10,400 Btu/kWh
2.09x1011 kwh x 1.04 x104 Btu/kWh
=2.2 x10¹⁵ Btu = 2.2 QBtu

Daily Value
US annual oil consumption equals 7.2 Gbo. Express this value in millions of barrels per day.
US Oil consumption = 7.2x10⁹ bbl/ 365 days = 20 million bbl/day
(11 million bbl day imported)

Global Population Growth
Current Global Population: 6.3 billion Growth Rate = 1.15 % Population Growth = 0.0115x 6.3 billion = 73 million

Simple Lifetime
Assuming constant level of consumption, estimate the lifetime of US oil resources
Lifetime = 98 Gbo / 7.2 Gbo/year = 14 years
What is wrong with this assumption?

Growth Rate
In 2000, China consumed 40.1 QBtu of Primary energy. In 2001, this value jumped to 41.9 Q Btu From this data estimate the growth rate in 2000. G = (41.9 – 40.1)/40.1 = 0.045%

Doubling Time During 2003, India consumed 13 QBtu of primary energy. Suppose the growth of Indian
energy consumption equals 5%. What will be India’s
consumption level in 2059? DT = 70 / 5 = 14 years 56 y / 14 y = 4 Doubles 4 times: 2x2x2x2 = 16 In 2059: 16 x 13 = 208 QBtu

Temperature Conversions
T (F) = 1.8 T(oC)
Temperature rise of 5 oC is equivalent to a temperature rise of 9 F
T (F) = 1.8 T(C) + 32 F
5 oC is equivalent to 41 F

Calculate US Carbon Emissions
US Carbon Emission =
26 MMT/QBtu x 22 QBtu
+ 19 MMT/QBtu x 38 Qbtu
+ 14 MMT/QBtu x 23 QBtu
= 1.6 Billion Metric Tons

Fraction
US / Global
= 1.6 BMT / 6.6 BMT
= 24 %
The US emits 24% of Global CO2.

Concepts
EnergyGrowthGlobal Warming
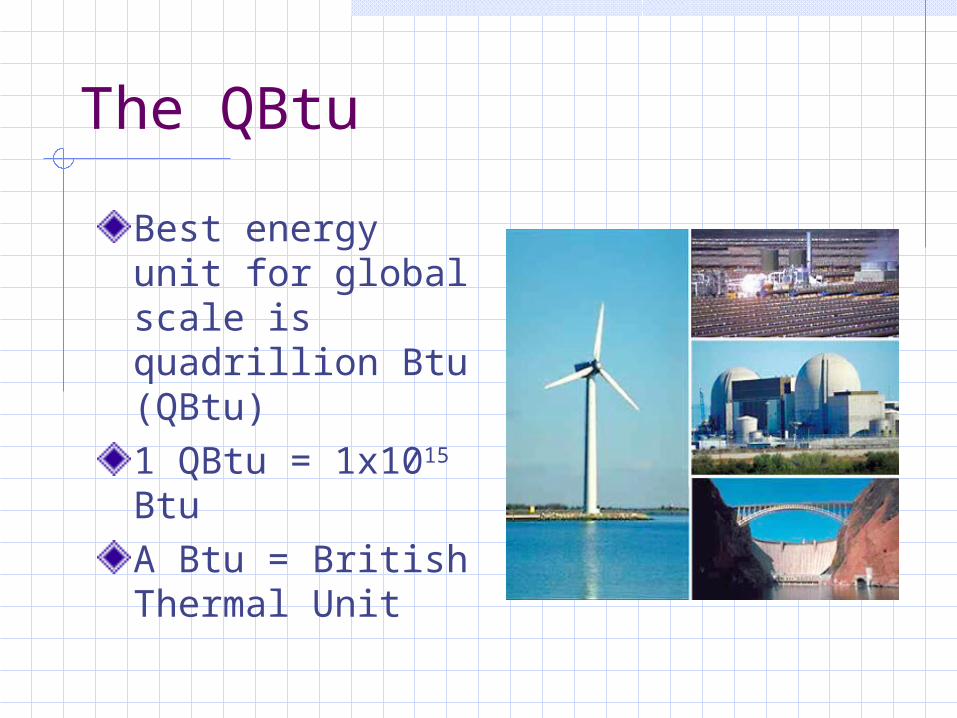
The QBtu
Best energy unit for global scale is quadrillion Btu (QBtu)1 QBtu = 1x10¹⁵ BtuA Btu = British Thermal Unit
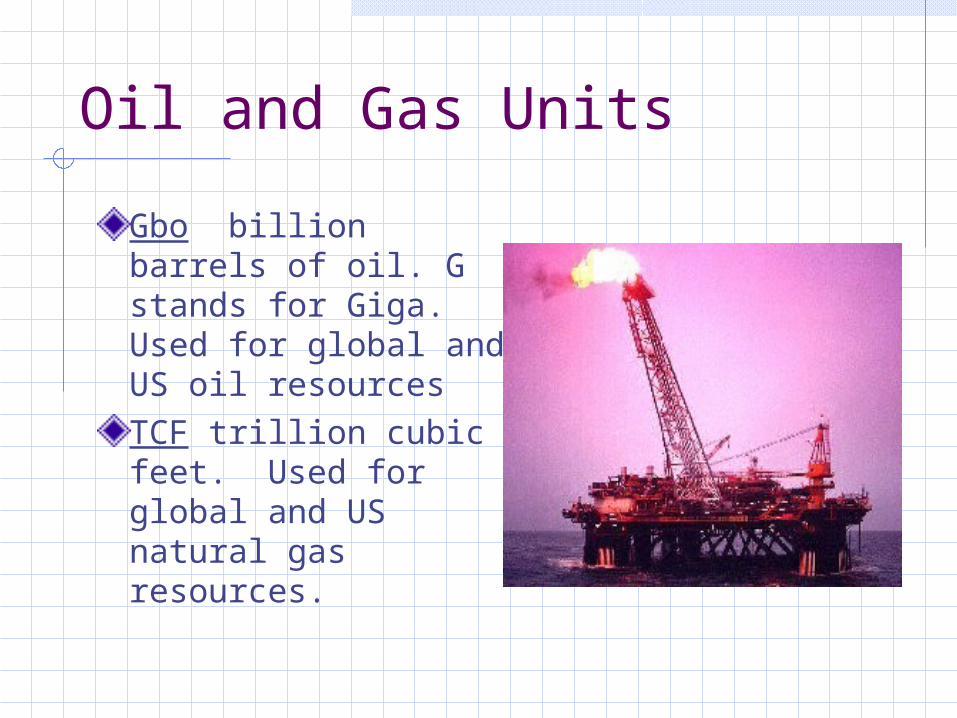
Oil and Gas Units
Gbo billion barrels of oil. G stands for Giga. Used for global and US oil resourcesTCF trillion cubic feet. Used for global and US natural gas resources.

Reserves and Resources
Reserves are known sources that are extractable with current technologies at current prices.Resources include sources not currently being exploited because of cost and sources not yet discovered.

Fossil Fuels
Coal, Natural Gas, and Oil are fossil fuels and are the source of 85% of the primary energy used worldwide.

World Primary Energy Consumption (QBtu)
Global 403 US 97Western Europe 73China 40
(2001 values)
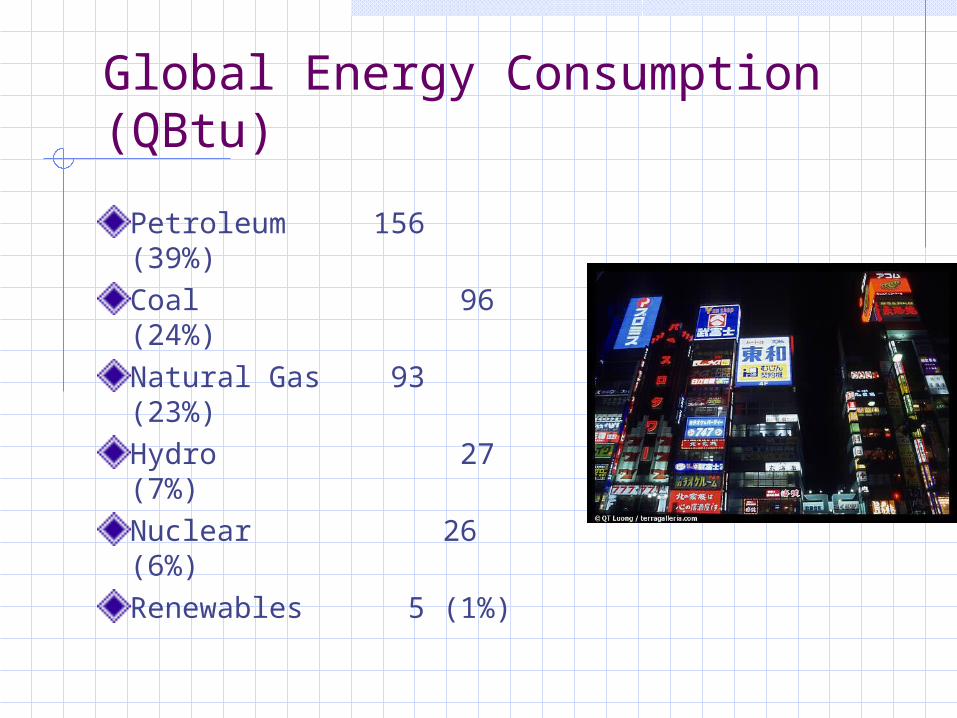
Global Energy Consumption (QBtu)
Petroleum 156 (39%)Coal 96 (24%)Natural Gas 93 (23%)Hydro 27 (7%)Nuclear 26 (6%)Renewables 5 (1%)
Global Oil Resources
• Saudi Arabia26%
• Iraq 11%• Iran 10%• Kuwait
10%• UAE 6%• Russia
5%• United States
3%
Global Oil Production
• Saudi Arabia12%
• United States11%
• Russia10%
• Iran 5%• Mexico
5%

When will Global Oil Production Peak?
Difficult to predict. Depends on
geology and economics.
Best estimates are sometime between 2004 and 2050.
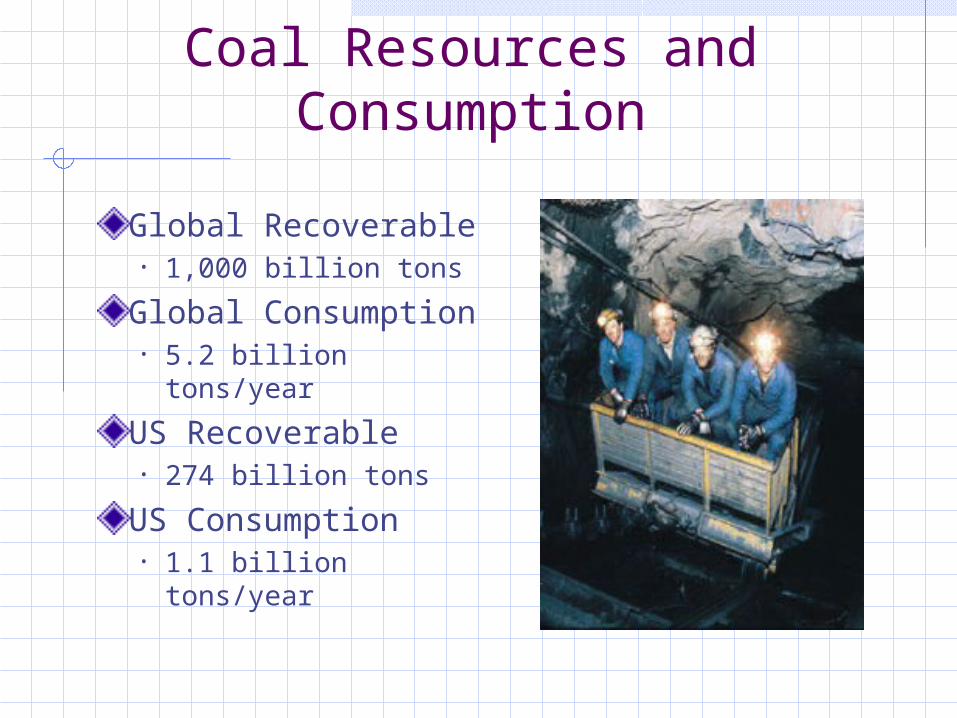
Coal Resources and Consumption
Global Recoverable• 1,000 billion tons
Global Consumption• 5.2 billion tons/year
US Recoverable• 274 billion tons
US Consumption• 1.1 billion tons/year
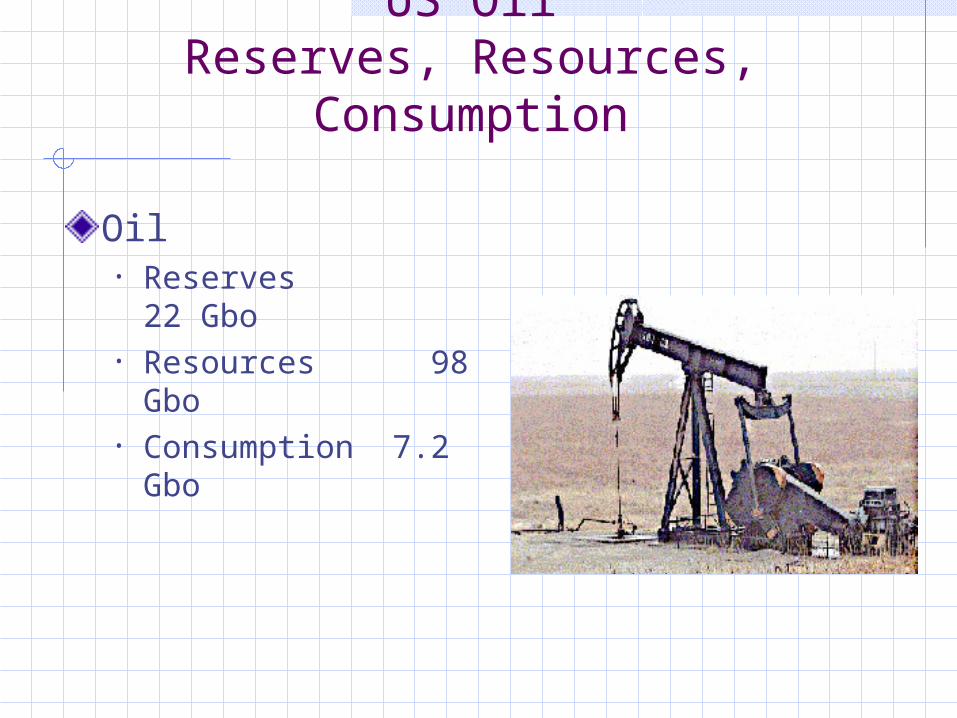
US OilReserves, Resources,
Consumption
Oil• Reserves 22
Gbo• Resources 98 Gbo• Consumption 7.2
Gbo

Lower 48 Crude Oil Reserves & Production, 1945-2000
0
5
10
15
20
25
30
35
40
1945 1950 1955 1960 1965 1970 1975 1980 1985 1990 1995 2000
Cru
de
Oil
Re
se
rve
s,
Bil
lio
n B
arr
els
0.0
0.5
1.0
1.5
2.0
2.5
3.0
3.5
4.0
Cru
de
Oil
An
nu
al
Pro
du
cti
on
, B
illi
on
Ba
rre
ls
Lower 48Reserves
Lower 48Production
PeakProduction1970
PeakReserves1959
US Production Peaked in 1970

US Sources of Energy (QBtu)
56% of oil consumed in US is imported

Global Coal Resources
• United States 25%• Russia 16%• China
12%• India
9%• Australia
8%• Germany
7%

US Energy Consumption (QBtu)
Petroleum 38 (39%)Coal 22 (23%)Natural Gas 23 (24%)Nuclear 8 (8%)Hydroelectric 3 (3%)Renewables 3 (3%)

US Coal Consumption
80% used by electric utilities

US Population Growth
Current US Population: 293 million Growth Rate = 0.87% Population Growth = 0.0087x 293 million = 2.5 million 2050 Population: 403
million

Global Population Growth
Current Global Population: 6.3 billion Growth Rate = 1.15 % Population Growth = 0.0115x 6.3 billion = 73 million 2050 Population: 9.1
billion
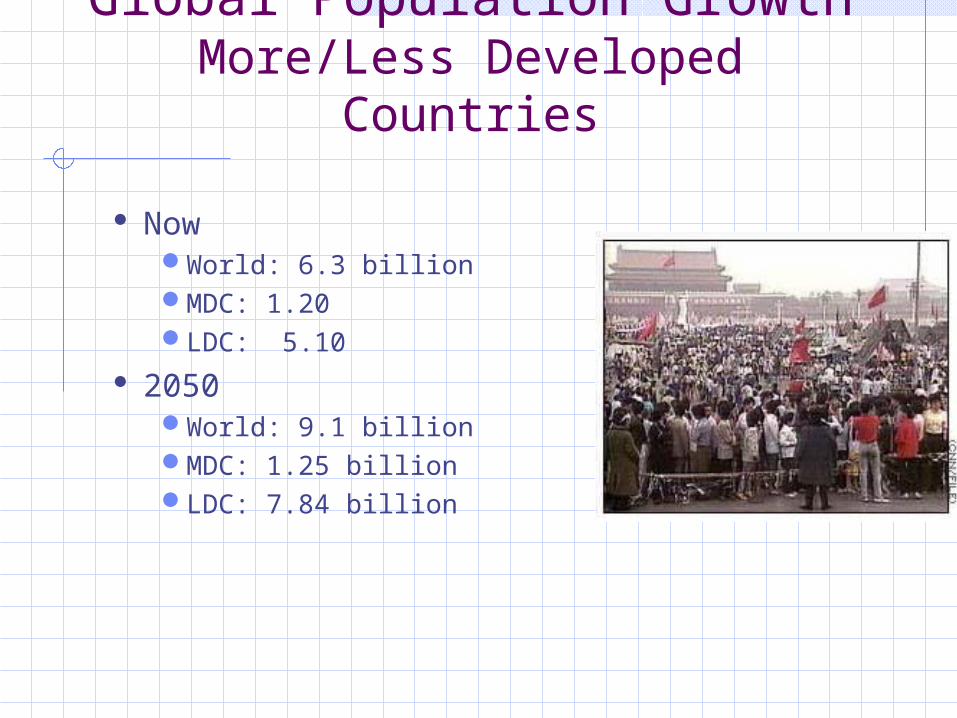
Global Population GrowthMore/Less Developed Countries
NowWorld: 6.3 billion MDC: 1.20LDC: 5.10
2050 World: 9.1 billionMDC: 1.25 billionLDC: 7.84 billion

Growth in Energy ConsumptionMDCs & LDCs
NowWorld: 400 QBtu MDC: 270 QBtuLDC: 130 QBtu
2050*World: 800 QBtuMDC: 320 QBtuLDC: 480 QBtu
* A mid-range prediction

The Earth is in an Interglacial Period
Last Glacial Maximum was 18,000 years ago and Global temperature was approximately 10 F colder than now
The last ice age ended 11,000 years ago.

Average Earth Temperature increased 0.6 oC (1 F) during 20th Century

Current temperature: highest in 1000 years.

Greenhouse Gases
Carbon dioxide – fossil fuel combustion. Methane – fossil fuel production, decomposition of organic wastes. Nitrous oxide - agricultural and industrial activities, as well as during combustion of solid waste and fossil fuels.
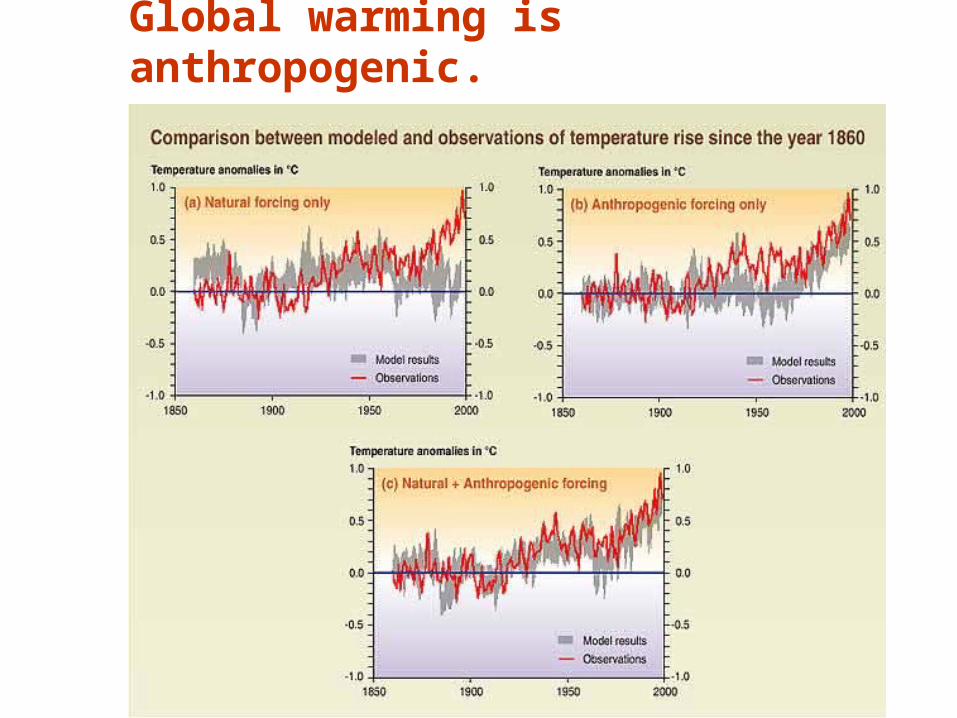
Global warming is anthropogenic.
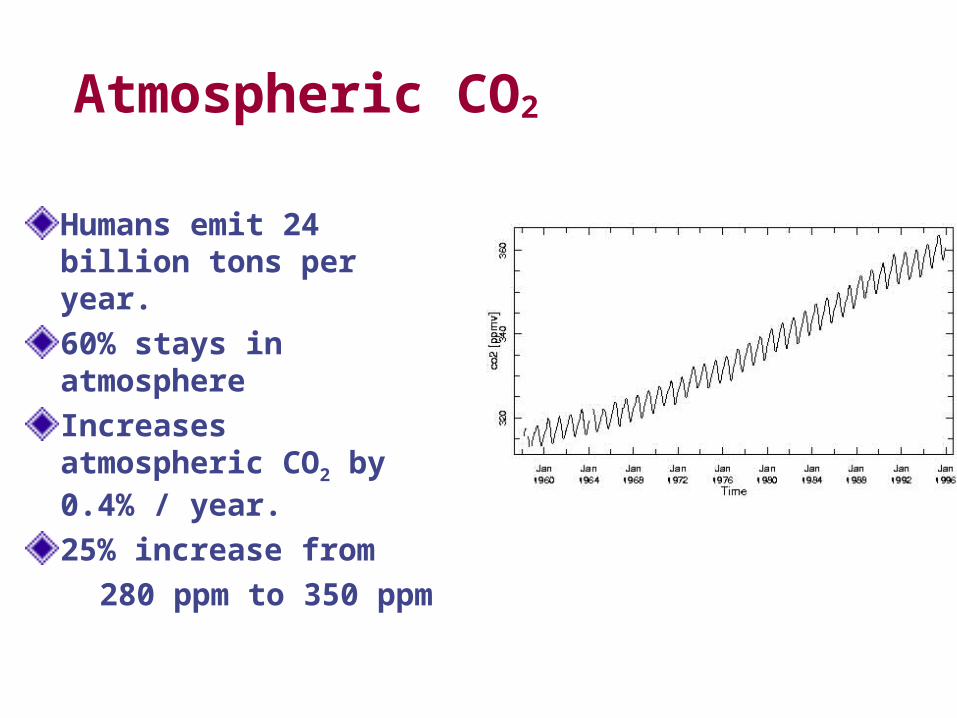
Humans emit 24 billion tons per year. 60% stays in atmosphere Increases atmospheric CO2 by 0.4% / year. 25% increase from
280 ppm to 350 ppm
Atmospheric CO2
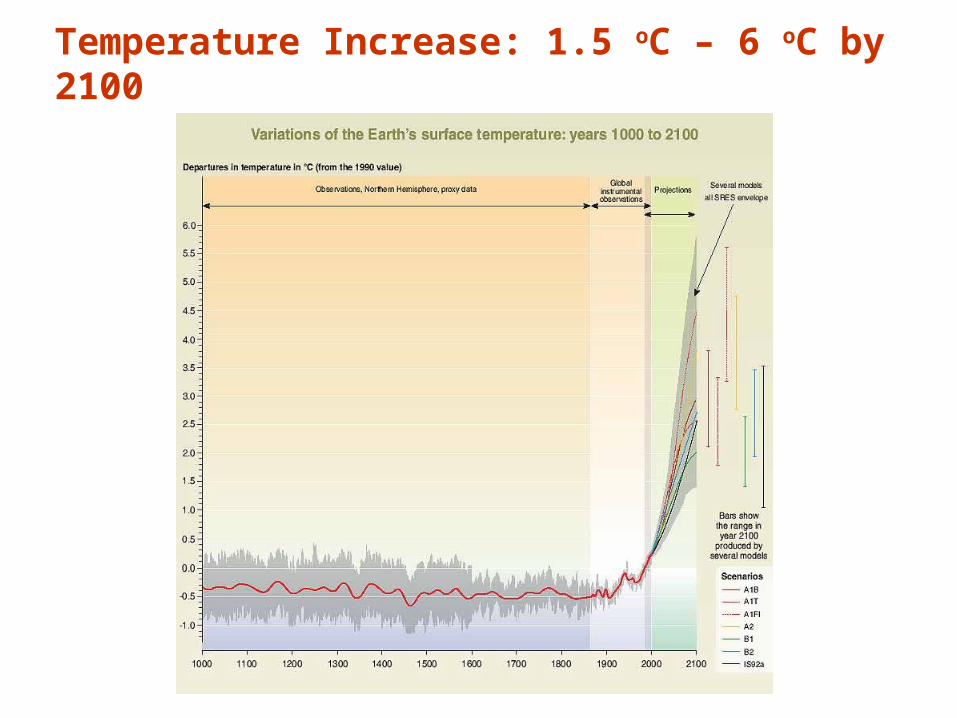
Temperature Increase: 1.5 oC – 6 oC by 2100
Global warming Extinctions
“ When the average of the three methods and two dispersal scenarios is taken, minimal climate-warming scenarios produce lower projections of species committed to extinction (18%) than mid-range (24%) and maximum-change (35%) scenarios.”

Global Carbon Emission
Global Carbon Emission of C in the form of CO2:
6.6 billion metric tons
Convert to CO2:
44/12 x 6.6 billion metric tons
= 24 billion metric tons

Adaptation and Mitigation