Embed Size (px)
Citation preview
1
Asia Geospatial Forum, 17-19 September 2012, Hanoi, Vietnam
EARTHQUAKE VULNERABILITY MAPPING OF RESIDENTIAL
BUILDINGS BASED ON THE GEOLOGICAL AND BUILDING
FOOTPRINT CHARACTERISTIC IN PLERET SUB-DISTRICT BANTUL
REGENCY, 2012
Aditya Saputra
(1), Priyono
(2), Yuli Priyana
(3), Agus Anggoro Sigit
(4)
(1), (2), (3), and (4) Lecturer staff in Geography Faculty of Muhammadiyah University of Surakarta
Jl. A. Yani Kartasura Tromol Pos 1 Surakarta 57102
[email protected] , [email protected], [email protected]
ABSTRACT
Pleret sub-district is one of the earthquake prone areas. It was proved, in the
earthquake event of May 27, 2006 in Yogyakarta, Pleret Sub-District was badly damaged.
This research was conducted to determine the earthquake vulnerability condition of
residential buildings using rapid visual screening of building for potential seismic hazard
procedure. The method used in this research was integration between remote sensing,
geographic information system and field observation. There are four lithologycal units in
Pleret Sub District based on the visual intepretation result using ASTER composite 3, 4,
PCA 56789. Those lithologycal units are Recent Merapi Volcano Deposite (Qmi),
Alluvium from denudational processes in Semilir and Nglanggran Formation (Qa),
Nglanggran Formation (Tmn) and Semilir Formation (Tmse). Those fourth lithologycal
units give the different appearance in ASTER composite 3, 4, PCA 56789. Semilir
Formation is dominated by alternately breccia pumice and breccia-tuff, give bright blue
with brownish red spotting appearance. Nglanggran Formation is dominated by volcanic
breccia and lava flow, give darker color i.e. brownish red with bright blue spotting
appearance. Recent Merapi Volcano deposites and Alluvium from denudational
processes in Semilir and Nglanggran Formation give bluish green and brownish red
appearance. Based on the intepretation of Quickbird imagery can be seen that the roof
type of residential buildings in Pleret Sub District are dominated by regular “kampung”
type i.e. 89.50%, while the buildings structure are dominated by reinforced masonry with
rigid diaphragm (RM2) i.e. 92.08%. The RM2 type have high score of rapid visual
screening of building for potential seismic hazard i.e. above the value 1.75. This score
shows that RM2 type has low level of earthquake vulnerability. From the results also
shown that all of the building structure types except wood structure (W1), if located in
moderate to high level of hazard indicated by unconsolidated surface material like
aluvium and located in dense area tend to have moderate until high degree of buildings
vulnerability level.
Keywords : Buildings vulnerability, lithology, buildings structure
2
Asia Geospatial Forum, 17-19 September 2012, Hanoi, Vietnam
I. INTRODUCTION
1.1 Research Background
Earthquake is defined as sudden motion or trembling of the earth caused
by release of strain accumulated within or along the edge of Earth’s tectonic plate.
The energy released from that process is seismic vibration radiating in the earth
and felt as earthquake after reaching the Earth’s surface (Bath, 1979). This natural
phenomenon is closly related to the geological condition and tectonic plate
configuration in particular area. Areas located in the edge of Earth’s tectonic plate
tend to have high earthquake susceptibility.
Indonesia is located between three junction of active tectonic plates tend
to have high susceptibility of tectonic earthquakes occurrence. Earthquake can
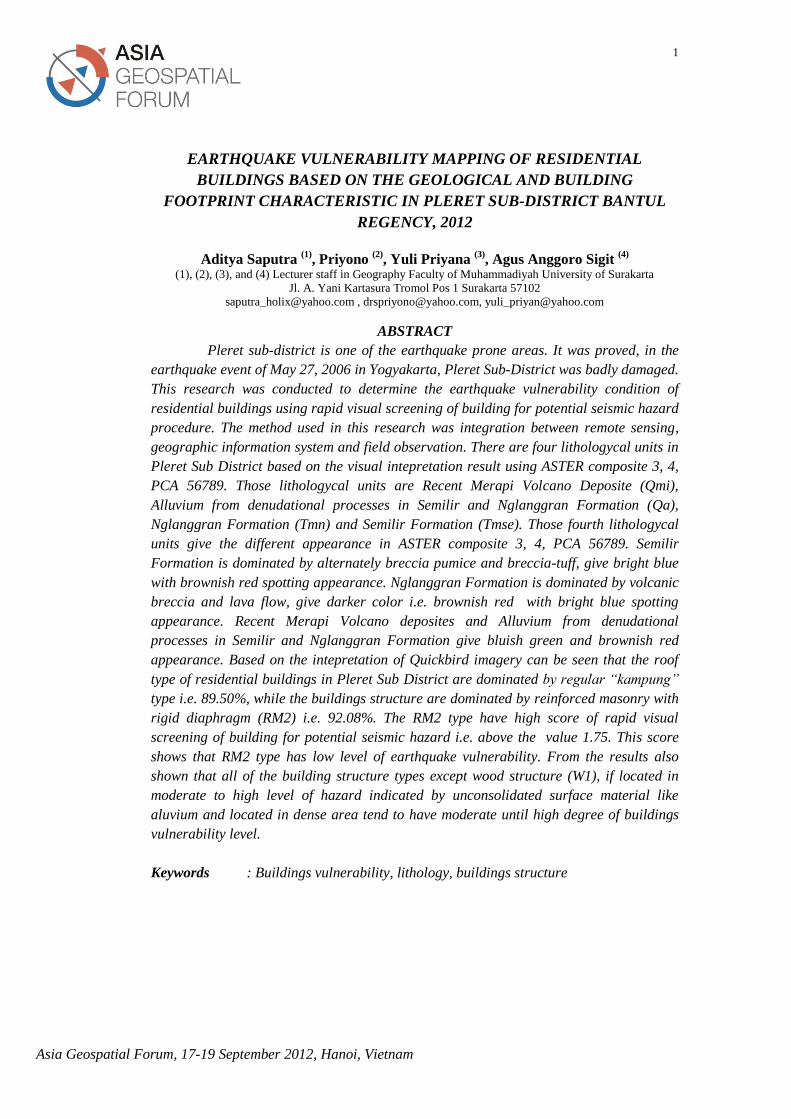
occur anytime in Indonesia. It was proved, on May 27, 2006 big earthquake was
occur in Yogyakarta, located in the northern zone of the Eurasian Plate and
Indian-Australian Plate subduction zone. This earthquake caused badly damage
and causing many casualties in part of Yogyakarta. One of them is Bantul
Regency which is located closest to earthquake epicentrum according to USGS
version. As much as 26,045 building units were badly damaged, 29,582 building
units were moderate damaged, and 24,262 building units were slightly damaged.
The death toll reached 4,121 people and injured victims reached 12,026 people
(Table 1 and 2).
Table 1. Buildings Damage Data in Yogyakarta Special Province
Regency Number of Buildings (2003) Collapse Moderate Slightly
damage
Bantul 181,991 26,045 29,582 24,262
Gunungkidul 158,570 11,323 5,355 16,360
Sleman 196,965 4,719 14,403 29,910
Yogyakarta 78,079 1,948 4,119 2,355
Kulonprogo 87,940 3,485 4,726 7,999
Source: Bappenas, 2006
Table 2. The Number of Victim in Yogyakarta Special Profince
Regency Death Toll Injury
Bantul 4,121 12,026
Sleman 240 3,792
Yogyakarta 195 318
Kulonprogo 22 2,179
Gunungkidul 81 1,086
Source : Bappenas, 2006
3
Asia Geospatial Forum, 17-19 September 2012, Hanoi, Vietnam
Pleret Sub-District is located near the Opak Fault which was estimated as
the location of earthquake epicentrum on last May 27, 2006. Pleret was badly
damaged in that eartquake event. According to FEMA the main factor causing
high number of death toll are the building damaged due to earthquake trembling.
Therefor, the buildings vulnerability mapping become the important activity in
Pleret Sub-District. In addition to that Pleret is one of the area in Bantul Regency
that has high level of earthquake hazard. It means that earthquake can occur
anytime in the future time in this area.
Remote sensing and Geographic Information Systems (GIS) is a modern
technology which support the mapping activity including mapping activity in
residential buildings vulnerability. In the other hand rapid visual screening of
building for potential seismic hazard (RVS) is a procedure in vulnerability
assessment of residential building which is developed by FEMA. RVS is one
earthquake vulnerability procedure and able to do the identification,
inventarisation and do the buildings classification regarding to earthquake. With
this procedure the assessment activity become more effisient and efective both in
time and financial point of view. The integration between remote sensing and
geographic information system (GIS) and rapid visual secreening of buildings for
potential seismic hazard can bring best improvement especially in data acquisition
, analysis, visualisation and information distribution regarding to vulnerability of
residential buildings.
1.2 Problem Statement
In 27 Mei 2006 earthquake occur in Yogyakarta Special Province and
Pleret become one of the area which has high number of death toll. Furthermore,
Pleret is classified as earthquake prone area. Pleret is also located near the Opak
Fault. Based on the earthquake record, In 1867 big earthquake also occurred in
this fault. Therefore, study of earthquake disaster with integration between all of
aspect and based on risk reduction concept is recommended to be done in research
area.
4
Asia Geospatial Forum, 17-19 September 2012, Hanoi, Vietnam
Vulnerability mapping of residential buildings can be applied to reduce
the impact if earthquake happen again in thr future time. The mapping activity
using detail scale of mapping unit can give the acurate description from the real
condition of vulnerability of residential buildings and its spatial distribution.
Therefore, the last condition of earthquake impact on 27 May 2006 will not
happen agai if earthquake occur in Pleret Regency. In the other side, this mapping
activity can gives the important information in study of earthquake risk reduction
throught acurate spatial data such as building footprints data and its vulnerability
level. Those two data are very needed and become the preliminary need in disaster
study based on risk reduction. The main objective of this research is to know the
vulnerability level of residential buildings and its distribution in Pleret Sub-
District
II. RESEARCH METHODOLOGY
The method used was integration between remote sensing, geographic
Information system and field observation using rapid visual screening of building
for potential seismic hazard procedure. Those three tecnique was comprehensively
done in vulnerability analysis of residential buildings in Pleret Sub-District.
Remote sensing and geographic information system was conducted in
data aqcuisition process of geology and building footprints information in
research area. Geology data extraction was done by visual interpretation of
ASTER imagery recorded in 2007, while the visual interpretation of Quickbird
imagery recorded in 2010 was used for building footprints analysis. Both
informations are very needed in vulnerability analysis of residential buildings
using RVS procedure.
The color composite used was based on Landsat 7 ETM+ 4,5,7. In
Landsat 7 ETM+ band 4 is near infra red band which is good used for vegetation
identification, agricultural crops, vegetation density, and water body
identification. Band 5 is middle infra red channel which is used for humidity
identification of vegetation and soil, while band 7 is the second middle infra red
channel which is good for rock formation determination as well as lithology and
5
Asia Geospatial Forum, 17-19 September 2012, Hanoi, Vietnam
mineral description (Santosa, 2003). Overall, the 4,5,7 composite of Landsat
imagery is best for emphasing the lithological border.
The analysis of vulnerability of residential buildings was conducted
through field observation based on rapid visual secreening of building for
potential seismic hazard procedure which is developed by FEMA in 2002. The
observed variables in this vulnerability assessment are building structur types,
buildings irregularity both plan and horizontal irregularity and surface lithology.
Unit analysis are based on the sample which was taken by stratified random
sampling method. The base of classification used was the shape of builfings
footprint and the shape of the roof. According to the shape of buildings footprint,
the residential building was devide into several groups. Those groups are reguler
building (has square shape of building footprints) and irregular building (has
certain shape of building footprint like L, U, H and O form).
The residential buildings are devided into 4 groups based on their roof
shape. Those 4 groups are joglo roof, limasan roof and cement roof (Ronald,
1997). The number of sampel are proportionally taken based on the total
population and building population on each class. In addition to that, the sample
taken are also considering about the different level of earthquake hazard. The
earthquake hazard classification refered to the surface material characteristic on
each lithological unit resulting from geology interpretation of ASTER imagery.
The hardness of surface material also influence the level of earthquake
ampification. The harder and more compat of surface material will produce the
lower of amplification level when earthquake happen, therefore can be assumed
that the more compact the surface material is the lower of earthquake hazard level.
The vulnerability index of residential buildings was resulted from the
analysis of the final score of RVS and the building density condition. Based on
that procedure the vulnerable buildings are the buildings which have the RVS
final score below the 1.75. The building density is defined quantitavely as the
number of building population per hectare. The building density also can be
measured through the basic koeficient of building density. In this research, the
density measurement used was the number of building unit in each hectare of
6
Asia Geospatial Forum, 17-19 September 2012, Hanoi, Vietnam
block in spatial planning document (RDRTK Pleret District 2008). In this
analysis, the unit analysis used was different from the previous analysis. The
residential block from detail spatial planning document was used to calculate the
building density index. Based on that data, each village was devided into smaller
unit block. The density class used was from the detail spatial planning document
of Pleret Sub-District (2008), the classification can be shown in Table 3.
Table 3 Building Density Classification
Parameters Very low Low Moderate High
Build up Area 30% 30 – 45% 45 – 60% 60 – 75%
Building Koeficient > 5% 5 – 20% 20 – 50% 50 – 75%
Number of Building - 0 – 40 unit/Ha 40 – 80 Unit/ha 80 – 150 Unit/ha
Source: RDRTK Kecamatan Pleret, 2008
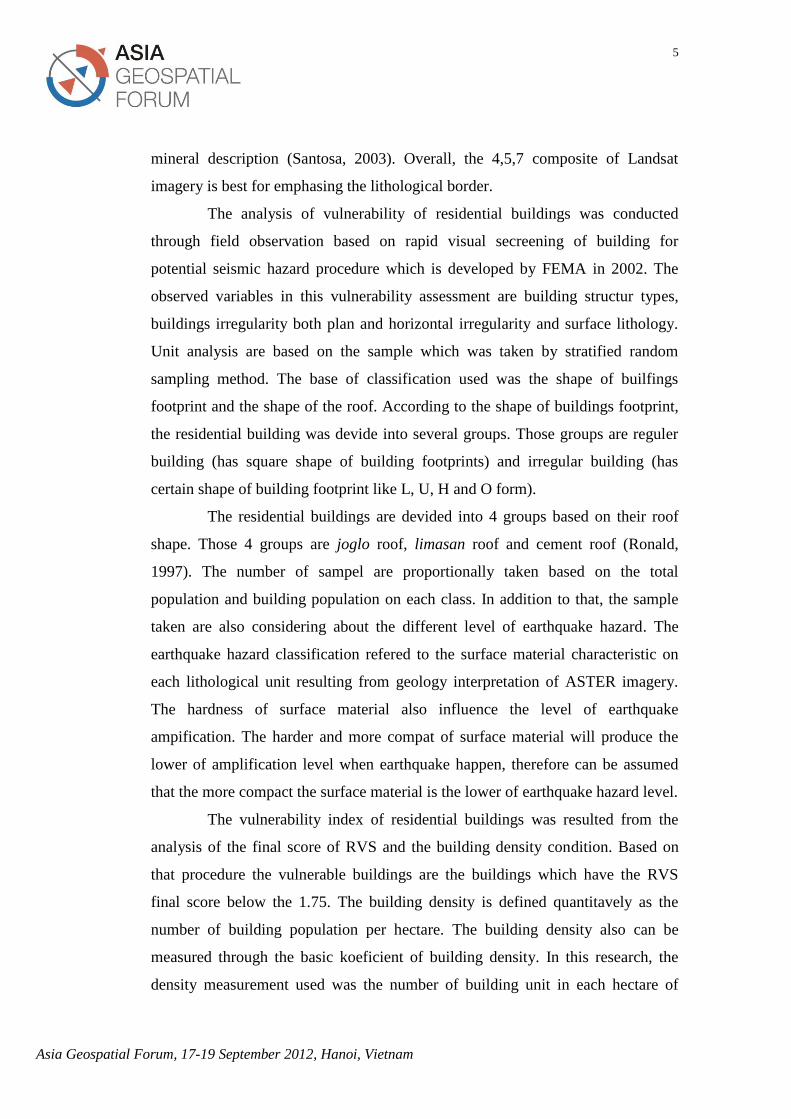
Weighted overlay on geographic information system was used to
combine those two variables. The weight score of both variable are determined
using pairwise comparison method. In this analysis the weight score was given
qualitatively according to researcher using comparison scale based on previous
study on the same topic. Overall, the flowchart of this research can be shown in
Picture 1.
III. HASIL PENELITIAN
Citra Quickbird Building footprint Visual Interpretation
Building footprint
Based on the roof
types
Classification Process
Residential
Building Sample
Sample design
RVS Score
RVS
ASTER Image
RGB
3,4,PCA,4,6,7,8,9
Geometric Correction
Layer Stacking
PCA
Lithologycal Unit
Intepretasi visual
Surface material
FEMA Classification
Building density
Pairwise method
Weighted Value Vulnerability map of
residential buildings Weighted overlay
Pictire 1 Research Work Flow
7
Asia Geospatial Forum, 17-19 September 2012, Hanoi, Vietnam
III. Result and Discussion
3.1 Geologi Interpretation
Digital Image Processing for study of lithology using ASTER image is
consist several process such as layer stacking, geometric correction and RGB
transformation using principle component analysis (PCA). All of the processes
have single objective for prepare the better image with clear color composite to
show the lithological aspect in research area. According to the result of layer
stacking process, there was one group of channel consist visible and near infrared
(VNIR) channel and also Short Wavelength Infrared Radiometar (SWIR) channel
which have the same spatial resolution i.e. 30 meter.
Based on the result of geometric correction, researcher can get new
image of ASTER with new spatial reference and the true north orientation. The
facility used in this process is image to image regristration with the help of the
previous record of ASTER image in 2006. This facility was used due to the work
efficiency. With this facility researcher do not need use the ground control point
to register the unregistration ASTER image which need longer time.
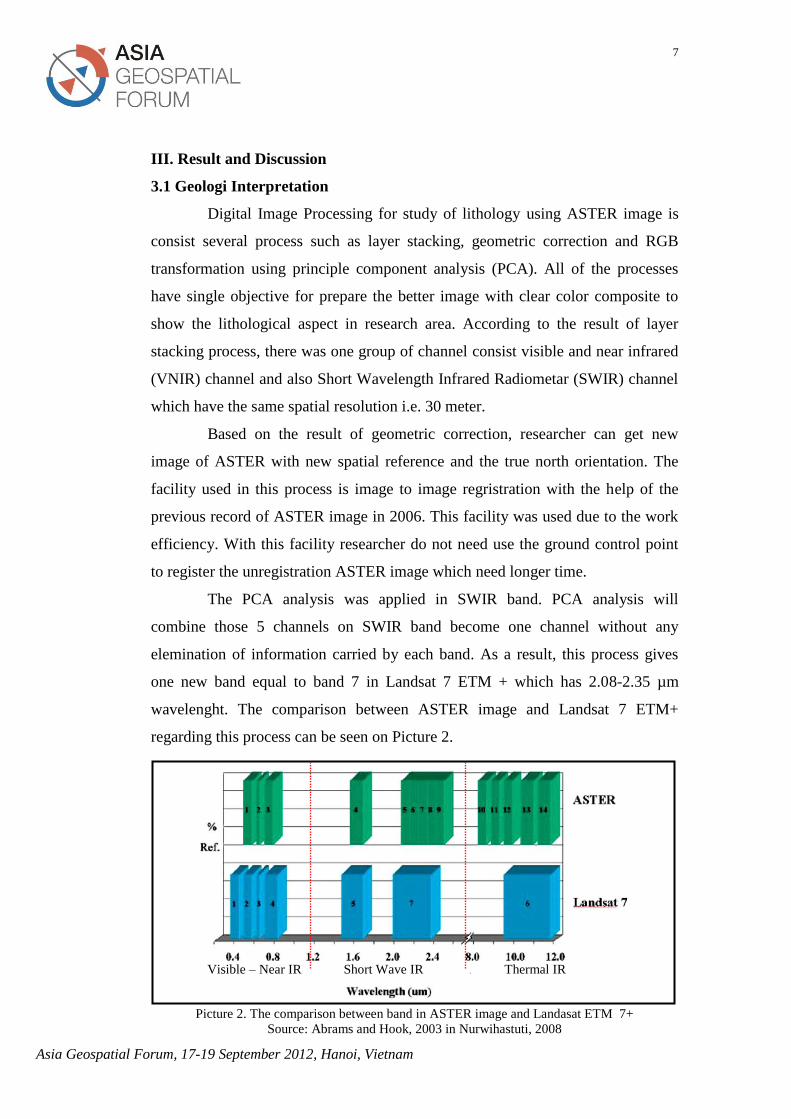
The PCA analysis was applied in SWIR band. PCA analysis will
combine those 5 channels on SWIR band become one channel without any
elemination of information carried by each band. As a result, this process gives
one new band equal to band 7 in Landsat 7 ETM + which has 2.08-2.35 µm
wavelenght. The comparison between ASTER image and Landsat 7 ETM+
regarding this process can be seen on Picture 2.
Visible – Near IR Short Wave IR Thermal IR
Picture 2. The comparison between band in ASTER image and Landasat ETM 7+
Source: Abrams and Hook, 2003 in Nurwihastuti, 2008
8
Asia Geospatial Forum, 17-19 September 2012, Hanoi, Vietnam
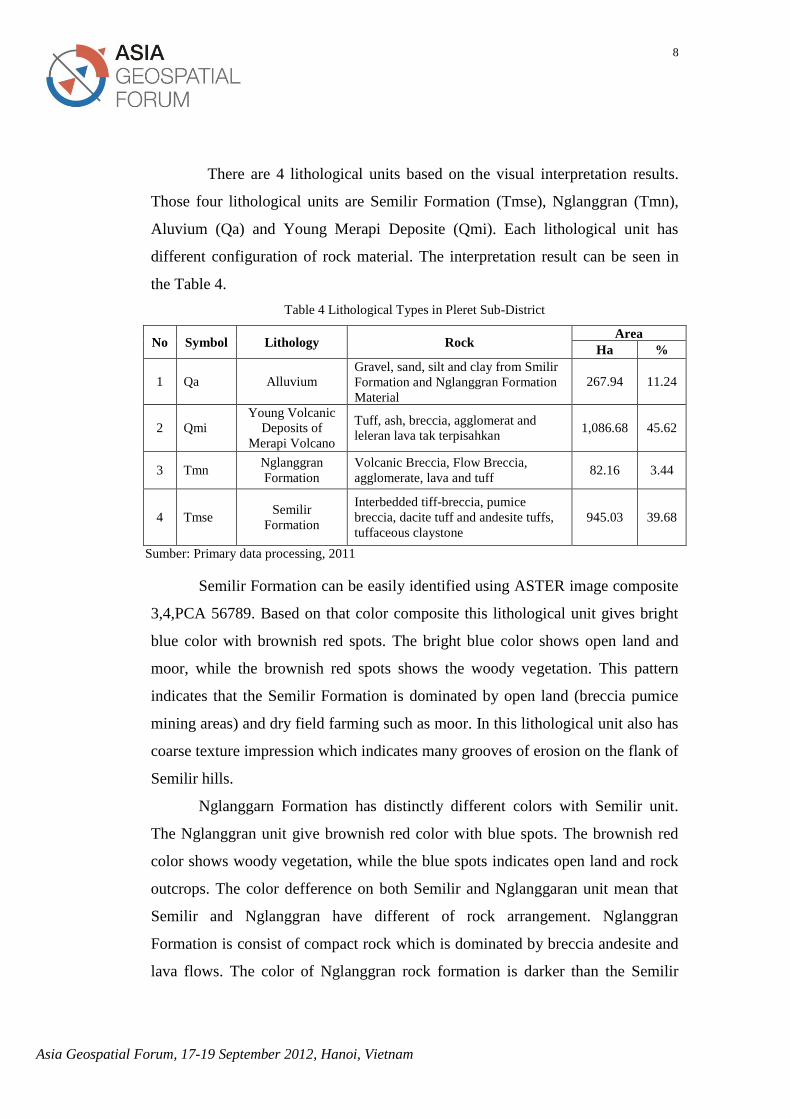
There are 4 lithological units based on the visual interpretation results.
Those four lithological units are Semilir Formation (Tmse), Nglanggran (Tmn),
Aluvium (Qa) and Young Merapi Deposite (Qmi). Each lithological unit has
different configuration of rock material. The interpretation result can be seen in
the Table 4.
Table 4 Lithological Types in Pleret Sub-District
No Symbol Lithology Rock Area
Ha %
1 Qa Alluvium Gravel, sand, silt and clay from Smilir
Formation and Nglanggran Formation
Material
267.94 11.24
2 Qmi
Young Volcanic
Deposits of
Merapi Volcano
Tuff, ash, breccia, agglomerat and
leleran lava tak terpisahkan 1,086.68 45.62
3 Tmn Nglanggran
Formation
Volcanic Breccia, Flow Breccia,
agglomerate, lava and tuff 82.16 3.44
4 Tmse Semilir
Formation
Interbedded tiff-breccia, pumice
breccia, dacite tuff and andesite tuffs,
tuffaceous claystone
945.03 39.68
Sumber: Primary data processing, 2011
Semilir Formation can be easily identified using ASTER image composite
3,4,PCA 56789. Based on that color composite this lithological unit gives bright
blue color with brownish red spots. The bright blue color shows open land and
moor, while the brownish red spots shows the woody vegetation. This pattern
indicates that the Semilir Formation is dominated by open land (breccia pumice
mining areas) and dry field farming such as moor. In this lithological unit also has
coarse texture impression which indicates many grooves of erosion on the flank of
Semilir hills.
Nglanggarn Formation has distinctly different colors with Semilir unit.
The Nglanggran unit give brownish red color with blue spots. The brownish red
color shows woody vegetation, while the blue spots indicates open land and rock
outcrops. The color defference on both Semilir and Nglanggaran unit mean that
Semilir and Nglanggran have different of rock arrangement. Nglanggran
Formation is consist of compact rock which is dominated by breccia andesite and
lava flows. The color of Nglanggran rock formation is darker than the Semilir
9
Asia Geospatial Forum, 17-19 September 2012, Hanoi, Vietnam
unit. That rock color indicates the level of acidity. Bright color of rock means that
the rock has higher level of acidity, while the darker color means low level of
acidity. The soil layer on this litholigical unit have developed well which is
indicated from the high density of vegetation in this unit. The other characteristic
is texture. This formation has smoother texture that the Semilir unit. The spatial
distribution of this units is on the top of Baturagung hills.
Alluvium is the denudation material from Semilir and Nglanggaran
Formation which is carried away by water and deposited nearby foothills. In the
ASTER, this material have smooth texture besause located in gently slope. The
color is dominated by bluish green and many brownish red spots along the river.
This brownish red spots are settelements. The other existing color in this unit is
dark green color which indicated the agricultural crops,
The Young Deposites of Marapi Volcano is dominated by bluish green
and reddish brown color. The bluish green shows the combination of settlements
area and farming field, while reddish brown shows the vegetation. Glance, This
lithological unit is similar with the alluvium unit because of their spatial
distribution. However, in the further analysis shown that Young Deposits of
Merapi Volcano have fertile soils from volcanic product which is used for farming
area. In addition to that in this lithological unit has less clay content comparing to
the alluvium matrial. It is proven that in this area is commonly found the clay
bricks artisans, because the clay content in this lithological unit is not too high and
suitable for raw materials of clay bricks production. The higher of clay content
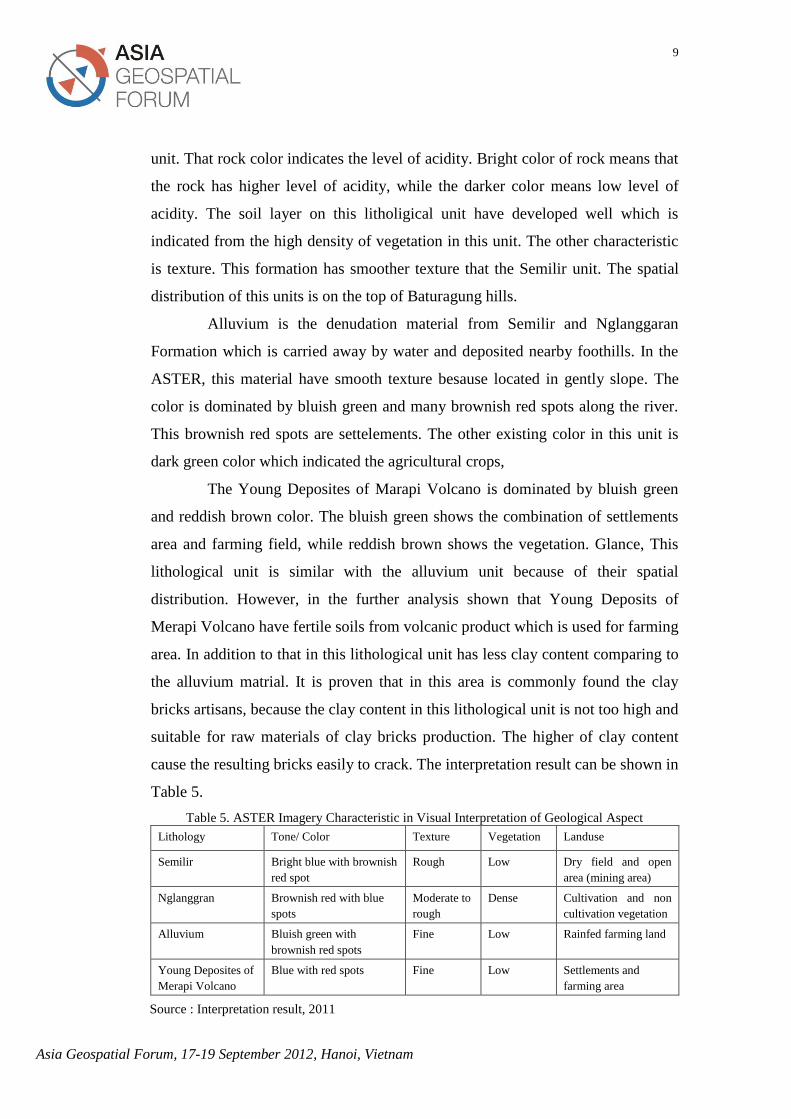
cause the resulting bricks easily to crack. The interpretation result can be shown in
Table 5.
Table 5. ASTER Imagery Characteristic in Visual Interpretation of Geological Aspect
Lithology Tone/ Color Texture Vegetation Landuse
Semilir Bright blue with brownish
red spot
Rough Low Dry field and open
area (mining area)
Nglanggran Brownish red with blue
spots
Moderate to
rough
Dense Cultivation and non
cultivation vegetation
Alluvium Bluish green with
brownish red spots
Fine Low Rainfed farming land
Young Deposites of
Merapi Volcano
Blue with red spots Fine Low Settlements and
farming area
Source : Interpretation result, 2011
10
Asia Geospatial Forum, 17-19 September 2012, Hanoi, Vietnam
3.2 Building Footprints Interpretation
Building objects identification was done by the visual interpretation
process on Quickbird imagery recorded in 2010. The interpretation process was
produced 17,513 building objects. Tone or color, shape, shadow and association
are the most used elements in visual interpretation. The most common color
reflect the building objects are dark brown, blue, green and grey. Those colors are
the color of roof material of buildings. Dark and light brown color indicate that
the building use clay tile, while the green and blue are painted clay tile. The white
color is zinc and asbestos roof materials, while gray color is cement roof type.
The building shape is dominated by regular shape both square shape and
rectangular shape. However, there are also several buildings object which have
irregular shape such as L, U, O and H shape. Shadow is the most important aspect
in the building identification process. Sometimes, an object has similar color with
building, but if the object does not has shadow nearby, it means the object is not a
building. The other key of interpretation is association, a building object is usually
located near the road network.
The separation process between residential buildings and non residential
buildings was done by the analysis of several key parameters such as shape, size,
and association. The separation process produced 16,318 buildings object
classified as residential building and 1,195 classified as non redisedential building
such as office, hospital, shopping complex, traditional market, cattle sheds, etc.
Based on the roof shape, The most striking feature is 89.50% residential buildings
use the kampung roof type, while limasan only about 9.60% from the total
residentian buildings resulted from visual interpretation. The other minority roof
design are Joglo with only 0.63%, sement roof type 0.12%, Kampung irregular
0.06% and Limasan irregular 0.04%. This classification process is usefull to ease
the vulnerability analysis and generalisation the building groups.
11
Asia Geospatial Forum, 17-19 September 2012, Hanoi, Vietnam
3.3 Rapid Visual Screening of Buildings for Potential Sismic Hazard
The rapid visual screening of buildings for potential seismic hazard
procedure was conducted to sevaral samples buildings. The number of sample are
calculated proportionally from the number of building population. The building
samples distribution can be shown in Table 6.
Table 6 Sample Distribution by its classification and its number
Building
Shape
Roof Types
Joglo Limasan Kampung Cement roof
L M H L M H L M H L M H
Regular 6 - 24 9 2 33 30 5 199 - 2 15
Irregular - - - - - 6 1 1 7 - - -
Sumber: Pengolahan data primer, 2011
L represent the low level of earthquake hazard areas, M represent moderate areas,
and H represent high areas. From the table can be known that Kampung roof type
is dominated in all of level of hazard zonation.
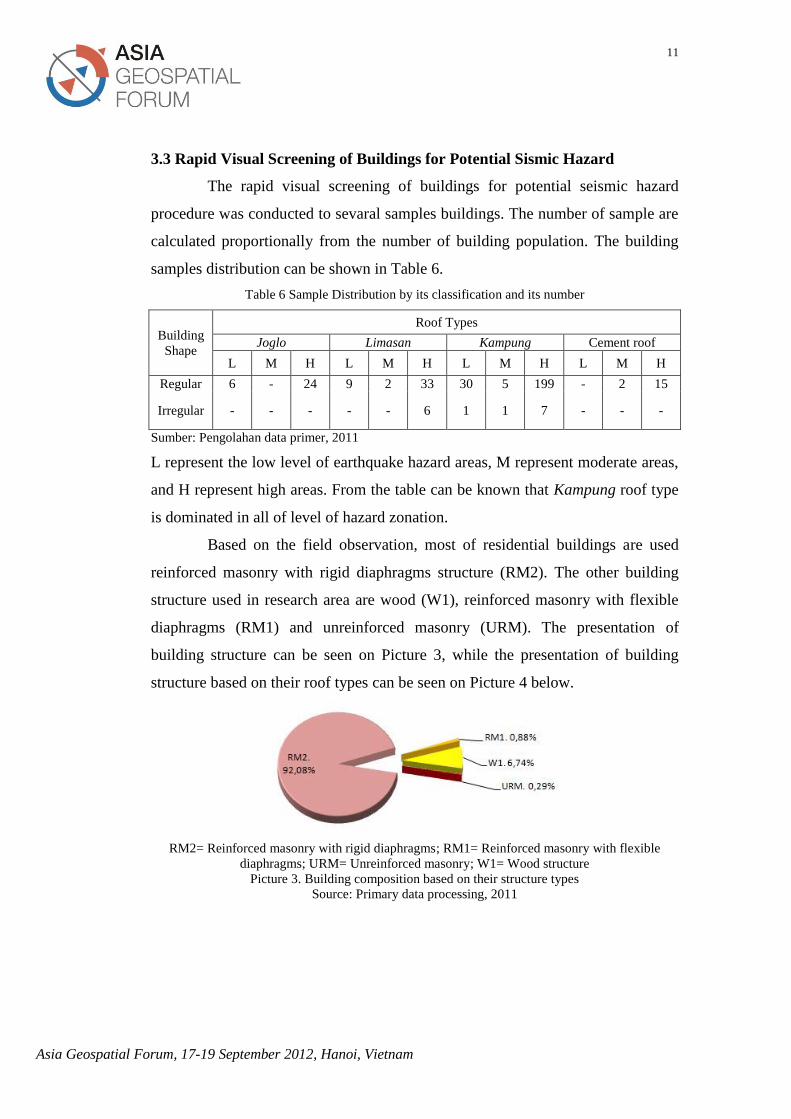
Based on the field observation, most of residential buildings are used
reinforced masonry with rigid diaphragms structure (RM2). The other building
structure used in research area are wood (W1), reinforced masonry with flexible
diaphragms (RM1) and unreinforced masonry (URM). The presentation of
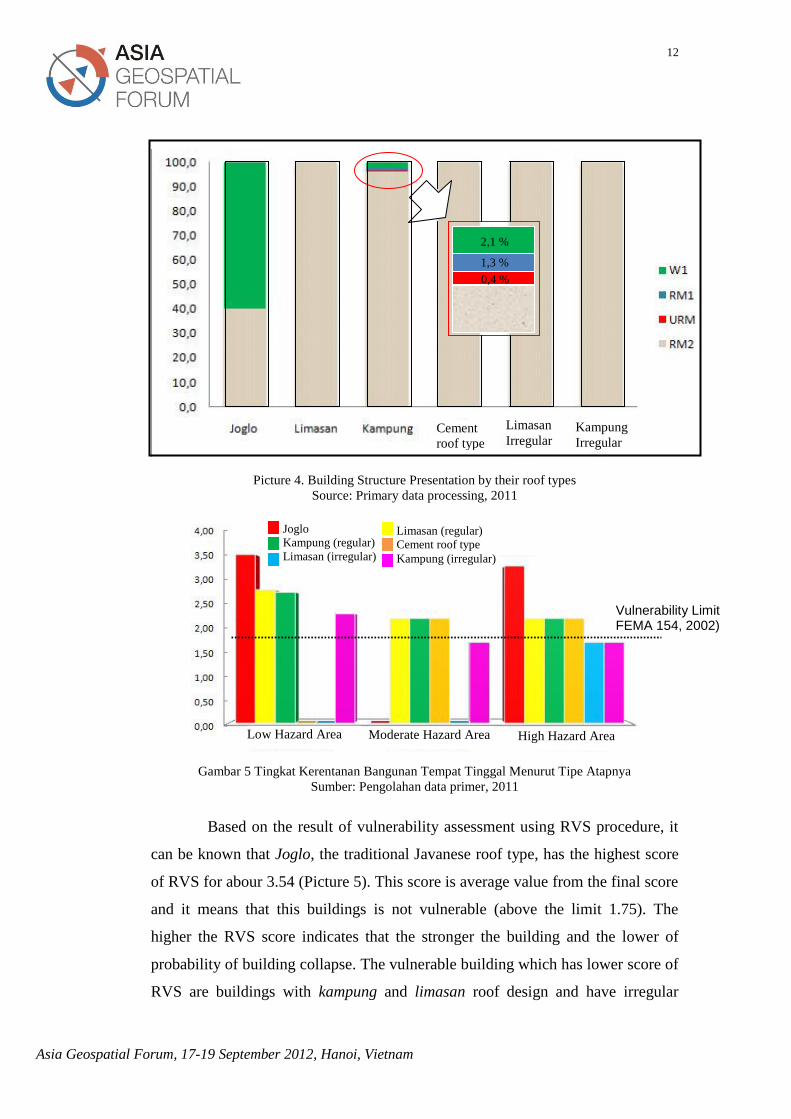
building structure can be seen on Picture 3, while the presentation of building
structure based on their roof types can be seen on Picture 4 below.
RM2= Reinforced masonry with rigid diaphragms; RM1= Reinforced masonry with flexible
diaphragms; URM= Unreinforced masonry; W1= Wood structure
Picture 3. Building composition based on their structure types
Source: Primary data processing, 2011
12
Asia Geospatial Forum, 17-19 September 2012, Hanoi, Vietnam
Picture 4. Building Structure Presentation by their roof types
Source: Primary data processing, 2011
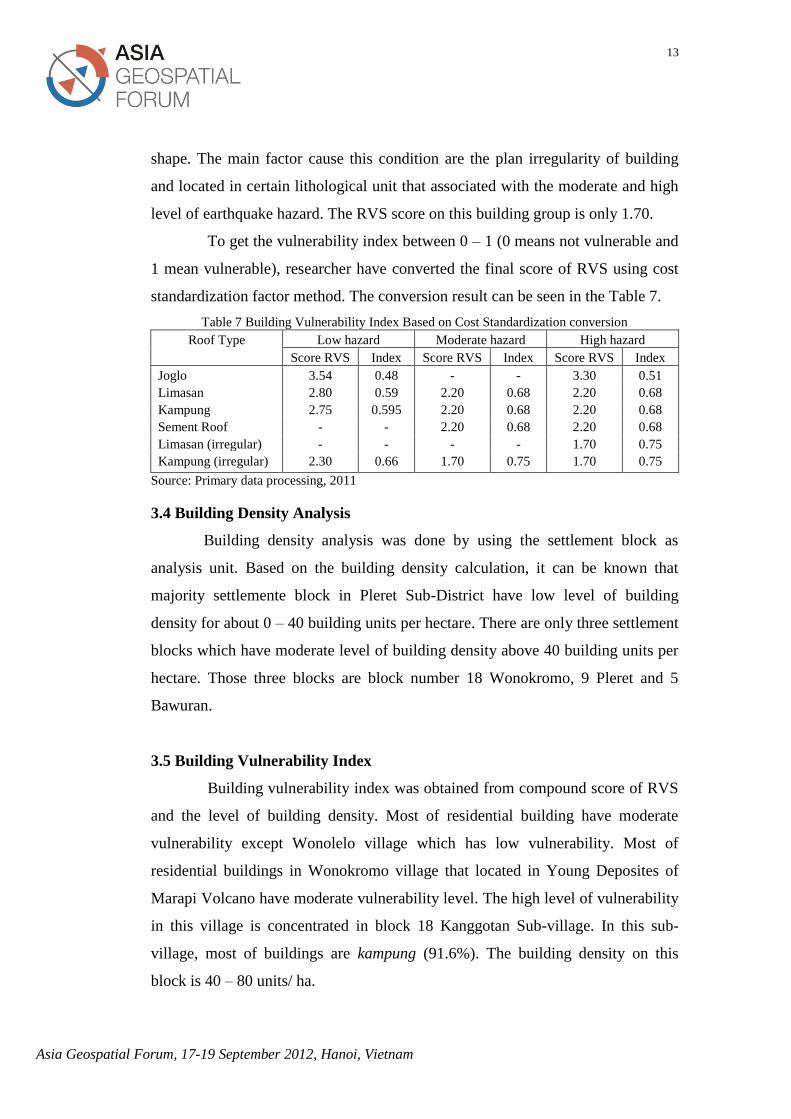
Gambar 5 Tingkat Kerentanan Bangunan Tempat Tinggal Menurut Tipe Atapnya
Sumber: Pengolahan data primer, 2011
Based on the result of vulnerability assessment using RVS procedure, it
can be known that Joglo, the traditional Javanese roof type, has the highest score
of RVS for abour 3.54 (Picture 5). This score is average value from the final score
and it means that this buildings is not vulnerable (above the limit 1.75). The
higher the RVS score indicates that the stronger the building and the lower of
probability of building collapse. The vulnerable building which has lower score of
RVS are buildings with kampung and limasan roof design and have irregular
2,1 %
1,3 %
0,4 %
Vulnerability Limit FEMA 154, 2002)
Joglo
Kampung (regular)
Limasan (irregular)
Limasan (regular)
Cement roof type
Kampung (irregular)
Low Hazard Area Moderate Hazard Area High Hazard Area
Cement
roof type
Limasan
Irregular Kampung
Irregular
13
Asia Geospatial Forum, 17-19 September 2012, Hanoi, Vietnam
shape. The main factor cause this condition are the plan irregularity of building
and located in certain lithological unit that associated with the moderate and high
level of earthquake hazard. The RVS score on this building group is only 1.70.
To get the vulnerability index between 0 – 1 (0 means not vulnerable and
1 mean vulnerable), researcher have converted the final score of RVS using cost
standardization factor method. The conversion result can be seen in the Table 7.
Table 7 Building Vulnerability Index Based on Cost Standardization conversion
Roof Type Low hazard Moderate hazard High hazard
Score RVS Index Score RVS Index Score RVS Index
Joglo 3.54 0.48 - - 3.30 0.51
Limasan 2.80 0.59 2.20 0.68 2.20 0.68
Kampung 2.75 0.595 2.20 0.68 2.20 0.68
Sement Roof - - 2.20 0.68 2.20 0.68
Limasan (irregular) - - - - 1.70 0.75
Kampung (irregular) 2.30 0.66 1.70 0.75 1.70 0.75
Source: Primary data processing, 2011
3.4 Building Density Analysis
Building density analysis was done by using the settlement block as
analysis unit. Based on the building density calculation, it can be known that
majority settlemente block in Pleret Sub-District have low level of building
density for about 0 – 40 building units per hectare. There are only three settlement
blocks which have moderate level of building density above 40 building units per
hectare. Those three blocks are block number 18 Wonokromo, 9 Pleret and 5
Bawuran.
3.5 Building Vulnerability Index
Building vulnerability index was obtained from compound score of RVS
and the level of building density. Most of residential building have moderate
vulnerability except Wonolelo village which has low vulnerability. Most of
residential buildings in Wonokromo village that located in Young Deposites of
Marapi Volcano have moderate vulnerability level. The high level of vulnerability
in this village is concentrated in block 18 Kanggotan Sub-village. In this sub-
village, most of buildings are kampung (91.6%). The building density on this
block is 40 – 80 units/ ha.
14
Asia Geospatial Forum, 17-19 September 2012, Hanoi, Vietnam
In Pleret village, the vulnerable buildings are located in block 9 i.e. east
part of Kaputren sub-village. The roof type composition on this villages are
94.5% kampung, limasan (4.8%) and joglo (0.7%). The building density reach 40
– 80 units/ ha and categorized as moderate building density. Overall, the
vulnerability level of residential building in Pleret village are moderate.
In Bawuran village, the high vulnerability buildings are concentrated in
block 5 (Bawuran Dua sub-village). The characteristic on this block is similar to
the previous mentioned block. Dominated by kampung roof type followed by
limasan with only around 5 % and joglo with only 0.1%. The building density in
this block is relatively high with 40 – 80 units/ ha. Overall, Bawuran village is
dominated by residential buildings which have moderate level of earthquake
vulnerability likewise in Segoroyoso and Wonolelo. It also can be conclude that
stiff material like Semilir and Nglanggran are able to absorb the seimic tremor
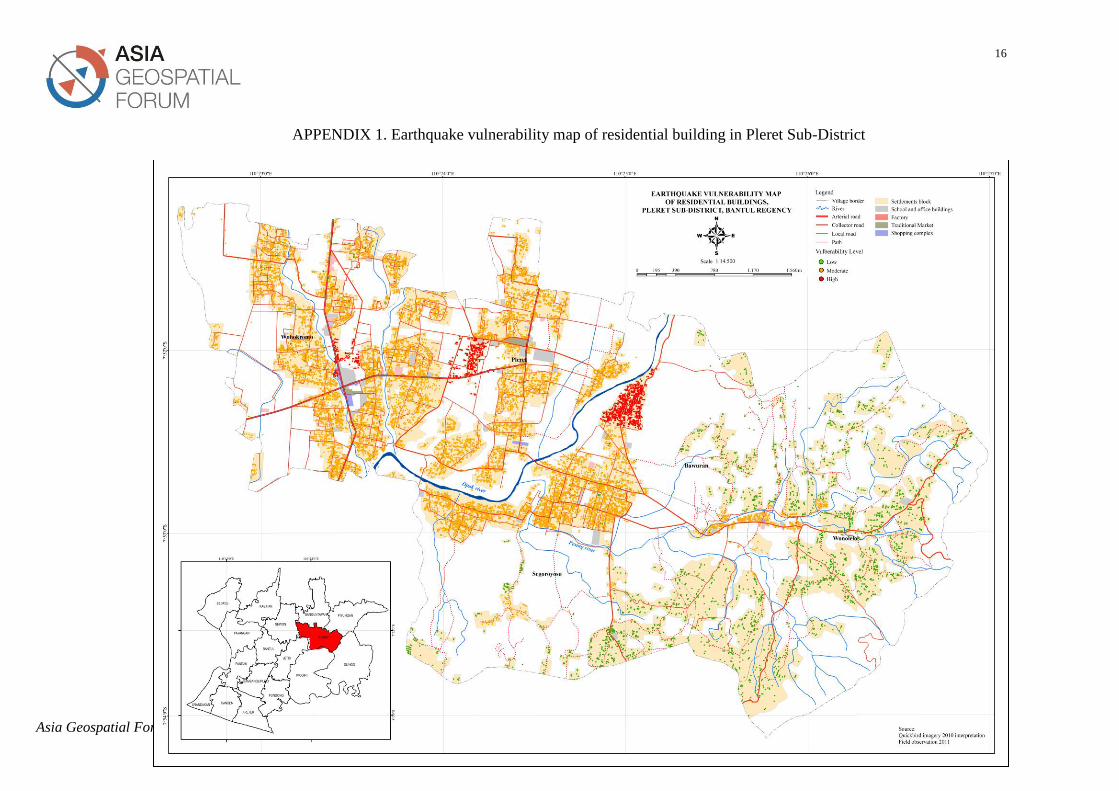
when earthquake happen. The vulnerability map of residential buildings can be
seen in Appendix 1.
IV. CONCLUSION
Majority residential buildings in Pleret sub-district have moderate level
of earthquake vulnerability (between 0.55 – 0.65 of vulnerability index). This
vulnerability index was produced from three main aspects calculation i.e. geology
charachteristic, RVS score and building density. The high level of earthquake
vulnerability are concentrated on several locations in Pleret Sub-District such as
Block 18 at Wonokromo village, Block 9 at Pleret Village and Block 5 at
Bawuran village. Those three village have the same moderate level of building
density. The low level of earthquake vulenarability are accupied on Wonolelo
village which has stiff surface material (Semilir and Nglanggran Formation)
15
Asia Geospatial Forum, 17-19 September 2012, Hanoi, Vietnam
DAFTAR PUSTAKA
Anonim. 2002. Keputusan Menteri Permukiman dan Prasarana Wilayah No
403/KPTS/M/2002 tentang Pedoman Teknis Pembangunan Rumah
Sederhana Sehat (Rs SEHAT).
Badan Perencanaan Pembangunan Daerah Kabupaten Bantul. 2008. Rencana
Detail Tata Ruang Kawasan (RDRTK) Kecamatan Pleret. BAPPEDA
Kabupaten Bantul. Yogyakarta
Bappenas. 2006. Preliminary Damage and Loss Assessment. Consultatif Group
Indonesia. Jakarta.
Bath, M. 1979. Introduction to Seismology,Second Edition. Birkhauser. Verlaag.
BPS. 2010. Pleret Dalam Angka. Badan Pusat Statistik (BPS). Yogyakarta
Carter. 1991. Disaster Management: A Disaster Manager’s Handbook,1. Asian
Development Bank. Manila Philippines.
FEMA. 2002. Rapid Visual Screening of Buildings for Potential Seismic Hazards:
A Handbook FEMA 154, Edition 2. The Federal Emergency Management
Agency (FEMA). Washington, DC.
Jimme. 2006. Seismic Vulnerability and Capacity Assessment at Ward Level A
Case Study of Ward No.20, Lalitpur Sub-Metropolitan City, Nepal. MSc
Thesis, ITC. Enschede, Netherland.
Nurwihastuti. 2008. Integrasi Pemrosesan Citra ASTER dan Sistem Informasi
Geografis Untuk Kajian Geomorfologi Studi Kasus di Sebagian Daerah
Istimewa Yogyakarta. Tesis S-2. Fakultas Geografi UGM. Yogyakarta.
Ronald, A. 1997. Ciri-Ciri Karya Budaya Di Balik Tabir Keagungan Rumah
Jawa: Cetakan kedua. Penerbitan Universitas Atma Jaya. Yogyakarta
Santoso, S. 2003. Studi Potensi Bahan Galian Sebagai Bahan Baku Industri
Keramik di Kabupaten Blitar Bagian Selatan (Ditinjau Dari Aspek
Geologi dan Geomorfologi). Skripsi S-1. Fakultas Geografi UGM.
Yogyakarta.
16
Asia Geospatial Forum, 17-19 September 2012, Hanoi, Vietnam
APPENDIX 1. Earthquake vulnerability map of residential building in Pleret Sub-District
17
Asia Geospatial Forum, 17-19 September 2012, Hanoi, Vietnam
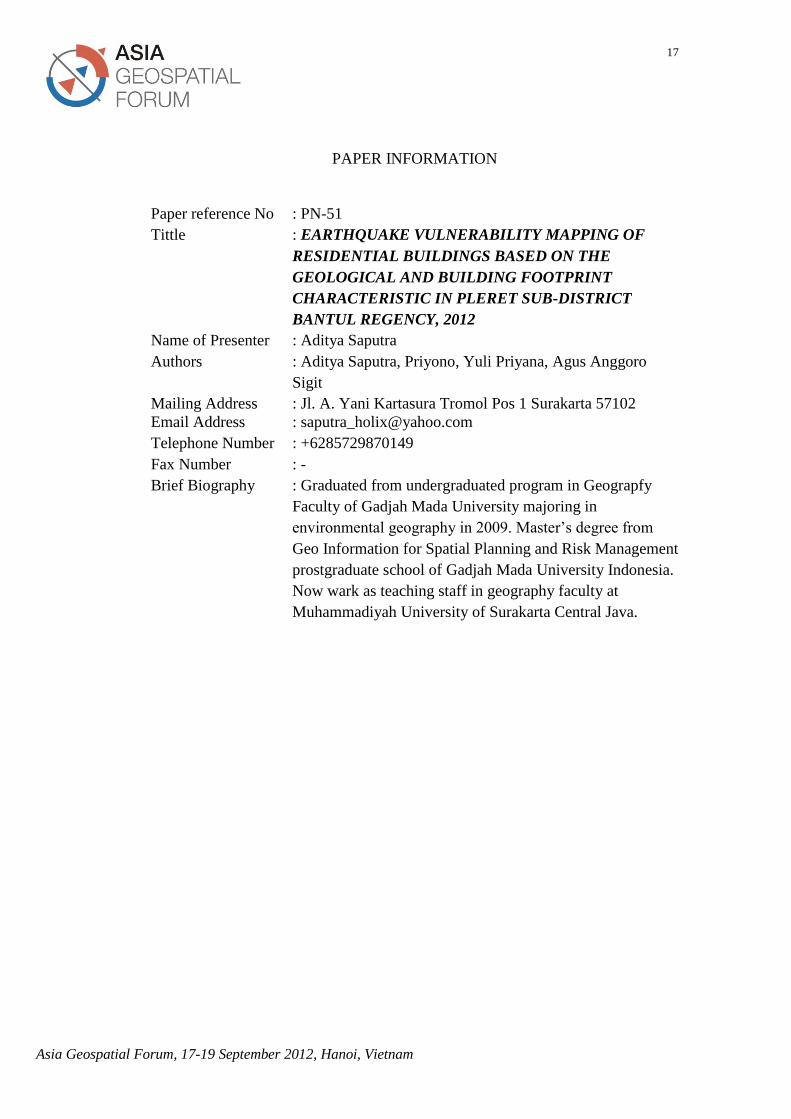
PAPER INFORMATION
Paper reference No : PN-51
Tittle : EARTHQUAKE VULNERABILITY MAPPING OF
RESIDENTIAL BUILDINGS BASED ON THE
GEOLOGICAL AND BUILDING FOOTPRINT
CHARACTERISTIC IN PLERET SUB-DISTRICT
BANTUL REGENCY, 2012
Name of Presenter : Aditya Saputra
Authors : Aditya Saputra, Priyono, Yuli Priyana, Agus Anggoro
Sigit
Mailing Address : Jl. A. Yani Kartasura Tromol Pos 1 Surakarta 57102
Email Address : [email protected]
Telephone Number : +6285729870149
Fax Number : -
Brief Biography : Graduated from undergraduated program in Geograpfy
Faculty of Gadjah Mada University majoring in
environmental geography in 2009. Master’s degree from
Geo Information for Spatial Planning and Risk Management
prostgraduate school of Gadjah Mada University Indonesia.
Now wark as teaching staff in geography faculty at
Muhammadiyah University of Surakarta Central Java.


![tworeal4u1@yahoo.com [mailto:tworeal4u1@yahoo.com]clkrep.lacity.org/onlinedocs/2015/15-1368_pc_01-25-16.pdf · From: Cameron Moore [mailto:kobys8@yahoo.com] Sent: Monday, January](https://img.pdfslide.us/doc/110x75/5e34bdff6a95ba262b2e2de7/tworeal4u1yahoocom-mailtotworeal4u1yahoocom-from-cameron-moore-mailtokobys8yahoocom.jpg)