Embed Size (px)
Citation preview
1
2
Earthquake Risk Study for Oregon's Critical Energy Infrastructure Hub
Yumei Wang, DOGAMI,
Steven F. Bartlett, University of Utah, and Scott B. Miles, Western Washington University
Table of Contents
Summary of Report..........................................................................................................................5
Section 1.Introduction....................................................................................................................16
Background
Objective
Use of this Study
Scope of Work
Study Methods
Limitations
Report Organization
Funding
Section 2. Characterization of Oregon's Natural Hazards.............................................................27
Natural Hazards and Risk
Development of Risk Matrix
Method to Develop Risk Score
Previous Statewide Earthquake Studies
Statewide Damage and Loss Estimates
Lessons from Recent Subduction Zone Earthquakes
Section 3. Oregon's Energy Sector................................................................................................33
Overview of Energy Sector
Critical Energy Infrastructure (CEI) Hub: Project Study Area
Economic Interdependencies with the Energy Sector
Comparison with Other Economic Studies
3
Section 4. Seismic Hazards in the CEI Hub..................................................................................39
Seismic Hazards in the CEI Hub Area
Active Fault Sources
Ground Shaking Characteristics
Earthquake Intensity
Potentially Unstable Soils
Liquefaction
Lateral Spreading
Co-Seismic Settlement
Bearing Capacity Failures
Landslides
Seiches
Fires
Hazardous Material Releases
Ground Deformation Analyses in the CEI Hub
BPA Study
Lateral Spreading Sensitivity Study
Section 5. Energy Facilities and Vulnerabilities in the CEI Hub..................................................61
CEI Hub Facilities: Liquid Fuel, Natural Gas and Electricity
Oregon Building Code Influences in the CEI Hub
Oil Terminal Facilities
Port structures
MOTEMS and CEI Hub Ports
Seismic Pipeline Vulnerability
Non-Energy Facilities and Structures
Waterway Transportation to the CEI Hub
Section 6. Summary of Findings....................................................................................................90
Seismic Risk in the CEI Hub
Lack of System Redundancies
System Interdependencies
Liquid Fuel
Natural Gas
Electricity
Impacts to Oregon

4
Section 7. Recommendations.......................................................................................................100
Recommendations
Recommendation #1: Conduct Seismic Vulnerability Assessments
Recommendation #2: Institutionalize Long-Term Mitigation Programs
Recommendation #3: Oversight by Homeland Security Council
Recommendation #4: Build Oregon’s Seismic Resilience
Recommended Practices for Building Seismic Resilience
Risk Management Approach
Encourage a Culture of Earthquake Preparedness
Section 8. Acknowledgments.......................................................................................................120
Section 9. References...................................................................................................................124
Section 10. Appendices................................................................................................................130
A. Oregon Economic Interdependency Assessment of the Energy Sector.....................131
B. Lateral Spreading Sensitivity Study..........................................................................146
C. Telecommunications: Seismic Codes and Guidelines...............................................157
5
Summary of Report Earthquake Risk Study for Oregon's Critical Energy Infrastructure Hub
Six magnitude 5 or higher earthquakes have occurred within the Portland metropolitan area in
the past 150 years. The Cascadia Subduction Zone has produced more than 40 large magnitude
earthquakes in the past 10,000 years. The most recent occurred on January 26, 1700 with an
estimated magnitude 9. These occurrences and extensive scientific understanding of seismic
processes indicate that it is not a question of if Oregon will experience a catastrophic earthquake,
but when it will occur.
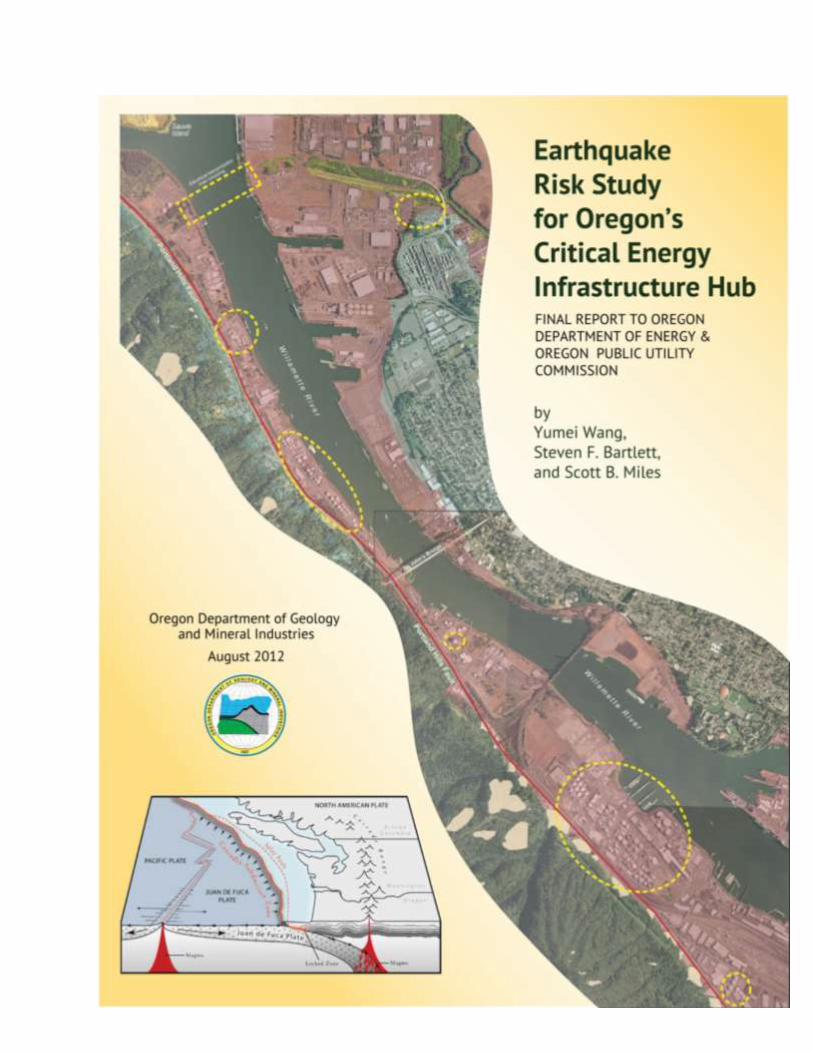
Oregon’s critical energy infrastructure (CEI) Hub is located in an area with significant seismic
hazard. Significant liquid fuel, natural gas and electrical infrastructure and facilities are situated
in this relatively small area in Portland. The CEI Hub covers a six-mile stretch on the lower
Willamette River located between the south tip of Sauvie Island and the Fremont Bridge on US
Highway 30. The energy sector facilities in the CEI Hub include:
All of Oregon’s major liquid fuel port terminals
Liquid fuel transmission pipelines and transfer stations
Natural gas transmission pipelines
Liquefied natural gas storage facility
High voltage electric substations and transmission lines
Electrical substations for local distribution
More than 90 percent of Oregon’s refined petroleum products come from the Puget Sound area
of Washington State. Oregon imports the product by pipeline and marine vessels to the CEI Hub
before it is distributed throughout Oregon to the end user. One large consumer is the Portland
International Airport. In addition, much of NW Natural’s natural gas passes through the CEI
Hub. A high voltage electrical transmission corridor crosses the area as well as supplies
distribution for this area.
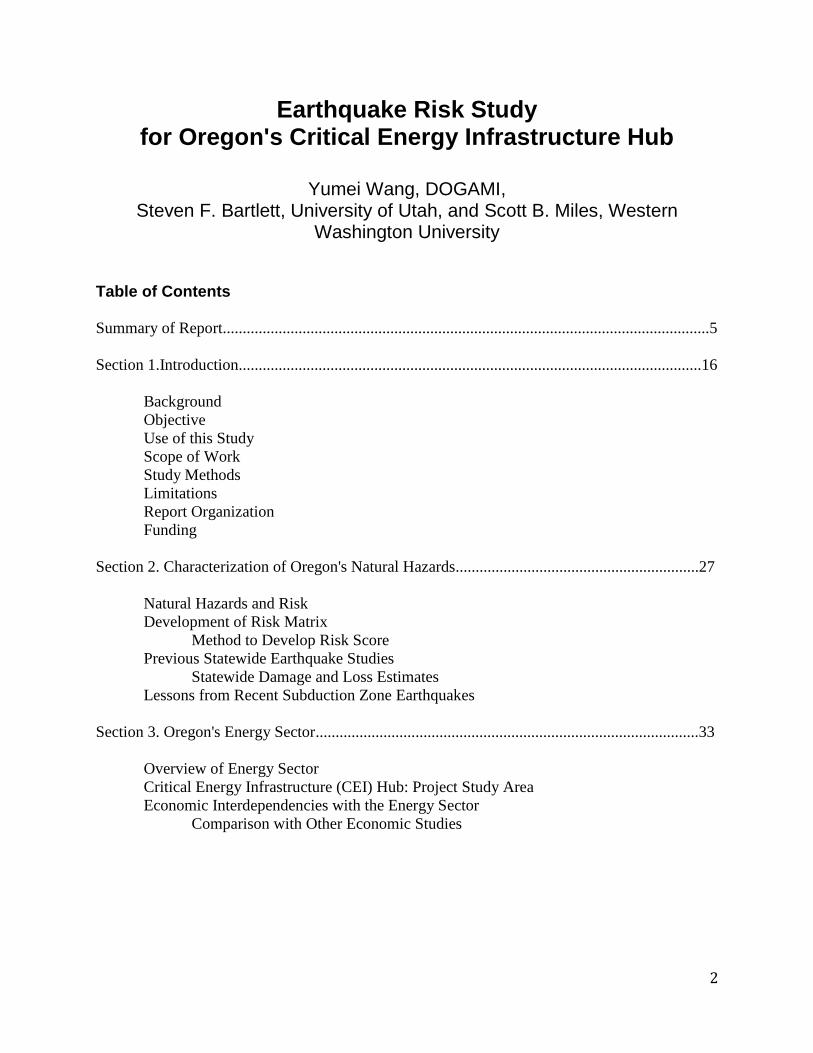
Site map of the Critical Energy Infrastructure (CEI) Hub on the western bank of the Lower
Willamette River area in NW Portland, Oregon. The CEI Hub, outlined in red, stretches for six
miles. (Google Earth)
6
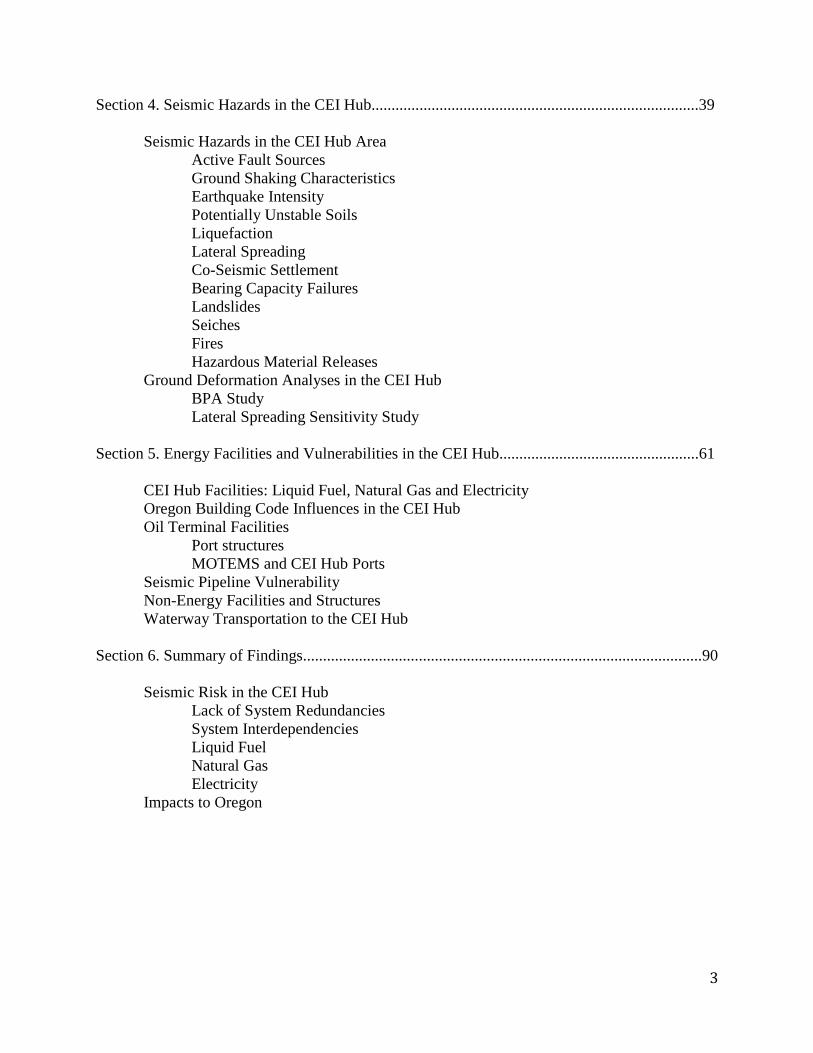
Oil terminals in the CEI Hub. (DOGAMI photo)
Earthquake Risk Study for Critical Energy Infrastructure Hub
The Oregon Department of Geology and Mineral Industries (DOGAMI) conducted an
earthquake risk study on Oregon’s CEI Hub as part of the Oregon Energy Assurance Project
(EAP) with Oregon Department of Energy (ODOE) and Public Utility Commission of Oregon
(OPUC). The study focuses on a large-magnitude Cascadia earthquake which because of
widespread shaking and vulnerable infrastructure poses a high risk to the health and safety of
Oregonians and the region’s economy. The study identifies and defines the CEI Hub area,
assesses the seismic hazards and identifies the vulnerabilities of the petroleum (liquid fuel),
natural gas, and electric energy facilities in the CEI Hub.
Oregon’s Natural Hazards
Oregon has numerous natural hazards. These range from high probability (fires) to low
probability (volcanic eruptions). Earthquakes are considered to have a moderate probability
because earthquakes in Oregon are rare. The earthquake vulnerability score for Oregon,
however, is very high because a vast majority of Oregon’s existing infrastructure has been
designed and constructed without seismic resistance considerations. The earthquake consequence
score is also very high because damage will likely be widespread and, in many places, severe.
Finally, the earthquake overall risk score is very high because when a major earthquake occurs, it
will likely result in a high loss of life, economic damages and long-term impacts.
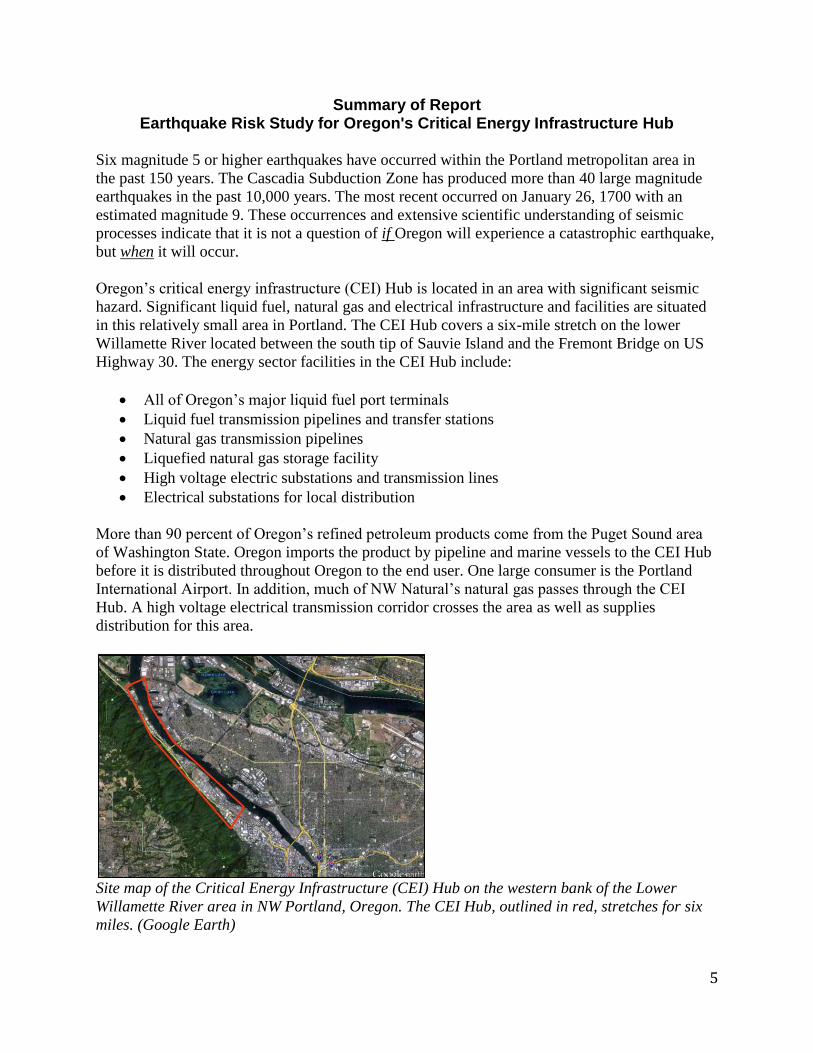
Cascadia seismic source is Oregon’s most threatening fault and can produce a magnitude 9
earthquake and accompanying coastal tsunami waves. (DOGAMI)

7
Energy Facilities in the CEI Hub
A significant portion of Oregon’s electricity, natural gas, and fuel oil infrastructure is
concentrated in the CEI Hub (a six-mile stretch in the lower Willamette River located between
the south tip of Sauvie Island and the Fremont Bridge on US Highway 30). A magnitude 8 or 9
Cascadia Subduction Zone earthquake would impact the CEI Hub with:
Ground shaking
Liquefaction (soil behavior phenomenon in which a saturated sand softens and loses
strength during strong earthquake ground shaking)
Lateral spreading (where surficial soil permanently moves laterally due to earthquake
shaking)
Landslides
Co-seismic settlement (where the ground surface is permanently lowered due to seismic
shaking)
Bearing capacity failures (when the foundation soil cannot support the structure it is
intended to support)
In addition, secondary seismic hazards could be initiated and include:
Seiches (waves that oscillate in water bodies often initiated by ground shaking)
Fire
Hazardous material releases, including by sloshing of liquid agitated by ground shaking
Liquefaction and lateral spreading hazards are of primary concern to the oil terminals that handle
Oregon's fuel supply. The CEI Hub is adjacent to the Willamette River and has extensive
deposits of highly liquefiable soils. These soils (made of sands, silts, gravels and clays) have
been naturally deposited by river activity as well as been created from man-made activities, such
as hydraulically placed material from river dredging or debris placed as landfill. For this reason,
DOGAMI performed ground deformation analyses to better understand the nature of the hazard
and the possible mitigation needs. A section on the deformation analyses is included in this
study. Tsunamis are expected to damage the coastal areas, including ports along the coast and
Columbia River mouth, but are not expected to cause significant damage in the Portland
waterways.
DOGAMI staff and others visited all relevant energy companies with facilities in the CEI Hub.
DOGAMI and ODOE staff conducted site visits at these petroleum facilities: BP, Chevron,
ConocoPhillips, KinderMorgan (KM) fuel terminals and KM pipeline, McCall Oil, Nustar, and
Shell. The fuel facilities often include: transmission and distribution pipelines, piers or wharves,
tank farms, loading racks, control buildings, electric distribution equipment, and many other
components. The liquid fuel transmission system includes gate stations, and transmission and
distribution pipes at the Columbia and Willamette river crossings. DOGAMI and OPUC staff
also conducted site visits of natural gas and electrical facilities owned by NW Natural, Portland
General Electric, and the Bonneville Power Administration (BPA).
General Findings
The CEI Hub facilities have infrastructure that ranges from about 100 years old built to no or
very antiquated standards to new infrastructure built to the current state-of-practice standards.
Because of the wide range of ages and associated construction practices, the seismic
8
vulnerability of the facilities also spans a wide range. Based on visual observations, engineering
judgment and limited information from the facility operators, major seismic vulnerabilities exist
in the CEI Hub. The vast majority of the facilities are constructed on soils susceptible to
liquefaction. Some critically important structures appear to be susceptible to significant damage
in a major earthquake. In addition, DOGAMI discovered that older building codes and practices
did not adequately address many non-building structures that exist in the CEI Hub, such as tanks,
pipes, and piers. One explanation is because non-building structures typically hold few, if any,
people and the focus of the building code has traditionally been on life safety. Current building
codes do not adequately address the seismic deficiencies in existing CEI Hub facilities. The
expected length of time to resume services after a Cascadia earthquake has not been evaluated by
any company except BPA.
Sector Specific Findings
Liquid Fuel
Liquid fuel pipeline: The CEI Hub petroleum facilities receive liquid fuel via two methods: 1)
the liquid fuel transmission pipeline, and 2) marine vessels. The transportation method and
amounts vary due to product need, transportation costs, weather and other conditions. The liquid
fuel pipeline was largely constructed in the 1960s when the regional seismic hazards were
unknown and state-of-practice construction techniques at that time did not include any reference
to seismic standards. The regional seismic hazards are now known to be significant and the soils
at the river crossings are susceptible to liquefaction and lateral spreading. The 1960s vintage
pipeline design did not consider ground movements from lateral spreading at river crossings or
the stresses to the pipelines induced by earthquakes that may cause pipe damage and multiple
breaks. A pipe break would have a significant impact on all of the petrochemical facilities in the
CEI Hub and could result in a statewide fuel shortage.
Shipping channel: The navigational channel from the Columbia River mouth to the lower
Willamette River is used to transport fuel by marine vessels. The Columbia River mouth is
expected to have tsunami damage and the channel is expected to experience slope failure, which
would close the channel to traffic. It is possible that bridges and other river crossings, such as
buried gas pipelines and electrical crossings, would be damaged and temporarily block the
waterway. Closure of the shipping channel would prevent marine vessels from delivering liquid
fuel as well as emergency response and recovery equipment from being delivered.
Marine terminals: All of the port facilities in the CEI Hub have significant seismic risks due to
liquefaction, lateral spreading, and seiches. Some older piers were constructed without any
seismic protection, have deteriorated, and are likely to fail in even a moderate earthquake. If oil
products are released and contaminant the navigable waterway, the waterway may be closed to
river traffic thus impeding emergency response activities as well as the supply chain. The local
capacity to fight fires and clean hazardous material spills is limited.
Fuel supply: Only three existing tanks are known to have addressed liquefaction vulnerabilities.
The fuel terminals in the CEI Hub on average have a three to five day supply in the tank farms
for regular unleaded gasoline and diesel fuel. Premium gasoline is subject to the daily delivery
and heavily dependent on whether the intercompany pipeline on Front Avenue is operational. If
the supply chain is disrupted by pipe breaks north of the CEI Hub and closure of the shipping
9
channel to the west, fuel would quickly become scarce. Options to transport fuel from the east
and south and by air are very limited.
Portland International Airport (PDX): PDX airport receives 100 percent of their liquid fuels from
a terminal in the CEI Hub. PDX has a limited on-site fuel supply. If the pipeline between the CEI
Hub and PDX fails, then PDX would likely experience a shortfall and operations would be
impacted.
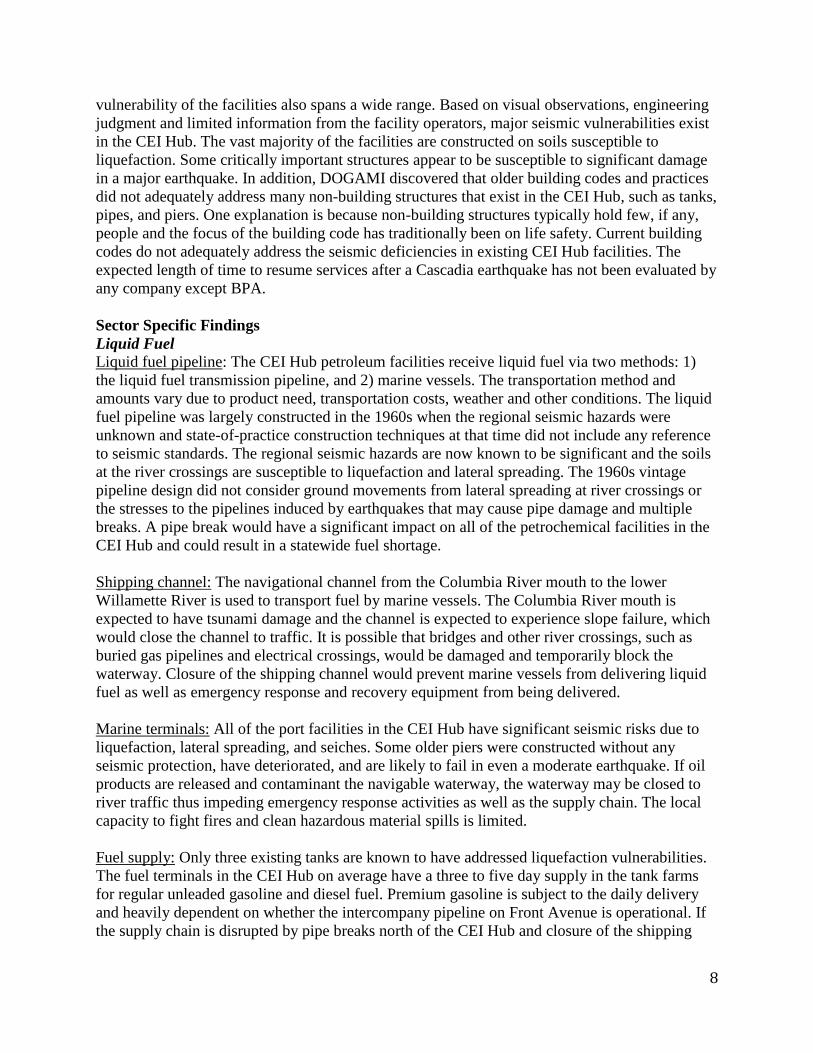
Left: Lateral timber bracing for steel plumb piles in the CEI Hub is considered inadequate by
California’s MOTEMS standards. (DOGAMI photo) Right: An example of a damaged pier in the
2010 Chile earthquake (Technical Council on Lifeline Earthquake Engineering – TCLEE, 2010)
This under-designed oil terminal pier foundation (left) in area with high susceptibility for
liquefaction and lateral spreading in the CEI Hub and the poor timber-to-concrete oil terminal
pier connection and exposed rebar foundation (right) in the CEI Hub are considered inadequate.
(DOGAMI photo)

10
The connection on this pier in the CEI Hub appears to have deteriorated due to a split in the
timber beam. This type of damage suggests that the condition of the structure may not be
routinely monitored and maintained and that the overall pier is seismically vulnerable.
(DOGAMI photo)
The approach (foreground) to the 1966 Astoria-Megler Bridge that spans the Columbia River
has major structural deficiencies that could lead to a collapse following an earthquake.
Damaged bridge sections could block waterway access to the CEI Hub. (DOGAMI photo)
Natural Gas Natural gas: Oregon's largest natural gas service provider receives the majority of their natural
gas from pipelines that cross under the Columbia River both near Sauvie Island and also
between Washougal, Washington and Troutdale, Oregon. One of the natural gas pipelines
crosses under the Willamette River at Multnomah Channel near their gate station at the southern
end of Sauvie Island. The soils at these river crossings are subject to liquefaction and lateral
spreading, the pipes are 1960s vintage and constructed without seismic design provisions, and
the consequences of potential pipe failures could be major for natural gas service territories and
Oregon. The natural gas company’s storage capacity is limited and pipe breaks could lead to a
natural gas shortfall in the state as well as explosions or fires.
Electricity Electrical facilities: Electrical facilities and systems have significant seismic risk due to ground
shaking and ground failure, including liquefaction and lateral spreading. Seismically vulnerable

11
facilities include substations and transmission in the CEI Hub as well as facilities outside of the
CEI Hub, including power plants, substations and transmission lines, all which are important for
distribution.
Major vulnerabilities in the CEI Hub include the control buildings, transformers and other
electrical equipment in yards at the substations, and transmission towers near the Willamette
River. Damage is likely to occur to both the transmission system and the distribution system in
the CEI Hub. Damage to the electrical grid will likely result in a blackout in the CEI Hub and
elsewhere.
BPA: Bonneville Power Administration (BPA) has conducted a comprehensive seismic
vulnerability study of their system and has had a long-term seismic mitigation program in place
since 1993. BPA’s long-term seismic mitigation program includes 1) investment protection (e.g.
anchoring transformers), and 2) power system recovery of critical paths (e.g. hardening of
equipment at one of multiple bays within a major substation). The first phase of BPA's
mitigation program includes bracing and restraining critical equipment and seismically
upgrading critical building facilities west of the Cascade Range. Seismic strengthening in the
substation yard would typically include: anchoring high-voltage power transformers; bracing
transformer conservators and radiators; replacing seismically vulnerable live tank circuit
breakers with more robust dead tank circuit breakers; adding damping systems to existing live
tank circuit breakers; hardening transformer bushing storage facilities; replacing rigid bus
connections with flexible bus. These mitigation techniques will improve the reliability of seismic
performance. Additional phases of the seismic mitigation program will include facilities east of
the Cascade Range.
BPA has a critical 115 kV and 230 kV high voltage transmission river crossing in the CEI Hub
as well as a substation. At the substation in the CEI Hub, some of the high-voltage equipment
had been anchored and braced to withstand earthquake motions. BPA is in the process of
conducting seismic strengthening of the control building and equipment inside the control
building (e.g., brace computer floors, control cabinets, battery racks, ceiling, pipes, etc) and
additional mitigation in the yard. BPA has conducted subsurface, liquefaction and lateral
spreading analyses at one of the transmission tower sites at the Willamette River crossing and
concluded severe ground movement up to 25 feet towards the river channel is possible. Until
mitigated, it is likely that at least two transmission towers would experience extensive damage,
be inoperable, require repair or replacement, and power lines could temporarily block river
traffic, including the pathway to the oil terminals. The BPA transmission towers at the
Willamette River crossing are scheduled to be seismically analyzed, have a seismic mitigation
design completed in 2013, and be mitigated by 2014.
Recent unpublished BPA Cascadia earthquake scenario studies of the existing transmission line
system indicate that their main grid would require between 7 and 51 days to make emergency
damage repairs to the transmission line system (Oregon and Washington) from a magnitude 9
Cascadia earthquake. This scenario assumes many ideal conditions (BPA employees and
contractor resources are immediately available, all roads and bridges are passable, available fuel,
etc), which is optimistic.
12
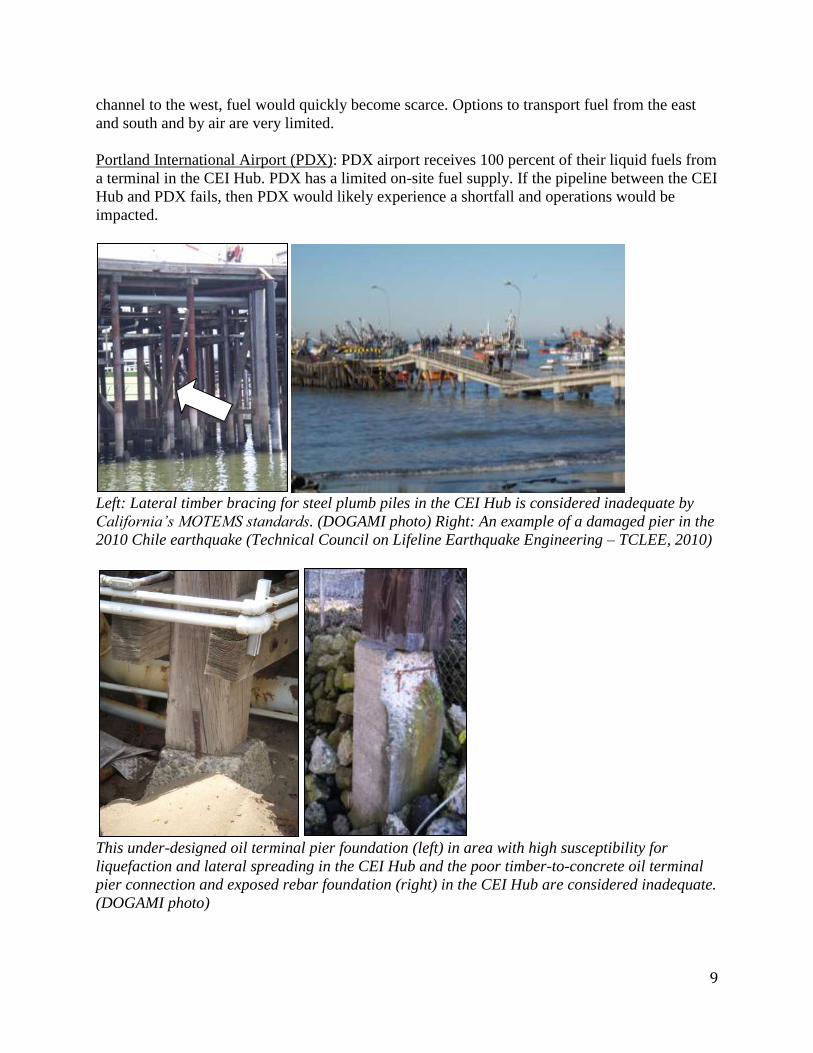
Left: These high voltage electrical transmission towers are built on a river bank in the CEI Hub
susceptible to lateral spreading. (DOGAMI photo) Right: Structural damage to a high voltage
transmission tower located at a river crossing in 2010 Chile earthquake (Technical Council on
Lifeline Earthquake Engineering – TCLEE)
Impacts to Oregon
Based on visual observations, engineering judgment, limited analyses, and limited information
from the facility operators, city records, and available literature, significant seismic risk exists in
the CEI Hub. Some critically important structures appear to be susceptible to significant damage
in a major earthquake with catastrophic consequences. Multiple liquid fuel transmission pipe
breaks and natural gas transmission pipe breaks are possible. Damage to liquid fuel, natural gas,
and electrical facilities in the CEI Hub is likely. The waterway would likely be closed and
require clean up.
Due to a combination of the existing seismic hazards, vulnerability of the exposed infrastructure
and potential consequences, Cascadia earthquakes pose substantial risk to the CEI Hub and to
Oregon. Not only are the energy sector facilities in the CEI Hub dependent on other sectors and
systems in Oregon, including transportation and communication, they are interdependent upon
each other. A major Cascadia earthquake and tsunami would likely produce an unprecedented
catastrophe much larger than any disaster the state has faced.
Western Oregon will likely face an electrical blackout, extended natural gas service outages,
liquid fuel shortage, as well as damage and losses in the tens of billions of dollars in a future
major Cascadia earthquake. Preparing for a catastrophic disaster to become more resilient is
needed to improve personal safety and security, and safeguard communities and businesses.
Recommendations
The most critical call-to-action that DOGAMI has concluded from this study of the CEI Hub is
this: Energy sector companies must pro-actively integrate seismic mitigation into their
business practices for Oregon’s energy sector to adequately recover from a magnitude 8.5 to 9
Cascadia earthquake in a reasonable time period.
Although energy sector companies have made efforts to prepare for seismic events, such as
through emergency planning and complying with the current building codes, these efforts are

13
limited and a timely restoration of energy sector services is questionable. As discussed in the
Summary of Findings section, only one company has completed comprehensive seismic
vulnerability assessments and instituted seismic mitigation plans. Energy sector companies must
make earthquake mitigation an integral part of their overall business plan. This is not only
prudent for the impact a large magnitude Cascadia earthquake would have on Oregonians and the
environment; it is good business continuity management. Oregon homes, businesses and
industries depend upon reliable energy sources. Liquid fuel, natural gas and electricity are
critical to our economy, environment and everyday existence, and the energy sector must do
more in order to assure those services and products in the event of a large earthquake.
In order for the energy sector to pro-actively integrate seismic mitigation into their operations,
DOGAMI makes these four recommendations to both private and public energy sector
stakeholders:
1. Energy sector companies should conduct Seismic Vulnerability Assessments on all of
their systems or facilities, and should work with the appropriate local, state, tribal and
federal government agencies and stakeholders to achieve timely completion of the
assessments to understand existing vulnerabilities.
2. Energy sector companies should institutionalize long-term seismic mitigation programs;
and should work with the appropriate local, state, tribal and federal government agencies
and stakeholders to achieve timely and effective mitigation to ensure facility resilience
and operational reliability.
3. The State of Oregon's Homeland Security Council should review the vulnerability and
resilience of the energy sector to earthquakes and other natural disasters within the scope
of their mission. This could involve the EAP partners (ODOE, OPUC, and DOGAMI) as
well as ODOT, Building Codes Division, and the Oregon Seismic Safety Policy Advisory
Commission (OSSPAC).
4. Energy sector companies and the State of Oregon should build Oregon’s seismic
resilience to a Cascadia earthquake. Adopting pro-active practices and a risk
management approach will help achieve seismic resilience. Encouraging a culture of
awareness and preparedness concerning the seismic vulnerability of the energy sector
including long range energy planning should be conducted.
Emergency batteries, as well as other components such as generators and communication
devices, should be braced or anchored to a withstand Cascadia earthquake. (DOGAMI photo)
14
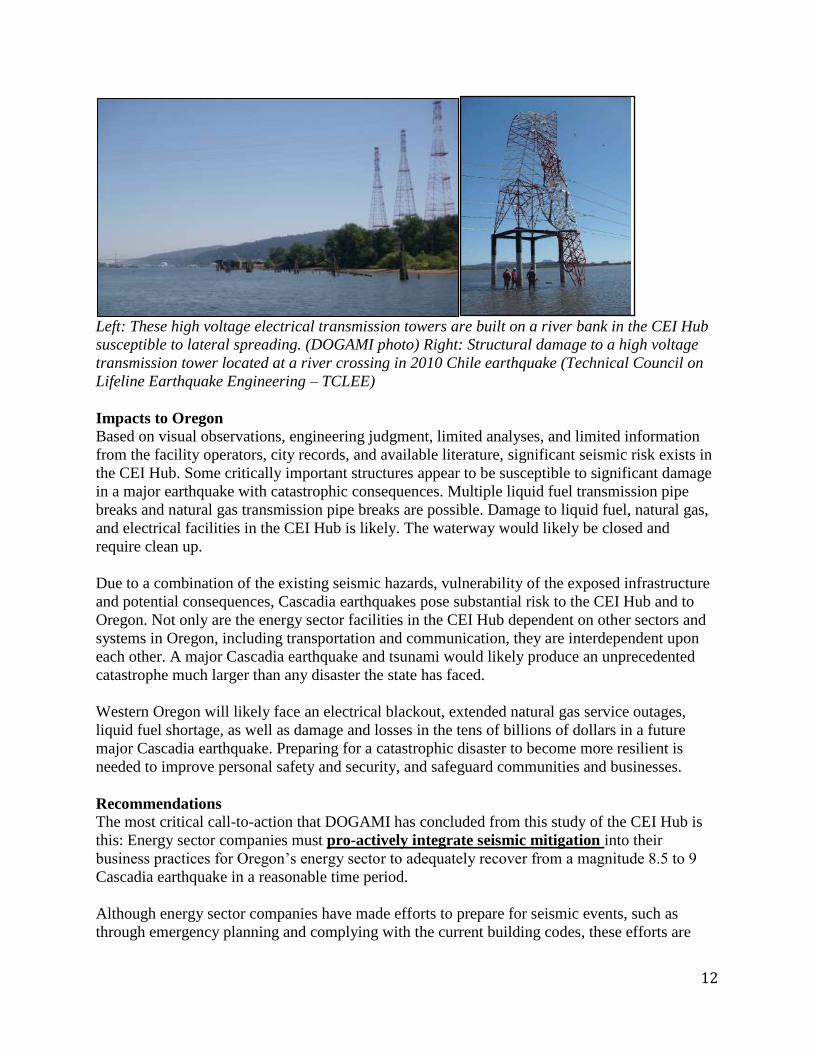
Photo shows the front view of an existing transformer with seismic anchorage including steel
cross bracing as mitigation. (Photo: Leon Kempner)
The length of time to resume services after a Cascadia earthquake should be evaluated by each
energy company to establish a baseline understanding, and improvements to achieve a
satisfactory service level should be made. Improvements, for example, can involve adding stone
columns to strengthen the ground against liquefaction-related damage and anchoring power
transformers to prevent sliding-related damage.
For the EAP, DOGAMI developed the resilience triangle graph with the resilience triangle
shown in green. (See figure) The basic principle of the resilience triangle is that the smaller the
triangle, the higher the resilience. Higher resilience requires minimal reductions in critical
lifeline services after a disaster, speedy recovery of those services, and an overall improved
service level as a result of rebuilding damaged systems and implementing better systems. The
resilience triangle diagram indicates that Chile and Japan have high levels of earthquake
resilience on the basis of their performance after the 2010 magnitude 8.8 earthquake in Chile and
2011 magnitude 9.0 earthquake in Japan (notwithstanding the nuclear energy issues). At the
current stage, Oregon's energy sector has low resilience and is expected to have significant loss
of energy sector services and a slow recovery time.
Funding is essential to increase Oregon’s seismic resilience in the energy sector, and to:
Pay for assistance and oversight to compel private sector companies into action to
conduct Seismic Vulnerability Assessments and implement seismic mitigation programs Support an effective Homeland Security Council on energy security preparedness Build the State of Oregon’s energy resilience
Increase Oregonians’ awareness of the effect of a Cascadia earthquake on energy
availability
As part of this project, DOGAMI and EAP partners promoted seismic awareness of Oregon’s
critical energy infrastructure. We developed productive relationships with other state agencies,
federal agencies, energy sector companies, associations, emergency response organizations and
other major stakeholders regarding seismic preparedness. We conducted table-top exercises and

15
outreach and have more planned with energy companies and associations. The EAP partners
have made more than 60 presentations to various stakeholders during the duration of this study.
Resilience Triangle (modified from MCEER)
These efforts were minimal, however, considering the task at hand. In order to build resilience in
Oregon's energy sector, it is necessary to increase awareness on the risk to the energy sector and
Oregonians from a Cascadia earthquake. There needs to be a cultural shift by Oregonians to
become an earthquake-prepared culture. The energy sector must demonstrate transparency and
accountability concerning Cascadia earthquake preparedness activity.
This study has demonstrated that Oregon’s CEI Hub is vulnerable to a Cascadia earthquake, and
that such an earthquake will impact our supply and sources of liquid fuel, natural gas and
electricity throughout Oregon.
Oregonians should heed this study’s findings, that:
A Cascadia earthquake will occur.
Oregon’s CEI Hub – where critical energy infrastructure is located in a six-mile stretch
of land – is vulnerable to a Cascadia earthquake.
Oregon’s resilience to a Cascadia earthquake is low.
Energy sector companies must adopt best practices and pro-actively integrate seismic
mitigation efforts into their business operations to prepare their facilities and systems to
absorb and recover from a Cascadia earthquake and to sufficiently restore critical
electric, natural gas and liquid fuel services to Oregon homes, businesses and industries
in a reasonable time period. This has not happened to date, as this study has shown.
More stringent oversight authority on seismic preparedness in the energy sector (liquid
fuel, electricity and natural gas) may be needed.
16
Section 1 Introduction
The Oregon Department of Geology and Mineral Industries (DOGAMI) conducted an
earthquake risk study of Oregon’s Critical Energy Infrastructure (CEI) Hub in Portland, Oregon.
This study was conducted as part of a larger U.S. Department of Energy (DOE)-funded Energy
Assurance Project (EAP) conducted by the Oregon Department of Energy (ODOE), Public
Utility Commission of Oregon (OPUC) and DOGAMI. More information on the EAP project is
at http://www.oregon.gov/ENERGY/Recovery/Funding.shtml#Energy_Assurance_Planning,
including the Oregon Energy Assurance Plan
http://www.oregon.gov/ENERGY/docs/OregonStateEnergyAssurancePlan.pdf.
Background Oregon is exposed to many natural hazards, including earthquakes, volcanoes, floods, landslides,
and more. These hazards have varying characteristics, including frequency of occurrence and
severity of possible damage and impact. For example, severe winter storms can occur every few
years and sometimes as often as several times per year. Because of technological advances in
weather forecasting, these storms typically have several days of advance warning. They typically
have limited fatalities (e.g., tens of fatalities or fewer) and can result in flooding, landslides, and
downed trees that impact communities, roads, and electrical service to a limited portion of the
state. The economic impact can reach hundreds of millions of dollars.
In contrast, major earthquakes rarely occur, but there are no systems that allow for days or hours
of advance warning of earthquakes. Major earthquakes in urban areas would likely result in more
damage than winter storms because the existing building inventory has many seismically
deficient buildings that were constructed before modern seismic building codes.
The most likely major earthquake to occur in Oregon is on the Cascadia Subduction Zone, which
is an earthquake fault at the boundary of the Juan de Fuca and North American plates. The next
Cascadia earthquake could be as large as a magnitude 9.2, which would shake a substantial
portion of the Pacific Northwest and create a tsunami that would flood low-lying coastal areas.
Although a magnitude 8 or higher Cascadia earthquake is an infrequent event, it would likely
result in thousands of fatalities and widespread, devastating damage throughout western Oregon.
The consequences from a major Cascadia earthquake would be much greater and farther
reaching than any other natural hazard in Oregon. DOGAMI focused its study on a Cascadia
earthquake of magnitude 8 or higher because of the potential consequences to the state of
Oregon. Specific information on Oregon’s hazards is included in Section 2: Characterization of
Oregon's Natural Hazards and Section 4: Seismic Hazards in the CEI Hub.
Oregon's energy sector will be among many severely impacted industries after a major Cascadia
earthquake. The energy sector involves the petroleum, natural gas and electricity industries. Each
energy industry is a network. The petroleum supply chain involves oil resource development, oil
refineries and distribution systems that include fuel terminals with products as well as multiple
modes of transportation. Likewise, the natural gas supply chain involves resource development,
processing and distribution systems. The electricity supply chain involves generation,
17
transmission and distribution. For Oregon to have a secure and stable energy supply, energy
sector industries must ensure a resilient supply chain during normal operations as well as during
extreme conditions, including a Cascadia earthquake.
This study evaluates seismic hazard, vulnerability, risk and resilience in the CEI Hub. These
concepts have varying meanings among earth scientists, engineeres and social scientists, so for
the purposes of this report, we define them as follows:
Seismic Hazard: The combination of the severity of damaging seismic effects (shaking,
liquefaction, landslides) at a particular location with the frequency with which those
effects occur at that location. A very large earthquake that is very rare poses a small
seismic hazard, as do very frequent but very small earthquakes. High levels of seismic
hazard result from the combination of relatively frequent and relatively large earthquakes.
Sesimic hazard is a function of the size and frequency of the earthquake, its location
relative to the site in question, and geologic conditions at the site.
Seismic Vulnerability: The degree to which a particular structure or system is likely to
sustain damage when exposed to a particular level of damaging seismic effects like
shaking, liquefaction or landsliding. Seismic vulnerability is an intrinsic characteristic of
the structure or system.
Seismic risk: The combination of seismic hazard affecting an area, the vulnerability of
the structures and systems in that area, and the consequences of failure of those structures
and systems.
Seismic Resilience: The ability of a structure, system or community to recover from a
damaging earthquake. Resilience includes not only the resistance of the system to initial
damage, but also the ease and speed with which it can be brought back into service after
the event.
Objective This purpose of this study is to better understand the vulnerabilities of the energy sector when it
is confronted with a magnitude 8 or larger Cascadia earthquake. This risk study focuses on
Cascadia earthquakes because a large magnitude Cascadia earthquake poses the highest risk of
all natural hazards to the state of Oregon (Wang, 2008).
Study goals were to:
Characterize Oregon's natural hazards by developing qualitatively-derived risk scores to
estimate the scale of potential disasters,
Better understand CEI facility operations and learn about site conditions, structures, and
components as well as the systems and interdependencies,
Describe some of the potential critical seismic vulnerabilities in the energy sector, and
Offer recommendations to improve energy sector resiliency to minimize earthquake
impacts.

18
Use of this Study This report provides information to help encourage a seismically resilient energy sector and
protect Oregonians in the event of a future Cascadia earthquake. It can be used to develop
scenarios, demonstrate objectives, and determine extent-of-play for table-top exercises. The
findings in this report can be applied to the development of mitigation, response, and recovery
strategies in the Oregon State Energy Assurance Plan and Energy Sector-Specific Emergency
Response Plans. The findings can also be used in Oregon resilience planning efforts directed by
the Oregon Seismic Safety Policy Advisory Commission (OSSPAC).
Scope of Work DOGAMI was tasked to determine seismic hazard and risk information of critical energy
facilities in Oregon in an intra-governmental agreement with OPUC. DOGAMI did not perform
detailed seismic vulnerability assessments of any specific facility, system or asset.
Although DOGAMI had conducted previous studies on Oregon earthquake resilience, including
Wang 1999, Wang 2008, and Wang 2010a, these studies did not focus on the energy sector.
Because there were many unknowns involving the energy sector, DOGAMI's approach was to:
1) gather information and learn about the state’s energy systems; 2) characterize Oregon's natural
hazards and its impacts on the energy sector; 3) conduct scoping studies; 4) perform document
reviews; 5) collect input and expert opinions from a wide range of professionals (see Section 8:
Acknowledgements); 6) conduct visual screening assessments; and 7) perform our own state-of-
practice engineering studies. The goal was to evaluate the overall vulnerability of the energy
sector to damage at the CEI Hub from a magnitude 8 or larger Cascadia earthquake.
From these activities, DOGAMI created a natural hazard risk matrix based on the natural hazards
recognized by the State of Oregon’s Natural Hazard Mitigation Plan. DOGAMI also defined the
CEI Hub project study area as the six-mile stretch of the lower Willamette River located between
the south tip of Sauvie Island and the Fremont Bridge on US Highway 30. (Figure 1) The project
entailed assessing the seismic hazards of the CEI Hub, identifying the major energy sector
facilities in the CEI Hub, and surveying their seismic vulnerabilities.
DOGAMI staff conducted a review of building codes to help assess the vulnerability of the
structures in the CEI Hub. DOGAMI conducted site visits to all major energy sector facilities in
the CEI Hub (Figure 1) as well as several facilities outside of the CEI Hub. In each case, the
facility's operator accompanied DOGAMI to visually survey their facilities, which is discussed in
the following section: Study Methods.

19
Figure 1: Site map of the Critical Energy Infrastructure (CEI) Hub on the western bank of the
Lower Willamette River area in NW Portland, Oregon. The CEI Hub, outlined in red, stretches
for six miles. (base map: Google Earth)
DOGAMI also partnered with academic earthquake professionals to co-conduct a statewide
economic study focusing on energy sector interdependencies (Appendix A) as well as a ground
deformation analysis for this project (Appendix B). These studies provide specialized technical
information that is useful towards meeting the study objective.
As a result, this earthquake risk study provides generalized information on the seismic hazard,
the exposed facilities, consequences of the seismic hazards to the exposed facilities, and key
findings and recommendations to make the energy systems more resilient to earthquake impacts.
The term "risk" is defined herein as a function of the threat of seismic hazard, the vulnerability of
the exposed parts, and the severity of the consequences. Sections 4 and 5 of this report address
the seismic hazards and seismic vulnerability of the exposed facilities in the CEI Hub. Section 6
starts with a discussion of consequences to help illustrate the concept, then addresses the
conditions involving seismic risk in the CEI Hub, and ends with discussing impacts to Oregon.
This information will allow the energy industry and decision-makers from all levels of
government to collaborate on strategies to rapidly recover from a major disaster, and to protect
public health and safety, the environment, and the region’s economy.

20
Study Methods The project method involved assessing the seismic hazard in the CEI hub area posed by a
Cascadia earthquake (Section 4 of this study). Although local crustal faults exist in the CEI Hub,
only the Cascadia fault was evaluated based on its higher probability of occurrence, many
seismic hazards and high risk (Sections 2 and 4 of this study). Many seismic hazards were
considered, which included ground shaking, soil susceptibility to earthquake-induced
liquefaction, lateral spreading, landslides, and co-seismic settlement. Since liquefaction and
lateral spreading hazards are the primary concerns, especially to the waterfront facilities, we co-
conducted a ground deformation analyses to better understand the nature of the hazards and the
possible mitigation needs.
DOGAMI reviewed the building code environment for facilities in the CEI Hub to determine the
design conditions of the facilities. Building codes set forth minimum standards on new
construction and for certain major changes. Building codes are frequently upgraded to reflect
new design knowledge including seismic hazards. These codes play a vital role in the seismic
robustness of structures. If the code requires a high level of seismic design, then the new
structure is designed and built to resist seismic forces. In contrast, if past codes call for seismic
design levels that are significantly lower than the levels in the current code, then those structures
may be seismically deficient.
The EAP partners, which include staff from DOGAMI, ODOE, and OPUC, assessed the seismic
vulnerability of CEI Hub facilities through a series of site visits and meetings. Key individuals
are listed in Table 1 and contributors are listed in the acknowledgements (Section 8). The EAP
assessments included on-site facility visits in the CEI Hub to meet with the operators and tour
their facilities, as well as viewing facilities by boat and aerial reconnaissance. A few site
assessments were conducted at facilities outside of the CEI Hub. DOGAMI co-organized two
boat tours with the City of Portland and invited key stakeholders including Oregon leadership
(director of Oregon Emergency Management, representative from Senate President's office),
FEMA and EAP partners. DOGAMI, OPUC and Oregon Department of Transportation (ODOT)
also conducted aerial reconnaissance with the Civil Air Patrol covering the CEI Hub to the
Columbia River mouth to consider emergency response options using the Columbia River
waterway.
Table 1: List of Key Individuals: EAP Partners and Stakeholders
EAP partners Oregon Department of Energy Deanna Henry Emergency Preparedness Manager Nuclear Safety & Energy Emergency Preparedness Division Oregon Department of Energy Rebecca O'Neil EAP Project Manager Senior Policy Analyst, Energy Technology Division
21
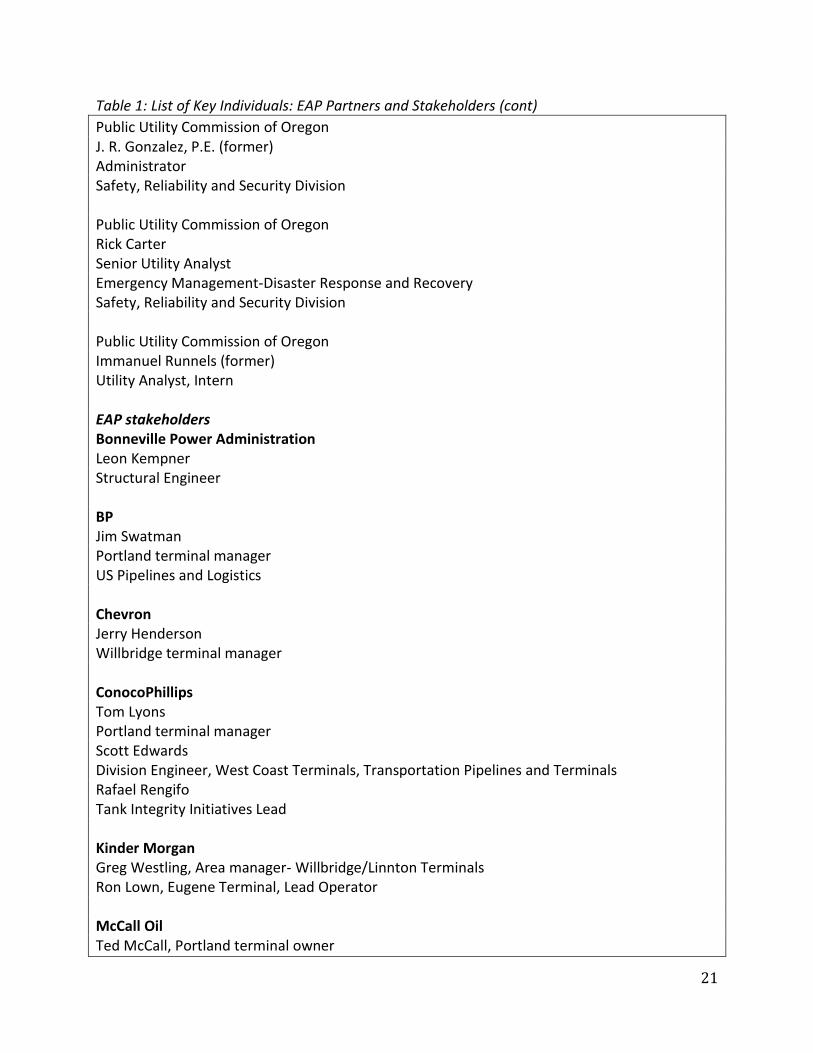
Table 1: List of Key Individuals: EAP Partners and Stakeholders (cont)
Public Utility Commission of Oregon J. R. Gonzalez, P.E. (former) Administrator Safety, Reliability and Security Division Public Utility Commission of Oregon Rick Carter Senior Utility Analyst Emergency Management-Disaster Response and Recovery Safety, Reliability and Security Division Public Utility Commission of Oregon Immanuel Runnels (former) Utility Analyst, Intern EAP stakeholders Bonneville Power Administration Leon Kempner Structural Engineer BP Jim Swatman Portland terminal manager US Pipelines and Logistics Chevron Jerry Henderson Willbridge terminal manager ConocoPhillips Tom Lyons Portland terminal manager Scott Edwards Division Engineer, West Coast Terminals, Transportation Pipelines and Terminals Rafael Rengifo Tank Integrity Initiatives Lead Kinder Morgan Greg Westling, Area manager- Willbridge/Linnton Terminals Ron Lown, Eugene Terminal, Lead Operator McCall Oil Ted McCall, Portland terminal owner
22
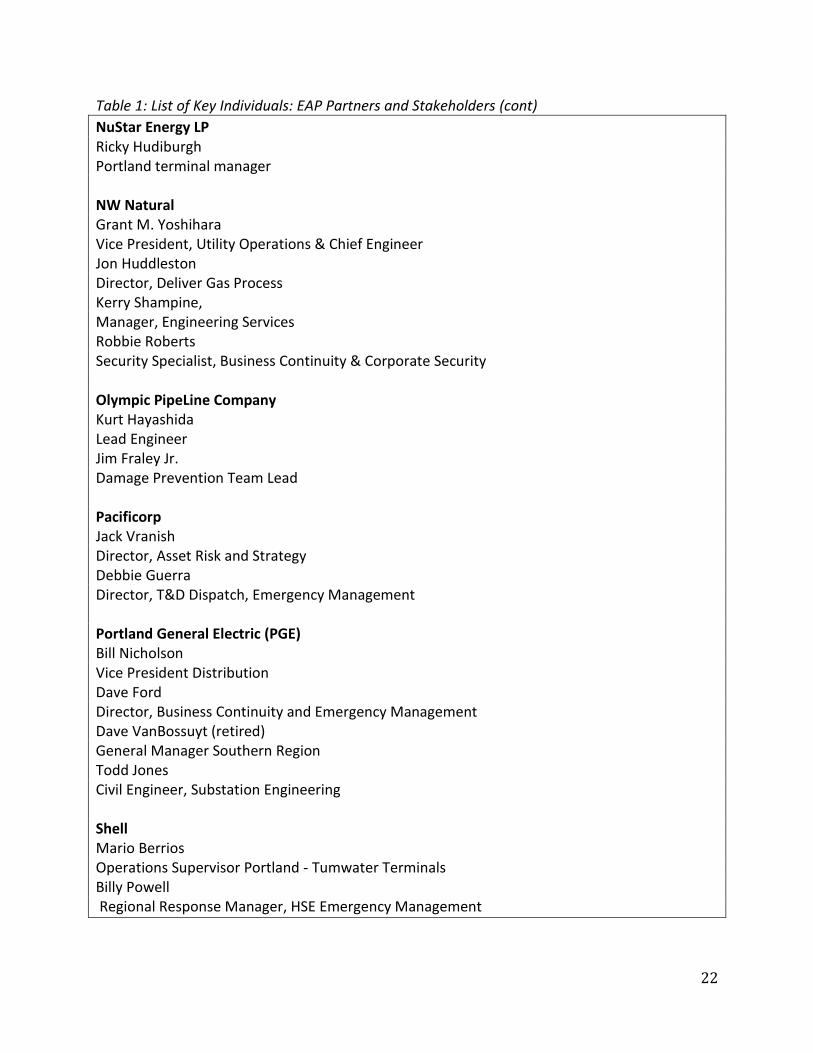
Table 1: List of Key Individuals: EAP Partners and Stakeholders (cont)
NuStar Energy LP Ricky Hudiburgh Portland terminal manager NW Natural Grant M. Yoshihara Vice President, Utility Operations & Chief Engineer Jon Huddleston Director, Deliver Gas Process Kerry Shampine, Manager, Engineering Services Robbie Roberts Security Specialist, Business Continuity & Corporate Security Olympic PipeLine Company Kurt Hayashida Lead Engineer Jim Fraley Jr. Damage Prevention Team Lead Pacificorp Jack Vranish Director, Asset Risk and Strategy Debbie Guerra Director, T&D Dispatch, Emergency Management Portland General Electric (PGE) Bill Nicholson Vice President Distribution Dave Ford Director, Business Continuity and Emergency Management Dave VanBossuyt (retired) General Manager Southern Region Todd Jones Civil Engineer, Substation Engineering Shell Mario Berrios Operations Supervisor Portland - Tumwater Terminals Billy Powell Regional Response Manager, HSE Emergency Management

23
Table 1: List of Key Individuals: EAP Partners and Stakeholders (cont)
Williams Northwest Pipeline George Angerbauer Manager of Public Outreach Troy Robey Assistant District Manager, Battle Ground District
Assessment of the energy sector facilities in the CEI Hub included:
All of Oregon’s major liquid fuel port terminals
Liquid fuel transmission pipelines and transfer points
Liquefied natural gas (LNG) facility
High voltage electric substation and transmission lines
Assessment of energy facilities outside the CEI Hub included:
Four electrical substations
Two power plants (Port Westward and Beavers in Western Oregon (Columbia County)
A natural gas gate station on Sauvie Island
A liquid fuel terminal in Eugene
ODOE organized site visits at these petroleum facilities: BP, Chevron, ConocoPhillips,
KinderMorgan (KM) fuel terminals and KM pipeline, McCall Oil, Nustar, and Shell. Site visits
were also conducted at Bonneville Power Administration (BPA), NW Natural, Portland General
Electric (PGE), and Williams Northwest Pipeline. We did not visit any PacifiCorp facilities as all
are located outside the CEI Hub.
DOGAMI reviewed US Coast Guard (USCG) inspection protocols for port facilities with
petroleum terminals. Because USCG inspections of the Portland fuel terminals do not include a
seismic component, the EAP partners worked with the California State Lands Commission to
look at how California addresses seismic issues at port facilities with fuel terminals. With help
from Martin Eskijian, Supervisor, Engineering Branch Marine Facilities Division from the
California State Lands Commission (retired in 2011) and his staff, the EAP partners reviewed
parts of the Marine Oil Terminal Engineering and Maintenance Standards (MOTEMS), which is
implemented and enforced by California State Lands Commission that incorporates seismic
safety http://www.slc.ca.gov/Division_Pages/MFD/MOTEMS/MOTEMS_Home_Page.html.
The EAP partners joined MOTEMS staff on two oil refinery inspections in Richmond and
Benecia, California, as well as observed a MOTEMS regulatory review meeting with a
petroleum company at the MOTEMS office in Hercules, California. DOGAMI and ODOE, with
the assistance of MOTEMS staff engineer Kendra Oliver at four of the Portland fuel terminals,
conducted site visits to inspect the piers and the wharves used for transporting liquid fuel in the
CEI Hub.

24
A significant part of the project involved identifying key stakeholders for all the energy sectors
as well as government agencies and other stakeholders. These are listed in Table 2. Many other
individuals provided their expertise upon request. These individuals are listed in Section 8:
Acknowledgments. The EAP partners provided EAP information to the energy sector, as well as
the public, at many meetings and through a variety of media in order to build awareness. For this
report, the names of the companies have often not been identified, and in places, replaced with
"unnamed". Furthermore, the location of their facilities in the CEI Hub have not been pinpointed.
This action was taken to promote participation from privately-owned energy sector operators
while respecting their privacy when obtaining seismic vulnerability data associated with their
facilities.
Table 2: List of stakeholders in this Earthquake Risk Study for Critical Energy Infrastructure
Hub.
Private sector fuel
stakeholders
Private sector electricity
natural gas stakeholders
Government Agency
stakeholders
Non-profit stakeholders
Academic stakeholders
BP NW Natural Bonneville Power Administration (BPA)
American Society of Civil Engineers
University of British Columbia
Chevron PacifiCorp City of Portland Western Energy Institute
University of Utah
ConocoPhillips Portland General Electric (PGE)
City of Salem Western Washington University
Kinder Morgan (KM) fuel terminals and pipeline
Williams Northwest Pipeline
Federal Emergency Management Agency (FEMA)
McCall Oil Oregon Dept. of Transportation
NuStar Energy LP Oregon Emergency Management
Olympic Pipe Line Company (operated by BP Pipelines, North America)
Oregon Seismic Safety Policy Advisory Commission
Shell Port of Portland
US Coast Guard
US Dept. of Energy
US Geological Survey
25
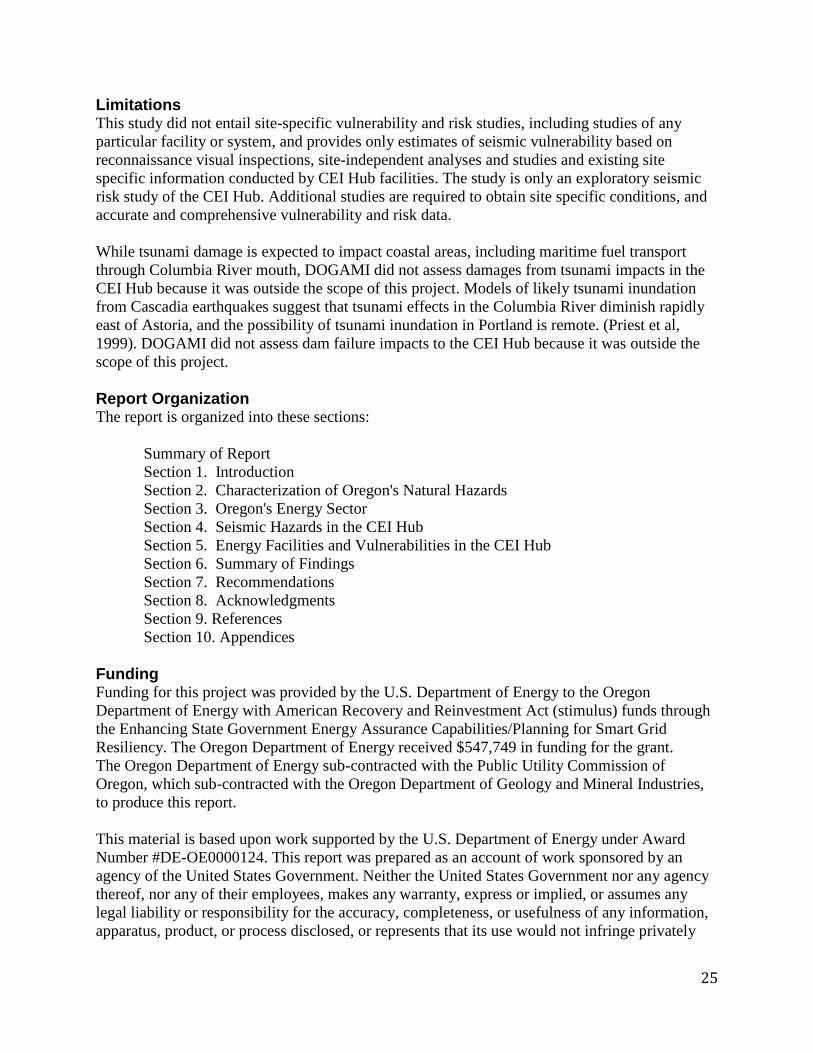
Limitations This study did not entail site-specific vulnerability and risk studies, including studies of any
particular facility or system, and provides only estimates of seismic vulnerability based on
reconnaissance visual inspections, site-independent analyses and studies and existing site
specific information conducted by CEI Hub facilities. The study is only an exploratory seismic
risk study of the CEI Hub. Additional studies are required to obtain site specific conditions, and
accurate and comprehensive vulnerability and risk data.
While tsunami damage is expected to impact coastal areas, including maritime fuel transport
through Columbia River mouth, DOGAMI did not assess damages from tsunami impacts in the
CEI Hub because it was outside the scope of this project. Models of likely tsunami inundation
from Cascadia earthquakes suggest that tsunami effects in the Columbia River diminish rapidly
east of Astoria, and the possibility of tsunami inundation in Portland is remote. (Priest et al,
1999). DOGAMI did not assess dam failure impacts to the CEI Hub because it was outside the
scope of this project.
Report Organization The report is organized into these sections:
Summary of Report
Section 1. Introduction
Section 2. Characterization of Oregon's Natural Hazards
Section 3. Oregon's Energy Sector
Section 4. Seismic Hazards in the CEI Hub
Section 5. Energy Facilities and Vulnerabilities in the CEI Hub
Section 6. Summary of Findings
Section 7. Recommendations
Section 8. Acknowledgments
Section 9. References
Section 10. Appendices
Funding Funding for this project was provided by the U.S. Department of Energy to the Oregon
Department of Energy with American Recovery and Reinvestment Act (stimulus) funds through
the Enhancing State Government Energy Assurance Capabilities/Planning for Smart Grid
Resiliency. The Oregon Department of Energy received $547,749 in funding for the grant.
The Oregon Department of Energy sub-contracted with the Public Utility Commission of
Oregon, which sub-contracted with the Oregon Department of Geology and Mineral Industries,
to produce this report.
This material is based upon work supported by the U.S. Department of Energy under Award
Number #DE-OE0000124. This report was prepared as an account of work sponsored by an
agency of the United States Government. Neither the United States Government nor any agency
thereof, nor any of their employees, makes any warranty, express or implied, or assumes any
legal liability or responsibility for the accuracy, completeness, or usefulness of any information,
apparatus, product, or process disclosed, or represents that its use would not infringe privately

26
owned rights. Reference herein to any specific commercial product, process, or service by trade
name, trademark, manufacturer, or otherwise does not necessarily constitute or imply its
endorsement, recommendation, or favoring by the United States Government or any agency
thereof. The views and opinions of authors expressed herein do not necessarily state or reflect
those of the United States Government or any agency thereof.
27
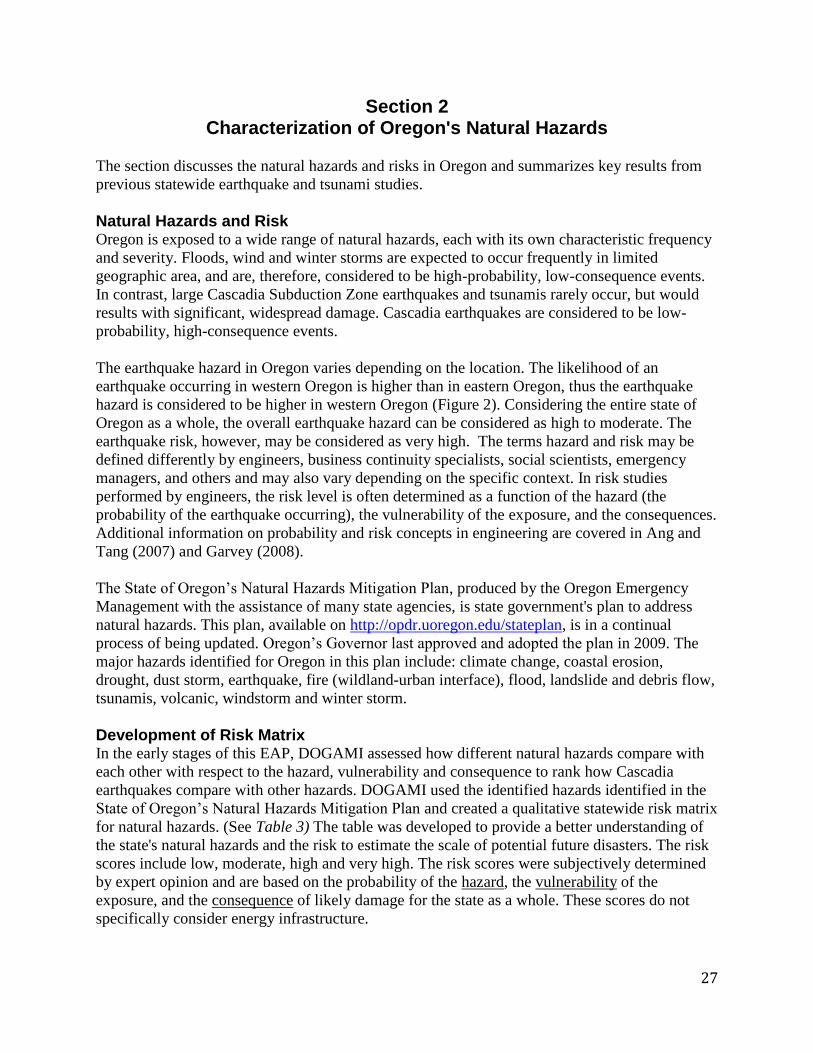
Section 2 Characterization of Oregon's Natural Hazards
The section discusses the natural hazards and risks in Oregon and summarizes key results from
previous statewide earthquake and tsunami studies.
Natural Hazards and Risk Oregon is exposed to a wide range of natural hazards, each with its own characteristic frequency
and severity. Floods, wind and winter storms are expected to occur frequently in limited
geographic area, and are, therefore, considered to be high-probability, low-consequence events.
In contrast, large Cascadia Subduction Zone earthquakes and tsunamis rarely occur, but would
results with significant, widespread damage. Cascadia earthquakes are considered to be low-
probability, high-consequence events.
The earthquake hazard in Oregon varies depending on the location. The likelihood of an
earthquake occurring in western Oregon is higher than in eastern Oregon, thus the earthquake
hazard is considered to be higher in western Oregon (Figure 2). Considering the entire state of
Oregon as a whole, the overall earthquake hazard can be considered as high to moderate. The
earthquake risk, however, may be considered as very high. The terms hazard and risk may be
defined differently by engineers, business continuity specialists, social scientists, emergency
managers, and others and may also vary depending on the specific context. In risk studies
performed by engineers, the risk level is often determined as a function of the hazard (the
probability of the earthquake occurring), the vulnerability of the exposure, and the consequences.
Additional information on probability and risk concepts in engineering are covered in Ang and
Tang (2007) and Garvey (2008).
The State of Oregon’s Natural Hazards Mitigation Plan, produced by the Oregon Emergency
Management with the assistance of many state agencies, is state government's plan to address
natural hazards. This plan, available on http://opdr.uoregon.edu/stateplan, is in a continual
process of being updated. Oregon’s Governor last approved and adopted the plan in 2009. The
major hazards identified for Oregon in this plan include: climate change, coastal erosion,
drought, dust storm, earthquake, fire (wildland-urban interface), flood, landslide and debris flow,
tsunamis, volcanic, windstorm and winter storm.
Development of Risk Matrix In the early stages of this EAP, DOGAMI assessed how different natural hazards compare with
each other with respect to the hazard, vulnerability and consequence to rank how Cascadia
earthquakes compare with other hazards. DOGAMI used the identified hazards identified in the
State of Oregon’s Natural Hazards Mitigation Plan and created a qualitative statewide risk matrix
for natural hazards. (See Table 3) The table was developed to provide a better understanding of
the state's natural hazards and the risk to estimate the scale of potential future disasters. The risk
scores include low, moderate, high and very high. The risk scores were subjectively determined
by expert opinion and are based on the probability of the hazard, the vulnerability of the
exposure, and the consequence of likely damage for the state as a whole. These scores do not
specifically consider energy infrastructure.
28
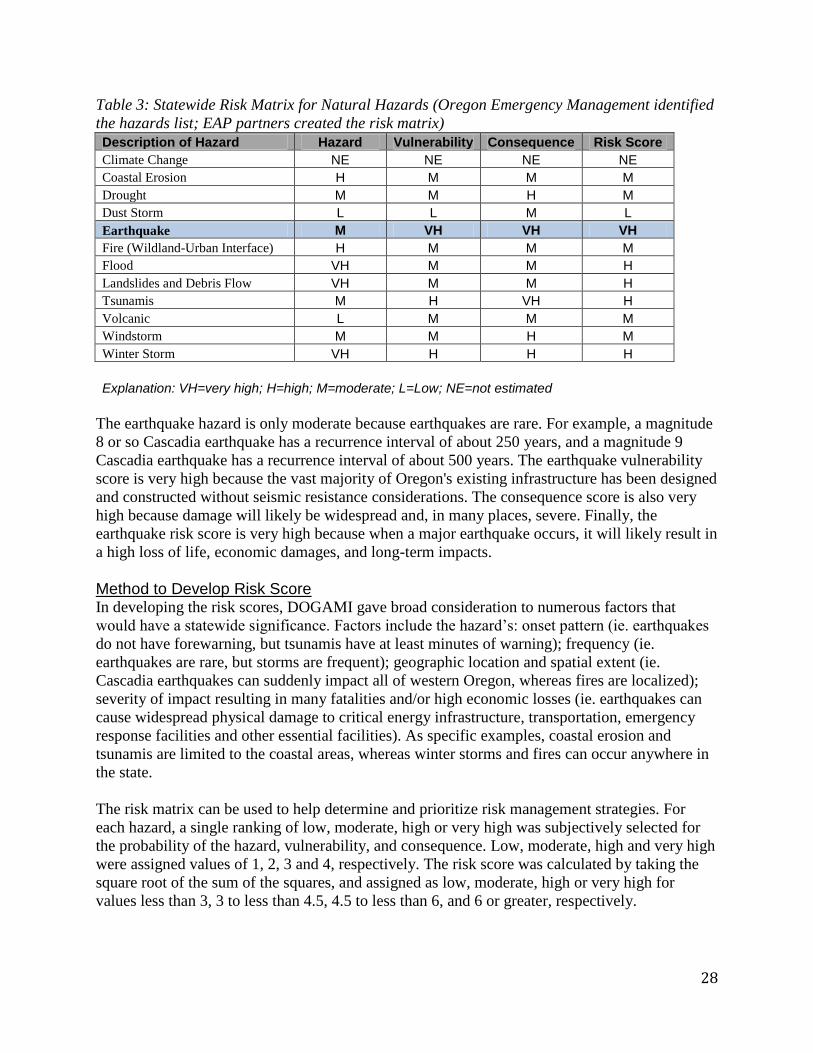
Table 3: Statewide Risk Matrix for Natural Hazards (Oregon Emergency Management identified
the hazards list; EAP partners created the risk matrix)
Description of Hazard Hazard Vulnerability Consequence Risk Score
Climate Change NE NE NE NE
Coastal Erosion H M M M
Drought M M H M
Dust Storm L L M L
Earthquake M VH VH VH
Fire (Wildland-Urban Interface) H M M M
Flood VH M M H
Landslides and Debris Flow VH M M H
Tsunamis M H VH H
Volcanic L M M M
Windstorm M M H M
Winter Storm VH H H H
Explanation: VH=very high; H=high; M=moderate; L=Low; NE=not estimated
The earthquake hazard is only moderate because earthquakes are rare. For example, a magnitude
8 or so Cascadia earthquake has a recurrence interval of about 250 years, and a magnitude 9
Cascadia earthquake has a recurrence interval of about 500 years. The earthquake vulnerability
score is very high because the vast majority of Oregon's existing infrastructure has been designed
and constructed without seismic resistance considerations. The consequence score is also very
high because damage will likely be widespread and, in many places, severe. Finally, the
earthquake risk score is very high because when a major earthquake occurs, it will likely result in
a high loss of life, economic damages, and long-term impacts.
Method to Develop Risk Score In developing the risk scores, DOGAMI gave broad consideration to numerous factors that
would have a statewide significance. Factors include the hazard’s: onset pattern (ie. earthquakes
do not have forewarning, but tsunamis have at least minutes of warning); frequency (ie.
earthquakes are rare, but storms are frequent); geographic location and spatial extent (ie.
Cascadia earthquakes can suddenly impact all of western Oregon, whereas fires are localized);
severity of impact resulting in many fatalities and/or high economic losses (ie. earthquakes can
cause widespread physical damage to critical energy infrastructure, transportation, emergency
response facilities and other essential facilities). As specific examples, coastal erosion and
tsunamis are limited to the coastal areas, whereas winter storms and fires can occur anywhere in
the state.
The risk matrix can be used to help determine and prioritize risk management strategies. For
each hazard, a single ranking of low, moderate, high or very high was subjectively selected for
the probability of the hazard, vulnerability, and consequence. Low, moderate, high and very high
were assigned values of 1, 2, 3 and 4, respectively. The risk score was calculated by taking the
square root of the sum of the squares, and assigned as low, moderate, high or very high for
values less than 3, 3 to less than 4.5, 4.5 to less than 6, and 6 or greater, respectively.

29
Previous Statewide Earthquake Studies For most of Oregon's history, the seismic potential was considered to be minimal. Even as late as
1980 during the Mt. St. Helens volcanic eruption, geologists were generally unaware of Oregon's
major faults and their earthquake potential. During the 1980s, geologists learned about the
Cascadia Subduction Zone and that it could produce large earthquakes. By the late 1980s, there
was general consensus among earthquake scientists that the Cascadia fault could unleash a
magnitude 8 or higher earthquake and accompanying tsunami (Wang, 1998a). Since that time,
scientific research has continued to improve our understanding of the Cascadia fault and
numerous earthquake and tsunami studies have been performed.
Figure 2 shows a current scientific model of the location of the Cascadia Subduction Zone. The
potential rupture surface of the Cascadia fault extends from the western edge (white line with
triangles) to the eastern edge (dashed black line). The eastern edge of the fault is important
because, in general, the shaking levels are closer to the fault.
Figure 2: Cascadia Subduction Zone between the black dashed line and the white line with
triangles. (Witter et al, 2011).
Statewide Damage and Loss Estimates In 1998, Oregon was the first state in the nation to conduct a statewide earthquake damage and
loss study (Wang, 1998b, Wang and Clark, 1999). Using HAZUS97, a damage and loss
estimation software package from FEMA, DOGAMI produced a technical report that included
evaluations of damage and losses for the entire state for 1) a magnitude 8.5 Cascadia earthquake
and 2) a 500-year return interval probabilistic ground motions. In the second evaluation, the
ground motions expected to be met or exceeded in a 500-year period are used in the building
code to design for earthquake shaking.
As part of that study, DOGAMI developed a statewide soils map. Next, DOGAMI developed a
suite of ground motions that integrated the soils map. The ground motions were used to estimate

30
damage to infrastructure from shaking. Figure 3 illustrates how layers of information are used to
determine damage where the uppermost layer depicts highest damage in red (Wang, 1998b).
Figure 4 shows a spectral velocity map of Oregon at 0.3 seconds, which was one of the ground
motion maps used to estimate damage (Wang, 1998c). The statewide damage and loss
assessment was conducted in two parts, both indicating severe losses. Building damage from a
hypothetical magnitude 8.5 Cascadia earthquake was estimated using FEMA's HAZUS97
software and indicated almost 1,000,000 buildings with some level of damage from earthquake
shaking (Wang and Clark, 1999). Fatalities were estimated using crude methodologies and
indicated more than 3,000 fatalities from tsunamis, 2,000 fatalities from severe building damage,
and many more casualties. (Wang, 1999)
Figure 3: Schematic showing a statewide GIS-based (HAZUS97) study damage and loss
assessment using probabilistic ground motions that represent equal seismic hazards throughout
Oregon. (Wang, 1998b)
31
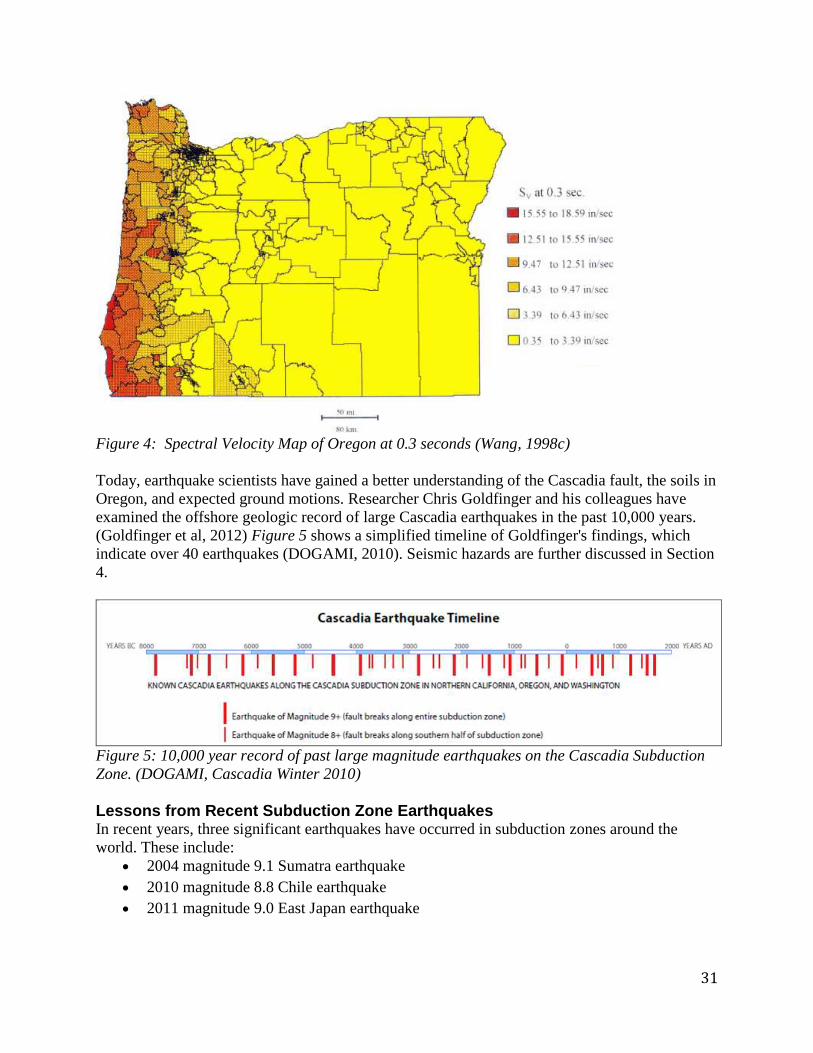
Figure 4: Spectral Velocity Map of Oregon at 0.3 seconds (Wang, 1998c)
Today, earthquake scientists have gained a better understanding of the Cascadia fault, the soils in
Oregon, and expected ground motions. Researcher Chris Goldfinger and his colleagues have
examined the offshore geologic record of large Cascadia earthquakes in the past 10,000 years.
(Goldfinger et al, 2012) Figure 5 shows a simplified timeline of Goldfinger's findings, which
indicate over 40 earthquakes (DOGAMI, 2010). Seismic hazards are further discussed in Section
4.
Figure 5: 10,000 year record of past large magnitude earthquakes on the Cascadia Subduction
Zone. (DOGAMI, Cascadia Winter 2010)
Lessons from Recent Subduction Zone Earthquakes In recent years, three significant earthquakes have occurred in subduction zones around the
world. These include:
2004 magnitude 9.1 Sumatra earthquake
2010 magnitude 8.8 Chile earthquake
2011 magnitude 9.0 East Japan earthquake
32
Each time a major subduction zone earthquake occurs, earthquake professionals working in the
Cascadia region gather important earthquake information and learn a great deal more about the
Cascadia Subduction Zone.
In the Sumatra earthquake, one big lesson learned was that tsunamis can kill over 200,000 people
from one side of the ocean to the other side. The tsunami hit and killed people in Sumatra, but
also traveled across the Indian Ocean and killed people in 12 other countries including Thailand,
India, and Sri Lanka. In 2009, stakeholders from the Pacific Northwest discussed tsunami
vertical evacuation refuges as a new mitigation option. (Wang, 2010a)
In the 2010 Chile earthquake, moderate shaking damaged an oil refinery that was rendered
inoperable for months. Earthquake professionals working in the Cascadia region learned lessons
on the importance of critical infrastructure. (Wang, 2010b)
In the 2011 Japan disaster, the electrical sector was impacted not only by damaged nuclear and
thermal power plants, but also by undamaged nuclear power plants, which were shut down due
to the public's concern about their safety. Also, one electric company experienced damage to 85
of its high voltage transformers. The Oregon Seismic Safety Policy Advisory Commission
adopted policy recommendations to address the issue of critical infrastructure (including fuel and
electric) following the Japan earthquake.
(http://www.oregon.gov/OMD/OEM/osspac/docs/lessons_recomm_7-11.pdf). They are
reprinted in the Winter 2012 Cascadia (DOGAMI).
Based on observations from historical earthquakes, scientists have determined that 1) large
earthquakes release more energy and produce stronger ground shaking than small earthquakes,
2) the level of ground shaking lowers with distance away from epicenter of the earthquake, and
3) damage is typically concentrated nearer the epicenter of the earthquake as well as in farther
locations with soft soil deposits, such as old lake bed soils. Based on post-earthquake field visits
after the 2004, 2010 and 2011 subduction zone earthquakes, co-author Yumei Wang, observed
that the damage in those subduction zone earthquakes was concentrated in three areas:
1. Tsunami inundation zones, 2. Areas of permanent ground deformation, such as landslides and liquefaction
zones, and 3. Seismically weak buildings and infrastructure.

33
Section 3: Oregon’s Energy Sector
This section provides an overview of Oregon's energy sector, the CEI Hub project study area,
and Oregon's economic interdependencies with the energy sector.
Overview of Energy Sector Three energy sources are considered—electricity, natural gas and fuel oil. The energy sectors
have separate systems for supplying their products and/or services. Not surprisingly, each has
sector-specific seismic vulnerabilities.
The crude oil used in Oregon originates in the Alaska North Slope oil fields. The Trans Alaska
Pipeline transports crude oil from these oil fields to the Valdez terminal in southern Alaska.
From there, barges, tankers and pipelines carry the crude oil to four refineries located in the
Puget Sound area of Washington State, which provide more than 90 percent of Oregon’s refined
petroleum product. About 75 percent of the product is transported via the Olympic Pipeline to
seven petroleum distribution terminals located within close proximity of one another in the CEI
Hub project study area, further described in the next section. The remaining fuel coming to
Oregon from the Washington State refineries is transported by tanker vessels to the Portland
facilities. (ODOE, 2011)
In 2010, Oregon’s electrical power mix from a variety of power plants was 0.77% biomass,
35.46% coal, 0.12% geothermal, 38.74% hydroelectric, 0.04% landfill gases, 16.24% natural
gas, 3.66% nuclear, 0.14% other, 0.17% petroleum, 0.34% waste, and 4.31% wind (ODOE
Power Mix Fact Sheet, 4/4/12). The electrical grid that serves the state of Oregon is coordinated
and highly interconnected with similar systems in the 13 western U.S. states, parts of northern
Mexico and western Canada. Critical grid functions, in relation to Oregon, are most
predominately the responsibility of the Bonneville Power Administration (BPA), Western
Electricity Coordinating Council (WECC), PacifiCorp and PGE. On a local level, the electric
distribution systems, as well as some transmission and generation, are also the responsibility of
Oregon’s numerous municipal and public power agencies. Being integrated, Oregon’s
generation and transmission systems are exposed to adverse events that may be caused over a
thousand miles away. In theory, Oregon’s electric resiliency (e.g., reliability) can be
significantly impacted by transmission or generation related events that could occur anywhere in
the entire interconnected region. Conversely, events emanating within Oregon could also
significantly impact other states. The prudent management, operations, planning and
maintenance of bulk power transmission and generation grids play a fundamental role in
Oregon’s electric resiliency (RW Beck, 2011).
Oregon receives natural gas from British Columbia, Alberta, Wyoming, Colorado and New
Mexico. Two connected interstate pipelines currently serve Oregon customers. The Williams
Company pipeline and the Gas Transmission Northwest (GTN) pipeline owned by the
TransCanada Corporation bring product from the Rocky Mountains and Canada. The Ruby
Pipeline transports domestic natural gas 675 miles across four states from Opal, Wyoming to the
existing Gas Transmission Northwest (GTN) pipeline near Malin, Oregon. According to the
Northwest Gas Association (NGWA), the Pacific Northwest is home to more than 48,000 miles
of natural gas transmission and distribution pipelines (ODOE, 2011).
34
More information on the energy assurance project, including the Oregon Energy Assurance Plan
is at http://www.oregon.gov/ENERGY/docs/OregonStateEnergyAssurancePlan.pdf.
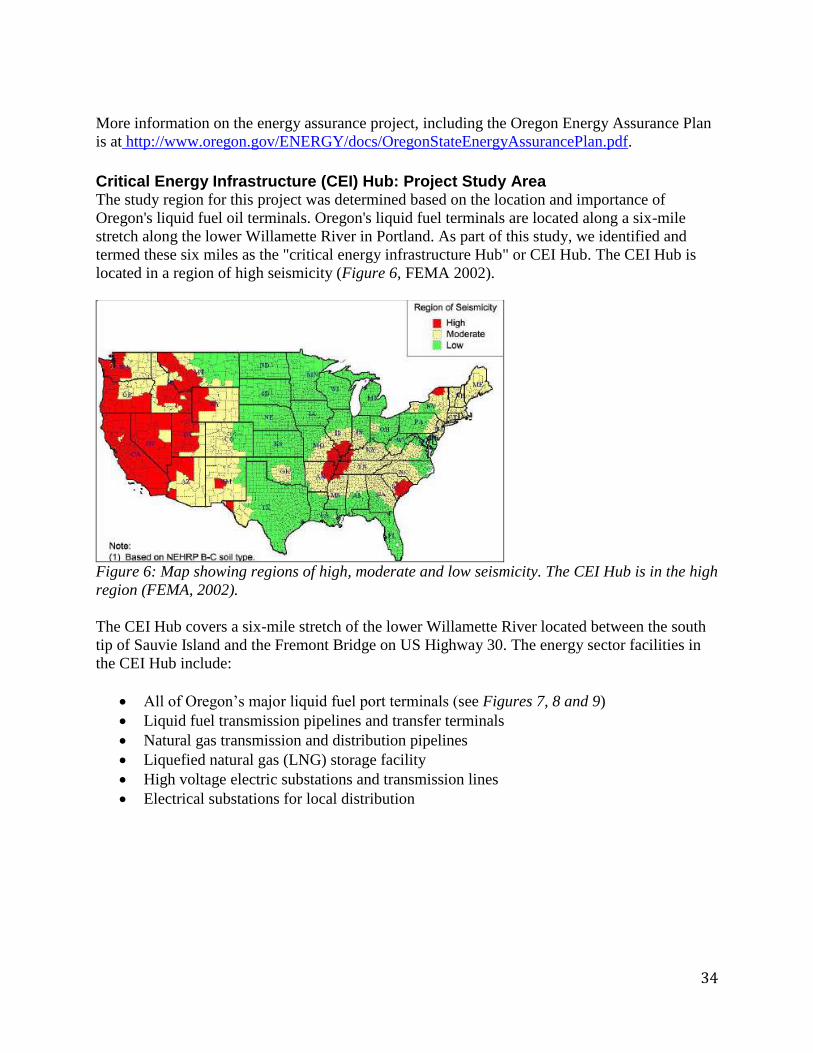
Critical Energy Infrastructure (CEI) Hub: Project Study Area The study region for this project was determined based on the location and importance of
Oregon's liquid fuel oil terminals. Oregon's liquid fuel terminals are located along a six-mile
stretch along the lower Willamette River in Portland. As part of this study, we identified and
termed these six miles as the "critical energy infrastructure Hub" or CEI Hub. The CEI Hub is
located in a region of high seismicity (Figure 6, FEMA 2002).
Figure 6: Map showing regions of high, moderate and low seismicity. The CEI Hub is in the high
region (FEMA, 2002).
The CEI Hub covers a six-mile stretch of the lower Willamette River located between the south
tip of Sauvie Island and the Fremont Bridge on US Highway 30. The energy sector facilities in
the CEI Hub include:
All of Oregon’s major liquid fuel port terminals (see Figures 7, 8 and 9) Liquid fuel transmission pipelines and transfer terminals Natural gas transmission and distribution pipelines Liquefied natural gas (LNG) storage facility High voltage electric substations and transmission lines Electrical substations for local distribution
35
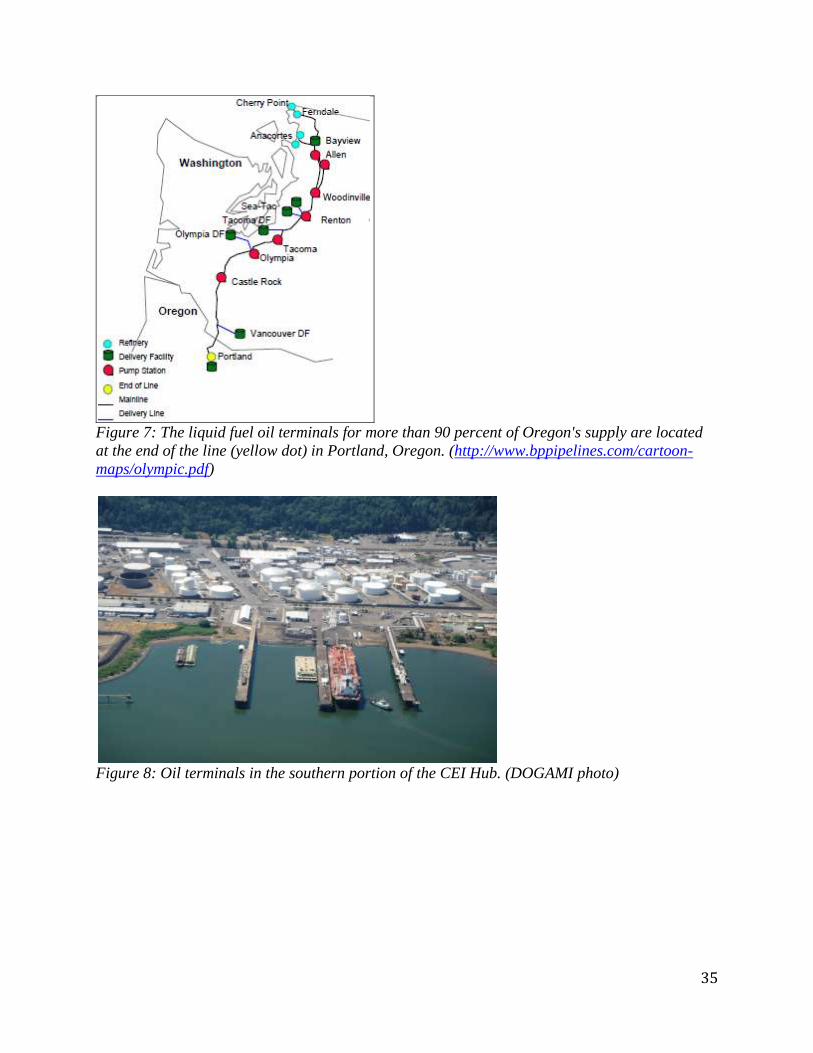
Figure 7: The liquid fuel oil terminals for more than 90 percent of Oregon's supply are located
at the end of the line (yellow dot) in Portland, Oregon. (http://www.bppipelines.com/cartoon-
maps/olympic.pdf)
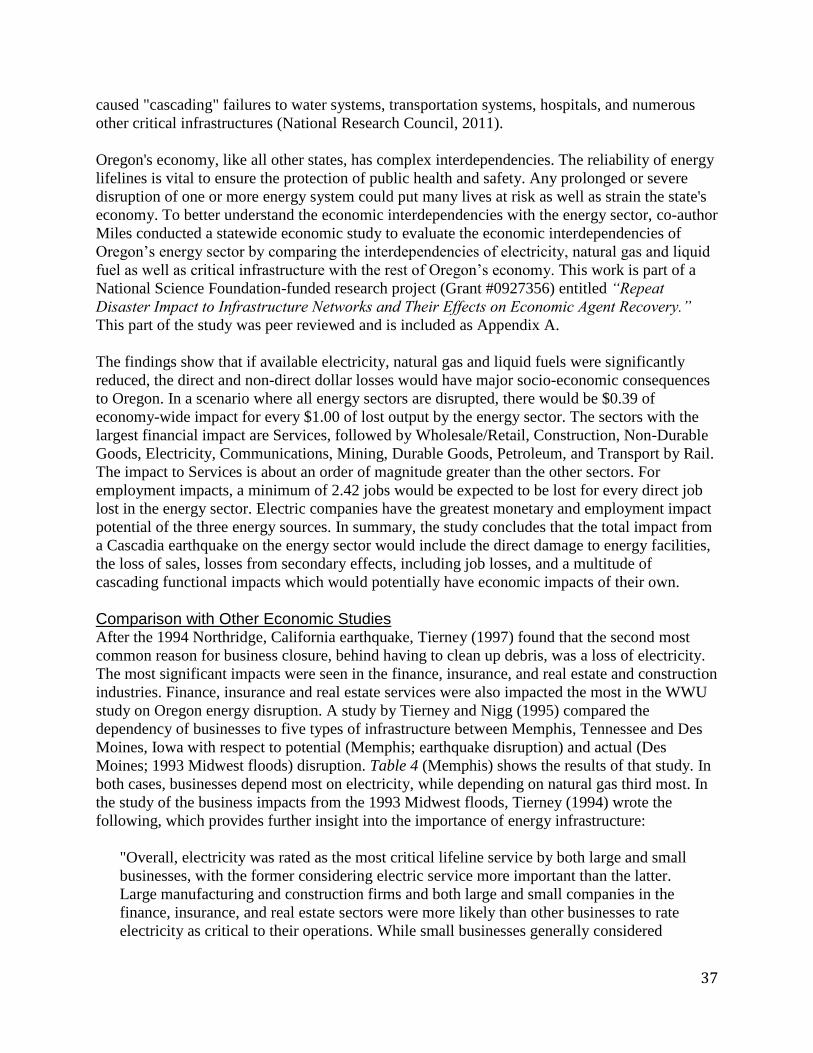
Figure 8: Oil terminals in the southern portion of the CEI Hub. (DOGAMI photo)

36
Figure 9: Oil terminals in the northern portion of the CEI Hub (foreground of photo). (DOGAMI
photo)
Petroleum enters the state by pipeline and marine vessels and is transferred to terminals at the
CEI Hub before it is distributed throughout Oregon to the end user. Once the product reaches the
CEI Hub, tanker trucks deliver fuel to customers in the Portland metro area, barges deliver fuel
farther east on the Columbia River, and a pipeline continues south to a terminal in Eugene. Fuel
is distributed throughout Oregon, including to the Portland International Airport and many other
major consumers.
Oregon's oil terminals are located along the western bank of the Willamette River (Figures 8 and
9). The Portland fuel terminals are on a six-day delivery cycle. On average, terminals have a
three to five day supply in the tank farm for regular unleaded gasoline and diesel fuel. Premium
gasoline is subject to the daily delivery and heavily dependent on whether an inter-company
pipeline on Front Avenue is operational. All seven terminals have the capability to receive
product by vessel. However, only Chevron and Kinder Morgan terminals have the marine vapor
recovery systems required to load unleaded fuel onto vessels for transport up the Columbia River
to Pasco, Washington. Diesel can be loaded on vessels without the vapor recovery systems.
Vessel deliveries vary. Chevron reports on average, its terminal receives a shipment by barge
every three or four days and by ship every seven or eight days. (Portland PBEM, Earthquake
Response Appendix, January 2012,
http://www.portlandonline.com/oem/index.cfm?c=53895&a=382005)
A significant portion of Oregon’s natural gas passes through the CEI Hub. Also, three high
voltage (115 kV and 230 kV) electrical transmission lines cross the area as well as feed the
distribution network for the local area.
Economic Interdependencies with the Energy Sector In August 2003, Americans got a dramatic "wake up call" concerning the vulnerability of
electrical systems and the resultant regional and national consequences as a result of the
Northeast Blackout. The blackout affected five states, 50 million people, and caused an estimated
$4 to $10 billion in business interruption losses in the central and eastern US. The power outage
37
caused "cascading" failures to water systems, transportation systems, hospitals, and numerous
other critical infrastructures (National Research Council, 2011).
Oregon's economy, like all other states, has complex interdependencies. The reliability of energy
lifelines is vital to ensure the protection of public health and safety. Any prolonged or severe
disruption of one or more energy system could put many lives at risk as well as strain the state's
economy. To better understand the economic interdependencies with the energy sector, co-author
Miles conducted a statewide economic study to evaluate the economic interdependencies of
Oregon’s energy sector by comparing the interdependencies of electricity, natural gas and liquid
fuel as well as critical infrastructure with the rest of Oregon’s economy. This work is part of a
National Science Foundation-funded research project (Grant #0927356) entitled “Repeat
Disaster Impact to Infrastructure Networks and Their Effects on Economic Agent Recovery.”
This part of the study was peer reviewed and is included as Appendix A.
The findings show that if available electricity, natural gas and liquid fuels were significantly
reduced, the direct and non-direct dollar losses would have major socio-economic consequences
to Oregon. In a scenario where all energy sectors are disrupted, there would be $0.39 of
economy-wide impact for every $1.00 of lost output by the energy sector. The sectors with the
largest financial impact are Services, followed by Wholesale/Retail, Construction, Non-Durable
Goods, Electricity, Communications, Mining, Durable Goods, Petroleum, and Transport by Rail.
The impact to Services is about an order of magnitude greater than the other sectors. For
employment impacts, a minimum of 2.42 jobs would be expected to be lost for every direct job
lost in the energy sector. Electric companies have the greatest monetary and employment impact
potential of the three energy sources. In summary, the study concludes that the total impact from
a Cascadia earthquake on the energy sector would include the direct damage to energy facilities,
the loss of sales, losses from secondary effects, including job losses, and a multitude of
cascading functional impacts which would potentially have economic impacts of their own.
Comparison with Other Economic Studies After the 1994 Northridge, California earthquake, Tierney (1997) found that the second most
common reason for business closure, behind having to clean up debris, was a loss of electricity.
The most significant impacts were seen in the finance, insurance, and real estate and construction
industries. Finance, insurance and real estate services were also impacted the most in the WWU
study on Oregon energy disruption. A study by Tierney and Nigg (1995) compared the
dependency of businesses to five types of infrastructure between Memphis, Tennessee and Des
Moines, Iowa with respect to potential (Memphis; earthquake disruption) and actual (Des
Moines; 1993 Midwest floods) disruption. Table 4 (Memphis) shows the results of that study. In
both cases, businesses depend most on electricity, while depending on natural gas third most. In
the study of the business impacts from the 1993 Midwest floods, Tierney (1994) wrote the
following, which provides further insight into the importance of energy infrastructure:
"Overall, electricity was rated as the most critical lifeline service by both large and small
businesses, with the former considering electric service more important than the latter.
Large manufacturing and construction firms and both large and small companies in the
finance, insurance, and real estate sectors were more likely than other businesses to rate
electricity as critical to their operations. While small businesses generally considered
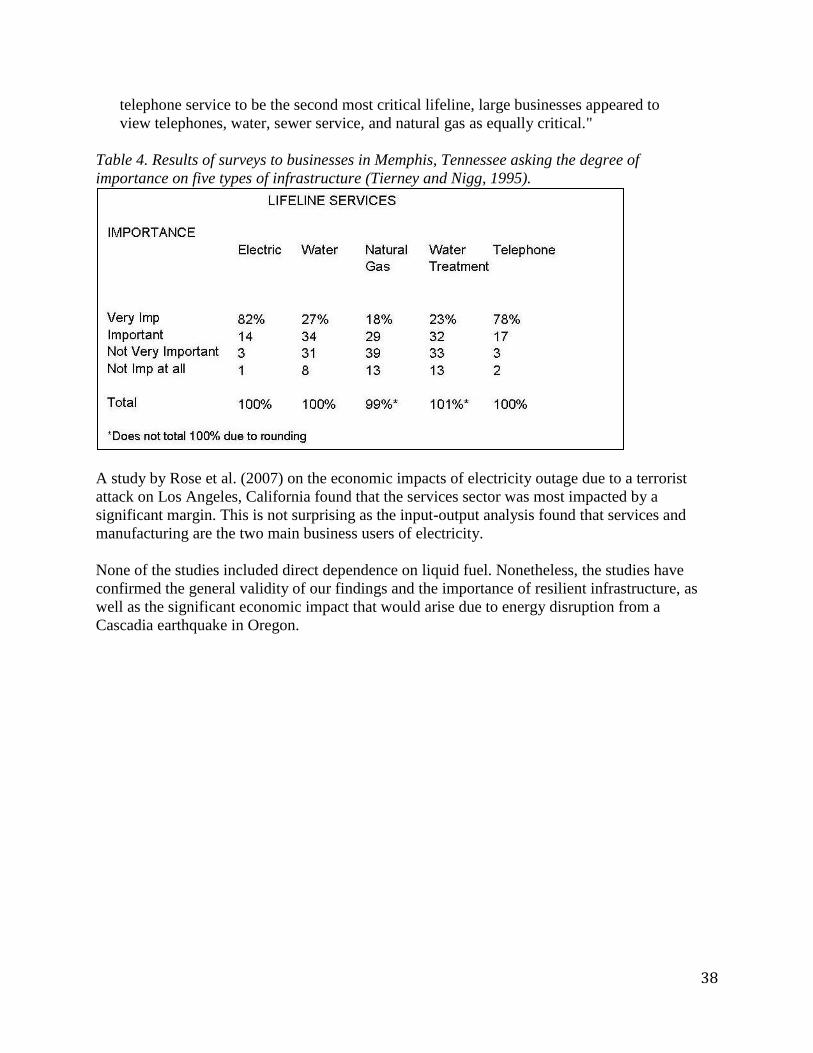
38
telephone service to be the second most critical lifeline, large businesses appeared to
view telephones, water, sewer service, and natural gas as equally critical."
Table 4. Results of surveys to businesses in Memphis, Tennessee asking the degree of
importance on five types of infrastructure (Tierney and Nigg, 1995).
A study by Rose et al. (2007) on the economic impacts of electricity outage due to a terrorist
attack on Los Angeles, California found that the services sector was most impacted by a
significant margin. This is not surprising as the input-output analysis found that services and
manufacturing are the two main business users of electricity.
None of the studies included direct dependence on liquid fuel. Nonetheless, the studies have
confirmed the general validity of our findings and the importance of resilient infrastructure, as
well as the significant economic impact that would arise due to energy disruption from a
Cascadia earthquake in Oregon.
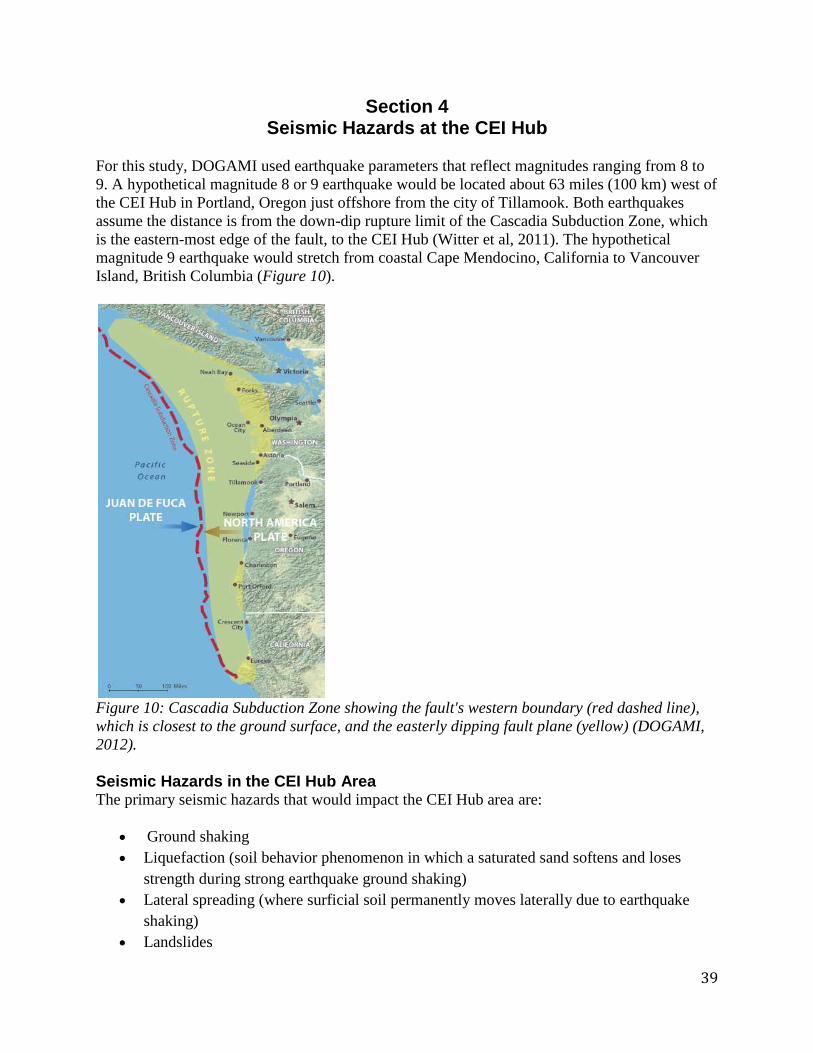
39
Section 4 Seismic Hazards at the CEI Hub
For this study, DOGAMI used earthquake parameters that reflect magnitudes ranging from 8 to
9. A hypothetical magnitude 8 or 9 earthquake would be located about 63 miles (100 km) west of
the CEI Hub in Portland, Oregon just offshore from the city of Tillamook. Both earthquakes
assume the distance is from the down-dip rupture limit of the Cascadia Subduction Zone, which
is the eastern-most edge of the fault, to the CEI Hub (Witter et al, 2011). The hypothetical
magnitude 9 earthquake would stretch from coastal Cape Mendocino, California to Vancouver
Island, British Columbia (Figure 10).
Figure 10: Cascadia Subduction Zone showing the fault's western boundary (red dashed line),
which is closest to the ground surface, and the easterly dipping fault plane (yellow) (DOGAMI,
2012).
Seismic Hazards in the CEI Hub Area The primary seismic hazards that would impact the CEI Hub area are:
Ground shaking
Liquefaction (soil behavior phenomenon in which a saturated sand softens and loses
strength during strong earthquake ground shaking)
Lateral spreading (where surficial soil permanently moves laterally due to earthquake
shaking)
Landslides

40
Co-seismic settlement (where the ground surface is permanently lowered due to seismic
shaking)
Bearing capacity failures (when the foundation soil cannot support the structure it is
intended to support)
In addition, secondary seismic hazards can be initiated and include:
Seiches (waves that oscillate in water bodies often initiated by ground shaking)
Fire
Hazardous material releases, such as fuel overtopping tanks by sloshing (occurs when
liquid becomes agitated by ground shaking)
Liquefaction and lateral spreading hazards are of primary concern to the fuel supply waterfront
facilities. For this reason, DOGAMI performed ground deformation analyses to better
understand the nature of the hazard and the possible mitigation needs. A section on the
deformation analyses is included in this study. Tsunamis are expected to damage the coastal
areas, including ports along the coast and Columbia River mouth, but are not expected to cause
significant damage in the Portland waterways. Following is a summary of these seismic hazards:
Active Fault Sources Many earthquake faults capable of producing damaging earthquakes exist in the area of the CEI
Hub. The most threatening fault is the Cascadia Subduction Zone fault (Cascadia fault) which
lies just offshore of the Oregon coast (see Figures 10 and 11). The Cascadia fault has produced
over 40 large magnitude earthquakes during this past 10,000 years, with the last major
earthquake occurring on January 26, 1700. The 1700 Cascadia earthquake likely caused
extensive ground shaking that extended from the Cape Mendocino area in Northern California to
British Columbia, Canada, as well as a large tsunami. This tsunami first hit the low lying areas
along the Pacific Northwest coast, then traveled across the Pacific Ocean to cause damage to
Japan's coast.
Based on the 10,000 year record of past Cascadia earthquakes (Goldfinger, 2012), Oregon will
certainly experience another magnitude 8-9 earthquake in its future. This future earthquake,
which has the same type of subduction zone process as the March 11, 2011 East Japan
magnitude 9 earthquake, will be accompanied by a coastal tsunami.
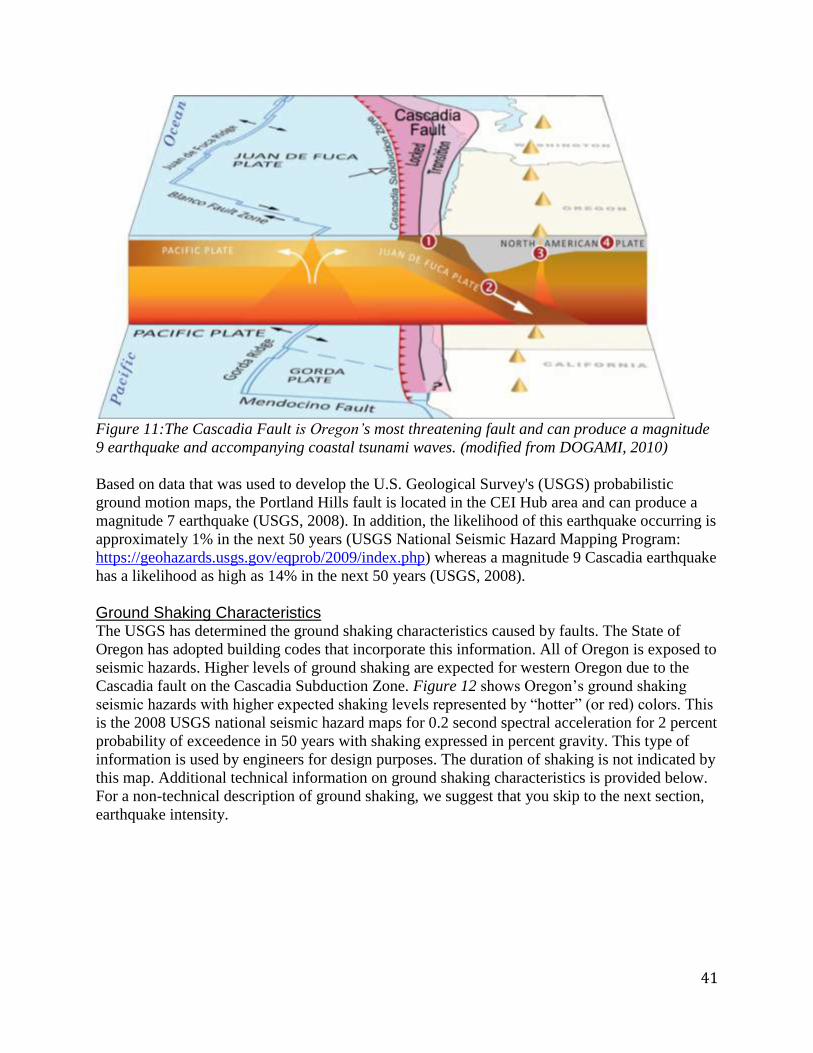
41
Figure 11:The Cascadia Fault is Oregon’s most threatening fault and can produce a magnitude
9 earthquake and accompanying coastal tsunami waves. (modified from DOGAMI, 2010)
Based on data that was used to develop the U.S. Geological Survey's (USGS) probabilistic
ground motion maps, the Portland Hills fault is located in the CEI Hub area and can produce a
magnitude 7 earthquake (USGS, 2008). In addition, the likelihood of this earthquake occurring is
approximately 1% in the next 50 years (USGS National Seismic Hazard Mapping Program:
https://geohazards.usgs.gov/eqprob/2009/index.php) whereas a magnitude 9 Cascadia earthquake
has a likelihood as high as 14% in the next 50 years (USGS, 2008).
Ground Shaking Characteristics The USGS has determined the ground shaking characteristics caused by faults. The State of
Oregon has adopted building codes that incorporate this information. All of Oregon is exposed to
seismic hazards. Higher levels of ground shaking are expected for western Oregon due to the
Cascadia fault on the Cascadia Subduction Zone. Figure 12 shows Oregon’s ground shaking
seismic hazards with higher expected shaking levels represented by “hotter” (or red) colors. This
is the 2008 USGS national seismic hazard maps for 0.2 second spectral acceleration for 2 percent
probability of exceedence in 50 years with shaking expressed in percent gravity. This type of
information is used by engineers for design purposes. The duration of shaking is not indicated by
this map. Additional technical information on ground shaking characteristics is provided below.
For a non-technical description of ground shaking, we suggest that you skip to the next section,
earthquake intensity.
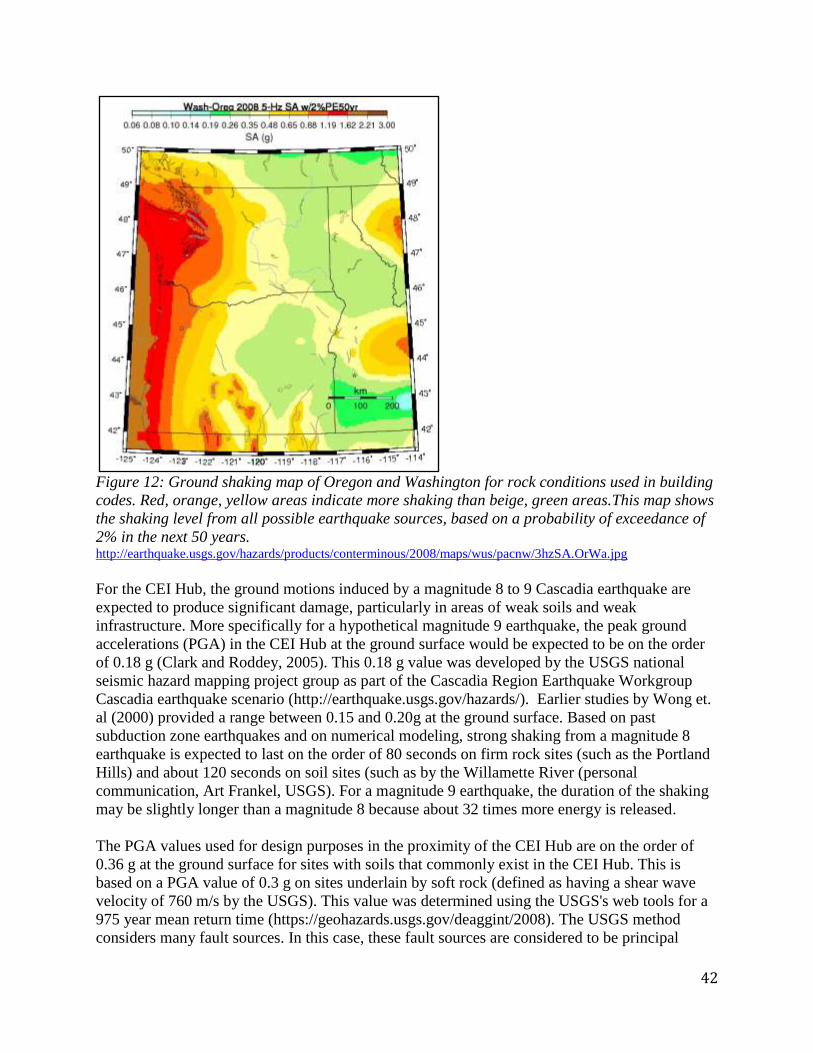
42
Figure 12: Ground shaking map of Oregon and Washington for rock conditions used in building
codes. Red, orange, yellow areas indicate more shaking than beige, green areas.This map shows
the shaking level from all possible earthquake sources, based on a probability of exceedance of
2% in the next 50 years. http://earthquake.usgs.gov/hazards/products/conterminous/2008/maps/wus/pacnw/3hzSA.OrWa.jpg
For the CEI Hub, the ground motions induced by a magnitude 8 to 9 Cascadia earthquake are
expected to produce significant damage, particularly in areas of weak soils and weak
infrastructure. More specifically for a hypothetical magnitude 9 earthquake, the peak ground
accelerations (PGA) in the CEI Hub at the ground surface would be expected to be on the order
of 0.18 g (Clark and Roddey, 2005). This 0.18 g value was developed by the USGS national
seismic hazard mapping project group as part of the Cascadia Region Earthquake Workgroup
Cascadia earthquake scenario (http://earthquake.usgs.gov/hazards/). Earlier studies by Wong et.
al (2000) provided a range between 0.15 and 0.20g at the ground surface. Based on past
subduction zone earthquakes and on numerical modeling, strong shaking from a magnitude 8
earthquake is expected to last on the order of 80 seconds on firm rock sites (such as the Portland
Hills) and about 120 seconds on soil sites (such as by the Willamette River (personal
communication, Art Frankel, USGS). For a magnitude 9 earthquake, the duration of the shaking
may be slightly longer than a magnitude 8 because about 32 times more energy is released.
The PGA values used for design purposes in the proximity of the CEI Hub are on the order of
0.36 g at the ground surface for sites with soils that commonly exist in the CEI Hub. This is
based on a PGA value of 0.3 g on sites underlain by soft rock (defined as having a shear wave
velocity of 760 m/s by the USGS). This value was determined using the USGS's web tools for a
975 year mean return time (https://geohazards.usgs.gov/deaggint/2008). The USGS method
considers many fault sources. In this case, these fault sources are considered to be principal
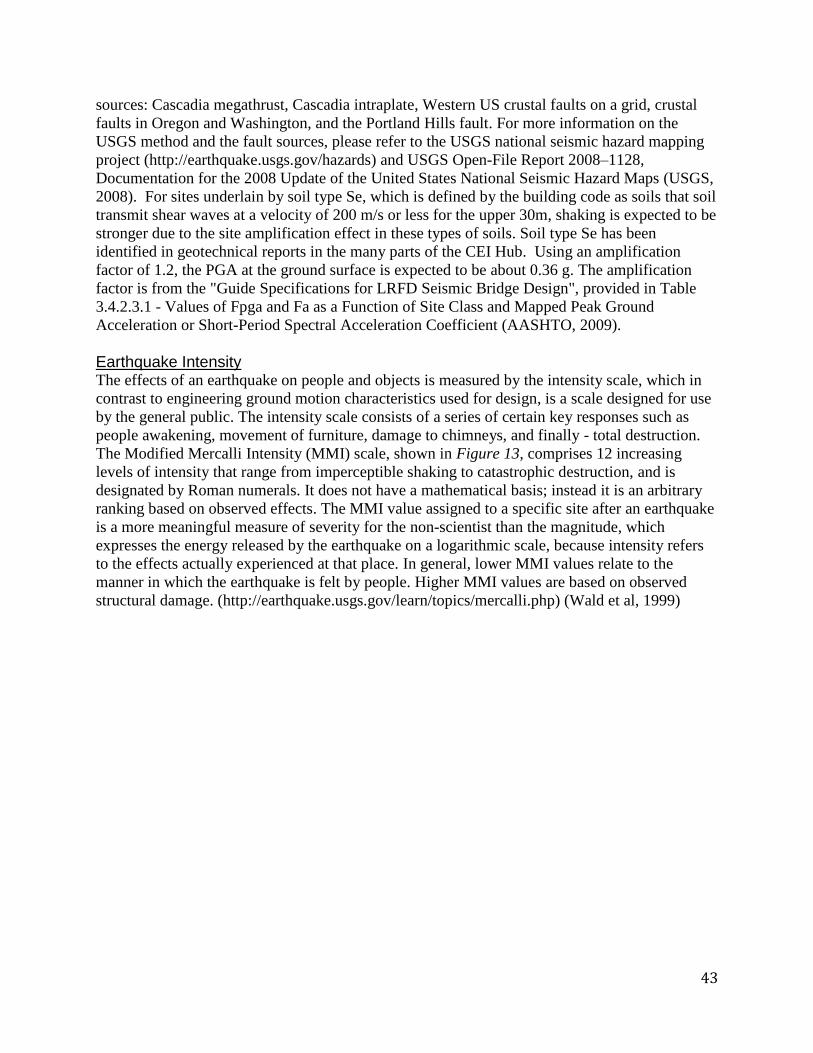
43
sources: Cascadia megathrust, Cascadia intraplate, Western US crustal faults on a grid, crustal
faults in Oregon and Washington, and the Portland Hills fault. For more information on the
USGS method and the fault sources, please refer to the USGS national seismic hazard mapping
project (http://earthquake.usgs.gov/hazards) and USGS Open-File Report 2008–1128,
Documentation for the 2008 Update of the United States National Seismic Hazard Maps (USGS,
2008). For sites underlain by soil type Se, which is defined by the building code as soils that soil
transmit shear waves at a velocity of 200 m/s or less for the upper 30m, shaking is expected to be
stronger due to the site amplification effect in these types of soils. Soil type Se has been
identified in geotechnical reports in the many parts of the CEI Hub. Using an amplification
factor of 1.2, the PGA at the ground surface is expected to be about 0.36 g. The amplification
factor is from the "Guide Specifications for LRFD Seismic Bridge Design", provided in Table
3.4.2.3.1 - Values of Fpga and Fa as a Function of Site Class and Mapped Peak Ground
Acceleration or Short-Period Spectral Acceleration Coefficient (AASHTO, 2009).
Earthquake Intensity The effects of an earthquake on people and objects is measured by the intensity scale, which in
contrast to engineering ground motion characteristics used for design, is a scale designed for use
by the general public. The intensity scale consists of a series of certain key responses such as
people awakening, movement of furniture, damage to chimneys, and finally - total destruction.
The Modified Mercalli Intensity (MMI) scale, shown in Figure 13, comprises 12 increasing
levels of intensity that range from imperceptible shaking to catastrophic destruction, and is
designated by Roman numerals. It does not have a mathematical basis; instead it is an arbitrary
ranking based on observed effects. The MMI value assigned to a specific site after an earthquake
is a more meaningful measure of severity for the non-scientist than the magnitude, which
expresses the energy released by the earthquake on a logarithmic scale, because intensity refers
to the effects actually experienced at that place. In general, lower MMI values relate to the
manner in which the earthquake is felt by people. Higher MMI values are based on observed
structural damage. (http://earthquake.usgs.gov/learn/topics/mercalli.php) (Wald et al, 1999)

44
Figure 13: Earthquake Intensity Scale (http://quake.abag.ca.gov/shaking/mmi/ )

45
A magnitude 9 Cascadia earthquake (Figure 14) would likely produce MMI values of VIII and
IX along the coast in most locations except for areas with tsunami flooding and areas of unstable
soils. Most areas with coastal tsunami flooding would experience major destruction with damage
levels equivalent to MMI X to MMI XII values. Areas of unstable soils in western Oregon could
experience major destruction reaching MMI IX to X, with very limited areas seeing even greater
damage. The MMI values would decrease towards the east. The Willamette Valley would likely
experience MMI VI and MMI VII with localized areas of MMI VIII associated with unstable
soils. East of the valley would likely experience MMI V and lower.
Local earthquakes in 1877 and 1962 produced ground shaking levels as high as MMI VII in
portions of Portland. (Bott and Wong, 1993)
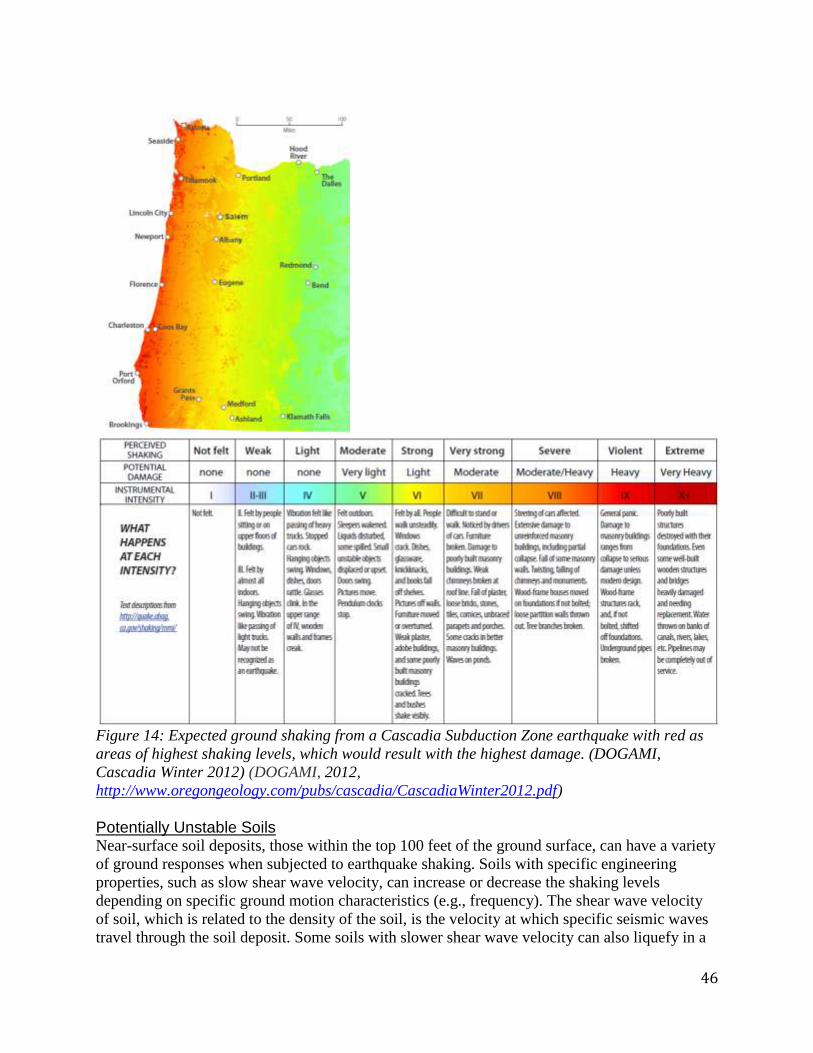
46
Figure 14: Expected ground shaking from a Cascadia Subduction Zone earthquake with red as
areas of highest shaking levels, which would result with the highest damage. (DOGAMI,
Cascadia Winter 2012) (DOGAMI, 2012,
http://www.oregongeology.com/pubs/cascadia/CascadiaWinter2012.pdf)
Potentially Unstable Soils Near-surface soil deposits, those within the top 100 feet of the ground surface, can have a variety
of ground responses when subjected to earthquake shaking. Soils with specific engineering
properties, such as slow shear wave velocity, can increase or decrease the shaking levels
depending on specific ground motion characteristics (e.g., frequency). The shear wave velocity
of soil, which is related to the density of the soil, is the velocity at which specific seismic waves
travel through the soil deposit. Some soils with slower shear wave velocity can also liquefy in a
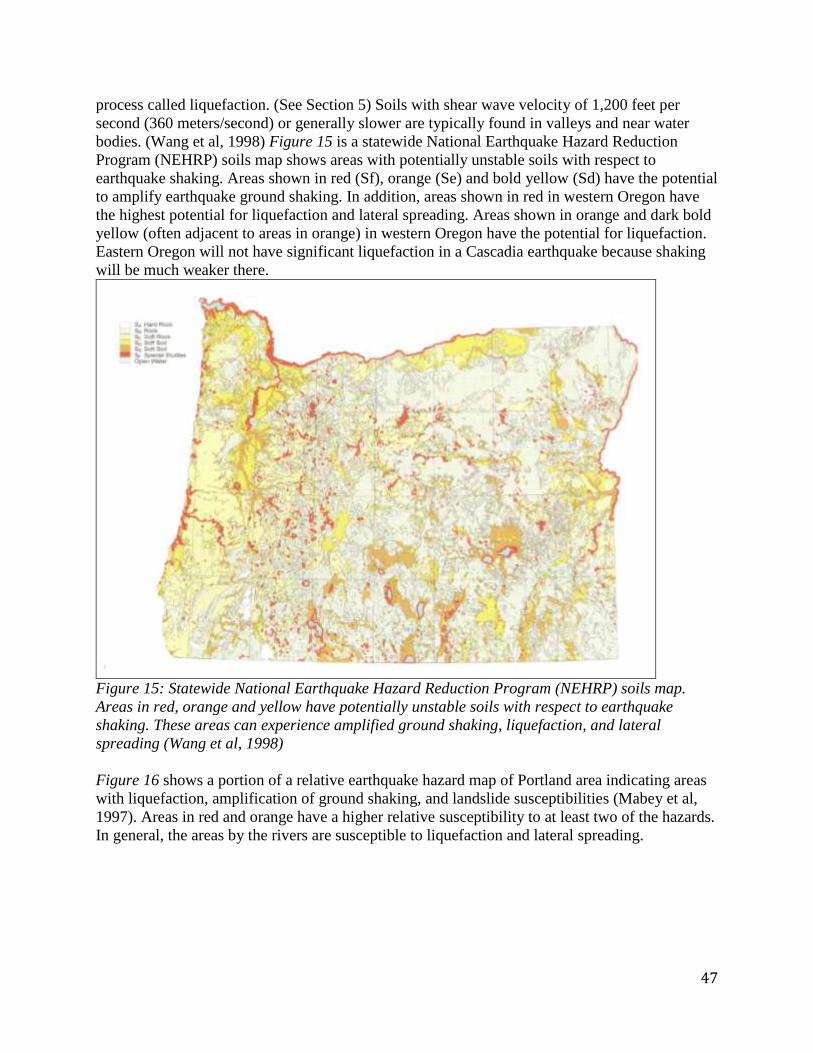
47
process called liquefaction. (See Section 5) Soils with shear wave velocity of 1,200 feet per
second (360 meters/second) or generally slower are typically found in valleys and near water
bodies. (Wang et al, 1998) Figure 15 is a statewide National Earthquake Hazard Reduction
Program (NEHRP) soils map shows areas with potentially unstable soils with respect to
earthquake shaking. Areas shown in red (Sf), orange (Se) and bold yellow (Sd) have the potential
to amplify earthquake ground shaking. In addition, areas shown in red in western Oregon have
the highest potential for liquefaction and lateral spreading. Areas shown in orange and dark bold
yellow (often adjacent to areas in orange) in western Oregon have the potential for liquefaction.
Eastern Oregon will not have significant liquefaction in a Cascadia earthquake because shaking
will be much weaker there.
Figure 15: Statewide National Earthquake Hazard Reduction Program (NEHRP) soils map.
Areas in red, orange and yellow have potentially unstable soils with respect to earthquake
shaking. These areas can experience amplified ground shaking, liquefaction, and lateral
spreading (Wang et al, 1998)
Figure 16 shows a portion of a relative earthquake hazard map of Portland area indicating areas
with liquefaction, amplification of ground shaking, and landslide susceptibilities (Mabey et al,
1997). Areas in red and orange have a higher relative susceptibility to at least two of the hazards.
In general, the areas by the rivers are susceptible to liquefaction and lateral spreading.
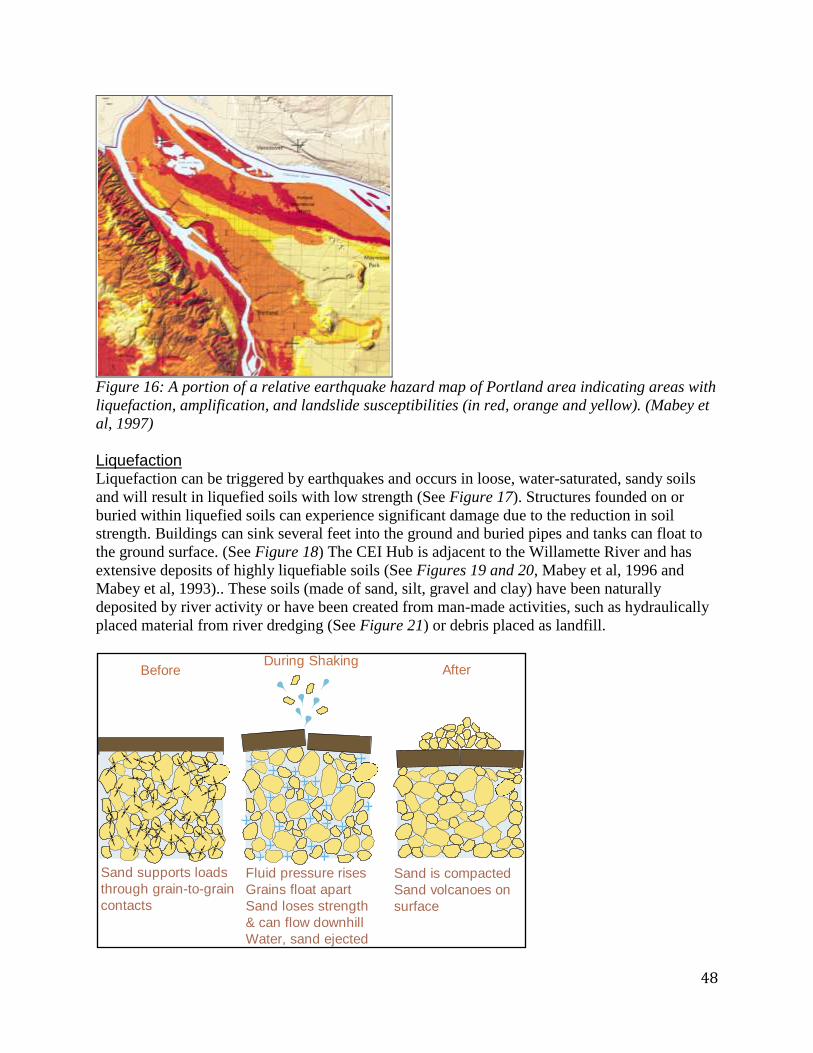
48
Figure 16: A portion of a relative earthquake hazard map of Portland area indicating areas with
liquefaction, amplification, and landslide susceptibilities (in red, orange and yellow). (Mabey et
al, 1997)
Liquefaction Liquefaction can be triggered by earthquakes and occurs in loose, water-saturated, sandy soils
and will result in liquefied soils with low strength (See Figure 17). Structures founded on or
buried within liquefied soils can experience significant damage due to the reduction in soil
strength. Buildings can sink several feet into the ground and buried pipes and tanks can float to
the ground surface. (See Figure 18) The CEI Hub is adjacent to the Willamette River and has
extensive deposits of highly liquefiable soils (See Figures 19 and 20, Mabey et al, 1996 and
Mabey et al, 1993).. These soils (made of sand, silt, gravel and clay) have been naturally
deposited by river activity or have been created from man-made activities, such as hydraulically
placed material from river dredging (See Figure 21) or debris placed as landfill.
BeforeDuring Shaking
After
Sand supports loads
through grain-to-grain
contacts
Fluid pressure rises
Grains float apart
Sand loses strength
& can flow downhill
Water, sand ejected
Sand is compacted
Sand volcanoes on
surface

49
Figure 17: Liquefaction process explanation (US Geological Survey)
Figure 18: Buried tank in liquefied soil that was uplifted due to buoyancy forces in the 1993
Hokkaido-Nansei-Oki Earthquake and Tsunami in Japan (Photo permission on 1/9/12 from
Youd; Youd, T.L. et al 1995, Photo taken by R. Chung)
Figure 19: Map showing liquefaction potential in the northern part of the CEI Hub (Mabey et al,
1996)

50
Figure 20: Map showing thickness of liquefiable sediment in the southern part of the CEI Hub
(Mabey et al, 1993)

51
Figure 21: This photo was taken in the early 1900s and shows river dredging activity in the
Guild’s Lake area south and adjacent to the CEI Hub. Dredged material can be comprised of
highly liquefiable soil. (Oregon Historical Society photo)
Lateral Spreading Lateral spreading occurs when the ground permanently moves laterally due to earthquake
shaking. (See Figure 22) Lateral spreading is common along river fronts because river deposited
soils are often weak and water saturated, conditions that can increase susceptibility. Lateral
spreading can occur on gentle slopes (e.g., less than 1 percent), on flat ground with a distant
slope face, and by waterfront retaining structures. Lateral spreading often occurs in liquefied
soils, but is not restricted to liquefied soils. The magnitude of lateral spreading can range from
inches to several feet, and in extreme cases as in flow slides, hundreds of feet. Lateral spreading
features include fissures and slumping. Figures 23 and 24 are examples of lateral spreading from
the 2010 magnitude 8.8 Chile earthquake.
The CEI Hub is adjacent to the Willamette River and has extensive deposits of soils highly
susceptible to lateral spreads (Figure 25, Mabey et al, 1993). Due to the significant concerns
about lateral spreading hazards in this area, DOGAMI performed dynamic analyses to model
possible ground deformations. Results from a ground deformation analysis are located at the end
of this section.
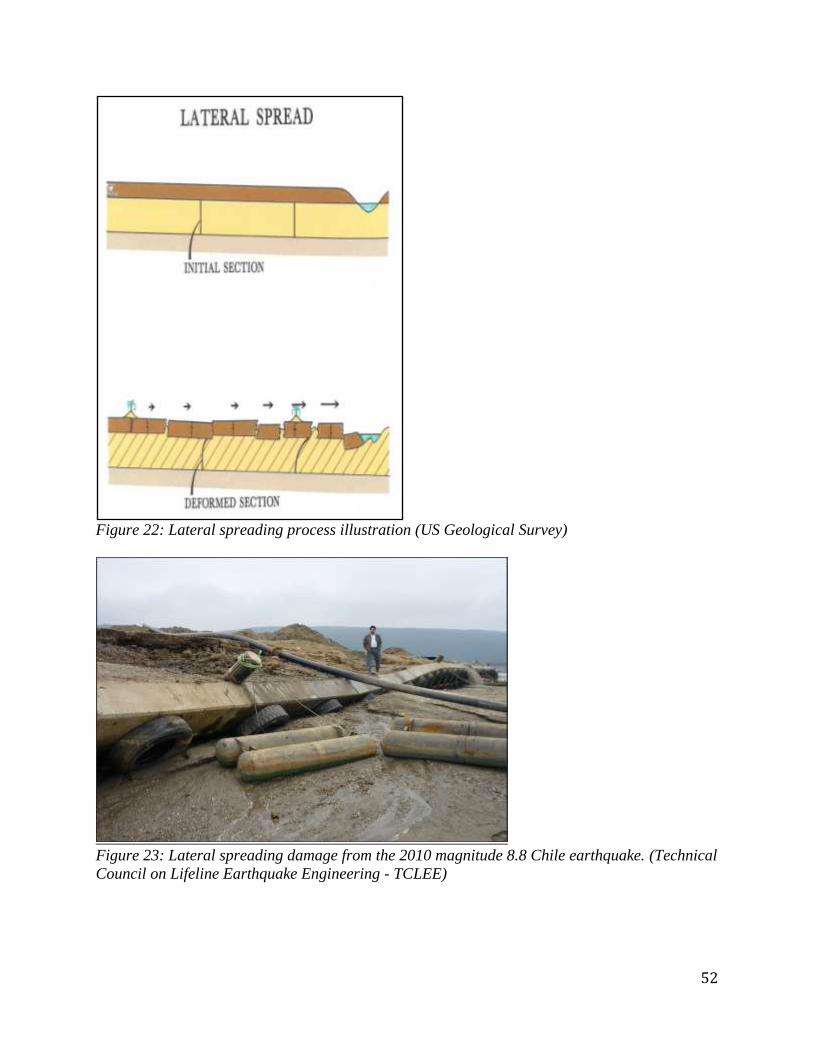
52
Figure 22: Lateral spreading process illustration (US Geological Survey)
Figure 23: Lateral spreading damage from the 2010 magnitude 8.8 Chile earthquake. (Technical
Council on Lifeline Earthquake Engineering - TCLEE)

53
Figure 24: Lateral spreading damage from the 2010 magnitude 8.8 Chile earthquake. (Technical
Council on Lifeline Earthquake Engineering - TCLEE)
Co-Seismic Settlement Co-seismic settlement is where the ground surface is permanently lowered due to seismic
shaking and occurs in certain types of soft, loose soils, such as liquefied soils. The CEI Hub area
has soils that are generally susceptible to co-seismic settlement, in some places, on the order of a
few inches or more. When soils experience uniform settlement, structures are often unharmed.
However, when soils experience differential settlement, structures can incur damage. For
example, rigid pipe fittings often break when the surrounding ground shifts.
Bearing Capacity Failures Bearing capacity failures can occur during shaking when the foundation soil cannot support the
structure it is intended to support. This occurs when the sub-grade soils have not been engineered
and constructed adequately. The CEI Hub area has soils that are generally susceptible to co-
seismic bearing capacity failures, including from liquefied soils. When soils experience
differential settlement, structures can tilt and incur damage. For example, tanks can tilt and
internal floating roof apparatus can become inoperable.
Landslides Landslides are land masses that move down slope and result in permanent ground deformation.
Many types of landslides exist, including fast moving and slow moving types and can occur on
steep ground to even level ground. Earthquakes can trigger thousands of landslides due to the
ground shaking over a wide region and can cause extensive damage. The CEI Hub area has
several mapped landslides including debris flows from the West Hills and rock falls and slumps
along US Highway 30. These mapped landslides are likely from past rainfall events and not by
past earthquake activity.
Seiches Seiches are waves that oscillate in water bodies and can be initiated by ground shaking. Seiches
can vary from minor (e.g., centimeters in height) to over 10 feet and last up to hours.
Theoretically, the Willamette River in the CEI Hub area can experience a seismically-induced
seiche.
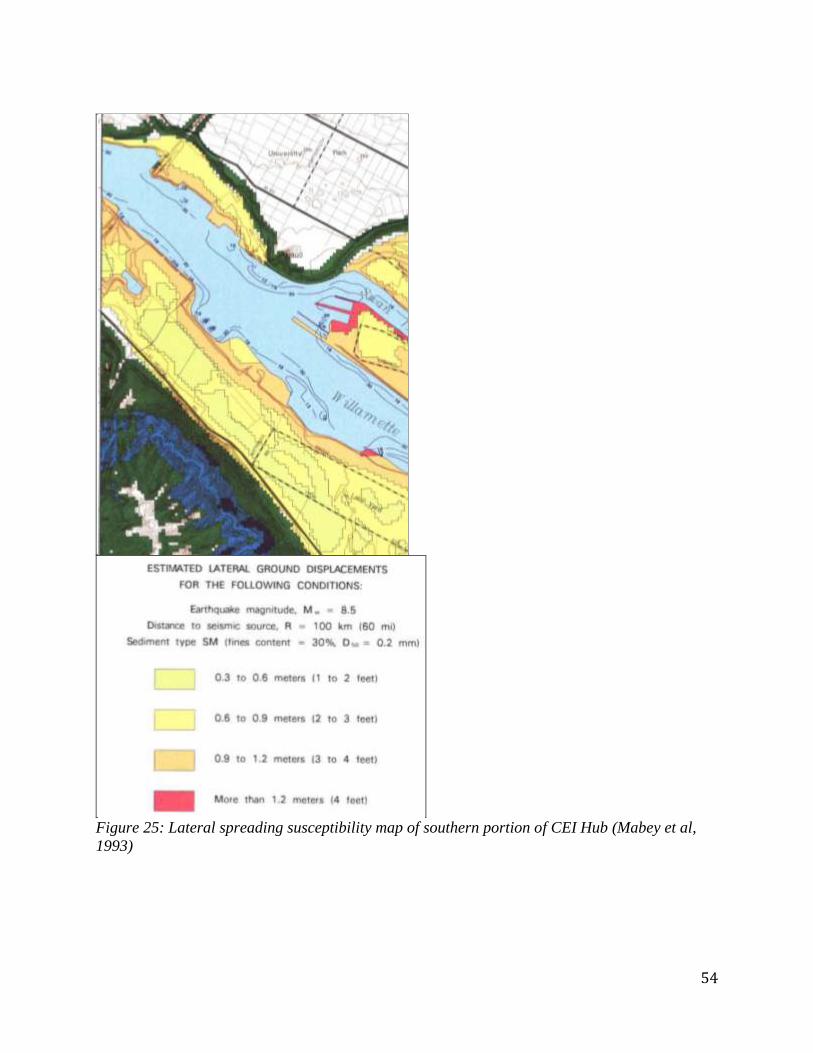
54
Figure 25: Lateral spreading susceptibility map of southern portion of CEI Hub (Mabey et al,
1993)

55
Figure 26: Welded steel water tank damaged in 1992 Landers, California earthquake. (Photo -
Curt Edwards, Technical Council on Lifeline Earthquake Engineering - TCLEE)
Fires Fires are often triggered as secondary effects from earthquakes. Numerous potential ignition
sources are available in the CEI Hub area. Certain types of fires, such as fires with predominately
petroleum fuel or transformer PCBs, require advanced fire specialists to contain. Water storage
tanks may be damaged and the water supply system may be inoperable. (Figure 26)
Hazardous Material Releases Hazardous materials are often released during earthquakes. Numerous potential sources for
possible uncontrolled hazardous material releases exist in the proximity of the CEI Hub, both at
and nearby the energy facilities. These materials can pose different types of hazards, such as
being corrosive, explosive, combustible, poisonous, and/or toxic. A few examples are:
petrochemicals, liquefied natural gas (LNG), chlorine gas, and anhydrous ammonia. Sloshing of
hazardous materials in tanks can occur in earthquakes. Sloshing occurs when liquid becomes
agitated by ground shaking. The CEI Hub has numerous tanks with liquid fuel and other products
that are susceptible to sloshing. Waves and splashing of liquids can overtop tanks and/or damage
tanks. (Figure 27)
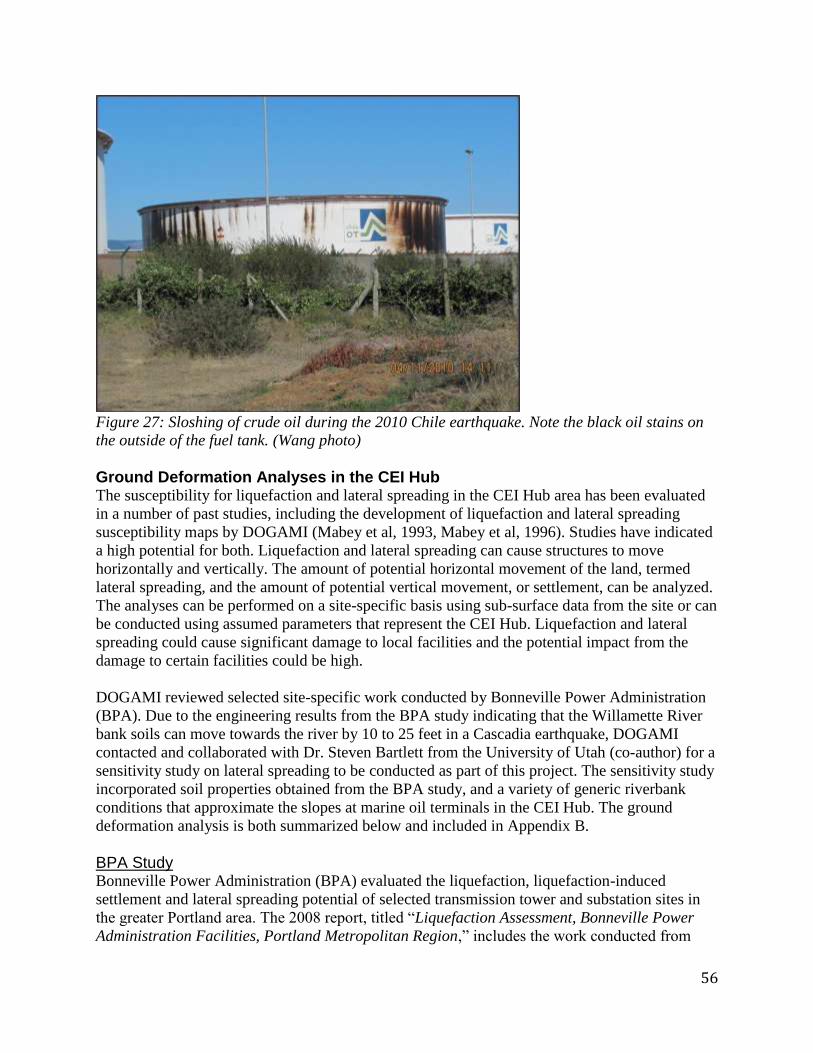
56
Figure 27: Sloshing of crude oil during the 2010 Chile earthquake. Note the black oil stains on
the outside of the fuel tank. (Wang photo)
Ground Deformation Analyses in the CEI Hub The susceptibility for liquefaction and lateral spreading in the CEI Hub area has been evaluated
in a number of past studies, including the development of liquefaction and lateral spreading
susceptibility maps by DOGAMI (Mabey et al, 1993, Mabey et al, 1996). Studies have indicated
a high potential for both. Liquefaction and lateral spreading can cause structures to move
horizontally and vertically. The amount of potential horizontal movement of the land, termed
lateral spreading, and the amount of potential vertical movement, or settlement, can be analyzed.
The analyses can be performed on a site-specific basis using sub-surface data from the site or can
be conducted using assumed parameters that represent the CEI Hub. Liquefaction and lateral
spreading could cause significant damage to local facilities and the potential impact from the
damage to certain facilities could be high.
DOGAMI reviewed selected site-specific work conducted by Bonneville Power Administration
(BPA). Due to the engineering results from the BPA study indicating that the Willamette River
bank soils can move towards the river by 10 to 25 feet in a Cascadia earthquake, DOGAMI
contacted and collaborated with Dr. Steven Bartlett from the University of Utah (co-author) for a
sensitivity study on lateral spreading to be conducted as part of this project. The sensitivity study
incorporated soil properties obtained from the BPA study, and a variety of generic riverbank
conditions that approximate the slopes at marine oil terminals in the CEI Hub. The ground
deformation analysis is both summarized below and included in Appendix B.
BPA Study Bonneville Power Administration (BPA) evaluated the liquefaction, liquefaction-induced
settlement and lateral spreading potential of selected transmission tower and substation sites in
the greater Portland area. The 2008 report, titled “Liquefaction Assessment, Bonneville Power
Administration Facilities, Portland Metropolitan Region,” includes the work conducted from
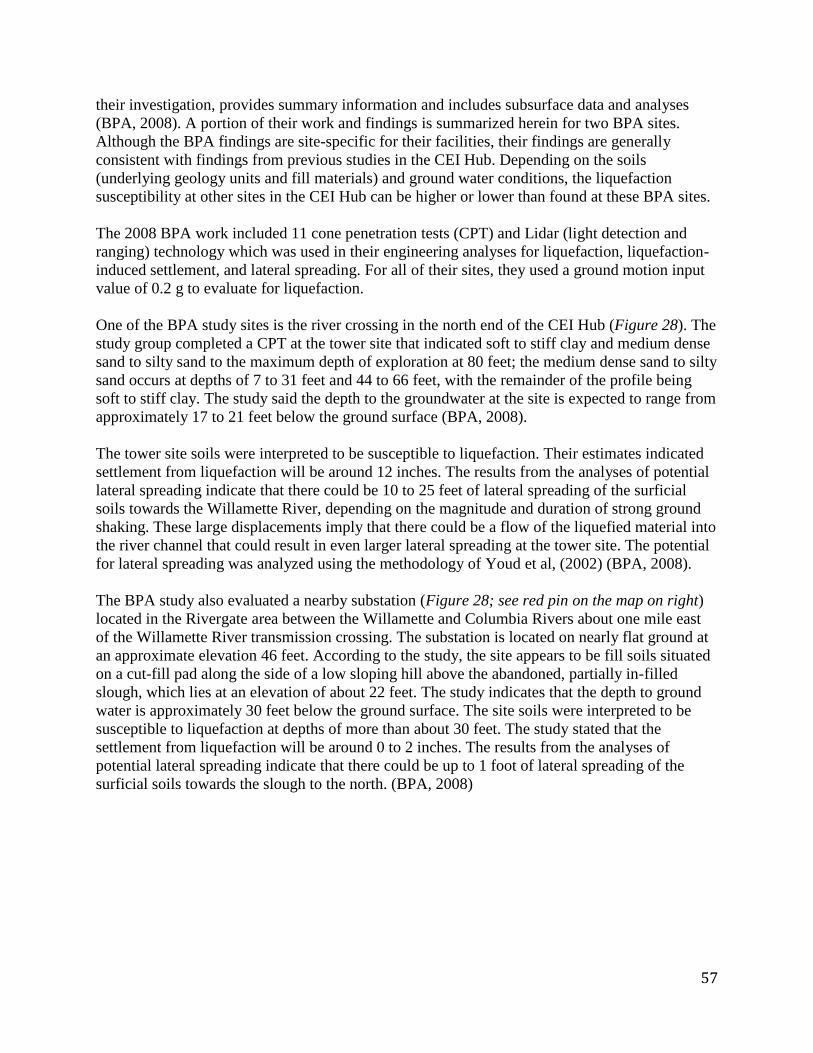
57
their investigation, provides summary information and includes subsurface data and analyses
(BPA, 2008). A portion of their work and findings is summarized herein for two BPA sites.
Although the BPA findings are site-specific for their facilities, their findings are generally
consistent with findings from previous studies in the CEI Hub. Depending on the soils
(underlying geology units and fill materials) and ground water conditions, the liquefaction
susceptibility at other sites in the CEI Hub can be higher or lower than found at these BPA sites.
The 2008 BPA work included 11 cone penetration tests (CPT) and Lidar (light detection and
ranging) technology which was used in their engineering analyses for liquefaction, liquefaction-
induced settlement, and lateral spreading. For all of their sites, they used a ground motion input
value of 0.2 g to evaluate for liquefaction.
One of the BPA study sites is the river crossing in the north end of the CEI Hub (Figure 28). The
study group completed a CPT at the tower site that indicated soft to stiff clay and medium dense
sand to silty sand to the maximum depth of exploration at 80 feet; the medium dense sand to silty
sand occurs at depths of 7 to 31 feet and 44 to 66 feet, with the remainder of the profile being
soft to stiff clay. The study said the depth to the groundwater at the site is expected to range from
approximately 17 to 21 feet below the ground surface (BPA, 2008).
The tower site soils were interpreted to be susceptible to liquefaction. Their estimates indicated
settlement from liquefaction will be around 12 inches. The results from the analyses of potential
lateral spreading indicate that there could be 10 to 25 feet of lateral spreading of the surficial
soils towards the Willamette River, depending on the magnitude and duration of strong ground
shaking. These large displacements imply that there could be a flow of the liquefied material into
the river channel that could result in even larger lateral spreading at the tower site. The potential
for lateral spreading was analyzed using the methodology of Youd et al, (2002) (BPA, 2008).
The BPA study also evaluated a nearby substation (Figure 28; see red pin on the map on right)
located in the Rivergate area between the Willamette and Columbia Rivers about one mile east
of the Willamette River transmission crossing. The substation is located on nearly flat ground at
an approximate elevation 46 feet. According to the study, the site appears to be fill soils situated
on a cut-fill pad along the side of a low sloping hill above the abandoned, partially in-filled
slough, which lies at an elevation of about 22 feet. The study indicates that the depth to ground
water is approximately 30 feet below the ground surface. The site soils were interpreted to be
susceptible to liquefaction at depths of more than about 30 feet. The study stated that the
settlement from liquefaction will be around 0 to 2 inches. The results from the analyses of
potential lateral spreading indicate that there could be up to 1 foot of lateral spreading of the
surficial soils towards the slough to the north. (BPA, 2008)
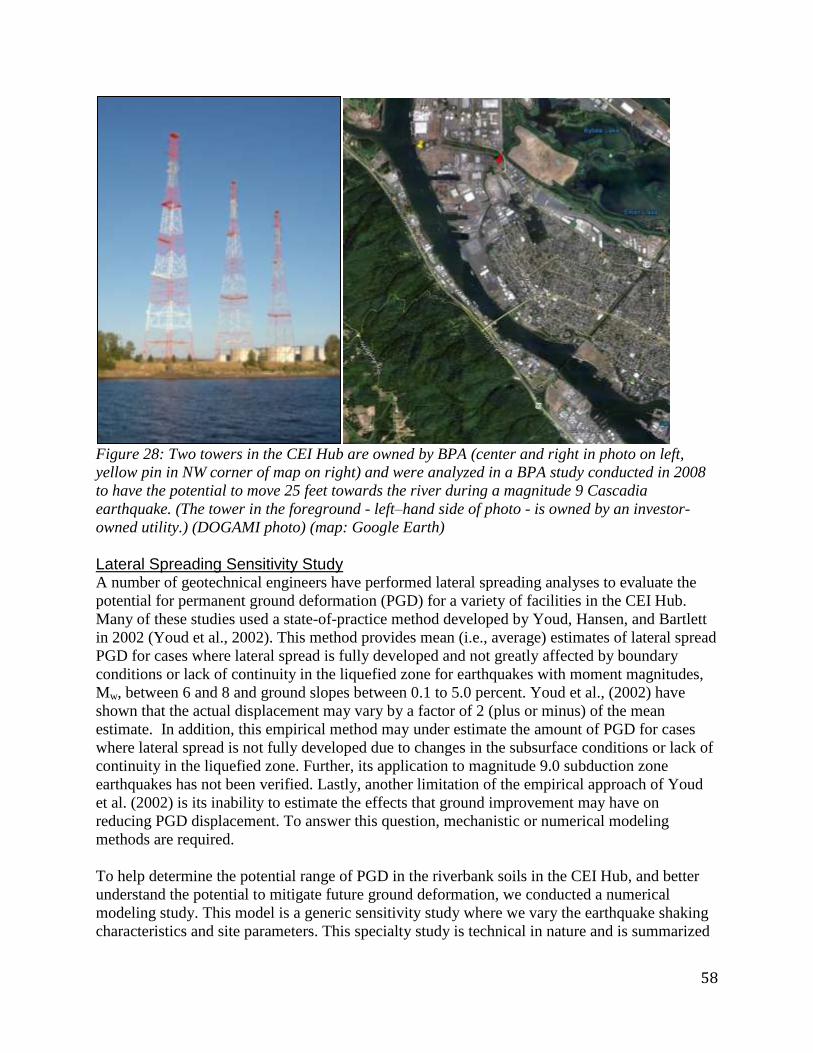
58
Figure 28: Two towers in the CEI Hub are owned by BPA (center and right in photo on left,
yellow pin in NW corner of map on right) and were analyzed in a BPA study conducted in 2008
to have the potential to move 25 feet towards the river during a magnitude 9 Cascadia
earthquake. (The tower in the foreground - left–hand side of photo - is owned by an investor-
owned utility.) (DOGAMI photo) (map: Google Earth)
Lateral Spreading Sensitivity Study A number of geotechnical engineers have performed lateral spreading analyses to evaluate the
potential for permanent ground deformation (PGD) for a variety of facilities in the CEI Hub.
Many of these studies used a state-of-practice method developed by Youd, Hansen, and Bartlett
in 2002 (Youd et al., 2002). This method provides mean (i.e., average) estimates of lateral spread
PGD for cases where lateral spread is fully developed and not greatly affected by boundary
conditions or lack of continuity in the liquefied zone for earthquakes with moment magnitudes,
Mw, between 6 and 8 and ground slopes between 0.1 to 5.0 percent. Youd et al., (2002) have
shown that the actual displacement may vary by a factor of 2 (plus or minus) of the mean
estimate. In addition, this empirical method may under estimate the amount of PGD for cases
where lateral spread is not fully developed due to changes in the subsurface conditions or lack of
continuity in the liquefied zone. Further, its application to magnitude 9.0 subduction zone
earthquakes has not been verified. Lastly, another limitation of the empirical approach of Youd
et al. (2002) is its inability to estimate the effects that ground improvement may have on
reducing PGD displacement. To answer this question, mechanistic or numerical modeling
methods are required.
To help determine the potential range of PGD in the riverbank soils in the CEI Hub, and better
understand the potential to mitigate future ground deformation, we conducted a numerical
modeling study. This model is a generic sensitivity study where we vary the earthquake shaking
characteristics and site parameters. This specialty study is technical in nature and is summarized
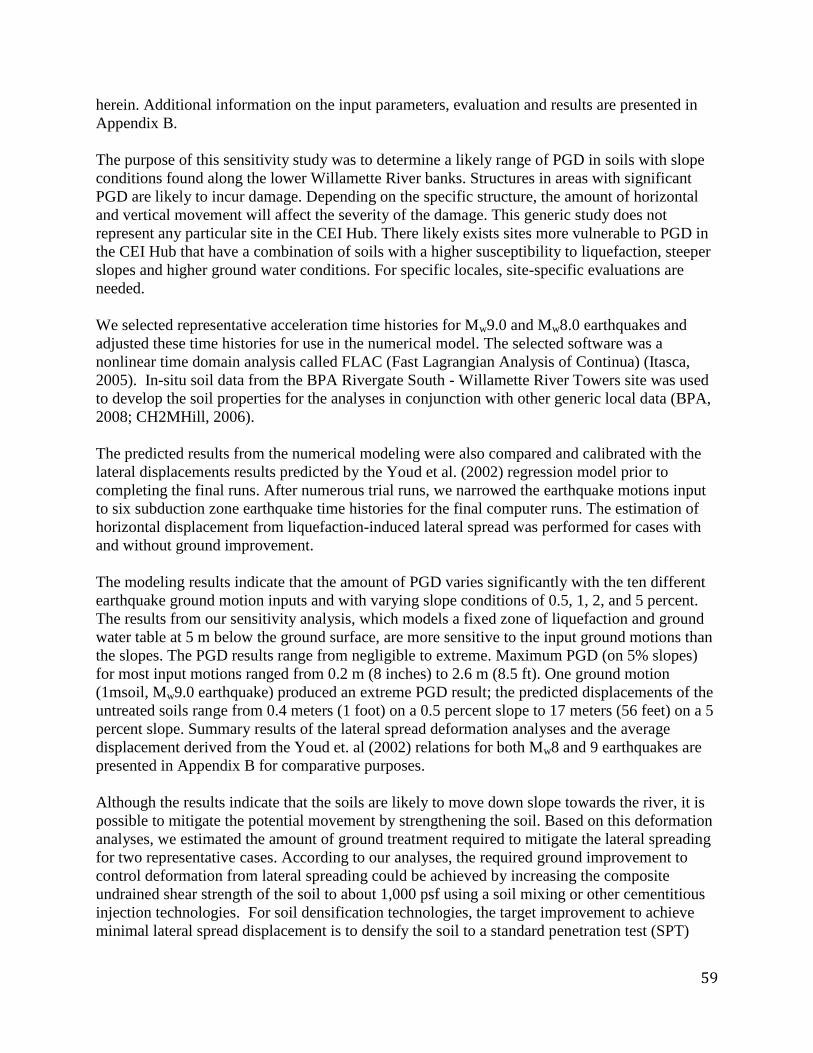
59
herein. Additional information on the input parameters, evaluation and results are presented in
Appendix B.
The purpose of this sensitivity study was to determine a likely range of PGD in soils with slope
conditions found along the lower Willamette River banks. Structures in areas with significant
PGD are likely to incur damage. Depending on the specific structure, the amount of horizontal
and vertical movement will affect the severity of the damage. This generic study does not
represent any particular site in the CEI Hub. There likely exists sites more vulnerable to PGD in
the CEI Hub that have a combination of soils with a higher susceptibility to liquefaction, steeper
slopes and higher ground water conditions. For specific locales, site-specific evaluations are
needed.
We selected representative acceleration time histories for Mw9.0 and Mw8.0 earthquakes and
adjusted these time histories for use in the numerical model. The selected software was a
nonlinear time domain analysis called FLAC (Fast Lagrangian Analysis of Continua) (Itasca,
2005). In-situ soil data from the BPA Rivergate South - Willamette River Towers site was used
to develop the soil properties for the analyses in conjunction with other generic local data (BPA,
2008; CH2MHill, 2006).
The predicted results from the numerical modeling were also compared and calibrated with the
lateral displacements results predicted by the Youd et al. (2002) regression model prior to
completing the final runs. After numerous trial runs, we narrowed the earthquake motions input
to six subduction zone earthquake time histories for the final computer runs. The estimation of
horizontal displacement from liquefaction-induced lateral spread was performed for cases with
and without ground improvement.
The modeling results indicate that the amount of PGD varies significantly with the ten different
earthquake ground motion inputs and with varying slope conditions of 0.5, 1, 2, and 5 percent.
The results from our sensitivity analysis, which models a fixed zone of liquefaction and ground
water table at 5 m below the ground surface, are more sensitive to the input ground motions than
the slopes. The PGD results range from negligible to extreme. Maximum PGD (on 5% slopes)
for most input motions ranged from 0.2 m (8 inches) to 2.6 m (8.5 ft). One ground motion
(1msoil, Mw9.0 earthquake) produced an extreme PGD result; the predicted displacements of the
untreated soils range from 0.4 meters (1 foot) on a 0.5 percent slope to 17 meters (56 feet) on a 5
percent slope. Summary results of the lateral spread deformation analyses and the average
displacement derived from the Youd et. al (2002) relations for both Mw8 and 9 earthquakes are
presented in Appendix B for comparative purposes.
Although the results indicate that the soils are likely to move down slope towards the river, it is
possible to mitigate the potential movement by strengthening the soil. Based on this deformation
analyses, we estimated the amount of ground treatment required to mitigate the lateral spreading
for two representative cases. According to our analyses, the required ground improvement to
control deformation from lateral spreading could be achieved by increasing the composite
undrained shear strength of the soil to about 1,000 psf using a soil mixing or other cementitious
injection technologies. For soil densification technologies, the target improvement to achieve
minimal lateral spread displacement is to densify the soil to a standard penetration test (SPT)

60
N160 blow count of 15, or greater, in the liquefiable zone. Nonetheless for actual sites, site-
specific engineering studies would be required.
In summary, the evaluations in Appendix B verified that the soil in the CEI Hub could be
vulnerable to damaging lateral spreading displacement during a Cascadia earthquake on a ground
slope as low as 0.5 percent. In addition, for critical structures that cannot tolerate PGD,
vulnerable soil conditions can be mitigated against lateral spreading using ground improvement.
This is valuable information as we consider the many critical energy facilities located in the area.
61
Section 5 Energy Facilities and Vulnerabilities in the CEI Hub
Portland’s critical energy infrastructure, including high voltage electricity transmission, fuel
pipelines, tank farms, ports and facilities, is concentrated along the Willamette River in the
critical energy infrastructure (CEI) Hub. Much of the existing infrastructure was constructed
prior to current seismic safety specifications and many of the petroleum storage tanks, piers,
marine docks and buildings may not be adequately hardened. This area consists primarily of
man-made filled land overlying river sediments and is vulnerable to liquefaction and lateral
spreading. The concentration of facilities and hazardous materials in this area has the potential to
produce damaging cascading effects including fires from ruptured natural gas and fuel lines,
hazardous material releases and debris blockage of the Willamette River.
There are a variety of structures at the oil terminals, natural gas facilities, and electrical
substations, as well as transmission pipes for liquid fuel and natural gas, and transmission towers
and lines for electricity. Most of the facilities include control buildings with control equipment,
some with emergency generators and/or batteries. The fuel terminals often include: transmission
and distribution pipelines, piers or wharves, tank farms, pipe and loading racks, pumps, electric
distribution equipment, and many other components. The liquid fuel transmission system
includes gate stations, and transmission and distribution pipes, including at the Columbia and
Willamette river crossings. Figure 29 shows infrastructure, including liquid fuel pipelines
(dashed yellow), natural gas pipelines (yellow) and electrical transmission lines (pink) on
potentially vulnerable soils in the CEI Hub. In addition to the major energy lines co-located in
this area, water, waste-water, rail and a highway are located here. Figure 29 is a close up of a
larger map, which shows that the natural gas system has a loop configuration around the greater
Portland area. Similarly, it shows that the electrical system includes a loop around the greater
Portland area. The larger mapped can be accessed at:
http://pubs.usgs.gov/sim/3027/sim3027_front.pdf
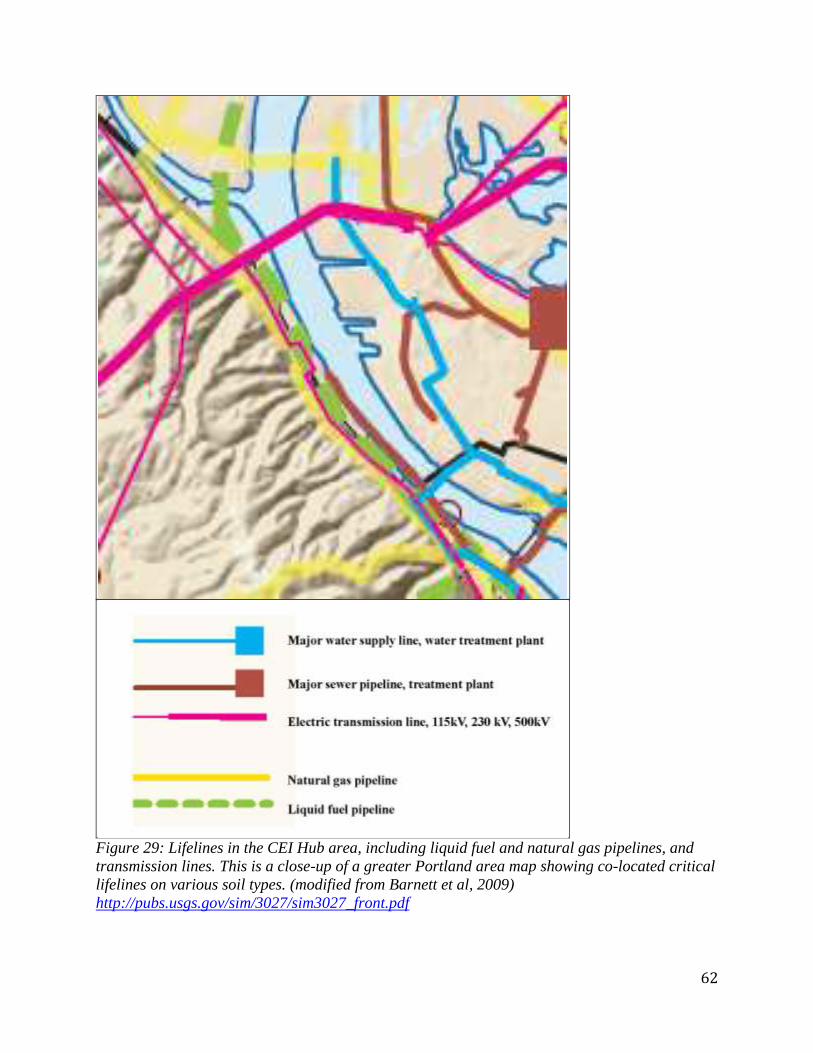
62
Figure 29: Lifelines in the CEI Hub area, including liquid fuel and natural gas pipelines, and
transmission lines. This is a close-up of a greater Portland area map showing co-located critical
lifelines on various soil types. (modified from Barnett et al, 2009)
http://pubs.usgs.gov/sim/3027/sim3027_front.pdf

63
The electrical facilities include electric substations that feed into the region’s power grid.
Substations include control buildings with control equipment and back-up batteries,
transformers, circuit breakers, and bus structures. The power system also includes transmission
lines and transmission towers. The natural gas system includes gate stations, transmission and
distribution pipes, and a liquefied natural gas (LNG) terminal, which includes tanks,
liquefication and gasification processing equipment, and control equipment.
DOGAMI conducted evaluations of the facilities with varying levels of detail ranging from
review of available engineering reports to conducting visual screening-level assessments.
DOGAMI was assisted by professional specialists for much of the work (see
acknowledgements). For example, DOGAMI worked with the local U.S. Coast Guard (USCG)
and engineers from California's program called Marine Oil Terminal Engineering and
Maintenance Standards (MOTEMS) to perform some of the visual screening level assessments
of the piers and wharves in the CEI Hub. William R. Clark, USCG Port Security Specialist was
DOGAMI's key point of contact. Martin Eskijian, MOTEMS Engineering Branch Supervisor
(retired in 2011), Kendra Oliver, Senior Engineer, Petroleum Structures, and several other staff,
provided technical expertise, which is described in Oil Terminal Facilities.
This section reviews the facilities included in the study. It also includes a discussion on building
codes. Building codes regulate the seismic design criteria, which in turn, controls seismic
vulnerability. This section also includes a more detailed discussion on waterfront dock structures,
land-based structures, seismic pipeline vulnerability and co-located facilities in the CEI Hub.
CEI Hub Facilities: Liquid Fuel, Natural Gas and Electricity All of the facilities in the CEI Hub are exposed to a variety of seismic hazards. The energy sector
facilities in the CEI Hub include:
All of Oregon’s major liquid fuel port terminals
Liquid fuel transmission pipelines and a transfer station
Natural gas transmission pipelines and a transfer station
Liquefied natural gas facility
High voltage electric substation and transmission lines
Electrical distribution substations
The EAP partners visited all relevant energy companies with facilities in the CEI Hub. DOGAMI
and ODOE jointly conducted site visits with the terminal managers at these petroleum facilities:
BP, Chevron, ConocoPhillips, KinderMorgan (KM) fuel terminals and KM pipeline, McCall Oil,
Nustar, and Shell. MOTEMS senior engineer, Kendra Oliver, participated in the visits to BP,
Chevron, McCall and Shell. The fuel facilities often include: transmission and distribution
pipelines, piers or wharves, tank farms, loading racks, control buildings, electric distribution
equipment, and many other components. The liquid fuel transmission system includes gate
stations, and transmission and distribution pipes at the Columbia and Willamette river crossings.
It is important to note that more than 90 percent of liquid fuels consumed in Oregon pass through
the CEI Hub, as does a significant portion of NW Natural’s natural gas. Thus, this area is
critically important to Oregon residents, businesses and industrial firms.
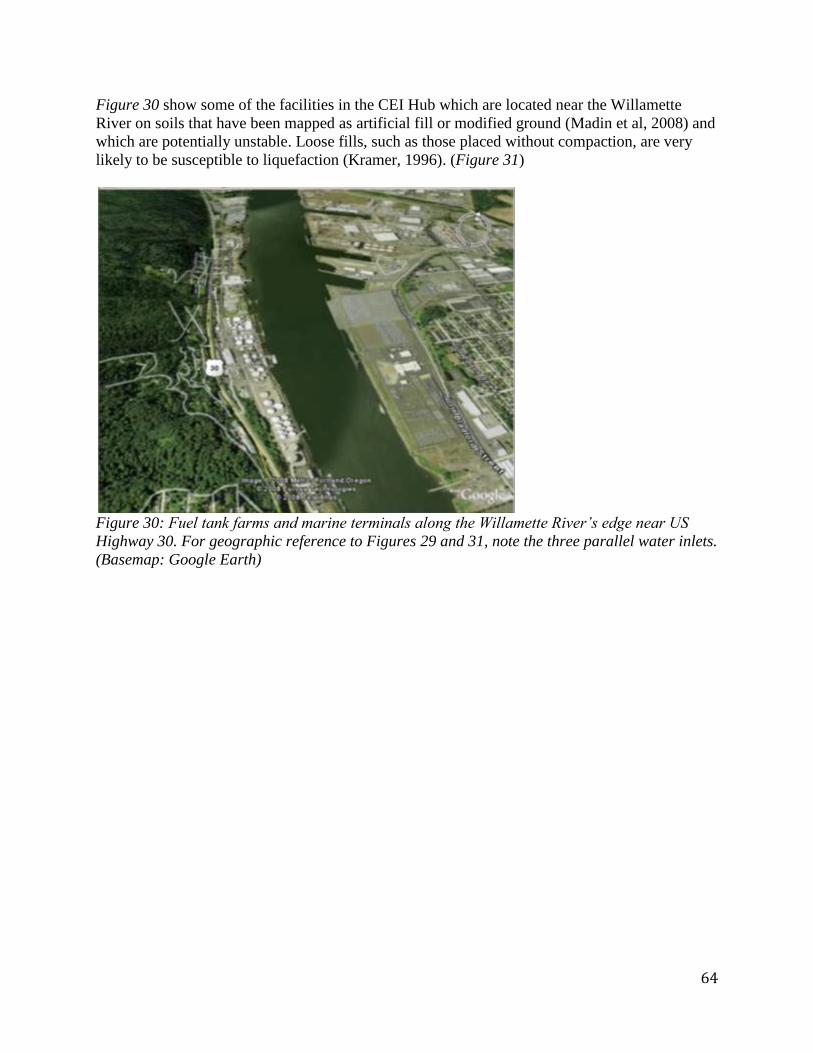
64
Figure 30 show some of the facilities in the CEI Hub which are located near the Willamette
River on soils that have been mapped as artificial fill or modified ground (Madin et al, 2008) and
which are potentially unstable. Loose fills, such as those placed without compaction, are very
likely to be susceptible to liquefaction (Kramer, 1996). (Figure 31)
Figure 30: Fuel tank farms and marine terminals along the Willamette River’s edge near US
Highway 30. For geographic reference to Figures 29 and 31, note the three parallel water inlets.
(Basemap: Google Earth)

65
Figure 31: Surface geology map showing areas of fill materials (in pink) adjacent to the river.
For geographic reference to Figures 29 and 30, note the three parallel water inlets. (Madin et
al, 2008)
DOGAMI and OPUC conducted site visits with utility operators at Bonneville Power
Administration, NW Natural, Portland General Electric (PGE), and Williams Northwest Pipeline
electrical and natural gas facilities. (No PacifiCorp facilities are located in the CEI Hub.) BPA
principal structural engineer, Leon Kempner Jr., provided technical expertise at all of BPA's
electrical facilities. The electrical facilities include electric substations that feed into the region’s
power grid. Substations include control buildings with control equipment and back-up batteries,
transformers, circuit breakers, and bus structures. The power system also includes transmission
lines and transmission towers. The natural gas system includes gate stations, transmission and
distribution pipes, and an LNG terminal, which includes tanks, liquefication and gasification
processing equipment, and control equipment.
We also conducted selected site visits to important energy facilities located just outside of the
CEI Hub. These included:
Two large electrical substations on Front Street (Figure 32)
A natural gas gate station on Sauvie Island

66
Two Columbia County electric power plants that use natural gas (Port Westward and
Beavers) are located next to the Columbia River. Both plants were developed on land
susceptible to liquefaction triggered by a Cascadia earthquake; the soil at the newer plant
was mitigated before construction.
A liquid fuel terminal in Eugene that is dependent on the CEI Hub for its fuel and serves
as an important distribution facility for Southern Oregon
Figure 32: Two large electric substations just south of the CEI Hub on Front Street that are
separated by a railroad track (Basemap: Google Earth)
Some infrastructure in the CEI Hub facilities was built 100 years ago, to very antiquated
standards while other infrastructure is new and built to the current state-of-practice standards.
Because of the wide range of ages and associated construction practices, the seismic
vulnerability of the facilities also spans a wide range. Based on visual observations, engineering
judgment and limited information from the facility operators, major seismic vulnerabilities exist
in the CEI Hub. Some critically important structures appear to be highly susceptible to
significant damage in a major earthquake. In contrast, some structures are expected to have
adequate seismic performance, including the new structures because of improved seismic design
practices. Some existing structures have been strengthened or upgraded, such as evidenced by
the newer dolphin structures used for mooring ships by older piers. No estimate has been made
on the percentage of newer or upgraded structures.

67
Energy companies have operational interdependencies with the transportation and
telecommunication sectors. To address seismic resilience for critical energy infrastructure
operations and interdependencies, DOGAMI:
Worked with the Oregon Department of Transportation (ODOT) to prioritize key bridges
and highways in the CEI Hub for potential future upgrades to withstand Cascadia
earthquake impacts. Highway 30 is essential for vehicular access to many of the CEI Hub
energy facilities. Bridges are critical to supporting fuel deliveries from the CEI Hub to
other parts of Oregon. In June 2012, ODOT issued its Oregon Seismic Lifeline Route
Study, which includes Highway 30 and the I-405 bridge as tier 1 lifeline routes (See
Figure 33). Co-author Wang was a steering committee member on the project.
http://www.oregon.gov/ODOT/TD/TP/Reports/Lifeline%20Selection%20Summary%20
Report.pdf
Worked with ODOE and ODOT to ensure reliable alternate routes are identified and
maintained to support distribution should the primary bridges for fuel deliveries become
impassable. This included co-author Wang and Tova Peltz (ODOT geotechnical
engineer) inspecting the Columbia River waterway in an air reconnaissance, as well as
discussions with William Clark (USCG), and bridge engineers Albert Nako (ODOT) and
David O'Longaigh (City of Portland Bureau of Transportation).
Worked with OPUC and the investor-owned telecommunication providers in Oregon that
the PUC regulates to promote reliable communications to energy companies located in
the CEI Hub. This includes working with telecommunications providers to: 1) identify
and resolve vulnerabilities to the system prior to an emergency, and 2) ensuring the rapid
recovery of downed communication systems in the CEI Hub in the aftermath of an
emergency. OPUC and DOGAMI have suggested to member of the telecommunication
industry that they conduct seismic vulnerability assessments of their systems, including at
Oregon Utility Safety Committee, OPUC's Energy Emergency Management Team and at
invited talks, such as to the Oregon Telecommunications Association.
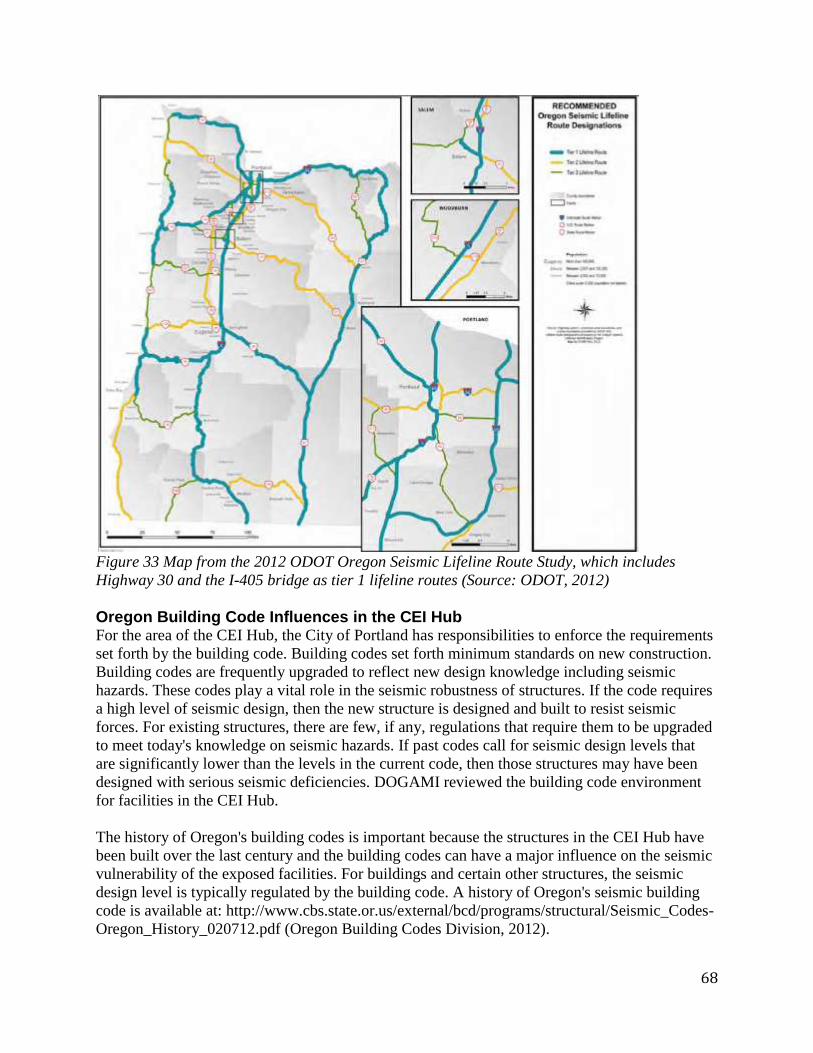
68
Figure 33 Map from the 2012 ODOT Oregon Seismic Lifeline Route Study, which includes
Highway 30 and the I-405 bridge as tier 1 lifeline routes (Source: ODOT, 2012)
Oregon Building Code Influences in the CEI Hub For the area of the CEI Hub, the City of Portland has responsibilities to enforce the requirements
set forth by the building code. Building codes set forth minimum standards on new construction.
Building codes are frequently upgraded to reflect new design knowledge including seismic
hazards. These codes play a vital role in the seismic robustness of structures. If the code requires
a high level of seismic design, then the new structure is designed and built to resist seismic
forces. For existing structures, there are few, if any, regulations that require them to be upgraded
to meet today's knowledge on seismic hazards. If past codes call for seismic design levels that
are significantly lower than the levels in the current code, then those structures may have been
designed with serious seismic deficiencies. DOGAMI reviewed the building code environment
for facilities in the CEI Hub.
The history of Oregon's building codes is important because the structures in the CEI Hub have
been built over the last century and the building codes can have a major influence on the seismic
vulnerability of the exposed facilities. For buildings and certain other structures, the seismic
design level is typically regulated by the building code. A history of Oregon's seismic building
code is available at: http://www.cbs.state.or.us/external/bcd/programs/structural/Seismic_Codes-
Oregon_History_020712.pdf (Oregon Building Codes Division, 2012).
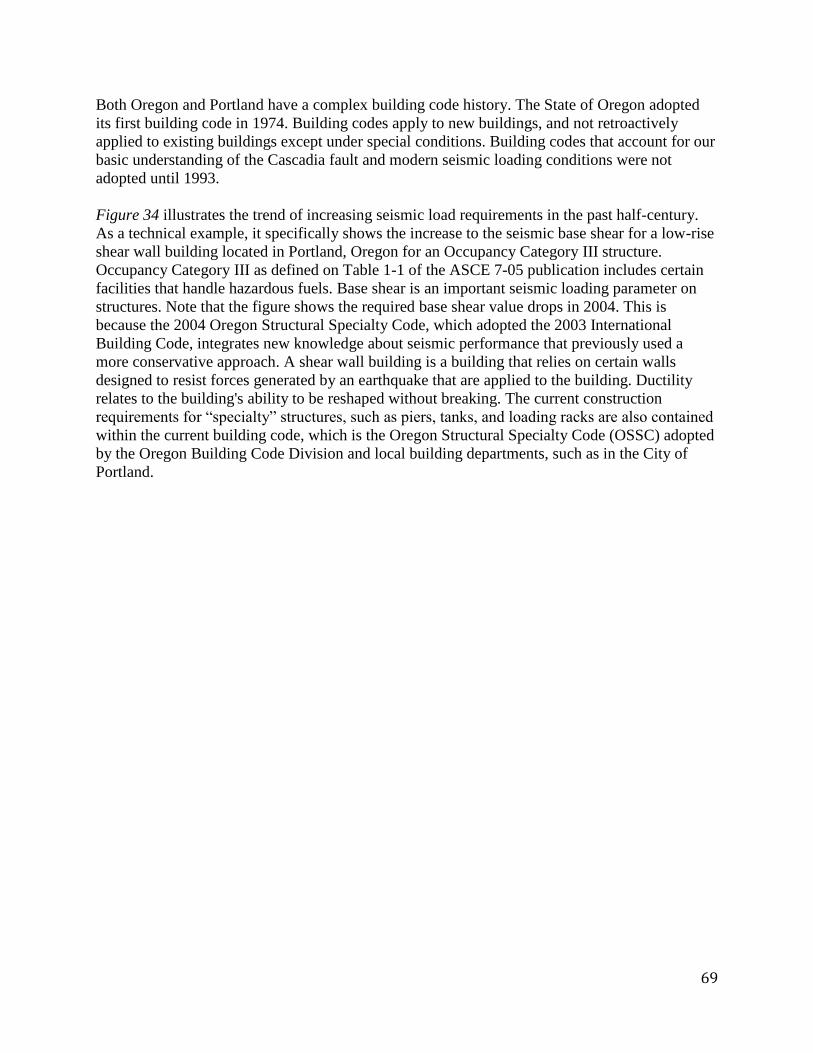
69
Both Oregon and Portland have a complex building code history. The State of Oregon adopted
its first building code in 1974. Building codes apply to new buildings, and not retroactively
applied to existing buildings except under special conditions. Building codes that account for our
basic understanding of the Cascadia fault and modern seismic loading conditions were not
adopted until 1993.
Figure 34 illustrates the trend of increasing seismic load requirements in the past half-century.
As a technical example, it specifically shows the increase to the seismic base shear for a low-rise
shear wall building located in Portland, Oregon for an Occupancy Category III structure.
Occupancy Category III as defined on Table 1-1 of the ASCE 7-05 publication includes certain
facilities that handle hazardous fuels. Base shear is an important seismic loading parameter on
structures. Note that the figure shows the required base shear value drops in 2004. This is
because the 2004 Oregon Structural Specialty Code, which adopted the 2003 International
Building Code, integrates new knowledge about seismic performance that previously used a
more conservative approach. A shear wall building is a building that relies on certain walls
designed to resist forces generated by an earthquake that are applied to the building. Ductility
relates to the building's ability to be reshaped without breaking. The current construction
requirements for “specialty” structures, such as piers, tanks, and loading racks are also contained
within the current building code, which is the Oregon Structural Specialty Code (OSSC) adopted
by the Oregon Building Code Division and local building departments, such as in the City of
Portland.
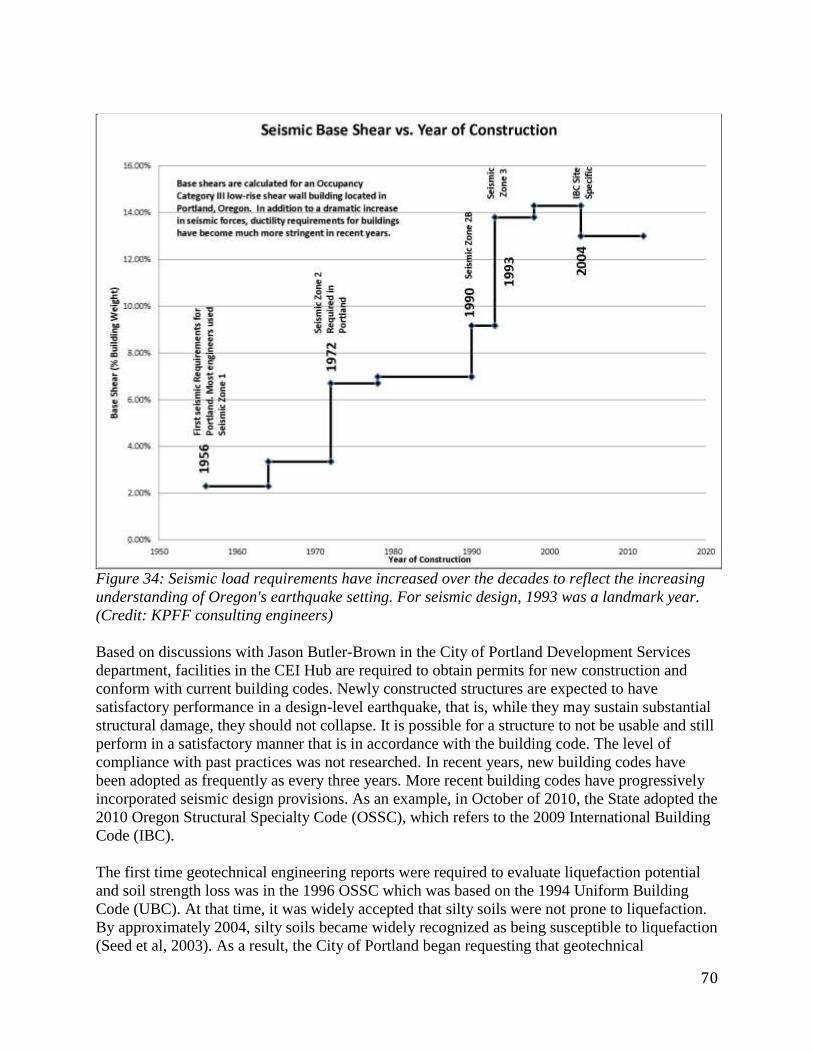
70
Figure 34: Seismic load requirements have increased over the decades to reflect the increasing
understanding of Oregon's earthquake setting. For seismic design, 1993 was a landmark year.
(Credit: KPFF consulting engineers)
Based on discussions with Jason Butler-Brown in the City of Portland Development Services
department, facilities in the CEI Hub are required to obtain permits for new construction and
conform with current building codes. Newly constructed structures are expected to have
satisfactory performance in a design-level earthquake, that is, while they may sustain substantial
structural damage, they should not collapse. It is possible for a structure to not be usable and still
perform in a satisfactory manner that is in accordance with the building code. The level of
compliance with past practices was not researched. In recent years, new building codes have
been adopted as frequently as every three years. More recent building codes have progressively
incorporated seismic design provisions. As an example, in October of 2010, the State adopted the
2010 Oregon Structural Specialty Code (OSSC), which refers to the 2009 International Building
Code (IBC).
The first time geotechnical engineering reports were required to evaluate liquefaction potential
and soil strength loss was in the 1996 OSSC which was based on the 1994 Uniform Building
Code (UBC). At that time, it was widely accepted that silty soils were not prone to liquefaction.
By approximately 2004, silty soils became widely recognized as being susceptible to liquefaction
(Seed et al, 2003). As a result, the City of Portland began requesting that geotechnical

71
engineering reports evaluate the liquefaction susceptibility of silty soils (pers. comm. with Jason
Butler-Brown, city of Portland geotechnical engineer on January 13, 2010). Therefore, structures
constructed over soft silty soils that were granted permits by the City of Portland prior to 2004,
such as those near the Willamette River, may have liquefaction vulnerabilities.
Although new buildings in the CEI Hub have been regulated by the City of Portland using the
OSSC for decades, DOGAMI discovered that older building codes and practices did not
adequately address many non-building structures that exist in the CEI Hub, such as tanks, pipes,
and piers. This is based on discussions with state, city, and private sector engineers including
Steve Judson (Oregon Building Codes Division), Jason Butler-Brown (City of Portland) and
Kent Yu (Degenkolb Engineers and Oregon Seismic Safety Policy Advisory Commission). One
explanation is because non-building structures typically hold few, if any, people and the focus of
the building code has traditionally been on life safety.
In the early 2000s, non-building structures gained more attention in American Society of Civil
Engineers (ASCE) 7, an engineering design document referenced by the OSSC and used by
engineers. The 2004 OSSC referenced the 2003 International Building Code (IBC) and ASCE 7.
For the first time the building code, through ASCE 7, specified more directly the design basis for
a variety of non-building structures, including piers and wharves. Furthermore, it specified that
the design shall account for the effects of liquefaction along with other marine based-loading
criteria. In 2005, the ASCE 7-05 was published. It is considered to be a landmark design
document because it specifies the loading criteria, including seismic design for a multitude of
structures and structure types. By 2007, with the adoption of the 2007 OSSC and OSSC's
reference to ASCE 7-05, ASCE 7-05 has gained significantly more influence among engineers
designing non-building structures as a building standard. Design methods other than those in
ASCE 7-05 are allowed by building officials.
Oil Terminal Facilities The state EAP partners, which consists of ODOE, OPUC and DOGAMI, worked with the US
Coast Guard (USCG) on the USCG's routine inspection of the petroleum terminals’ port
facilities, reviewed California’s MOTEMS and conducted site visits with USCG personnel and
MOTEMS engineers to better understand the seismic condition of the port structures, primarily
the piers and the wharves for transporting liquid fuels.
Port Structures Beginning in July 2009, EAP partners and USCG leadership and staff developed a working
relationship to share information on the earthquake hazards to the port facilities in the CEI Hub
that USCG regulates for port security. These include: BP, ConocoPhillips, Chevron,
KinderMorgan, McCall Oil, and Nustar Energy. EAP partners arranged boat tours of ports for
energy facilities, hosted earthquake table-top scenarios, and organized a meeting with Western
Energy Institute and the USCG. The Western Energy Institute is a non-profit organization of
energy sector businesses. They help develop memorandum of understandings (MOUs) between
petroleum companies that deal with, for example, emergency situations. These MOUs could be
helpful to the USCG in fulfilling their responsibilities on port security. In response to concerns
raised at the Western Energy Institute meetings, the EAP partners alerted transportation officials
about the need to have reliable transportation routes open during a major earthquake disaster.
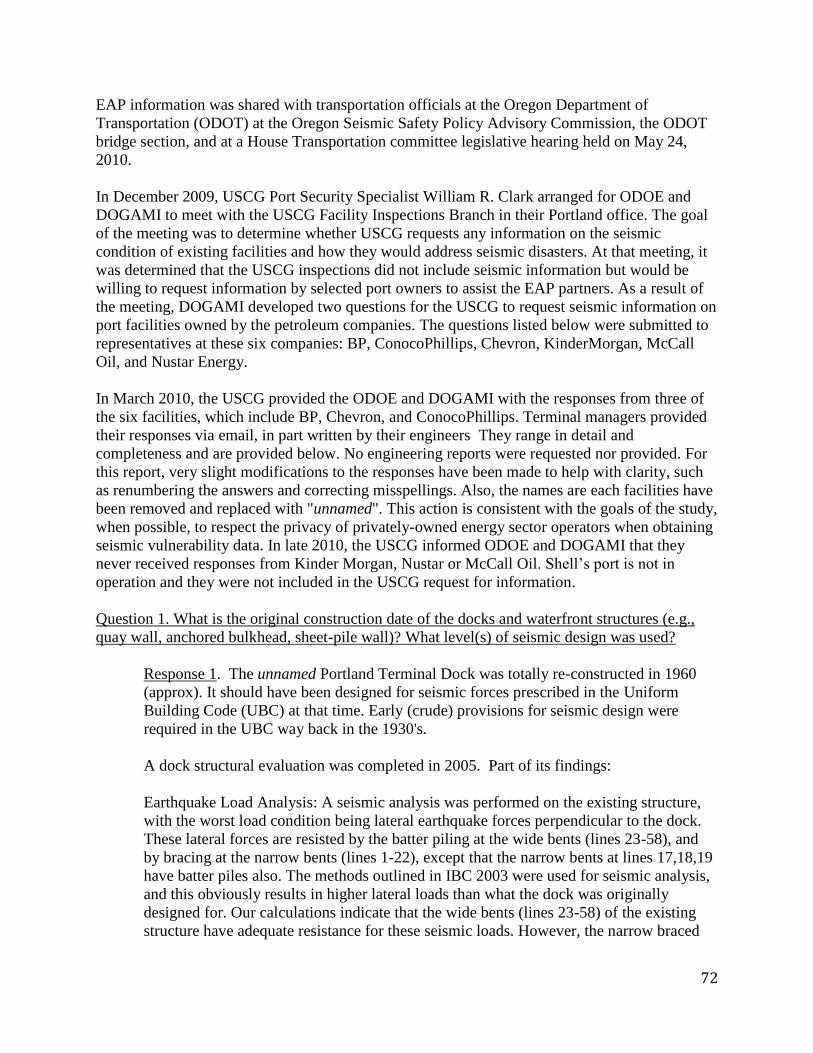
72
EAP information was shared with transportation officials at the Oregon Department of
Transportation (ODOT) at the Oregon Seismic Safety Policy Advisory Commission, the ODOT
bridge section, and at a House Transportation committee legislative hearing held on May 24,
2010.
In December 2009, USCG Port Security Specialist William R. Clark arranged for ODOE and
DOGAMI to meet with the USCG Facility Inspections Branch in their Portland office. The goal
of the meeting was to determine whether USCG requests any information on the seismic
condition of existing facilities and how they would address seismic disasters. At that meeting, it
was determined that the USCG inspections did not include seismic information but would be
willing to request information by selected port owners to assist the EAP partners. As a result of
the meeting, DOGAMI developed two questions for the USCG to request seismic information on
port facilities owned by the petroleum companies. The questions listed below were submitted to
representatives at these six companies: BP, ConocoPhillips, Chevron, KinderMorgan, McCall
Oil, and Nustar Energy.
In March 2010, the USCG provided the ODOE and DOGAMI with the responses from three of
the six facilities, which include BP, Chevron, and ConocoPhillips. Terminal managers provided
their responses via email, in part written by their engineers They range in detail and
completeness and are provided below. No engineering reports were requested nor provided. For
this report, very slight modifications to the responses have been made to help with clarity, such
as renumbering the answers and correcting misspellings. Also, the names are each facilities have
been removed and replaced with "unnamed". This action is consistent with the goals of the study,
when possible, to respect the privacy of privately-owned energy sector operators when obtaining
seismic vulnerability data. In late 2010, the USCG informed ODOE and DOGAMI that they
never received responses from Kinder Morgan, Nustar or McCall Oil. Shell’s port is not in
operation and they were not included in the USCG request for information.
Question 1. What is the original construction date of the docks and waterfront structures (e.g.,
quay wall, anchored bulkhead, sheet-pile wall)? What level(s) of seismic design was used?
Response 1. The unnamed Portland Terminal Dock was totally re-constructed in 1960
(approx). It should have been designed for seismic forces prescribed in the Uniform
Building Code (UBC) at that time. Early (crude) provisions for seismic design were
required in the UBC way back in the 1930's.
A dock structural evaluation was completed in 2005. Part of its findings:
Earthquake Load Analysis: A seismic analysis was performed on the existing structure,
with the worst load condition being lateral earthquake forces perpendicular to the dock.
These lateral forces are resisted by the batter piling at the wide bents (lines 23-58), and
by bracing at the narrow bents (lines 1-22), except that the narrow bents at lines 17,18,19
have batter piles also. The methods outlined in IBC 2003 were used for seismic analysis,
and this obviously results in higher lateral loads than what the dock was originally
designed for. Our calculations indicate that the wide bents (lines 23-58) of the existing
structure have adequate resistance for these seismic loads. However, the narrow braced

73
bents (lines 1-16, and 20-22) would be slightly overstressed due to these seismic loads
and the bracing/connections would need to be reinforced. This would likely involve
replacing the wood bracing with steel channels and adding some additional bolts. It's
important to note that seismic upgrades to existing structures are typically only required
when a structure is undergoing a change of occupancy or major design alteration, which
is not the case here. So, while it's not legally required, we still recommend adding seismic
reinforcing to the narrow dock area. This would increase the structure's resistance to
seismic loads and help prevent failures in the product piping/spills into waterway.
Response 2. A comprehensive review of all of the local record drawings for the dock
reveal the following:
The earliest drawing for the dock is from unnamed, dated June 1936, and it appears that
the drawing may not have been an original construction drawing, but a modification. The
dock could have been constructed several years earlier. Since the terminal had been in
existence since about 1912, it is easy to believe that a wharf structure existed at that time.
In 1972 structural wood piling replacement and firewall improvements were made.
In 1974 major structural improvements were made. The work was performed under city
of Portland permit 480690, 12/6/1973. The work added 3 reinforced concrete mooring
sections, reconstructed the dock in entirety between bents #3 and #16, added two
reinforced concrete dolphins at the head of the dock, and added a 40ft.x80ft.x8" thick
reinforced concrete slab at the tanker unloading section. The work was designed and
stamped by a licensed PE and work was completed to building codes in force at that time.
Any seismic evaluation of the dock required by code would have been completed,
however no specific seismic criteria was listed on design drawings.
In 1997 two significant steel-piled fenders were added to the upstream and downstream
berths. The work was designed by a PE, Winzler and Kelly.
A new waterfront structure was added in 2007. A 100 ft. long sheet-pile wall was
installed and armored with rip rap on the upstream side of the dock. The work was
designed in accordance with the latest building codes in force and was permitted by the
city or Portland. The downstream side of the dock do not include any significant
improvements, e.g., quay wall, anchored bulkhead, or sheet-pile wall.
Response 3. The dock was completed 1993, no idea what level of seismic design was
used. The sea wall was completed 2009 and was designed using a computer model to
meet current UBC Seismic Zone 3 requirements.
Question 2. What is the post earthquake disaster restoration time for waterfront structures that
handle fuel (e.g., operational capacity versus time curves)?
Response 1. The restoration time will depend on the extent of the damage. We'd
establish a command post and us the IC system, then assess the damage. Any return to
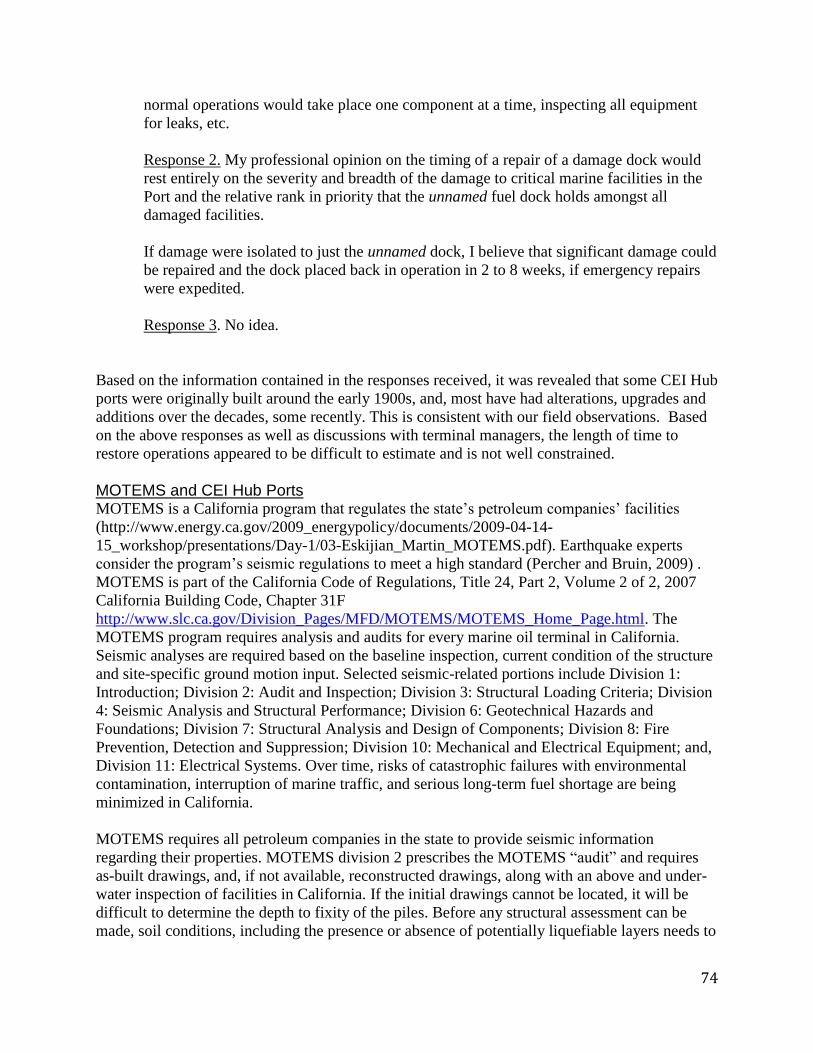
74
normal operations would take place one component at a time, inspecting all equipment
for leaks, etc.
Response 2. My professional opinion on the timing of a repair of a damage dock would
rest entirely on the severity and breadth of the damage to critical marine facilities in the
Port and the relative rank in priority that the unnamed fuel dock holds amongst all
damaged facilities.
If damage were isolated to just the unnamed dock, I believe that significant damage could
be repaired and the dock placed back in operation in 2 to 8 weeks, if emergency repairs
were expedited.
Response 3. No idea.
Based on the information contained in the responses received, it was revealed that some CEI Hub
ports were originally built around the early 1900s, and, most have had alterations, upgrades and
additions over the decades, some recently. This is consistent with our field observations. Based
on the above responses as well as discussions with terminal managers, the length of time to
restore operations appeared to be difficult to estimate and is not well constrained.
MOTEMS and CEI Hub Ports MOTEMS is a California program that regulates the state’s petroleum companies’ facilities
(http://www.energy.ca.gov/2009_energypolicy/documents/2009-04-14-
15_workshop/presentations/Day-1/03-Eskijian_Martin_MOTEMS.pdf). Earthquake experts
consider the program’s seismic regulations to meet a high standard (Percher and Bruin, 2009) .
MOTEMS is part of the California Code of Regulations, Title 24, Part 2, Volume 2 of 2, 2007
California Building Code, Chapter 31F
http://www.slc.ca.gov/Division_Pages/MFD/MOTEMS/MOTEMS_Home_Page.html. The
MOTEMS program requires analysis and audits for every marine oil terminal in California.
Seismic analyses are required based on the baseline inspection, current condition of the structure
and site-specific ground motion input. Selected seismic-related portions include Division 1:
Introduction; Division 2: Audit and Inspection; Division 3: Structural Loading Criteria; Division
4: Seismic Analysis and Structural Performance; Division 6: Geotechnical Hazards and
Foundations; Division 7: Structural Analysis and Design of Components; Division 8: Fire
Prevention, Detection and Suppression; Division 10: Mechanical and Electrical Equipment; and,
Division 11: Electrical Systems. Over time, risks of catastrophic failures with environmental
contamination, interruption of marine traffic, and serious long-term fuel shortage are being
minimized in California.
MOTEMS requires all petroleum companies in the state to provide seismic information
regarding their properties. MOTEMS division 2 prescribes the MOTEMS “audit” and requires
as-built drawings, and, if not available, reconstructed drawings, along with an above and under-
water inspection of facilities in California. If the initial drawings cannot be located, it will be
difficult to determine the depth to fixity of the piles. Before any structural assessment can be
made, soil conditions, including the presence or absence of potentially liquefiable layers needs to

75
be assessed with geotechnical borings. MOTEMS requires borings to a depth of 100 feet placed
in strategic areas around or under the existing wharf/pier. As an example, some of the
requirements for the seismic assessment of a marine oil terminal in California include:
A site-specific seismic hazard study will be required to determine the appropriate
response spectrum for the 72 and 475 year return period events. This is mandated for site
class “F” and will probably be required with the soft river bottom and potential
liquefaction and no shallow bedrock. However, one set of borings may be sufficient for
many adjacent facilities to eliminate repetitive borings.
The MOTEMS criteria (or ASCE u/w standards, Ref. 2) on an above and under-water
inspection to the mudline is required. The criteria for the inspection requires that a
registered civil or structural engineer to be in the water at least 25 percent of the dive
time. As-built or “baseline” drawings may have to be constructed to evaluate the
structural integrity of each facility if the original drawings are not available.
Martin Eskijian, MOTEMS Engineering Branch Supervisor (retired in 2011), and his staff
provided expertise and assistance to the EAP. Mr. Eskijian provided assistance on one site visit
comprised of a boat reconnaissance that included port facilities in Oregon in the CEI Hub. The
EAP partners were invited to the MOTEMS northern California office in Hercules, California,
where we visited the Chevron refinery in Richmond, California, the Tesero port facility in
Vallejo, California, and participated as observers in a MOTEMS meeting with Shell. After that,
MOTEMS senior engineer, Kendra Oliver, provided assistance on four terminal visits that
included port facilities in Oregon in the CEI Hub.
The following photographs describe and illustrate some of the EAP partners' and MOTEMS
engineers’ major concerns about seismic readiness of the port structures operated by oil
terminals in the CEI Hub. These issues largely fall under MOTEMS Divisions 3: Structural
Loading Criteria, Division 4: Seismic Analysis and Structural Performance, Division 6:
Geotechnical Hazards and Foundations, and Division 7: Structural Analysis and Design of
Components.
Figure 35 shows steel plumb piles with lateral timber bracing as observed at facilities in the CEI
Hub. MOTEMS does not permit the use of timber cross bracing to provide lateral restraint
(seismic loading) for vertical piles. This was one of many major shortcomings of the observed
facilities in the CEI Hub. With the large variation in water depth, dependent on dam release,
tides and storms, the pile heights out of the water look high; buckling forces on the columns may
well exceed current design standards and this may become critical for the seismic evaluation.
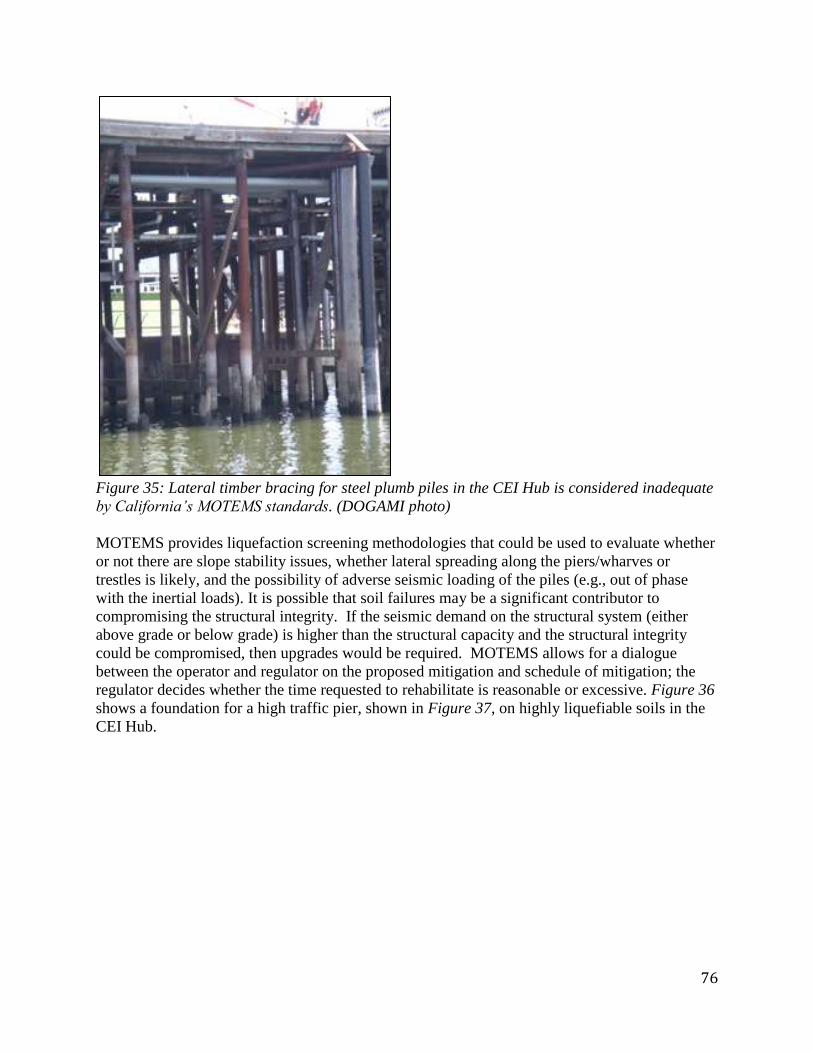
76
Figure 35: Lateral timber bracing for steel plumb piles in the CEI Hub is considered inadequate
by California’s MOTEMS standards. (DOGAMI photo)
MOTEMS provides liquefaction screening methodologies that could be used to evaluate whether
or not there are slope stability issues, whether lateral spreading along the piers/wharves or
trestles is likely, and the possibility of adverse seismic loading of the piles (e.g., out of phase
with the inertial loads). It is possible that soil failures may be a significant contributor to
compromising the structural integrity. If the seismic demand on the structural system (either
above grade or below grade) is higher than the structural capacity and the structural integrity
could be compromised, then upgrades would be required. MOTEMS allows for a dialogue
between the operator and regulator on the proposed mitigation and schedule of mitigation; the
regulator decides whether the time requested to rehabilitate is reasonable or excessive. Figure 36
shows a foundation for a high traffic pier, shown in Figure 37, on highly liquefiable soils in the
CEI Hub.

77
Figure 36: This under-designed foundation in part of an oil terminal pier in the CEI Hub is
considered inadequate. Based on previous regional studies, boring logs from an adjacent
facility, and on-site visual inspection of the surficial soils, this area has high susceptibility for
liquefaction and lateral spreading. (DOGAMI photo)
Figure 37: The area by this pier in the CEI Hub is used to transport liquid fuel. Based on
previous regional studies, boring logs from an adjacent facility, and on-site visual inspection of
the surficial soils, this area has high susceptibility for liquefaction and lateral spreading.
(DOGAMI photo)

78
Under the MOTEMS system, following on the seismic analyses of the port structure and the
ground, a pipeline stress analysis may be required in order to be certain that no leaks will result
from the seismic displacements. Facilities in the CEI Hub have flexible timber structures (some
with pipelines under the piers) with hard points in locations that would likely indicate failure in a
pipeline stress analysis.
During the site visits in the CEI Hub, DOGAMI and MOTEMS engineers observed many
structures with pipelines with possible vulnerabilities, some of which were verified by the
responses provided by the oil terminal facilities to the USCG. Figure 38 shows transverse timber
beams in seriously degraded condition, with one bolt connecting the beam to the steel plumb pile
as observed during visual inspections. Some of the transverse beams support petroleum
pipelines. The pile cap beam in the center of the photo, which should be level, has a clockwise
rotation. Based on the professional judgment of DOGAMI and MOTEMS engineer Martin
Eskijian from post-earthquake investigations, experience with engineering analyses, and from the
body of knowledge in the earthquake profession, this configuration would be expected to fail in a
moderate earthquake, without even considering lateral spreading or liquefaction.
Figure 38: This photo shows generally poor condition of transverse beams supporting petroleum
pipelines and cap beam in the CEI Hub. Notice the clockwise rotation of the pile cap beam in the
center of the photo. (DOGAMI photo)
Figures 39, 40, 41 and 42 illustrate some of the poor conditions observed of the oil terminal piers
in the CEI Hub. Examples from working piers include: deteriorated concrete foundation, exposed
rebar, split timber beams and broken timber piles.
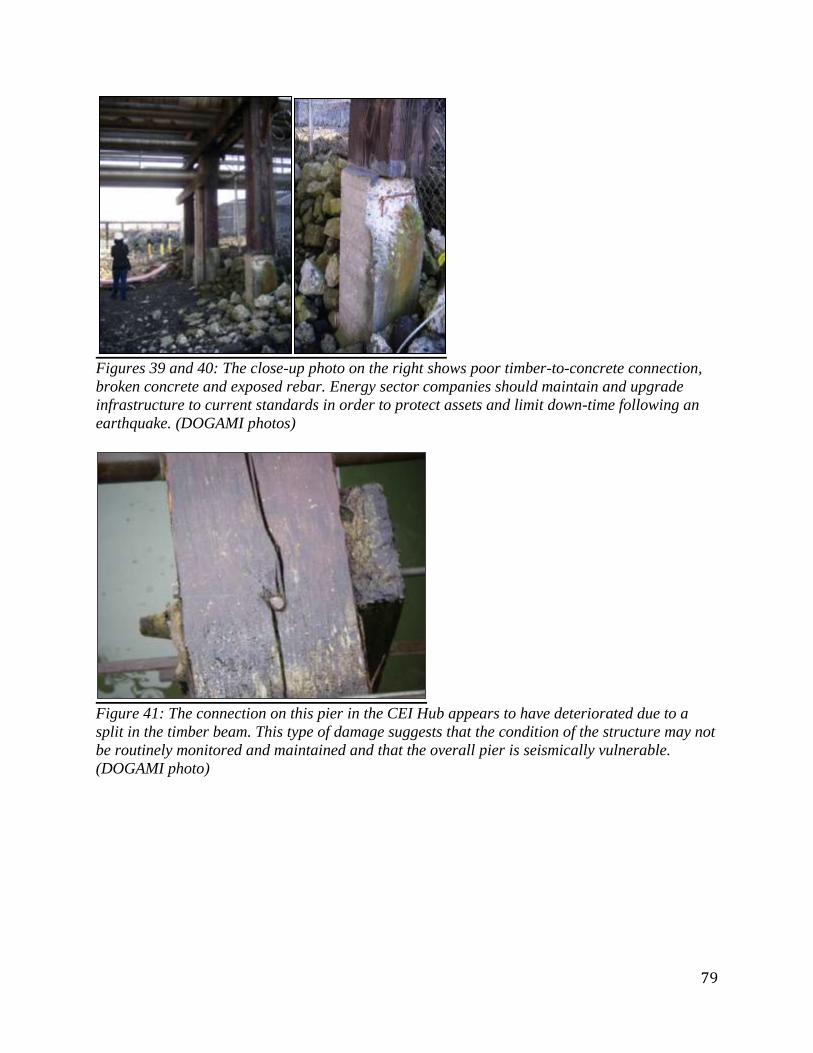
79
Figures 39 and 40: The close-up photo on the right shows poor timber-to-concrete connection,
broken concrete and exposed rebar. Energy sector companies should maintain and upgrade
infrastructure to current standards in order to protect assets and limit down-time following an
earthquake. (DOGAMI photos)
Figure 41: The connection on this pier in the CEI Hub appears to have deteriorated due to a
split in the timber beam. This type of damage suggests that the condition of the structure may not
be routinely monitored and maintained and that the overall pier is seismically vulnerable.
(DOGAMI photo)
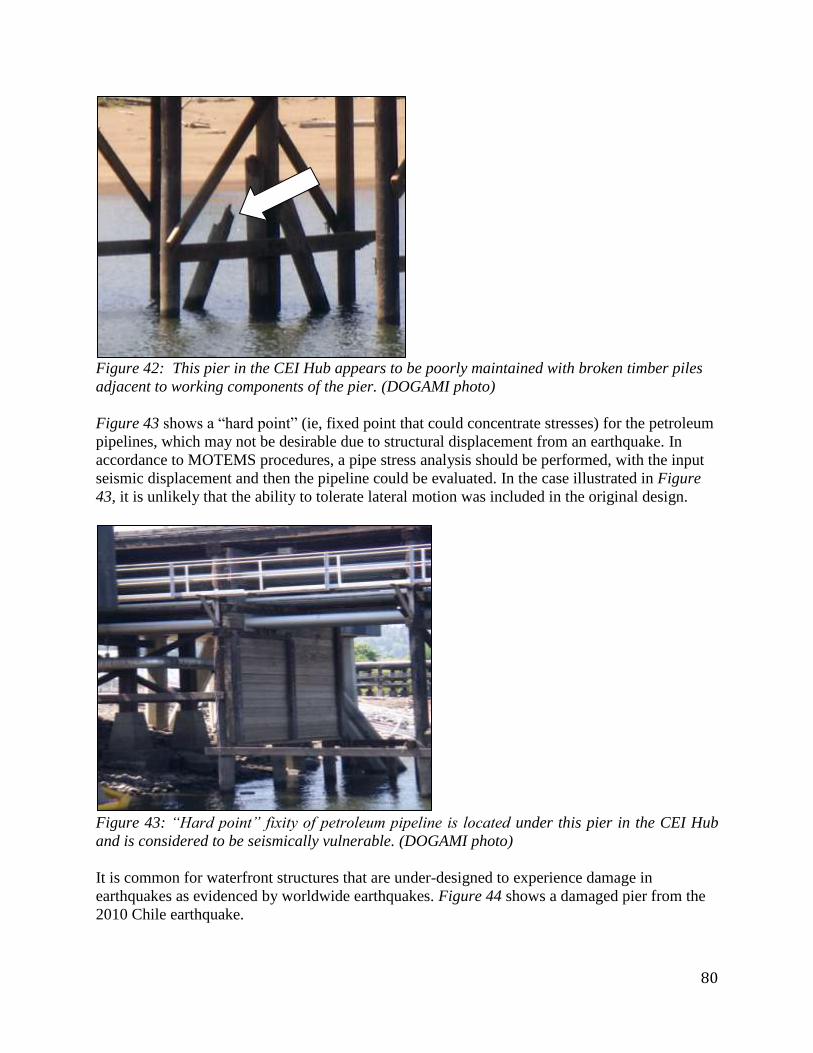
80
Figure 42: This pier in the CEI Hub appears to be poorly maintained with broken timber piles
adjacent to working components of the pier. (DOGAMI photo)
Figure 43 shows a “hard point” (ie, fixed point that could concentrate stresses) for the petroleum
pipelines, which may not be desirable due to structural displacement from an earthquake. In
accordance to MOTEMS procedures, a pipe stress analysis should be performed, with the input
seismic displacement and then the pipeline could be evaluated. In the case illustrated in Figure
43, it is unlikely that the ability to tolerate lateral motion was included in the original design.
Figure 43: “Hard point” fixity of petroleum pipeline is located under this pier in the CEI Hub
and is considered to be seismically vulnerable. (DOGAMI photo)
It is common for waterfront structures that are under-designed to experience damage in
earthquakes as evidenced by worldwide earthquakes. Figure 44 shows a damaged pier from the
2010 Chile earthquake.
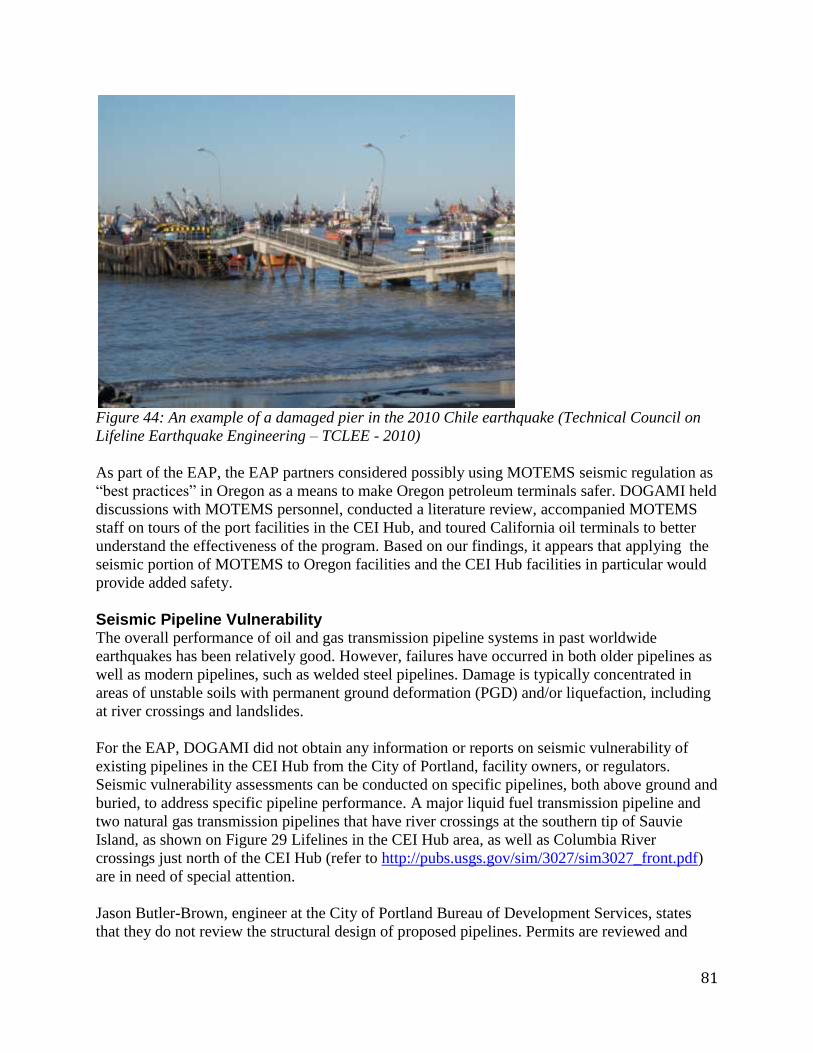
81
Figure 44: An example of a damaged pier in the 2010 Chile earthquake (Technical Council on
Lifeline Earthquake Engineering – TCLEE - 2010)
As part of the EAP, the EAP partners considered possibly using MOTEMS seismic regulation as
“best practices” in Oregon as a means to make Oregon petroleum terminals safer. DOGAMI held
discussions with MOTEMS personnel, conducted a literature review, accompanied MOTEMS
staff on tours of the port facilities in the CEI Hub, and toured California oil terminals to better
understand the effectiveness of the program. Based on our findings, it appears that applying the
seismic portion of MOTEMS to Oregon facilities and the CEI Hub facilities in particular would
provide added safety.
Seismic Pipeline Vulnerability The overall performance of oil and gas transmission pipeline systems in past worldwide
earthquakes has been relatively good. However, failures have occurred in both older pipelines as
well as modern pipelines, such as welded steel pipelines. Damage is typically concentrated in
areas of unstable soils with permanent ground deformation (PGD) and/or liquefaction, including
at river crossings and landslides.
For the EAP, DOGAMI did not obtain any information or reports on seismic vulnerability of
existing pipelines in the CEI Hub from the City of Portland, facility owners, or regulators.
Seismic vulnerability assessments can be conducted on specific pipelines, both above ground and
buried, to address specific pipeline performance. A major liquid fuel transmission pipeline and
two natural gas transmission pipelines that have river crossings at the southern tip of Sauvie
Island, as shown on Figure 29 Lifelines in the CEI Hub area, as well as Columbia River
crossings just north of the CEI Hub (refer to http://pubs.usgs.gov/sim/3027/sim3027_front.pdf)
are in need of special attention.
Jason Butler-Brown, engineer at the City of Portland Bureau of Development Services, states
that they do not review the structural design of proposed pipelines. Permits are reviewed and

82
issued for the excavation associated with the pipelines (on private property) and where pipelines
are supported on structures that cross over private roadways or areas accessible by people (again
on private property). Interstate fuel pipeline design is regulated under Title 49 of the Code of
Federal Regulation. Part 192 of Title 49 of the Code of Federal Regulations addresses gaseous
fuels, Part 193 addresses LNG and Part 195 deals with liquid fuels. These serve as minimum
design standards and are applied to interstate pipelines connected to the CEI Hub.
Certain fuel pipelines are regulated for safety by the US Department of Transportation's Office of
Pipelines and Hazardous Materials and Safety Administration (PHMSA)
(http://www.phmsa.dot.gov/pipeline/regs). As part of this EAP, JR Gonzalez (former) the
Administrator of the OPUC Safety, Reliability and Security Division informed Hossein
Monfared, Pipeline Engineer, from PHMSA Western Region Office of Pipeline Safety that a
liquid fuel transmission pipeline feeds petroleum tank farms situated on potentially liquefiable
soils. This was part of a discussion to inquire about the content of PHMSA's audits. As an
outcome of that discussion, DOGAMI discovered that, to date, PHMSA has not requested
seismic information as part of their audits involving tank farms in Portland.
When soil liquefies, it behaves like a fluid and pipe embedded in it will be subjected to the
buoyant force from below. This buoyancy due to liquefaction can occur at river crossings and
sandy areas with high ground water tables. Figure 45 is a schematic showing buoyancy forces
(Fb) on a buried pipe with a burial depth of C (IITK, 2007). Pipes can fail due to buoyant forces.
Figure 45: Buoyancy forces on a buried pipeline. (IITK, 2007)
In areas with permanent ground deformation (PGD), such as areas with lateral spreading
(without the occurrence of liquefaction) or liquefied soils that have translated down slope
towards the river channel (often referred to as a "free face"), the embedded pipe will be subjected
to both compression and extensional forces. The total strain on the pipe can exceed the amount
of strain the pipe can withstand creating unsafe pipeline conditions and even pipeline rupture.
The maximum strain in the pipe both in tension and compression can be evaluated and compared
with the allowable strain of the pipe. Figure 46 is a schematic diagram that shows a pipeline
perpendicular to the direction of PGD. Figure 47 shows a pipeline that is parallel to the direction
of PGD. In both figures, the area of unstable soils with PGD are illustrated before (purple zone)
and after (gray zone) the ground movement. The actual pattern of PGD will depend on the
earthquake ground motions, local soil conditions and the pipeline may cross the zone in any
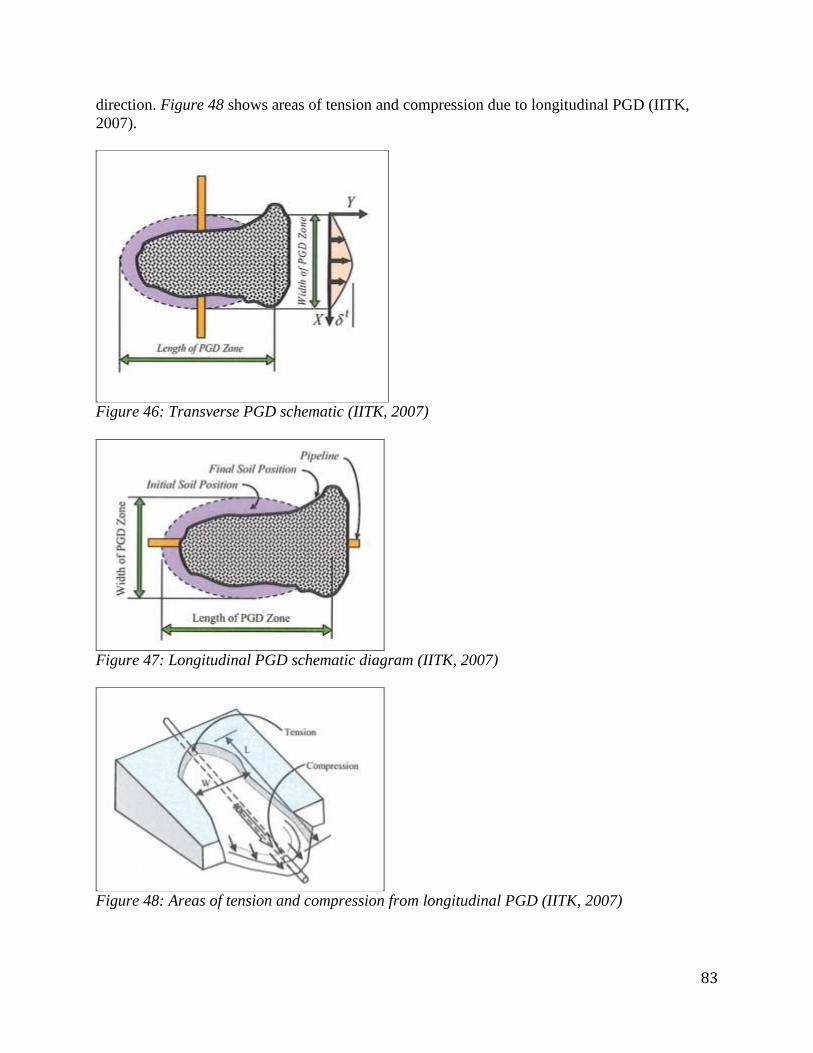
83
direction. Figure 48 shows areas of tension and compression due to longitudinal PGD (IITK,
2007).
Figure 46: Transverse PGD schematic (IITK, 2007)
Figure 47: Longitudinal PGD schematic diagram (IITK, 2007)
Figure 48: Areas of tension and compression from longitudinal PGD (IITK, 2007)

84
A variety of possible mitigation measures are available to improve the performance of pipes
against PGD. Depending on the specific situation, some options might involve: soil
improvement, increasing the load carrying capacity of the pipe system, reducing the friction
between the pipe and soil, relocating the pipe, anchors to prevent uplift from buoyant forces, or
special pipe joints or fittings that allow greater joint deflection, extension, or compression.
Non-Energy Facilities and Structures Many other structures and facilities are located in the proximity of the CEI Hub. Structures
include bridges over the Willamette River as well as other port facilities and overpasses that span
the railroad tracks. Other industrial companies, including ones that handle petrochemicals and
hazardous materials, are located in the CEI Hub. A major rail yard exists at the south end of the
CEI Hub. A limited number of commercial and residential occupants are also located in the area.
Although these facilities are not part of the energy sector and included in this study, it is
important to be aware of these facilities and structures. They could become a concern after a
Cascadia earthquake. For example, if the chemical company has a fire, it could spread to a
nearby oil terminal, or vice versa.
Waterway Transportation to the CEI Hub The navigational channel from the Columbia River mouth to the lower Willamette River is used
to transport fuel by marine vessels. DOGAMI investigated the infrastructure and geologic
conditions along the shipping channel and terminals and analyzed the situation based on
discussions with engineers from the U.S. Corps of Engineers and ODOT and staff from the U.S.
Coast Guard (USCG), engineering judgment from previous earthquake investigations,
geotechnical engineering reports and publically available material. Our findings, which are
preliminary and require additional studies, indicate that the shipping channel will be damaged
and closed for river navigation until it is officially cleared for use by the USCG. Based on our
findings, the likely damage includes four modes:
Tsunami scour, damage and debris near the mouth of the Columbia River
Underwater slope failures along portions of the steep banks of the navigable river channel
Collapses of overhead structures such as bridges from earthquake shaking
Broken buried pipelines at river crossing locations
Tsunami damage near the mouth of the Columbia River is based on tsunami hazard mapping
(Priest et al, 1998) and DOGAMI’s field observations of tsunami damage from the 2004 Sumatra
and 2011 Tohoku Japan subduction zone earthquakes. Damage to the navigable river channel is
based on the already marginally stable, underwater steep slopes that require periodic dredging to
maintain the required channel depths during normal operating conditions. Based on discussions
with the ODOT Bridge Section engineers and seismic bridge engineering practices, all of
existing bridges including the bridge approach structures have been seismically under-designed
compared to today's requirements and may incur damage
(http://peer.berkeley.edu/events/caltrans-peer/files/Ashford_Abutment_2009_r1.pdf). Similarly,
the pipe and transmission river crossings may be under-designed in particular to liquefaction and
lateral spreading conditions. The structures that may be damaged and block the waterway extend
from the Columbia River mouth to the fuel storage area in the CEI Hub. These structures, from
west to east, include:
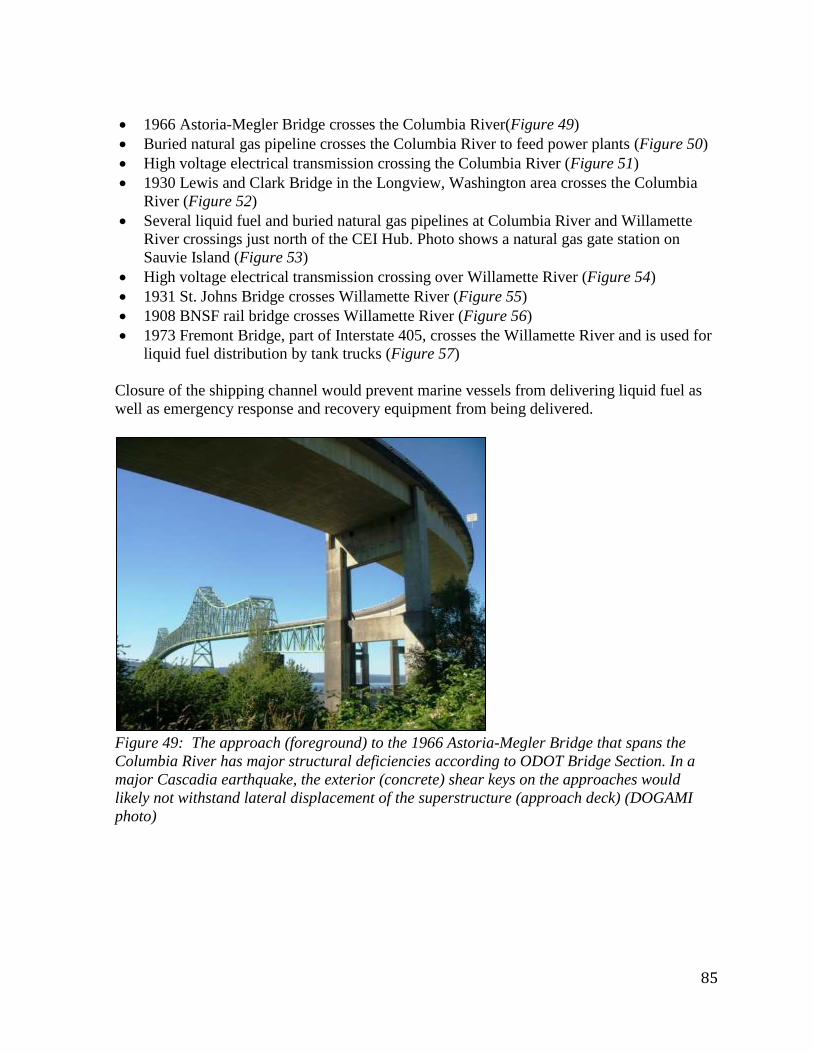
85
1966 Astoria-Megler Bridge crosses the Columbia River(Figure 49)
Buried natural gas pipeline crosses the Columbia River to feed power plants (Figure 50)
High voltage electrical transmission crossing the Columbia River (Figure 51)
1930 Lewis and Clark Bridge in the Longview, Washington area crosses the Columbia
River (Figure 52)
Several liquid fuel and buried natural gas pipelines at Columbia River and Willamette
River crossings just north of the CEI Hub. Photo shows a natural gas gate station on
Sauvie Island (Figure 53)
High voltage electrical transmission crossing over Willamette River (Figure 54)
1931 St. Johns Bridge crosses Willamette River (Figure 55)
1908 BNSF rail bridge crosses Willamette River (Figure 56)
1973 Fremont Bridge, part of Interstate 405, crosses the Willamette River and is used for
liquid fuel distribution by tank trucks (Figure 57)
Closure of the shipping channel would prevent marine vessels from delivering liquid fuel as
well as emergency response and recovery equipment from being delivered.
Figure 49: The approach (foreground) to the 1966 Astoria-Megler Bridge that spans the
Columbia River has major structural deficiencies according to ODOT Bridge Section. In a
major Cascadia earthquake, the exterior (concrete) shear keys on the approaches would
likely not withstand lateral displacement of the superstructure (approach deck) (DOGAMI
photo)
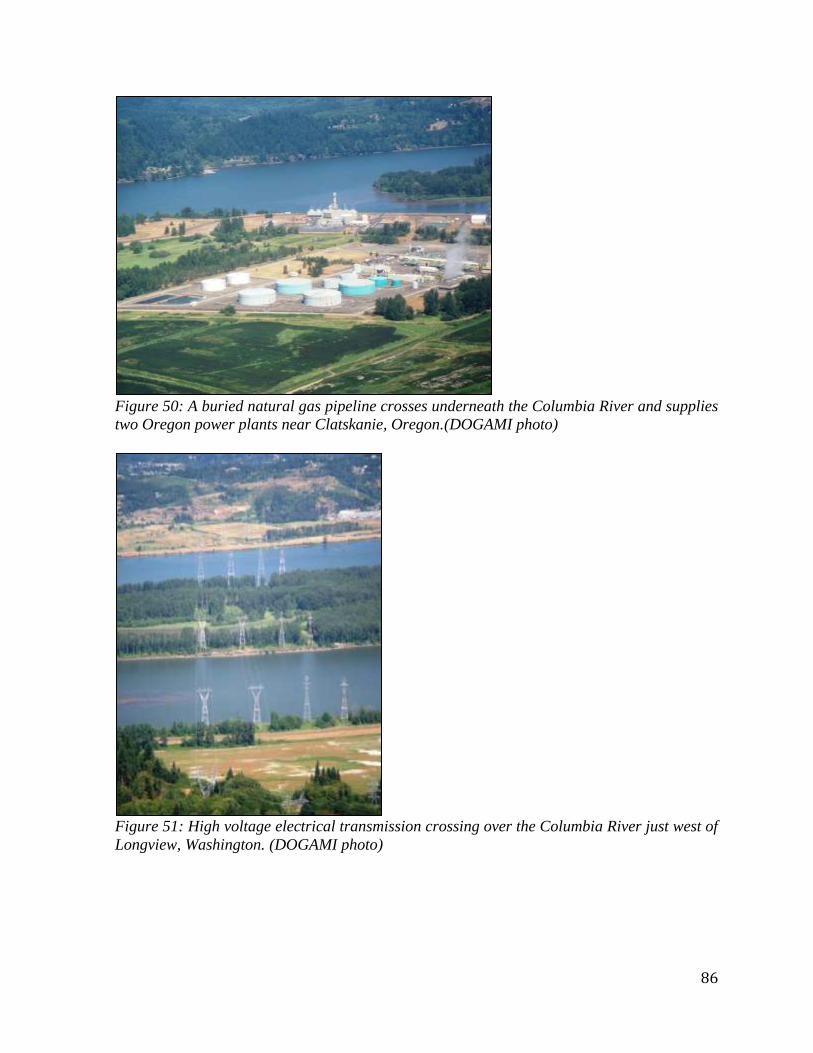
86
Figure 50: A buried natural gas pipeline crosses underneath the Columbia River and supplies
two Oregon power plants near Clatskanie, Oregon.(DOGAMI photo)
Figure 51: High voltage electrical transmission crossing over the Columbia River just west of
Longview, Washington. (DOGAMI photo)
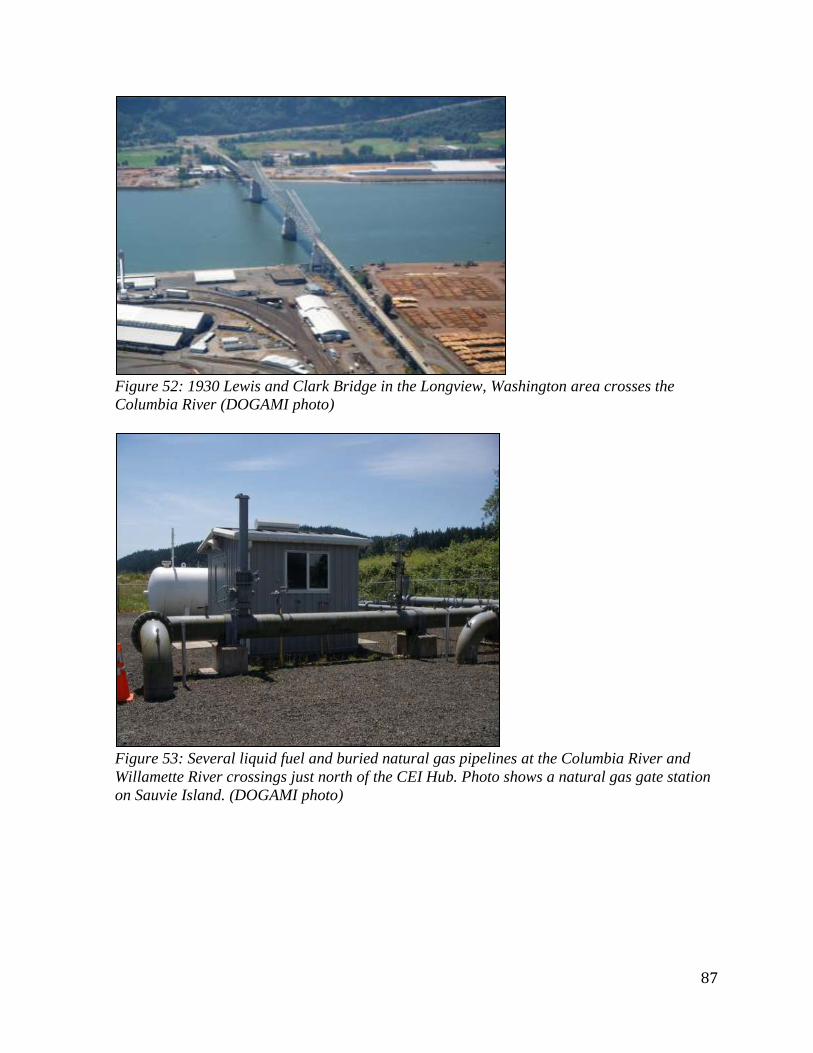
87
Figure 52: 1930 Lewis and Clark Bridge in the Longview, Washington area crosses the
Columbia River (DOGAMI photo)
Figure 53: Several liquid fuel and buried natural gas pipelines at the Columbia River and
Willamette River crossings just north of the CEI Hub. Photo shows a natural gas gate station
on Sauvie Island. (DOGAMI photo)
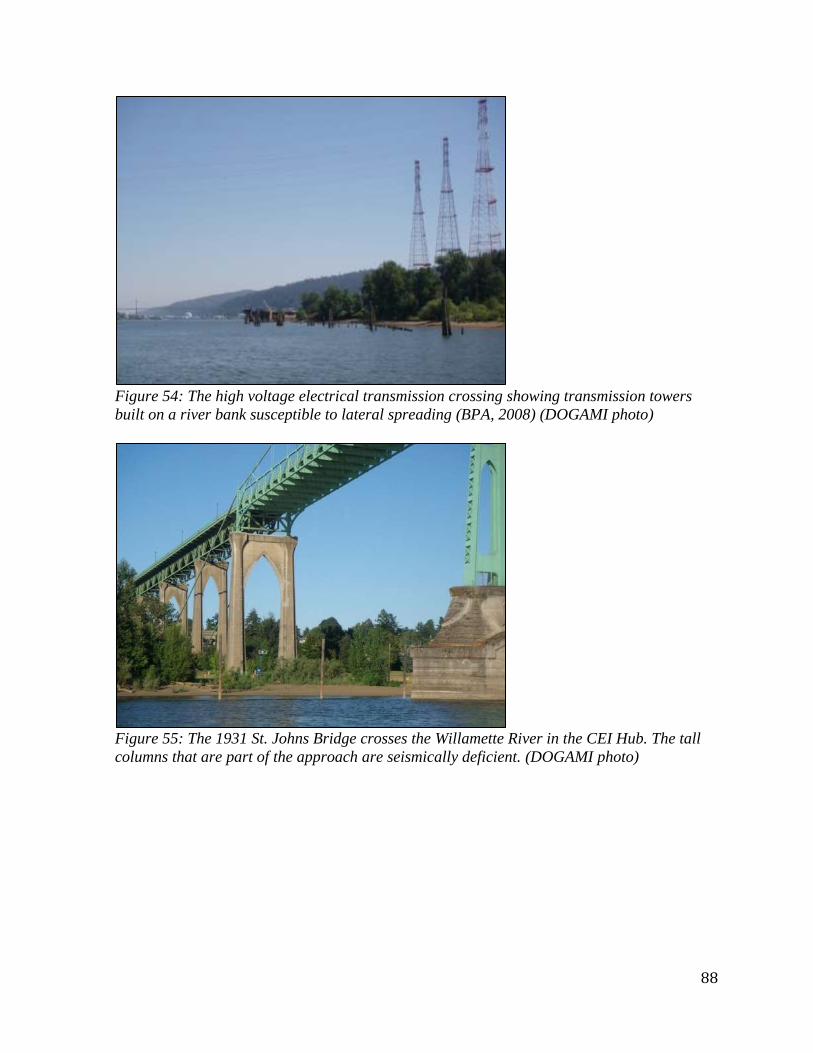
88
Figure 54: The high voltage electrical transmission crossing showing transmission towers
built on a river bank susceptible to lateral spreading (BPA, 2008) (DOGAMI photo)
Figure 55: The 1931 St. Johns Bridge crosses the Willamette River in the CEI Hub. The tall
columns that are part of the approach are seismically deficient. (DOGAMI photo)
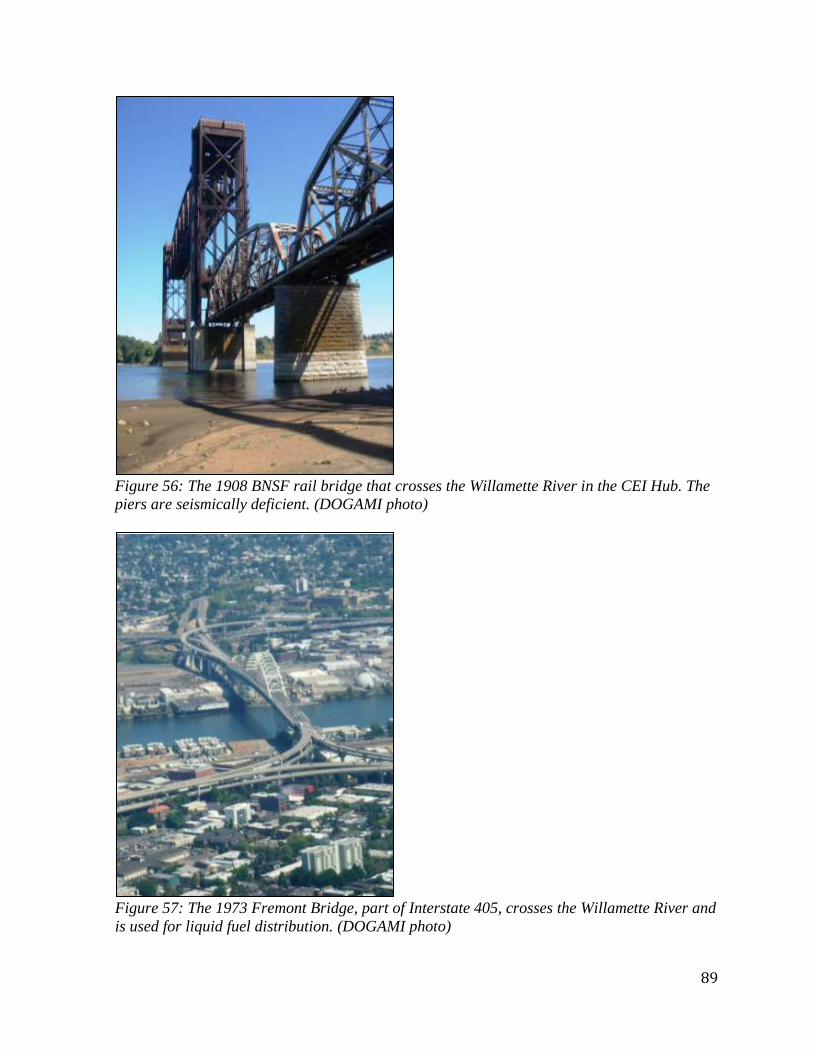
89
Figure 56: The 1908 BNSF rail bridge that crosses the Willamette River in the CEI Hub. The
piers are seismically deficient. (DOGAMI photo)
Figure 57: The 1973 Fremont Bridge, part of Interstate 405, crosses the Willamette River and
is used for liquid fuel distribution. (DOGAMI photo)
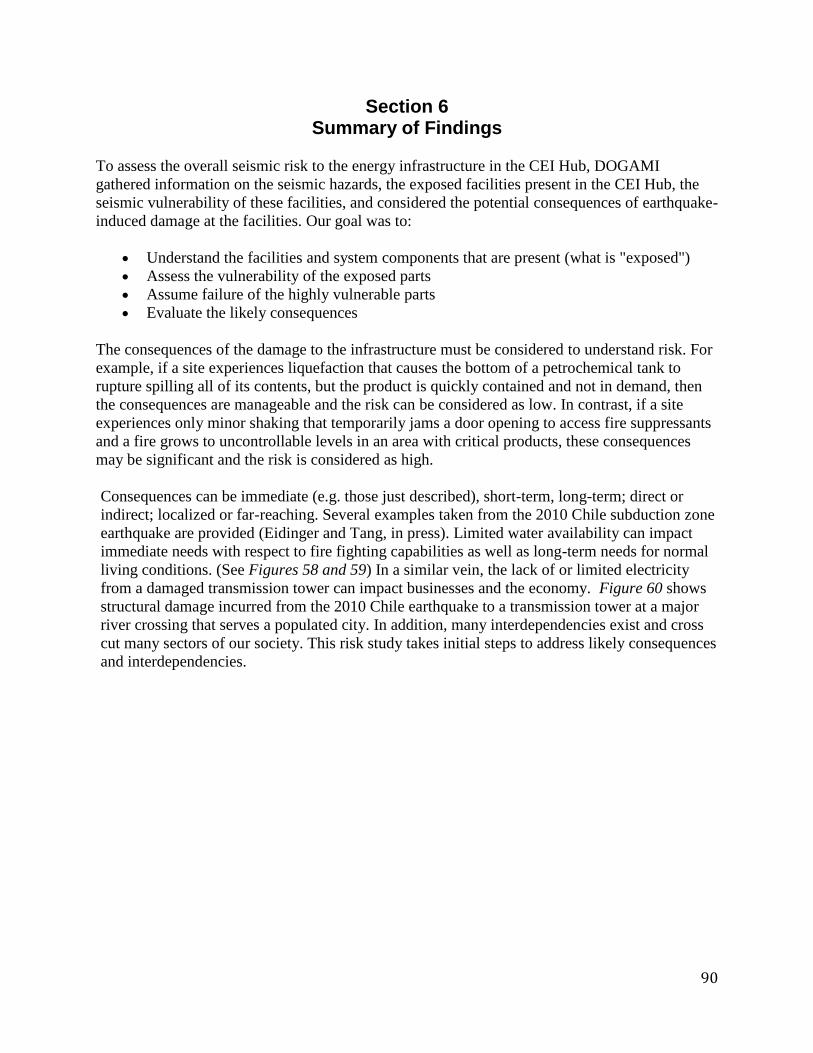
90
Section 6 Summary of Findings
To assess the overall seismic risk to the energy infrastructure in the CEI Hub, DOGAMI
gathered information on the seismic hazards, the exposed facilities present in the CEI Hub, the
seismic vulnerability of these facilities, and considered the potential consequences of earthquake-
induced damage at the facilities. Our goal was to:
Understand the facilities and system components that are present (what is "exposed") Assess the vulnerability of the exposed parts Assume failure of the highly vulnerable parts Evaluate the likely consequences
The consequences of the damage to the infrastructure must be considered to understand risk. For
example, if a site experiences liquefaction that causes the bottom of a petrochemical tank to
rupture spilling all of its contents, but the product is quickly contained and not in demand, then
the consequences are manageable and the risk can be considered as low. In contrast, if a site
experiences only minor shaking that temporarily jams a door opening to access fire suppressants
and a fire grows to uncontrollable levels in an area with critical products, these consequences
may be significant and the risk is considered as high.
Consequences can be immediate (e.g. those just described), short-term, long-term; direct or
indirect; localized or far-reaching. Several examples taken from the 2010 Chile subduction zone
earthquake are provided (Eidinger and Tang, in press). Limited water availability can impact
immediate needs with respect to fire fighting capabilities as well as long-term needs for normal
living conditions. (See Figures 58 and 59) In a similar vein, the lack of or limited electricity
from a damaged transmission tower can impact businesses and the economy. Figure 60 shows
structural damage incurred from the 2010 Chile earthquake to a transmission tower at a major
river crossing that serves a populated city. In addition, many interdependencies exist and cross
cut many sectors of our society. This risk study takes initial steps to address likely consequences
and interdependencies.
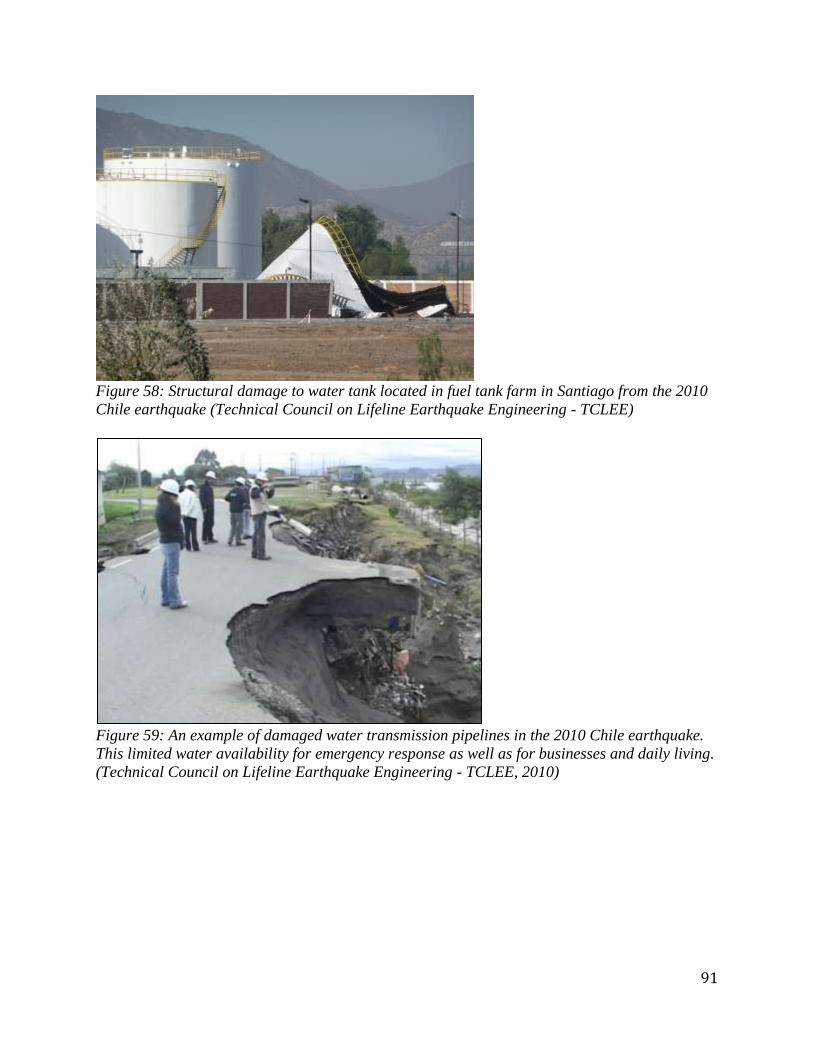
91
Figure 58: Structural damage to water tank located in fuel tank farm in Santiago from the 2010
Chile earthquake (Technical Council on Lifeline Earthquake Engineering - TCLEE)
Figure 59: An example of damaged water transmission pipelines in the 2010 Chile earthquake.
This limited water availability for emergency response as well as for businesses and daily living.
(Technical Council on Lifeline Earthquake Engineering - TCLEE, 2010)
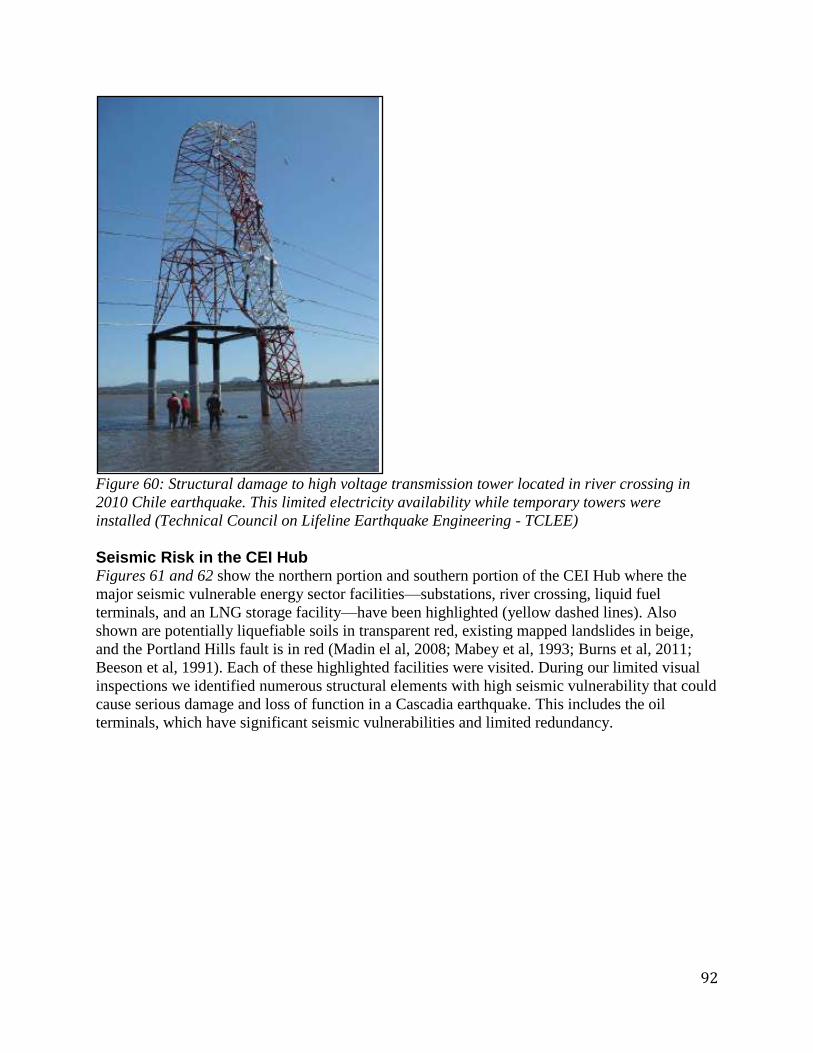
92
Figure 60: Structural damage to high voltage transmission tower located in river crossing in
2010 Chile earthquake. This limited electricity availability while temporary towers were
installed (Technical Council on Lifeline Earthquake Engineering - TCLEE)
Seismic Risk in the CEI Hub Figures 61 and 62 show the northern portion and southern portion of the CEI Hub where the
major seismic vulnerable energy sector facilities—substations, river crossing, liquid fuel
terminals, and an LNG storage facility—have been highlighted (yellow dashed lines). Also
shown are potentially liquefiable soils in transparent red, existing mapped landslides in beige,
and the Portland Hills fault is in red (Madin el al, 2008; Mabey et al, 1993; Burns et al, 2011;
Beeson et al, 1991). Each of these highlighted facilities were visited. During our limited visual
inspections we identified numerous structural elements with high seismic vulnerability that could
cause serious damage and loss of function in a Cascadia earthquake. This includes the oil
terminals, which have significant seismic vulnerabilities and limited redundancy.
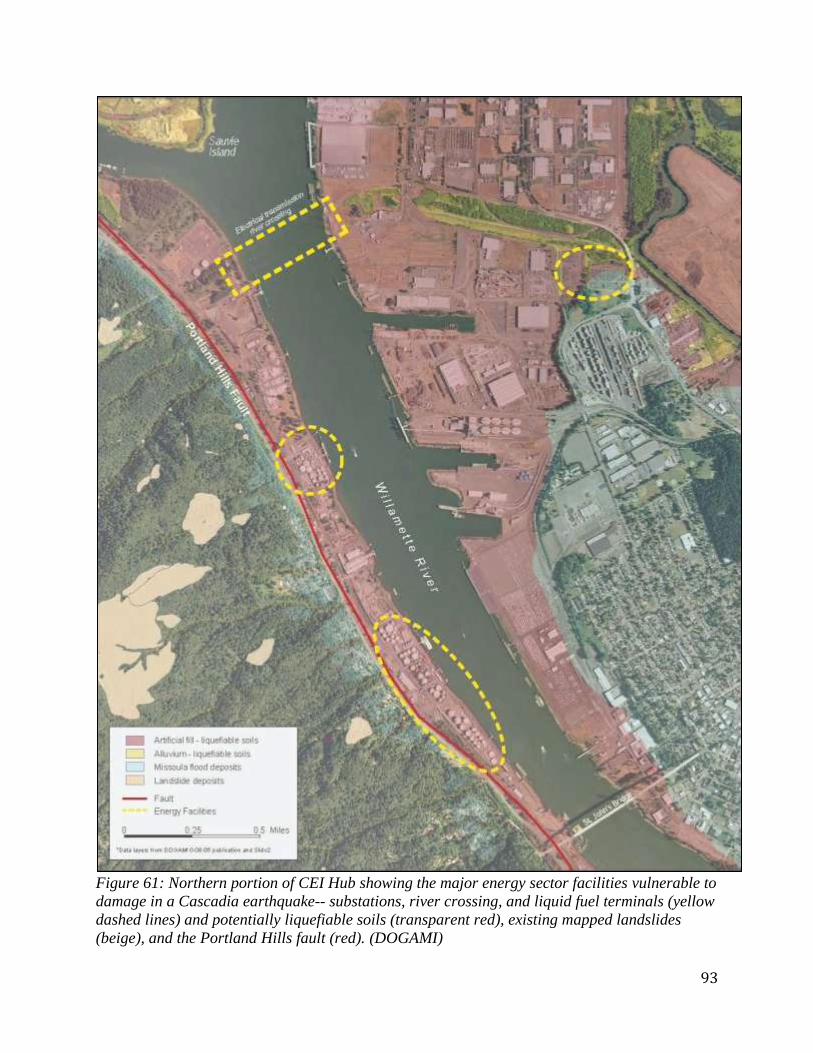
93
Figure 61: Northern portion of CEI Hub showing the major energy sector facilities vulnerable to
damage in a Cascadia earthquake-- substations, river crossing, and liquid fuel terminals (yellow
dashed lines) and potentially liquefiable soils (transparent red), existing mapped landslides
(beige), and the Portland Hills fault (red). (DOGAMI)
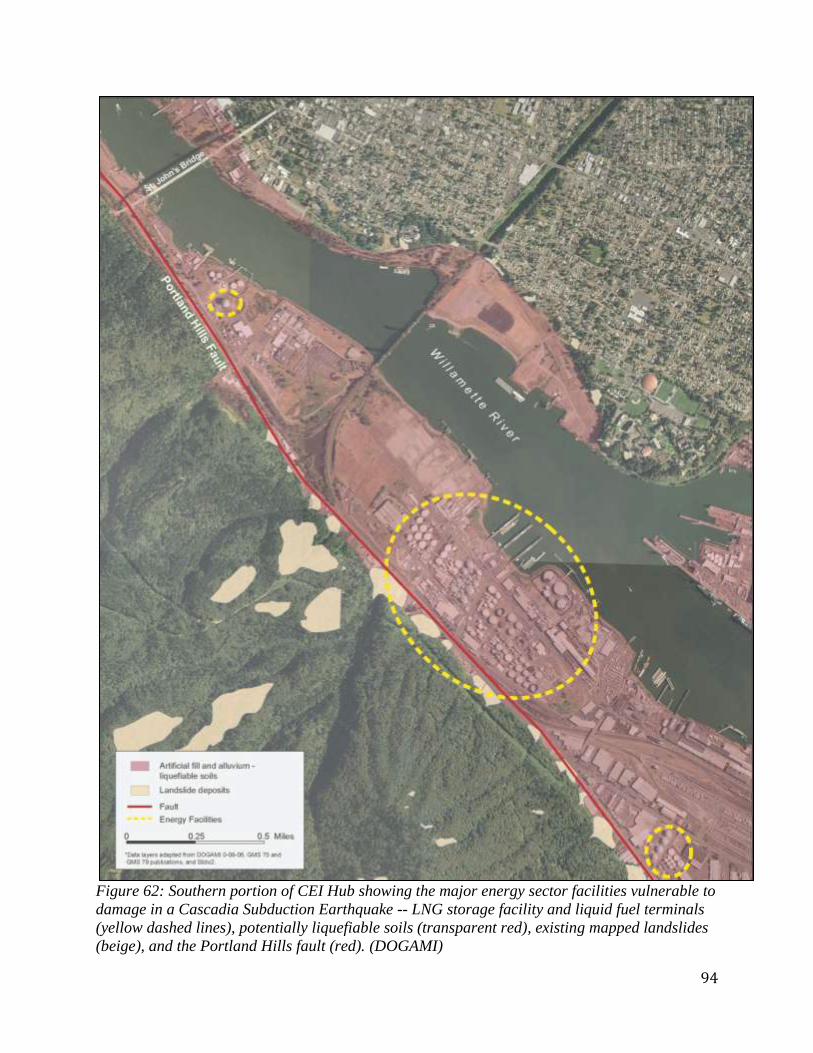
94
Figure 62: Southern portion of CEI Hub showing the major energy sector facilities vulnerable to
damage in a Cascadia Subduction Earthquake -- LNG storage facility and liquid fuel terminals
(yellow dashed lines), potentially liquefiable soils (transparent red), existing mapped landslides
(beige), and the Portland Hills fault (red). (DOGAMI)

95
Based on the findings of this study, DOGAMI has identified the following as examples of high
seismic risks to the energy sector with statewide importance. The first two risks are system-wide
risks involving redundancies and interdependencies; the remaining risks are sector-specific
seismic risks to liquid fuel, natural gas and electricity.
Lack of System Redundancies DOGAMI determined that each energy source has a different level of redundancy in their
transmission system. This determination was based on discussions with the EAP partners,
interviews with personnel from the various energy sectors, and analyses of available data
including maps, such as Earthquake Hazards of Lifelines along the Interstate 5 Urban Corridor:
Woodburn, Oregon, to Centralia, Washington, and Earthquake Hazards of Lifelines along the
Interstate 5 Urban Corridor: Cottage Grove to Woodburn, (Barnett el al, 2009), Western
Electricity Coordinating Council (WECC, 2012) and US. Department of Transportation's
National Pipeline Mapping System's Public Map Viewer
(https://www.npms.phmsa.dot.gov/PublicViewer/composite.jsf). The redundancy of each of the
systems influences the level of seismic resilience with more redundant systems favoring higher
resilience. The transmission systems, such as the main electrical grid and transmission pipelines,
are of key importance in the supply chain.
1. The electrical system has power generation facilities located throughout Oregon and has
the most widespread and redundant transmission system. The level of redundancy
surrounding and within the Portland metropolitan area is high because there exist a
number of transmission systems and diminishes away from the Portland area. 2. The natural gas system in Oregon relies 100 percent on imported natural gas, most of it
from the north, and has much less redundancy than the electrical system. The natural gas
system has a loop configuration around the greater Portland area and this provides for
some redundancy. If a break in the loop occurs, it is theoretically possible to provide
natural gas to areas around the loop. The level of redundancy south of the Portland
metropolitan area (e.g. Marion County) is considered to be low based on discussions with
OPUC and the gas operator. In addition, the natural gas reserve capacity has limits. 3. Oregon’s liquid fuel oil source relies 100 percent on imported fuel, most of it from the
north, and has very limited redundancy and reserve capacity.
System Interdependencies The three energy sources—electricity, natural gas, and liquid fuel—depend upon each other so if
one system is inoperable, it will impact another. For example, all sources rely on electricity to
operate their systems. Electricity is needed to power the control rooms for natural gas and liquid
fuel transmission.
The energy sector also relies on the transportation and telecommunication sectors. For example,
in order to transport liquid fuel to the marine oil terminals in the CEI Hub, ships enter through
the Columbia River mouth and travel up the navigable waterway. If the river mouth is blocked
by tsunami debris, the shipping channel is altered from sloughing of the underwater slopes or the
shipping lane is blocked by downed electrical transmission lines or bridges, then moving fuel to
the CEI Hub via the waterway would not be possible.
96
Liquid Fuel Liquid fuel pipeline: The CEI Hub petroleum facilities receive liquid fuel via two methods: 1)
the liquid fuel transmission pipeline, and 2) marine vessels. The transportation method and
amounts vary due to product need, transportation costs, weather and other conditions. The liquid
fuel pipeline was largely constructed in the 1960s when the regional seismic hazards were
unknown and state-of-practice construction techniques at that time did not include any reference
to seismic standards. The regional seismic hazards are now known to be high and the soils at the
river crossings are susceptible to liquefaction and lateral spreading. The 1960s vintage pipeline
design did not consider ground movements from lateral spreading at river crossings or the
stresses to the pipelines induced by earthquakes that may cause pipe damage and multiple
breaks. A pipe break would have a significant impact on all of the petrochemical facilities in the
CEI Hub and could result in a statewide fuel shortage.
Shipping channel: The navigational channel from the Columbia River mouth to the lower
Willamette River is used to transport fuel by marine vessels. DOGAMI conducted a preliminary
investigation and found that the shipping channel would likely be damaged and closed for river
navigation until it is officially cleared for use by the USCG. Based on our findings, the likely
damage includes four modes:
Tsunami scour, damage and debris near the mouth of the Columbia River
Underwater slope failures along portions of the steep banks of the navigable river channel
Collapses of overhead structures such as bridges from earthquake shaking
Broken buried pipelines at river crossing locations
Closure of the shipping channel would prevent marine vessels from delivering liquid fuel as well
as limit transport of emergency recovery equipment.
Marine terminals: All of the port facilities in the CEI Hub have significant seismic risks due to
liquefaction, lateral spreading, and seiches. Some older piers were constructed without any
seismic design provisions, have deteriorated, and may be damaged even in a moderate
earthquake. If oil products are released and contaminate the navigable waterway, the waterway
may be closed to river traffic thus impeding emergency response activities as well as the supply
chain. The local capacity to fight fires and clean hazardous material spills is limited.
Fuel Tank Farms: All of the fuel tank farms in the CEI Hub have significant seismic risks due
to the significant unmitigated liquefaction hazards largely posed by hydraulically-deposited river
soils (also known as hydraulic fill) and native soils. Due to the long standing inadequate seismic
hazard knowledge and the inadequate building code requirements, the majority of the tanks have
been constructed without any or only limited seismic design criteria on unmitigated, potentially
liquefiable soils. It was not until 2004 that city building officials required new construction
projects, including tanks, to evaluate for liquefaction of silts. Based on discussions with City of
Portland engineers from Bureau of Development Services and terminal operators, DOGAMI has
identified only three existing tanks that have addressed liquefaction hazards.
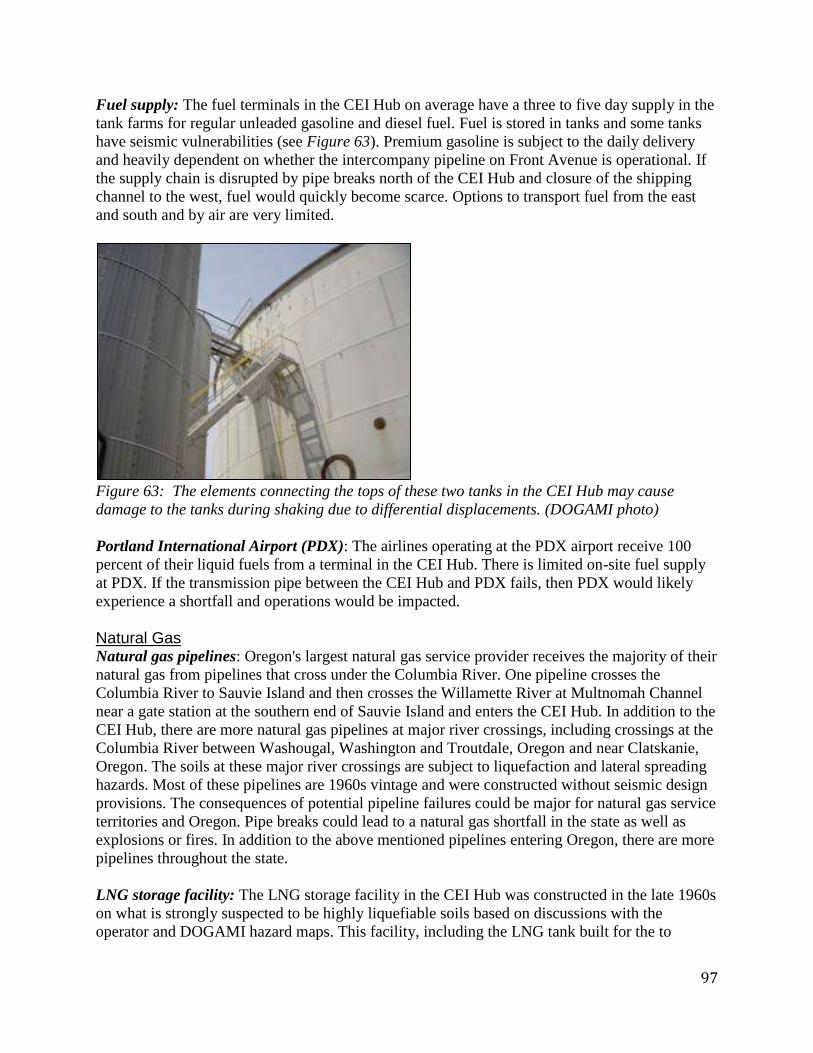
97
Fuel supply: The fuel terminals in the CEI Hub on average have a three to five day supply in the
tank farms for regular unleaded gasoline and diesel fuel. Fuel is stored in tanks and some tanks
have seismic vulnerabilities (see Figure 63). Premium gasoline is subject to the daily delivery
and heavily dependent on whether the intercompany pipeline on Front Avenue is operational. If
the supply chain is disrupted by pipe breaks north of the CEI Hub and closure of the shipping
channel to the west, fuel would quickly become scarce. Options to transport fuel from the east
and south and by air are very limited.
Figure 63: The elements connecting the tops of these two tanks in the CEI Hub may cause
damage to the tanks during shaking due to differential displacements. (DOGAMI photo)
Portland International Airport (PDX): The airlines operating at the PDX airport receive 100
percent of their liquid fuels from a terminal in the CEI Hub. There is limited on-site fuel supply
at PDX. If the transmission pipe between the CEI Hub and PDX fails, then PDX would likely
experience a shortfall and operations would be impacted.
Natural Gas Natural gas pipelines: Oregon's largest natural gas service provider receives the majority of their
natural gas from pipelines that cross under the Columbia River. One pipeline crosses the
Columbia River to Sauvie Island and then crosses the Willamette River at Multnomah Channel
near a gate station at the southern end of Sauvie Island and enters the CEI Hub. In addition to the
CEI Hub, there are more natural gas pipelines at major river crossings, including crossings at the
Columbia River between Washougal, Washington and Troutdale, Oregon and near Clatskanie,
Oregon. The soils at these major river crossings are subject to liquefaction and lateral spreading
hazards. Most of these pipelines are 1960s vintage and were constructed without seismic design
provisions. The consequences of potential pipeline failures could be major for natural gas service
territories and Oregon. Pipe breaks could lead to a natural gas shortfall in the state as well as
explosions or fires. In addition to the above mentioned pipelines entering Oregon, there are more
pipelines throughout the state.
LNG storage facility: The LNG storage facility in the CEI Hub was constructed in the late 1960s
on what is strongly suspected to be highly liquefiable soils based on discussions with the
operator and DOGAMI hazard maps. This facility, including the LNG tank built for the to
98
provide peaking gas supplies, could result in unsafe conditions during a major earthquake.
Furthermore, although the facility has an on-site emergency generator, based on EAP partners'
site inspection with the operator, it had seismic deficiencies and would likely not operate after a
major earthquake.
At the February 13, 2012 OPUC hearing, the natural gas operator with facilities in the CEI Hub
reported that they had not performed seismic vulnerability assessments of the natural gas system.
Electricity Electrical facilities: Electrical facilities and systems have significant seismic risk due to ground
shaking and ground failure, including liquefaction and lateral spreading. Seismically vulnerable
facilities include substations and transmission in the CEI Hub as well as facilities outside of the
CEI Hub, including power plants, substations and transmission lines. At the February 13, 2012
OPUC hearing, the investor-owned utility company with facilities in the CEI Hub reported that
they had not performed seismic vulnerability assessments of the electrical system.
Major vulnerabilities in the CEI Hub include the control buildings, power transformers and other
electrical equipment in yards at the substations, and transmission towers near the Willamette
River. Damage is likely to occur to both the transmission system and the distribution system in
the CEI Hub. Damage to the electrical grid will likely result in a blackout in the CEI Hub and
elsewhere.
Bonneville Power Administration (BPA) has conducted a comprehensive seismic vulnerability
study of their system and has had a long-term seismic mitigation program in place since 1993.
BPA’s long-term seismic mitigation program includes 1) investment protection (e.g. anchoring
transformers), and 2) power system recovery of critical paths (e.g. hardening of equipment at one
of multiple bays within a major substation). The first phase of BPA's mitigation program
includes bracing and restraining critical equipment and seismically upgrading critical building
facilities west of the Cascade Range. Seismic strengthening in the substation yard would
typically include: anchoring high-voltage power transformers; bracing transformer conservators
and radiators; replacing seismically vulnerable live tank circuit breakers with more robust dead
tank circuit breakers; adding damping systems to existing live tank circuit breakers; hardening
transformer bushing storage facilities; replacing rigid bus connections with flexible bus. These
mitigation techniques will improve the reliability of seismic performance. Additional phases of
the seismic mitigation program will include facilities east of the Cascade Range.
BPA has a critical 115 kV and 230 kV high voltage transmission river crossing in the CEI Hub
as well as a substation. At the substation in the CEI Hub, some of the high-voltage equipment
had been anchored and braced to withstand earthquake motions. BPA is in the process of
conducting seismic strengthening of the control building and equipment inside the control
building (e.g., brace computer floors, control cabinets, battery racks, ceiling, pipes, etc) and
additional mitigation in the yard. BPA has conducted subsurface, liquefaction and lateral
spreading analyses at one of the transmission tower sites at the Willamette River crossing and
concluded severe ground movement up to 25 feet towards the river channel is possible. Until
mitigated, it is likely that at least two transmission towers would experience extensive damage,
be inoperable, require repair or replacement, and power lines could temporarily block river
99
traffic, including the pathway to the oil terminals. The BPA transmission towers at the
Willamette River crossing are scheduled to be seismically analyzed, have a seismic mitigation
design completed in 2013, and be mitigated by 2014.
Recent unpublished BPA Cascadia earthquake scenario studies of the existing transmission line
system indicate that their main grid would require between 7 and 51 days to make emergency
damage repairs to the transmission line system (Oregon and Washington) from a magnitude 9
Cascadia earthquake. This scenario assumes many ideal conditions (BPA employees and
contractor resources are immediately available, all roads and bridges are passable, available fuel,
etc), which is optimistic.
Impacts to Oregon Based on visual observations, engineering judgment, limited analyses, and limited information
from the facility operators, city records, and available literature, significant seismic risk exists in
the CEI Hub. Some critically important structures appear to be susceptible to significant damage
in a major earthquake with potentially catastrophic consequences. Multiple liquid fuel
transmission pipe breaks and natural gas transmission pipe breaks are possible. Damage to liquid
fuel, natural gas, and electrical facilities in the CEI Hub is likely. The waterway would likely be
closed and require clean up.
Due to a combination of the existing seismic hazards, vulnerability of the exposed infrastructure
and potential consequences, Cascadia earthquakes pose substantial risk to the CEI Hub and to
Oregon. Not only are the energy sector facilities in the CEI Hub dependent on other sectors and
systems in Oregon, including transportation and communication, they are interdependent upon
each other. A major Cascadia earthquake and tsunami would likely produce an unprecedented
catastrophe much larger than any disaster the state has faced.
Western Oregon will likely face an electrical blackout, extended natural gas service outages,
liquid fuel shortage, as well as damage and losses in the tens of billions of dollars in a future
major Cascadia earthquake. Preparing for a catastrophic disaster to become more resilient is
needed to improve personal safety and security, and safeguard communities and businesses.
100
Section 7 Recommendations
The most critical call-to-action that DOGAMI has concluded from this study of the CEI Hub is
this: Energy sector companies must pro-actively integrate seismic mitigation into their
business practices for Oregon’s energy sector to adequately recover from a magnitude 8.5 to 9
Cascadia earthquake in a reasonable time period.
Although energy sector companies have made efforts to prepare for seismic events, such as
through emergency planning and complying with the current building codes, these efforts are
limited and a timely restoration of energy sector services is questionable. As discussed in the
Summary of Findings section, only one company has completed comprehensive seismic
vulnerability assessments and instituted seismic mitigation plans. Energy sector companies must
make earthquake mitigation an integral part of their overall business plan. This is not only
prudent for the impact a large magnitude Cascadia earthquake would have on Oregonians and the
environment; it is good business continuity management. Oregon homes, businesses and
industries depend upon reliable energy sources. Liquid fuel, natural gas and electricity are
critical to our economy, environment and everyday existence, and the energy sector must do
more in order to assure those services and products in the event of a large earthquake.
Recommendations In order for the energy sector to pro-actively integrate seismic mitigation into their operations,
DOGAMI makes these four recommendations to both private and public energy sector
stakeholders:
1. Energy sector companies should conduct Seismic Vulnerability Assessments on all of
their systems or facilities, and should work with the appropriate local, state, tribal and
federal government agencies and stakeholders to achieve timely completion of the
assessments to understand existing vulnerabilities.
2. Energy sector companies should institutionalize long-term seismic mitigation
programs; and should work with the appropriate local, state, tribal and federal
government agencies and stakeholders to achieve timely and effective mitigation to
ensure facility resilience and operational reliability.
3. The State of Oregon's Homeland Security Council should review the vulnerability
and resilience of the energy sector to earthquakes and other natural disasters within
the scope of their mission. This could involve the EAP partners (ODOE, OPUC, and
DOGAMI) as well as ODOT, Building Codes Division, and the Oregon Seismic
Safety Policy Advisory Commission (OSSPAC).
4. Energy sector companies and the State of Oregon should build Oregon’s seismic
resilience to a Cascadia earthquake. Adopting pro-active practices and a risk
management approach will help achieve seismic resilience. Encouraging a culture of
awareness and preparedness concerning the seismic vulnerability of the energy sector
including long range energy planning should be conducted.
101
Recommendation #1: Conduct Seismic Vulnerability Assessments (SVAs) To improve energy sector resilience to a catastrophic earthquake, energy sector companies will
need to conduct Seismic Vulnerability Assessments (SVAs) of each individual energy facility in
the CEI Hub and on a priority basis throughout Oregon. As part of the SVA, energy sector
companies should identify key nodes or links at all of their facilities that, if they were to fail,
would affect many customers over an extended duration. Companies should conduct an
assessment to determine if the identified key nodes or links have high risk of failure during a
magnitude 9 Cascadia earthquake. They should evaluate and prioritize the best mitigation
options on their highest risk key nodes or links. Energy sector companies should consider a
magnitude 8.5 to 9 Cascadia earthquake and tsunami during wet conditions (including co-seismic
landslides, liquefaction and lateral spreading) as the basis of their assessments.
Following are suggestions regarding SVAs:
Energy sector companies should use sector-appropriate guidelines and standards to conduct
their SVAs. For example, the electric and natural gas companies can refer to the American
Lifelines Alliance and the American Society of Civil Engineers or other industry guidelines
and standards to conduct SVAs on facilities, systems, and components. (See Table 3.) This
includes considering broader influences relating to: 1) co-location and interdependencies; 2)
business continuity; 3) safety; 4) environmental damage/spills; 5) reliability of service; 6)
other critical factors. The liquid fuel companies can refer to the Marine Oil Terminal
Engineering and Maintenance Standards (MOTEMS), a regulatory program implemented by
California State Lands Commission that incorporates seismic safety.
Energy sector companies should conduct SVAs on all their facilities and systems, including
liquefaction vulnerabilities, and report to the appropriate authorities and stakeholders within
a pre-determined time frame providing an overview of their assessment. This should include
their evaluation in their current state of their expected down time in a Cascadia earthquake,
which establishes baseline information, as well as expected recovery rate, and expected
dependence on other sectors.
Energy sector companies should report to the appropriate authorities and stakeholders within
a pre-determined time frame providing an overview of their seismic mitigation plan, costs,
and implementation timeframes.
All energy sector companies should share assessments and mitigation plan with their
ratepayers and shareholders in order to increase awareness and set realistic expectations for
the public. This action would help develop support for a funding plan that is both transparent
and accountable.
State agencies (ODOE, OPUC, and DOGAMI) responsible for the Energy Assurance Project
(EAP) should provide technical guidance to energy sector companies to achieve reliable
energy-related services.
Energy sector companies and public agencies should look for opportunities for public-private
sector partnerships to prepare for Cascadia earthquakes. This would include pilot projects
involving SVAs, risk management tools, and mitigation. For example, the Bonneville Power
Administration (BPA) has plans to mitigate transmission towers at the lower Willamette
River crossing by 2014. There could be significant cost advantages if the privately-owned
adjacent towers were upgraded in coordination with the BPA effort.
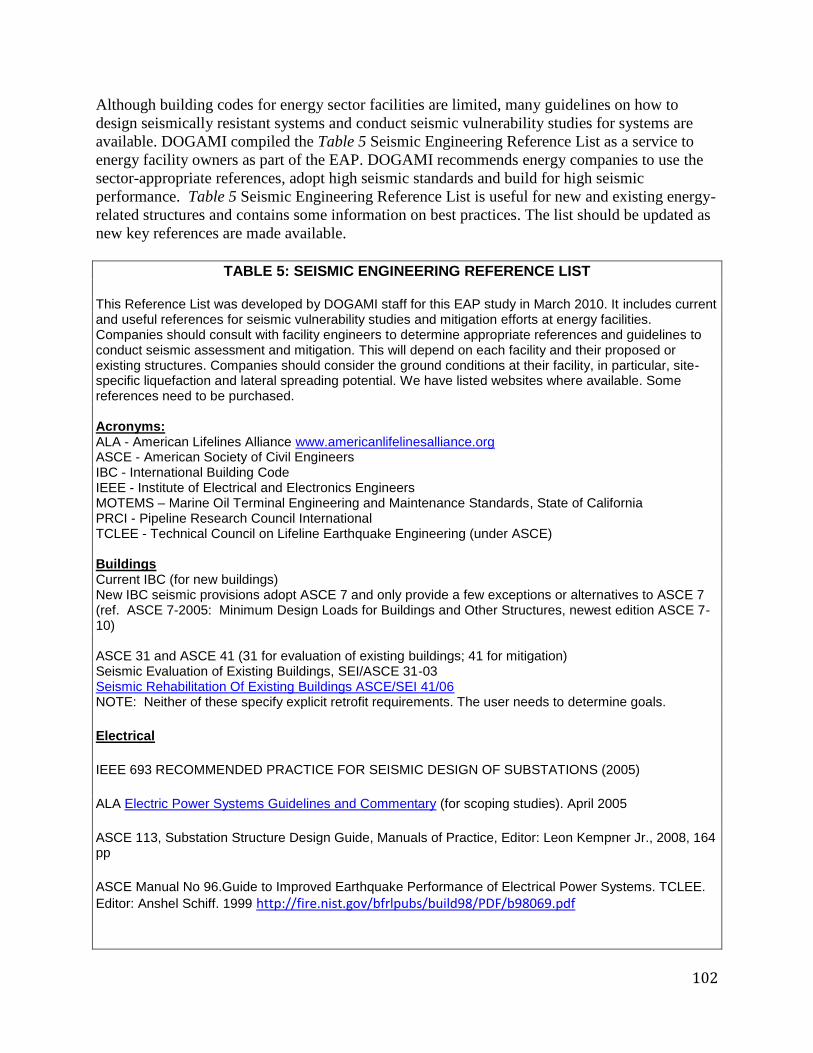
102
Although building codes for energy sector facilities are limited, many guidelines on how to
design seismically resistant systems and conduct seismic vulnerability studies for systems are
available. DOGAMI compiled the Table 5 Seismic Engineering Reference List as a service to
energy facility owners as part of the EAP. DOGAMI recommends energy companies to use the
sector-appropriate references, adopt high seismic standards and build for high seismic
performance. Table 5 Seismic Engineering Reference List is useful for new and existing energy-
related structures and contains some information on best practices. The list should be updated as
new key references are made available.
TABLE 5: SEISMIC ENGINEERING REFERENCE LIST This Reference List was developed by DOGAMI staff for this EAP study in March 2010. It includes current and useful references for seismic vulnerability studies and mitigation efforts at energy facilities. Companies should consult with facility engineers to determine appropriate references and guidelines to conduct seismic assessment and mitigation. This will depend on each facility and their proposed or existing structures. Companies should consider the ground conditions at their facility, in particular, site-specific liquefaction and lateral spreading potential. We have listed websites where available. Some references need to be purchased. Acronyms: ALA - American Lifelines Alliance www.americanlifelinesalliance.org ASCE - American Society of Civil Engineers IBC - International Building Code IEEE - Institute of Electrical and Electronics Engineers MOTEMS – Marine Oil Terminal Engineering and Maintenance Standards, State of California PRCI - Pipeline Research Council International TCLEE - Technical Council on Lifeline Earthquake Engineering (under ASCE) Buildings Current IBC (for new buildings) New IBC seismic provisions adopt ASCE 7 and only provide a few exceptions or alternatives to ASCE 7 (ref. ASCE 7-2005: Minimum Design Loads for Buildings and Other Structures, newest edition ASCE 7-10) ASCE 31 and ASCE 41 (31 for evaluation of existing buildings; 41 for mitigation) Seismic Evaluation of Existing Buildings, SEI/ASCE 31-03 Seismic Rehabilitation Of Existing Buildings ASCE/SEI 41/06 NOTE: Neither of these specify explicit retrofit requirements. The user needs to determine goals.
Electrical
IEEE 693 RECOMMENDED PRACTICE FOR SEISMIC DESIGN OF SUBSTATIONS (2005)
ALA Electric Power Systems Guidelines and Commentary (for scoping studies). April 2005
ASCE 113, Substation Structure Design Guide, Manuals of Practice, Editor: Leon Kempner Jr., 2008, 164 pp
ASCE Manual No 96.Guide to Improved Earthquake Performance of Electrical Power Systems. TCLEE.
Editor: Anshel Schiff. 1999 http://fire.nist.gov/bfrlpubs/build98/PDF/b98069.pdf
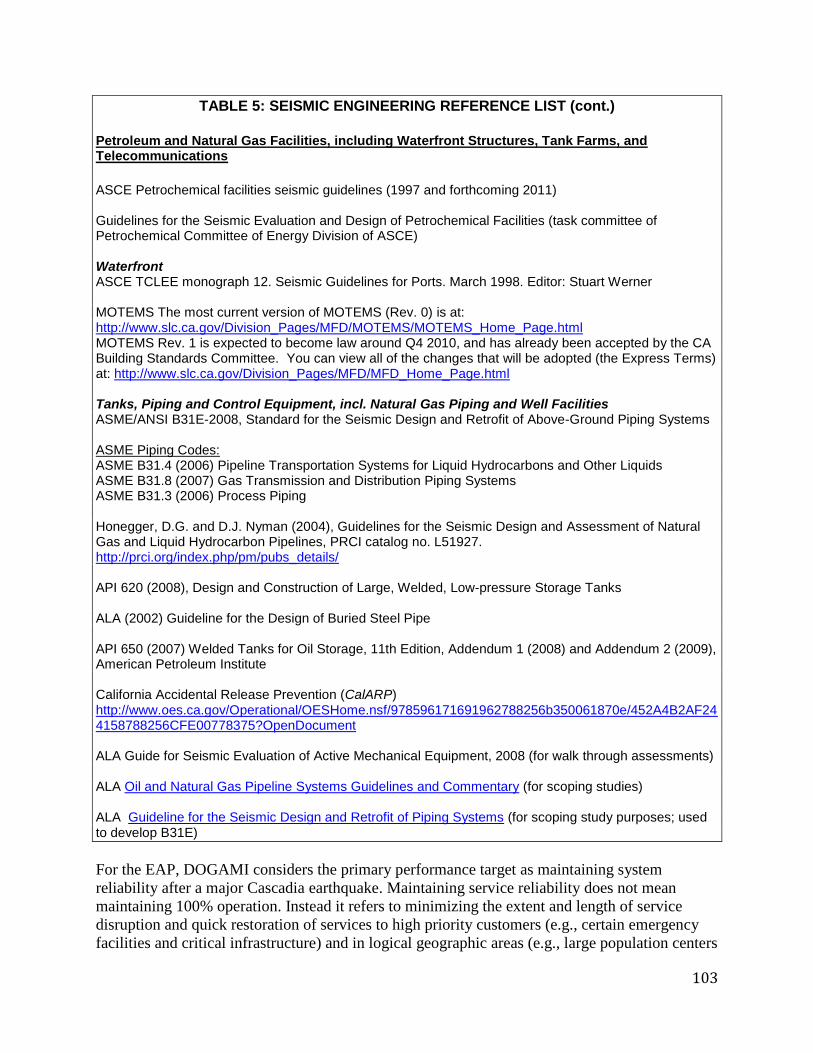
103
TABLE 5: SEISMIC ENGINEERING REFERENCE LIST (cont.)
Petroleum and Natural Gas Facilities, including Waterfront Structures, Tank Farms, and Telecommunications
ASCE Petrochemical facilities seismic guidelines (1997 and forthcoming 2011) Guidelines for the Seismic Evaluation and Design of Petrochemical Facilities (task committee of Petrochemical Committee of Energy Division of ASCE) Waterfront ASCE TCLEE monograph 12. Seismic Guidelines for Ports. March 1998. Editor: Stuart Werner MOTEMS The most current version of MOTEMS (Rev. 0) is at: http://www.slc.ca.gov/Division_Pages/MFD/MOTEMS/MOTEMS_Home_Page.html MOTEMS Rev. 1 is expected to become law around Q4 2010, and has already been accepted by the CA Building Standards Committee. You can view all of the changes that will be adopted (the Express Terms) at: http://www.slc.ca.gov/Division_Pages/MFD/MFD_Home_Page.html Tanks, Piping and Control Equipment, incl. Natural Gas Piping and Well Facilities ASME/ANSI B31E-2008, Standard for the Seismic Design and Retrofit of Above-Ground Piping Systems ASME Piping Codes: ASME B31.4 (2006) Pipeline Transportation Systems for Liquid Hydrocarbons and Other Liquids ASME B31.8 (2007) Gas Transmission and Distribution Piping Systems ASME B31.3 (2006) Process Piping Honegger, D.G. and D.J. Nyman (2004), Guidelines for the Seismic Design and Assessment of Natural Gas and Liquid Hydrocarbon Pipelines, PRCI catalog no. L51927. http://prci.org/index.php/pm/pubs_details/ API 620 (2008), Design and Construction of Large, Welded, Low-pressure Storage Tanks ALA (2002) Guideline for the Design of Buried Steel Pipe API 650 (2007) Welded Tanks for Oil Storage, 11th Edition, Addendum 1 (2008) and Addendum 2 (2009), American Petroleum Institute California Accidental Release Prevention (CalARP) http://www.oes.ca.gov/Operational/OESHome.nsf/978596171691962788256b350061870e/452A4B2AF244158788256CFE00778375?OpenDocument ALA Guide for Seismic Evaluation of Active Mechanical Equipment, 2008 (for walk through assessments) ALA Oil and Natural Gas Pipeline Systems Guidelines and Commentary (for scoping studies) ALA Guideline for the Seismic Design and Retrofit of Piping Systems (for scoping study purposes; used to develop B31E)
For the EAP, DOGAMI considers the primary performance target as maintaining system
reliability after a major Cascadia earthquake. Maintaining service reliability does not mean
maintaining 100% operation. Instead it refers to minimizing the extent and length of service
disruption and quick restoration of services to high priority customers (e.g., certain emergency
facilities and critical infrastructure) and in logical geographic areas (e.g., large population centers
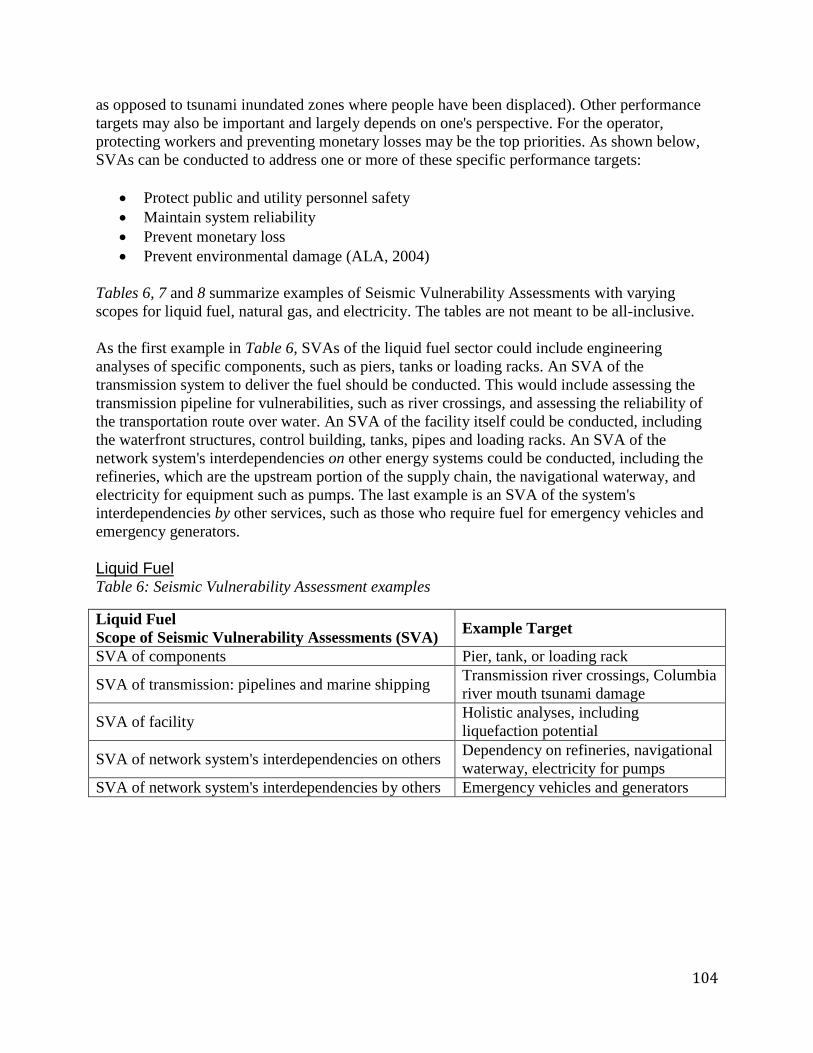
104
as opposed to tsunami inundated zones where people have been displaced). Other performance
targets may also be important and largely depends on one's perspective. For the operator,
protecting workers and preventing monetary losses may be the top priorities. As shown below,
SVAs can be conducted to address one or more of these specific performance targets:
Protect public and utility personnel safety
Maintain system reliability
Prevent monetary loss
Prevent environmental damage (ALA, 2004)
Tables 6, 7 and 8 summarize examples of Seismic Vulnerability Assessments with varying
scopes for liquid fuel, natural gas, and electricity. The tables are not meant to be all-inclusive.
As the first example in Table 6, SVAs of the liquid fuel sector could include engineering
analyses of specific components, such as piers, tanks or loading racks. An SVA of the
transmission system to deliver the fuel should be conducted. This would include assessing the
transmission pipeline for vulnerabilities, such as river crossings, and assessing the reliability of
the transportation route over water. An SVA of the facility itself could be conducted, including
the waterfront structures, control building, tanks, pipes and loading racks. An SVA of the
network system's interdependencies on other energy systems could be conducted, including the
refineries, which are the upstream portion of the supply chain, the navigational waterway, and
electricity for equipment such as pumps. The last example is an SVA of the system's
interdependencies by other services, such as those who require fuel for emergency vehicles and
emergency generators.
Liquid Fuel Table 6: Seismic Vulnerability Assessment examples
Liquid Fuel
Scope of Seismic Vulnerability Assessments (SVA) Example Target
SVA of components Pier, tank, or loading rack
SVA of transmission: pipelines and marine shipping Transmission river crossings, Columbia
river mouth tsunami damage
SVA of facility Holistic analyses, including
liquefaction potential
SVA of network system's interdependencies on others Dependency on refineries, navigational
waterway, electricity for pumps
SVA of network system's interdependencies by others Emergency vehicles and generators

105
Natural Gas Table 7: Seismic Vulnerability Assessment examples
Natural Gas
Scope of Seismic Vulnerability Assessments (SVA) Example Target
SVA of components LNG storage tank
SVA of transmission path Gate stations, bridge crossings,
underground river crossings
SVA of network system Holistic analyses
SVA of network system's interdependencies on others Dependency on local communication
systems
SVA of network system's interdependencies by others Gas service reliability to hospital
Electricity Table 8: Seismic Vulnerability Assessment examples
Electrical
Scope of Seismic Vulnerability Assessments (SVA) Example Target
SVA of components Power transformer and switchyard
equipment reliability
SVA of priority path Path connecting critical substation
components
SVA of network system Holistic analyses including engineering
data
SVA of network system's interdependencies on others Dependency on local transportation
systems
SVA of network system's interdependencies by others Power disruption to water treatment
plant and water systems to fight fires
Recommendation #2: Institutionalize Seismic Mitigation Programs Mitigation programs should address life safety, environmental impacts, and recovery times as
well as minimize potential damage. The Seismic Vulnerability Assessments should be followed
by prioritized mitigation measures to protect critical links of the energy systems from irreparable
damage as well as to ensure rapid recovery of energy services. After completing SVAs, energy
companies should establish priorities and determine possible methods to reduce vulnerabilities
and undesired effects. Assuming the costs associated with implementing the mitigation plans are
significant, the high costs can be managed by implementing the mitigation plan over several
years.
DOGAMI recommends energy companies in Oregon to develop and implement long-term
mitigation plans and strategies to reduce damages from future disasters so as to maintain
services. Following are suggestions regarding the development of seismic mitigation programs:
1) Consider benefits versus costs (e.g., using benefit-cost analyses) together with basic
societal needs
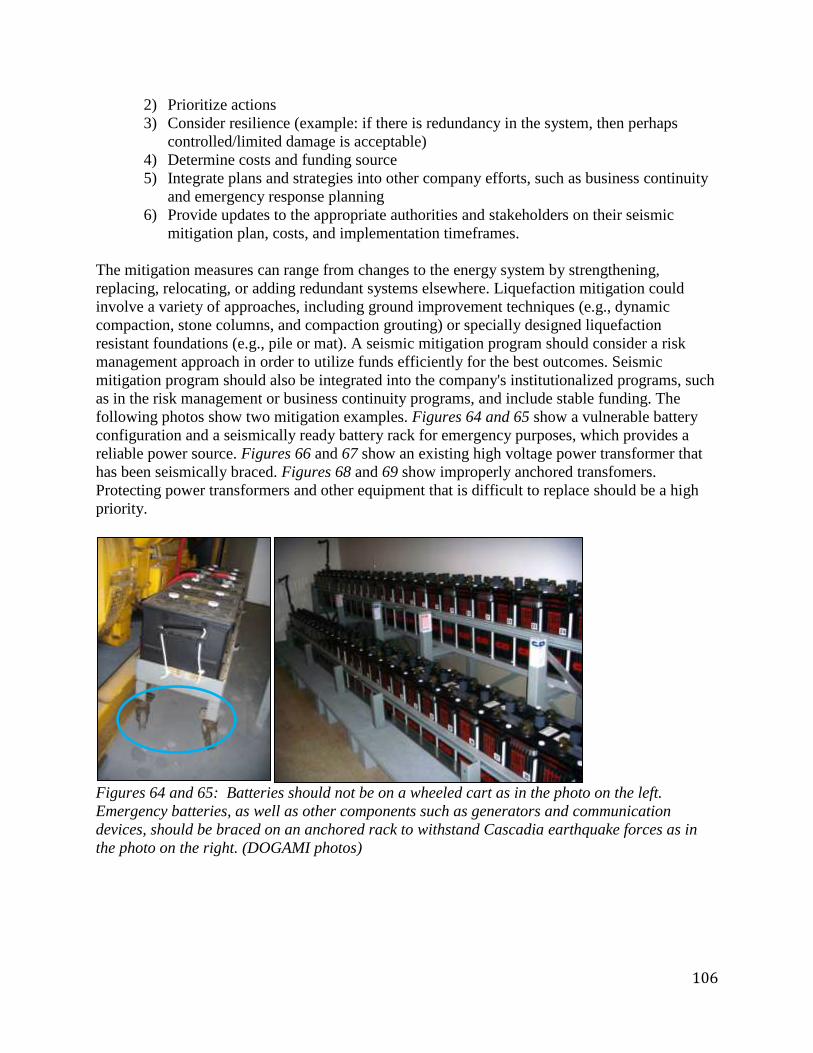
106
2) Prioritize actions
3) Consider resilience (example: if there is redundancy in the system, then perhaps
controlled/limited damage is acceptable)
4) Determine costs and funding source
5) Integrate plans and strategies into other company efforts, such as business continuity
and emergency response planning
6) Provide updates to the appropriate authorities and stakeholders on their seismic
mitigation plan, costs, and implementation timeframes.
The mitigation measures can range from changes to the energy system by strengthening,
replacing, relocating, or adding redundant systems elsewhere. Liquefaction mitigation could
involve a variety of approaches, including ground improvement techniques (e.g., dynamic
compaction, stone columns, and compaction grouting) or specially designed liquefaction
resistant foundations (e.g., pile or mat). A seismic mitigation program should consider a risk
management approach in order to utilize funds efficiently for the best outcomes. Seismic
mitigation program should also be integrated into the company's institutionalized programs, such
as in the risk management or business continuity programs, and include stable funding. The
following photos show two mitigation examples. Figures 64 and 65 show a vulnerable battery
configuration and a seismically ready battery rack for emergency purposes, which provides a
reliable power source. Figures 66 and 67 show an existing high voltage power transformer that
has been seismically braced. Figures 68 and 69 show improperly anchored transfomers.
Protecting power transformers and other equipment that is difficult to replace should be a high
priority.
Figures 64 and 65: Batteries should not be on a wheeled cart as in the photo on the left.
Emergency batteries, as well as other components such as generators and communication
devices, should be braced on an anchored rack to withstand Cascadia earthquake forces as in
the photo on the right. (DOGAMI photos)
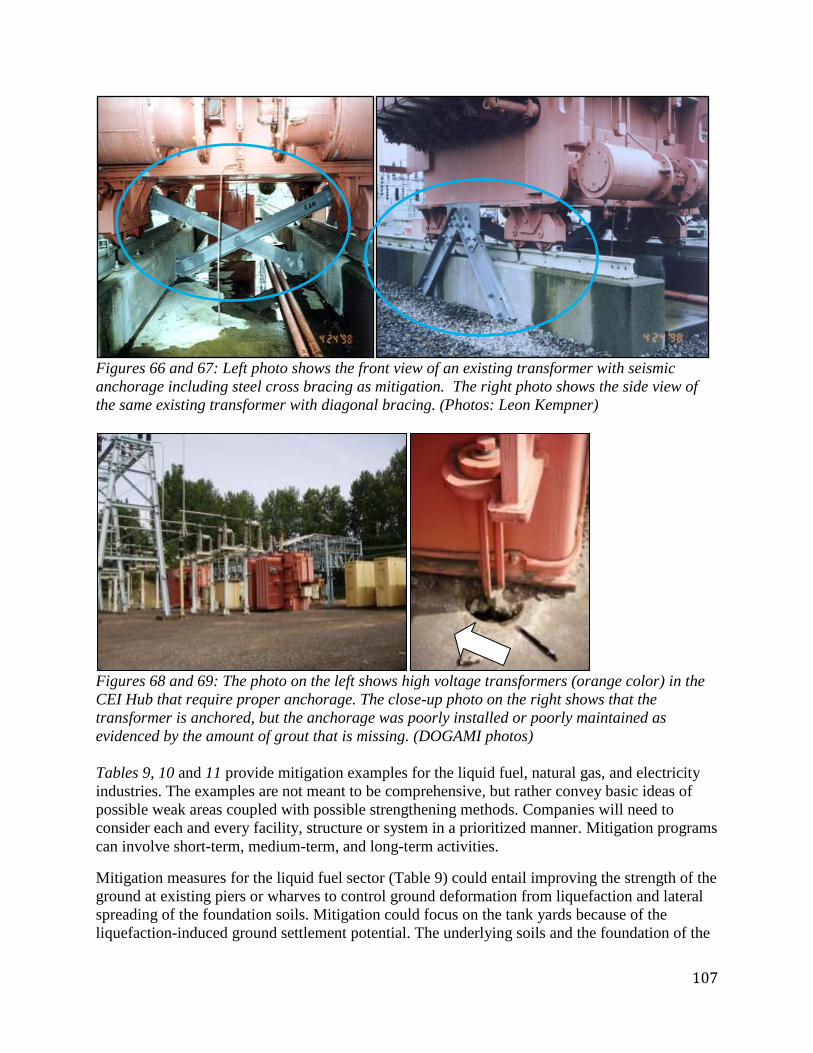
107
Figures 66 and 67: Left photo shows the front view of an existing transformer with seismic
anchorage including steel cross bracing as mitigation. The right photo shows the side view of
the same existing transformer with diagonal bracing. (Photos: Leon Kempner)
Figures 68 and 69: The photo on the left shows high voltage transformers (orange color) in the
CEI Hub that require proper anchorage. The close-up photo on the right shows that the
transformer is anchored, but the anchorage was poorly installed or poorly maintained as
evidenced by the amount of grout that is missing. (DOGAMI photos)
Tables 9, 10 and 11 provide mitigation examples for the liquid fuel, natural gas, and electricity
industries. The examples are not meant to be comprehensive, but rather convey basic ideas of
possible weak areas coupled with possible strengthening methods. Companies will need to
consider each and every facility, structure or system in a prioritized manner. Mitigation programs
can involve short-term, medium-term, and long-term activities.
Mitigation measures for the liquid fuel sector (Table 9) could entail improving the strength of the
ground at existing piers or wharves to control ground deformation from liquefaction and lateral
spreading of the foundation soils. Mitigation could focus on the tank yards because of the
liquefaction-induced ground settlement potential. The underlying soils and the foundation of the
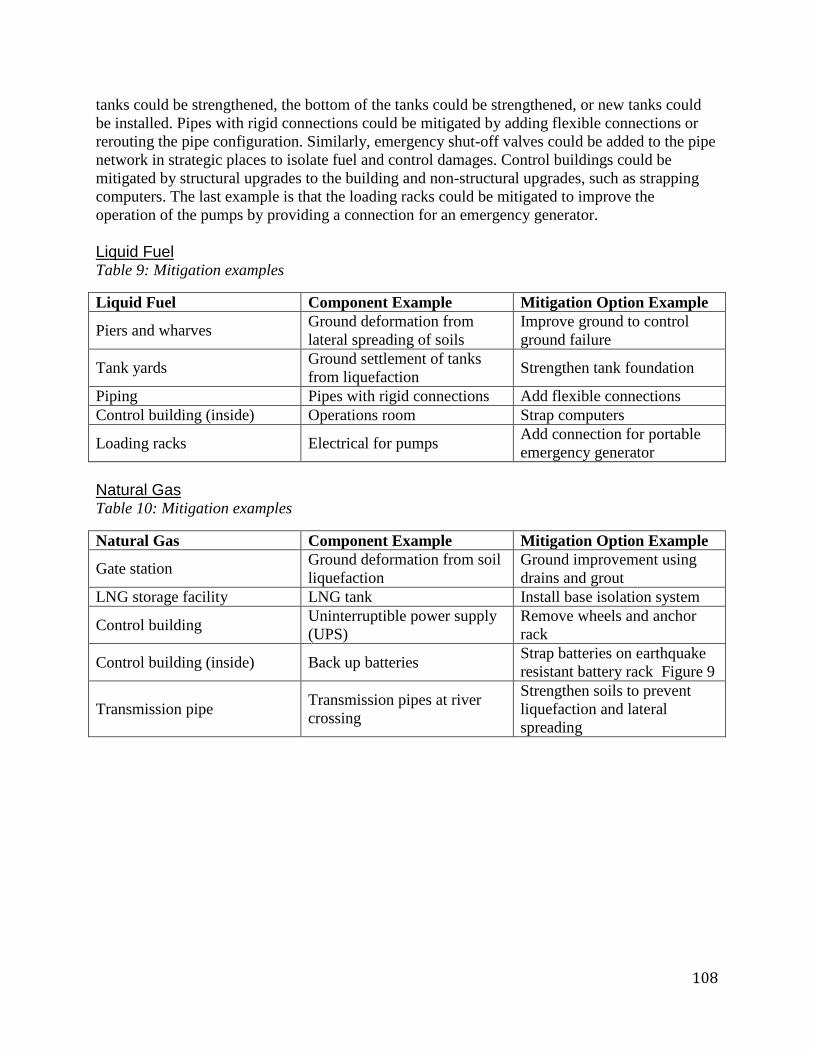
108
tanks could be strengthened, the bottom of the tanks could be strengthened, or new tanks could
be installed. Pipes with rigid connections could be mitigated by adding flexible connections or
rerouting the pipe configuration. Similarly, emergency shut-off valves could be added to the pipe
network in strategic places to isolate fuel and control damages. Control buildings could be
mitigated by structural upgrades to the building and non-structural upgrades, such as strapping
computers. The last example is that the loading racks could be mitigated to improve the
operation of the pumps by providing a connection for an emergency generator.
Liquid Fuel Table 9: Mitigation examples
Liquid Fuel Component Example Mitigation Option Example
Piers and wharves Ground deformation from
lateral spreading of soils
Improve ground to control
ground failure
Tank yards Ground settlement of tanks
from liquefaction Strengthen tank foundation
Piping Pipes with rigid connections Add flexible connections
Control building (inside) Operations room Strap computers
Loading racks Electrical for pumps Add connection for portable
emergency generator
Natural Gas Table 10: Mitigation examples
Natural Gas Component Example Mitigation Option Example
Gate station Ground deformation from soil
liquefaction
Ground improvement using
drains and grout
LNG storage facility LNG tank Install base isolation system
Control building Uninterruptible power supply
(UPS)
Remove wheels and anchor
rack
Control building (inside) Back up batteries Strap batteries on earthquake
resistant battery rack Figure 9
Transmission pipe Transmission pipes at river
crossing
Strengthen soils to prevent
liquefaction and lateral
spreading
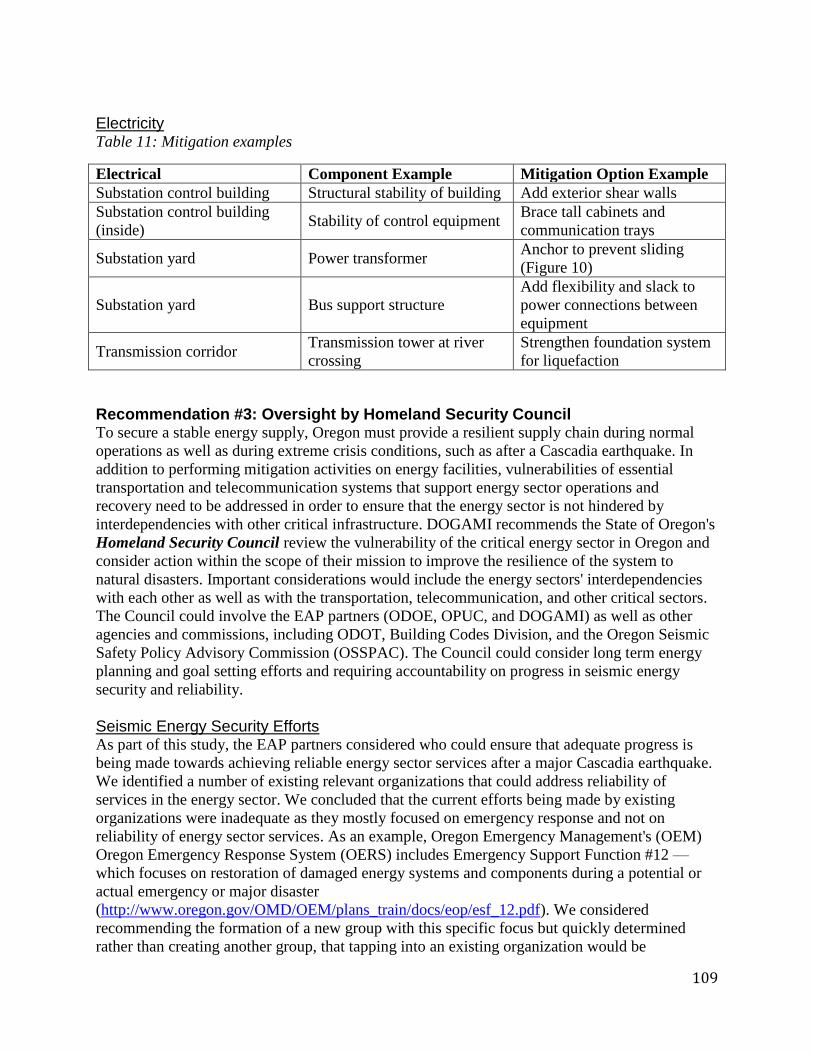
109
Electricity Table 11: Mitigation examples
Electrical Component Example Mitigation Option Example
Substation control building Structural stability of building Add exterior shear walls
Substation control building
(inside) Stability of control equipment
Brace tall cabinets and
communication trays
Substation yard Power transformer Anchor to prevent sliding
(Figure 10)
Substation yard Bus support structure
Add flexibility and slack to
power connections between
equipment
Transmission corridor Transmission tower at river
crossing
Strengthen foundation system
for liquefaction
Recommendation #3: Oversight by Homeland Security Council To secure a stable energy supply, Oregon must provide a resilient supply chain during normal
operations as well as during extreme crisis conditions, such as after a Cascadia earthquake. In
addition to performing mitigation activities on energy facilities, vulnerabilities of essential
transportation and telecommunication systems that support energy sector operations and
recovery need to be addressed in order to ensure that the energy sector is not hindered by
interdependencies with other critical infrastructure. DOGAMI recommends the State of Oregon's
Homeland Security Council review the vulnerability of the critical energy sector in Oregon and
consider action within the scope of their mission to improve the resilience of the system to
natural disasters. Important considerations would include the energy sectors' interdependencies
with each other as well as with the transportation, telecommunication, and other critical sectors.
The Council could involve the EAP partners (ODOE, OPUC, and DOGAMI) as well as other
agencies and commissions, including ODOT, Building Codes Division, and the Oregon Seismic
Safety Policy Advisory Commission (OSSPAC). The Council could consider long term energy
planning and goal setting efforts and requiring accountability on progress in seismic energy
security and reliability.
Seismic Energy Security Efforts As part of this study, the EAP partners considered who could ensure that adequate progress is
being made towards achieving reliable energy sector services after a major Cascadia earthquake.
We identified a number of existing relevant organizations that could address reliability of
services in the energy sector. We concluded that the current efforts being made by existing
organizations were inadequate as they mostly focused on emergency response and not on
reliability of energy sector services. As an example, Oregon Emergency Management's (OEM)
Oregon Emergency Response System (OERS) includes Emergency Support Function #12 —
which focuses on restoration of damaged energy systems and components during a potential or
actual emergency or major disaster
(http://www.oregon.gov/OMD/OEM/plans_train/docs/eop/esf_12.pdf). We considered
recommending the formation of a new group with this specific focus but quickly determined
rather than creating another group, that tapping into an existing organization would be

110
preferable. We determined that group of a high-level individuals who could make major
decisions and create new policies was preferred. As such, we identified the Homeland Security
Council as the best option. Its membership consists of: (a) Four members from the Oregon
Legislative Assembly; (b) The Governor; (c) The Adjutant General; (d) The Superintendent of
State Police; (e) The Director of the Office of Emergency Management; and (f) Additional
members appointed by the Governor who the Governor determines necessary to fulfill the
functions of the council, including state agency heads, elected state officials, local government
officials, a member of the governing body of an Indian tribe and representatives from the private
sector (http://www.oregonlaws.org/ors/401.109). In May 2012, OPUC and DOGAMI met with
the General Mike Caldwell, director of OEM, and OEM staff to explore whether or not the
Homeland Security Council would be an appropriate group to take on this task. At the meeting,
we learned that the Homeland Security Council had limited productivity, was recently
downsized, but also received very positive feedback on it as a likely appropriate group to address
seismic security of the energy sector.
The EAP partners initiated efforts to evaluate possible emergency land, air and river
transportation routes, including by air reconnaissance with the assistance of the Civil Air Patrol
(CAP), in August 2010. Based on the initial findings, DOGAMI recommends that the Council
examine the transportation and telecommunication sectors to better understand and address
shortcomings in critical operational interdependencies. Reliable critical transportation routes
during earthquake disasters are vital for emergency response and recovery, including fuel
distribution. Information on telecommunication frameworks and seismic preparedness guidelines
are provided in Appendix C: Telecommunications: Seismic Codes and Guidelines.
The Council could work with Building Code Division, OSSPAC, engineering and construction
industries and other key stakeholders to identify and rectify existing gaps in the seismic
provisions of the current building codes. For example, the current codes do not require facilities
that are operating well beyond their design life to be re-examined even when there are significant
public safety concerns.
Recommendation #4: Build Oregon's Seismic Resilience Oregon energy facilities are generally prepared for most natural hazards, such as localized severe
winter storms. However, the energy sector is not prepared for a catastrophic Cascadia earthquake
disaster. The CEI Hub is one critical part of a state economy that is within a disaster-prone area.
If damaged, Oregon's economy could result with catastrophic consequences. To date, there are
inadequate safety protocols to protect Oregon from significant earthquake impacts to the CEI
Hub as this study has shown. On the state level, Oregon is considered to have low resilience to a
major Cascadia earthquake.
In contrast, on a national level, the U.S. will be able to absorb the shock from a major Cascadia
earthquake and tsunami. Oregon would be assisted by many others, including the federal
government, the non-profit sector, and a variety of private companies. Many energy sector
organizations that operate in Oregon would have extensive assistance from their own companies
as well as other energy sector companies that have mutual aid agreements in place. In order to
build seismic resilience for critical energy infrastructure operations and interdependencies in
Oregon, we need to pursue the recommendations listed on the following pages. In additional to

111
the recommendations, Oregon can adopt a risk management strategy. The concept of
"resilience," which is a relatively new term in disaster preparedness, is described below.
"Resilience" has a variety of definitions. One definition of resilience is the capacity of a system
or a structure to absorb and recover from a shock (Bruneau et al, 2005;
http://mceer.buffalo.edu/research/resilience). Resilience can be defined to include four elements:
1. Robustness - strength, or the ability of elements, systems, and other units of analysis to
withstand a given level of stress or demand without suffering degradation or loss of
function; 2. Redundancy - the extent to which elements, systems, or other units of analysis exist that
are substitutable, i.e., capable of satisfying functional requirements in the event of
disruption, degradation, or loss of function;
3. Resourcefulness - the capacity to identify problems, establish priorities, and mobilize
resources when conditions exist that threaten to disrupt some element, system, or other
unit of analysis (resourcefulness can be further conceptualized as consisting of the ability
to supply material - i.e., monetary, physical, technological, and informational - and
human resources to meet established priorities and achieve goals); and 4. Rapidity - the capacity to meet priorities and achieve goals in a timely manner in order to
contain losses and avoid future disruption.
(http://mceer.buffalo.edu/research/resilience/resilience_10-24-06.pdf)
In 2011, the National Research Council (NRC) released a report, "National Earthquake
Resilience." This report included the following list and Table 12 addressing resilience:
Relevant hazards are recognized and understood.
Communities at risk know when a hazard event is imminent.
Individuals at risk are safe from hazards in their homes and places of work.
Disaster-resilient communities experience minimum disruption to life and economy after
a hazard event has passed. (NRC, 2011)
The National Research Council’s report made these observations on what condition a state with
high resilience should be in following a catastrophic earthquake:
No systematic concentration of casualties. Important or high-occupancy structures (e.g.
schools, hospitals, and other major institutional buildings; high-rise commercial and
residential buildings) do not collapse, and significant numbers of specific building types
(e.g. hazardous unreinforced masonry structures) do not collapse. There are no major
hazardous materials releases that would cause mass casualties.

112
Financial loss and societal consequences are manageable, not catastrophic. Damage to
the built environment is reduced to avoid catastrophic financial and societal losses due to
overwhelming cost of repair, casualties, displaced populations, government interruption,
loss of housing, or loss of jobs. Community character and cultural values are maintained
following disasters; there is not wholesale loss of iconic buildings (including those
designated as historic), groups of buildings, and neighborhoods of architectural, historic,
ethnic, or other significance.
Emergency responders are able to respond and improvise. Roads are passable, fire
suppression systems are functional, hospitals and other critical facilities are functional. It
is noteworthy that during the 9/11 attacks, New York City’s response was hampered by
the need to set up a new Emergency Operations Center as the existing one had been
located in the World Trade Center.
Critical infrastructure services continue to be provided in the aftermath of a disaster.
Energy, water, and transportation are especially critical elements. Telecommunications
are also very important. Continued service is needed for critical facilities such as
hospitals to function, as well as for residents to remain sheltered in their homes.
Disasters do not escalate into catastrophes. Infrastructure interdependencies have been
anticipated and mitigated, so that disruptions to one critical infrastructure do not cause
cascading failures in other infrastructures (e.g. levee failures in New Orleans escalated
the disaster into a catastrophe). Fires are quickly contained and do not develop into major
urban conflagrations that cause mass casualties and large-scale neighborhood destruction.
Resources for recovery meet the needs of all affected community members. Resources for
recovery are available in an adequate, timely, and equitable manner. To a large extent,
local governments, non-profit organizations, businesses, and residents would have
already materially and financially prepared for a major disaster (e.g. are adequately
insured; have undertaken resilience activities on their own and in cooperation with
others). Safety nets are in place for the most vulnerable members of society.
Communities are restored in a manner that makes them more resilient to the next event.
Experience is translated into improved design, preparedness and overall resilience. High-
hazard areas are rebuilt in ways that reduce, rather than recreate, conditions of disaster
vulnerability (NRC, 2011).

113
Table 12: Resilience applications to social, ecological, physical, and economic recovery by time
period. (National Research Council - NRC, 2011)
For the EAP, DOGAMI developed the resilience triangle graph with the resilience triangle
shown in green. (Figure 70) The basic principle of the resilience triangle is that the smaller the
triangle, the higher the resilience. Higher resilience requires minimal reductions in critical
lifeline services after a disaster, speedy recovery of those services, and an overall improved
service level as a result of rebuilding damaged systems and implementing better systems. Chile
and Japan have high levels of earthquake resilience on the basis of their performance after the
2010 magnitude 8.8 earthquake in Chile and 2011 magnitude 9.0 earthquake in Japan
(notwithstanding the nuclear energy issues). At the current stage, Oregon's energy sector has low
resilience and is expected to have significant loss of energy sector services and a slow recovery
time.
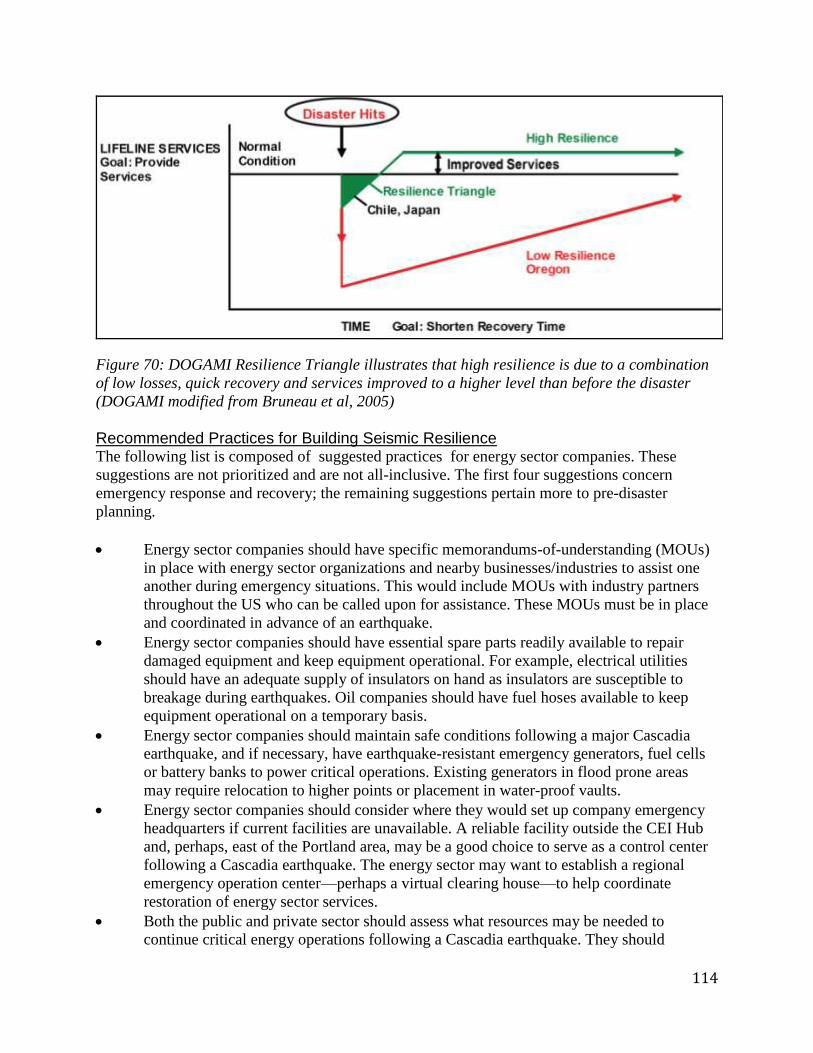
114
Figure 70: DOGAMI Resilience Triangle illustrates that high resilience is due to a combination
of low losses, quick recovery and services improved to a higher level than before the disaster
(DOGAMI modified from Bruneau et al, 2005)
Recommended Practices for Building Seismic Resilience The following list is composed of suggested practices for energy sector companies. These
suggestions are not prioritized and are not all-inclusive. The first four suggestions concern
emergency response and recovery; the remaining suggestions pertain more to pre-disaster
planning.
Energy sector companies should have specific memorandums-of-understanding (MOUs)
in place with energy sector organizations and nearby businesses/industries to assist one
another during emergency situations. This would include MOUs with industry partners
throughout the US who can be called upon for assistance. These MOUs must be in place
and coordinated in advance of an earthquake.
Energy sector companies should have essential spare parts readily available to repair
damaged equipment and keep equipment operational. For example, electrical utilities
should have an adequate supply of insulators on hand as insulators are susceptible to
breakage during earthquakes. Oil companies should have fuel hoses available to keep
equipment operational on a temporary basis.
Energy sector companies should maintain safe conditions following a major Cascadia
earthquake, and if necessary, have earthquake-resistant emergency generators, fuel cells
or battery banks to power critical operations. Existing generators in flood prone areas
may require relocation to higher points or placement in water-proof vaults.
Energy sector companies should consider where they would set up company emergency
headquarters if current facilities are unavailable. A reliable facility outside the CEI Hub
and, perhaps, east of the Portland area, may be a good choice to serve as a control center
following a Cascadia earthquake. The energy sector may want to establish a regional
emergency operation center—perhaps a virtual clearing house—to help coordinate
restoration of energy sector services.
Both the public and private sector should assess what resources may be needed to
continue critical energy operations following a Cascadia earthquake. They should
115
proactively make provisions to minimize the impact, rather than rely on a robust response
operation. Existing entities, including the Department of Homeland Security (DHS)
Fusion Center, DHS U.S. Coast Guard Area Maritime Security Committees, and the
Oregon Emergency Response System Council should consider taking steps to reduce
potential damage to the energy sector before a Cascadia earthquake, which requires
partnering to ensure readiness.
Energy sector companies should review and learn pertinent information from prior
earthquakes, such as the 2004 magnitude 9.1 Sumatra earthquake, 2010 magnitude 8.8
Chile earthquake, and 2011 magnitude 9.0 Japan earthquake. Although it can be difficult
to extract practical information depending upon the country and situation of the prior
earthquake, two non-profit organizations provide sources of information on impacts from
major earthquakes. These include: 1) American Society of Civil Engineers that publishes
lifeline information, including the energy sector, on “Technical Council of Lifeline
Earthquake Engineering” after major worldwide earthquakes
(http://www.asce.org/Content.aspx?id=2147488653) , and 2) Earthquake Engineering
Research Institute’s (EERI) that has the Learning from Earthquakes Program
(http://www.eeri.org/projects/learning-from-earthquakes-lfe/). The EERI focus is broad
(geosciences, emergency response, building, and more).
Energy sector companies should turn to industry-specific seismic documents to help
evaluate and improve existing components and systems and design new construction. The
goal is to reduce and control potential damage. For example, the Marine Oil Terminal
Engineering and Maintenance Standards (MOTEMS) is a regulatory program
implemented by California State Lands Commission that incorporates seismic safety for
the liquid fuel industry’s oil terminals. Figure 71 shows a seismic instrument at a facility
regulated by MOTEMS. The American Lifelines Alliance and American Society of Civil
Engineers provide similar seismic guidelines for the electrical, natural gas and liquid fuel
industries.
Energy sector companies should look for engineering solutions that are industry
appropriate. For example: Liquid fuel companies could construct new tanks and piping to
withstand liquefaction hazards by strengthening the underlying soils, designing robust
foundations and installing flexible piping connections. Seismically mitigation for existing
important tanks could also be conducted. Natural gas companies could consider in-
ground LNG tanks such as those commonly built in Japan. In-ground tanks can be
designed to address buoyancy forces in liquefiable soils. Oil and gas companies could
design their systems to be able to isolate certain blocks of areas using control valves in
order to better control or contain damage. Isolating areas prone to liquefaction to prevent
cascading damage is a possibility. Electrical companies could build micro-grids for
important facilities or districts so areas could be isolated and continue to operate if the
main grid goes down. A micro-grid in Sendai, Japan performed well after the 2011
earthquake (http://spectrum.ieee.org/energy/the-smarter-grid/a-microgrid-that-wouldnt-
quit).
Energy sector companies should determine target performance levels to provide service
after a Cascadia earthquake, and in time, achieve those performance objectives. For
example, after a winter storm, an electricity company may determine that a target
performance level to restore 75 percent of customers’ within 24 hours, 90 percent within
48 hours, and 100 percent within one week is achievable. Energy sector companies
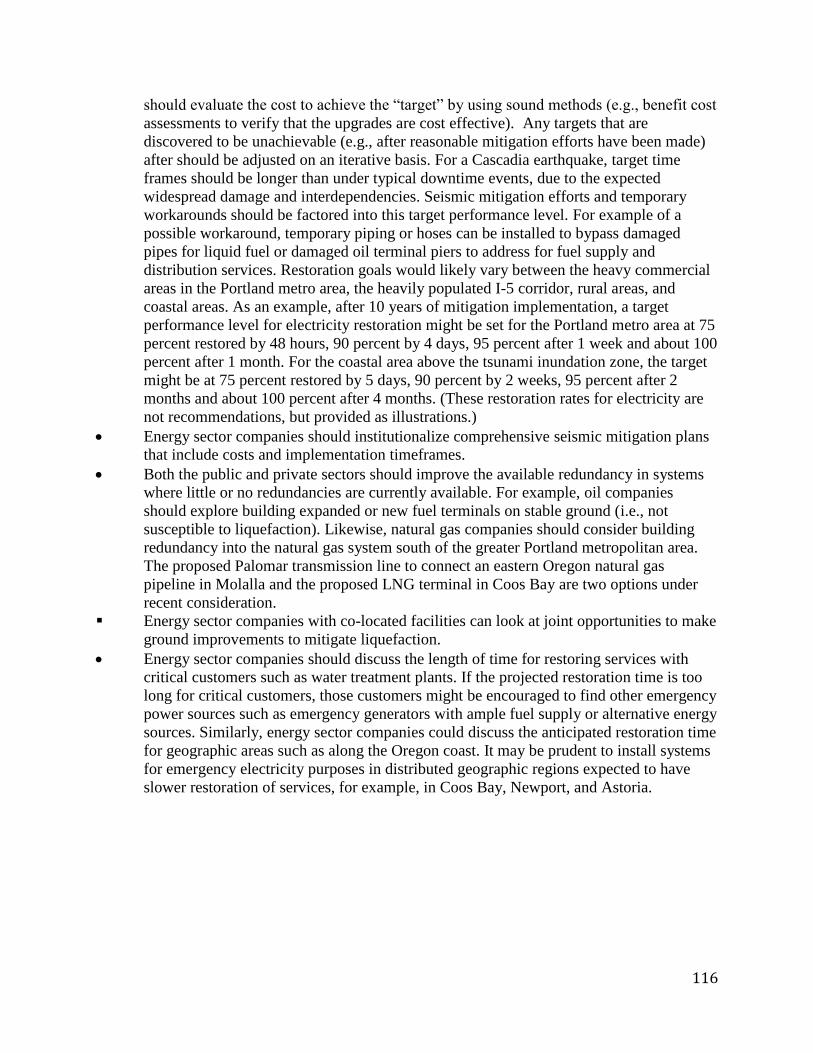
116
should evaluate the cost to achieve the “target” by using sound methods (e.g., benefit cost
assessments to verify that the upgrades are cost effective). Any targets that are
discovered to be unachievable (e.g., after reasonable mitigation efforts have been made)
after should be adjusted on an iterative basis. For a Cascadia earthquake, target time
frames should be longer than under typical downtime events, due to the expected
widespread damage and interdependencies. Seismic mitigation efforts and temporary
workarounds should be factored into this target performance level. For example of a
possible workaround, temporary piping or hoses can be installed to bypass damaged
pipes for liquid fuel or damaged oil terminal piers to address for fuel supply and
distribution services. Restoration goals would likely vary between the heavy commercial
areas in the Portland metro area, the heavily populated I-5 corridor, rural areas, and
coastal areas. As an example, after 10 years of mitigation implementation, a target
performance level for electricity restoration might be set for the Portland metro area at 75
percent restored by 48 hours, 90 percent by 4 days, 95 percent after 1 week and about 100
percent after 1 month. For the coastal area above the tsunami inundation zone, the target
might be at 75 percent restored by 5 days, 90 percent by 2 weeks, 95 percent after 2
months and about 100 percent after 4 months. (These restoration rates for electricity are
not recommendations, but provided as illustrations.)
Energy sector companies should institutionalize comprehensive seismic mitigation plans
that include costs and implementation timeframes.
Both the public and private sectors should improve the available redundancy in systems
where little or no redundancies are currently available. For example, oil companies
should explore building expanded or new fuel terminals on stable ground (i.e., not
susceptible to liquefaction). Likewise, natural gas companies should consider building
redundancy into the natural gas system south of the greater Portland metropolitan area.
The proposed Palomar transmission line to connect an eastern Oregon natural gas
pipeline in Molalla and the proposed LNG terminal in Coos Bay are two options under
recent consideration.
Energy sector companies with co-located facilities can look at joint opportunities to make
ground improvements to mitigate liquefaction.
Energy sector companies should discuss the length of time for restoring services with
critical customers such as water treatment plants. If the projected restoration time is too
long for critical customers, those customers might be encouraged to find other emergency
power sources such as emergency generators with ample fuel supply or alternative energy
sources. Similarly, energy sector companies could discuss the anticipated restoration time
for geographic areas such as along the Oregon coast. It may be prudent to install systems
for emergency electricity purposes in distributed geographic regions expected to have
slower restoration of services, for example, in Coos Bay, Newport, and Astoria.
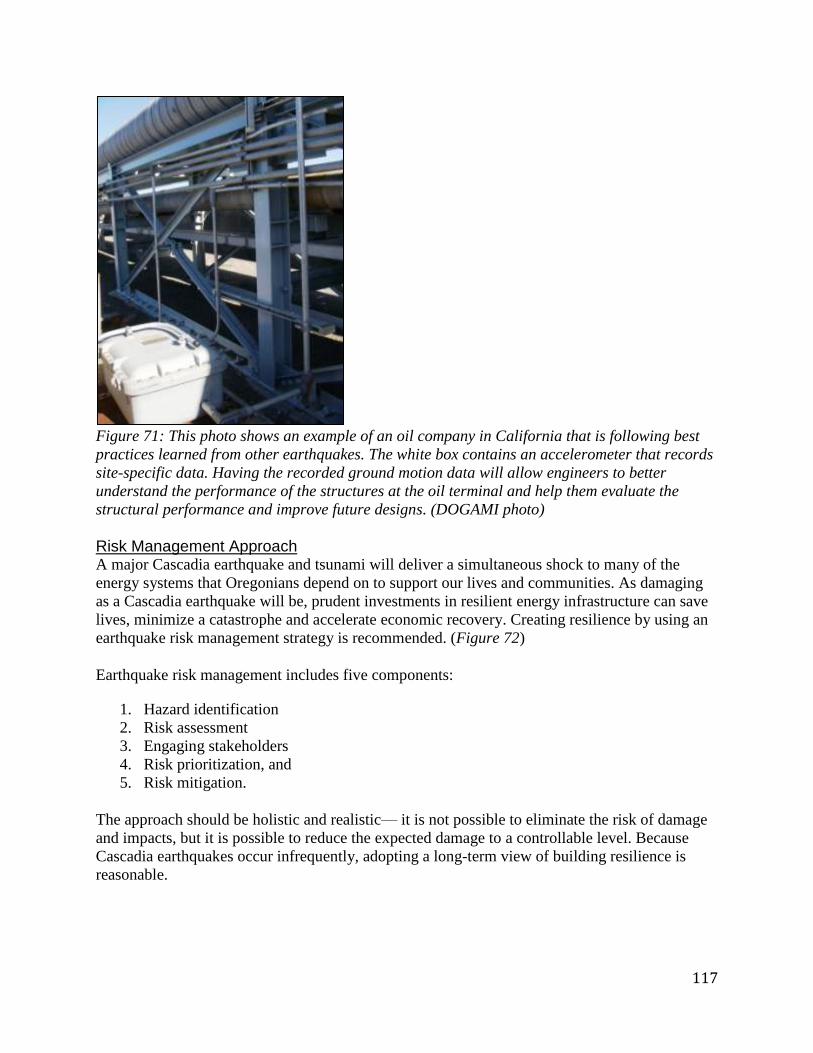
117
Figure 71: This photo shows an example of an oil company in California that is following best
practices learned from other earthquakes. The white box contains an accelerometer that records
site-specific data. Having the recorded ground motion data will allow engineers to better
understand the performance of the structures at the oil terminal and help them evaluate the
structural performance and improve future designs. (DOGAMI photo)
Risk Management Approach A major Cascadia earthquake and tsunami will deliver a simultaneous shock to many of the
energy systems that Oregonians depend on to support our lives and communities. As damaging
as a Cascadia earthquake will be, prudent investments in resilient energy infrastructure can save
lives, minimize a catastrophe and accelerate economic recovery. Creating resilience by using an
earthquake risk management strategy is recommended. (Figure 72)
Earthquake risk management includes five components:
1. Hazard identification
2. Risk assessment
3. Engaging stakeholders
4. Risk prioritization, and
5. Risk mitigation.
The approach should be holistic and realistic— it is not possible to eliminate the risk of damage
and impacts, but it is possible to reduce the expected damage to a controllable level. Because
Cascadia earthquakes occur infrequently, adopting a long-term view of building resilience is
reasonable.
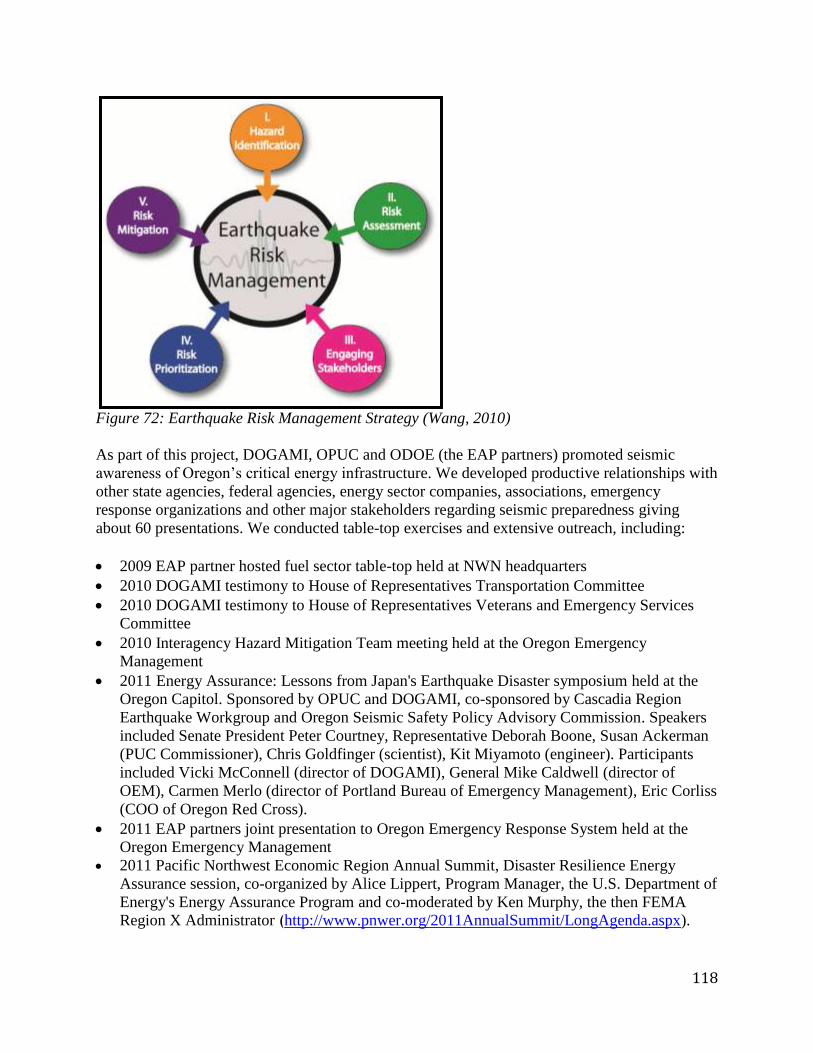
118
Figure 72: Earthquake Risk Management Strategy (Wang, 2010)
As part of this project, DOGAMI, OPUC and ODOE (the EAP partners) promoted seismic
awareness of Oregon’s critical energy infrastructure. We developed productive relationships with
other state agencies, federal agencies, energy sector companies, associations, emergency
response organizations and other major stakeholders regarding seismic preparedness giving
about 60 presentations. We conducted table-top exercises and extensive outreach, including:
2009 EAP partner hosted fuel sector table-top held at NWN headquarters
2010 DOGAMI testimony to House of Representatives Transportation Committee
2010 DOGAMI testimony to House of Representatives Veterans and Emergency Services
Committee
2010 Interagency Hazard Mitigation Team meeting held at the Oregon Emergency
Management
2011 Energy Assurance: Lessons from Japan's Earthquake Disaster symposium held at the
Oregon Capitol. Sponsored by OPUC and DOGAMI, co-sponsored by Cascadia Region
Earthquake Workgroup and Oregon Seismic Safety Policy Advisory Commission. Speakers
included Senate President Peter Courtney, Representative Deborah Boone, Susan Ackerman
(PUC Commissioner), Chris Goldfinger (scientist), Kit Miyamoto (engineer). Participants
included Vicki McConnell (director of DOGAMI), General Mike Caldwell (director of
OEM), Carmen Merlo (director of Portland Bureau of Emergency Management), Eric Corliss
(COO of Oregon Red Cross).
2011 EAP partners joint presentation to Oregon Emergency Response System held at the
Oregon Emergency Management
2011 Pacific Northwest Economic Region Annual Summit, Disaster Resilience Energy
Assurance session, co-organized by Alice Lippert, Program Manager, the U.S. Department of
Energy's Energy Assurance Program and co-moderated by Ken Murphy, the then FEMA
Region X Administrator (http://www.pnwer.org/2011AnnualSummit/LongAgenda.aspx).

119
These efforts were minimal, however, considering the task at hand. In order to build resilience in
Oregon's energy sector, it is necessary to increase awareness on the risk to the energy sector and
Oregonians from a Cascadia earthquake. There needs to be a cultural shift by Oregonians to
become an earthquake preparedness culture. More transparency and accountability in the energy
sector on Cascadia preparedness is required.
Encourage a Culture of Earthquake Preparedness Since the terror attacks in the US on September 11, 2001, Americans have become much more
aware of and supportive of security precautions. Rather than wait for an earthquake disaster to
strike, Oregon should take precautions today and become better prepared.
It is not a question of if a large magnitude Cascadia earthquake will occur, but when it will occur.
This study has demonstrated that Oregon’s CEI Hub is vulnerable to a Cascadia earthquake, and
its failure will impact our supply and sources of liquid fuel, natural gas and electricity throughout
Oregon. Oregonians have experienced gas shortages during the 1970s, and power outages during
winter storms.. Following a Cascadia earthquake, there will likely be no gas available to the
public for a considerable period of time. During a winter storm, power outages last hours to days
long. After a Cascadia earthquake, many Oregonians could be without heat and electrical power
for months.
Oregonians should heed this study’s findings, that:
A Cascadia earthquake will occur.
Oregon’s CEI Hub – where critical energy infrastructure is located in a six-mile stretch
of land – is vulnerable to a Cascadia earthquake. Oregon’s resilience to a Cascadia earthquake is low.
Energy sector companies must adopt best practices and pro-actively integrate seismic
mitigation efforts into their business operations to prepare their facilities and systems to
absorb and recover from a Cascadia earthquake and to sufficiently restore critical
electric, natural gas and liquid fuel services to Oregon homes, businesses and industries
in a reasonable time period.
More stringent oversight on seismic preparedness in the energy sector (liquid fuel,
electricity and natural gas) may be needed. ###
120
Section 8 Acknowledgments
Funding for this project was provided the US Department of Energy (US DOE) under Award
Number #DE-OE0000124 through the Oregon Department of Energy. Alice Lippert of US DOE
was a most helpful supporter and partner. Oregon's Energy Assurance Project (EAP) members
were invaluable partners, including JR Gonzalez (formerly Administrator of Safety, Reliability
and Security Division), Rick Carter, and Immanuel Runnels (intern) from the Public Utility
Commission of Oregon and Deanna Henry, Rebecca O'Neil, Ann Grim and Ken Niles
(administrator, Nuclear Safety Division) from the Oregon Department of Energy. Special thanks
to Deanna Henry and JR Gonzalez for their collaborative leadership role; Rebecca O'Neil for her
project management; and Ann Grim for her invaluable support with technical writing. Support
and guidance was provided by Don Lewis (formerly DOGAMI assistant director).
The report has been developed using a collaborative process and has been reviewed in its
entirety, in sections and in various draft stages by persons according to perspectives and
expertise. The following individuals, who do not necessarily endorse the conclusions or
recommendations, participated in the review process: peer reviews were conducted by the EAP
partners including Deanna Henry, Rebecca O'Neil, JR Gonzalez, and Rick Carter. Ian Madin of
DOGAMI provided detailed review and editing. Peer reviews of the report summary were
conducted by Brad Moyes of KPFF, Allison Pyrch of Shannon and Wilson, Tricia Sears of the
City of Portland (former), and Edward Wolf, independent writer.
We thank the reviewers of the economic interdependency study, which is summarized in Section
3 and included in Appendix A:
Stephanie Chang, Professor, University of British Columbia
Hart Hodges, Professor, College of Business and Economics, Western Washington
University
Adam Rose, Professor, Coordinator for Economics, Center for Risk and Economic
Analysis of Terrorism Events, University of Southern California
Anne Wein, Economist, US Geological Survey
Contributors We received contributions from many organizations and individuals, which have been grouped
as follows: major contributors, federal agencies, state of Oregon, city of Portland, and
organizations and individuals.
Major contributors We thank the personnel from all of the major Oregon energy sector companies in the CEI Hub
who collaborated with us on this project. Please refer to Table 1 to see a list of key individual
contributors.
We received major engineering contributions from organizations and individuals, including from
members of the American Society of Civil Engineers (ASCE) Technical Committee on Lifeline
121
Earthquake Engineering (TCLEE) on engineering specialty topics, including waterfront
structures, liquid fuel facilities including tanks and pipes, electrical systems, and bridges. ASCE
TCLEE members are denoted with an asterisk (*).
Waterfront Structures:
Martin Eskijian, California State Lands MOTEMS Engineering Branch Supervisor (retired 2012)
Kendra Oliver, California State Lands MOTEMS, Senior Engineer, Petroleum Structures
*Allison Pyrch, Shannon and Wilson
Liquid Fuel Facilities, including Tanks and Pipes:
*Tom Cooper, TW Cooper Inc, Consultant
Douglas G. Honegger, D.G. Honegger Consulting, Consultant
*Pete McDonough, Questar, Engineer
Tom O'Rourke, Cornell University, Civil Engineering Professor
*Solomon Tesfamariam, University of British Columbia, Civil Engineering Assistant Professor
Electrical Systems:
*Leon Kempner, Bonneville Power Administration (BPA), Structural Engineer
*John Eidinger, GE Engineering Systems, Consultant
*Anshel Schiff, Precision Measurement Instruments, Consultant
Bridges:
Bruce Johnson, ODOT, State Bridge Engineer
Albert Nako, ODOT, Bridge Engineer
Federal Agencies Bonneville Power Administration (BPA)
Christy Munro, Ryan Egerdahl, Kim Leathley, Thorsten Bartling (formerly BPA), Erik
Westman, Rodney Ross, Mark Jones, and Chris Robinson
Federal Emergency Management Agency (FEMA) Region X
Ken Murphy
National Earthquake Hazards Reduction Program (NEHRP) Advisory Committee on Earthquake
Hazard Reduction (ACEHR)
Chris Poland and Tom O'Rourke
US Army Corps of Engineers
Don Chambers and David Scofield
US Coast Guard
William Clark and John Newcomer from Portland Sector
US Geological Survey (USGS)
Art Frankel, Evelyn Roeloffs, and Woody Savage (retired)

122
US Department of Transportation's Office of Pipelines and Hazardous Materials and Safety
Administration (PHMSA) Western Region Office of Pipeline Safety
Hossein Monfared
State of Oregon Senate President Peter Courtney and Cameron Smith from the Governor's office provided
leadership support.
Oregon Emergency Management (OEM)
General Mike Caldwell, Dave Stuckey, Dennis Sigrist, Althea Rizzo, and John Lewis and
members of the OEM Oregon Emergency Response System (OERS)
Oregon Department of Transportation (ODOT)
Nancy Murphy, Tova Peltz, Amanda Pietz, Jan Six, and Tony Stratis
Public Utility Commission of Oregon (OPUC)
Commissioners Susan Ackerman (Chair), John Savage, and Stephen Bloom
Oregon Seismic Safety Policy Advisory Commission (OSSPAC)
All the members of the commission provided support, in particular, Kent Yu of Degenkolb; Jay
Raskin of Ecola Architects, Bryce Ward of EcoNorthwest, and Stan Watters of Port of Portland.
Oregon Building Codes Division
Richard Rogers and Steve Judson
Oregon State University
Chris Goldfinger and Scott Ashford
Oregon Department of Geology and Mineral Industries (DOGAMI)
Many staff members from DOGAMI including Director Vicki McConnell, Don Lewis (former),
Ian Madin, Bill Burns, Deb Schueller, Tracy Pollock (former), and Geneva Beck
City of Portland Carmen Merlo, Patty Rueter (retired), and Tricia Sears of Portland Bureau of Emergency
Management (PBEM); Amit Kumar and Jason Butler-Brown of Development Services; Grant
Coffey of Portland Fire Department; Teresa Elliott of Water Bureau; and David OLongaigh of
Bureau of Transportation
Organizations and Individuals American Society of Civil Engineers TCLEE members:
Bill Byers, BNSF, civil engineer (retired)
Reggie DesRoche, Georgia Tech University, Civil Engineering Professor
Stephen Dickenson, New Albion Geotechnical Inc, Principal Engineer
Curt Edwards, Psomas, Vice President
Alexis Kwasinski, University of Texas at Austin, Assistant Professor
Nason McCullough, CH2M Hill, Geotechnical Engineer

123
Alex Tang, L&T Consulting, Consultant
Mark Yashinsky, Caltrans, Bridge Engineer
Robert Dalrymple, Civil Engineering Professor, Johns Hopkins University
Dave Dittmer, Port of Portland
Bo Downen, Public Power Commission
Ken Goettel, Goettel and Associates
Seiki Harada, HMC
Brandon Hardenbrook, Deputy Director, Pacific Northwest Economic Region (PNWER)
Mark Koelling of Hayward Baker Inc.
Chuck Meyer, Western Electric Institute (WEI)
Kit Miyamoto of Miyamoto International
John Plechinger, PacifiCorps, Manager, Disaster and Risk Planning
Brett Phillips, PGE, Civil Engineer, Manager of Substation Engineering
Paul Schedler, PGE, Civil Engineer, Substation Engineering
Wayne Schulz, pilot, Citizen Air Patrol
Portland's Local Emergency Planning Committee (LEPC) and Emergency Communications for
Hazardous Operations (ECHO) members provided assistance including John Shaw of Portland
Community College; John C. Ratliff of Kanto Corporation; Brian Bailey, Siltronics, Jan
Secunda; Darise Weller; and Edd Scott. Portland Harbor Community Advisory Group members
provided assistance including Jim Robison, group chair.

124
Section 9 References
AASHTO (2009). Guide Specifications for Load and Resistance Factor Design (LRFD) Seismic
Bridge Design, American Association of State Highway and Transportation Officials,
Washington, D.C.
Ang, Alfredo H-S, Tang, Wilson H., 2007, Probability Concepts in Engineering: Emphasis on
Applications to Civil and Environmental Engineering (v. 1), John Wiley & Sons, Inc.
Barnett, E.A.,Weaver, C.S., Meagher, K.L., Haugerud, R.A., Wang, Z., Madin, I.P., Wang, Y.,
Wells, R.E., Blakely, R.J., Ballantyne, D.B., and M. Darienzo, 2009, Earthquake Hazards of
lifelines along the Interstate 5 Urban Corridor: Woodburn, Oregon, to Centralia, Washington:
U.S. Geological Survey Scientific Investigations Map 3027, 1 sheet.
Barnett, E.A., Weaver, C.S., Meagher, K.L., Haugerud, R.A., Wang, Z., Madin, I.P., Wang, Y.,
Wells, R.E., Blakely, R.J., Ballantyne, D.B., and M. Darienzo, 2009, Earthquake Hazards of
lifelines along the Interstate 5 Urban Corridor: Cottage Grove to Woodburn, Oregon: U.S.
Geological Survey Scientific Investigations Map 3028, 1 sheet. http://pubs.usgs.gov/sim/3028
Beeson, M.H., T.L. Tolan and I. P. Madin, 1991, GMS-75. Geologic map of Portland
quadrangle, Multnomah and Washington Counties., OR and Clark Co., WA, 1:24,000
http://www.oregongeology.org/sub/publications/GMS/gms075.pdf
Bonneville Power Administration (BPA) Liquefaction Assessment BPA Facilities Portland
Metropolitan Region, 2008 (11-5-08 draft report), including 2007 Geomatrix CPT data
Bott, Jacqueline D.J. and Wong, Ivan G., 1993. Historical earthquakes in and around Portland,
Oregon, Oregon Geology, v. 55, Number 5, p.116-122.
Bruneau, M., Filiatrault, A., Lee, G.C., O’Rourke, T.D., Reinhorn, A.M., Shinozuka, M. and
Tierney, K., White Paper on the SDR Grand Challenges for Disaster Reduction,
MCEER_05_SP09, December 2005
Burns, W.J., Mickelson, K.A., Saint-Pierre, E.C., 2011. Statewide Landslide Information
Database of Oregon Release-2, Oregon Department of Geology and Mineral Industries, SLIDO-
2
CH2MHill, June 2006, Geotechnical Data Report, Valero LP Portland Terminal Tank Farm
Expansion Project.
Clark, J., and J. Roddey, 2005, Cascadia subduction zone earthquake: A magnitude 9.0
earthquake scenario, OR, by Cascadia Region Earthquake Workgroup (CREW), published as
Oregon Department of Geology and Mineral Industries: O-05-05. http://www.crew.org/products-
programs
125
Comprehensive Seismic Risk and Vulnerability Study for the State of South Carolina, URS,
September 10, 2001 (33.6 MB, 609 pgs). http://www.scemd.org/images/Plans/eq_study.pdf
Eidinger, JE, and Tang, A, (in press), Wang, Yumei (as contributor) in “Maule Chile earthquake
of February 27, 2010 Lifeline Performance”, ASCE TCLEE monograph 35. Preliminary web
short report:
http://www.asce.org/uploadedFiles/Technical_Groups_and_Institutes/TCLEE/TCLEE%20Preli
minary%202010%20Chile%20EQ%20Report.pdf
Federal Emergency Management Agency, 2002, FEMA 154 report, Rapid Visual Screening of
Buildings for Potential Seismic Hazards: A Handbook, 2nd ed., Available online:
http://www.fema.gov/plan/prevent/earthquake/pdf/fema-154.pdf
Garvey, Paul R., 2008, Analytical Methods for Risk Management: A Systems Engineering
Perspective, CRC Press.
Goldfinger, C., Nelson, C.H., Morey, A.E., Johnson, J.E., Patton, J., Karabanov, E., Gutiérrez-
Pastor, J., Eriksson, A.T., Gràcia, E., Dunhill, G., Enkin, R.J., Dallimore, A., and Vallier, T.,
2012, Turbidite event history—Methods and implications for Holocene paleoseismicity of the
Cascadia subduction zone: U.S. Geological Survey Professional Paper 1661–F, 170 p, 64 figures,
available at http://pubs.usgs.gov/pp/pp1661f/.
Indian Institute of Technology Kanpur; Gujarat State Disaster Management Authority;
November 2007; IITK-GSDMA Guidelines for Seismic Design of Buried Pipelines; Provisions
with Commentary and Explanatory Examples; National Information Center of Earthquake
Engineering. 87 pp.
Itasca Consulting Group, Inc. 2005. FLAC: Fast Lagrangian analysis
of continua: Structural elements, version 5, Itasca Consulting Group, Inc., Minneapolis, Minn.
Kramer, Steven L., 1996, Geotechnical Earthquake Engineering, Prentice Hall, 653 pp.
Mabey, M.A., I. P. Madin, T.L. Youd and C.F. Jones, 1993, Oregon Department of Geology and
Mineral Industries: GMS-79. EQ hazard maps of Portland quad, Multnomah and Washington
Cos., OR and Clark Co., WA, by 98 p., 3 pls., 1:24,000
Mabey, M.A., I. Madin, G. Black and D. Meier, 1996, Oregon Department of Geology and
Mineral Industries GMS-104. Relative EQ hazard map of Linnton quad, Multnomah and
Washington Cos., , 6 p., 1 pl., 1:24,000, 1:55,000
Mabey, M., G. Black, I. Madin, D. Meier, T. L. Youd and C. Jones & B. Rice, 1997, IMS 1,
Relative EQ hazard map of Portland Metro region, Clackamas, Multnomah & Washington Cos.,
OR, Oregon Department of Geology and Mineral Industries 1:62,500, 1:216,000
126
Madin, Ian P. Lina Ma, and Clark A. Niewendorp, 2008, OFR O-08-06 Preliminary Geologic
Map of the Linnton 7.5′ Quadrangle, Multnomah and Washington Counties, Oregon, Oregon
Department of Geology and Mineral Industries
Marine Oil Terminal Engineering and Maintenance Standards (MOTEMS), California Code of
Regulations, Title 24, Part 2, Volume 2 of 2, 2007 California Building Code, Chapter 31F
http://www.slc.ca.gov/Division_Pages/MFD/MOTEMS/MOTEMS_Home_Page.html
National Research Council, 2011, National Earthquake Resilience: Research, Implementation,
and Outreach Committee on National Earthquake Resilience Research, Implementation, and
Outreach; Committee on Seismology and Geodynamics; http://dels.nas.edu/Report/National-
Earthquake-Resilience-Research-Implementation/13092
NIST GCR 97-720, Thomas W. Cooper, A Study of the Performance of Petroleum Storage
Tanks During Earthquakes, 1933-1995
http://www.fire.nist.gov/bfrlpubs/build97/PDF/b97010.pdf
Oregon Building Codes Division: A Summary of Requirements in the State of Oregon, February
7, 2012, Steve Judson
http://www.oregon.gov/OMD/OEM/osspac/docs/history_seismic_codes_or.pdf
Oregon Department of Energy (ODOE) and Public Utility Commission of Oregon, Oregon State
Energy Assurance Plan, March 2011
Oregon Department of Geology and Mineral Industries (DOGAMI), Cascadia Winter 2012: The
2011 Japan earthquake and tsunami: Lessons for the Oregon Coast, 16 p.,
http://www.oregongeology.com/pubs/cascadia/CascadiaWinter2012.pdf
Oregon Department of Geology and Mineral Industries (DOGAMI), Cascadia Winter 2010,
Oregon's earthquake risk and resiliency, 12 p.,
http://www.oregongeology.org/sub/quarpub/CascadiaWinter2010.pdf
Oregon Department of Transportation, Bridge Engineering Section. November 2009. Seismic
Vulnerability of Oregon State Highway Bridges: Mitigation Strategies to Reduce Major Mobility
Risks. Salem, Oregon.
ftp://ftp.odot.state.or.us/Bridge/bridge_website_chittirat/2009_Seismic_Vulnerability_final.pdf
Oregon Department of Transportation, 2012, Oregon Seismic Lifeline Routes Identification
Project, Lifeline Selection Summary Report, Prepared for Oregon Department of Transportation,
May 15, 2012, CH2M Hill, 1100 NE Circle Boulevard Suite 300 Corvallis, OR 97330
Percher, M.I., and W. M. Bruin, 2009, Lessons Learned for the Seismic Assessment of
California Marine Oil Terminals, American Society of Civil Engineers Technical Council on
Lifeline Earthquake Engineering (TCLEE), Proceedings of the 2009 Lifeline Earthquake
Engineering in a Multihazard Environment Conference, June 28-July 1, 2009, Oakland,
California, Edited by Alex K. K. Tang, P.E. and Stu Werner, P.E, pp 951-961.

127
Priest, G., E. Myers, A. Baptista, G. Erdakos and R. Kamphaus, 1999, Tsunami hazard map of
Astoria area, Clatsop Co., OR, Oregon Department of Geology and Mineral Industries, IMS-11,
1:24,000
Priest, George R, Chris Goldfinger, Kelin Wang, Robert C. Witter, Yinglong Zhang, and
Antonio M. Baptista, 2009, Tsunami Hazard Assessment of the Northern Oregon Coast: A
Multi-Deterministic Approach Tested at Cannon Beach, Clatsop County, Oregon, Special Paper
41, Oregon Department of Geology and Mineral Industries.
Rose, A., Oladosu, G. and Liao,S., Business interruption impacts of a terrorist attack on the
electric power system of Los Angeles: Customer resilience to a total blackout, Risk Analysis,
2007, Vol. 27, No. 3, pp 513-531.
R.W.Beck, Distributed Energy Resiliency Study, Report issued on June 29, 2011 for the Oregon
Department of Energy, 148 pp.
Seed R.B., Cetin, K.O., Kammerer, A.M., Wu, J., Pestana, J.M., Riemer, M.F., Sancio, R.B.,
Bray, J.D., Kayen, R.E., and Faris, A., (2003) “Recent Advances in Soil Liquefaction
Engineering: A Unified and Consistent Framework”. 26th
Annual ASCE Los Angeles
Geotechnical Spring Seminar p 2-5
Tierney, K.J., 1994, Business vulnerability and disruption: Data from the 1993 Midwest floods,
41st North American Meetings of the Regional Science Association International, Niagara Falls,
Ontario, November, pp.16-24.
Tierney, K.J. and Nigg, J.M., Business vulnerability due to disaster-related lifeline disruption,
University of Delaware Disaster Research Center Preliminary Paper 223, 1995, 9p.
Tierney, K.J., 1997, Business impacts of the Northridge earthquake, Journal of Contingencies &
Crisis Management, Vol. 5 Issue 2, p87, 11p.
Tierney, Kathleen, and Michel Bruneau, 2007, Conceptualizing and Measuring Resilience, A
Key to Disaster Loss Reduction, Transportation Research Board of the National Academies, TR
NEWS 250 May –June 2007.
U.S. Geological Survey, 2008, Mark D. Petersen, Arthur D. Frankel, Stephen C. Harmsen,
Charles S. Mueller,Kathleen M. Haller, Russell L. Wheeler, Robert L. Wesson, Yuehua Zeng,
Oliver S. Boyd, David M. Perkins, Nicolas Luco, Edward H. Field, Chris J. Wills, and Kenneth
S. Rukstales, Open-File Report 2008–1128, Documentation for the 2008 Update of the United
States National Seismic Hazard Maps.
Wald, D., V. Quitoriano, T. Heaton, and H. Kanamori, 1999, Relationships between peak ground
acceleration, peak ground velocity, and Modified Mercalli Intensity in California, Earthquake
Spectra, 15, 557-564

128
Wang, Y., Weldon, R., and Fletcher, D., 1998, Creating a UBC soil map for Oregon: Oregon
Geology, v. 60, no 4. p. 74-78.
Wang, Y., 1998a, Earthquake risks and mitigation in Oregon, in Burns, S. [ed.] Association of
Engineering Geologists Environmental, Engineering, and Groundwater Geology of Oregon,
Belmont CA, Star Publishing Company, p. 325-342.
Wang, Y., 1998b, Oregon earthquakes- preliminary estimates of damage and loss: Oregon
Geology, v. 60, no 6. p. 123-132.
Wang, Y., 1998c, Earthquake damage and loss estimates for Oregon: Oregon Department of
Geology and Mineral Industries open file report O-98-3, 208 p.
Wang, Y., and Clark, J.L., 1999, Earthquake damage in Oregon, Preliminary estimates of future
earthquake losses: Oregon Department of Geology and Mineral Industries special paper 29, 59 p.
Wang, Y., 1999, Risk assessment and risk management in Oregon, American Society of Civil
Engineers Technical Council on Lifeline Earthquake Engineering for the 5th
U.S. Conference in
Seattle Washington, 10 pp.
Wang, Y., 2008, “Cascadia’s Multi-Hazard Environment,” Proceedings for 14th
World
Conference on Earthquake Engineering, October 12-17, 2008, Beijing, China.
Wang, Y., and Gonzalez, JR., 2008, “Oregon Public Utilities Commission–Oregon Department
of Geology and Mineral Industries Leadership Forum and Seismic Critical Energy
Infrastructures Workshop”, April 2, 2008, Oregon Department of Geology and Mineral
Industries, O-08-10.
Wang, Yumei, 2010a, “Tsunami Evacuation Building Workshop, September 28-29, 2009,
Cannon Beach, Seaside, and Portland, Oregon,” Oregon Department of Geology and Mineral
Industries, DOGAMI Open-File Report O-10-02, on CD.
Wang, Yumei, 2010b, “Earthquake Risk Management Approaches for Civic and Critical Lifeline
Infrastructure: Applications in Oregon,” Proceedings to China-USA Symposium for the
Advancement of Earthquake Sciences and Hazard Mitigation Practices, Beijing & Mianyang,
China.
Western Electric Coordinating Council, 2012, Map of Principal Transmission Lines, January 1,
2012. http://www.wecc.biz/library/Pages/Interconnection%20Maps.aspx
Witter, R, 2008, Prehistoric Cascadia Tsunami Inundation and Run up at Cannon Beach, Clatsop
County, Oregon, Open-File Report O-08-12, Oregon Department of Geology and Mineral
Industries.
Witter, Robert C., Yinglong Zhang, Kelin Wang, George R. Priest, Chris Goldfinger, Laura L.
Stimely, John T. English, and Paul A. Ferro, 2011, Special Paper 43, Simulating tsunami
129
inundation at Bandon, Coos County, Oregon, using hypothetical Cascadia and Alaska earthquake
scenarios, Oregon Department of Geology and Mineral Industries, 57 p.
Wong, I., Silva, W., Bott, J., Wright, D., Thomas, P., Gregor, N., Li, S., Mabey, M., Sojourner,
A., and Wang, Y., 2000, Earthquake scenario and probabilistic ground shaking maps for the
Portland, Oregon, metropolitan area. Portland Hills fault M 6.8 earthquake, peak horizontal
acceleration (g) at the ground surface: Oregon Department of Geology and Mineral Industries
Interpretive Map Series IMS-15 and 16, 12 map sheets, scale 1:62,500
Youd, T.L., Chung, R.M., and Harp, E.L., 1995, “Liquefaction and other geotechnical effects,”
Hokkaido-Nansei-Oki Earthquake and Tsunami of July 12, 1993 Reconnaissance Report,
Earthquake Spectra, EERI, Vol. 11, Sup. A, p. 49-94.
Youd, T. L., Hansen, C. M., Bartlett S. F., 2002, “Revised Multilinear Regression Equations for
Prediction of Lateral Spread Displacement,” Journal of Geotechnical and Geoenvironmental
Engineering, ASCE, December 2002, pp. 1007-1017.
130
Section 10 Appendices
A Oregon Economic Interdependency Assessment of the Energy Sector
B Lateral Spreading Sensitivity Study
C Telecommunications: Seismic Codes and Guidelines

131
Appendix A Oregon Economic Interdependency Assessment of the Energy Sector
Scott B. Miles, Associate Professor, and Alexis Blue, Graduate Student, Resilience Institute,
Western Washington University
The goal of the study included in this appendix was determine the economic interdependencies
of Oregon’s energy infrastructure with itself, broader critical infrastructure, and Oregon’s
commercial economy. This study characterizes critical infrastructure and commercial economy
for the entire state at a county resolution. Characterizing the interdependencies quantitatively
facilitates the general understanding of potential economic ripple effects of earthquake-induced
disruption of energy infrastructure on the State of Oregon. The primary task of the study was to
model the effects of lower sales of electricity, fuel and natural gas -- the three Oregon Energy
Assurance sectors –to other critical infrastructure industries and the rest of Oregon’s economy.
Limitations in this study approach are discussed in the analysis overview.
The objectives of this study were the following:
1. Aggregate industries to represent energy and critical infrastructure sectors to characterize
the interdependencies of power, natural gas, and fuel industries with other critical
infrastructure industries, and Oregon’s commercial economy
2. Develop an energy infrastructure-focused input-output table for the State of Oregon
3. Analyze the economic impacts of financial loss within the created energy infrastructure
sectors for a range of energy infrastructure financial loss scenarios
Analysis Overview
The study used input-output analysis to understand economic interdependencies between energy
infrastructure sectors and other sectors, as well as to estimate economic impacts of various
energy infrastructure financial loss scenarios. The financial loss scenarios are used as a rough
proxy for energy infrastructure disruption. The analysis described below does not model physical
infrastructure disruption or cascading functional impacts.
The software tool and data set called IMPLAN by MIG Inc., was used to conduct the input-
output analysis of this study (http://implan.com/). IMPLAN data is a compilation of data for
describing employment, employee compensation, proprietary income, other property income,
indirect business taxes, output, inter-institutional transfers, and household and government
purchases. For this study, the data is reported at the state level, even though the data is available
at a finer resolution. IMPLAN was used to model the impact of negative sales as a proxy for
infrastructure disruption. IMPLAN models how this loss of sales and jobs flows back through
inter-industry purchasing.
Interdependency Assessment
The interdependency assessment was conducted using the 2008 IMPLAN database (the latest
dataset available at the time of the study) with no additional or modified data. IMPLAN data
describes 440 North American Industry Classification System (NAICS) industry classes in the
dataset. The 440 NAICS industries were aggregated into 19 sectors for the purpose of this
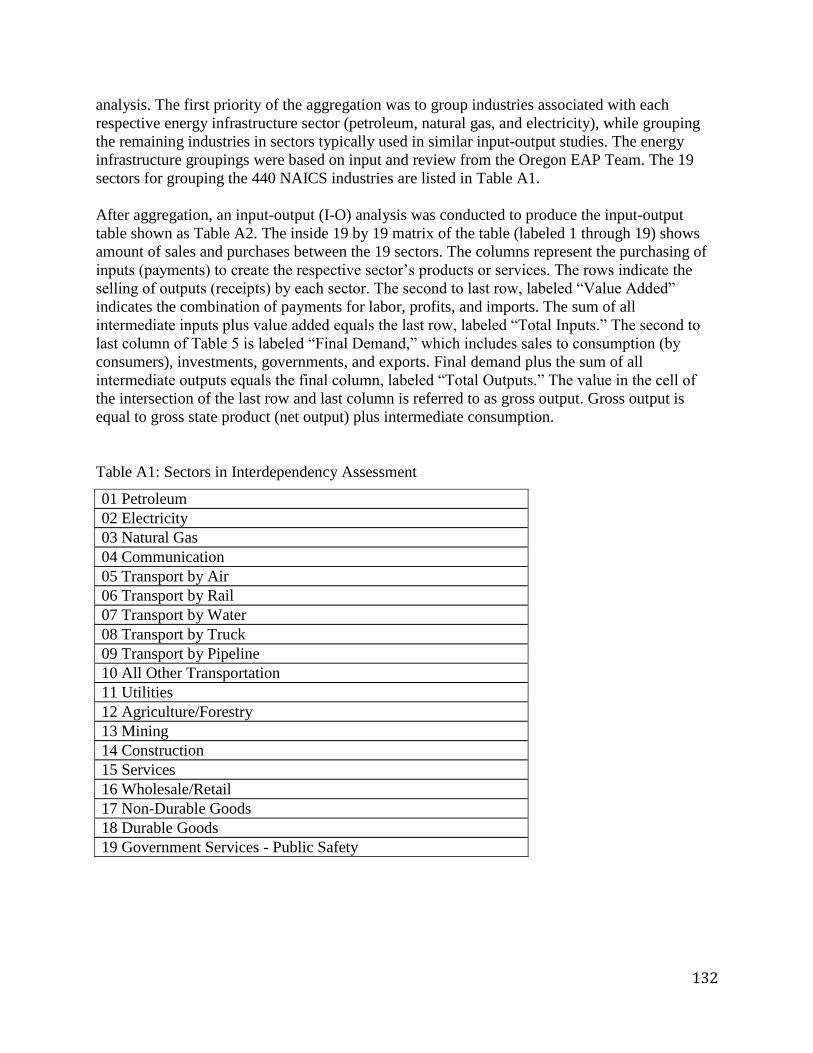
132
analysis. The first priority of the aggregation was to group industries associated with each
respective energy infrastructure sector (petroleum, natural gas, and electricity), while grouping
the remaining industries in sectors typically used in similar input-output studies. The energy
infrastructure groupings were based on input and review from the Oregon EAP Team. The 19
sectors for grouping the 440 NAICS industries are listed in Table A1.
After aggregation, an input-output (I-O) analysis was conducted to produce the input-output
table shown as Table A2. The inside 19 by 19 matrix of the table (labeled 1 through 19) shows
amount of sales and purchases between the 19 sectors. The columns represent the purchasing of
inputs (payments) to create the respective sector’s products or services. The rows indicate the
selling of outputs (receipts) by each sector. The second to last row, labeled “Value Added”
indicates the combination of payments for labor, profits, and imports. The sum of all
intermediate inputs plus value added equals the last row, labeled “Total Inputs.” The second to
last column of Table 5 is labeled “Final Demand,” which includes sales to consumption (by
consumers), investments, governments, and exports. Final demand plus the sum of all
intermediate outputs equals the final column, labeled “Total Outputs.” The value in the cell of
the intersection of the last row and last column is referred to as gross output. Gross output is
equal to gross state product (net output) plus intermediate consumption.
Table A1: Sectors in Interdependency Assessment
01 Petroleum
02 Electricity
03 Natural Gas
04 Communication
05 Transport by Air
06 Transport by Rail
07 Transport by Water
08 Transport by Truck
09 Transport by Pipeline
10 All Other Transportation
11 Utilities
12 Agriculture/Forestry
13 Mining
14 Construction
15 Services
16 Wholesale/Retail
17 Non-Durable Goods
18 Durable Goods
19 Government Services - Public Safety

133
Table A2: Baseline Inputs-Outputs for Interdependency Assessment
Outputs (Payments, $ Millions)
Inputs (Receipts, $ Millions) 01 02 03 04 05 06 07 08 09 10 11 12 13 14 15 16 17 18 19
Final
Demand Total
01 Petroleum 11.9 40.5 29.0 1.4 14.5 2.7 0.0 19.4 0.1 11.2 0.0 21.1 0.3 31.6 27.7 11.9 43.5 14.4 11.8 236.8 530.0
02 Electricity 3.2 4.5 35.6 19.7 0.9 0.3 2.6 6.7 0.0 13.5 0.1 106.5 15.9 74.0 1035.9 328.4 303.6 621.7 23.0 2356.4 4952.5
03 Natural Gas 7.8 2.2 11.4 19.6 0.1 0.0 1.2 2.3 0.0 9.2 0.3 30.9 9.4 24.3 239.7 45.2 301.4 431.5 57.3 433.7 1627.6
04 Communication 0.6 8.0 0.9 1240.5 11.2 0.9 2.3 18.9 0.0 11.5 0.3 5.7 0.7 137.4 1672.8 261.4 59.8 239.9 7.3 3407.3 7087.3
05 Transport by Air 0.2 2.0 0.4 12.5 0.1 0.2 0.7 5.1 0.0 10.3 0.0 2.5 0.1 15.8 159.9 23.1 23.7 67.4 1.0 886.7 1211.6
06 Transport by Rail 0.7 74.7 1.8 2.1 0.4 2.5 0.1 25.7 0.0 7.9 0.0 25.0 5.5 20.3 26.7 4.5 113.3 175.1 2.9 364.6 853.9
07 Transport by Water 0.2 3.3 0.4 0.3 1.7 0.4 0.0 2.1 0.0 6.4 0.0 15.0 0.5 8.7 41.9 1.4 29.7 27.9 1.1 386.3 527.3
08 Transport by Truck 1.7 14.5 2.5 11.1 2.8 3.7 3.4 129.8 0.0 17.1 0.1 95.5 8.2 202.8 255.5 156.0 334.7 649.1 22.0 1493.0 3403.6
09 Transport by Pipeline 0.1 3.4 2.8 0.0 0.1 0.0 0.0 0.2 0.0 0.0 0.0 0.0 0.0 0.2 0.1 0.1 0.3 0.1 0.7 2.8 11.1
10 All Other Transportation 0.3 6.9 0.8 40.3 89.6 11.8 76.3 231.5 0.0 69.9 0.1 2.4 1.1 10.8 807.4 604.4 20.5 62.0 9.7 1139.9 3185.8
11 Utilities 0.1 14.8 0.3 6.1 0.1 0.2 1.8 0.6 0.0 14.5 0.0 34.2 0.1 11.7 155.2 18.3 22.6 38.4 36.8 -296.1 59.8
12 Agriculture/Forestry 0.4 0.3 2.0 0.0 0.0 0.0 0.0 0.0 0.0 0.0 0.0 1774.4 1.5 41.0 107.6 20.1 1955.3 284.5 0.1 6096.5 10283.8
13 Mining 0.2 79.1 1.2 0.9 0.0 0.1 0.0 0.0 0.0 0.0 0.0 5.1 14.4 23.0 6.4 0.1 14.2 103.2 3.7 316.7 568.1
14 Construction 7.2 99.1 1.2 47.2 0.3 27.9 0.0 2.1 0.2 13.2 4.0 24.5 0.0 13.4 856.6 70.8 69.2 163.5 172.9 17016.0 18589.2
15 Services 41.0 329.9 54.4 1480.5 146.4 128.0 77.9 365.6 0.8 285.1 6.8 693.6 48.1 2343.2 29237.8 5486.9 2339.6 6725.0 541.9 74279.8 124612.2
16 Wholesale/Retail 8.4 20.5 10.2 49.8 12.4 11.0 2.2 75.1 0.1 32.1 0.2 256.5 7.1 1389.2 1356.4 895.1 1294.3 3733.1 43.9 23784.7 32982.3
17 Non-Durable Goods 5.6 4.4 7.4 32.2 0.5 1.3 0.8 10.7 0.0 9.5 0.0 400.3 2.3 170.3 1158.4 178.4 2266.0 907.6 18.9 17469.5 22644.2
18 Durable Goods 3.5 16.5 6.9 80.2 10.2 13.5 23.1 24.7 0.1 27.0 0.2 32.1 7.3 1109.2 612.1 124.0 234.8 5732.0 62.1 49927.9 58047.3
19 Government Services - Public Safety 0.0 0.0 0.1 5.1 0.0 0.0 0.0 0.3 0.0 5.2 0.0 0.2 0.0 0.0 140.3 9.8 11.1 16.5 42.4 19346.4 19577.5
Value Added 436.8 4227.8 1458.4 4037.9 920.3 649.4 334.7 2482.7 9.8 2642.3 47.5 6758.4 445.9 12962.2 86713.8 24742.3 13206.6 38054.3 18518.0
Total 530.0 4952.5 1627.6 7087.3 1211.6 853.9 527.3 3403.6 11.1 3185.8 59.8 10283.8 568.1 18589.2 124612.2 32982.3 22644.2 58047.3 19577.5 310755.2
Note: * Value Added = Employee Compensation + Proprietor Income + Indirect Business Taxes + Other Property Type Income
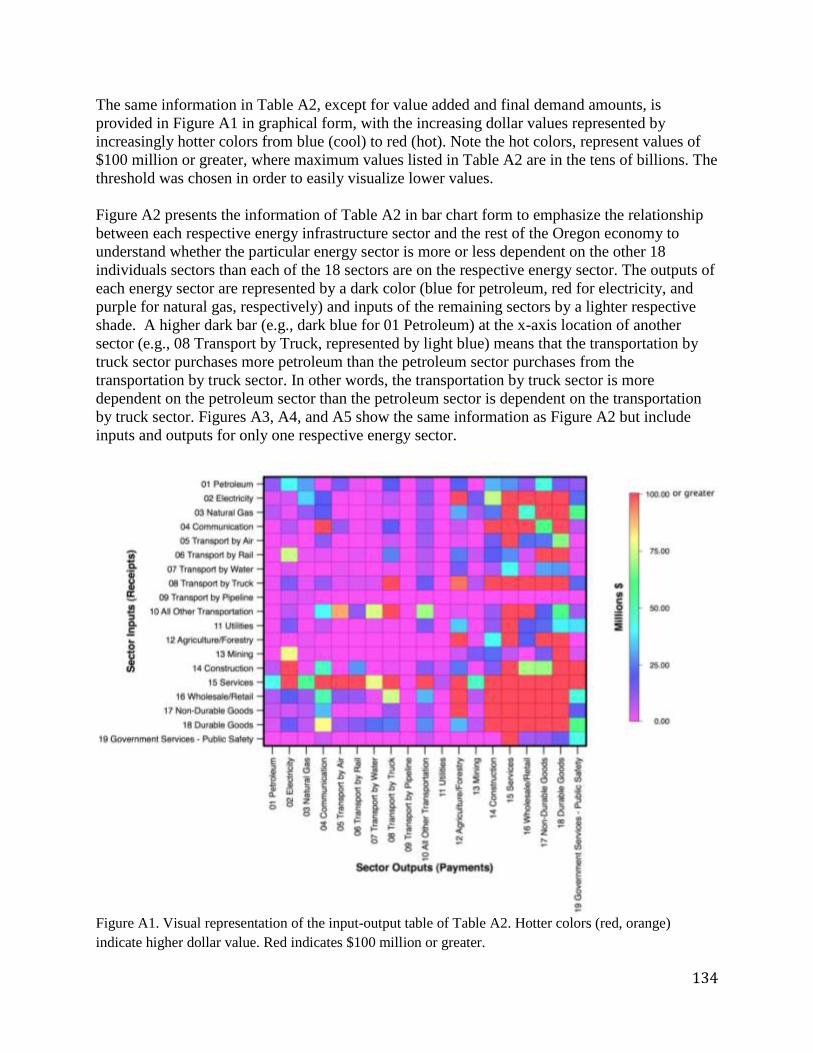
134
The same information in Table A2, except for value added and final demand amounts, is
provided in Figure A1 in graphical form, with the increasing dollar values represented by
increasingly hotter colors from blue (cool) to red (hot). Note the hot colors, represent values of
$100 million or greater, where maximum values listed in Table A2 are in the tens of billions. The
threshold was chosen in order to easily visualize lower values.
Figure A2 presents the information of Table A2 in bar chart form to emphasize the relationship
between each respective energy infrastructure sector and the rest of the Oregon economy to
understand whether the particular energy sector is more or less dependent on the other 18
individuals sectors than each of the 18 sectors are on the respective energy sector. The outputs of
each energy sector are represented by a dark color (blue for petroleum, red for electricity, and
purple for natural gas, respectively) and inputs of the remaining sectors by a lighter respective
shade. A higher dark bar (e.g., dark blue for 01 Petroleum) at the x-axis location of another
sector (e.g., 08 Transport by Truck, represented by light blue) means that the transportation by
truck sector purchases more petroleum than the petroleum sector purchases from the
transportation by truck sector. In other words, the transportation by truck sector is more
dependent on the petroleum sector than the petroleum sector is dependent on the transportation
by truck sector. Figures A3, A4, and A5 show the same information as Figure A2 but include
inputs and outputs for only one respective energy sector.
Figure A1. Visual representation of the input-output table of Table A2. Hotter colors (red, orange)
indicate higher dollar value. Red indicates $100 million or greater.
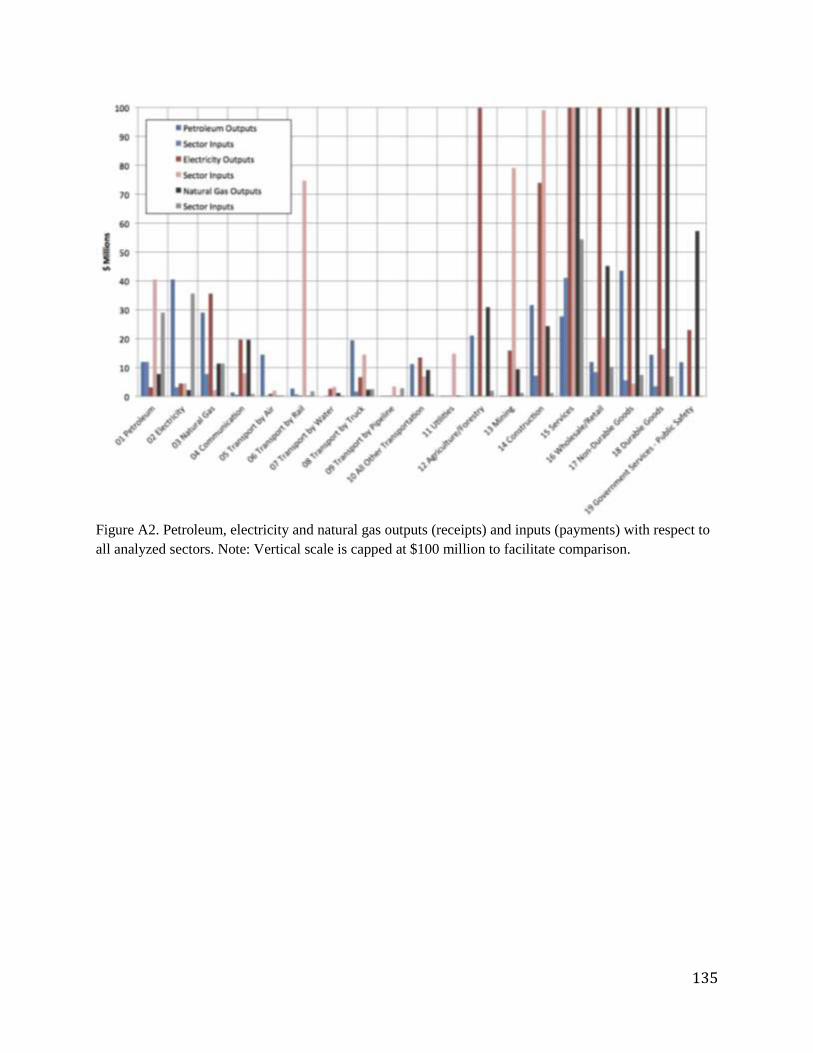
135
Figure A2. Petroleum, electricity and natural gas outputs (receipts) and inputs (payments) with respect to
all analyzed sectors. Note: Vertical scale is capped at $100 million to facilitate comparison.
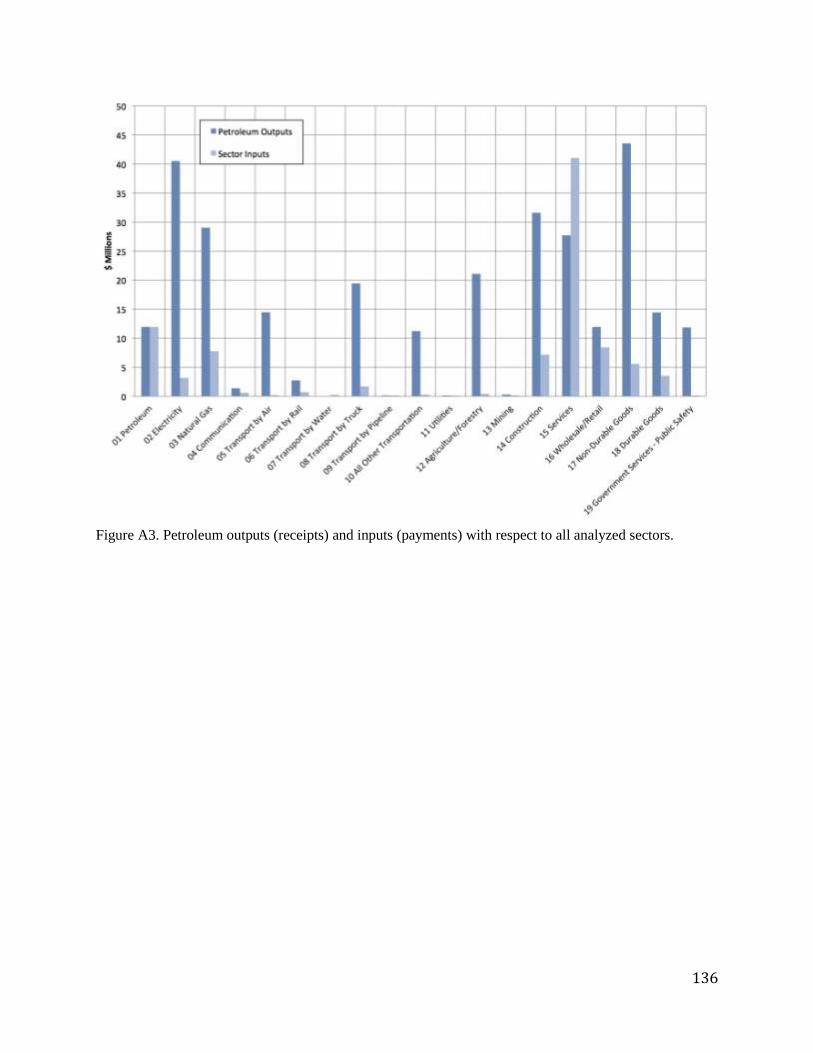
136
Figure A3. Petroleum outputs (receipts) and inputs (payments) with respect to all analyzed sectors.

137
Figure A4. Electricity outputs (receipts) and inputs (payments) with respect to all analyzed sectors.
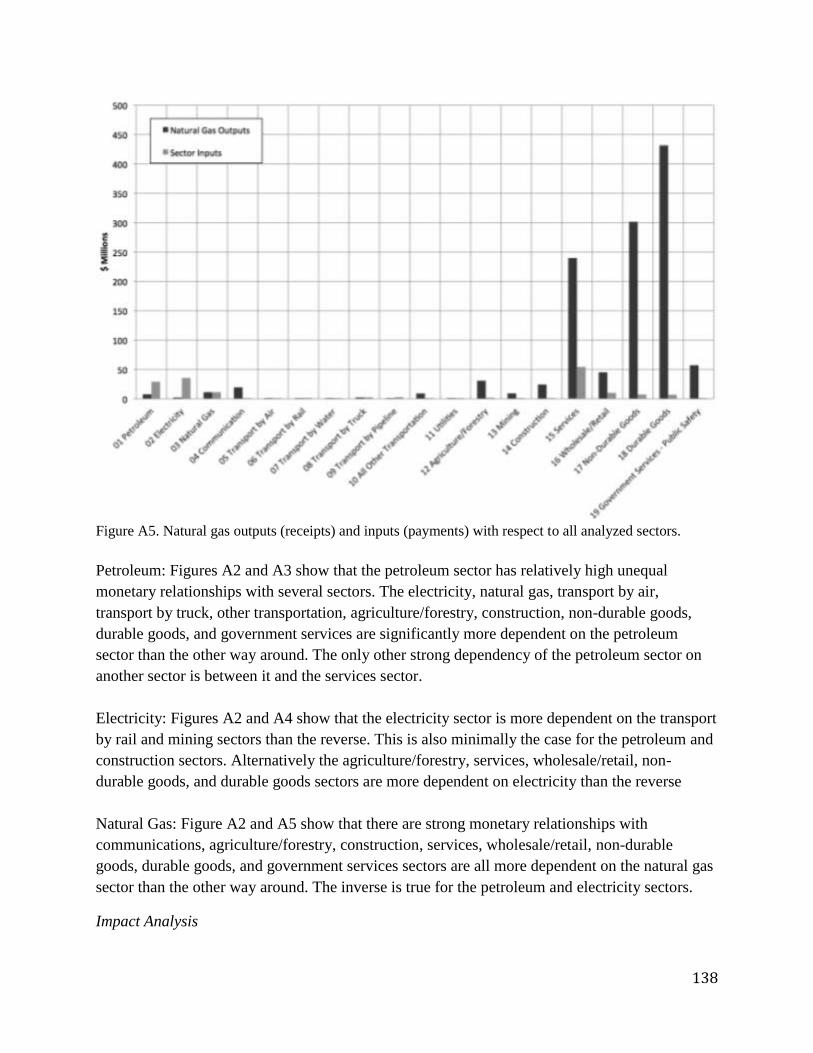
138
Figure A5. Natural gas outputs (receipts) and inputs (payments) with respect to all analyzed sectors.
Petroleum: Figures A2 and A3 show that the petroleum sector has relatively high unequal
monetary relationships with several sectors. The electricity, natural gas, transport by air,
transport by truck, other transportation, agriculture/forestry, construction, non-durable goods,
durable goods, and government services are significantly more dependent on the petroleum
sector than the other way around. The only other strong dependency of the petroleum sector on
another sector is between it and the services sector.
Electricity: Figures A2 and A4 show that the electricity sector is more dependent on the transport
by rail and mining sectors than the reverse. This is also minimally the case for the petroleum and
construction sectors. Alternatively the agriculture/forestry, services, wholesale/retail, non-
durable goods, and durable goods sectors are more dependent on electricity than the reverse
Natural Gas: Figure A2 and A5 show that there are strong monetary relationships with
communications, agriculture/forestry, construction, services, wholesale/retail, non-durable
goods, durable goods, and government services sectors are all more dependent on the natural gas
sector than the other way around. The inverse is true for the petroleum and electricity sectors.
Impact Analysis
139
A suite of scenarios was developed to estimate the impacts of reduced levels of energy sector
products being purchased over the course of one year (in this case 2008, the most recent year
available for IMPLAN) as an approximate proxy for energy infrastructure loss. The impact
analysis does not model the impact of physical or functional loss of the energy infrastructure,
only loss of purchases of sector goods and services. The analysis also does not represent when
within the year loss in purchases occurs. The results of the analysis are only representative of
purchases loss within the year and don’t include any losses in subsequent years. The scenarios
analyzed using IMPLAN are summarized in Table A3. The values in Table A3 are percent
reduction in purchases. In order to avoid divide by zero errors in IMPLAN, zero was
approximated using a value close to zero. Table A4 lists, in the second column, the total output
when each energy infrastructure sector purchases are normal (based on 2008 data in IMPLAN),
which represents no hazard impact. The remaining columns to the right show the reduction in
output for 75 percent, 50 percent, 25 percent and 0 percent of normal purchase levels to
approximate hazard impacts.
Input-output analysis has some associated limitations in modeling economic impacts. For this
particular application, again, input-output modeling does not model functional relationships of
infrastructure. The loss modeled is financial in the form of reduced purchases of some good or
product – in this case related to an energy infrastructure sector. Changes in inputs and, thus,
outputs cannot be represented at any temporal resolution less than a year. Data for input-output
analysis are only available a few years after the year the data describes. (In this case, the most
recent data available are for 2008.) No consideration is made within the analysis for price effects,
substitutions, or economies of scale. A basic input-output model, such as used here, is a demand-
side model and so assumes that supplies are infinite. As a result, the absolute and relative
financial relationships of purchases (inputs) and receipts (outputs) are reliable. The limitations in
the context of modeling the influence of supply disruptions (such as a reduction of energy
infrastructure service in a disaster) will results in significant under-estimation of actual loss. The
predicted loss should be considered a lower-bound. Due to limitations of this interdependency
model, the actual losses could be orders of magnitude higher because of supply-side and
functional dependencies.
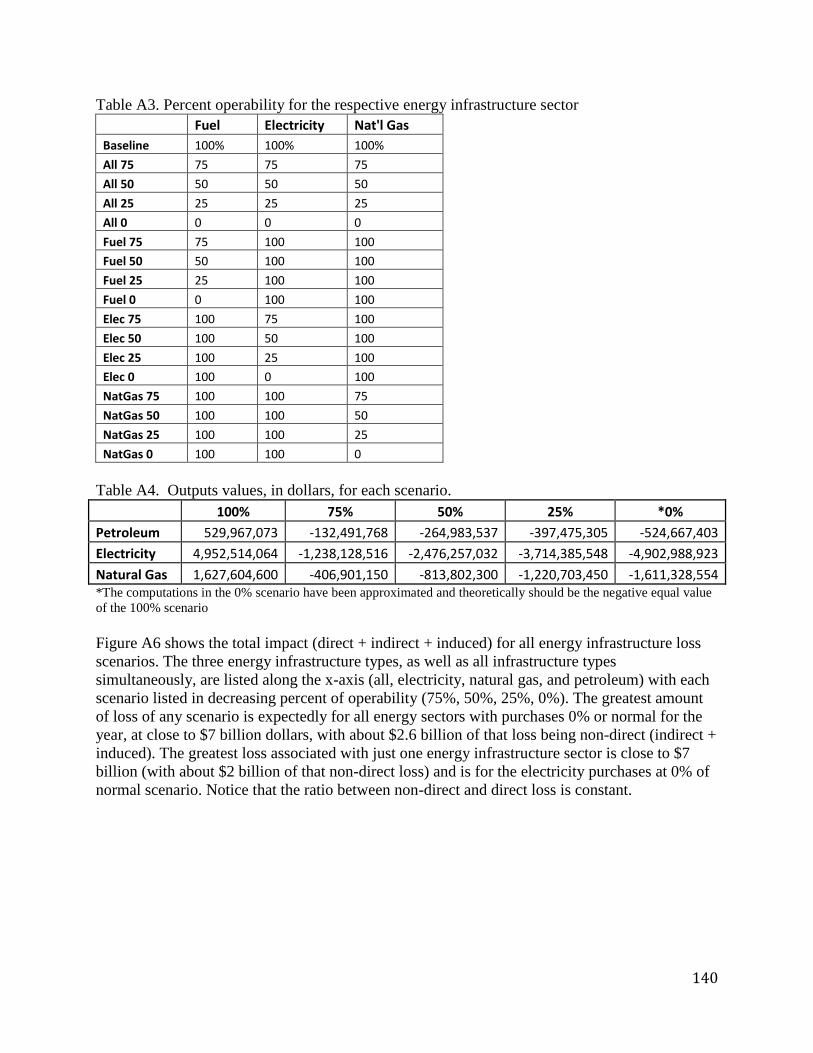
140
Table A3. Percent operability for the respective energy infrastructure sector
Fuel Electricity Nat'l Gas Baseline 100% 100% 100%
All 75 75 75 75
All 50 50 50 50
All 25 25 25 25
All 0 0 0 0
Fuel 75 75 100 100
Fuel 50 50 100 100
Fuel 25 25 100 100
Fuel 0 0 100 100
Elec 75 100 75 100
Elec 50 100 50 100
Elec 25 100 25 100
Elec 0 100 0 100
NatGas 75 100 100 75
NatGas 50 100 100 50
NatGas 25 100 100 25
NatGas 0 100 100 0
Table A4. Outputs values, in dollars, for each scenario.
100% 75% 50% 25% *0%
Petroleum 529,967,073 -132,491,768 -264,983,537 -397,475,305 -524,667,403
Electricity 4,952,514,064 -1,238,128,516 -2,476,257,032 -3,714,385,548 -4,902,988,923
Natural Gas 1,627,604,600 -406,901,150 -813,802,300 -1,220,703,450 -1,611,328,554 *The computations in the 0% scenario have been approximated and theoretically should be the negative equal value
of the 100% scenario
Figure A6 shows the total impact (direct + indirect + induced) for all energy infrastructure loss
scenarios. The three energy infrastructure types, as well as all infrastructure types
simultaneously, are listed along the x-axis (all, electricity, natural gas, and petroleum) with each
scenario listed in decreasing percent of operability (75%, 50%, 25%, 0%). The greatest amount
of loss of any scenario is expectedly for all energy sectors with purchases 0% or normal for the
year, at close to $7 billion dollars, with about $2.6 billion of that loss being non-direct (indirect +
induced). The greatest loss associated with just one energy infrastructure sector is close to $7
billion (with about $2 billion of that non-direct loss) and is for the electricity purchases at 0% of
normal scenario. Notice that the ratio between non-direct and direct loss is constant.
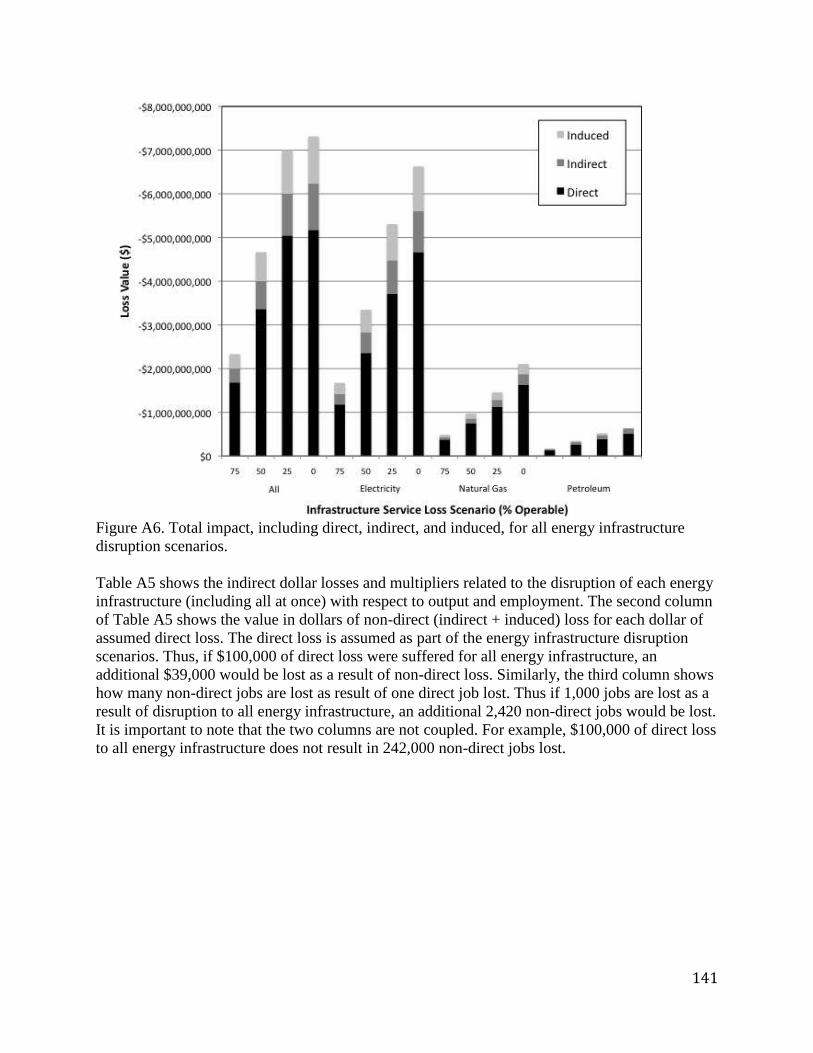
141
Figure A6. Total impact, including direct, indirect, and induced, for all energy infrastructure
disruption scenarios.
Table A5 shows the indirect dollar losses and multipliers related to the disruption of each energy
infrastructure (including all at once) with respect to output and employment. The second column
of Table A5 shows the value in dollars of non-direct (indirect + induced) loss for each dollar of
assumed direct loss. The direct loss is assumed as part of the energy infrastructure disruption
scenarios. Thus, if $100,000 of direct loss were suffered for all energy infrastructure, an
additional $39,000 would be lost as a result of non-direct loss. Similarly, the third column shows
how many non-direct jobs are lost as result of one direct job lost. Thus if 1,000 jobs are lost as a
result of disruption to all energy infrastructure, an additional 2,420 non-direct jobs would be lost.
It is important to note that the two columns are not coupled. For example, $100,000 of direct loss
to all energy infrastructure does not result in 242,000 non-direct jobs lost.
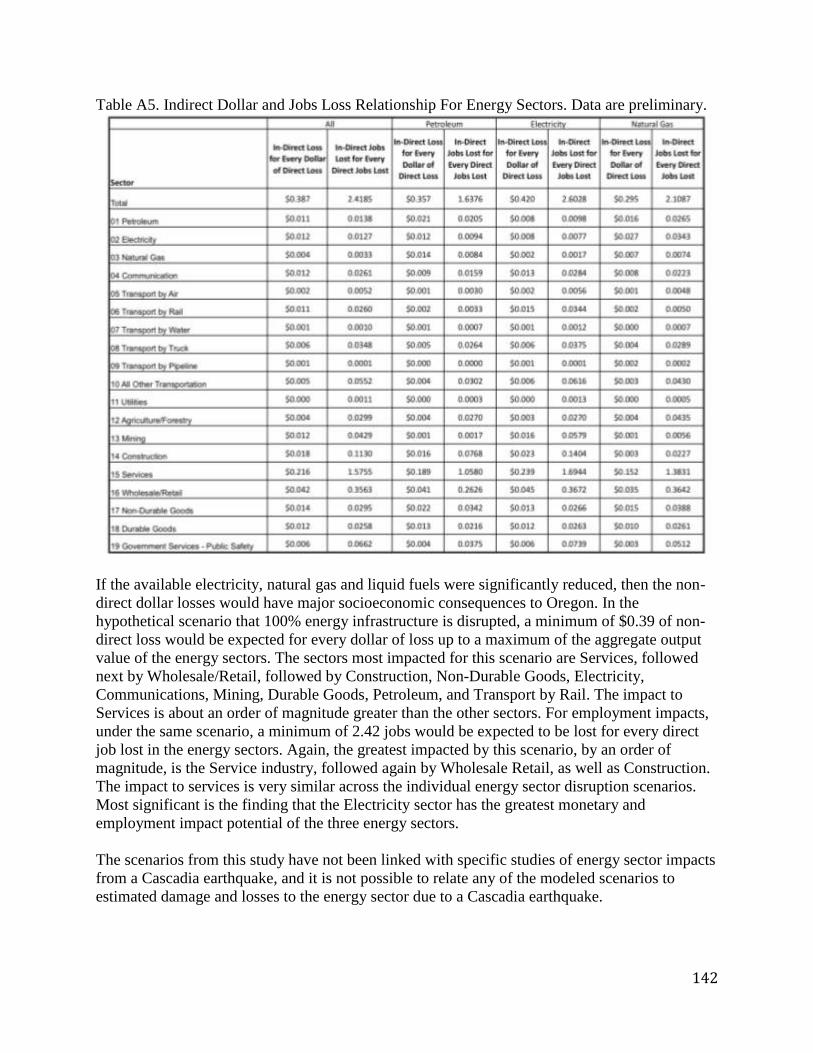
142
Table A5. Indirect Dollar and Jobs Loss Relationship For Energy Sectors. Data are preliminary.
If the available electricity, natural gas and liquid fuels were significantly reduced, then the non-
direct dollar losses would have major socioeconomic consequences to Oregon. In the
hypothetical scenario that 100% energy infrastructure is disrupted, a minimum of $0.39 of non-
direct loss would be expected for every dollar of loss up to a maximum of the aggregate output
value of the energy sectors. The sectors most impacted for this scenario are Services, followed
next by Wholesale/Retail, followed by Construction, Non-Durable Goods, Electricity,
Communications, Mining, Durable Goods, Petroleum, and Transport by Rail. The impact to
Services is about an order of magnitude greater than the other sectors. For employment impacts,
under the same scenario, a minimum of 2.42 jobs would be expected to be lost for every direct
job lost in the energy sectors. Again, the greatest impacted by this scenario, by an order of
magnitude, is the Service industry, followed again by Wholesale Retail, as well as Construction.
The impact to services is very similar across the individual energy sector disruption scenarios.
Most significant is the finding that the Electricity sector has the greatest monetary and
employment impact potential of the three energy sectors.
The scenarios from this study have not been linked with specific studies of energy sector impacts
from a Cascadia earthquake, and it is not possible to relate any of the modeled scenarios to
estimated damage and losses to the energy sector due to a Cascadia earthquake.
143
Improving the energy sector's resilience to major disasters, in particular a Cascadia earthquake
would require mitigation actions to reduce the restoration time of energy services. The total
impact from a disaster to the energy sector would include the direct damage to the energy
facilities, the loss of sales (such as by amounts as shown in the scenarios), non-direct losses and
non-direct job losses (as shown in Table A5), and a multitude of cascading functional impacts,
which would also potentially have economic impacts of their own.
Comparison with Other Studies
After the Northridge earthquake, Tierney (1997) found that after debris clean up, loss of
electricity was the most commonly cited reason for business closure (Table A6). The most
significant impacts were seen in the finance, insurance, and real estate industries (FIRE;
classified as services in the current study) and construction. FIRE services were also impacted
the most in the current study on Oregon energy disruption. In a study by Tierney and Nigg
(1995) comparing the dependency of businesses to five types of infrastructure between
Memphis, TN and Des Moines, IA with respect to potential (Memphis; earthquake disruption)
and actual (Des Moines; 1993 Midwest floods) disruption. Table A7 (Des Moines) and Table A8
(Memphis) shows the results of that study. In both cases, businesses depend most on electricity,
while depending on natural gas third most. Lastly, in the study of the business impacts from the
1993 Midwest floods, Tierney (1994) wrote the following, which provides further insight into
the importance of energy infrastructure amongst other required business resources and the
impacts of the services sector (FIRM) from these disruptions:
Overall, electricity was rated as the most critical lifeline service by both large and small
businesses, with the former considering electric service more important than the latter.
Large manufacturing and construction firms and both large and small companies in the
finance, insurance, and real estate sectors were more likely than other businesses to rate
electricity as critical to their operations. While small businesses generally considered
telephone service to be the second most critical lifeline, large businesses appeared to
view telephones, water, sewer service, and natural gas as equally critical.
A study by Rose et al. (2007) on the economic impacts of electricity outage due to a terrorist
attack on Los Angeles, CA found that the services sector was most impacted by a significant
margin. This is not surprising as the input-output analysis found that services and manufacturing
are the two main business users of electricity.
None of the above studies included direct dependence on liquid fuel. Looking at Table A6, one
could conjecture that a few factors leading to business closure are related to lack of access to
liquid fueling, putting disruption of fuel near the top of the factors. Even so, what studies have
been done confirm the general validity of the findings of the current study and the importance of
resilient infrastructure, as well as the significant economic impact that would arise due to energy
disruption from a Cascadia earthquake in Oregon. The general lack of studies of the dependence
of and impacts to businesses from energy infrastructure disruption suggests the importance and
innovation of this study.
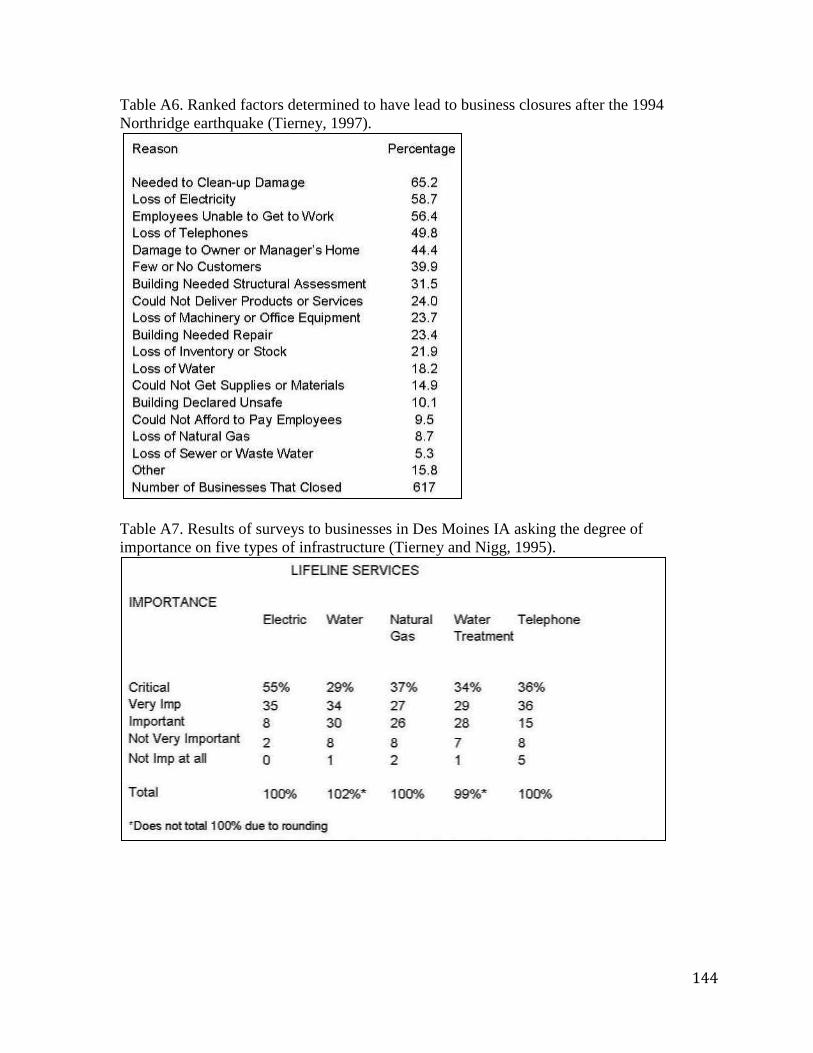
144
Table A6. Ranked factors determined to have lead to business closures after the 1994
Northridge earthquake (Tierney, 1997).
Table A7. Results of surveys to businesses in Des Moines IA asking the degree of
importance on five types of infrastructure (Tierney and Nigg, 1995).

145
Table A8. Results of surveys to businesses in Memphis, TN asking the degree of
importance on five types of infrastructure (Tierney and Nigg, 1995).
References Rose, A., Oladosu, G. and Liao, S., Business interruption impacts of a terrorist attack on the
electric power system of Los Angeles: Customer resilience to a total blackout, Risk Analysis,
2007, Vol. 27, No. 3, pp 513-531.
Tierney, K.J., Business impacts of the Northridge earthquake, Journal of Contingencies & Crisis
Management, 1997, Vol. 5 Issue 2, p87, 11p.
Tierney, K.J., Business vulnerability and disruption: Data from the 1993 Midwest floods,
41st North American Meetings of the Regional Science Association International, Niagara Falls,
Ontario, November, 1994, pp.16-24.
Tierney, K.J. and Nigg, J.M., Business vulnerability due to disaster-related lifeline disruption,
University of Delaware Disaster Research Center Preliminary Paper 223, 1995, 9p.
Acknowledgement
We are grateful for review from Dr. Stephanie Chang, Dr. Hart Hodges, Dr. Adam Rose, and Dr.
Anne Wein for their helpful reviews. Any mistakes in this report are not the responsibility of the
reviewers.
This work was partially supported by National Science Foundation Grant #0927356. This study
is part of Dr. Miles’ National Science Foundation research project entitled “Repeat Disaster
Impact to Infrastructure Networks and Their Effects on Economic Agent Recovery.”

146
Appendix B Lateral Spreading Sensitivity Study
by Steven Bartlett, PE, University of Utah and Yumei Wang, PE, DOGAMI
Introduction
The potential amount of ground deformation resulting from liquefaction-induced lateral spread in
the Critical Energy Infrastructure (CEI) Hub in Portland, Oregon was jointly evaluated. The
University of Utah was the lead modeler, and DOGAMI was the lead in framing the sensitivity
study and provided some of the input variables including the geotechnical soils data. The
evaluations were done using empirical equations developed by Youd et al. (2002) and by
nonlinear numerical modeling using a finite difference computer program called FLAC (Fast
Lagrangian Analysis of Continua) (v.5) developed by Itasca, 2005. The lateral spread evaluations
were done using several earthquake time histories and slope conditions for two cases of soil
conditions: (1) unimproved ground, and (2) improved ground. Unimproved ground denotes
analyses performed for the existing ground conditions that have not been modified by any type
of ground improvement technology. Improved ground denotes analyses that were done to
estimate the potential reduction in lateral spread displacement that might be achieved by
modifying the properties of the potentially liquefiable soil using some type of ground
improvement technology (e.g., stone columns, rammed aggregate piers, etc.).
Seismic Input
The evaluations involved selection of representative acceleration time histories for magnitude 9.0
(M9.0) and magnitude 8.0 (M8.0) earthquakes and slightly adjusting them for use in the
numerical modeling. A total of ten subduction zone earthquake time histories were considered
for the final numerical analyses (Figure B1). Two of these are synthetic time histories obtained
from Art Frankel of the US Geological Survey (1msoil and 1ssoil), and the remaining eight time
histories are from other subduction zone earthquakes from the 1985 Chilean and 1985 Mexican
earthquakes. Each candidate time history was analyzed using both of its horizontal components.
All candidate time histories were scaled to a peak ground acceleration (pga) value of 0.3 g to be
more representative of the expected strong motion for a 1000-year return period event (Figure
B2). For example, the pga value for a deterministic Cascadia M9.0 event is about 0.18 g;
however, when this event is considered in probabilistic terms at a 1000-year return period, the
expected pga increases to approximately 0.3 g for rock and stiff soil sites. In addition to the 0.3-g
scaling of pga, the candidate time histories were baseline-corrected to ensure that no artificial
displacement occurs when analyzing the records in the numerical model.
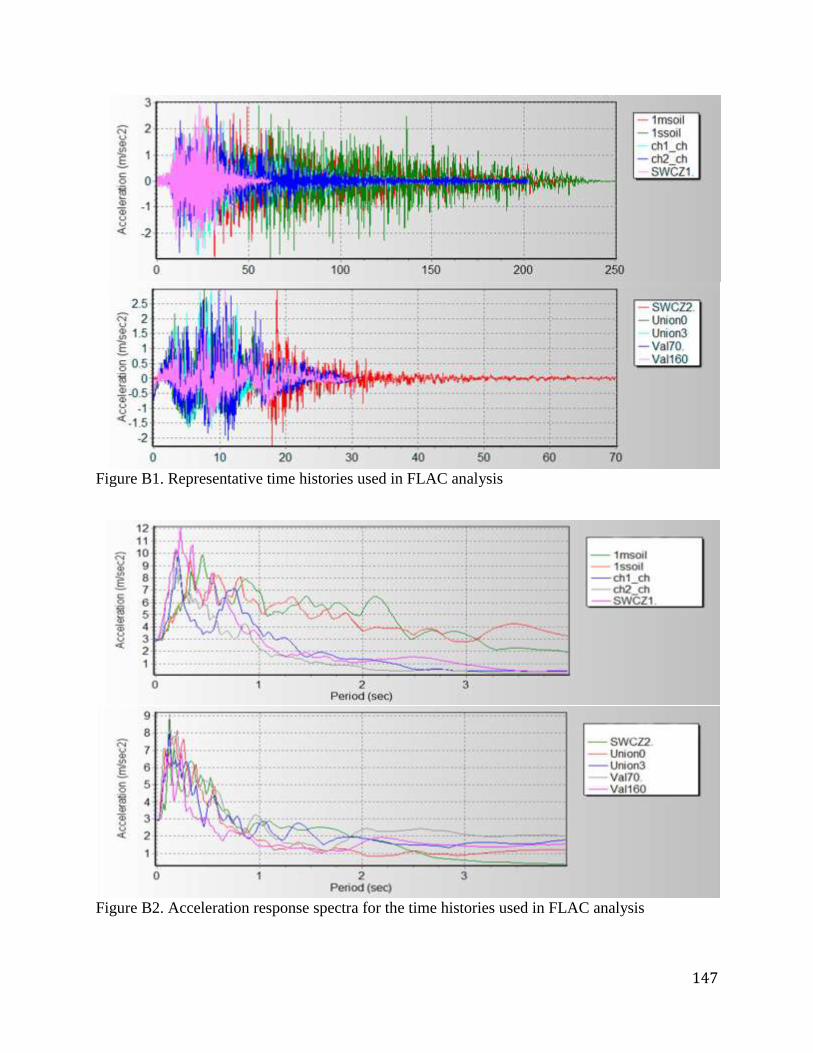
147
Figure B1. Representative time histories used in FLAC analysis
Figure B2. Acceleration response spectra for the time histories used in FLAC analysis

148
Subsurface Conditions
In-situ soil data from a BPA tower site in the CEI Hub were used to develop representative soil
profiles and used in conjunction with other generic soil properties from the area (BPA, 2008;
CH2MHill, 2006). Figure B3 shows in-situ soil data (cone penetrometer soundings) from the
CEI Hub, which were used in the evaluations. From a lateral spread viewpoint, the primary zone
of interest is that from about 21 to 46 feet deep. Much of this zone has qc1values of 60 tons / sq.
foot, and except for the zone between 38 to 40 feet, the soils appears to be granular and
susceptible to liquefaction due to their low penetration resistance. (Note that materials with
penetration resistance greater than 60 tons / sq. foot were not considered in the evaluations
because they are probably not susceptible to damaging lateral spread displacement due to their
higher density and strength.)
Figure B3. Soils layering and profile considered in FLAC analyses (modified from BPA, 2008)
Lateral Spread Zone
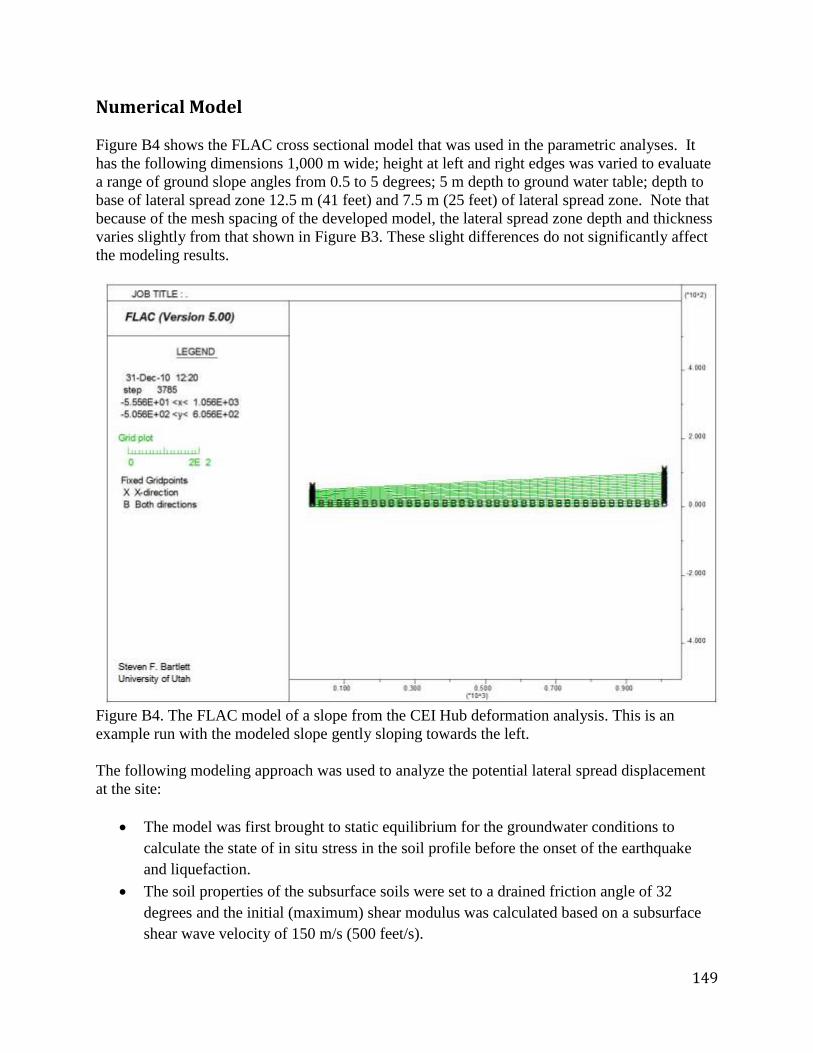
149
Numerical Model
Figure B4 shows the FLAC cross sectional model that was used in the parametric analyses. It
has the following dimensions 1,000 m wide; height at left and right edges was varied to evaluate
a range of ground slope angles from 0.5 to 5 degrees; 5 m depth to ground water table; depth to
base of lateral spread zone 12.5 m (41 feet) and 7.5 m (25 feet) of lateral spread zone. Note that
because of the mesh spacing of the developed model, the lateral spread zone depth and thickness
varies slightly from that shown in Figure B3. These slight differences do not significantly affect
the modeling results.
Figure B4. The FLAC model of a slope from the CEI Hub deformation analysis. This is an
example run with the modeled slope gently sloping towards the left.
The following modeling approach was used to analyze the potential lateral spread displacement
at the site:
The model was first brought to static equilibrium for the groundwater conditions to
calculate the state of in situ stress in the soil profile before the onset of the earthquake
and liquefaction.
The soil properties of the subsurface soils were set to a drained friction angle of 32
degrees and the initial (maximum) shear modulus was calculated based on a subsurface
shear wave velocity of 150 m/s (500 feet/s).

150
The candidate time histories were input at the base of the FLAC model and the
earthquake motion was propagated through the model. Slight scaling of the time history
was done to ensure that the 0.3 g was produced at the surface of the model without
liquefaction effects present in the model.
Each candidate time history was analyzed using both a positive polarity (+) and a
negative polarity (-) to evaluate the sensitivity of lateral spread displacement to the
polarity of the record.
Liquefaction effects were introduced in the modeling using the following approach and
assumptions:
o Liquefaction is triggered approximately when the first 0.1 g acceleration spike is
encountered in the candidate time history based on liquefaction triggering
analyses.
o Maximum shear strength and soil stiffness values for the soil profile were used at
the onset of strong motion.
o These values were linearly degraded to residual values to represent complete
liquefaction at the time when the first 0.1 g acceleration spike occurred in the
respective time history.
The initial shear modulus at the beginning of the earthquake record was
degraded to 10 percent of its initial value at complete liquefaction.
The friction angle of the liquefied soil was degraded from its peak value of
32 degrees at the beginning of the earthquake record to 6 degrees when
complete liquefaction was encountered. This residual value was selected
because it allows the residual strength to be approximately 10 percent of
the initial mean effective stress under hydrostatic conditions, which is a
reasonable estimate of the residual strength for loose, liquefied sand.
The lateral spread horizontal displacement was calculated for each of the candidate time
histories. The slope of the FLAC model was varied from 0.5 to 5 degrees for each of the
candidate time histories to account for potential variation of slope in the CEI Hub.
The FLAC model results were also compared against displacements predicted from the
Youd et al. (2002) regression equation to evaluate the reasonableness of the FLAC
model.
Lateral Spread Displacement Estimates for Unimproved Ground
Using the modeling approach described above, a parametric study was conducted to estimate the
order of magnitude and characteristics of the possible lateral spread displacement for
unimproved ground. Table B1 shows the main parameters used in the study, as well as the
deformation results for the various earthquakes and ground slope cases. In addition, the FLAC
results are compared and complemented with empirically derived mean estimates of horizontal
displacement obtained from the empirical relationships developed from the Youd et al. (2002)
for M9.0 and M8.0 earthquakes (Figure B5). Note that Youd et al. (2002) found that actual

151
displacements can vary by a factor of 2 from the mean estimate. Thus for example, the upper
bound lateral spread displacement for a 5 percent slope and a M9.0 event is approximately 10 m
based on a mean estimate of about 5 m for that same event.
Figure B5. Estimates of horizontal displacement versus ground slope for M9.0 and M8.0
earthquakes compared with mean estimates from Youd et al. (2002) regression equation.
The FLAC modeling results for records 1msoil and 1ssoil produce about 17 m of predicted
ground displacement for a M9.0 event on a 5 percent slope. This is somewhat higher than the 10
m upper bound estimated by the Youd et al. (2002) regression equation. The reason for the
relatively large displacement produced by the FLAC model can be seen by comparing the
magnitude and duration of the strong motion represented by histories 1msoil and 1ssoil with the
other candidate time histories used in the modeling. The 1msoil and 1ssoil records both have
strong motion duration that exceeds 200 s and ground accelerations that exceed 1 m/s2 (0.1 g) for
much of the record (Figure B1). The amplitude and duration of strong motion for these two
records are notably higher than the other records used in the evaluations. Certainly the amount of
lateral spread displacement would decrease if these records were used unscaled instead of the
0.3-g scaling that was used. However, we choose to use the scaled time histories for these events
and evaluate the corresponding ground improvement needed to remediate the lateral spread, as
discussed in the next section.
0
1
2
3
4
5
6
0 1 2 3 4 5 6
Ho
rizo
nta
l Dis
pla
cem
en
t (m
)
Ground Slope (%)
Lateral Spread Displacement vs. Slope 1msoil
1ssoil
Ch_1 Chile
Ch_2 Chile
Union_90
Union_360
Union_360
Val 70
Val 160
SWCZ1
SWCZ2
Youd et al. M9
Youd et al. M8
17 m for 1ssoil and 1msoil
152
Lateral Spread Displacement Estimates for Improved Ground
The soil properties used in the FLAC model were modified to represent the case where the
ground has been improved by some type of ground improvement technology. For these analyses,
the soil properties were modified accordingly to represent the effects of improved ground in the
lateral spread zone.
The friction angle in the liquefied zone was increased from its residual value in the FLAC
model to a value where deformations became small. From this, the shear strength
required to ameliorate the lateral spread was calculated.
The residual shear modulus for the treated zone was set equal to 30 percent of the initial
unliquefied value of the shear modulus, G.
The shear strength of the improved ground required to mitigate the lateral spread was
uniformly distributed throughout the potential lateral spread zone.
It was assumed that excess pore pressure generation from cycling (partial liquefaction)
does not affect the shear strength of the improved ground.
The evaluation of improved ground was not repeated for all cases. Instead, representative time
histories were used to estimate what treatment was required to mitigate the lateral spread hazard.
The selected time histories were: (1) 1msoil, which was selected to represent a M9.0 event at a
distance of 100 km, and (2) SWCZ1, which was selected to represent a M8.0 event at a distance
of 100 km. These particular earthquake records were selected because they produced
displacement near the upper bound displacement for the unimproved ground case (Figure B-5);
hence they represent a conservative case to analyze the effects of improved ground.
The results of the improved ground evaluations presented in Table B-2. These analyses show that
the improved soil must have a minimum composite strength of about 30 to 50 kPa (600 to 1000
psf) to mitigate the lateral spread hazard for a M9.0 event. The analyses also show that the
improved soil must have a minimum composite strength of about 20 to 45 kPa (400 to 900 psf)
to mitigate the lateral spread hazard for a M8.0 event. We anticipate that if these composite
strengths can be obtained using ground improvement, then the expected lateral spread
displacement will be 0.05 m (2 inches), or less. These preliminary evaluations were done using
limited geotechnical data and simplifying assumptions. More detailed, site specific evaluations
can be made for the individual facilities.
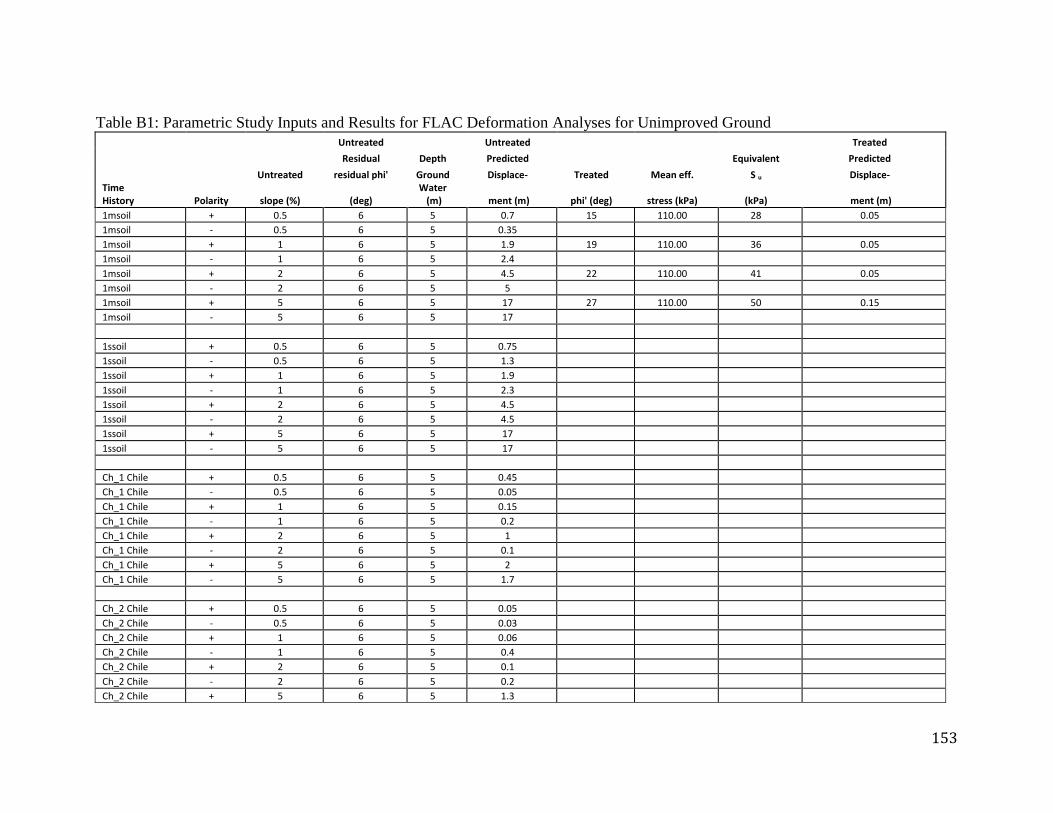
153
Table B1: Parametric Study Inputs and Results for FLAC Deformation Analyses for Unimproved Ground
Untreated
Untreated
Treated
Residual Depth Predicted
Equivalent Predicted
Untreated residual phi' Ground Displace- Treated Mean eff. S u Displace-
Time History Polarity slope (%) (deg)
Water (m) ment (m) phi' (deg) stress (kPa) (kPa) ment (m)
1msoil + 0.5 6 5 0.7 15 110.00 28 0.05
1msoil - 0.5 6 5 0.35 1msoil + 1 6 5 1.9 19 110.00 36 0.05
1msoil - 1 6 5 2.4 1msoil + 2 6 5 4.5 22 110.00 41 0.05
1msoil - 2 6 5 5 1msoil + 5 6 5 17 27 110.00 50 0.15
1msoil - 5 6 5 17
1ssoil + 0.5 6 5 0.75 1ssoil - 0.5 6 5 1.3 1ssoil + 1 6 5 1.9 1ssoil - 1 6 5 2.3 1ssoil + 2 6 5 4.5 1ssoil - 2 6 5 4.5 1ssoil + 5 6 5 17 1ssoil - 5 6 5 17
Ch_1 Chile + 0.5 6 5 0.45 Ch_1 Chile - 0.5 6 5 0.05 Ch_1 Chile + 1 6 5 0.15 Ch_1 Chile - 1 6 5 0.2 Ch_1 Chile + 2 6 5 1 Ch_1 Chile - 2 6 5 0.1 Ch_1 Chile + 5 6 5 2 Ch_1 Chile - 5 6 5 1.7
Ch_2 Chile + 0.5 6 5 0.05 Ch_2 Chile - 0.5 6 5 0.03 Ch_2 Chile + 1 6 5 0.06 Ch_2 Chile - 1 6 5 0.4 Ch_2 Chile + 2 6 5 0.1 Ch_2 Chile - 2 6 5 0.2 Ch_2 Chile + 5 6 5 1.3
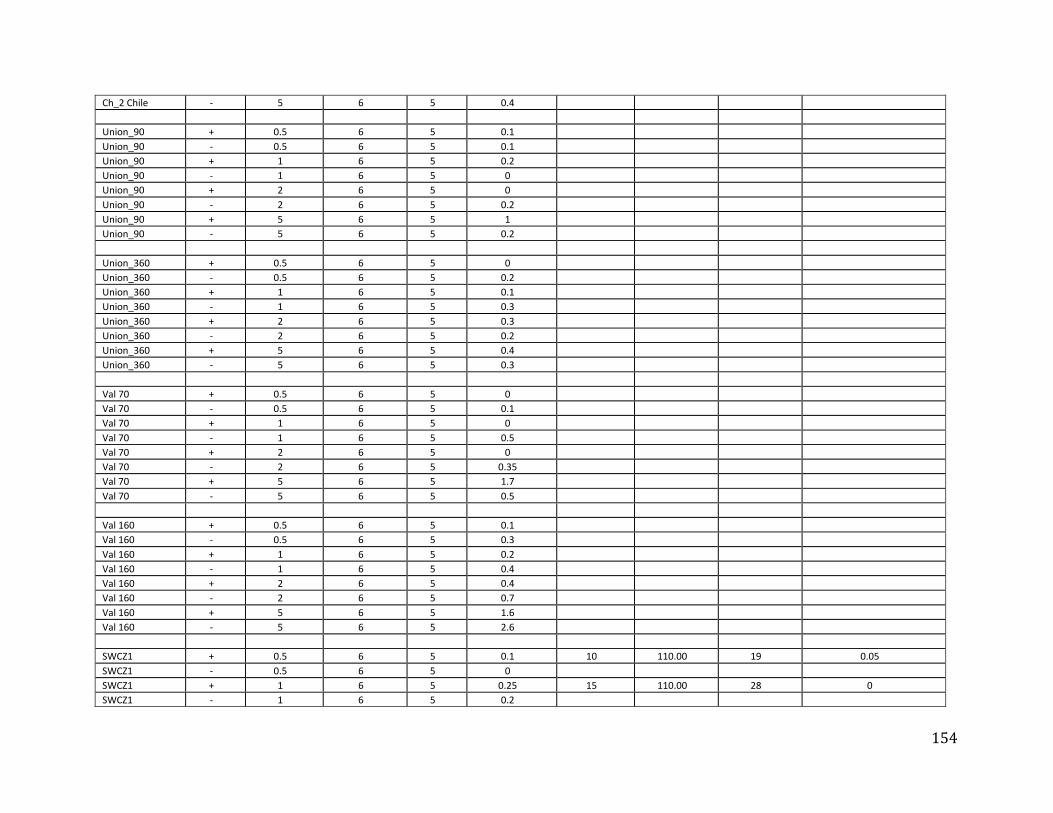
154
Ch_2 Chile - 5 6 5 0.4
Union_90 + 0.5 6 5 0.1 Union_90 - 0.5 6 5 0.1 Union_90 + 1 6 5 0.2 Union_90 - 1 6 5 0 Union_90 + 2 6 5 0 Union_90 - 2 6 5 0.2 Union_90 + 5 6 5 1 Union_90 - 5 6 5 0.2
Union_360 + 0.5 6 5 0 Union_360 - 0.5 6 5 0.2 Union_360 + 1 6 5 0.1 Union_360 - 1 6 5 0.3 Union_360 + 2 6 5 0.3 Union_360 - 2 6 5 0.2 Union_360 + 5 6 5 0.4 Union_360 - 5 6 5 0.3
Val 70 + 0.5 6 5 0 Val 70 - 0.5 6 5 0.1 Val 70 + 1 6 5 0 Val 70 - 1 6 5 0.5 Val 70 + 2 6 5 0 Val 70 - 2 6 5 0.35 Val 70 + 5 6 5 1.7 Val 70 - 5 6 5 0.5
Val 160 + 0.5 6 5 0.1 Val 160 - 0.5 6 5 0.3 Val 160 + 1 6 5 0.2 Val 160 - 1 6 5 0.4 Val 160 + 2 6 5 0.4 Val 160 - 2 6 5 0.7 Val 160 + 5 6 5 1.6 Val 160 - 5 6 5 2.6
SWCZ1 + 0.5 6 5 0.1 10 110.00 19 0.05
SWCZ1 - 0.5 6 5 0 SWCZ1 + 1 6 5 0.25 15 110.00 28 0
SWCZ1 - 1 6 5 0.2
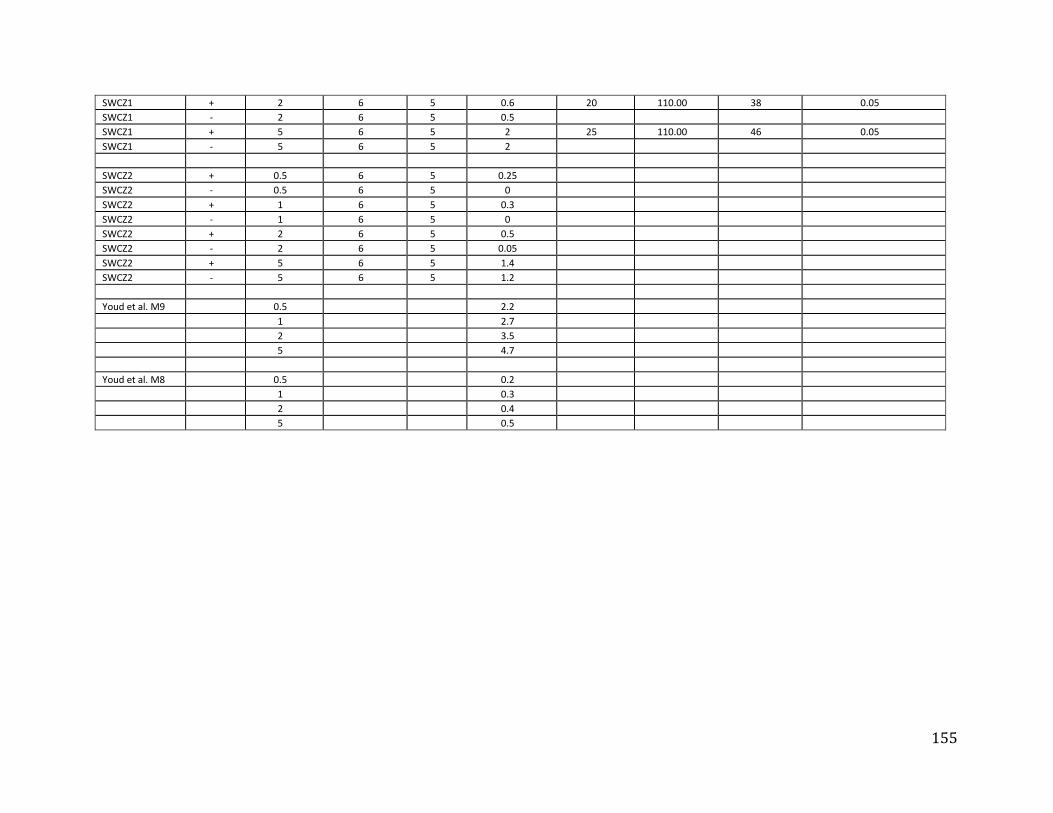
155
SWCZ1 + 2 6 5 0.6 20 110.00 38 0.05
SWCZ1 - 2 6 5 0.5 SWCZ1 + 5 6 5 2 25 110.00 46 0.05
SWCZ1 - 5 6 5 2
SWCZ2 + 0.5 6 5 0.25 SWCZ2 - 0.5 6 5 0 SWCZ2 + 1 6 5 0.3 SWCZ2 - 1 6 5 0 SWCZ2 + 2 6 5 0.5 SWCZ2 - 2 6 5 0.05 SWCZ2 + 5 6 5 1.4 SWCZ2 - 5 6 5 1.2
Youd et al. M9
0.5
2.2
1
2.7
2
3.5
5
4.7
Youd et al. M8
0.5
0.2
1
0.3
2
0.4
5
0.5
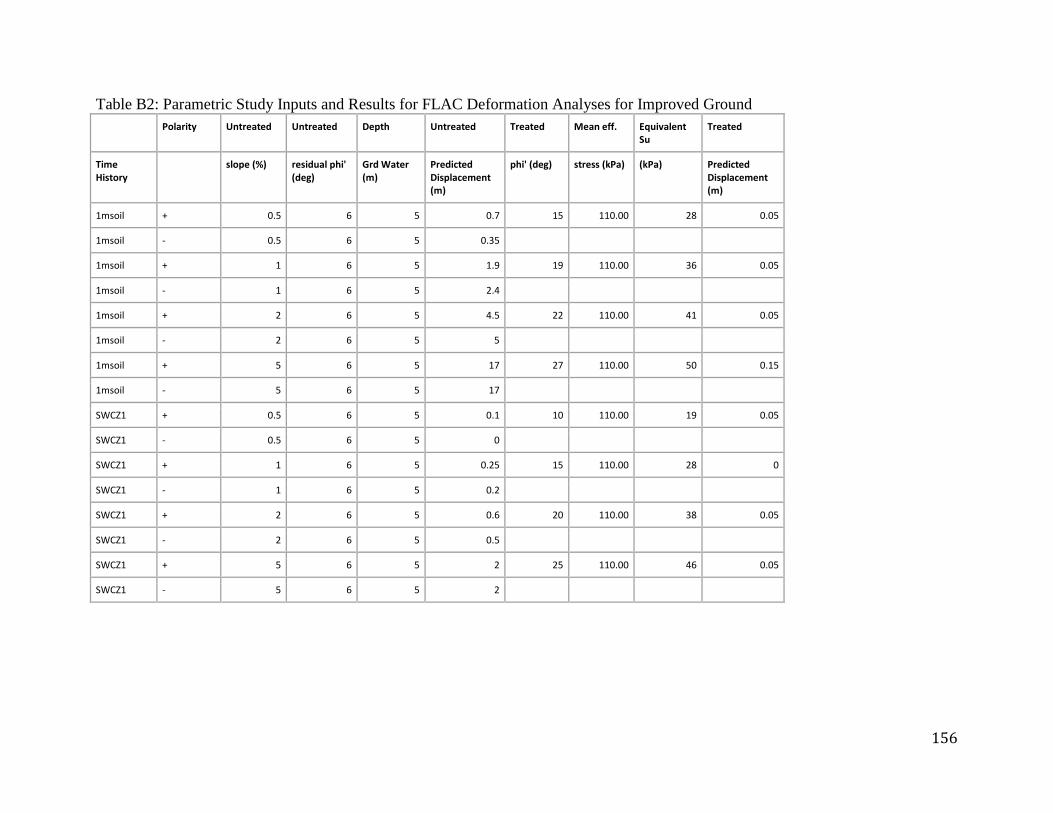
156
Table B2: Parametric Study Inputs and Results for FLAC Deformation Analyses for Improved Ground
Polarity Untreated Untreated Depth Untreated Treated Mean eff. Equivalent Su
Treated
Time History
slope (%) residual phi' (deg)
Grd Water (m)
Predicted Displacement (m)
phi' (deg) stress (kPa) (kPa) Predicted Displacement (m)
1msoil + 0.5 6 5 0.7 15 110.00 28 0.05
1msoil - 0.5 6 5 0.35
1msoil + 1 6 5 1.9 19 110.00 36 0.05
1msoil - 1 6 5 2.4
1msoil + 2 6 5 4.5 22 110.00 41 0.05
1msoil - 2 6 5 5
1msoil + 5 6 5 17 27 110.00 50 0.15
1msoil - 5 6 5 17
SWCZ1 + 0.5 6 5 0.1 10 110.00 19 0.05
SWCZ1 - 0.5 6 5 0
SWCZ1 + 1 6 5 0.25 15 110.00 28 0
SWCZ1 - 1 6 5 0.2
SWCZ1 + 2 6 5 0.6 20 110.00 38 0.05
SWCZ1 - 2 6 5 0.5
SWCZ1 + 5 6 5 2 25 110.00 46 0.05
SWCZ1 - 5 6 5 2

157
Appendix C Telecommunications: Seismic Codes and Guidelines
All companies with facilities in the CEI Hub are encouraged to conduct seismic vulnerability
assessments that include interdependencies on other systems, such as telecommunication
systems. Telecommunication systems are not only important for communication systems, but
also many different types of systems, such as pipeline and electrical systems, need
telecommunications to operate. Telecommunication systems can help monitor and control data
and systems so many systems are dependent on them. Seismic codes and guidelines for
telecommunication systems are provided below. The list should be updated as new key
references are made available.
Telecommunications
To increase service reliability, facilities should incorporate redundancy of wired, wireless and radio services (see figure; PBX = Private branch exchange for private telephone network)
NEBS - Network Equipment-Building System, including GR-63 Physical Protection Bellcore http://telecom-info.telcordia.com/site-cgi/ido/docs2.pl?ID=160834912&page=nebs ASCE - American Society of Civil Engineers (ASCE) 7-10 American Society of Civil Engineers ASCE - monograph No. 10 Methods of Achieving Improved Seismic Performance of Communications Systems TIA/EIA-222-G (2009) Structural Standard for Antenna Supporting Structures and Antennas