Embed Size (px)
Citation preview
Newcastle&Earthquake Risk in
Edited by Trevor Dhuand Trevor Jones
Record 2002/15
LAKEMACQUARIE
Earthq
uake R
isk in N
EWC
AST
LE & LA
KE M
AC
QU
AR
IER
ecord
20
02
/15
Record cover_spine (CMYK) 9/2/02 3:48 PM Page 1
GEOSCIENCE AUSTRALIADEPARTMENT OF INDUSTRY, TOURISM & RESOURCES
Geoscience Australia Record 2002/15
EARTHQUAKE RISK INNEWCASTLE AND LAKE MACQUARIE
Edited by Trevor Dhu and Trevor Jones
Minerals and Geohazards Division, Geoscience Australia, GPO Box 378, Canberra,ACT 2601
CANBERRA 2002
Department of Industry, Tourism and ResourcesMinister for Industry, Tourism and Resources
The Hon Ian Macfarlane MP
Parliamentary Secretary: The Hon Warren Entsch MPSecretary: Mr Mark Paterson
Geoscience AustraliaChief Executive Officer: Neil Williams
COPYRIGHT
© Commonwealth of Australia 2002
This work is copyright. Apart from any fair dealings for the purposes of study, research, criticism or review, as permitted under the Copyright Act 1968, no part may be reproduced by any process without written
permission. Copyright is vested in the Commonwealth of Australia, and is administered through the Chief Executive Officer, Geoscience Australia. Requests and enquiries should be directed to the Chief Executive Officer, Geoscience Australia, GPO Box 378, Canberra, ACT, 2601, Australia.
ISSN: 1039–0073
ISBN: 0 642 46744 7
Bibliographical Reference: Dhu, T., and Jones, T. (eds.), 2002. Earthquake Risk in Newcastle and Lake Macquarie. Geoscience Australia Record 2002/15, Geoscience Australia, Canberra.
DISCLAIMER
The information is provided for mitigation of natural hazards and risks posed to Newcastle and LakeMacquarie. The Commonwealth does not warrant that the information in the report is accurate or complete,
and disclaims liability for all loss, damages and costs incurred directly or indirectly by any person as a resultof using or relying on the information in the report.
Contributing AuthorsNeil Corby, Trevor Dhu, Glenn Fulford, Ingo Hartig, Andrew Jones, Trevor Jones, David Robinson,
John Schneider, Cvetan Sinadinovski, John Stehle and David Stewart
and in cooperation with
Hunter Water CorporationHunter District Emergency Management Committee
Record cover_spine (CMYK) 9/2/02 3:49 PM Page 2
Summary Jones and Dhu
Geoscience Australia Earthquake Risk in Newcastle and Lake Macquarie 1
1 SUMMARY (T. JONES AND T. DHU)
This Chapter summarises the important results of the earthquake risk assessment of Newcastle and LakeMacquarie. The summary presents the essential aspects of the risk assessment techniques used, the importantresults and conclusions, and suggests options to mitigate the earthquake risk in Newcastle and Lake Macquarie.
1.1 BackgroundAt 10.27 am on the 28 December 1989 an earthquake measuring 5.6 on the Richter scale shook Newcastle,
Australia’s sixth most populous city. This moderate-magnitude earthquake claimed 13 lives and causedextensive damage to buildings and other structures. This event clearly demonstrated that moderate-magnitudeearthquakes, which frequently occur in Australia, have the potential to dramatically impact Australiancommunities.
Natural hazards devastate Australian communities almost every year. In response to the danger posed bythese natural hazards, Geoscience Australia developed the Cities Project. This initiative began in 1996 and isfocused on research to measure and mitigate risks faced by Australian urban communities from a range ofnatural hazards including earthquakes. The ultimate objective is to improve the safety of communities, andconsequently make them more sustainable and prosperous.
1.2 IntroductionIn addition to the devastating 1989 Newcastle earthquake, at least four other earthquakes of magnitude 5 or
greater have occurred in the surrounding Hunter region since European settlement in 1804. Some of theseearthquakes caused damage in areas that, at the time, were sparsely populated. Similar events, were they to occurtoday in populated areas, would certainly cause significant damage. The frequency with which these events haveoccurred in the Hunter region suggests that earthquakes pose a genuine threat to the communities there.
This study presents the most comprehensive and advanced earthquake risk assessment undertaken for anyAustralian city to date. It has focused on the economic losses caused by damage to buildings from earthquakeground shaking, and not on the impacts from other, secondary hazards such as soil liquefaction and surfacefaulting. The study has adopted a probabilistic approach that makes allowances for the variability that is inherentin natural processes as well as the uncertainty in our knowledge.
The results from this project will assist decision-makers involved in local and state government, policydevelopment, the insurance industry, engineers, architects, and the building and finance industries to managepotential damage and loss of life from earthquakes in Newcastle and Lake Macquarie. The results also haveimplications for the earthquake risk facing larger Australian cities such as Sydney, Melbourne and Adelaide.This is due to a number of factors, including similarities between the earthquake hazard in Newcastle and LakeMacquarie and other parts of Australia, and similarities between the urban environments, particularly thecomposition of the building stock.
We emphasise that this report should be regarded as the best and most recentassessment of earthquake risk in Newcastle and Lake Macquarie. However, weacknowledge that there are limitations in the models and data we have used, and that wehave an incomplete understanding of the natural variability inherent in ground shakingand building response.
The results, interpretations and conclusions could change with the incorporation ofnew data and with different model assumptions.
Therefore, the reader should not take action based on information in this reportalone.
Summary Jones and Dhu
Geoscience Australia Earthquake Risk in Newcastle and Lake Macquarie 2
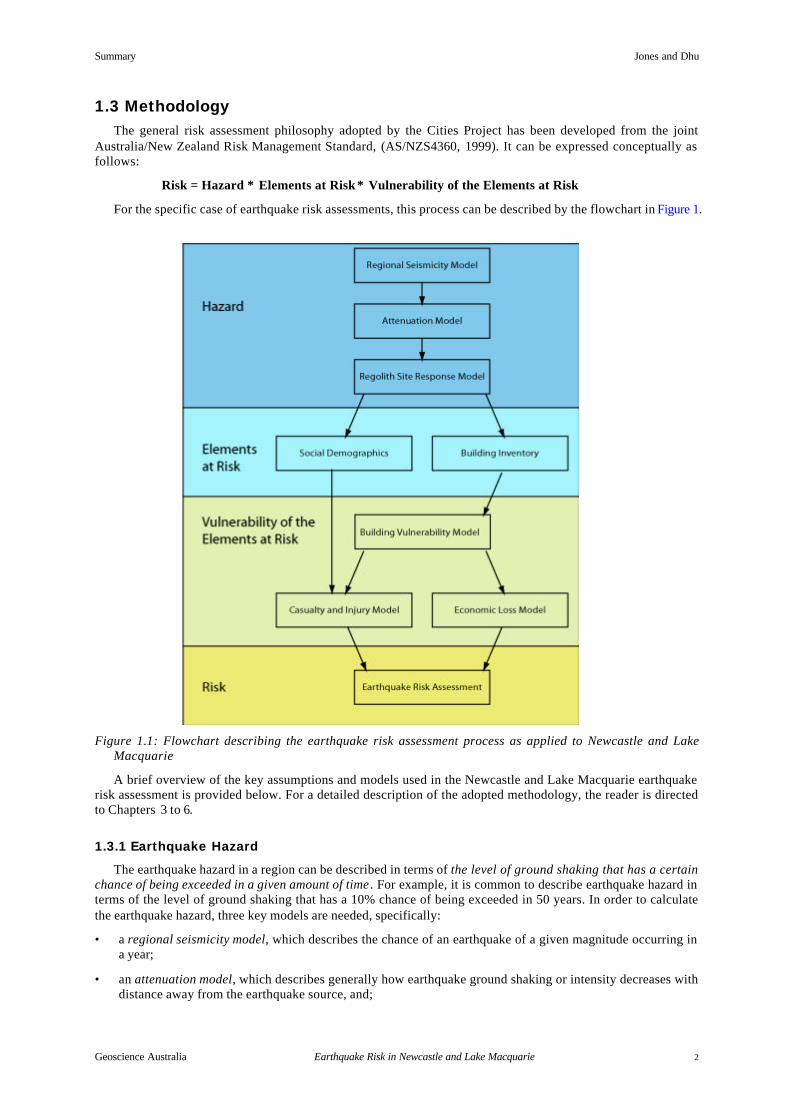
1.3 MethodologyThe general risk assessment philosophy adopted by the Cities Project has been developed from the joint
Australia/New Zealand Risk Management Standard, (AS/NZS4360, 1999). It can be expressed conceptually asfollows:
Risk = Hazard ∗ Elements at Risk ∗ Vulnerability of the Elements at Risk
For the specific case of earthquake risk assessments, this process can be described by the flowchart in Figure 1.
Figure 1.1: Flowchart describing the earthquake risk assessment process as applied to Newcastle and LakeMacquarie
A brief overview of the key assumptions and models used in the Newcastle and Lake Macquarie earthquakerisk assessment is provided below. For a detailed description of the adopted methodology, the reader is directedto Chapters 3 to 6.
1.3.1 Earthquake Hazard
The earthquake hazard in a region can be described in terms of the level of ground shaking that has a certainchance of being exceeded in a given amount of time . For example, it is common to describe earthquake hazard interms of the level of ground shaking that has a 10% chance of being exceeded in 50 years. In order to calculatethe earthquake hazard, three key models are needed, specifically:
• a regional seismicity model, which describes the chance of an earthquake of a given magnitude occurring ina year;
• an attenuation model, which describes generally how earthquake ground shaking or intensity decreases withdistance away from the earthquake source, and;
Summary Jones and Dhu
Geoscience Australia Earthquake Risk in Newcastle and Lake Macquarie 3
• a site response model, which describes how local regolith (soils, geological sediments and weathered rock)will affect the ground shaking experienced during an earthquake.
The regional seismicity model was created from historical seismicity and an interpretation of the earthquakeoccurrence on local geological structures. The model describes the chance of occurrence of earthquakes withmoment magnitudes ranging from 4.5 through to 6.5, as these were thought to be the events likely to inflictdamage on the study region.
The attenuation model of Toro et al. (1997) was used in this study. This attenuation model was developed forcentral and eastern North America, a region of the world that is thought to have similar attenuationcharacteristics to Australia. However, it must be emphasised that no explicit study has been conducted on thesuitability of this model for Australian conditions.
The site response model was developed from detailed geotechnical data which were acquired primarily inthe Newcastle municipality, and to a lesser degree the Lake Macquarie municipality. These data were used toclassify the study region into six different site classes. State-of-the-art modelling techniques were then used todetermine how ground shaking on regolith (soils, geological sediments and weathered rock) would differ fromground shaking on an unweathered rock outcrop.
1.3.2 Elements at Risk
Geoscience Australia undertook a comprehensive field survey in order to document the characteristics ofbuildings in the study region that contribute to the building’s vulnerability during an earthquake. This surveyobtained vital information such as wall construction type and building usage for approximately 6,000 buildingsin the study region. In addition to surveying a sample of the general building stock, an effort was made to surveyall essential service facilities such as hospitals, and ambulance and fire stations.
1.3.3 Vulnerability of the Elements at Risk
Earthquake vulnerability models are used to estimate the level of damage caused by a given level of groundshaking for a wide variety of building types. For the purposes of this study, building damage due to earthquakeground shaking was calculated using the method described in Kircher et al. (1997). The vulnerability modelswere developed specifically for Australian building types. This approach allows the calculation of damage on thebasis of building type. For example, given a certain level of ground shaking, the damage to an unreinforcedmasonry structure would be different from the damage to a timber-framed structure.
Models based on work from the Federal Emergency Management Agency (FEMA) in the United States wereused to convert estimates of building damage into estimates of economic loss. In this study, economic loss isdefined in terms of the restoration cost of local buildings and their contents. The models from FEMA werecalibrated using the cost of restoration for local buildings. FEMA models were used to calculate casualty lossesin terms of injuries and lives lost.
1.3.4 Earthquake Risk
As mentioned previously, the earthquake risk to the study region is a combination of the earthquake hazard,the elements at risk and the vulnerability of those elements to earthquake ground shaking. In this study, thesethree components have been combined by:
• conducting computer simulations of approximately 1,200 earthquakes across the study region, each with itsown magnitude and probability of occurrence based upon the regional seismicity model;
• using the attenuation and site response models to determine the level of ground shaking from everysimulated earthquake at each of the surveyed buildings;
• using the vulnerability models to calculate the damage and economic loss to every building from eachearthquake, as well as the related casualties, and;
• aggregating the losses across all the buildings in the study region to produce an estimate of loss for each ofthe 1,200 simulated earthquakes.
1.3.5 Incorporation of Variability
Any attempt to model natural processes or phenomena should incorporate some of the variability that isinherent in nature. For example, in this work we have classified the entire study region into six different regolith
Summary Jones and Dhu
Geoscience Australia Earthquake Risk in Newcastle and Lake Macquarie 4
site classes. However, it is unrealistic to believe that every point within a single regolith site class will respond toan earthquake in precisely the same manner. Similarly, it is unrealistic to believe that every timber-framedbuilding in the study area will suffer the same amount of damage given a certain level of ground shaking.
A detailed description of how natural variability has been incorporated into this study can be found inChapters 3 to 6. However, in essence, the natural variability was incorporated by allowing the model parametersto vary in the simulations. One result of incorporating this variability is that two buildings of the same type,which experience the same level of ground shaking, may suffer different levels of damage. Similarly, the siteresponse and attenuation models were allowed to vary in each earthquake simulation.
1.3.6 Verification of the Risk Assessment Methodology – The 1989 Newcastle Earthquake
A computer simulation of the 1989 Newcastle earthquake was used to test the risk assessment methodologyused in this work. The results of the simulated earthquake were compared against records of the actual damageexperienced during the 1989 event. For a detailed comparison of the simulated results with those recorded afterthe event, the reader is directed to the attached main report. When considered on a broad scale, the results of thiscomparison are very encouraging. For example, the simulated economic loss for the study region in 1989 dollarswas of the order of $1.1 billion. This simulated economic loss is for both insured and uninsured properties. Incomparison, in the aftermath of the 1989 earthquake, the insured losses in 1989 dollars were estimated to be$862 million1.
1.4 Earthquake Risk Assessment Results
1.4.1 Earthquake Hazard in the Newcastle and Lake Macquarie Region
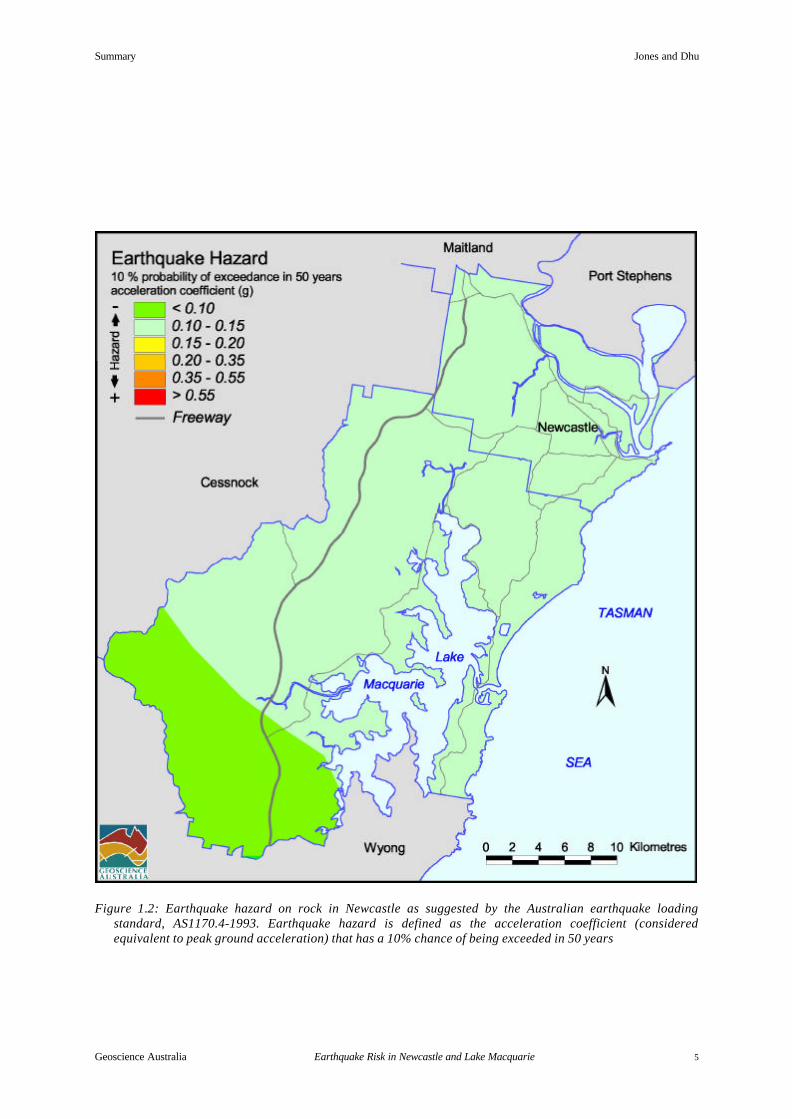
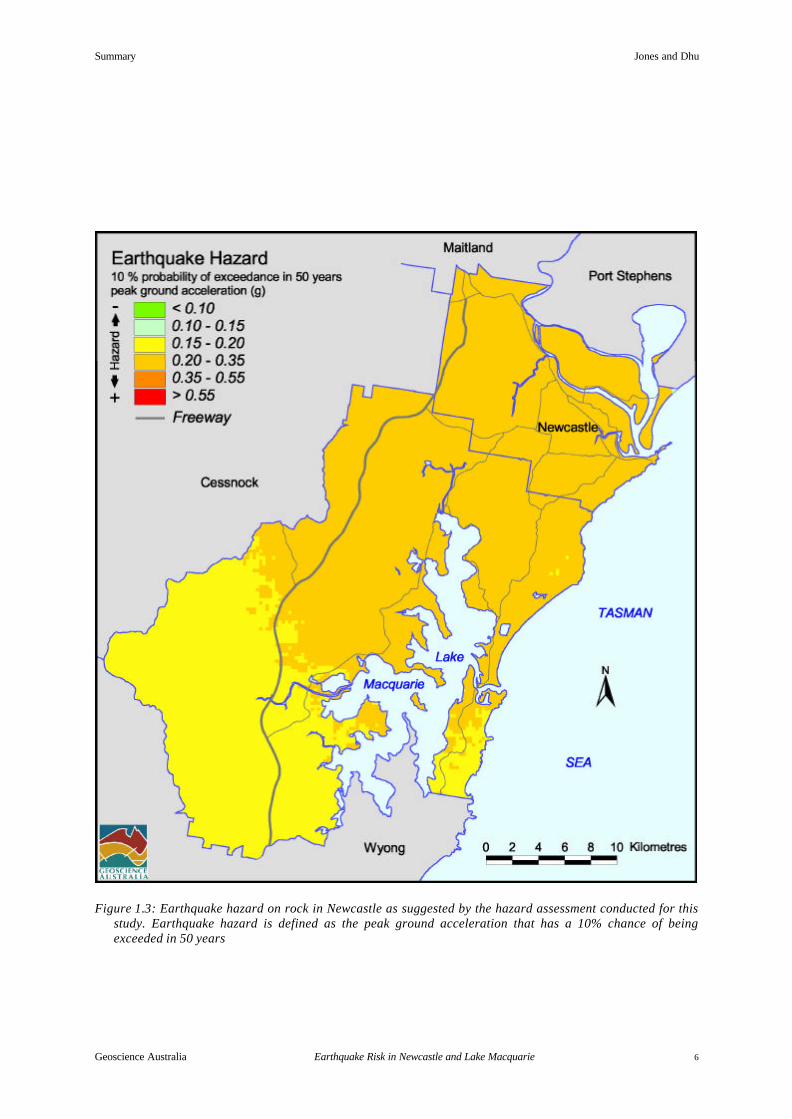
Earthquake hazard is typically measured in terms of the level of ground shaking that has a certain chance ofbeing exceeded in a given time period. The Australian earthquake loading standard, AS1170.4-1993, presentsearthquake hazard in terms of an ‘acceleration coefficient’ that has a 10% chance of being exceeded in 50 years.This acceleration coefficient is considered to be equivalent to peak ground acceleration. A comparison of theearthquake hazard from AS1170.4-1993 with the equivalent hazard calculated in this study is presented in Figure1.2 and Figure 1.3. Both maps have the same trend of increasing hazard towards the north-east of the studyregion. The hazard calculated within this study is typically greater than the hazard suggested by the Australianearthquake loading standard.
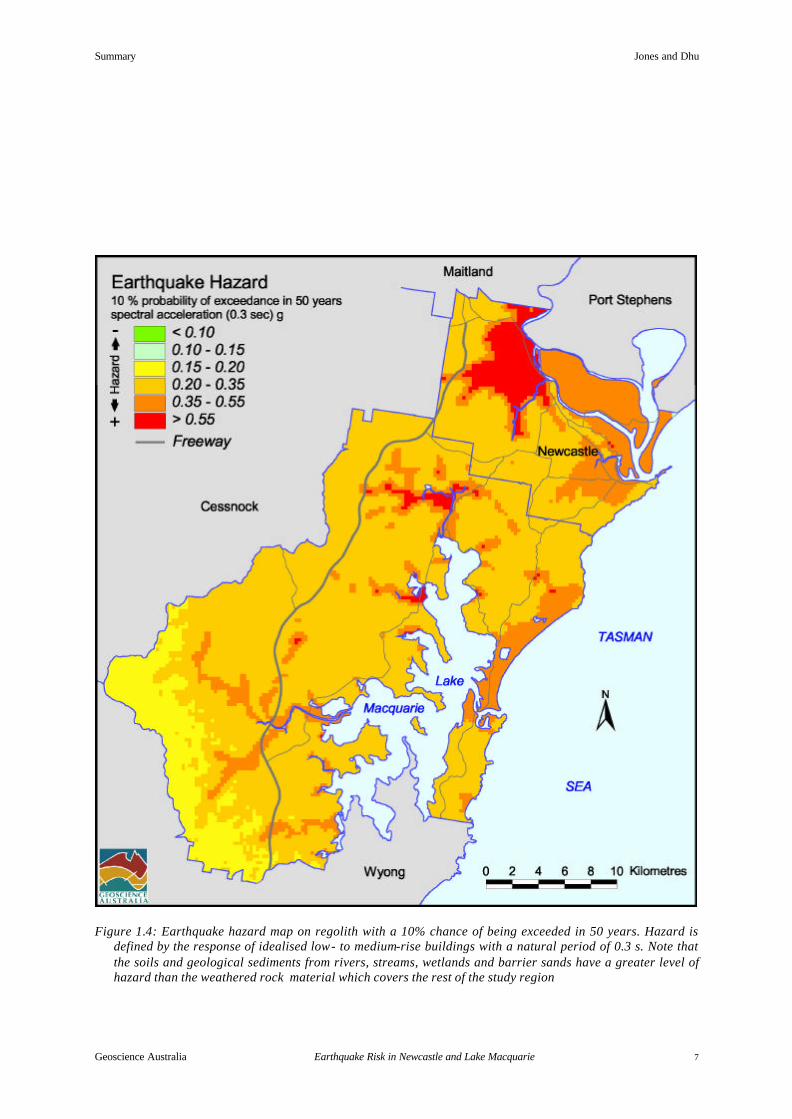
The hazard maps presented in Figure 1.2 and Figure 1.3 were calculated using a measure of ground shaking(i.e. peak ground acceleration) that would be experienced on a rock outcrop. However, the buildings inNewcastle and Lake Macquarie are not built on rock, but rather on varying thicknesses of regolith. Note also thatthe damage experienced by buildings is often influenced not only by the peak ground acceleration, but also bythe level of ground shaking at a specific period of vibration. For example, low- to medium-rise structures aretypically more vulnerable to ground shaking that has a period of vibration of approximately 0.3 s than they are topeak ground acceleration. Figure 1.4 presents an estimate earthquake hazard on regolith based on the response ofidealised low- to medium-rise structures. This figure clearly demonstrates that the soils and geologicalsediments from rivers, streams, wetlands and barrier sands have a greater level of hazard than the weathered rockmaterial which covers the rest of the study region.
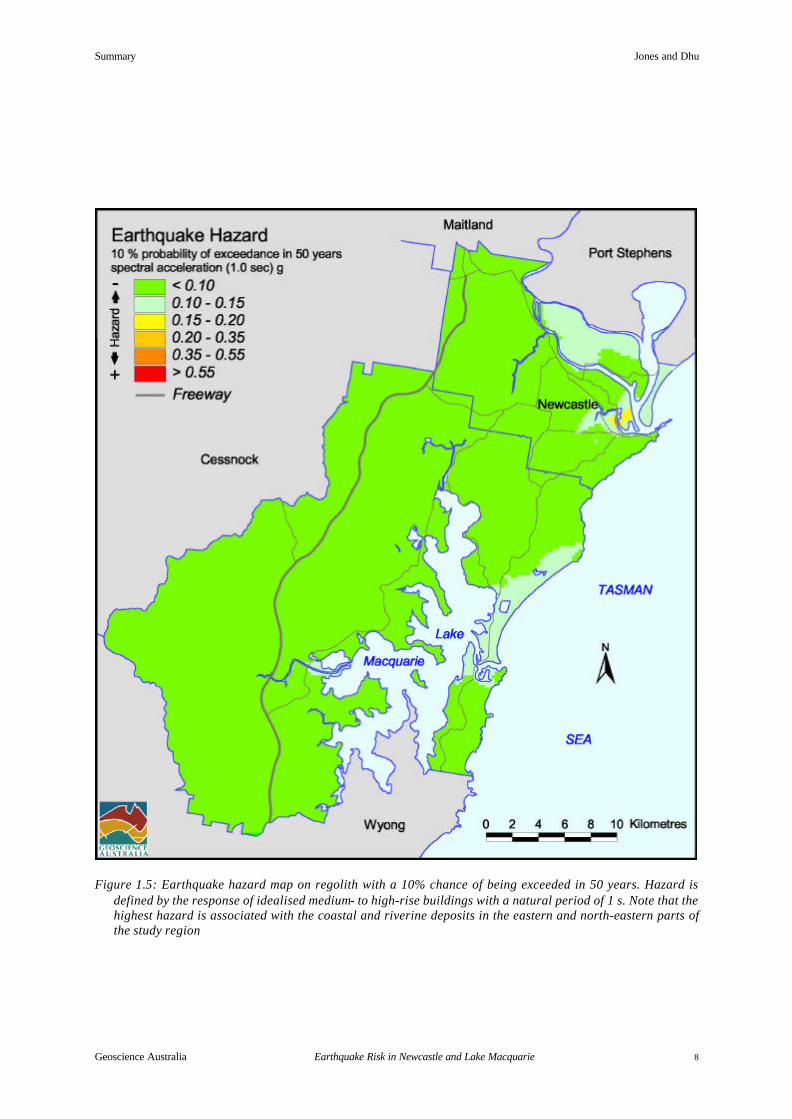
Medium- to high-rise structures are typically more vulnerable to ground shaking that has a period of vibrationof approximately 1 s. Figure 1.5 presents the earthquake hazard on regolith based on the response of idealisedmedium- to high-rise structures. In this figure, the highest hazard can be seen to be associated with the coastaland riverine deposits in the eastern and north-eastern parts of the study region.
1 Insurance Disaster Response Organisation, 2002, www.idro.com.au.
Summary Jones and Dhu
Geoscience Australia Earthquake Risk in Newcastle and Lake Macquarie 5
Figure 1.2: Earthquake hazard on rock in Newcastle as suggested by the Australian earthquake loadingstandard, AS1170.4-1993. Earthquake hazard is defined as the acceleration coefficient (consideredequivalent to peak ground acceleration) that has a 10% chance of being exceeded in 50 years
Summary Jones and Dhu
Geoscience Australia Earthquake Risk in Newcastle and Lake Macquarie 6
Figure 1.3: Earthquake hazard on rock in Newcastle as suggested by the hazard assessment conducted for thisstudy. Earthquake hazard is defined as the peak ground acceleration that has a 10% chance of beingexceeded in 50 years
Summary Jones and Dhu
Geoscience Australia Earthquake Risk in Newcastle and Lake Macquarie 7
Figure 1.4: Earthquake hazard map on regolith with a 10% chance of being exceeded in 50 years. Hazard isdefined by the response of idealised low- to medium-rise buildings with a natural period of 0.3 s. Note thatthe soils and geological sediments from rivers, streams, wetlands and barrier sands have a greater level ofhazard than the weathered rock material which covers the rest of the study region
Summary Jones and Dhu
Geoscience Australia Earthquake Risk in Newcastle and Lake Macquarie 8
Figure 1.5: Earthquake hazard map on regolith with a 10% chance of being exceeded in 50 years. Hazard isdefined by the response of idealised medium- to high-rise buildings with a natural period of 1 s. Note that thehighest hazard is associated with the coastal and riverine deposits in the eastern and north-eastern parts ofthe study region
Summary Jones and Dhu
Geoscience Australia Earthquake Risk in Newcastle and Lake Macquarie 9
1.4.2 Earthquake Risk in the Newcastle and Lake Macquarie Region
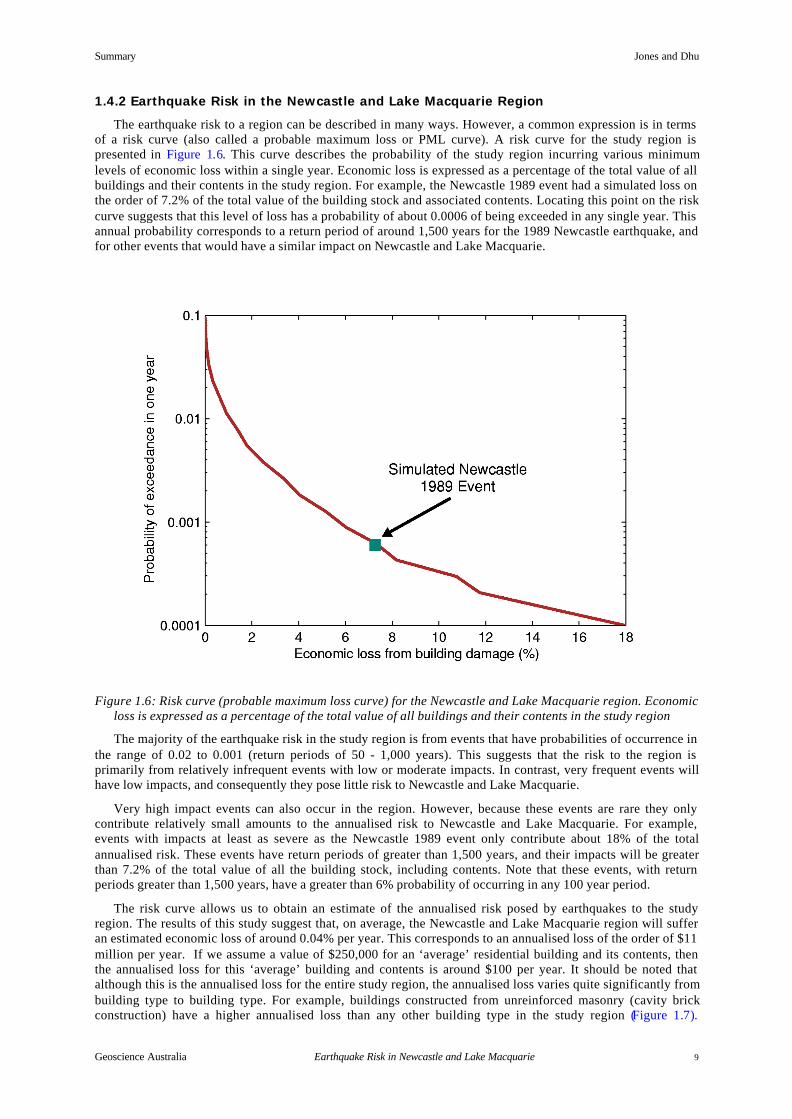
The earthquake risk to a region can be described in many ways. However, a common expression is in termsof a risk curve (also called a probable maximum loss or PML curve). A risk curve for the study region ispresented in Figure 1.6. This curve describes the probability of the study region incurring various minimumlevels of economic loss within a single year. Economic loss is expressed as a percentage of the total value of allbuildings and their contents in the study region. For example, the Newcastle 1989 event had a simulated loss onthe order of 7.2% of the total value of the building stock and associated contents. Locating this point on the riskcurve suggests that this level of loss has a probability of about 0.0006 of being exceeded in any single year. Thisannual probability corresponds to a return period of around 1,500 years for the 1989 Newcastle earthquake, andfor other events that would have a similar impact on Newcastle and Lake Macquarie.
Figure 1.6: Risk curve (probable maximum loss curve) for the Newcastle and Lake Macquarie region. Economicloss is expressed as a percentage of the total value of all buildings and their contents in the study region
The majority of the earthquake risk in the study region is from events that have probabilities of occurrence inthe range of 0.02 to 0.001 (return periods of 50 - 1,000 years). This suggests that the risk to the region isprimarily from relatively infrequent events with low or moderate impacts. In contrast, very frequent events willhave low impacts, and consequently they pose little risk to Newcastle and Lake Macquarie.
Very high impact events can also occur in the region. However, because these events are rare they onlycontribute relatively small amounts to the annualised risk to Newcastle and Lake Macquarie. For example,events with impacts at least as severe as the Newcastle 1989 event only contribute about 18% of the totalannualised risk. These events have return periods of greater than 1,500 years, and their impacts will be greaterthan 7.2% of the total value of all the building stock, including contents. Note that these events, with returnperiods greater than 1,500 years, have a greater than 6% probability of occurring in any 100 year period.
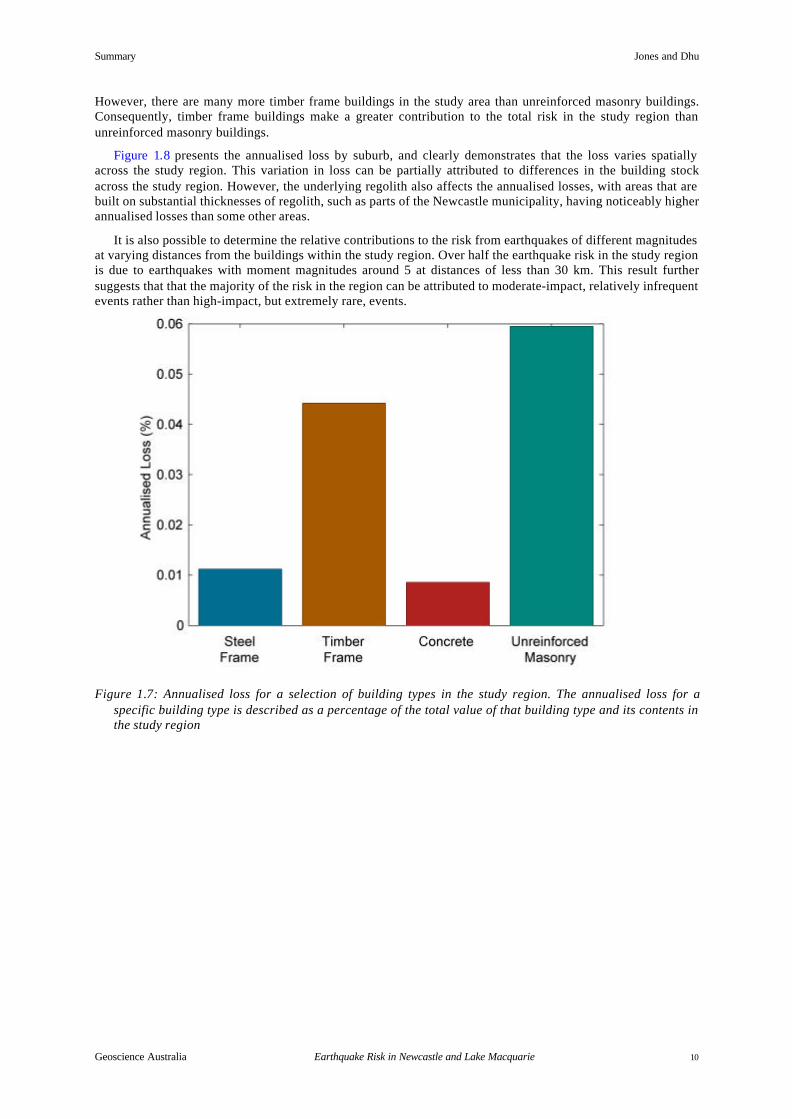
The risk curve allows us to obtain an estimate of the annualised risk posed by earthquakes to the studyregion. The results of this study suggest that, on average, the Newcastle and Lake Macquarie region will sufferan estimated economic loss of around 0.04% per year. This corresponds to an annualised loss of the order of $11million per year. If we assume a value of $250,000 for an ‘average’ residential building and its contents, thenthe annualised loss for this ‘average’ building and contents is around $100 per year. It should be noted thatalthough this is the annualised loss for the entire study region, the annualised loss varies quite significantly frombuilding type to building type. For example, buildings constructed from unreinforced masonry (cavity brickconstruction) have a higher annualised loss than any other building type in the study region (Figure 1.7).
Summary Jones and Dhu
Geoscience Australia Earthquake Risk in Newcastle and Lake Macquarie 10
However, there are many more timber frame buildings in the study area than unreinforced masonry buildings.Consequently, timber frame buildings make a greater contribution to the total risk in the study region thanunreinforced masonry buildings.
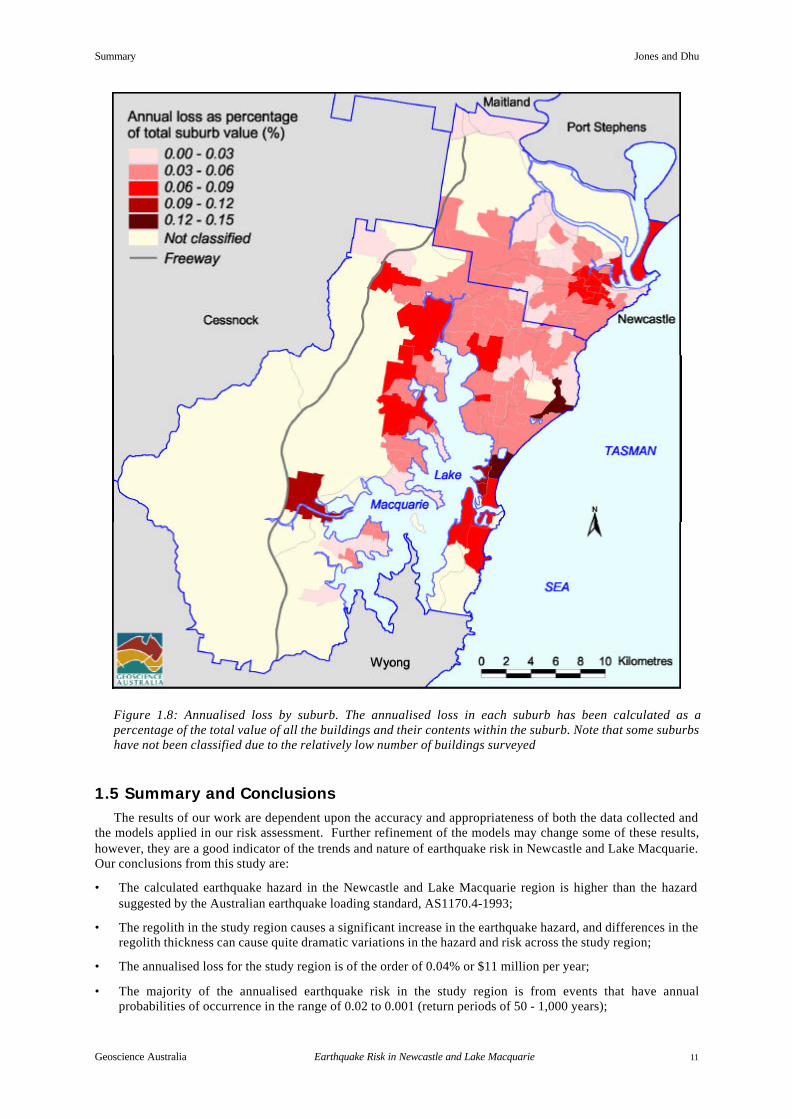
Figure 1.8 presents the annualised loss by suburb, and clearly demonstrates that the loss varies spatiallyacross the study region. This variation in loss can be partially attributed to differences in the building stockacross the study region. However, the underlying regolith also affects the annualised losses, with areas that arebuilt on substantial thicknesses of regolith, such as parts of the Newcastle municipality, having noticeably higherannualised losses than some other areas.
It is also possible to determine the relative contributions to the risk from earthquakes of different magnitudesat varying distances from the buildings within the study region. Over half the earthquake risk in the study regionis due to earthquakes with moment magnitudes around 5 at distances of less than 30 km. This result furthersuggests that that the majority of the risk in the region can be attributed to moderate-impact, relatively infrequentevents rather than high-impact, but extremely rare, events.
Figure 1.7: Annualised loss for a selection of building types in the study region. The annualised loss for aspecific building type is described as a percentage of the total value of that building type and its contents inthe study region
Summary Jones and Dhu
Geoscience Australia Earthquake Risk in Newcastle and Lake Macquarie 11
Figure 1.8: Annualised loss by suburb. The annualised loss in each suburb has been calculated as apercentage of the total value of all the buildings and their contents within the suburb. Note that some suburbshave not been classified due to the relatively low number of buildings surveyed
1.5 Summary and ConclusionsThe results of our work are dependent upon the accuracy and appropriateness of both the data collected and
the models applied in our risk assessment. Further refinement of the models may change some of these results,however, they are a good indicator of the trends and nature of earthquake risk in Newcastle and Lake Macquarie.Our conclusions from this study are:
• The calculated earthquake hazard in the Newcastle and Lake Macquarie region is higher than the hazardsuggested by the Australian earthquake loading standard, AS1170.4-1993;
• The regolith in the study region causes a significant increase in the earthquake hazard, and differences in theregolith thickness can cause quite dramatic variations in the hazard and risk across the study region;
• The annualised loss for the study region is of the order of 0.04% or $11 million per year;
• The majority of the annualised earthquake risk in the study region is from events that have annualprobabilities of occurrence in the range of 0.02 to 0.001 (return periods of 50 - 1,000 years);
Summary Jones and Dhu
Geoscience Australia Earthquake Risk in Newcastle and Lake Macquarie 12
• The risk varies with building construction type, and unreinforced masonry structures have higher averagerisks per building than other construction types. Brick veneer buildings contribute about half of the totalrisk. This is partly because they comprise a large proportion of buildings in Newcastle and Lake Macquarie.Timber frame buildings with timber, fibro and other light wall claddings contribute approximately one-quarter of the risk. A further one-sixth of the risk is contributed by unreinforced masonry buildings;
• Damage to residential buildings contributes the vast majority of the risk (approximately 91%). This islargely because residential buildings comprise the vast majority of all buildings in Newcastle and LakeMacquarie;
• The 1989 Newcastle earthquake had an economic impact with a return period of the order of 1,500 years.According to our models, approximately 82% of all annualised risk in Newcastle and Lake Macquarie is dueto events with lesser economic impacts than the 1989 earthquake. Thus, events like the 1989 earthquake, oreven more catastrophic events, make only a small contribution to the earthquake risk in the region whenconsidered on an annualised basis. However, rare but catastrophic events are very important to emergencymanagers and the insurance and reinsurance industries;
• Annualised risk varies considerably across Newcastle and Lake Macquarie. It depends on the nature of theunderlying regolith, the composition of the building stock and building usage in particular areas. Our resultssuggest that the suburbs most at risk in Newcastle, determined by a percentage of the total value ofbuildings and contents in the suburb, are Broadmeadow, Carrington, Hamilton, Hamilton East, HamiltonNorth, Hamilton South, Islington , Maryville, Stockton, The Junction, Warabrook and Wickham. In LakeMacquarie the suburbs most at risk are Belmont South, Blacksmiths, Caves Beach, Marks Point, Pelican,Swansea and Teralba. Further research into the building parameters for unreinforced masonry constructiontypes may change these conclusions, especially in older suburbs such as Newcastle, Newcastle East,Newcastle West and Cooks Hill. Other Lake Macquarie suburbs such as Cooranbong, Dora Creek,Estelville, Fassifern, Holmesville, Killingworth, Redhead, Toronto and Warners Bay also had highannualised risk in our results, but the results are less reliable because survey rates were low in these suburbs,and the regolith site modelling is inferior to that in Newcastle;
• Over half of the earthquake risk is from moderate-magnitude earthquakes, with moment magnitudes around5, that occur less than 30 km from the study area. This conclusion has implications for emergencymanagement in the lower Hunter. It may be appropriate to prepare for the possible impacts of such eventsrather than on catastrophic events that have an extremely small probability of occurring;
• In general, the risk of casualties from earthquakes is low. However, we do not rule out the possibility thatcasualties in future events could be caused by damage to a single building, or a small number of buildings. Itis extremely unlikely that any event capable of causing widespread casualties will occur in the study region;
• The results also have implications for the earthquake risk facing larger Australian cities such as Sydney,Melbourne and Adelaide. This is due to a number of factors, including similarities between the earthquakehazard in Newcastle and Lake Macquarie and other parts of Australia, and similarities between the urbanenvironments, particularly the composition of the building stock;
• The earthquake risk to Newcastle and Lake Macquarie may be reduced gradually over time by improvedbuilding construction practices, attrition of vulnerable building stock such as unreinforced masonry, and byreducing vulnerability of existing buildings through renovations constructed to modern code standards;
• Good building practice may be the single, most important, long-term factor in reducing economic losses andcasualties from earthquakes in Newcastle and Lake Macquarie.
It should be emphasised that a great deal of variability was included in the models used to generate theseresults. To some degree this variability was incorporated to account for our lack of knowledge about the variousmodels used in the study. The effect of high levels of variability is to increase the estimates of risk. Futurestudies on the earthquake risk in the region should focus on improving the models that have been used. This willallow for the variability in the models to be decreased, which will most probably result in a decrease in theestimated risk.
Summary Jones and Dhu
Geoscience Australia Earthquake Risk in Newcastle and Lake Macquarie 13
1.6 Suggested Mitigation Options• Newcastle City Council and Lake Macquarie City Council should consider adopting the site class maps and
the associated, period-dependent median amplification factors in their land planning regulations. Theamplification factors could replace the site factor S in AS1170.4-1993 in determining earthquake loadingsfor structures in Newcastle and Lake Macquarie. The amplification factors that refer to a peak groundacceleration on rock of 0.25 g from a magnitude 5.5 earthquake (Table 4-4) are appropriate, for normalstructures, for earthquake loadings with a 10% probability of occurrence in 50 years.
• Enforce the compliance of all new structures with current earthquake loading standards. Two importantareas where improvements could be made are in ensuring that mortar quality and wall tie placement andspecifications comply with code specifications.
• Provide adequate insurance against earthquakes. Householders, small business operators and corporationsshould ensure that their earthquake insurance is adequate. The cost of repair or replacement of heritagebuildings can be significantly higher than the corresponding costs for modern buildings and so there ispotential for heritage buildings to be underinsured to a greater extent than other buildings.
• Protect facilities such as police, fire and ambulance stations and hospitals, which provide essential servicesfollowing any earthquake event. These facilities could be examined by suitably qualified engineers on a site-by-site basis to assess their performance under earthquake loadings. The survey of essential facilities carriedout during this study found that many of these facilities were built on regolith site classes that dramaticallyincreased earthquake hazard and/or were of vulnerable construction types.
• Review earthquake loading standards. In this study, certain levels of building damage were estimated as aresult of certain levels of ground shaking. The levels of damage may be more or less than what engineerswould have expected from the input ground motions. If the damage predicted by the models is higher thanwould have been expected by expert engineers, then design standards may need to be made more rigorous.The damage models need to be rigorous for this review of design standards to be meaningful.
• Collect future post disaster damage, economic, social and insured loss data in a systematic, pre-planned waywith a high degree of detail and accuracy so that risk assessments will be improved and the amount ofvariability reduced.
• Collect information on building parameters that contribute to vulnerability to earthquakes on a systematicbasis and maintain databases containing this information. This need not be a tedious task if it is combinedwith similar related information gathering as for example through development approval processes. Theinformation may also be useful for other purposes, for example, as estimating the vulnerability of thecommunity to other hazards such as fire and wind, and would be valuable to the insurance industry. Thislong term strategy would assist risk assessments and risk management in the future.
1.7 Future Directions for Earthquake Risk Assessment
Many improvements and additions can be made to improve the techniques used in this study. Improvementcan be made through new scientific, engineering and socio-economic research, by expanding the scope of therisk assessment to capture other sources of risk outside of what has been assessed so far, and by collecting,compiling and assessing new information to assist these initiatives. Chapters 4 and 6 each contain a discussion ofthe sources of earthquake hazard and risk variability.
Some important measures to improve earthquake risk assessment in Newcastle and Lake Macquarie aresuggested below. The list is not comprehensive.
In this study, we have assessed direct economic losses due to building damage. Our study has not addressedthe direct losses from business interruption or the indirect losses to other communities resulting fromearthquakes in Newcastle and Lake Macquarie. An assessment of these losses would give a more completeestimate of the total risk due to earthquakes in Newcastle and Lake Macquarie.
The importance of the impacts of earthquakes on ‘lifelines’ such as electric power and water supply needs tobe investigated. In Chapter 5, a preliminary analysis was undertaken of the exposure of sewer and water facilitiesdue to their location on the various regolith site classes. Further investigation is required to assess the risk tolifelines in Newcastle and Lake Macquarie. This investigation needs to address the impact that earthquakes could
Summary Jones and Dhu
Geoscience Australia Earthquake Risk in Newcastle and Lake Macquarie 14
have on lifeline function, as well as the consequent impact on the broader community due to impaired lifelinefunctioning.
The socio-economic implications of earthquake impacts on Newcastle and Lake Macquarie also need to beassessed. In the first instance, the simplest socio-economic vulnerability models would relate structural damageto the impact on all community activities and the time taken to restore the community to its normal state.Geoscience Australia has assembled some relevant information that could assist such investigations in future,and is working to develop socio-economic loss models for natural hazards.
The methodology used in the modelling approach is a significant improvement over previously publishedearthquake risk assessment models applied to Australia. However, Geoscience Australia’s model will benefitfrom further validation, which will need to be carried out with the support and cooperation of others.
The engineering vulnerability models need to be checked, modified and produced as necessary to make themappropriate for Australian building stock. This requires a long-term, engineering research effort. Models forsome construction types including timber frame buildings were developed by GA and structural engineeringexperts based on Australian design and construction practice were used in this study. Models for other buildingtypes such as some steel frame buildings have been adopted without alteration from US models. The efforts toimprove the models should concentrate on the construction types that are the most important contributors to risk,as they have done so far. For Newcastle and Lake Macquarie, these are timber frame structures (especially brickveneer structures) and unreinforced masonry structures. Details such as tile or steel roof, masonry gable ends,parapets and chimneys, number of storeys in low rise buildings, soft storey, are important components of thevulnerability models. Other structural types may be important because, even though they are relatively few innumber in the study area, such buildings may be classified as ‘important’ buildings or house essential services.Concrete frame buildings are one example of such building construction types.
Part of the assessment process for the building vulnerability models is to examine the degrees of structural,non-structural and contents damage, and economic losses, that are predicted by the models for certain levels ofinput ground shaking. The vulnerability and economic loss models need to be further reviewed by the structuralengineering community to improve confidence in the results produced by them. For example, upon furtheranalysis, the results of our modelling may show that significant simulated economic losses are due toacceleration effects rather than lateral displacements. These outcomes should be compared with the expectationsof the structural engineering community and the model parameters adjusted if necessary.
The degree of damage and economic loss predicted by the models can be used to assess the appropriatenessof earthquake loading standard specifications. For example, is the economic loss predicted by ground shakingwith a 10% probability of occurrence in 50 years acceptable to the loading committee, the insurance andconstruction industries, and to government?
Sensitivity tests should be run by varying parameter values in the models to give alternative estimates of risk.The results may point to areas where efforts should be made to improve the models or collect new data. Reducedvariability in the models will lead to more accurate and reliable estimates of risk.
Assessments of future risk based on projections of changes in building stock and demographics would bevaluable to the assist decisions on the development of Newcastle and Lake Macquarie. A cost/benefit analysis ofthe effectiveness of introducing various mitigation measures would also assist the rational development of thecities. Assessments of future risk, and cost/benefit analyses, would be aided by masonry vulnerability modelsthat accounted for building condition.
1.8 Final RemarksGeoscience Australia is actively developing new techniques and revising its methodologies. Other workers in
planning, emergency management, engineering, the insurance industry, the utility corporations, sociology andthe finance industry are also putting increasing efforts into risk management for natural hazards includingearthquakes. It is our hope that this study will assist these workers, the people of Newcastle and Lake Macquarie,and the broader Australian community, in reducing earthquake risk.
As a final note it should be remembered that, in the aftermath of the 1989 earthquake, there were manystudies and recommendations on what should be done to mitigate the effects of future earthquakes. However,thirteen years on, few of the recommendations have been implemented. We urge the relevant authorities toreview the recommendations made in this report and previous reports such as that conducted by the Institution ofEngineers (Melchers, 1990) and to take appropriate action, so that ultimately we will have safer and moreprosperous communities.
Acknowledgments
Geoscience Australia Earthquake Risk in Newcastle and Lake Macquarie 15
ACKNOWLEDGMENTS
We are grateful to Newcastle City Council for its continued support and encouragement over the course ofthe project that led to this report. The project was conducted over four years. In this time, two Lord Mayors heldoffice, Cr Greg Heys and Cr John Tate, both of whom personally supported this project. Council officersprovided many valuable datasets and other information to the project. These included damage datasets andNRMA Insurance records for the 1989 earthquake, datasets on roads, cadastre, drainage, aerial photographs, andmany more. We thank Lynn Gray for his close association with the project. Lynn was influential in providingCouncil office accommodation for Geoscience Australia staff member David Stewart in Newcastle. Lynn wasthe Council’s point of contact with the project. We are grateful for the advice, guidance, provision of data andkeen interest in the project provided by Council officers Col Sandeman and Bob Boyce. We thank NewcastleRegional Museum directors Gavin Fry and, before him, Patrick Filmer-Sankey for their support, especially inrelation to the ‘Earthquake!’ exhibition at the museum.
We are also grateful to Lake Macquarie City Council for their participation in the project and theirenthusiastic support of the project throughout its course. In particular, we thank Robert Taylor, who provided afriendly and very effective interface to Council operations, staff, and data over the four years.
We thank Bob McGregor-Skinner, the Hunter District Emergency Management Officer and convenor of theHunter District Emergency Management Committee, for his ongoing, warm and beneficial relationship with GAover nearly a decade. Bob provided many good ideas to the project, especially in relation to promoting its aimsto emergency management specialists and the public alike.
We thank the members of the Newcastle Project Coordinating Committee who provided their time overseveral years to guide the project and review its progress. They were Lynn Gray (Newcastle City Council), BobTaylor (Lake Macquarie City Council), Robert McGregor Skinner (Hunter District Emergency ManagementCommittee) Peter Buckland (Hunter Water Corporation), George Walker (Aon Australia), Christopher Henri(Insurance Disaster Response Organisation), John Brunton (NSW Department of Mineral Resources), ChrisJenkins (Institution of Engineers, Australia) and Bob Stobie (Telstra).
The Hunter Water Corporation provided valuable datasets on water and sewer distribution networks to theproject. We thank them for their cooperation and support.
David Stewart played a key role in the project, as the Newcastle - Lake Macquarie Project Leader, based inNewcastle for two years. David remains an author in some chapters of the report because of his importantcontributions, even though his role officially was completed in 2001. David was instrumental in gathering thesupport of the community and many government and private organisations for the project.
John Stehle played a major role in producing results for the Interim Technical Report and convening thegroup of experts that reviewed the capacity spectrum parameters for the engineering vulnerability models. Johnalso played a primary role in developing some of the original simulation techniques, especially those for theengineering models. John remains an author in some chapters of the report because of his original and stillvaluable contributions.
Individuals from several departments of the University of Newcastle brought considerable knowledge andexpertise to the project. Steve Fityus developed a model for the deposition of geological sediments in theNewcastle area in collaboration with GA. David Smith also assisted in the development of this model. AdrianPage, Mark Stewart, and Rob Melchers each provided unmatched engineering and risk assessment expertise, aswell as first hand knowledge of the impacts of the 1989 Newcastle earthquake. Phil Seccombe provided valuableinsights into the regional geology and tectonics.
Thank you to Gary Taunton and Bruce Hickey of the Department of Land & Property Information - NewSouth Wales for provision of some of the spatial datasets used within this study. Also to Adrian Tout of PacificAccess for supplying WhereIS digital data.
The NSW Department of Mineral Resources hosted a workshop in December 2000 to determine aseismotectonic model for the Hunter region. We would especially like to thank Brad Mullard, Richard Glen andJohn Brunton for their assistance in making the workshop a success. We also thank other participants in thisworkshop: Stephen Cox, Ron Boyd, Gary Huftile, Michael Neville, as well as the GA participants.
We thank all of the participants in the engineering workshop held at the University of Melbourne on 23February 2001 to determine building parameters for earthquake. We also thank them for their continued inputfollowing the workshop. They were John Wilson, Priyan Mendis, Emad Gad, Mark Edwards and Nelson Lamfrom the University of Melbourne, Adrian Page and Rob Melchers from the University of Newcastle, Michael
Acknowledgments
Geoscience Australia Earthquake Risk in Newcastle and Lake Macquarie 16
Griffith from the University of Adelaide, Greg Foliente and Philip Paevere from CSIRO, George Walker fromAon Australia, David Henderson from the James Cook University, and Saman da Silva from RMIT. Several GAengineers and seismologists also contributed.
The Hunter Mutual Aid Group, chaired by Bill Edwards, enthusiastically supported all phases of the projectand promoted it to emergency managers in industry and government throughout the Hunter Valley.
The GA Field Data Acquisition Team consisting of Andrew Hislop, Ben Ghol, Nikki Brown, Craig Bagnall,Dave Pownall, John Stehle, and Neil Corby collected comprehensive information on almost 6500 buildings inthe study area, creating the backbone dataset for this project.
We also thank the GA Microtremor Data Acquisition Team who collected microtremor data for more than400 sites in the study area. These data were used to help prepare the site class maps.
We thank GA’s Miriam Middelmann and Anita Dwyer for providing the first draft of the brochure for thereport.
We would like to thank Richard Capsis and Chris Fitzgerald of the Geospatial Application and VisualisationUnit, GA for their assistance in preparing material for this report. We would also like to thank Karin Weiss andRex Bates from GA for providing the graphic design and production of the report.
Many thanks go to Andres Mendez and his colleagues at Aon Re Worldwide for providing a platform ofearthquake hazard related software from which our own software has been based. Andres’ ongoing technicaladvice has been invaluable during the later phases of this study.
Thanks to the Walt Silva and his associates at Pacific Engineering and Analysis, El Cerrito, California forproviding the RASCALS software used for creating site amplification factors, as well as a great deal of supportin the use of RASCALS.
Valuable discussions were held with Mark Edwards from Melbourne University concerning the buildingCapacity Spectrum method for calculating building damage.
We would like to express our thanks to George Walker of Aon Insurance, Mark Stewart of The University ofNewcastle and Mark Edwards of Melbourne University who provided us with valuable and detailed commentsand review of a draft version of this report.
Finally, we thank any other people who have assisted this project to its completion, but whom we haveinadvertently overlooked in our thanks.
Table of Contents
Geoscience Australia Earthquake Risk in Newcastle and Lake Macquarie 17
TABLE OF CONTENTS
1 Summary (T. Jones and T. Dhu)________________________________________________________ 1
1.1 Background____________________________________________________________________ 1
1.2 Introduction____________________________________________________________________ 1
1.3 Methodology___________________________________________________________________ 2
1.3.1 Earthquake Hazard _________________________________________________________ 2
1.3.2 Elements at Risk ___________________________________________________________ 3
1.3.3 Vulnerability of the Elements at Risk ___________________________________________ 3
1.3.4 Earthquake Risk ___________________________________________________________ 3
1.3.5 Incorporation of Variability _________________________________________________ 3
1.3.6 Verification of the Risk Assessment Methodology – The 1989 Newcastle Earthquake _______ 4
1.4 Earthquake Risk Assessment Results _________________________________________________ 4
1.4.1 Earthquake Hazard in the Newcastle and Lake Macquarie Region _____________________ 4
1.4.2 Earthquake Risk in the Newcastle and Lake Macquarie Region ________________________ 9
1.5 Summary and Conclusions _______________________________________________________ 11
1.6 Suggested Mitigation Options _____________________________________________________ 13
1.7 Future Directions for Earthquake Risk Assessment _____________________________________ 13
1.8 Final Remarks _________________________________________________________________ 14
Acknowledgments __________________________________________________________________ 15
Table of Contents ___________________________________________________________________ 17
2 Introduction - Urban Geohazard Risk Assessment (D. Stewart and T. Jones) _____________________ 22
2.1 Newcastle & Lake Macquarie Project________________________________________________ 22
2.2 The Cities Project ______________________________________________________________ 22
2.3 Risk Management ______________________________________________________________ 24
2.4 What is Risk?__________________________________________________________________ 24
2.5 Risk Identification ______________________________________________________________ 25
2.6 Risk Analysis _________________________________________________________________ 26
2.7 Risk Evaluation ________________________________________________________________ 27
2.8 Risk Mitigation Strategies ________________________________________________________ 29
2.9 Confidence, Uncertainty and Probability _____________________________________________ 29
2.10 Earthquake Risk Assessment Methodology Adopted for this Study ________________________ 29
3 Earthquake History, Regional Seismicity and the 1989 Newcastle Earthquake (C. Sinadinovski, T. Jones,D. Stewart, and N. Corby) _______________________________________________________________ 31
3.1 Seismology ___________________________________________________________________ 31
3.1.1 Isoseismal Maps __________________________________________________________ 33
3.2 The 1989 Newcastle Earthquake ___________________________________________________ 38
3.2.1 Principal Information Sources _______________________________________________ 40
3.2.2 Building Damage States in the 1989 Newcastle Earthquake _________________________ 41
Table of Contents
Geoscience Australia Earthquake Risk in Newcastle and Lake Macquarie 18
4 Earthquake Hazard (T. Dhu, D. Robinson, C. Sinadinovski, T. Jones, N. Corby, A. Jones and J. Schneider)___________________________________________________________________________________ 43
4.1 Introduction___________________________________________________________________ 43
4.2 Earthquake Source Model ________________________________________________________ 43
4.2.1 Introduction _____________________________________________________________ 43
4.2.2 Earthquake Source Zones ___________________________________________________ 43
4.3 Simulation of Earthquakes ________________________________________________________ 50
4.4 Attenuation Model______________________________________________________________ 52
4.5 Site Response Model____________________________________________________________ 53
4.5.1 Introduction _____________________________________________________________ 53
4.5.2 Geotechnical Site Class Models ______________________________________________ 53
4.5.3 Amplification Factors ______________________________________________________ 56
4.6 Earthquake Hazard______________________________________________________________ 60
4.6.1 Introduction _____________________________________________________________ 60
4.6.2 Calculation of Earthquake Hazard ____________________________________________ 60
4.6.3 10% Chance of Exceedance in 50 Years (approx. 500 year return period) _______________ 60
4.6.4 2% Chance of Exceedance in 50 Years (approx. 2,500 year return period) ______________ 69
4.7 Assumptions and Uncertainties of the Earthquake Hazard Models _________________________ 76
4.7.1 Earthquake Source Model – Assumptions and Uncertainties _______________________ 76
4.7.2 Attenuation Model – Assumptions and Uncertainties ______________________________ 76
5 The Elements at Risk in Newcastle and Lake Macquarie (J. Stehle, N. Corby, D. Stewart and I. Hartig) _ 77
5.1 The Urban Setting ______________________________________________________________ 77
5.1.1 The Development of Newcastle and Lake Macquarie_______________________________ 77
5.1.2 Geographical Setting ______________________________________________________ 77
5.1.3 Significant Features _______________________________________________________ 78
5.2 Elements at Risk - Buildings _____________________________________________________ 79
5.2.1 Distribution of Buildings ____________________________________________________ 79
5.2.2 HAZUS Construction Types ________________________________________________ 80
5.2.3 Key Facilities ____________________________________________________________ 83
5.3 Elements at Risk - Societal ______________________________________________________ 85
5.3.1 Economic _______________________________________________________________ 85
5.3.2 Casualty ________________________________________________________________ 85
5.3.3 Shelter _________________________________________________________________ 88
5.3.4 Trauma _________________________________________________________________ 88
5.3.5 Social Indices ____________________________________________________________ 88
5.4 Elements at Risk - Lifelines _______________________________________________________ 93
5.4.1 Roads __________________________________________________________________ 93
5.4.2 Rail ____________________________________________________________________ 93
5.4.3 Sea Transport ____________________________________________________________ 93
5.4.4 Air Transport ____________________________________________________________ 93
Table of Contents
Geoscience Australia Earthquake Risk in Newcastle and Lake Macquarie 19
5.4.5 Electricity _______________________________________________________________ 93
5.4.6 Water and Sewerage _______________________________________________________ 93
5.4.7 Gas and Other Fuels ______________________________________________________ 97
5.4.8 Communication ___________________________________________________________ 97
5.5 Collected Statistics _____________________________________________________________ 97
5.5.1 Roads __________________________________________________________________ 97
5.5.2 Rail ____________________________________________________________________ 98
5.5.3 Sea Transport ____________________________________________________________ 99
5.5.4 Air Transport ___________________________________________________________ 99
5.5.5 Electricity _______________________________________________________________ 99
5.5.6 Water and Sewerage _______________________________________________________ 99
5.5.7 Gas and Other Fuels _______________________________________________________ 99
5.5.8 Communication ___________________________________________________________ 99
6 Earthquake Risk (G. Fulford, T. Jones, J. Stehle, N. Corby, D. Robinson, J. Schneider and T. Dhu) ___ 103
6.1 Methodology for Vulnerability and Economic Loss ____________________________________ 103
6.1.1 Incorporating Variability in the Building Vulnerability Models _____________________ 107
6.1.2 Economic Loss Model _____________________________________________________ 107
6.1.3 Casualty Modelling _______________________________________________________ 109
6.2 The 1989 Newcastle Earthquake _________________________________________________ 110
6.2.1 Available Data __________________________________________________________ 110
6.2.2 Results for the simulated 1989 Newcastle earthquake _____________________________ 112
6.2.3 Uncertainties in the Model _________________________________________________ 115
6.3 Economic Risk in Newcastle and Lake Macquarie ____________________________________ 115
6.3.1 Overall Impact __________________________________________________________ 115
6.3.2 Localised Impact and Risk _________________________________________________ 120
6.3.3 Uncertainties in the Modelling ______________________________________________ 121
7 Discussion and Conclusions (T. Jones, G. Fulford and T. Dhu) ______________________________ 123
7.1 Discussion___________________________________________________________________ 123
7.1.1 Earthquake Hazard _______________________________________________________ 123
7.1.2 Vulnerability of the Building Stock to Earthquakes _______________________________ 123
7.1.3 Earthquake Risk _________________________________________________________ 124
7.1.4 Effect of Variability on Results _____________________________________________ 127
7.2 Conclusions _________________________________________________________________ 127
7.3 Suggested Mitigation Options ____________________________________________________ 128
7.4 Future Directions for Earthquake Risk Assessment ___________________________________ 129
7.5 Final Remarks ________________________________________________________________ 130
Appendix A - Modified Mercalli (MM) Scale of Earthquake Intensity (after Dowrick, 1996) _________ 131
A.1 MM I ______________________________________________________________________ 131
A.2 MM II______________________________________________________________________ 131
A.3 MM III _____________________________________________________________________ 131
Table of Contents
Geoscience Australia Earthquake Risk in Newcastle and Lake Macquarie 20
A.4 MM IV _____________________________________________________________________ 131
A.5 MM V______________________________________________________________________ 131
A.6 MM VI _____________________________________________________________________ 131
A.7 MM VII ____________________________________________________________________ 132
A.8 MM VIII____________________________________________________________________ 132
A.9 MM IX _____________________________________________________________________ 133
A.10 MM X_____________________________________________________________________ 133
A.11 MM XI ____________________________________________________________________ 133
A.12 MM XII ___________________________________________________________________ 133
A.13 Construction types ___________________________________________________________ 133
Appendix B - Regional Seismicity______________________________________________________ 135
B.1 List of Earthquakes with ML ≥ 3.0 in the Investigated Region____________________________ 135
B.2 List of Significant Earthquakes in the Study Region ___________________________________ 140
B.3 Isoseimal Maps_______________________________________________________________ 141
Appendix C - Earthquake Hazard in the Lower Hunter Region of NSW__________________________ 149
C.1 The Workshop _______________________________________________________________ 149
C.2 Part A ~ Regional Earthquake Hazard Models ________________________________________ 149
C.2.1 The Cities Project ________________________________________________________ 149
C.2.2 Definition of Earthquake Source Zones ________________________________________ 150
C.2.3 Conclusions & Recommendations ____________________________________________ 153
C.2.4 Earthquake Hazard Model for the Lower Hunter _________________________________ 153
C.3 Part B - Notes From the Workshop ______________________________________________ 154
C.3.1 Hazard Models Framework ________________________________________________ 154
C.3.2 Regional Earthquake Catalogue______________________________________________ 154
C.3.3 Tectonic Framework _____________________________________________________ 155
C.3.4 Source Models __________________________________________________________ 155
C.3.5 Fault Sources ___________________________________________________________ 156
C.3.6 Conclusions ____________________________________________________________ 157
C.4 Part C - Workshop Participants ___________________________________________________ 160
Appendix D - Geology and Tectonic framework ___________________________________________ 161
D.1 Introduction _________________________________________________________________ 161
D.1.1 Regional Geology _______________________________________________________ 162
D.2 Structural Geology ____________________________________________________________ 163
D.2.1 Offshore Structural Geology _______________________________________________ 163
D.2.2 Onshore Structure _______________________________________________________ 165
D.3 Quaternary Geology ___________________________________________________________ 168
D.3.1 Previous Work __________________________________________________________ 168
D.3.2 New Data and Methodology ________________________________________________ 168
D.3.3 Newcastle Basin Quaternary Succession ______________________________________ 169
D.3.4 Lake Macquarie Quaternary Succession________________________________________ 174
Table of Contents
Geoscience Australia Earthquake Risk in Newcastle and Lake Macquarie 21
D.3.5 Depositional History _____________________________________________________ 176
D.4 Characterisation of Site Classes Based on Local Geology _______________________________ 177
D.4.1 Weathered Rock _________________________________________________________ 177
D.4.2 Quaternary Sediments _____________________________________________________ 177
D.4.3 Extrapolation of Site Classes to Broader Newcastle and Lake Macquarie Region ________ 177
Appendix E - Microtremor Survey ___________________________________________________ 179
E.1 Methodology _______________________________________________________________ 179
E.2 Natural Period Results _________________________________________________________ 179
Appendix F - Geotechnical Properties Of Newcastle and Lake Macquarie Regolith Site Classes ______ 182
F.1 Shear Wave Velocity___________________________________________________________ 182
F.2 Densities ___________________________________________________________________ 182
Appendix G - Building Inventory _____________________________________________________ 187
Appendix H - Data and Information Sources _____________________________________________ 238
Appendix I - Extracts of Key Reports on the 1989 Newcastle Earthquake ____________________ 243
I.1 Introduction ______________________________________________________________________ 243
I.2 Information Resources on the Newcastle Earthquake _____________________________________ 243
I.3 IEAust 1990 Report
I.4 PWD Report Jan 1992
I.5 The Centre for Earthquake Research in Australia
I.6 The Earth was Raised up in Waves Like the Sea ... Earthquake Tremors Felt in
_______________________________________________ 245
______________________________________________256 ______________________________ 258 the Hunter Valley Since
White settlement
References ______________________________________________________ 265
______________________________________________________262