Embed Size (px)
Citation preview

0
Earthquake Observation by Social Sensors
Takeshi Sakaki and Yutaka MatsuoThe University of Tokyo
Japan
1. Introduction
Many studies have examined observation and detection of earthquakes using physicalsensors. These systems require highly accurate physical sensors located over a broad area,necessitating great expense to set up the supporting infrastructure.
Social media have garnered much attention recently and the number of social media users hasbeen increasing. Social media are kinds of media for social interaction among users. Userscreate contents for themselves and exchange them on social media. Social media includemany kinds of forms, including weblog, wikis, videos and microblogs. One of the biggestcharacteristics of social media is user-generated contents.
Social media users often make posts about what happened around them: live performance,sports events and natural disaster, including earthquake. Figure 1 depicts the graph of tweetcounts and the sizes of earthquake on March 11th 2011, the day of the Great Eastern JapanEarthquake. It is apparent that tweet counts and earthquake occurrences are correlated. Itmeans that when earthquakes occurs, social media users make posts about those earthquakes.
Along with the popularization of social media, new methods for earthquake observationare appearing. These method use information about earthquakes posted on the internetby users. For example, the web site Did You Feel It?, operated by the United StatesGeological Survey (USGS), gathers earthquake information from web-site users through a
Fig. 1. Size of earthquakes and change of tweet counts on the day of the Great Eastern JapanEarthquake
15
www.intechopen.com

2 Will-be-set-by-IN-TECH
questionnaire format(Intensity, 2005). From the Twitter web-site, Toretter extracts tweets thatrefer to earthquakes and estimates the location of an earthquake’s epicenter using locationinformation included with those tweets(Sakaki et al., 2010)
These methods treat social media users as sensors. We designate these virtual sensors associal sensors, which entail no costs. Unfortunately, such sensors provide a signal that isextremely noisy because users sometimes misunderstand phenomena, sleep, and are not neara computer.
We introduce these methods and explain a process for earthquake detection by analyzingsocial sensor information. We introduce current studies and services for earthquakeobservation using social sensors . Moreover, we explain Toretter as an example and describeits mechanisms.
2. Overview of earthquake observation by social sensors
We explain the basic idea of social sensors and introduce internet service users as social sensorsto observe earthquakes.
2.1 Earthquake observation services performed by social sensors
We introduce four earthquake observation services that use information from internet users.In this chapter, we examine Toretter as an example. We explain its detailed mechanisms in thenext chapter.
Did You Feel It?The web site Did You Feel It?, which is operated by United States Geological Survey (USGS),is shown in Fig. 2. Through the internet, it gathers earthquake information from users whoexperienced those earthquakes directly (Intensity, 2005).
Fig. 2. Screenshot of Did You Feel It?
TEDThe USGS also manages the Twitter Earthquake Detector (TED), which gathers tweetsreferring to earthquake occurrences from Twitter. They acquire location information andphotographs attached to tweets and show this information related to maps(Survey, 2009).
314 Earthquake Research and Analysis – Statistical Studies, Observations and Planning
www.intechopen.com
Earthquake Observation by Social Sensors 3
iShakeThe iShake project has developed a smartphone application (Fig. 3) that uses a phoneto measure acceleration during an earthquake and report those data to researchers forprocessing (CITRIS, 2011). This project, conducted by UC Berkeley, is designed to createa system that moves beyond Did You Feel It?. Data from smartphone applications cancomplement data obtained from ground monitoring instruments, thereby improving theresolution and accuracy of earthquake intensity maps.
Fig. 3. Screenshot of iShake.
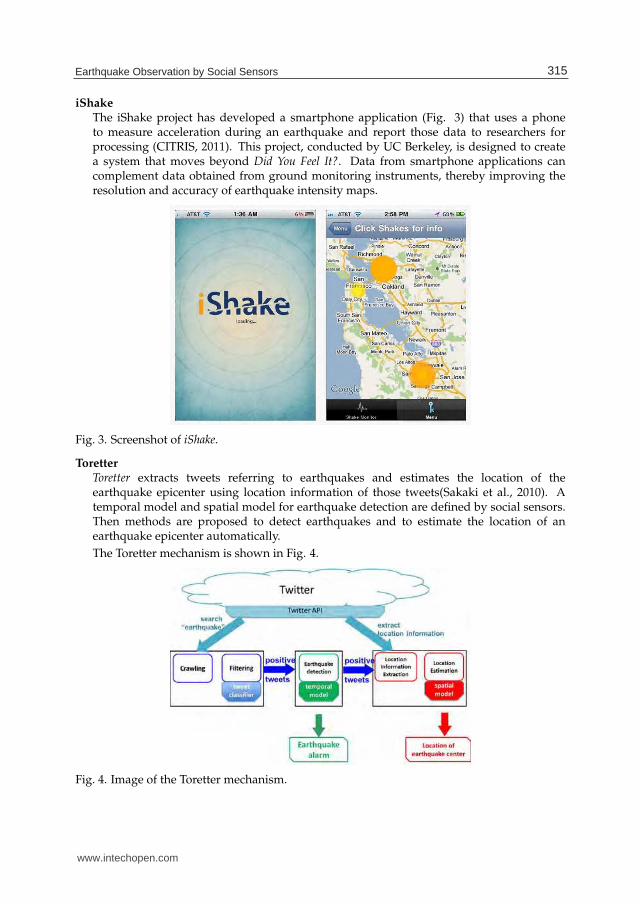
ToretterToretter extracts tweets referring to earthquakes and estimates the location of theearthquake epicenter using location information of those tweets(Sakaki et al., 2010). Atemporal model and spatial model for earthquake detection are defined by social sensors.Then methods are proposed to detect earthquakes and to estimate the location of anearthquake epicenter automatically.
The Toretter mechanism is shown in Fig. 4.
Fig. 4. Image of the Toretter mechanism.
315Earthquake Observation by Social Sensors
www.intechopen.com

4 Will-be-set-by-IN-TECH
First it collects tweets referring to earthquakes by crawling with the Twitter API andfiltering the tweet messages using a tweet classifier. Second it tries to detect an earthquakefrom collected tweets based on a temporal model for earthquake detection. Finally, itextracts location information for each tweet from Twitter. The system uses that informationand a particle filter to estimate the earthquake epicenter based on a spatial model for socialsensors.
In this chapter, we explain methods of earthquake observation using social sensors accordingto the Toretter mechanism. We explain this entire process in the following section.
2.2 Overview of social sensors
We introduce the mode of social sensors and describe their features in comparison to physicalsensors.
2.2.1 Basic idea of social sensors
Many methods and infrastructure can be used to observe events and natural phenomenausing physical sensors: heavy traffic, air pollution, astronomical events, weather phenomena,and earthquakes are some examples. The basic mechanisms of such observations by physicalsensors are presented on the right side of Fig. 5. First, a target event for observation occurs.Second, some sensors for the target event respond with a positive signal. Third, a centralserver collects signals from sensors and analyzes them. Finally, the server detects the targetevent or produces some observation values as output.
If users of social media observe an event, then similarly to physical sensors, they make postsabout the event. For example, some Twitter users might post "Oh earthquake!" or "pouringrain, thunder & lightning " or "It’s a double rainbow! & the moon is out. Beautiful!". Theseactions by users are analogous to the response of physical sensors to a stimulus: the users andsensors send a signal when an event occurs. Therefore, a user of social media is a sensor of akind. We designate such sensors as social sensors.
An observation system incorporating social sensors is depicted on the left side of Fig. 5.First, an event occurs. Second, social media users make posts about the event. Third, theposts are collected at a central server and analyzed. Finally, the server detects the event orproduces some observation value. This whole process corresponds to a process of observationby physical sensors, presented for comparison in Fig. 5
Methods for observing phenomena by physical sensors can be adapted to social sensors.Actually, some services based on social media use methods of observation resemblingmethods used with physical sensors.
Regarding Twitter users as social sensors, we can work with the following assumption.
1. Each Twitter user is regarded as a sensor. A sensor detects a target event and makes areport probabilistically.
2. Each tweet is associated with a time and location, which is a latitude–longitude pair.
2.2.2 Features of social sensors
Social sensors differ from physical sensors in some points. We describe features of socialsensors in comparison to physical sensors.
316 Earthquake Research and Analysis – Statistical Studies, Observations and Planning
www.intechopen.com

Earthquake Observation by Social Sensors 5
Fig. 5. Correspondence between event observation by social sensors and by physical sensors.
Social sensors are uncontrollable. They sometimes become inoperable because some usersare not on-line; maybe they are sleeping or busy doing something else. They also functionimproperly more often than physical sensors because users misinterpret events more oftenthan physical sensors. Therefore, it is necessary to know that social sensors are noisier thanphysical sensors and that their signals must be analyzed more carefully.
Social sensors, which are users of social media, are located over a wide area. They can giveresponses to events of many kinds, ranging from natural phenomena, such as earthquakes andhurricanes, to events related to human activities, such as heavy traffic, live performances, andelections. The extremely numerous social sensors all over the world present the possibilityof responding to events of many kinds. In other words, detection of target events can bedone with no cost to set up sensors. However, when using social media systems such asTwitter, which incorporate these social sensors, it is necessary to filter the signals (tweets)posted by social sensors (Twitter users) according to the event that is to be observed. Usingsome method, it is necessary to extract tweets referring to a target event. We summarize thefeatures of social sensors and physical sensors in Table 1.
We explain these methods in the next section.
3. Tweet collection
In the first step portrayed in Fig. 4, it is necessary to collect tweets referring to an earthquakefrom Twitter. This process includes two steps: crawling tweets from Twitter and filtering out
317Earthquake Observation by Social Sensors
www.intechopen.com

6 Will-be-set-by-IN-TECH
features physical social
accuracy high accuracy noisyversatility target events only event of any kindcost high very lowprocessing simple complex
Table 1. Features of physical sensor and social sensors.
tweets that do not refer to the earthquake. For crawling and filtering tweets, we recommendusing script programming languages, such as Python, PERL, and Ruby.
3.1 Crawling tweets from Twitter
To collect tweets or some user information from Twitter, one must use the Twitter ApplicationProgrammers Interface (API). Twitter API is a group of commands that are necessary to extractdata from Twitter. Twitter has APIs of three kinds: Search API, REST API, and Streaming API.In this section, we introduce Search API and Streaming API, which are necessary to crawltweets from Twitter. We explain REST API later because REST API is necessary to extractlocation information from Twitter information.
Additionally, it is known that Twitter API specifications are subject to change. When usingTwitter API, it is necessary to know the latest details and requirements. They are obtainablefrom Twitter API documentation1.
3.1.1 Twitter Search API
The Twitter Search API extracts tweets from Twitter, including search keywords or thosefitting other retrieval conditions, in chronological order. It is possible to use language, date,location and other conditions as retrieval conditions.
When searching tweets including earthquake posted from 1 Aug 2011 to 5 Aug 2011, one mightaccess the following URL:
http://search.twitter.com/search.json?q=earthquake&since=2011-09-01&until=2011-09-05
tweet time user tweet text
2011-09-04 04:47:10 user 1 The truth of 311 seismic terror.http://t.co/R9I6U9w 911#earthquake #fukushima #japan #CNN #tsunami #prayforJapan
2011-09-04 04:47:09 user 2 FML! What did I say?! @..... RT @.... 24 HOUREARTHQUAKE WARNING for San Diego, - 6.0+ likely - hey @....
2011-09-04 04:47:08 user 3 ML 2.3 SOUTHERN GREECE: Magnitude ML 2.3RegionSOUTHERN GREECEDate time 2011-09-04 04:37:42.0 UTCLocation ...
Table 2. Search results of keyword earthquake after the conversion.
It is possible to obtain results in Fig. 6, as described in JavaScript Object Notation (JSON)format, which is a text-based open standard designed for human-readable data. It is possibleto convert this result in Fig. 6 into Table 2 by parsing the result using a script programminglanguage. Parameters that are often used to collect tweets are shown in Table 3 (This table isreferred to Twitter API Documentation2).
1 https://dev.twitter.com/docs2 https://dev.twitter.com/docs/api/1/get/search
318 Earthquake Research and Analysis – Statistical Studies, Observations and Planning
www.intechopen.com

Earthquake Observation by Social Sensors 7
Fig. 6. Search results from Twitter Search API.
name explanation required value
q search keywords required -rpp the number of tweets to return per page optional up to 100result type search result of type optional mixed/recent/popularuntil tweets before the given date optional before todaysince tweets after the given date optional after 5 days agolang restricts tweets to the given language optional jp/en/all/others
Table 3. Search conditions of Twitter Search API.
Some points must be considered when using Twitter Search API:
• It is possible to collect tweets posted only during the prior five days. It is not possible tosearch tweets posted six days ago.
• It is only possible to collect the latest 1500 tweets at one time.(Technically speaking, it is possible to access one page with a request and track pages backto the 15th page. One page includes 100 tweets at most. Therefore it is possible to acquirethe latest 1500 tweets at one time.)
• One is limited to API requests.(No limit is published, but it is possible to access the Twitter Search API at least 500 timesper hour.)
Therefore, we recommend the collection of tweets every 10 min or more often because it isimpossible to crawl all tweets including earthquake if those tweets are posted at 2000 tweetsper hour and one uses Twitter Search API every hour. Actually, tweets including earthquakewere posted at more than 5000 per hour when the earthquake occurred on March 11, 2011.
Toretter requests the API command search 15 times every 5 min to collect the latest tweets eachtime: 180 command executions per hour.
3.1.2 Twitter Streaming API
The Twitter Streaming API extraction is defined in Twitter API documentation as follows:
319Earthquake Observation by Social Sensors
www.intechopen.com

8 Will-be-set-by-IN-TECH
The Twitter Streaming API enables high-throughput near-real-time access to varioussubsets of public and protected Twitter data.
Twitter Streaming API provides some methods shown in Table 4, of which filter method canbe used to crawl tweets related to earthquakes.
command explanation
filter returns public statuses that match one or more filtering conditions.
firehose returns all public statuses.A few companies have permission to access this command.
link returns all statuses containing http: and https:.
retweet returns all retweets
sample returns a random sample of all public statuses.(ratio is about 1%)
Table 4. Streaming API methods.
Filter method returns public statuses that match one or more filtering conditions. Allconditions of filter are presented in Table 5. It is possible to use the parameter track to collecttweets because keywords can be set as a condition value of track.
command explanation
follow returns public statuses that reference the given set of users.
track returns public statuses that include specified keywords.
locations returns public statuses that posted from a specific set of bounding boxes to track.
Table 5. Conditions of filter methods.
When using a filter command with the parameter keyword, earthquake, it is necessary to createa file called tracking that contains track=earthquake. Then one can access the following URL:
https://stream.twitter.com/1/statuses/filter.json
Streaming API also returns results in the form of JSON, shown in Fig. 6. Therefore, it ispossible to parse those results in the same way as results obtained with Search API.
It is possible to collect tweets including earthquake in real time. Some points must beconsidered when using Twitter Streaming API:
• The prepared server must have sufficiently high specifications to process all data receivedfrom Twitter.
• It is impossible to use some characters in Twitter Streaming API(e.g., Japanese characters can not be used in Twitter Streaming API).
Using Toretter, we want to detect earthquakes in Japan. For that purpose, it is necessary tocollect tweets including earthquake in Japanese. However, Japanese characters cannot be usedin Twitter Streaming API. Therefore, Toretter uses the Twitter Search API to crawl tweets. Tocollect tweets of languages other than English, it is necessary to check whether that languageis supported by the Twitter Streaming API.
320 Earthquake Research and Analysis – Statistical Studies, Observations and Planning
www.intechopen.com
Earthquake Observation by Social Sensors 9
tweet real-time
SYF News: Magnitude 7.0 earthquake shakes Vanuatu; no tsunami alert no
HOLY **** EARTHQUAKE yes
Powerful earthquake rocks Vanuatu, no tsunami warnings (Newkerala ) no
AAAAAAAAAH earthquake ! yes
Holy ****, that earthquake scared the **** outta me yes
a year on after our very first earthquake... and the shakes are still happening no
Table 6. Sample tweets and relevance of real-time earthquake detection.
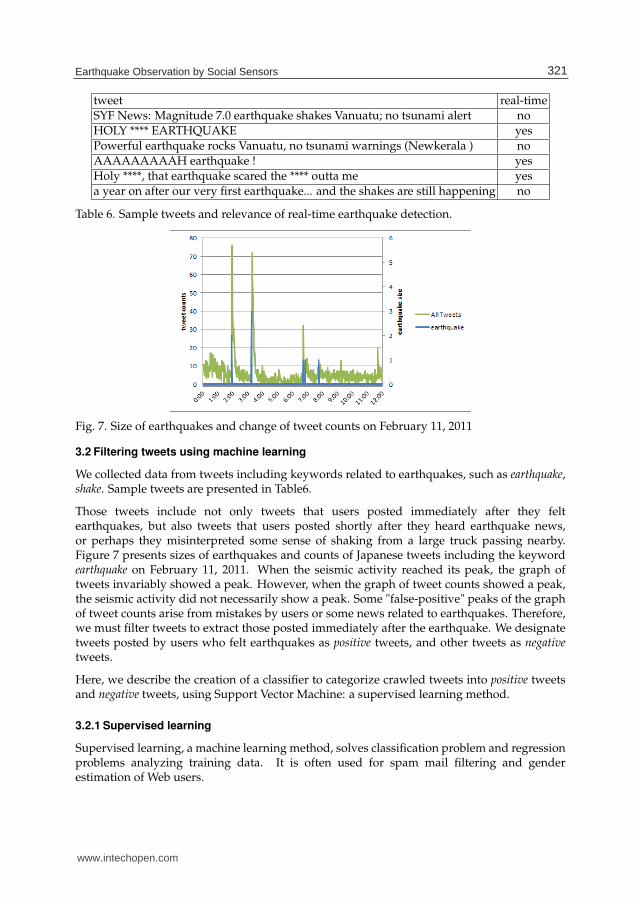
Fig. 7. Size of earthquakes and change of tweet counts on February 11, 2011
3.2 Filtering tweets using machine learning
We collected data from tweets including keywords related to earthquakes, such as earthquake,shake. Sample tweets are presented in Table6.
Those tweets include not only tweets that users posted immediately after they feltearthquakes, but also tweets that users posted shortly after they heard earthquake news,or perhaps they misinterpreted some sense of shaking from a large truck passing nearby.Figure 7 presents sizes of earthquakes and counts of Japanese tweets including the keywordearthquake on February 11, 2011. When the seismic activity reached its peak, the graph oftweets invariably showed a peak. However, when the graph of tweet counts showed a peak,the seismic activity did not necessarily show a peak. Some "false-positive" peaks of the graphof tweet counts arise from mistakes by users or some news related to earthquakes. Therefore,we must filter tweets to extract those posted immediately after the earthquake. We designatetweets posted by users who felt earthquakes as positive tweets, and other tweets as negativetweets.
Here, we describe the creation of a classifier to categorize crawled tweets into positive tweetsand negative tweets, using Support Vector Machine: a supervised learning method.
3.2.1 Supervised learning
Supervised learning, a machine learning method, solves classification problem and regressionproblems analyzing training data. It is often used for spam mail filtering and genderestimation of Web users.
321Earthquake Observation by Social Sensors
www.intechopen.com
10 Will-be-set-by-IN-TECH
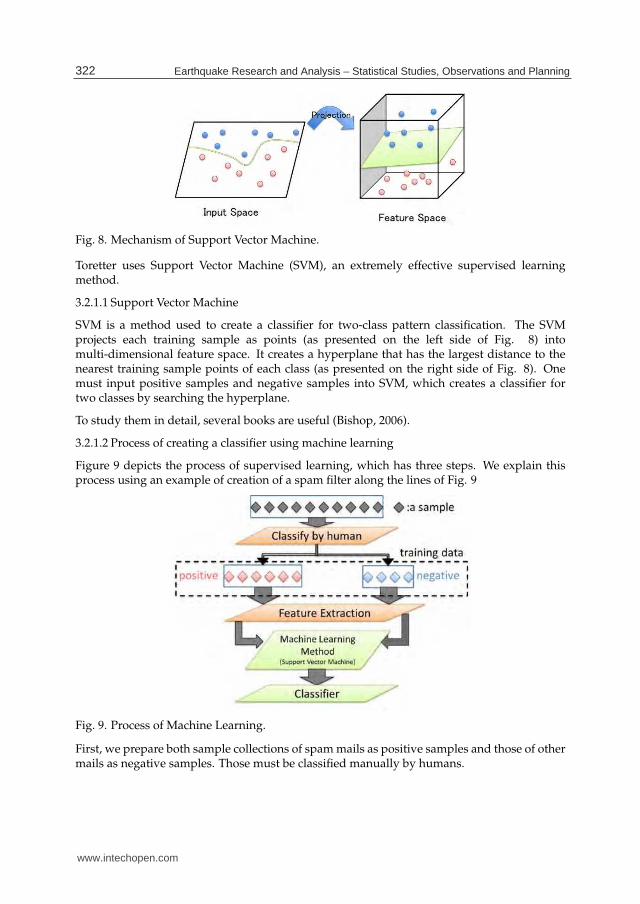
Fig. 8. Mechanism of Support Vector Machine.
Toretter uses Support Vector Machine (SVM), an extremely effective supervised learningmethod.
3.2.1.1 Support Vector Machine
SVM is a method used to create a classifier for two-class pattern classification. The SVMprojects each training sample as points (as presented on the left side of Fig. 8) intomulti-dimensional feature space. It creates a hyperplane that has the largest distance to thenearest training sample points of each class (as presented on the right side of Fig. 8). Onemust input positive samples and negative samples into SVM, which creates a classifier fortwo classes by searching the hyperplane.
To study them in detail, several books are useful (Bishop, 2006).
3.2.1.2 Process of creating a classifier using machine learning
Figure 9 depicts the process of supervised learning, which has three steps. We explain thisprocess using an example of creation of a spam filter along the lines of Fig. 9
Fig. 9. Process of Machine Learning.
First, we prepare both sample collections of spam mails as positive samples and those of othermails as negative samples. Those must be classified manually by humans.
322 Earthquake Research and Analysis – Statistical Studies, Observations and Planning
www.intechopen.com

Earthquake Observation by Social Sensors 11
Second, we extract various features from samples. We must select effective features forclassification. Effective features are those which positive samples seem to have and whichnegative samples do not seem to have, or vice versa. For example, all words included insamples are often used to create spam filters because we can infer that spam messages includewords such as "Free!", "50% off!", and "Call now!" with high probability.
Third, we input both positive samples and negative samples with feature information andcreate a classifier for those samples. If inputting a new mail into the classifier, then it outputsa positive value or a negative value. If the output is positive, the new mail is regarded as aspam message.
3.2.2 Creation of sample data for the classifier
Positive samples and negative samples must be created manually. There are two points ofconsideration.
First, this process is very sensitive. One must classify positive tweets and negative tweetsaccurately. Therefore, it is necessary to acquire records of actual earthquakes. One mustchoose positive tweets referring to these earthquake records to classify them precisely.
Second, one must prepare equal numbers of positive tweets and negative tweets. The numberof samples needed depends on the task. Generally, it is said that sample data must comprise300–500 samples. Actually, one should increase the number of samples until finding theclassification which provides sufficient performance.
3.2.3 Extraction of features from sample data
Next, one must select features of tweets for machine learning. In the spam mail filter example,words included in sample mails are chosen as features. Toretter uses features of three kinds.We explain them in detail and use the following sentence for explanation.
Oh! Earthquake happened right now!
Keyword features all words included in a tweet.example sentence → Oh, earthquake, happened , right, now
Statistical features number of words in a tweet message and the position of the searchkeyword within a tweetexample sentence → number of words: five, the position of the search keyword: second
Context features words before and after a search keyword.example sentence → Oh, happened
Statistical features are the most effective in these three features according to results of our earlierresearch(Sakaki et al., 2010). It is guessed that this is true because people who came acrossan earthquake were surprised and in an emergency situation so that they tend to post shorttweets such as "Oh! earthquake!" and "It’s shaking".
Of course, these features can differ depending on language, country, and culture. Therefore,effective features should be chosen when creating a filter for tweets.
323Earthquake Observation by Social Sensors
www.intechopen.com

12 Will-be-set-by-IN-TECH
feature ID feature feature ID feature
0 I 1 am
2 in 3 Japan
4 earthquake 5 right
6 now
7 number of words in tweets
8 position of search keyword
9 word before keywords is Japan
10 word after keywords is right
Table 7. Sample features for SVM-Light.
3.2.4 Applying machine learning
Some machine learning methods can create a classifier for any problem: Naive Bayes classifier,Neural Networks, Decision Tree, and Support Vector Machine. In this chapter, Support VectorMachine is used for our explanation because it is said that SVM is a superior method forclassification problems and regression problems, and many SVM software packages exist. Wetreat SVM-Light, which is a popular SVM tool, as an example in this chapter.
Creating a classifier demands three steps.
3.2.4.1 Create training data from tweets
First, it necessary to convert tweet data into a training data file format for SVM-Light. Thetraining data file format of SVM-Light is
<target> <feature>:<value> <feature>:<value> ... <feature>:<value> # <info>-1 1:0.43 3:0.12 9284:0.2 # abcdef
In this file format, each line corresponds to a single tweet. <target> expresses a polar of eachtweet. +1 means positive and −1 means negative. <feature> expresses a feature ID of eachfeature and <value> expresses the weight of each feature in the tweet. Each feature should beassigned to each feature ID. For example, if one assigns each feature to each feature ID, as inTable 7, then a tweet conversion into a training data for SVM-Light as shown below.
I am in Japan, earthquake right now → +1 0:1 1:1 2:1 3:1 4:1 5:1 6:1 7:7 8:5 9:1 10:1
You must run the following command to create a classifier for tweets after converting positivetweets collected into a training data file training data file.
svm_learn "training data file" "model file"
svm_learn is a command in SVM-Light to create a model file for classifier. After runningsvm_learn, it is possible to obtain model file as an output of svm_learn. It is possible to classifythe tweet command svm_classify with this model file. When classifying new tweets into apositive class and negative class, each tweet is converted into test data in the same format astraining data. Then the following command is executed.
svm_classify "test data file" "model file" "output file
324 Earthquake Research and Analysis – Statistical Studies, Observations and Planning
www.intechopen.com

Earthquake Observation by Social Sensors 13
It is possible to obtain polars of each tweet in the output file New tweets are classifiable into apositive class and negative class by the classifier for tweets as described.
SVM-Light(Joachims, 2008), LIBSVM(Chih-Chung & Chih-Jen, 2011), and Classias(Okazaki,2009) have compatibility such that the process we explain here is applicable to LIBSVM andClassias. (Toretter uses Classias for SVM tools.)
4. Earthquake detection from a time-series data using a probabilistic model
The second step of Fig. 4 detects an earthquake from positive tweets.
First, it is difficult to believe these tweets directly because some users misinterpret shakingcaused by something other than an earthquake. Some ill-willed users post positive tweetsto deceive others. This closely resembles physical sensors, and sometimes produces a wrongvalue. Therefore, we must process positive tweets to detect earthquakes with high accuracy,similarly to treating physical sensors.
Figure 10 depicts the sizes of earthquakes and counts of positive tweets filtered by SVM onFeb 11 2011. These two graphs are correlated: whenever an earthquake occurs, a peak appearsin the graph of positive tweet counts. Therefore, we can detect earthquakes by detecting thepeaks of positive tweet counts.
Fig. 10. Sizes of earthquakes and changes of filtered tweet counts Feb 11 2011.
Many methods have been used to detect peaks from time-series data for purposes such asburst detection(Kleinberg, 2002; Zhu & Shasha, 2003) and anomaly detection(Cheng et al.,2008; Krishnamurthy et al., 2003). Toretter uses a static rule 5 tweets in 5 min that is calculatedusing an exponential function. We explain this method hereinafter.
4.1 Temporal model
To detect an earthquake using physical sensors, we must calculate the probability ofearthquake occurrence based on signals from those sensors. Similarly, we must calculate theprobability of earthquake occurrence from signals of social sensors. In this subsection, weexplain the temporal model we use to calculate this probability.
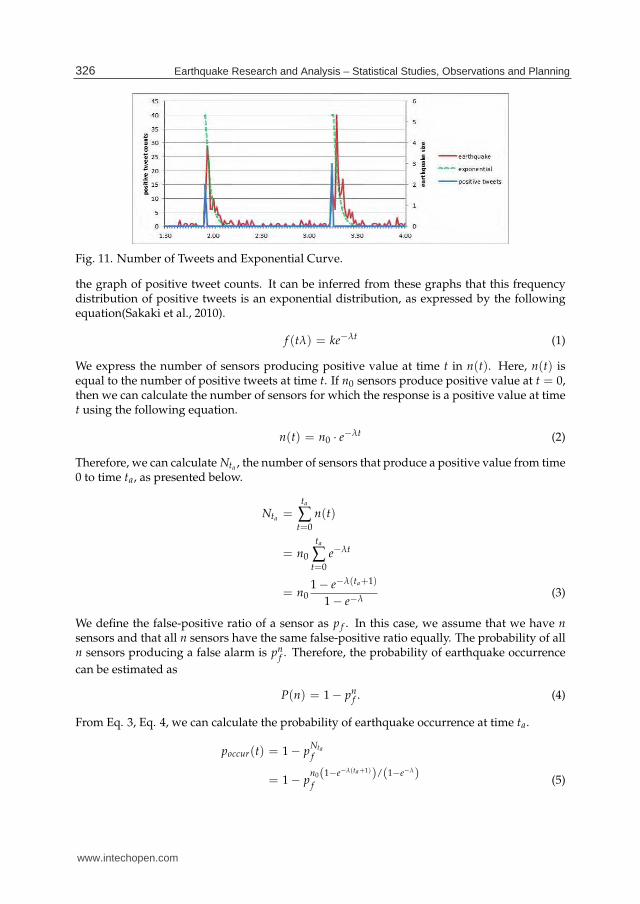
Figure 11 presents graphs of positive tweet counts during earthquakes. In Fig. 11, the greenline shows an exponential function. As shown here, the green line resembles the red line,
325Earthquake Observation by Social Sensors
www.intechopen.com
14 Will-be-set-by-IN-TECH
Fig. 11. Number of Tweets and Exponential Curve.
the graph of positive tweet counts. It can be inferred from these graphs that this frequencydistribution of positive tweets is an exponential distribution, as expressed by the followingequation(Sakaki et al., 2010).
f (tλ) = ke−λt (1)
We express the number of sensors producing positive value at time t in n(t). Here, n(t) isequal to the number of positive tweets at time t. If n0 sensors produce positive value at t = 0,then we can calculate the number of sensors for which the response is a positive value at timet using the following equation.
n(t) = n0 · e−λt (2)
Therefore, we can calculate Nta , the number of sensors that produce a positive value from time0 to time ta, as presented below.
Nta =ta
∑t=0
n(t)
= n0
ta
∑t=0
e−λt
= n01 − e−λ(ta+1)
1 − e−λ(3)
We define the false-positive ratio of a sensor as p f . In this case, we assume that we have nsensors and that all n sensors have the same false-positive ratio equally. The probability of alln sensors producing a false alarm is pn
f . Therefore, the probability of earthquake occurrence
can be estimated as
P(n) = 1 − pnf . (4)
From Eq. 3, Eq. 4, we can calculate the probability of earthquake occurrence at time ta.
poccur(t) = 1 − pNta
f
= 1 − pn0(1−e−λ(ta+1))/(1−e−λ)f (5)
326 Earthquake Research and Analysis – Statistical Studies, Observations and Planning
www.intechopen.com

Earthquake Observation by Social Sensors 15
4.2 Setup the condition for detection trigger
In the Toretter system, we detect an earthquake when five positive tweets arrive in 5 min, whichmeans five sensors produce positive signals in 5 min. In this subsection, we explain how todetermine this condition.
We set λ = 0.34, p f = 0.35 (taken from our earlier research) to Equation (5) , by which wecan calculate the probability of earthquake occurrence. When obtaining n0 positive tweets,and given that we would like to make an alarm with false-positive ratio less than 1%, we cancalculate twait as
twait = − 1
0.34log
(
1 − 1.264
n0
)
− 1. (6)
If we set twait = 5, then we can calculate n0 = 4.1 from Eq. 6. Therefore, the trigger forearthquake detection is set as five positive tweets come in 5 min in Toretter. The trigger usedfor detection of earthquake calculation can be determined using an exponential function, asdescribed in this section.
5. Location estimation from tweets
In this section, we explain a means to estimate the location of an earthquake epicenter byanalyzing tweets. First, we introduce the kinds of location information to be acquired fromtweets. Next, we explain methods to estimate the location of the earthquake epicenter.
5.1 Extracting location information from tweets
Two kinds of information are applicable for location estimation from tweets: using locationinformation in the Twitter user profile or using geotag attached to tweets.
5.1.1 Location information in user profiles
The twitter user profile includes the location information of users. Of course, not all usersmake their location information public on the internet, but a sufficient number of users do so(This number varies among countries.).
For earthquake detection, we collect positive tweets. We extract the location information ofusers who post those positive tweets for earthquake epicenter location estimation. TwitterREST API must be used to extract location information of users from Twitter.
Twitter REST API is one Twitter API included among all methods to use basic functions ofTwitter. Many methods of using REST API exist. We use the users/show method to obtain userinformation. To extract user information of Twitter user TwitterAPI, it is necessary to accessthe following URL.
http://api.twitter.com/1/users/show.json?screen_name=TwitterAPI&include_entities=true
It is possible to obtain results in Fig. 12, which is described in JSON format, in the samemanner as that used for Twitter Search API. It is possible to know from the result in Fig. 12that Twitter user TwitterAPI resides in San Francisco, CA.
Some points to consider when using Twitter REST API are the following:
327Earthquake Observation by Social Sensors
www.intechopen.com

16 Will-be-set-by-IN-TECH
Fig. 12. User information extraction from Twitter Search API.
• Some users do not register their location information, or register non-location data, suchas in a dream, anywhere. Such non-location data should be ignored.
• API requests are limited.(The limit is published: it is possible to access the Twitter Search API about 150 times perhour without authorization.)
It is possible to access REST API 150 times per hour. This limit is sufficient to extract userinformation for location estimation of an earthquake epicenter because the earthquake-relatedtweets posted in the 5 min after an earthquake are most often fewer than 100. To expand thelimit, one must register with Twitter and obtain an authorization called OAuth, according tothe Twitter API Documentation3.
Moreover one must convert location information acquired from Twitter into alatitude–longitude pair because human beings can understand places expressed by thenames of places, such as San Francisco, but a computer can not understand where that placeis. One must treat location information in the format of a latitude–longitude coordinate pair.At present, some web services can convert geographical names into a latitude–longitudecoordinate pairs, such as the Google Maps API and Yahoo Maps API. Here we explain theGoogle Maps API.
To convert San Francisco into a a latitude–longitude coordinate pair, one can access thefollowing URL.
http://maps.google.com/maps/api/geocode/json?address=San%20Francisco&sensor=false&language=en
Results are obtainable as in Fig. 13, which is described in JSON format, in the same manneras Twitter API. It is possible to convert San Francisco into latitude = 37.7749295, longitude =−122.4194155.
Location information related to an earthquake can be acquired as described above.
3 https://dev.twitter.com/docs/auth
328 Earthquake Research and Analysis – Statistical Studies, Observations and Planning
www.intechopen.com

Earthquake Observation by Social Sensors 17
Fig. 13. Result of geographical name converted using Google Maps API.
5.1.2 Geotags attached to each tweet
Some tweets have an attached geotag, which includes a latitude–longitude pair acquired fromGPS. If positive tweets related to an earthquake include tweets with attached geotags, then itis possible to use these geotag data for location estimation. Geotag data can be extracted usingthe Twitter Search API. Therefore, GPS data can be obtained if stored when using crawl forthose tweets by the Twitter Search API.
Geotag data are more accurate than location information of the Twitter user profile becausethey are acquired from GPS. Nevertheless, it is unusual that positive tweets referring toan earthquake include a sufficient number of tweets with attached geotags to estimate theearthquake epicenter location. Actually, a combination of location information of Twitter usersand geotag should be used.
5.2 Location estimation using Bayesian filtering
If one can obtain sufficient location information from positive tweets, then estimating thelocation of the earthquake epicenter can be done using the information. Nevertheless, thatinformation is often inaccurate. Alternatively if they are precise, then users might still beposting far from the earthquake epicenter. Therefore, it is preferred that the location of theearthquake epicenter be estimated probabilistically.
Several methods can be used to estimate the location of events from sensor readingsusing Bayesian Filters: Kalman filters, Multihypothesis tracking, Grid-based approaches,Topological approaches, and Particle filters.
We use particle filters as an example for explanation. Particle filters have high performancein belief, accuracy, robustness, and variety according to an evaluation by Fox et al. (Foxet al., 2003). Moreover particle filters work better to detect earthquakes from Twitter in theexperiments by Sakaki et al. (Sakaki et al., 2010).
329Earthquake Observation by Social Sensors
www.intechopen.com

18 Will-be-set-by-IN-TECH
5.2.1 Spatial model
Each tweet is associated with a location. We describe a method that can estimate the locationof an event from sensor readings. To define the problem of location estimation, we considerthe evolution of the state sequence {xt, t ∈ N} of a target, given
xt = ft(xt−1, ut), ft : Rnt ×Rn
t → Rnt ,
where ft is a possibly nonlinear function of the state xt−1. Furthermore, ut is an i.i.d. processnoise sequence. The objective of tracking is to estimate xt recursively from measurements, as
zt = ht(xt, nt), ht : Rnt ×Rn
t → Rnt ,
where ht is a possibly nonlinear function, and where nt is an i.i.d. measurement noisesequence. From a Bayesian perspective, the tracking problem is to calculate, recursively, somedegree of belief in the state xt at time t, given data zt up to time t.
Presuming that p(xt−1|zt−1) is available, the prediction stage uses the following equation.
p(xt|zt−1) =∫
p(xt|xt−1)p(xt−1|zt−1)dxt−1
Here we use a Markov process of order one. Therefore, we can assume that
p(xt|xt−1, zt−1) = p(xt|xt−1).
In the update stage, Bayes’ rule is applied as
p(xt|zt) = p(zt|xt)p(xt|zt−1)/p(zt|zt−1),
where the normalizing constant is
p(zt|zt−1) =∫
p(zt|xt)p(xt|zt−1)dxt.
To solve the problem, several methods of Bayesian filters are proposed such as Kalman filters,multi-hypothesis tracking, grid-based and topological approaches, and particle filters. Forthis study, we use particle filters, both of which are widely used in location estimation.
Additionally, we must consider the nonuniform distribution of Twitter users when we applyBayesian filters to social sensors because social sensors are arranged non-uniformly to a greaterdegree than normal physical sensors are.
5.2.2 Location estimation using a particle filter
A particle filter is a Bayes filter that approximates a state probabilistically. It is a sequentialMonte Carlo method. For location estimation, we maintain a probability distribution for thelocation estimation at time t, designated as the belief Bel(xt) = {xi
t, wit}, i = 1 . . . n. Each xi
t
is a discrete hypothesis related to the location of the object. The wit are non-negative weights,
called importance factors, which sum to one.
The Sequential Importance Sampling (SIS) algorithm is a Monte Carlo method that forms thebasis for particle filters. The SIS algorithm consists of recursive propagation of the weightsand support points as each measurement is received sequentially.
330 Earthquake Research and Analysis – Statistical Studies, Observations and Planning
www.intechopen.com

Earthquake Observation by Social Sensors 19
We use a more advanced algorithm with re-sampling. We use weight distribution Dw(x, y),which is obtained from the Twitter user distribution to assess the biases of user locations4 .The algorithm is shown as follows:
1. Initialization: Calculate the weight distribution Dw(x, y) from Twitter users’geographic distribution in Japan.
2. Generation: Generate and weight a particle set, which means the N discretehypothesis.
(a) Generate a particle set
S0 = (s00, s1
0, s20, . . . , sN−1
0 )
and allocate them evenly on the map, as
particle sk0 = (xk
0, yk0, wk
0)
x, longitude; y, latitude; w, weight
(b) Weight them based on weight distribution Dw(x, y).
3. Re-sampling
(a) Re-sample N particles from a particle set St using weights of respective particlesand allocate them on the map. We allow re-sampling of more than that of thesame particles.
(b) Generate a new particle set St+1 and weight them based on weight distributionDw(x, y).
4. Prediction: Predict the next state of a particle set St from Newton’s motion equation.
(xkt , yk
t ) = (xkt−1 + vxt−1 ∆t +
axt−1
2∆t2,
ykt−1 + vyt−1 ∆t +
ayt−1
2∆t2)
(vxt , vyt ) = (vxt−1 + axt−1 , vyt−1 , ayt−1 )
axt = N (0; σ2), ayt = N (0; σ
2).
5. Weighing: Re-calculate the weight of St by measurement m(mx, my) as follows.
dxkt = mx − xk
t , dykt = my − yk
t
wkt = Dw(xk
t , ykt ) ·
1
(√
2πσ)
·exp
(
− (dxkt
2+ dyk
t2)
2σ2
)
6. Measurement: Calculate the current object location o(xt, yt) by the average ofs(xt, yt) ∈ St.
7. Iteration: Iterate Steps 3, 4, 5, and 6 until convergence.
4 We sample tweets associated with locations and obtain a user distribution that is proportional to thenumber of tweets in each region.
331Earthquake Observation by Social Sensors
www.intechopen.com

20 Will-be-set-by-IN-TECH
6. Evaluation and application
In this section, we explain how to evaluate results of experiments and describe points thatshould be considered when applying these methods.
6.1 Selection of the target area
Three conditions must be met to apply methods for earthquake observation from social media.
The first is that a sufficient number of people use Twitter in a targeted area. The second one isthat several earthquakes occur each year for a target area. The third one is that infrastructureshould be set up in a target area.
These three conditions are needed in each step of earthquake detection and locationestimation. A sufficient number of tweets and a certain number of earthquakes are needed tocreate a classifier for tweets and to estimate the locations of earthquake epicenters. Accuratelogs of earthquakes are also necessary to calculate the false-alarm probability of social sensorsand to evaluate the earthquake detection system performance.
If creating a classifier and setting a trigger for earthquake detection in an area and applyingthem in another area, then the third condition is not indispensable. However, the firstcondition and the second condition are necessary in both areas.
Fig. 14. Twitter user map.
Fig. 15. Earthquake map.
332 Earthquake Research and Analysis – Statistical Studies, Observations and Planning
www.intechopen.com

Earthquake Observation by Social Sensors 21
Figure 14 depicts the Twitter user distribution map and Fig. 15 depicts an earthquakeoccurrence distribution map. Earthquake detection using information from Twitter users isapplicable in overlapping areas of these two maps: for example, Japan, the west coast of theU.S., Indonesia, Turkey, Iran, and Italy.
The number of Twitter users has been increasing continuously. Therefore, those areas canprobably be expanded. Additionally, if one uses social media other than Twitter, thenoverlapping areas might be changed.
Therefore, a target area should be chosen very carefully to apply the methods described in thischapter.
6.2 Evaluation of earthquake detection
To evaluate the performance of earthquake detection and earthquake epicenter locationestimation, one must collect earthquake data from some organizations. Those data mustinclude information about an approximate time point of an earthquake and approximateposition of an earthquake epicenter. Moreover, it is better that they include the exact time of anearthquake, the longitude and latitude of an earthquake epicenter, and the seismic intensityof earthquakes in each region.
For example, the Japan Meteorology Agency (JMA) publishes an earthquake database on theWeb, which includes a time, magnitude, and earthquake intensities at each point of area, aplace of earthquake epicenter of all earthquakes above level 1 on the Japanese seismic intensityscale5. The USGS publishes similar data on the Web6.
Data of such kinds can be obtained by crawling. They can be used to create training data forclassifiers and to evaluate the performance an earthquake detection system.
7. Conclusion
Our research is an early approach to using Twitter as a social sensor for earthquakeobservations. It is meaningful that we apply methods by ordinary physical sensors toearthquake detection by social sensors. Furthermore, we present the possibility of earthquakedetection without installing numerous physical sensors. The method is effective forearthquake observations in some countries where a few seismic sensors exist. However, itis difficult to detect earthquakes occurring in oceanic areas or less populated areas usingmethods we introduced in this chapter. Therefore, we must verify that earthquake detectionby social sensors is effective when we apply these methods. Furthermore, the applicablescope of the earthquake observation by social sensors can be extended considering a stochasticgradient, more detailed probabilistic models, and so on. Many subjects remain to be exploredin future work.
8. References
Bishop, C. M. (2006). Pattern Recognition and Machine Learning, Vol. 4 of Information science andstatistics, Springer.
5 http://www.seisvol.kishou.go.jp/eq/shindo_db/shindo_index.html6 http://neic.usgs.gov/neis/qed/
333Earthquake Observation by Social Sensors
www.intechopen.com

22 Will-be-set-by-IN-TECH
Cheng, H., Tan, P.-N., Potter, C. & Klooster, S. (2008). Data mining for visual explorationand detection of ecosystem disturbances, Proceedings of the 16th ACM SIGSPATIALinternational conference on Advances in geographic information systems - GIS ’08 p. 1.
Chih-Chung, C. & Chih-Jen, L. (2011). LIBSVM-a Library for Support Vector Machine.URL: http://www.csie.ntu.edu.tw/ cjlin/libsvm/
CITRIS (2011). iShake -Mobile Phones as Seismic Sensors-.URL: http://ishakeberkeley.appspot.com/
Fox, D., Hightower, J., Schulz, D. & Borriello, G. (2003). Bayesian filtering for locationestimation, IEEE Pervasive Computing 2(3): 24–33.
Intensity, M. (2005). Did You Feel It ? Citizens Contribute to Earthquake Science, TechnicalReport March, U.S. Geological Survey.URL: http://earthquake.usgs.gov/earthquakes/dyfi/
Joachims, T. (2008). SVM-Light.URL: http://svmlight.joachims.org/
Kleinberg, J. (2002). Bursty and hierarchical structure in streams, ACM Press, New York, NewYork, USA.
Krishnamurthy, B., Sen, S., Zhang, Y. & Chen, Y. (2003). Sketch-based change detection:methods, evaluation, and applications, Proceedings of the 3rd ACM SIGCOMMConference on Internet Measurement, ACM, pp. 234–247.
Okazaki, N. (2009). Classias.URL: http://www.chokkan.org/software/classias/index.html.en
Sakaki, T., Okazaki, M. & Matsuo, Y. (2010). Earthquake shakes Twitter users: real-time eventdetection by social sensors, Proceedings of the 19th international conference on World wideweb pp. 851–860.
Survey, U. S. G. (2009). Twitter Earthquake Detector (TED).URL: http://recovery.doi.gov/press/us-geological-survey-twitter-earthquake-detector-ted/
Zhu, Y. & Shasha, D. (2003). Efficient elastic burst detection in data streams, Proceedings of theninth ACM SIGKDD international conference on Knowledge discovery and data mining -KDD ’03, ACM Press, New York, New York, USA, p. 336.
334 Earthquake Research and Analysis – Statistical Studies, Observations and Planning
www.intechopen.com

Earthquake Research and Analysis - Statistical Studies,Observations and PlanningEdited by Dr Sebastiano D'Amico
ISBN 978-953-51-0134-5Hard cover, 460 pagesPublisher InTechPublished online 02, March, 2012Published in print edition March, 2012
InTech EuropeUniversity Campus STeP Ri Slavka Krautzeka 83/A 51000 Rijeka, Croatia Phone: +385 (51) 770 447 Fax: +385 (51) 686 166www.intechopen.com
InTech ChinaUnit 405, Office Block, Hotel Equatorial Shanghai No.65, Yan An Road (West), Shanghai, 200040, China
Phone: +86-21-62489820 Fax: +86-21-62489821
The study of earthquakes plays a key role in order to minimize human and material losses when theyinevitably occur. Chapters in this book will be devoted to various aspects of earthquake research and analysis.The different sections present in the book span from statistical seismology studies, the latest techniques andadvances on earthquake precursors and forecasting, as well as, new methods for early detection, dataacquisition and interpretation. The topics are tackled from theoretical advances to practical applications.
How to referenceIn order to correctly reference this scholarly work, feel free to copy and paste the following:
Takeshi Sakaki and Yutaka Matsuo (2012). Earthquake Observation by Social Sensors, Earthquake Researchand Analysis - Statistical Studies, Observations and Planning, Dr Sebastiano D'Amico (Ed.), ISBN: 978-953-51-0134-5, InTech, Available from: http://www.intechopen.com/books/earthquake-research-and-analysis-statistical-studies-observations-and-planning/earthquake-obvervation-by-social-sensors

© 2012 The Author(s). Licensee IntechOpen. This is an open access articledistributed under the terms of the Creative Commons Attribution 3.0License, which permits unrestricted use, distribution, and reproduction inany medium, provided the original work is properly cited.