Embed Size (px)
DESCRIPTION
Zhaoping Jia, Ziyan Wu, Qi'ang Wang
Citation preview
- 52 -
http://www.ivypub.org/AE/
Architectural Engineering November 2013, Volume 1, Issue 3, PP.52-59
Earthquake Loss Evaluation of Buildings Based
on Story EDP-DV Functions Zhaoping Jia†, Ziyan Wu, Qi’ang Wang
School of Civil Engineering, Northwestern Polytechnical University, Xi’an 710129, China
†Email: [email protected]
Abstract
In order to quantify the seismic performance of buildings reasonably and effectively, the paper puts forward the method of
earthquake loss evaluation of buildings based on story EDP-DV functions. Firstly, considering the randomness of seismic response
parameters, the distribution functions of story EDPs at a given level of ground motion intensity can be achieved through
Incremental Dynamic Analysis. Meanwhile, story EDP-DV functions which relate story response parameters (story EDPs) directly
to economic losses (DVs) can be created beforehand by integrating component fragility functions and loss functions; they can be
called directly without double computation for the same type of buildings. Lastly, the economic losses of a building at a given
level of ground motion intensity can be achieved by combining the distribution functions of story EDPs and story EDP-DV
functions. On this occasion, the proposed method omits the damage measure in PEER methodology and makes the story not
component as a unit of account to evaluate the earthquake losses of a building reasonably and accurately. The numerical example
shows that the proposed method is feasible and reasonable to quantify the seismic performance of buildings.
Keywords: Seismic Performance; Earthquake Loss Evaluation; Story EDP-DV Functions; Distribution Functions;
Incremental Dynamic Analysis
1 INTRODUCTION
Despite current seismic codes can protect life-safety very well by providing a set of prescriptive provisions, they
can’t quantify the seismic performance of buildings explicitly. One way of quantifying the seismic performance that
has been proposed by recent researches [1-3] is using economic losses as a metric to gauge how well structural
systems respond when subjected to seismic ground motions. The uncertainties of ground motion (i.e. earthquake
source, earthquake magnitude…etc) and structure (i.e. strength of materials, geometry size, structural style…etc) led
to the variation of earthquake losses, so it’s important for performance-based seismic design to evaluate earthquake
losses of buildings reasonably and accurately. Vision 2000[4] defined the performance levels and multiple
performance targets clearly, but the performance levels defined in the document were often qualitative, not
well-defined and, consequently, open to subjectivity. Ma and Lv[5] regarded the discrete performance of structures
as a continuous variable to estimate the economic losses of a building, but the method only considered the losses
under basic earthquake. Porter and Kiremdjian[6] applied the Monte Carlo simulation to develop fragility functions
for common building assemblies. In this case, it could predict building-specific relationships between expected
losses and seismic intensity. The calculation was very huge. Rahnama and Wang [7] applied the fragility functions to
quantify the average loss ratio of similar buildings at a given level of ground motion intensity, but the paper focused
on the estimation of average annual losses.
The deficiencies of above researches were that the model was too simple or complex, so they couldn’t quantify the
seismic performance of buildings effectively. The Pacific Earthquake Engineering Research (PEER) Center has
established a fully probabilistic framework that used the results from seismic hazard analysis and response
simulation to estimate damage and monetary losses incurred during earthquakes. The methodology was divided into
four basic stages that account for the following: ground motion hazard estimation, response estimation, damage
estimation, loss estimation. The above four stages corresponded to the variables respectively: intensity measure (IM,
- 53 -
http://www.ivypub.org/AE/
i.e. peak ground acceleration, spectral acceleration…etc), engineering demand parameter (EDP, i.e. interstory drift
ratio, peak floor acceleration…etc), damage measure (DM), decision variable (DV, i.e. economic loss, loss of life,
downtime…etc). The results of each stage serve as input to the next stage as shown in schematically in Fig.1.
IM EDP DM DV
FIG.1 PEER METHODOLOGY
The previous PEER methodology involves several integrations of many random variables making it very
computational intensive. Based on the methodology, the paper puts forward the method of earthquake loss evaluation
of buildings based on story EDP-DV functions. The proposed method combines the distribution functions of story
EDPs and story EDP-DV functions to compute the economic losses of a building. The story EDP-DV functions
which relate story EDPs directly to DVs can be created beforehand by applying empirical data (component fragility
functions and loss functions), and they can be called directly without double computation for the same type of
buildings. So the proposed method omits the damage measure (DM) in PEER methodology and promotes the
component-based earthquake loss evaluation to story-based earthquake loss evaluation, which can quantify the
seismic performance of buildings reasonably and effectively.
2 DISTRIBUTION FUNCTIONS OF STORY EDPS
2.1 Incremental Dynamic Analysis (IDA)
The IDA curves indicate the relationship between IM and EDP. In the process of establishing IDA curves, the IM is
monotonically increasing and the EDP should be able to express the structural performance properly. The IDA
method firstly selects some seismic waves for the site being considered, and each seismic wave will be magnified to
different levels of seismic intensity proportionally. The EDP can be received by the nonlinear time-history analysis
of a structure at a given level of ground motion intensity for each seismic wave. The nonlinear time-history analysis
doesn’t end until the structure collapses at a high level of ground motion intensity. Corresponding to a seismic wave,
an IDA curve can be received by spline interpolation of each (EDP, IM) point. The method can fully grasp the entire
process of the structure which is from the elastic analysis to the elastic-plastic analysis.
2.2 Distribution Functions of Story EDPs at a Given Level of Ground Motion Intensity
The uncertainty of earthquake action is much greater than material strength, load and so on, so the paper only
considers the variation of seismic response parameters. Shome[8] and Aslani[9] assume that the structural response
parameters at the intensity level IM are lognormally distributed when the structure is non-collapse. According to the
IDA curves, the distribution functions of story EDPs, when the building collapse has not occurred at the intensity
level IM is given as follows:
( )
( )
( ), , )
Ln EDP
k
Ln EDP
Ln xF x NC IM im = P EDP x NC IM im =
( (1)
where x is a random variable of story EDPs, ( )Ln EDP and
( )Ln EDP are logarithmic mean and logarithmic standard
deviation of story EDPs, respectively, given that the building collapse has not occurred and the level of ground
motion intensity is IM.
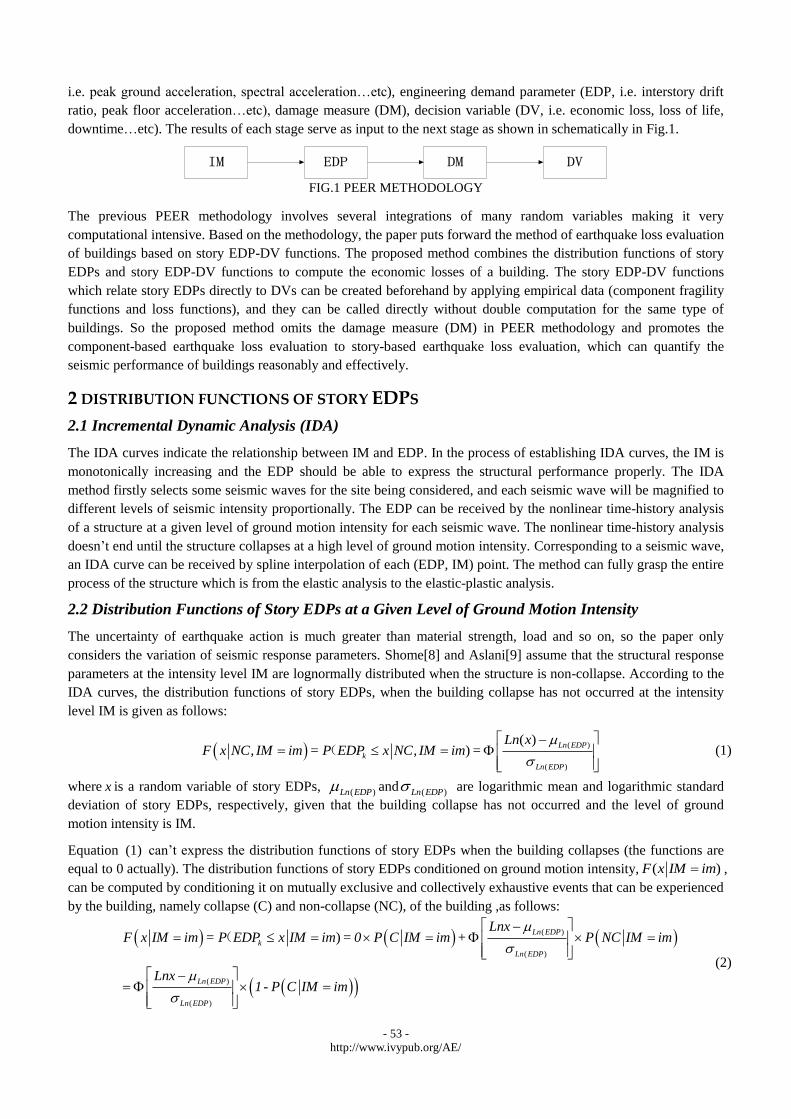
Equation (1) can’t express the distribution functions of story EDPs when the building collapses (the functions are
equal to 0 actually). The distribution functions of story EDPs conditioned on ground motion intensity, ( )F x IM im ,
can be computed by conditioning it on mutually exclusive and collectively exhaustive events that can be experienced
by the building, namely collapse (C) and non-collapse (NC), of the building ,as follows:
( )
( )
( )
( )
)Ln EDP
k
Ln EDP
Ln EDP
Ln EDP
LnxF x IM im = P EDP x IM im = 0 P C IM im + P NC IM im
Lnx 1 - P C IM im
(
(2)
- 54 -
http://www.ivypub.org/AE/
( ) /P C IM im u n (3)
where F x IM im is the distribution function of story EDPs conditioned on IM, ( )P NC IM im is the
probability that the structure will not collapse conditioned on IM, ( )P C IM im is the probability that the structure
will collapse conditioned on IM, which is complementary to ( )P NC IM im , u and n are the number of seismic
waves due to collapse and total seismic waves, respectively, conditioned on IM.
3 STORY EDP-DV FUNCTIONS
3.1Component Fragility Functions and Loss Functions from Empirical Data
Component fragility functions provide the probability of experiencing or exceeding a particular damage state
conditioned on component EDP. It has been well-established that the lognormal distribution provides relatively good
fit to empirical cumulative distributions computed from experimental data [2, 10]. The paper takes the logarithmic
mean and logarithmic standard deviation of component fragility functions [2, 10] to compute the component fragility
functions, i j jP DS EDP edp ( ds ).
Component loss functions are the component’s economic losses conditioned on component damage state. In order to
reduce computation, the paper introduces the normalized loss which is equal to the loss cost divided by replacement
cost. The component’s normalized losses conditioned on component damage state (component loss function),
'[ ]j iE L DS ds , can be achieved from[2,10].
3.2 Story EDP-DV Functions
Story EDP-DV functions provide the normalized story losses conditioned on story EDP. The story EDP-DV
functions which relate story EDPs directly to DVs can be created beforehand by integrating component fragility
functions and loss functions, and they can be called directly without double computation for the same type of
buildings. So the proposed method omits the damage measure (DM) in PEER methodology and promotes the
component-based earthquake loss evaluation to story-based earthquake loss evaluation.
The first step in developing story EDP-DV functions is collapsing out the third intermediate step of DM in PEER
methodology by combining information from component fragility functions and loss functions as shown in
equation(4).
' '
1
[ ] [ ] ( )l
j j j j i i j j
i
E L EDP edp E L DS ds P DS ds EDP edp
(4)
0
1
i+1 j j
i j j i j j i+1 j j
i j j
1- P DS ds EDP = edp i
P DS = ds EDP = edp = P DS ds EDP = edp - P DS ds EDP = edp i l
i lP DS ds EDP = edp
( )
( ) ( ) ( )
( )
(5)
where '[ ]j j jE L EDP edp is the normalized loss in the j th component when it is subjected to a component EDP,
'[ ]j iE L DS ds is the normalized loss in the j th component when it is in damage state i (component loss function),
and ( )i j jP DS ds EDP edp is the probability of the j th component being in damage state i given that it is
subjected to a component EDP. The probability of being in each damage state for component j can be obtained
from component fragility functions as shown in equation(5).
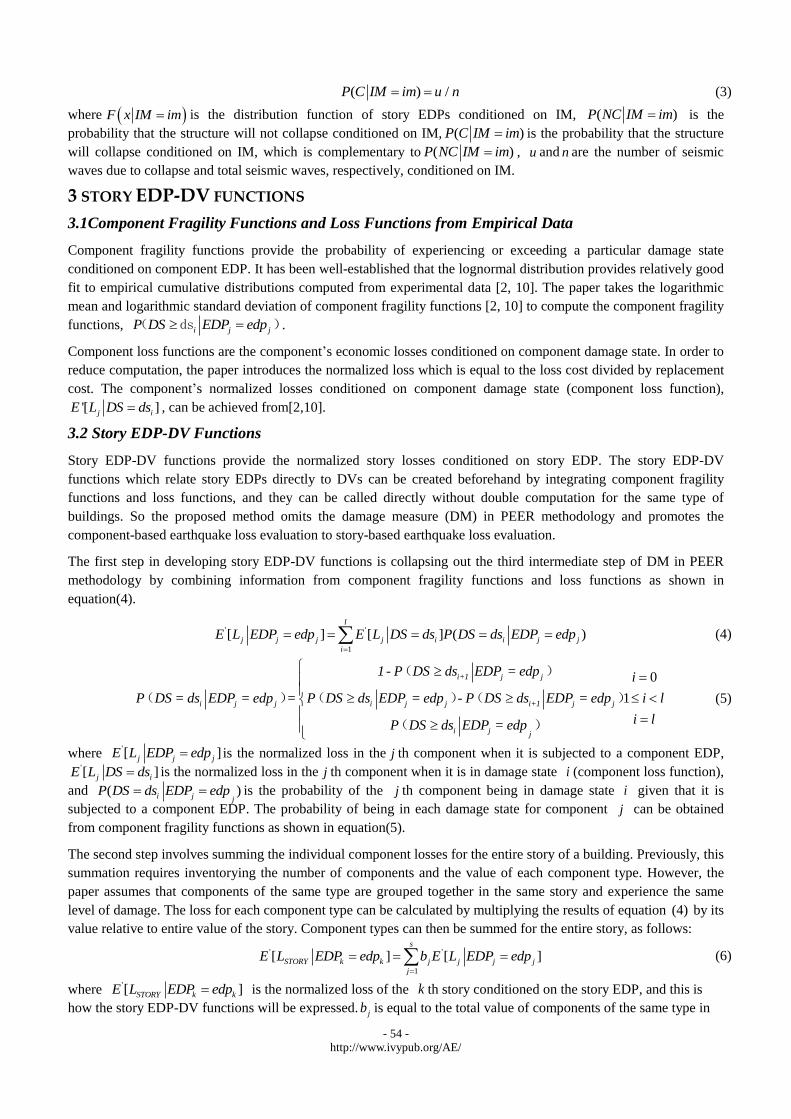
The second step involves summing the individual component losses for the entire story of a building. Previously, this
summation requires inventorying the number of components and the value of each component type. However, the
paper assumes that components of the same type are grouped together in the same story and experience the same
level of damage. The loss for each component type can be calculated by multiplying the results of equation (4) by its
value relative to entire value of the story. Component types can then be summed for the entire story, as follows:
' '
1
[ ] [ ]s
STORY k k j j j j
j
E L EDP edp b E L EDP edp
(6)
where '[ ]STORY k kE L EDP edp is the normalized loss of the k th story conditioned on the story EDP, and this is
how the story EDP-DV functions will be expressed. jb is equal to the total value of components of the same type in
- 55 -
http://www.ivypub.org/AE/
the k th story divided by the total value of the k th story, termed “component cost distribution”, which can be
achieved from 2007 RS Means Square Foot Costs [11].
4 EARTHQUAKE LOSS EVALUATION
The normalized story losses conditioned on IM can be computed using the total probability theorem as follows:
' '
0 0
'
0
'[ ] [ ] ( ) [ ] (1 ( ))
[ ] (1 ( ))
STORY STORY k STORY k
STORY
E L IM im E L x dP EDP x IM im E L x d P EDP x IM im
E L x d F x IM im
(7)
where '[ ]STORYE L IM im is the normalized story loss conditioned on IM, '[ ]STORYE L x is the story EDP-DV
function, ( )F x IM im is the distribution function of story EDPs conditioned on IM. The normalized building
losses are computed as the sum of the losses in each story of the building conditioned on IM as follows:
1
'[ ] '[ ]q
STORY k
k
E L IM im E L IM im c
(8)
where '[ ]E L IM im is the normalized building loss conditioned on IM, q is the number of stories in the building,
kc is equal to the total value of k th story divided by the total value of the building.
In order to figure out the direction of controlling losses, the normalized building losses conditioned on IM can be
disaggregated into mean losses due to collapse, and mean losses due to non-collapse as follows:
' ''[ ] [ ] [ ]C NCE L IM E L IM E L IM ’ (9)
The normalized building losses are equal to 1 when the building collapses, so
'
' '
[ ]= ( ) '[ ]= ( )
[ ]= '[ ] [ ]
C
NC C
E L IM P C IM E L C P C IM
E L IM E L IM E L IM
’
’ (10)
where ' [ ]CE L IM’ and ' [ ]NCE L IM are mean losses due to collapse and mean losses due to non-collapse respectively,
'[ ]E L C is the normalized building loss when the building collapses, ( )P C IM is the probability that the structure
will collapse conditioned on IM and can be achieved from equation (3).
5 CASE STUDY
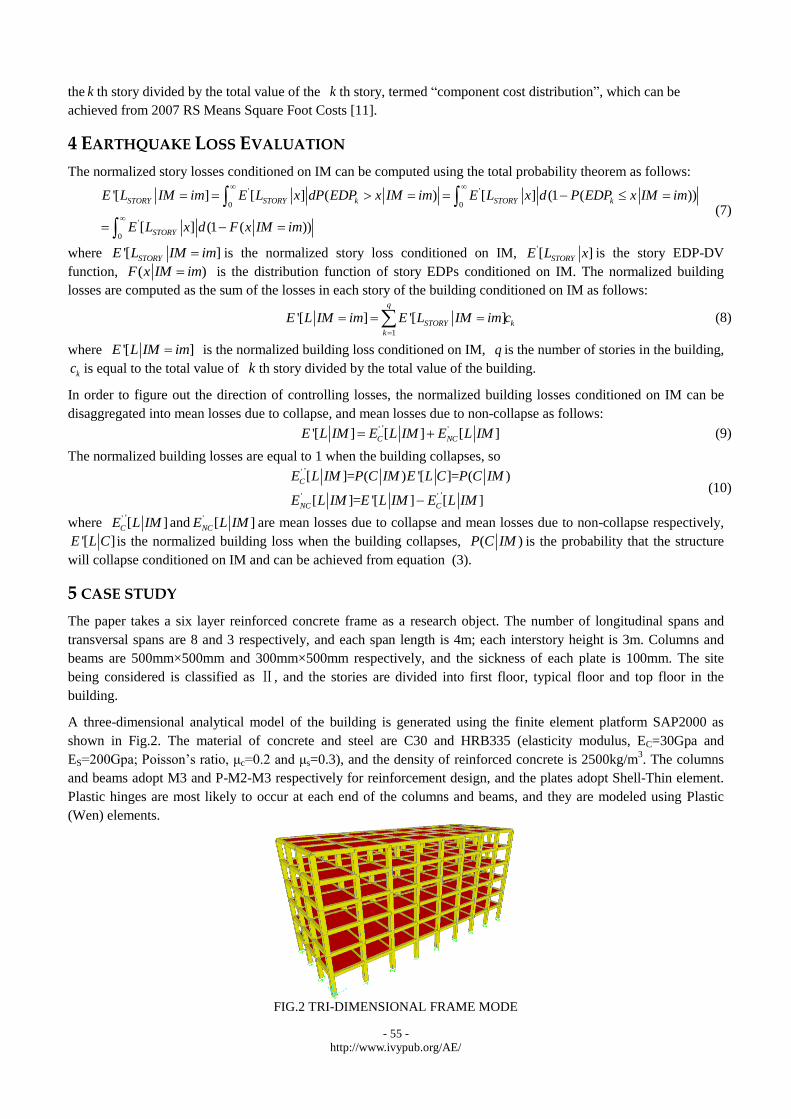
The paper takes a six layer reinforced concrete frame as a research object. The number of longitudinal spans and
transversal spans are 8 and 3 respectively, and each span length is 4m; each interstory height is 3m. Columns and
beams are 500mm×500mm and 300mm×500mm respectively, and the sickness of each plate is 100mm. The site
being considered is classified as Ⅱ, and the stories are divided into first floor, typical floor and top floor in the
building.
A three-dimensional analytical model of the building is generated using the finite element platform SAP2000 as
shown in Fig.2. The material of concrete and steel are C30 and HRB335 (elasticity modulus, EC=30Gpa and
ES=200Gpa; Poisson’s ratio, μc=0.2 and μs=0.3), and the density of reinforced concrete is 2500kg/m3. The columns
and beams adopt M3 and P-M2-M3 respectively for reinforcement design, and the plates adopt Shell-Thin element.
Plastic hinges are most likely to occur at each end of the columns and beams, and they are modeled using Plastic
(Wen) elements.
FIG.2 TRI-DIMENSIONAL FRAME MODE
- 56 -
http://www.ivypub.org/AE/
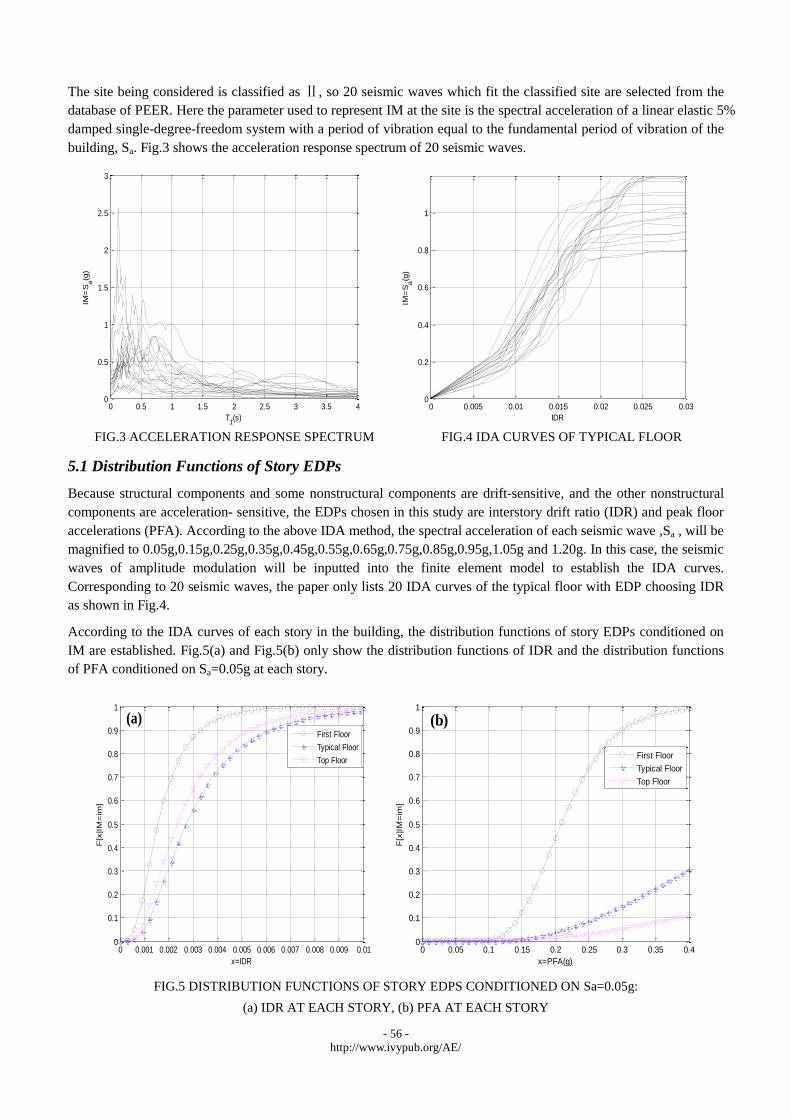
The site being considered is classified as Ⅱ, so 20 seismic waves which fit the classified site are selected from the
database of PEER. Here the parameter used to represent IM at the site is the spectral acceleration of a linear elastic 5%
damped single-degree-freedom system with a period of vibration equal to the fundamental period of vibration of the
building, Sa. Fig.3 shows the acceleration response spectrum of 20 seismic waves.
FIG.3 ACCELERATION RESPONSE SPECTRUM FIG.4 IDA CURVES OF TYPICAL FLOOR
5.1 Distribution Functions of Story EDPs
Because structural components and some nonstructural components are drift-sensitive, and the other nonstructural
components are acceleration- sensitive, the EDPs chosen in this study are interstory drift ratio (IDR) and peak floor
accelerations (PFA). According to the above IDA method, the spectral acceleration of each seismic wave ,Sa , will be
magnified to 0.05g,0.15g,0.25g,0.35g,0.45g,0.55g,0.65g,0.75g,0.85g,0.95g,1.05g and 1.20g. In this case, the seismic
waves of amplitude modulation will be inputted into the finite element model to establish the IDA curves.
Corresponding to 20 seismic waves, the paper only lists 20 IDA curves of the typical floor with EDP choosing IDR
as shown in Fig.4.
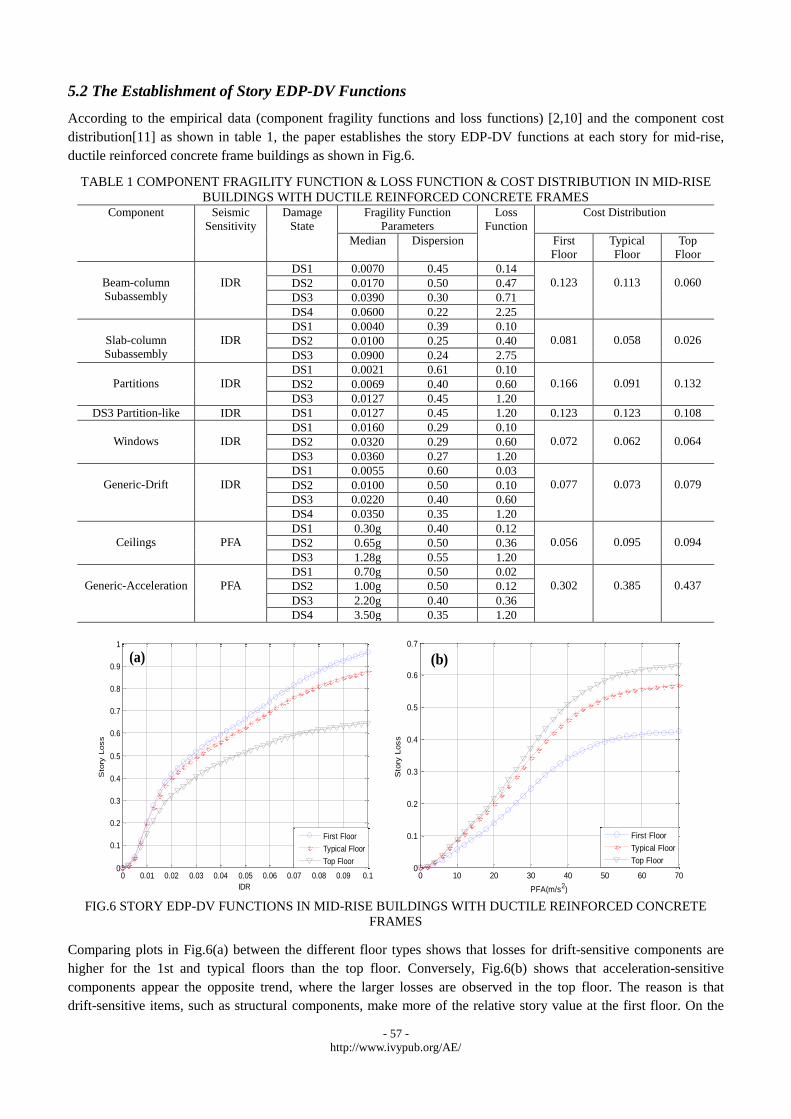
According to the IDA curves of each story in the building, the distribution functions of story EDPs conditioned on
IM are established. Fig.5(a) and Fig.5(b) only show the distribution functions of IDR and the distribution functions
of PFA conditioned on Sa=0.05g at each story.
FIG.5 DISTRIBUTION FUNCTIONS OF STORY EDPS CONDITIONED ON Sa=0.05g:
(a) IDR AT EACH STORY, (b) PFA AT EACH STORY
0 0.5 1 1.5 2 2.5 3 3.5 40
0.5
1
1.5
2
2.5
3
T1(s)
IM=
Sa(g
)
0 0.005 0.01 0.015 0.02 0.025 0.030
0.2
0.4
0.6
0.8
1
IDR
IM=
Sa(g
)
0 0.001 0.002 0.003 0.004 0.005 0.006 0.007 0.008 0.009 0.010
0.1
0.2
0.3
0.4
0.5
0.6
0.7
0.8
0.9
1
x=IDR
F[x
|IM
=im
]
First Floor
Typical Floor
Top Floor
(a)
0 0.05 0.1 0.15 0.2 0.25 0.3 0.35 0.40
0.1
0.2
0.3
0.4
0.5
0.6
0.7
0.8
0.9
1
x=PFA(g)
F[x
|IM
=im
]
First Floor
Typical Floor
Top Floor
(b)
- 57 -
http://www.ivypub.org/AE/
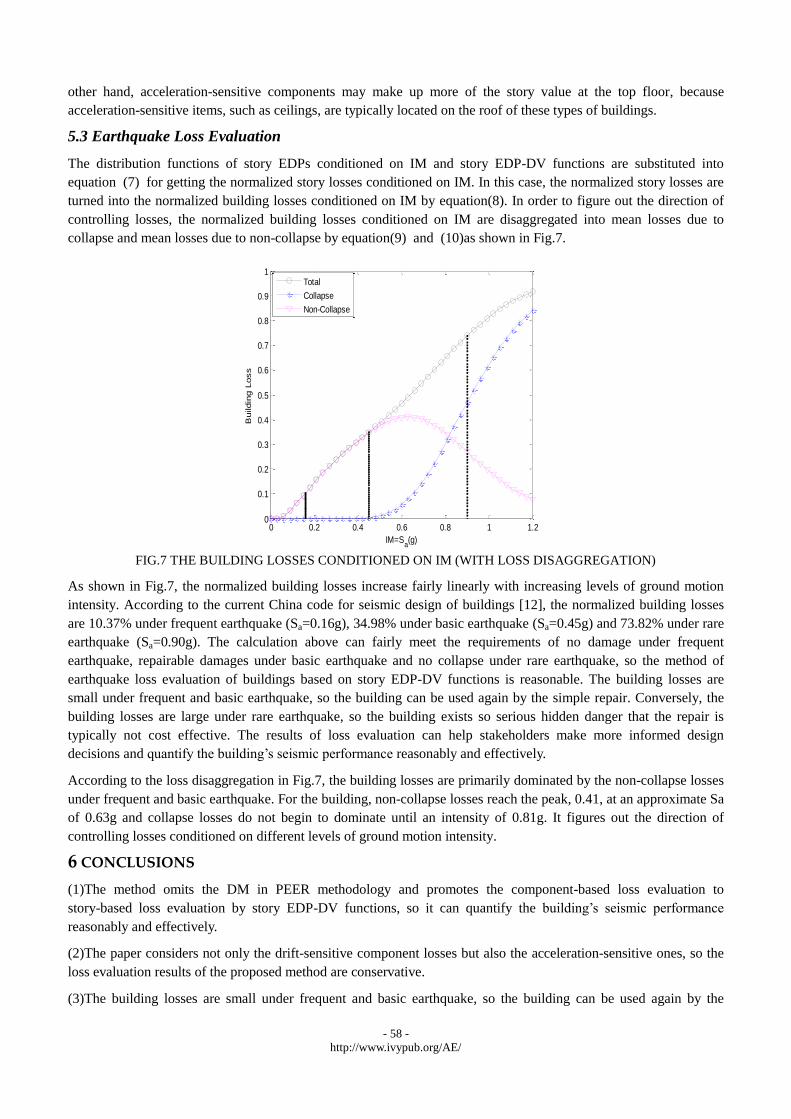
5.2 The Establishment of Story EDP-DV Functions
According to the empirical data (component fragility functions and loss functions) [2,10] and the component cost
distribution[11] as shown in table 1, the paper establishes the story EDP-DV functions at each story for mid-rise,
ductile reinforced concrete frame buildings as shown in Fig.6.
TABLE 1 COMPONENT FRAGILITY FUNCTION & LOSS FUNCTION & COST DISTRIBUTION IN MID-RISE
BUILDINGS WITH DUCTILE REINFORCED CONCRETE FRAMES Component Seismic
Sensitivity
Damage
State
Fragility Function
Parameters
Loss
Function
Cost Distribution
Median Dispersion First
Floor
Typical
Floor
Top
Floor
Beam-column
Subassembly
IDR
DS1 0.0070 0.45 0.14
0.123
0.113
0.060 DS2 0.0170 0.50 0.47
DS3 0.0390 0.30 0.71
DS4 0.0600 0.22 2.25
Slab-column
Subassembly
IDR
DS1 0.0040 0.39 0.10
0.081
0.058
0.026 DS2 0.0100 0.25 0.40
DS3 0.0900 0.24 2.75
Partitions
IDR
DS1 0.0021 0.61 0.10
0.166
0.091
0.132 DS2 0.0069 0.40 0.60
DS3 0.0127 0.45 1.20
DS3 Partition-like IDR DS1 0.0127 0.45 1.20 0.123 0.123 0.108
Windows
IDR
DS1 0.0160 0.29 0.10
0.072
0.062
0.064 DS2 0.0320 0.29 0.60
DS3 0.0360 0.27 1.20
Generic-Drift
IDR
DS1 0.0055 0.60 0.03
0.077
0.073
0.079 DS2 0.0100 0.50 0.10
DS3 0.0220 0.40 0.60
DS4 0.0350 0.35 1.20
Ceilings
PFA
DS1 0.30g 0.40 0.12
0.056
0.095
0.094 DS2 0.65g 0.50 0.36
DS3 1.28g 0.55 1.20
Generic-Acceleration
PFA
DS1 0.70g 0.50 0.02
0.302
0.385
0.437 DS2 1.00g 0.50 0.12
DS3 2.20g 0.40 0.36
DS4 3.50g 0.35 1.20
FIG.6 STORY EDP-DV FUNCTIONS IN MID-RISE BUILDINGS WITH DUCTILE REINFORCED CONCRETE
FRAMES
Comparing plots in Fig.6(a) between the different floor types shows that losses for drift-sensitive components are
higher for the 1st and typical floors than the top floor. Conversely, Fig.6(b) shows that acceleration-sensitive
components appear the opposite trend, where the larger losses are observed in the top floor. The reason is that
drift-sensitive items, such as structural components, make more of the relative story value at the first floor. On the
0 0.01 0.02 0.03 0.04 0.05 0.06 0.07 0.08 0.09 0.10
0.1
0.2
0.3
0.4
0.5
0.6
0.7
0.8
0.9
1
IDR
Sto
ry L
oss
First Floor
Typical Floor
Top Floor
(a)
0 10 20 30 40 50 60 700
0.1
0.2
0.3
0.4
0.5
0.6
0.7
PFA(m/s2)
Sto
ry L
oss
First Floor
Typical Floor
Top Floor
(b)
- 58 -
http://www.ivypub.org/AE/
other hand, acceleration-sensitive components may make up more of the story value at the top floor, because
acceleration-sensitive items, such as ceilings, are typically located on the roof of these types of buildings.
5.3 Earthquake Loss Evaluation
The distribution functions of story EDPs conditioned on IM and story EDP-DV functions are substituted into
equation (7) for getting the normalized story losses conditioned on IM. In this case, the normalized story losses are
turned into the normalized building losses conditioned on IM by equation(8). In order to figure out the direction of
controlling losses, the normalized building losses conditioned on IM are disaggregated into mean losses due to
collapse and mean losses due to non-collapse by equation(9) and (10)as shown in Fig.7.
FIG.7 THE BUILDING LOSSES CONDITIONED ON IM (WITH LOSS DISAGGREGATION)
As shown in Fig.7, the normalized building losses increase fairly linearly with increasing levels of ground motion
intensity. According to the current China code for seismic design of buildings [12], the normalized building losses
are 10.37% under frequent earthquake (Sa=0.16g), 34.98% under basic earthquake (Sa=0.45g) and 73.82% under rare
earthquake (Sa=0.90g). The calculation above can fairly meet the requirements of no damage under frequent
earthquake, repairable damages under basic earthquake and no collapse under rare earthquake, so the method of
earthquake loss evaluation of buildings based on story EDP-DV functions is reasonable. The building losses are
small under frequent and basic earthquake, so the building can be used again by the simple repair. Conversely, the
building losses are large under rare earthquake, so the building exists so serious hidden danger that the repair is
typically not cost effective. The results of loss evaluation can help stakeholders make more informed design
decisions and quantify the building’s seismic performance reasonably and effectively.
According to the loss disaggregation in Fig.7, the building losses are primarily dominated by the non-collapse losses
under frequent and basic earthquake. For the building, non-collapse losses reach the peak, 0.41, at an approximate Sa
of 0.63g and collapse losses do not begin to dominate until an intensity of 0.81g. It figures out the direction of
controlling losses conditioned on different levels of ground motion intensity.
6 CONCLUSIONS
(1)The method omits the DM in PEER methodology and promotes the component-based loss evaluation to
story-based loss evaluation by story EDP-DV functions, so it can quantify the building’s seismic performance
reasonably and effectively.
(2)The paper considers not only the drift-sensitive component losses but also the acceleration-sensitive ones, so the
loss evaluation results of the proposed method are conservative.
(3)The building losses are small under frequent and basic earthquake, so the building can be used again by the
0 0.2 0.4 0.6 0.8 1 1.20
0.1
0.2
0.3
0.4
0.5
0.6
0.7
0.8
0.9
1
IM=Sa(g)
Buildin
g L
oss
Total
Collapse
Non-Collapse

- 59 -
http://www.ivypub.org/AE/
simple repair. Conversely, the building losses are large under rare earthquake, so the building exists so serious
hidden danger that the repair is typically not cost effective.
(4)The building losses are mainly caused by the structure non-collapse under frequent and basic earthquake.
Conversely, the building losses are basically caused by the structure collapse under rare earthquake. In this case, the
direction of controlling losses conditioned on different levels of ground motion intensity is figured out.
REFERENCES
[1] Krawinkler, H. and Miranda, E. (2004). “Performance-Based Earthquake Engineering.” In Y. Borzognia and V. Bertero (Ed.),
Earthquake Engineering: From Engineering Seismology to Performance-Based Engineering, 1st edition (pp 9-1 to 9-59). CRC
Press
[2] Aslani, H. and Miranda, E. (2005). Probabilistic Earthquake Loss Estimation and Loss Disaggregation in Buildings, Report No.
157. Stanford, CA: John A. Blume Earthquake Engineering Center, Stanford University
[3] Mitrani-Reiser, J. and Beck, J. (2007). An Ounce of Prevention: Probabilistic Loss Estimation for Performance-based Earthquake
Engineering. Pasadena, CA: Department of Civil Engineering and Applied Mechanics, California Institute of Technology
[4] California S E A O. Vision 2000, Conceptual Frame Work for Performance Based Seismic Engineering of Buildings[S]. SEAOC:
Sacramento, CA, USA, 1995
[5] MA Hongwang, LV Xilin, CHEN Xiaobao. An estimation method for the direct losses of earthquake-induced building damages[J].
China Civil Engineering Journal, 2005, 38(3): 38-43 (in Chinese)
[6] Porter K A, Kiremidjian A S, Legrue J S. Assembly-based vulnerability of buildings and its use in performance evaluation[J].
Earthquake Spectra, 2001, 17(2): 291-312
[7] Rahnama M, Wang Z, Mortgat C. China Probabilistic Seismic Risk Model Part 2 - Building Vulnerability and Loss
Estimation[C]// The 14 World Conference on Earthquake Engineering, Beijing, China: 2008
[8] Shome N. Probabilistic seismic demand analysis of nonlinear structures [D]. Stanford: Dept. of Civil and Environment
Engineering, Stanford University, 1999
[9] Aslani H, Miranda E. Probabilistic response assessment for building-specific loss estimation [C]. PEER 2003,Pacific Earthquake
Engineering Research Center,University of California at Berkeley: Berkeley,California, PEER-2003/03
[10] Ramirez C M, Miranda E. Building-specific loss estimation methods & tools for simplified performance-based earthquake
engineering[D]. California: Stanford University, 2009
[11] Means R S. RS Means Square Foot Costs[J]. RS Means Corp.: Kingston, MA, 2007
[12] GB 50011-2010. China code for seismic design of buildings [S]. Beijing: China Architecture Industry Press, 2010 (in Chinese)
AUTHORS
Zhaoping Jia (1989-), male, the Han
nationality, Bachelor, Master candidate,
mainly engaged in the field of
performance-based design and evaluation,
in 2012, graduated from Northwestern
Polytechnical University in civil
engineering, acquired Bachelor Degree.
Email: [email protected]
Ziyan Wu (1962-), female, the Han nationality, Ph.D., Professor,
Doctoral supervisor, mainly engaged in testing, teaching and
research of structural health monitoring and reliability
assessment, in 2006, graduated from Northwestern Polytechnical
University in Management Science and Engineering, acquired
PhD. Email: [email protected]
Qi’ang Wang (1986-), male, the Han nationality, Master, Ph.D.
candidate, mainly engaged in structural reliability analysis, in
2013, graduated from Northwestern Polytechnical University in
civil engineering, acquired Master Degree.
Email: [email protected]