Embed Size (px)
Citation preview
13th World Conference on Earthquake Engineering Vancouver, B.C., Canada
August 1-6, 2004 Paper No. 1013
EARTHQUAKE GROUND SHAKING HAZARD MAPS FOR THE STATE OF MONTANA
Ivan WONG1, Susan OLIG1, Mark DOBER1, Douglas WRIGHT1, Eliza NEMSER1, David LAGESON2, Walter SILVA3, Michael STICKNEY4, Michele LEMIEUX5, and
Larry ANDERSON6
SUMMARY Seismic hazard maps are a useful tool for regulatory agencies that are responsible for the safety of important and critical facilities particularly if their area of responsibility is large and geologically and seismically diverse and if they manage a large inventory. Western Montana, located in the northern Intermountain region of the U.S., is characterized by abundant late-Quaternary Basin and Range normal faulting and historical seismicity. In contrast, eastern Montana is similar to other portions of the Great Plains in the central U.S., with only two known faults of possible late-Quaternary age and a relatively low level of seismicity. Because of the potential earthquake threat to dams in the state, we have developed a set of probabilistic earthquake ground motion maps for the Montana Department of Natural Resources and Conservation Dam Safety Program. The 18 statewide maps display peak horizontal acceleration and 0.2 and 1.0 sec horizontal spectral acceleration for approximate return periods of 500, 2500, and 5000 years (exceedance probabilities of 10%, 2%, and 1% in 50 years, respectively). The maps display ground motions for two site conditions: soft rock and the ground surface. Ground motions calculated at the ground surface include site response effects for the areas underlain by unconsolidated sediments, such as the major late Cenozoic basins in western Montana. Ground motion attenuation also differs significantly in the western and eastern parts of the state reflecting their contrast in geologic and tectonic characteristics. The lack of strong motion data for Montana and surrounding regions required the use of stochastic numerical modeling to develop region-specific attenuation relationships. These relationships were used together with published attenuation relationships
1 Seismic Hazards Group, URS Corporation, 1333 Broadway, Suite 800, Oakland, CA 94612 2 Montana State University, Department of Earth Sciences, Bozeman, MT 59717 3 Pacific Engineering & Analysis, 311 Pomona Avenue, El Cerrito, CA 94530 4 Montana Bureau of Mines & Geology, Montana Tech of the University of Montana, Butte, MT 59701 5 Montana Department of Natural Resources and Conservation, 48 North Last Chance Gulch, Helena, MT 59620 6 U.S. Bureau of Reclamation, Denver Federal Center, CO 80225
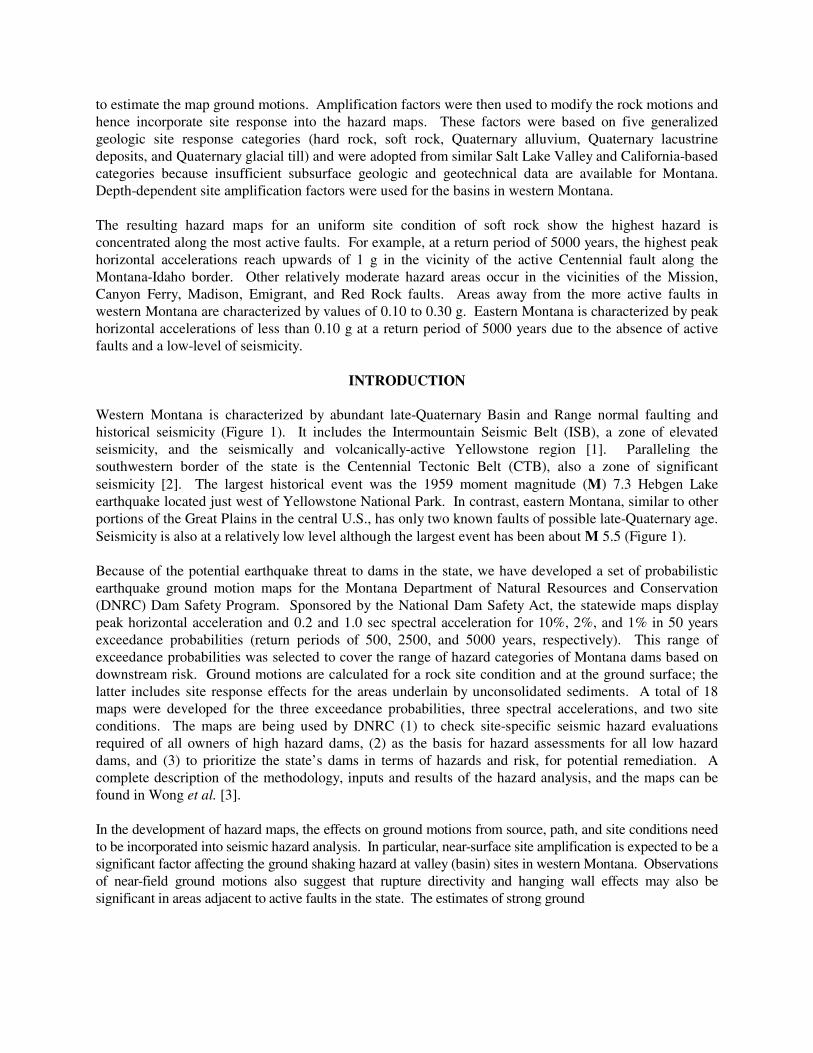
to estimate the map ground motions. Amplification factors were then used to modify the rock motions and hence incorporate site response into the hazard maps. These factors were based on five generalized geologic site response categories (hard rock, soft rock, Quaternary alluvium, Quaternary lacustrine deposits, and Quaternary glacial till) and were adopted from similar Salt Lake Valley and California-based categories because insufficient subsurface geologic and geotechnical data are available for Montana. Depth-dependent site amplification factors were used for the basins in western Montana. The resulting hazard maps for an uniform site condition of soft rock show the highest hazard is concentrated along the most active faults. For example, at a return period of 5000 years, the highest peak horizontal accelerations reach upwards of 1 g in the vicinity of the active Centennial fault along the Montana-Idaho border. Other relatively moderate hazard areas occur in the vicinities of the Mission, Canyon Ferry, Madison, Emigrant, and Red Rock faults. Areas away from the more active faults in western Montana are characterized by values of 0.10 to 0.30 g. Eastern Montana is characterized by peak horizontal accelerations of less than 0.10 g at a return period of 5000 years due to the absence of active faults and a low-level of seismicity.
INTRODUCTION Western Montana is characterized by abundant late-Quaternary Basin and Range normal faulting and historical seismicity (Figure 1). It includes the Intermountain Seismic Belt (ISB), a zone of elevated seismicity, and the seismically and volcanically-active Yellowstone region [1]. Paralleling the southwestern border of the state is the Centennial Tectonic Belt (CTB), also a zone of significant seismicity [2]. The largest historical event was the 1959 moment magnitude (M) 7.3 Hebgen Lake earthquake located just west of Yellowstone National Park. In contrast, eastern Montana, similar to other portions of the Great Plains in the central U.S., has only two known faults of possible late-Quaternary age. Seismicity is also at a relatively low level although the largest event has been about M 5.5 (Figure 1). Because of the potential earthquake threat to dams in the state, we have developed a set of probabilistic earthquake ground motion maps for the Montana Department of Natural Resources and Conservation (DNRC) Dam Safety Program. Sponsored by the National Dam Safety Act, the statewide maps display peak horizontal acceleration and 0.2 and 1.0 sec spectral acceleration for 10%, 2%, and 1% in 50 years exceedance probabilities (return periods of 500, 2500, and 5000 years, respectively). This range of exceedance probabilities was selected to cover the range of hazard categories of Montana dams based on downstream risk. Ground motions are calculated for a rock site condition and at the ground surface; the latter includes site response effects for the areas underlain by unconsolidated sediments. A total of 18 maps were developed for the three exceedance probabilities, three spectral accelerations, and two site conditions. The maps are being used by DNRC (1) to check site-specific seismic hazard evaluations required of all owners of high hazard dams, (2) as the basis for hazard assessments for all low hazard dams, and (3) to prioritize the state’s dams in terms of hazards and risk, for potential remediation. A complete description of the methodology, inputs and results of the hazard analysis, and the maps can be found in Wong et al. [3]. In the development of hazard maps, the effects on ground motions from source, path, and site conditions need to be incorporated into seismic hazard analysis. In particular, near-surface site amplification is expected to be a significant factor affecting the ground shaking hazard at valley (basin) sites in western Montana. Observations of near-field ground motions also suggest that rupture directivity and hanging wall effects may also be significant in areas adjacent to active faults in the state. The estimates of strong ground
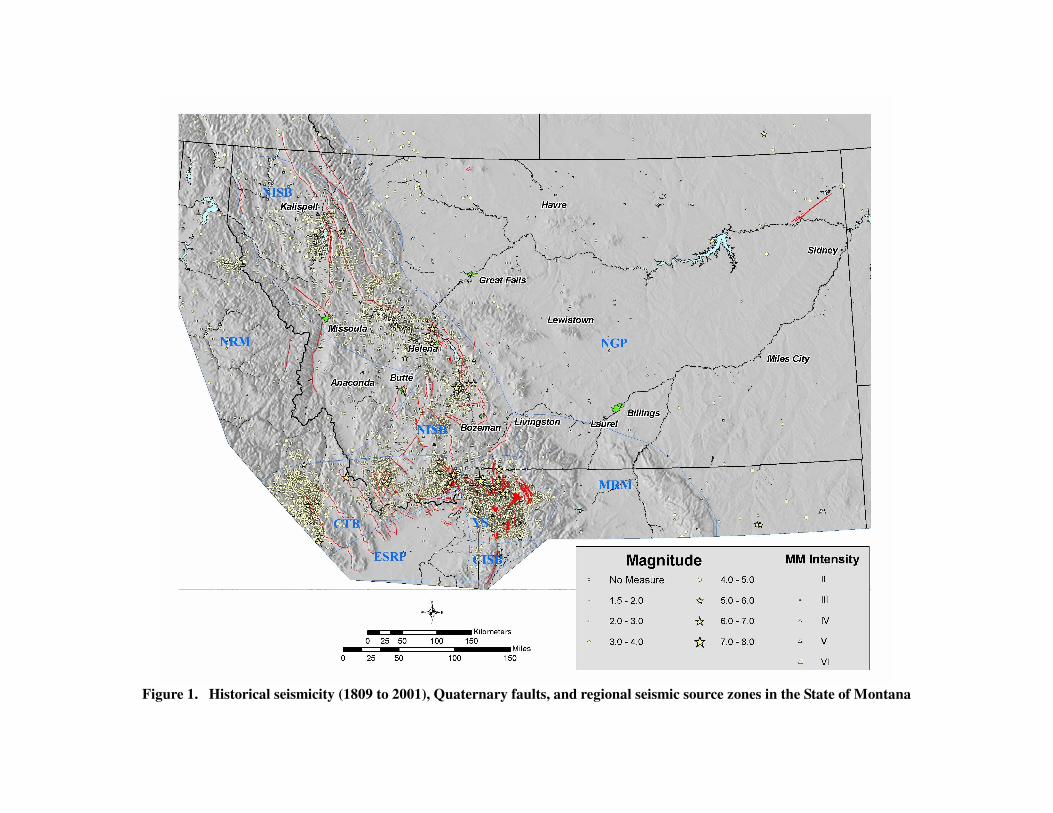
Figure 1. Historical seismicity (1809 to 2001), Quaternary faults, and regional seismic source zones in the State of Montana
shaking for Montana displayed on the maps and described in this paper are based on the most up-to-date albeit limited information on seismic sources, crustal attenuation, and near-surface geology. Because of this limited data, there are large uncertainties associated with earthquake ground motion prediction in Montana. These uncertainties must be considered in the use of our maps. The hazard maps are intended to illustrate the intensity and variability of ground shaking within the state for the three exceedance probabilities. In addition to DNRC’s use of the maps, we hope the maps will increase general public awareness of earthquake hazards, and will aid in regional planning, emergency preparedness, and loss estimation. Although we believe the maps represent the state-of-the-art in ground motion modeling, the maps are not intended to be used directly in engineering design. Various codes (e.g., International Building Code) define minimum design ground motion levels for buildings, bridges, and other structures, and commonly reference other maps to determine these design levels. Our maps do not replace these design maps, but can be used to compare with code-based design, and to evaluate the need for increasing design levels if indicated.
SEISMOTECTONIC SETTING AND HISTORICAL SEISMICITY Western Montana is one of the most seismically active regions within the interior of the western U.S. Seismicity in western Montana is largely concentrated within the northern ISB, the CTB, and the Yellowstone region [1] (Figure 1). In contrast, eastern Montana has a much lower, albeit not insignificant, level of seismicity due to its location within the comparatively tectonically stable Northern Great Plains Province. The ISB extends from northwestern Arizona through central Utah, along the Idaho-Wyoming border and terminates in northwestern Montana [1]. The deformational processes occurring along the ISB are principally in response to ongoing tectonic extension as observed throughout the Basin and Range Province. In general, the ISB is characterized by late-Quaternary normal faulting, diffuse shallow seismicity generally occurring in the top 15 km of the crust and episodic scarp-forming earthquakes (M 6.5 to 7.5) [1]. Within the northern ISB in western Montana, seismicity is diffuse with concentrations of small magnitude (M ≤ 4.0) events corresponding to aftershocks of M ≥ 6.0 events (Figure 1). Stickney and Bartholomew [2] define the southern margin of the northern Basin and Range Province as the CTB (Figure 1). The CTB represents the northern arm of the parabolic distribution of seismicity and late Quaternary faulting centered on Yellowstone and flanking the Snake River Plains [4]. The CTB, which is part of the northern ISB, is the most tectonically and seismically active portion of the northern Basin and Range Province and was the site of the 1983 M 6.8 Borah Peak, Idaho earthquake. Stickney and Bartholomew [2] suggest that earthquakes are more frequent and larger in the CTB than in the northern ISB. Within western Montana, there have been at least 18 earthquakes of M ≥ 5.0 from about 1809 to the present. The largest of these earthquakes, the 1959 Hebgen Lake event is the only earthquake to have ruptured the ground surface. The 1925 M 6.6 earthquake has been located in the southern end of Clarkston Valley, although the responsible fault remains unknown to this day. Other significant earthquakes in western Montana include events in Beaverhead County in 1897 (Richter magnitude ML 6.4), near Helena in 1935 (M ~6¼), Virginia City in 1947 (ML 6.3), and Yellowstone in 1975 (ML 6.4). The most significant historical earthquake known in eastern Montana was an event of estimated M 5.5 that occurred near the border between northeastern Montana and Saskatchewan, Canada. Bakun and
Stickney [5] suggest that the source of the earthquake could be the Brockton-Froid fault, one of the two postulated late-Quaternary faults in eastern Montana (Figure 1).
METHODOLOGY AND INPUT TO HAZARD CALCULATIONS There were five principal tasks in this study: (1) seismic source characterization; (2) definition and characterization of geologic site response categories and assignment of amplification factors; (3) seismic attenuation characterization; (4) probabilistic ground motion calculations; and (5) map development. Seismic Source Characterization The first step in any assessment of earthquake ground-shaking hazards is a characterization of the seismic sources that will produce ground motions of engineering significance at the site or area of interest. Seismic source characterization is concerned with three fundamental elements: (1) the identification, location, and geometry of significant sources of earthquakes; (2) the maximum size distribution of earthquakes for each source; and (3) the rate at which different size earthquakes occur in each source. Parameters needed are fault location, geometry, orientation, sense of slip, maximum earthquake magnitude (Mmax), and recurrence model and rate. Uncertainties in the seismic source parameters were incorporated into the probabilistic seismic hazard analysis using a logic tree approach. In this procedure, values of the source parameters are represented by the branches of logic trees with weights that define the distribution of values. In general, three values for each parameter were weighted and used in the analysis. In a probabilistic hazard assessment of earthquake ground motions, all seismic sources that can generate significant ground shaking at a site (generally those within a distance of 100 to 200 km in the western U.S.) are characterized. Two general types of seismic sources were considered in the probabilistic hazard analysis: active or seismogenic faults and an areal source zone. Quaternary Fault Sources Our seismic source characterization model for this analysis included 92 potential fault sources (Figure 1). We included all known faults longer than 5 km with evidence for repeated Quaternary movement within Montana and extending out to 50 km beyond the border. We also considered more significant faults out to 100 km, including longer more active faults (e.g., Teton, Lemhi, and Lost River faults). We used a variety of data sources but relied heavily on Quaternary fault compilations by Haller et al. [6], Stickney et al. [7], and Machette et al. [8]. Several previous seismic hazard analyses performed by us in the region were also used (e.g., Woodward-Clyde Federal Services et al. [9], Wong et al. [10, 11] as well as fault data from recent U.S. Geological Survey, U.S. Bureau of Reclamation, Montana Bureau of Mines and Geology (MBMG), and Montana State University studies (e.g., Pierce et al. [12], Hecker et al.[13], Haller et al. [14], Anderson and LaForge [15, 16], Ruleman [17], Liebli and Lageson [18]). We also contacted various individuals about ongoing and unpublished studies (e.g., S.M. Vuke, MBMG, written communication, 2003; J.E. Adams, Geological Survey of Canada, written communication, 2002; Breckenridge et al. [19]). Unfortunately, most of the Quaternary faults in Montana (> 85%) have not been studied in any detail and very few data are available to develop rupture models and constrain slip rates. Our fault parameters are fully tabulated and documented with references, which are not included here, but will be included in Wong et al. [3] to facilitate updating the model as new data becomes available. Where the data permit, we have attempted to consider and accommodate the structural variations that are potentially significant to the hazard analysis by including a variety of rupture behavior models and fault geometries in our source characterization. All faults are dominantly normal-slip faults that we modeled as single planes, zones (multiple planes), or curvilinear surfaces. Most faults are included as single independent (unsegmented) planar sources, unless the available data suggest otherwise. Zones of faults are modeled as multiple, distributed, parallel fault planes that do not coseismically rupture as in the linked
model, but rather have the assigned moment rate distributed evenly among the planes. Most of zones of faults are associated with volcanism and generally have low rates of activity (e.g., Elephant Back fault zone, Mirror Plateau faults, and Mallard Lake resurgent dome faults). Alternative rupture behavior models to the single-plane, independent fault include linked faults, segmented faults, and zones of faults. Potentially linked faults may experience coseismic rupture (either along or across strike), whereas portions of potentially segmented faults may rupture independently of each other. Examples of potentially linked faults include the newly discovered Toston fault [20] and the Canyon Ferry fault [21], the several faults of the 1959 Hebgen Lake earthquake rupture, and the Georgia Gulch and Tobacco Root faults. Some faults show compelling evidence for being segmented, where relatively persistent segment boundaries have apparently confined prehistoric surface ruptures to particular sections of the faults (e.g., Lost River, Mission, and Centennial faults). For other faults, the evidence is more ambiguous as to whether persistent rupture segment boundaries exist (e.g., Blacktail, Emigrant, and Teton faults). Finally, we note that the rupture behavior of most of the faults in the state is poorly understood and may actually be more complex than our simplifying assumptions, but we have attempted to address uncertainties that are particularly significant to the hazard in Montana, given the available data. The youngest most active faults and fault segments (i.e., late Quaternary faults with slip rates ≥ 0.1 mm/yr) were modeled as curvilinear surfaces. To model the curvilinear nature of normal faults, we digitized the primary, most-active fault trace and projected these curves down-dip using a weighted mean strike. Thus, these simple curvilinear surfaces retain a constant dip and do not accommodate complexities like listric faults (i.e., decreasing dip with depth). All surfaces, planar and curvilinear, extend the full depth of the seismogenic crust, and so fault dips are averages estimated over the full depth of the seismogenic crust. All faults as well as regional source zones (see “Background Seismicity”) were assigned a maximum seismogenic depth of 13, 15, and 17 km, weighted 0.2, 0.6, and 0.2, respectively. For most typical range-bounding normal faults, preferred dips are assumed to be 55° unless fault-specific data indicate otherwise. Preferred Mmax ranged from M 6.2 to 7.3. These values were estimated using the empirical relationships of Wells and Coppersmith [22] for all fault types. Magnitudes were generally solely based on fault lengths, but we also considered displacements per event where data were available. In our analysis, we include distributions of ± 0.3 around the preferred Mmax to account for the various epistemic uncertainties in determining Mmax for faults (e.g., dePolo and Slemmons [23]). These include uncertainties associated with the regression relations used and the input parameters to those relations, insofar as uncertainties in maximum rupture lengths and/or displacements per event were not explicitly included. Probabilities of activity ranged from 0.2 to 1.0. In assigning probabilities of activity for each fault source, we considered both the likelihood that it is structurally capable of independently generating earthquakes (seismogenic), and the likelihood that it is still active within the modern stress field. We incorporated many factors in assessing these likelihoods, such as: orientation in the modern stress field, fault geometry (length, continuity, depth extent, and dip), relation to other faults, age of youngest movement, rates of activity, geomorphic expression, amount of cumulative offset, and any evidence for a non-tectonic origin. Faults with definitive evidence for repeated Quaternary activity were generally assigned probabilities of being active and seismogenic of 1.0. Exceptions include faults that may be secondary and dependent on other faults, faults or suspected fault features that may have a non-seismogenic origin, and faults that may be too short to independently generate large earthquakes (≤ 10 km length). The probability of activity for faults that do not show definitive evidence for repeated Quaternary activity was individually judged based on available data and the criteria explained above.
We considered truncated-exponential, characteristic, and maximum-magnitude recurrence models, with weights dependent on the fault length, type of data used to calculate activity rates, and type of rupture model. The truncated exponential recurrence model is the traditional Gutenberg-Richter exponential frequency-magnitude relationship that is truncated at the maximum magnitude. As defined by Schwartz and Coppersmith [24], the characteristic recurrence model was based on paleoseismic observations of similar-size displacements per event on faults, implying that surface faulting events more typically exhibited a “characteristic” magnitude rather than a full range of magnitudes, including more frequent moderate-sized (M 6 to 7) events, as inferred from extrapolating the historical record of seismicity and using the exponential model. Thus, the characteristic model predicts fewer moderate-size events and generally results in lower hazard than the truncated exponential model. We use the characteristic model of Youngs and Coppersmith [25]. The maximum magnitude model is an extreme version of the characteristic model and assumes that a fault (or fault segment) only ruptures in its entirety in characteristic-sized events, and smaller events do not occur (e.g., Wesnousky [26]). Observations of historical seismicity and paleoseismic investigations worldwide suggest that characteristic behavior is more likely for individual faults, whereas seismicity in zones best fits a truncated exponential model [24]. Therefore, except for zones of faults, we generally favored the characteristic model of Youngs and Coppersmith [25] for all fault sources by giving it weights of 0.6 to 0.8. We assigned equal weights to the exponential and characteristic models for zones of faults. We assigned a slightly higher weight to the maximum-magnitude model than to the exponential model for longer, segmented faults (0.2 versus 0.1), but for shorter independent faults we assigned both models an equal weight of 0.2. This choice was based on the idea that as faults develop, become longer and eventually segmented, their behavior may evolve to become less exponential and more characteristic (e.g., Wesnousky [27, 28], Stirling et al. [29]). We incorporated all available intermediate- (≤ 1.6 Ma) and short-term (≤ 130 ka) slip rate data in characterizing rates of fault activity, but we generally preferred short-term data when available. Weighted mean slip rates ranged from 0.0006 mm/yr (Lake of the Woods fault) to 1.7 mm/yr (Teton fault). Although we only used slip rates here, we usually prefer using recurrence intervals instead of slip rates to characterize rates of activity [11]. However, recurrence intervals are generally lacking for Montana faults, and in our judgment, the quality of the available data are inferior to the available slip rate data. We converted vertical slip rates to net (fault parallel) slip rates for most faults by assuming 100% dip slip and the preferred fault dips for each individual fault. Additionally, wherever possible we attempted to calculate or adjust for along-strike average slip rates. Variations of displacements along strike can significantly affect the calculation of slip rates [30], but unfortunately very few faults have enough data to calculate average rates for the entire fault (e.g., Teton fault). More typically we found only a few data points for one or two sites along the fault (e.g., Canyon Ferry fault) or no fault-specific data at all (e.g., Boulder River Valley western border fault). In the latter case, we assumed slip rate distributions to be the same as a similar nearby structure, taking into account such factors as style of deformation, geomorphic expression, and age of youngest movement. Background Seismicity The hazard from background (floating or random) earthquakes that are not associated with known or mapped faults needs to be incorporated into the probabilistic hazard analysis. Earthquake recurrence estimates in the study region and Mmax are required to assess the hazard from background earthquakes. In most of the western U.S., particularly the Basin and Range Province, the Mmax for background earthquakes usually ranges from M 6 to 6½. Repeated events larger than these magnitudes probably produce recognizable fault-or fold-related features at the earth’s surface (e.g., Doser [31], dePolo [32]). In this
study, we adopt values of M 6 to 6½ ± ¼ depending on the seismotectonic setting, i.e., regional source zone. Recurrence estimates were calculated for the nine regional source zones considered in this study: the northern and central ISB (NISB and CISB), CTB, Yellowstone region (YS), Northern and Middle Rocky Mountains (NRM and MRM), Northern Great Plains (NGP), and the eastern Snake River Plain (ESRP) (Figure 1). In addition to the traditional approach of using areal source zones (assuming uniformly distributed seismicity), Gaussian smoothing [33] was used to address the hazard from background earthquakes in the probabilistic analysis. In this approach, we smoothed the historical background seismicity to incorporate a degree of stationarity, using a spatial window of 15 km. Geologic Site Response Units and Amplification Factors In order to quantify the site response of soil and unconsolidated sediments, a shear-wave velocity profile, depth to a reference rock datum, and dynamic degradation curves (both shear modulus reduction and damping) are required to define geologic site response categories. Based on these site response categories, frequency- and strain-dependent amplification factors can be computed as a function of input ground motions. Unfortunately, there were insufficient geologic and geotechnical data to characterize the near-surface geology in the Montana in sufficient detail to calculate region-specific amplification factors. Shear-wave velocity data in the state were sparse with only a few known measurement sites. Depths to reference rock were only known for the major basins in western Montana. Thus in the absence of region-specific data, we defined five generic geologic site response categories: hard rock, soft rock, Quaternary alluvium, Quaternary lacustrine deposits, and Quaternary glacial till. Based on a surficial geologic map of the state that we assembled from maps from the MBMG and USGS, lithologic units were assigned to one of the five site response categories. Differences in lithologic unit classification and discontinuities of map units across quadrangle boundaries were a major source of uncertainty on the resulting state map. Since region-specific amplification factors could not be computed due to a lack of data, we adopted factors based on comparisons with the surficial geology in the Salt Lake Valley [34] and California [35]. These factors were developed using an equivalent-linear site response approach coupled with the stochastic numerical modeling technique [36]. To account for uncertainties in this approach, the amplification factors for broadly similar geologic categories were combined and enveloped. With the exception of 18 major Quaternary basins in western Montana, the thickness of unconsolidated sediments in the state is generally less than 30 m. Within the basins, the sediments are up to 300 m thick although the uncertainties in thickness estimates are large. Depth-dependent amplification factors for the basins were calculated by enveloping factors over ranges of thicknesses (e.g., 50 to 100 m and 100 to 200 m). Note because of the division of rock into soft and hard, amplification factors were adopted that allowed modification of ground motions from soft rock into hard rock and vice versa. Ground Motion Attenuation Characterization To characterize the attenuation of ground motions, we used attenuation relationships appropriate for soft rock sites in the western U.S. and hard rock sites in the Midcontinent, and a stochastic numerical modeling technique [36]. An important consideration in the selection of attenuation relationships is that western Montana is located in the extensional Basin and Range Province where normal faulting dominates and eastern Montana lies within the compressional Midcontinent. It has been increasingly recognized that earthquakes in extensional tectonic regimes produce lower ground motions than events in compressional/strike-slip regimes for the same magnitude and distance [37, 30, 38]. We used the following empirical soft rock relationships in this study for western Montana: Abrahamson and Silva [39], with normal faulting factors; Spudich et al. [40], which was developed from an extensional
earthquake strong motion database; Sadigh et al. [41]; and Campbell [42]. The latter two relationships are based primarily on California strong motion data and were included to more fully address uncertainty. None of these relationships are specific to Montana or the Basin and Range Province due to the paucity of strong motion records. The relationships were weighted 0.40, 0.40, 0.10, and 0.10, respectively, based on our subjective judgment of the applicability of each relationship. For eastern Montana, we used the central and eastern U.S. hard rock relationships of Atkinson and Boore [43], Somerville et al. [44], Toro et al. [45] for the Midcontinent, Campbell [46] and the single- and double-corner models of Silva et al. [47]. These relationships were weighted 0.12, 0.08, 0.12, 0.08, 0.40, and 0.20, respectively. It should be noted that due to the almost complete absence of strong motion records in the central and eastern U.S., these relationships have been developed based on numerical ground motion modeling. To compensate for the lack of region-specific attenuation relationships, the stochastic ground motion modeling approach was used to develop such relationships [48] for both western and eastern Montana. The point-source version of the stochastic methodology [36] was used to model earthquakes of M 5.5, 6.5, and 7.5 in the distance range of 1 to 400 km. Uncertainties in stress drop, magnitude-dependent focal depths, the crustal attenuation parameters Qo and η, the near-surface attenuation parameter (kappa), and the rock profile atop the crustal model were included in the computations of the attenuation relationships through parametric variations [48]. Ranges of magnitude-dependent stress drops appropriate for extensional and compressional regimes were used [49]. The P-wave crustal velocity model used for locating earthquakes in western Montana was adopted in the calculations. Inserted on top of this model is a generic western U.S. soft rock Vs profile developed from the database compiled by Pacific Engineering & Analysis. For eastern Montana, a crustal model based on the seismic investigations by Warren et al. [50] and McCamy and Meyer [51] was used to develop the stochastic attenuation relationships. The uncertainty in ground motion attenuation was included in the probabilistic analysis by using the log-normal distribution about the median values as defined by the standard error associated with each attenuation relationship. Three standard deviations about the median value were included in the analysis.
GROUND MOTION CALCULATIONS AND MAP DEVELOPMENT Ground motions were estimated for the probabilistic hazard maps using the previously described seismic source model and the attenuation relationships. Peak horizontal acceleration and spectral accelerations at spectral periods of 0.2 and 1.0 sec were displayed in map form using GIS. Probabilistic Ground Motions To calculate the probabilistic ground motions, we performed a comprehensive Cornell [52] hazard analysis using logic trees, employing the computer code HAZ32 written by Norm Abrahamson. All known seismic sources that could generate strong ground shaking in the state, were incorporated into the probabilistic analysis. Published and stochastic attenuation relationships, weighted 0.40 and 0.60, respectively, were used in the analysis to calculate the ground motion values. The mean probabilistic hazard was calculated at return periods of 500, 2500, and 5000 years. Map Development The ground shaking maps were produced using a vector- and raster-based GIS. Probabilistic ground motions on rock were calculated for the map area using a grid of points at variable spacings of 5 to 20 km. Each grid point was assigned to a site response category. Surface ground motions were calculated by multiplying the rock ground motions by the appropriate amplification factors. The amplification factors
for each grid point were selected based on the site response unit, depth to rock, and the input rock peak acceleration as described above. For a grid point on soft rock in western Montana, no amplification factor was applied since the ground motions were calculated for a soft rock condition. For a grid point on soft rock in eastern Montana, an amplification factor was applied to convert from the hard rock input motion to soft rock. For each map, the peak or spectral acceleration values were color contoured by interpolation in intervals of 0.10 g. The intent was to avoid implying a greater level of resolution and/or accuracy than was possible given the limitations of available geologic data.
MAPS AND RESULTS The resulting hazard maps for an uniform site condition of soft rock show the highest hazard concentrated along the most active faults (Figure 2). At a return period of 5000 years, the highest peak horizontal accelerations reach upwards of 1 g in the vicinity of the active Centennial fault along the Montana-Idaho border. Other areas of relatively moderate hazard occur in the vicinities of the Mission, Canyon Ferry, Madison, Emigrant, and Red Rock faults (Figure 2). Areas away from the more active faults in western Montana are characterized by peak accelerations of 0.10 to 0.30 g. Eastern Montana is characterized by peak horizontal accelerations of less than 0.10 g at a return period of 5000 years due to the absence of active faults and a low-level of seismicity (Figure 2). The peak acceleration hazard maps at return periods of 1000 and 2500 years show a similar pattern to the 5000-year return period maps. The peak horizontal acceleration value range up to 0.30 to 0.40 g and 0.70 to 0.80 g on the two maps, respectively. The hazard maps for 0.2 and 1.0 sec horizontal spectral acceleration display the same general patterns as the peak acceleration maps. The maps for the ground surface have been completed but are not discussed herein. They show a more complex pattern of ground motions due to the site response effects of Quaternary alluvium located in basins throughout western Montana and the Quaternary glacial till in the northernmost portion of the state.
ACKNOWLEDGMENTS This study was funded by the Montana Department of Natural Resources Dam Safety Program and FEMA through the National Dam Safety Act. Financial support was also provided by URS Corporation and the Montana Bureau of Mines and Geology. We would like to thank the many individuals who provided us data, information, and assistance including our review board members Laurence Siroky, Doug Bausch, Mary McLaughlin, Doug McClelland, Ray Schwaller, Kevin Smith, and Steve Romero, and also Chris Leibli, Kathy Haller, Ken Pierce, Susan Vuke, Karen Porter, Karl Kellogg, Tom Patton, Paul Thale, Ken Sandau, and John Moran. Our thanks to Melinda Lee for assisting in the preparation of this report and maps.
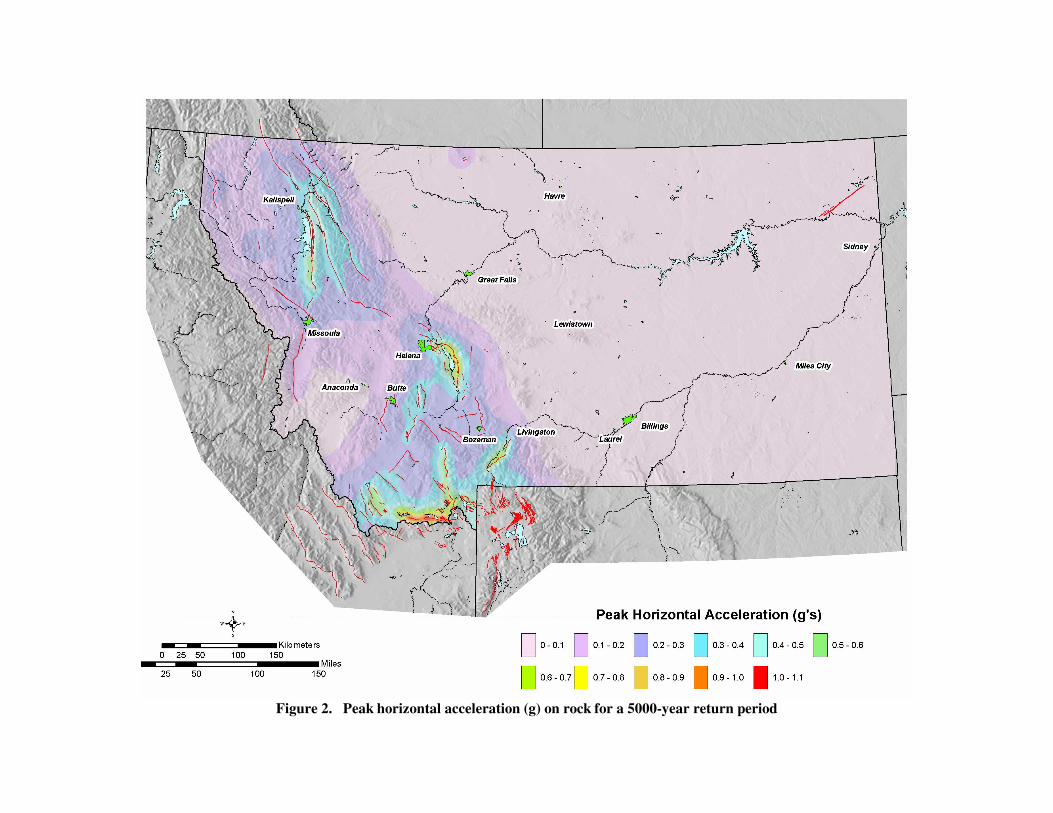
Figure 2. Peak horizontal acceleration (g) on rock for a 5000-year return period
REFERENCES 1. Smith RB, Arabasz WJ. “Seismicity of the Intermountain seismic belt.” Slemmons DB, Engdahl ER, Zoback MD, Zoback ML, Blackwell D, Editors. Neotectonics of North America. Geological Society of North America SMV V-1, 1991: 185-228. 2. Stickney MC, Bartholomew MJ. “Seismicity and late Quaternary faulting of the northern Basin and Range Province, Montana and Idaho.” Bulletin of the Seismological Society of America 1987; 77: 1602-1625. 3. Wong I, Olig S, Dober M, Wright D, Nemser E, Lageson D, Silva W, Stickney M, Lemieux M, Anderson L. “Probabilistic earthquake hazard maps for the State of Montana.” Montana Bureau of Mines and Geology (in press), 2004. 4. Anders MH, Geissman JW, Piety LA, Sullivan JT. “Parabolic distribution of circumeastern Snake River Plain seismicity and latest Quaternary faulting: Migratory pattern and association with the Yellowstone hotspot.” Journal of Geophysical Research 1989; 94: 1589-1621. 5. Bakun WH, Stickney MC. “Historic Montana earthquake sources inferred from intensity data.” Seismological Research Letters 2002; 73: 262. 6. Haller KM, Stickney MC, Machette MN. “Quaternary faults and seismicity in western Montana.” Montana Bureau of Mines and Geology Open-File Report 411, 2000, 241 p. 7. Stickney MC, Haller KM, Machette MN. :Quaternary faults and seismicity in western Montana.” Montana Bureau of Mines and Geology Special Publication 411, 2000. 8. Machette MN, Pierce KL, McCalpin JP, Haller KM, Dart RL. “Map and data for Quaternary faults and folds in Wyoming.” U.S. Geological Survey Open-File Report 01-0461, 2001; 1.0, 154 p. 9. Woodward-Clyde Federal Services, Geomatrix Consultants, Pacific Engineering and Analysis. “Site-specific probabilistic seismic hazard analysis for the Idaho National Engineering Laboratory.” Final Report prepared for Lockheed Martin Idaho Technologies and U.S. Department of Energy INEL-95/0536, Volumes 1 and 2, 1996. 10. Wong IG, Olig SS, Gorton AE, Naugler WE. “Seismotectonic evaluation of the Broadwater Power Project, Toston, Dam, Montana.” Unpublished final report prepared for Montana Department of Natural Resources and Conservation, 1999. 11. Wong I, Olig S, Dober M. “Preliminary probabilistic seismic hazard analyses, Island Park, Grassy Lake, Jackson Lake, Palisades, and Ririe Dams, eastern Idaho and western Wyoming.” Unpublished final report prepared for U.S. Bureau of Reclamation, 2000. 12. Pierce KL, Lageson DR, Ruleman CA, Hintz RG. “Holocene paleoseismology of Hebgen Lake normal fault, MT: The Cabin Creek site of the Hebgen Lake Paleoseismology Working Group.” EOS Transactions, American Geophysical Union 2000; 81: F1170. 13. Hecker S, Stenner H, Costa C, Schwartz DP, Hamilton JC. “New paleoseismic results from the central part of the 1959 Hebgen fault rupture, Montana.” Geological Society of America Abstracts with Programs 2002; 34: A-4. 14. Haller KM, Tsutsumi H, Machette MN, Essex J, Hancock D. “Paleoseismic investigation of the 1959 Red Canyon fault, southwestern Montana.” Geological Society of America Abstracts with Programs 2002; 34: A-4. 15. Anderson LW, LaForge R. “Seismotectonic study for Hungry Horse Dam, Hungry Horse Project, and Gibson Dam, Sun River Project, Montana.” U.S. Bureau of Reclamation Seismotectonic Report 2001-5, 2001. 16. Anderson LW, LaForge R. “Seismotectonic study for Canyon Ferry Dam, Missouri River Basin Project, Montana.” U.S. Bureau of Reclamation Seismotectonic Report 2003-1, 2002. 17. Ruleman CA III. “Quaternary tectonic activity within the Yellowstone tectonic parabola and associated seismic hazards, southwest Montana.” MS Thesis, Montana State University, 2002. 18. Leibli CL, Lageson DR. “Quaternary reconnaissance slip-rate assessment of range front faults in western Montana.” Unpublished draft report, Montana State University, Bozeman, Montana, 2002.
19. Breckenridge RM, Lewis RS, Adema GW, Weisz DW. :Miocene and younger faults in Idaho.” Idaho Geological Survey Map 8, 2003; 1:1,000,000 scale. 20. Gorton AE, Olig SS. “The New Toston fault: Implications for basin evolution and seismic hazards in western Montana.” Geological Society of America Abstracts with Programs 1999; 31: A-14. 21. Anderson LW, Piety LA, Olig SS, Forman SL. “Late Quaternary activity of the Canyon Ferry fault, Montana.” Geological Society of America, Abstracts with Programs 2003; 35: 11. 22. Wells D, Coppersmith KJ. “New earthquake magnitude and fault rupture parameters, Correlations among earthquake magnitude, rupture length, and fault displacement.” Bulletin of the Seismological Society of America 1994; 84: 974-1002. 23. dePolo CM, Slemmons DB. “Estimation of earthquake size for seismic hazards.” Geological Society of America, Reviews in Engineering Geology 1990; VIII: 1-27. 24. Schwartz DP, Coppersmith KJ. “Fault behavior and characteristic earthquakes—examples from the Wasatch and San Andreas fault zones.” Journal of Geophysical Research 1984; 89: 5681-5698. 25. Youngs RR, Coppersmith KJ. “Implications of fault slip rates and earthquake recurrence models to probabilistic seismic hazard estimates.” Bulletin of the Seismological Society of America 1985; 75: 939-965. 26. Wesnousky SG, “Earthquakes, Quaternary faults, and seismic hazard in California.” Journal of Geophysical Research 1986; 91: 12,587-12,631. 27. Wesnousky SG. “Seismicity as a function of cumulative geologic offset: Some observations from southern California.” Bulletin of the Seismological Society of America 1990; 80: 1374-1381. 28. Wesnousky SG. “The Gutenberg-Richter or characteristic earthquake distribution: Which is it?” Bulletin of the Seismological Society of America 1994; 84: 1940-1959. 29. Stirling MW, Wesnousky SG, Shimazaki K. “Fault trace complexity, cumulative slip, and the shape of the magnitude-frequency distribution for strike-slip faults: A global survey.” Geophysical Journal International 1996; 124: 833-868. 30. Wong IG, Olig SS. “Seismic hazards in the Basin and Range Province: Perspectives from probabilistic analyses, in Western States Seismic Policy Council.” Lund, WR, Editor. Proceedings Volume, Basin and Range Province Seismic-Hazards Summit. Utah Geological Survey Miscellaneous Publication 98-2; 1998: 110-127. 31. Doser DI. “The 1983 Borah Peak, Idaho and 1959 Hebgen Lake, Montana earthquakes—Models for normal fault earthquakes in the Intermountain Seismic Belt.” Stein RS, Bucknam RC, Editors. Proceedings of Workshop XXVIII on the Borah Peak, Idaho, Earthquake. U.S. Geological Survey Open-File Report 1985; 85-290: p. 368-384. 32. dePolo CM. “The maximum background earthquake for the Basin and Range Province, western North America.” Bulletin of the Seismological Society of America 1994; 84: 466-472. 33. Frankel A. “Mapping seismic hazard in the central and eastern United States.” Seismological Research Letters 1995; 66: 8-21. 34. Wong I, Silva W, Olig S, Thomas P, Wright D, Ashland F, Gregor N, Pechmann J, Dober M, Christenson G, Gerth R. “Earthquake scenario and probabilistic ground shaking maps for the Salt Lake City, Utah, metropolitan area.” Utah Geological Survey Miscellaneous Publication MP-02-05, 2002, 50 p. 35. Silva WJ, Li S, Darragh R, Gregor N. “Surface geology based strong motion amplification factors for the San Francisco and Los Angeles area.” Unpublished report prepared for PEARL by Pacific Engineering & Analysis, 1999. 36. Silva WJ, Wong IG, Darragh RB. “Engineering characterization of earthquake strong ground motions in the Pacific Northwest.” Rogers AM, Walsh TJ, Kockelman WJ, Priest GR, Editors. Assessing Earthquake Hazards and Reducing Risk in the Pacific Northwest. U.S. Geological Survey Professional Paper 1560; 2: 313-324, 1998. 37. Spudich P, Fletcher JB, Hellweg M, Boatwright J, Sullivan C, Joyner WB, Hanks TC, Boore DM, McGarr A, Baker LM, Lindh AG. “SEA96 - A new predictive relation for earthquake ground motions in extensional tectonic regimes.” Seismological Research Letters 1997; 68: 190-198.
38. Stepp JC, Wong I, Whitney J, Quittmeyer R, Abrahamson N, Coppersmith K, Toro G, Youngs R, Savy J, Sullivan T, Yucca Mountain PSHA Project Members. “Probabilistic seismic hazard analyses for ground motions and fault displacement at Yucca Mountain, Nevada.” Earthquake Spectra 2001; 17: 113-151. 39. Abrahamson NA, Silva WJ. “Empirical response spectral attenuation relations for shallow crustal earthquakes.” Seismological Research Letters 1997; 68: 94-127. 40. Spudich P, Joyner WB, Lindh AG, Boore DM, Margaris BM, Fletcher JB. “SEA99 – A revised ground motion prediction relation for use in extensional tectonic regimes.” Bulletin of the Seismological Society of America 1999; 89: 1156-1170. 41. Sadigh K, Chang CY, Egan JA, Makdisi F, Youngs RR. “Attenuation relationships for shallow crustal earthquakes based on California strong motion data.” Seismological Research Letters 1997; 68: 180-189. 42. Campbell KW. Empirical near-source attenuation relationships for horizontal and vertical components of peak ground acceleration, velocity, and pseudo-absolute acceleration response spectra.” Seismological Research Letters 1997; 68: 154-179. 43. Atkinson GM, Boore DM. “Ground motion relations for eastern North America.” Bulletin of the Seismological Society of America 1995; 85: 17-30. 44. Somerville PG, Collins NF, Abrahamson NA, Graves RW, Saikia CK. “Ground motion attenuation relations for the central and eastern United States.” Unpublished report prepared for the U.S. Geological Survey, 2001. 45. Toro GR, Abrahamson NA, Schneider JF. “A model of strong ground motions from earthquakes in Central and Eastern North America: Best estimates and uncertainties.” Seismological Research Letters 1997; 68: 41-57. 46. Campbell KW. Prediction of strong ground motion using the hybrid empirical method and its use in the development of ground-motion (attenuation) relations in eastern North America.” Bulletin of the Seismological Society of America 2003; 93: 1012-1033. 47. Silva W, Gregor N, Darragh R. “Development of regional hard rock attenuation relations for central and eastern North America.” Unpublished report prepared by Pacific Engineering and Analysis (available on the PE&A website), 2002. 48. Wong IG, Silva WJ, Youngs RR, Stark CL. “Numerical earthquake ground motion modeling and its use in microzonation.” Proceedings of the 11th World Conference on Earthquake Engineering: Pergamon (CD-ROM), 1996. 49. Silva WJ, Abrahamson NA, Toro G, Constantino C. “Description and validation of the stochastic ground motion model.” Unpublished report prepared for the Brookhaven National Laboratory, 1997. 50. Warren DH, Healy JH, Bohn J, Marshall PA. “Crustal structure under LASA from seismic refraction measurements.” Journal of Geophysical Research 1973; 78: 8721-8734. 51. McCamy K, Meyer RP. “A correlation method of apparent velocity measurement.” Journal of Geophysical Research 1964; 69: 691-699. 52. Cornell CA. “Engineering seismic risk analysis.” Bulletin of the Seismological Society of America 1968; 58: 1583-1606.