Embed Size (px)
Citation preview

EARTHQUAKE ENGINEERING AND STRUCTURAL DYNAMICS, VOL. 2, 359-378 (1974)
TIME AND AMPLITUDE DEPENDENT RESPONSEOF STRUCTURES
F. E. UDWADIA AND M. D. TRIFUNAC
Department of Engineering and Applied Science, California Institute of Technology, Pasadena, California, U.S.A.
SUMMARY
An understanding of the precise nature of the non -linear response of structures is essential for future improve-ment of earthquake resistant design procedures. This paper presents a summary of observations of dynamicbehaviour which were made on two typical modern buildings during a period of about ten years. These structuresunderwent numerous tests and experienced three strong earthquake ground motions . The data presented shouldprove useful for calibration of parameters in theoretical non-linear models.
For buildings having an apparent soft -spring-type non-linearity, a partial or complete recovery of the structuralstiffness appears to occur following the large strains created by strong ground shaking . The rate and extent ofthis recovery appear to depend strongly on the strain levels throughout the excitation.
INTRODUCTION
The main purpose of most experiments on full-scale structures is to find their dynamic properties which, inthe majority of applications, can be expressed through the natural frequencies, modes of vibration and thecorresponding equivalent viscous dampings . Because these properties determine the initial linear responseof structures during strong earthquake ground shaking, strong winds and artificial blasts, much effort hasbeen devoted in the past several years to the development of new techniques and the refinement of existingexperimental methods for full-scale structural testing.1-12
A majority of the experimental procedures and methods of analysis in the full- scale testing of structuresare developed around the assumption that the systems studied are time-invariant and linear, or that anequivalent time-invariant and linear system can be found. While it has been repeatedly demonstrated thatthese assumptions are quite adequate for many applications which involve small amplitude excitations,large excitations bring out the non-linear features of the system , and erroneous results may appear if theabove assumptions are still applied . The tendency to use linear models in mathematical formulations ofvibration problems has also been motivated by the fact that the tools of the theory of linear systems arereadily available for use in the analysis.
A rather helpful aspect of the time-invariant linear system approach to structural vibration problems isthe relative ease with which the system can be characterized (through its transfer function) by experi-mentally measuring the input to the system and its subsequent response. Though this approach may not behelpful in the actual design process , it might substantially aid in calculating the response of existing structuresto ground shaking, if indeed the linear time-invariant criterion is satisfied. This is because the non-parametric approach (transfer function method) bypasses the lengthy and involved procedures in thesystem definition utilizing parameters that would otherwise have to be estimated from structural details,i.e. the formulation of a theoretical parametric model. Because of this important application it becomesessential to determine the amplitudes of vibration to which the linear time-invariant system approach canbe carried out without introducing serious errors into the analysis.
If an experiment on a non-linear time-variant structural system is analysed by means of a `transfer function'as though the system were a linear time-invariant one, several apparent effects will be introduced into theresults. The `natural frequency' peaks will become broader and less well defined. In some cases, especiallyfor the higher modes, the peaks may branch into two or three. Consequently, damping estimates, derivedfrom the shape of the frequency peak, will become too large and ill defined.13
© 1974 by John Wiley & Sons, Ltd.
Received 26 October 1973
359

360 F. E. UDWADIA AND M. D. TRIFUNAC
The purpose of this paper is to examine the quantitative aspects of the above-mentioned time andamplitude variations of structural characteristics by presenting the experimental results for two modernbuildings. These structures were tested repeatedly over a span of several years by almost all experimentalprocedures currently in use. During the same period of time, three earthquakes were recorded in one buildingand two in the other, thus allowing comparisons to be made of the responses to small, intermediate andlarge excitations and the apparent system changes as a function of time.
One of the structures studied is a nine-storey reinforced concrete building (the Robert Millikan Libraryon the Campus of the California Institute of Technology in Pasadena, California). A forced vibrationexperiment was carried out on this structure by Kuroiwa14 and was briefly summarized by Jennings andKuroiwa.15 The first ambient vibration test was performed in March 1967 and was reported by Blanfordet al.4 In April 1968 the Borrego Mountain earthquake occurred but was recorded only in the basement ofthe library.16 Subsequent ambient vibration tests were carried out in April 196813 and July 1969.13 The LytleCreek earthquakes' was recorded in September 1970 and the San Fernando earthquake18 was recorded inFebruary 1971. Shortly after the San Fernando earthquake the last complete ambient vibration test wascarried out.19
The second structure studied in this paper is a ten-storey steel-frame building (Building 180 at the JetPropulsion Laboratory of the California Institute of Technology, Pasadena). Forced vibration tests in thisbuilding were carried out from January to November 1963.20 Three earthquakes (the Borrego Mountainin April 1968,16 the Lytle Creek in September 197017 and the San Fernando in February 197118) wererecorded in the basement and on the roof. The only complete, two-dimensional ambient test of this structurewas carried out in July 1971.21
Only a small number of modern buildings have so far been tested using the ambient and forced vibrationmethods. Prior to the San Fernando earthquake of February 1971 there were only a few measurements oflarge amplitude building response to strong earthquake ground motion. Since our understanding of thedynamics of full-scale structures can expand and improve only on the basis of many sound and completemeasurements covering a wide amplitude and frequency range, it is clear that present vibration measuringtechniques should be extended and that more detailed and complete instrumentation of typical structuresshould be developed.
EXPERIMENTAL PROCEDURES
Several methods of testing full-scale structures are currently being used. According to the desired level ofexcitation, the available instrumentation and the methods of analysis, the details of the selected proceduresmay vary considerably. In the following we briefly summarize some of the main characteristics of the experi-mental procedures which have been employed in testing the two structures studied in this paper. Moredetailed descriptions of these and other experimental methods can be found in the earthquake engineeringliterature.22
Microtremors and wind represent examples of naturally occurring excitations which are often used forfull-scale structural testing. Microtremors and earthquakes excite the structural motions in the same way.The random trains of transient waves excited by various noise sources close to the surface of the earth aretransmitted into the building through its foundation. Wind excitations, on the other hand, act on the wholebuilding directly, thus leading to a time- and space-dependent forcing function. While wind excitations canlead to vibration amplitudes which are significantly larger than those excited by microtremors, both excitationsare acting simultaneously and usually no effort is made to separate their effects. In analysing buildingvibrations caused by weak winds and microtremors, because the strains are small it is usually assumed thatthe materials respond linearly, and consequently that the principle of superposition applies. Theseassumptions then allow the system to be expressed as a linear combination of its modes of vibration. Theexperimental measurements are then analysed using the Fourier transform approach if the recorded vibrationsare of a transient nature and the power spectrum method if they are assumed to be steady-state membersof a stationary random process.
Forced vibration tests are carried out by means of one or more vibration generators which effectivelyexert a sinusoidal point force on the structure. By suitable arrangements of several vibration generators,

TIME AND AMPLITUDE DEPENDENT RESPONSE OF STRUCTURES 361
it is possible to excite translational, torsional or two-dimensional modes of vibration.20, 21 The maincharacteristic of these tests is that the structure oscillates at the excitation frequency imposed by the vibrationgenerator. This facilitates the data analysis and reduction since no Fourier transform or power spectrumtechniques are called for as in the case of microtremors and wind excitations. However, forced vibrationtests take significantly more time in the field since the structural characteristics have to be studied point by
point in the selected frequency band.Man-excited structural vibration testing is a simple and expedient method of finding information about
the fundamental and only rarely the higher natural frequencies of a structure. For this type of testing, theoperator moves his body back and forth in synchronism with the natural period of the system. This can beaccomplished by his continuous observation of the visual display of the induced structural motions.9
Numerous other procedures have been developed and used for the testing of full-scale structures.22' 23These methods involve different forms of excitation and a variety of data analysis procedures, but are allcharacterized by relatively small levels of the induced structural vibrations. It has been demonstrated thateven at these small levels the structures may exhibit non-linear force deflection relationships.12,14 However,the observed changes of natural frequency have usually been of the order of 10 per cent at most, there beingno detectable irreversible change in the structural properties.
Strong earthquake ground motions represent one of the most powerful excitation sources for buildings.Though these strong motions represent a serious threat to human life, thus motivating us towards acquiringa better understanding of them by comprehensive instrumentation programs, records of structural vibrationsgenerated by them also represent invaluable and unique sources of information for the detailed analysis ofnon-linear response.
LINEAR AND NON-LINEAR MODELS : METHODS OF ANALYSIS
In most ambient and forced vibration tests of buildings it is assumed that the structure can be idealized as adamped , linear , discrete or continuous system whose properties vary with reference to a line or a plane.13When the measurements indicate that the floor structures are sufficiently stiff, a one-dimensional line modelmay be acceptable.
A linear , time-invariant, structural system can be thought of as a device or a process which operates on atime history and changes it in some way. The most basic description of such a process may be given throughthe unit impulse function h(T) and the convolution integral
y(t) = f h(r)x(t-T)dT (1)-0000J
where we have assumed zero initial conditions; x(t) is the input time history and y(t) is the result of theaction of the linear system on x(t). Taking the Fourier transform of both sides of equation ( 1) and designatingthe Fourier transforms of x(t), y(t) and h(t) by X(f), Y(f) and H(f) respectively , it is easy to show that
Y(f) = H(f) X(f) (2)
Equation (2) is of great importance in the analysis of linear structures because it states that the Fouriertransform of the output is equal to the product of the Fourier transform of the input and the Fourier trans-form of the unit impulse response h(T). The latter transform is also often referred to as the transfer functionof the system. The significance of this formulation lies in the fact that the structure can be represented by a`black box' whose unit response function and therefore the output y(t), for any given x(t), can be determinedwithout a detailed knowledge of the structural system.
For a system with non-linear characteristics superposition is no longer applicable, hence the concept ofthe `transfer function' breaks down, and the simple relationship depicted in equation (1) becomes invalid.However, a `moving window' Fourier analysis may be used to determine the `apparent transfer function' ofthe `equivalent linear system' that may characterize the structure in a short interval of time when non-linearities are small and the excitation amplitudes and frequency of excitation change slowly.

362 F. E. UDWADIA AND M. D. TRIFUNAC
Moving window Fourier analysis is a commonly used tool in time series analysis. It is used to describe thechanges in the frequency content of a signal, which are slow relative to the smallest frequency resolved bythe Fourier transform, i.e. 27r/T, where T is the length of the time window. Under these circumstancesequations (1) and (2) may be used to determine the `apparent transfer function' of the system which wouldcorrespond to the equivalent linear model that describes approximately the system response in a shortinterval of time T. This approach, of course, can serve only as an approximate tool for determining theequivalent linear system with slowly changing parameters, since the effects of the input before the timeinterval T, which are introduced into the observation window through the memory characteristics of thenon-linear system, have been neglected. For the purpose of this approximate analysis we will neglect theeffects caused by the memory characteristics of the system and will assume that the apparent frequenciesof the system, for the time interval T, can be determined from the ratio of the output and input Fourier
transforms as indicated by equation (2) for the same time interval T. We will use this approximate method tostudy the apparent frequency changes of building vibrations during strong earthquake ground motion.
TWO CASE STUDIES
Nine-storey reinforced concrete buildingGeneral description. The Robert Millikan Library on the Campus of the California Institute of Technology
is a nine-storey reinforced concrete building with basement. Figure 1 shows a NS section, the typical floorplan and the overall dimensions. The structural system is characterized by the two shear walls which aredesigned to carry lateral loads in the NS direction and by the central core which houses the elevator shaftand provides resistance to EW loads. Other structural details, phases of construction and the properties ofthe underlying soil have been described in detail by Kuroiwa.14
A N-S SECTION TYPICAL FLOOR PLAN
Tu^
Ifi=p 7r7f=ir-^'n^^^lr i%
15'ROOF +128
9TH 114'
14' 1 100'
147TH 86'
6TH 72'
14'5TH 50'
14'4rH 44
14^3R0 30'
14'2ND 16'
I6'IST 0-
1 4'-14'
Figure 1. Millikan library building
4 NORTH
69'
MLJ
EAST SHEAR WALL
WEST SHEAR WALL
25'
25'
25'

TIME AND AMPLITUDE DEPENDENT RESPONSE OF STRUCTURES 363
Summary of measuring equipment, procedures and the different tests. Forced vibration tests of the Millikan
Library were carried out during 1966-67 by Kuroiwa 14 During these tests two shakers were mounted onthe 9th floor at locations I and II which are shown in Figure 1. For the NS and EW translational experi-
ments the shakers were synchronized to move in phase, while for the torsional excitation out-of-phase motion
was used. Acceleration transducers were located in position A for NS and in position B for EW vibrationtests (Figure 1). Positions C, D, E and F were used during the torsional experiments. Typical acceleration
amplitudes during the forced vibration tests were of the order of 10-2 g. To test the linearity of response,
Kuroiwa14 used different force levels and found that in the response amplitude range between 3 x 10⁻² cmand 15 x 10-2 cm the E-W fundamental soil-structure frequency changed by about 3 per cent. These changescould be interpreted by a softening-spring type of non-linearity.
Ambient vibration experiments on the Millikan Library were first carried out during March 1967.4 Themeasuring system consisted of Ranger seismometers, a signal conditioner and an analogue magnetic taperecorder. The transducer locations coincided with those used by Kuroiwa14 in the forced vibration experiment(Figure 1). Seven measuring stations for translational modes were located at the roof, 8th, 6th, 4th, 2nd and1st floors and in the basement. One torsional experiment was conducted on the roof.
The other three ambient vibration tests were carried out during 1968,13 196913 and 1971.19 The measuringequipment, the methods of measurement and the data analysis were essentially the same as those duringthe first experiment in 1967. Changes in the apparent frequency of building vibration prior to, during andafter the San Fernando earthquake of 9 February 1971 and the possible incomplete recovery of the pre-earthquake stiffness of the soil-structure system motivated an additional man-excited test which was carried
out during 1972.13Comparison of ambient, forced and earthquake-excited vibrations. Figures 2 and 3 show the NS and EW
transfer functions of the Millikan Library building for the excitations during the Lytle Creek earthquake of197017 and the San Fernando earthquake.13 These transfer functions have been computed from the Fouriertransforms of the complete earthquake records obtained at the roof and basement of this building. For theSan Fernando earthquake the figures show marked reductions of the apparent natural frequencies relativeto values obtained from the ambient and forced vibration tests (shown by arrows in the figures). The samephenomenon is present to a lesser degree in the response to the Lytle Creek earthquake. The broad peaks ofthe transfer functions seem to represent the integrated effect of gradual changes in the structural naturalfrequencies for different levels of earthquake excitation. No significant change in the structural systemfollowing the Borrego Mountain earthquake of 196816 could be identified from the ambient vibration testsin 196913 (Figures 2 and 3). Vibrations during this earthquake could most probably be characterized by atransfer function similar to that for the Lytle Creek earthquake. However, following the San Fernandoearthquake, ambient vibration tests indicated appreciable reductions of natural frequencies. This reductionfor the first mode in the NS direction was 4.8 per cent, while for the softer EW direction the percentagereductions in the 1st and 2nd modes were 14 per cent and 9 per cent, respectively. Ambient vibrationtests19 after the San Fernando earthquake indicated a fundamental EW period of 0.80 sec (Figure 3). Asmaller aftershock during March 197113 indicated this period to be about 0.75 sec, while a subsequentambient test gave a period of 0.77 sec.13 The man-excited ambient tests conducted during December 1971,13
indicated a period of 0.73 sec.Moving window Fourier analysis of earthquake-excited vibrations. Figures 4, 5, 6 and 7 present the moving
window Fourier analysis for EW and NS vibrations of the Millikan Library during the Lytle Creek andSan Fernando earthquakes. The transfer functions have been calculated for 8 sec window lengths of bothEW and NS records starting from the beginning and displacing the window each time by 2 sec. The apparentnatural frequencies were picked by hand and plotted versus the time corresponding to the middle of eachwindow (Figure 4). The horizontal lines (Figure 4) indicate the natural frequencies as determined fromvarious tests done on the structure at various times. The error bars show the maximum possible error inpicking a frequency peak from the computed transfer functions. It is clear that this choice of the windowduration permits detection of the changes in the system that occur over time intervals comparable to thewindow length T. Thus, for example, the short bursts of larger roof response amplitudes at 3, 7 and 15 secin Figure 5 are too short for possible changes in the apparent frequency of vibration to be detected.

364
AMBIENT VIER , TEST ( March,1967)
FORCEDI VIER. TEST ( 1966-1967)
it
1 I
I I I I I6 8 10 12 14
FREQUENCY-CPS
• TORSION
MAN EXCITED VIBR. TEST ( Dec, 1972)
QI AMBIENT VIBR. TEST ( Feb, 1971)
.QLAMBIENT VIBR. TEST (Ju(y,1969)
UAMBIENT VIBR. TEST (April,1968)
Figure 2. Earthquake, forced vibration and ambient vibration test data, Millikan library.
F. E. UDWADIA AND M. D. TRIFUNAC
0 NORTH-SOUTH
I NORTH-SOUTHt- TRANSFER FUNCTION
A EAST-WEST
II *
I^i rn I^
III
II
I 1r
EAST-WESTI TRANSFER FUNCTIONI (SAN FERNANDOI EARTHQUAKE, 1971)
I I j Vnli
A II III
I
n
• TORSION
_MAN EXCITED VIBR. TEST ( Dec,1972)
1 AMBIENT VIBR. TEST ( Feb, 1971)
-AMBIENT VIBR . TEST (July,1969)
AMBIENT VIBR . TEST (Aprll,1968)
-AMBIENT VIBR. TEST ( Iarch,l967)
-FORCED VIBR . TEST (196-1967)
,,^ TRANSFER FUNCTION(LYTLE CREEKEARTHQUAKE, 1970)
I I I I'I I ) I00 2 4 6 8 10 12 14
FREQUENCY-CPS
Figure 3. Earthquake, forced vibration and ambient vibration test data, Millikan library
The EW response (Figure 4) of the structure indicates systematic changes in the apparent frequency. Agradual increase in the fundamental frequency is observed up to about 12 sec, after which the original pre-earthquake frequency is recovered. The reason for this behaviour is attributable to the fact that only the tailend of the strong motion was recorded. The initial reduced value of the apparent frequency (as compared tothe pre-earthquake values) during the interval of time when the roof accelerations were about 0.03 g, and itsrecovery when the roof accelerations decreased to less than 0.01 g, are clearly indicated in Figure 4.
(LYTLE CREEKEARTHQUAKE, 1970)
NORTH-SOUTHTRANSFER FUNCTION(SAN FERNANDOEARTHQUAKE, 1971)
I I i I I I 1

TIME AND AMPLITUDE DEPENDENT RESPONSE OF STRUCTURES 365
The signal-to-noise ratio for the moving window Fourier analysis of the second NS mode of vibration(Figure 5) for the Lytle Creek data was low and the transfer function often indicated several peaks. Ratherthan delete the data, we selected up to three peaks and shaded the area between the peaks in Figure 5 to
s-- . EARTHQUAKE----- AMBIENT TEST ( July,1969)--- AMBIENT TEST ( April,1968)- -- AMBIENT TEST ( March,1967)
SHAKER TEST (1966-1967)
6.................
L SECOND MODE ERROR BARI
5
1.75
I ERROR BAR
1.50
1.25
100
NUN
\ 0EU
E-W BASE ACCELERATION
-1001 1 1 1 1 1 1 1 1 1 1 1 )
0 10 20TIME-SECONDS
Figure 4. Frequency variation of first and second translational modes, Lytle Creek earthquake, 1970, data on Millikanlibrary east-west response
indicate the approximate changes of this frequency. The purpose of doing this was to illustrate thecomplications and problems that can arise in using this rather simple heuristic approach to determiningtime-dependent frequency characteristics, especially in the presence of noise. The time changes of thefundamental NS frequency and its departures from the frequencies measured in ambient and forced vibrationtests (Figure 5) are smaller than the possible errors in selecting the frequency of a peak from the computedtransfer function and thus may not be significant.
The first 8 sec of the EW and NS motions during the San Fernando earthquake (Figures 6 and 7) showfundamental frequencies of 1.3 cps and 1.9 cps. These are essentially the same as those determined by the
14

366 F. E. UDWADIA AND M. D. TRIFUNAC
small amplitude ambient and shaker tests prior to the earthquake. However, with the arrival of large motionsthat resulted in a roof acceleration in excess of 0.2 g, the apparent fundamental frequency quickly reduced toabout l•0 cps for the EW (Figure 6) and 1.5 cps for the NS (Figure 7) motions. At about 16 sec the EW
9.5
NUdN
EU
NN
EU
9.0
8.5
8:0
2.0
1.75'-
100r-
-1000
^---- EARTHQUAKE--- AMBIENT TEST ( July,1969)
--- AMBIENT TEST ( April,1968)
AMBIENT TEST ( March,1967)............•••• SHAKER TEST (1966-1967)
I ERROR BAR• 1
FIRST MODE
N-S BASE ACCELERATION
I I I I I I I10 20
TIME-SECONDSFigure 5. Frequency variation of first and second translational modes Lytle Creek earthquake, 1970, data on Millikan
library north-south response
(Figure 6) building accelerations show much lower amplitudes and the transfer function at this time indicatesa double peak, the higher frequency peak being more predominant. As the window shifts out of this lowresponse zone, the apparent fundamental frequency drops again to 1 cps and remains there until thequiescent segment of response between 44 and 54 sec (Figure 6), when the frequency jumps back to 1.33 cps.Subsequent motions cause the apparent fundamental frequency to drop back to 1.0 cps after which arecovery to about 1.23 cps for the window centred at 80 sec occurs. A similar behaviour for the NScomponent of motion is shown for the first two modes in Figure 7. The bifurcation in the frequency peaksfor the first mode is indicated by the break in the solid dotted line at around 18 sec in Figure 6 and at about40 sec in Figure 7.

TIME AND AMPLITUDE DEPENDENT RESPONSE OF STRUCTURES 367
A comparison of the apparent fundamental frequencies determined during the large earthquake excitations
(approximately 02 g), with the frequencies measured during the ambient and forced vibration tests, showsnot only a frequency reduction of the order of 35 per cent, but also a partial or complete recovery following
these large excitations. During the Lytle Creek earthquake (Figure 4) the 15 per cent reduction of the
apparent EW fundamental frequency was completely recovered following the earthquake. During the SanFernando earthquake (Figure 6) the EW motion was characterized by the apparent fundamental frequency
AMBIENT TEST (Feb, 1971)-------- AMBIENT TEST ( July, 1969 & April, 1968)--- AMBIENT TEST ( March, 1967)
SHAKER TEST ( 1966-1967)EARTHQUAKE
W1.0
TERROR BAR
200
EU
200"
200r-
U
00EU
E-W ROOF ACCELERATION11
E-W BASE ACCELERATION
2001 I I I I I I I I I I 1 1 1 1 1 1 1 1 1 1 1
0 20 40 60 80TIME-SECONDS
Figure 6. Frequency variation of lowest translational mode San Fernando earthquake, 1971, data on Millikan libraryeast-west response
reduction of 50 per cent. A few weeks after the earthquake the frequency had partly recovered to a valuewhich was about 18 per cent lower than the pre-earthquake frequency.19 Twenty-two months after the SanFernando earthquake the man-excited test indicated that an additional apparent recovery had taken placeto a value of about 12 per cent lower than the pre-earthquake frequency.13
Ten-storey steel frame building
General description. The Engineering Building 180 , located at the site of the Jet Propulsion Laboratory ofthe California Institute of Technology in Pasadena , California, is a ten -storey symmetric steel-frame structure.The overall dimensions of the building and some construction details are shown in Figure 8 together withthe typical floor plan and the NS , EW sections . The structural system is characterized by a steel frame andrelatively rigid girders in the long EW direction (Figure 8). Other structural characteristics , construction
details and soil properties have been discussed in detail by Nielsen.20Summary of measuring equipment and procedures for the different tests. Forced- and man -excited vibration
tests were carried out between January and November 196320 during the various stages of construction, and

368 F. E. UDWADIA AND M. D. TRIFUNAC
after the building had been completed. For the preliminary torsional and translational tests only one shaker
was used on the 6th floor (Figure 8). It was located off the building centre to enable an adequate excitationof the torsional modes. The results obtained from the preliminary tests were used to find the optimallocations for two shakers (B and C in Figure 8) to be used in the final tests.20 The detailed description ofthe measuring equipment, the results of the numerous tests and their interpretation have been given byNielsen.20 A linear computer model of this structure was studied by Wood,24 while its non-linear hysteriticbehaviour was deduced by Jennings.25
8.0
7.5
2.0
1.5
NUN
E
N-S BASE ACCELERATION
2001 1 1 1 1 I 1 t 1 t. 1 1 1 1 1 1 1 1 r 1 I0 20 40 60 80
TIME-SECONDS
Figure 7. Frequency variation of first and second translational modes San Fernando earthquake, 1971, data on Millikanlibrary north-south response
Ambient vibration tests on Building 180 were carried out in July 1971 following the San Fernando earth-quake.21 These tests revealed the detailed two-dimensional vibrational characteristics for the NS vibrationsand clarified and augmented the information previously gathered during the forced vibration tests. Themeasurements were carried out by simultaneously using six Ranger seismometers, one signal conditioner andan analogue magnetic tape recorder. The vertical reference axis of the vibration mode shapes was a verticalline close to column 13 (Figure 8). The horizontal variations of modal amplitudes were measured at sixlevels (basement, 2nd, 4th, 6th and 8th floors and roof) near columns 2, 4, 6, 9, 11 and 1321 (Figure 8).
Comparison of ambient, forced and earthquake-excited vibrations. The NS and EW transfer functionscomputed from the Fourier transforms of the complete available length of the strong -motion records are
200
N
N0
EU
22-00
AMBIENT TEST (Feb, 1971)-------- AMBIENT TEST (July, 1969)--- AMBIENT TEST (April, 1968)
AMBIENT TEST (March, 1967).... . ...... SHAKER TEST (1966-1967)r^ EARTHQUAKE
N-S ROOF ACCELERATION

TIME AND AMPLITUDE DEPENDENT RESPONSE OF STRUCTURES
220'
rnI *14 15 19 17 18 19 20 21 22 23
x
0z
24
90'Q 48'-
6VIBRATION EXCITER B VIBRATION EXCITER A VIBRATION EXCITER C
(4th FLOOR) (6th FLOOR) (4th FLOOR)
VM w Em ft VM flm PM an Y1M VMTYP.
A0
B
L L5 L e_n-•i h'2'-0
Figure 8. J.P.L. building
14WF
ALLOTHERCOL'S
369
shown in Figures 9 and 10. These transfer functions are presented for the Borrego Mountain, the LytleCreek and the San Fernando earthquakes. For the distant Borrego Mountain earthquake, recorded motionsconsisted predominantly of long period surface waves. Thus, the highly attenuated high frequency wavesdid not provide an adequate signal-to-noise ratio causing the transfer function for this earthquake (Figures 9and 10) to show large unreliable amplitudes for frequencies higher than about 5 cps. As is shown in Figures11-14, vibration amplitudes during the Borrego Mountain and Lytle Creek earthquakes were nearly the
same. Consequently the apparent natural frequencies in the transfer functions in Figures 9 and 10 areessentially the same. The San Fernando earthquake generated about ten times larger vibration amplitudesresulting in the reduction of both NS and EW apparent natural frequencies (Figures 9 and 10).
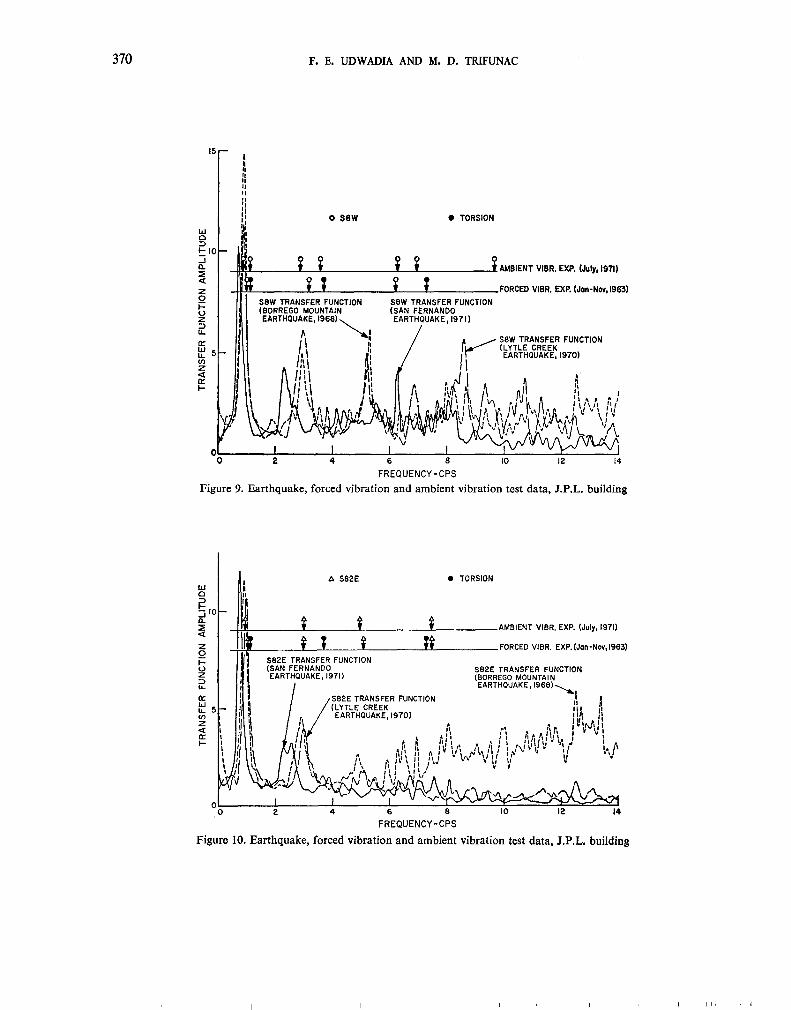
Moving window Fourier analysis. Figures 11-16 show the results of the moving window Fourier analysisfor the data from the three earthquakes. Again, the transfer functions have been calculated for 8 sec windowlengths starting from the beginning and moving the window in steps of 2 sec each in the direction ofincreasing time. As for the data in Figures 6 and 7, the apparent peaks of the moving window transferfunctions were picked by hand and plotted versus time corresponding to the middle of each window.
Figures 11-14 show the changes of apparent natural frequencies for the motions recorded during theBorrego Mountain and Lytle Creek earthquakes. Although these changes are only slightly larger than theerrors involved in identifying the frequency peaks, they seem to follow the usual trend of decreasing apparentfrequency with increasing excitation amplitudes. After these two earthquakes, the apparent frequenciesessentially returned to those determined by the forced vibration tests.20 During the San Fernando earthquake(Figures 15 and 16) the apparent fundamental frequency reduction in the EW and NS directions was about15 per cent and 20 per cent respectively. Six months later the fundamental frequencies were only about6 per cent lower than those determined by the forced vibration test in 1963. Similar changes were also
indicated for the apparent frequencies of the second modes of vibration.
SOUTH
3-*8-06731 28"10" f.
48' 0" `14WF1
370 F. E. UDWADIA AND M. D. TRIFUNAC
0 S8W • TORSION
FORCED VIBR. EXP. (Jan -Nov. 1963)S8W TRANSFER FUNCTION(BORREGO MOUNTAINEARTHQUAKE, 1968)
SBW TRANSFER FUNCTION(SAN FERNANDOEARTHQUAKE, 1971)
S8W TRANSFER FUNCTION(LYTLE CREEKEARTHQUAKE. 1970)
A S82E
S82E TRANSFER FUNCTION(SAN FERNANDOEARTHQUAKE, 1971)
• TORSION
6 8 10 12 14
FREQUENCY-CPS
Figure 9. Earthquake, forced vibration and ambient vibration test data, J.P.L. building
Figure 10. Earthquake, forced vibration and ambient vibration test data, J.P.L. building

TIME AND AMPLITUDE DEPENDENT RESPONSE OF STRUCTURES 371
3.2
3.0
1.0
0.8
30r-
-30
30
Nv
EU
FORCED VIBR. TEST (Jon-Nov, 1963)^• EARTHQUAKE
SECOND MODE
I
k
Iw
9-TH FLOOR S 82 E ACCELERATION
A
BSMT S 82 E ACCELERATION
IO
ERROR BAR
I 1 1 1 1 I I I I 1 I 1 1 I 1 I 1 1
2Q
TIME-SECONDS
30 40
Figure 11. Frequency variation of first and second translational modes Borrego Mountain earthquake, 1968, data onJ.P.L. building S 82 E response
372 F. D. UDWADIA AND M. D. TRIFUNAC
FORCED VIBR. TEST ( Jan.-Nov,1963)•-+ EARTHQUAKE
3.2
3.0
2.8
1-2.6
I.O r
0.8
SECOND MODE
ERROR BAR
FIRST MODE
NUN
E oU
0.6
30r
9-TH FLOOR S 08 W ACCELERATION
A
V^^
-30
30
I- BSMT S O8 W ACCELERATION
-300 10 20 30 40
TIME-SECONDS
Figure 12. Frequency variation of first and second translational modes Borrego Mountain earthquake, 1968, data onJ.P.L. building S 08 W response

TIME AND AMPLITUDE DEPENDENT RESPONSE OF STRUCTURES 373
3.2
3.0
2.8
1.0
0.8
0.6
40
-40
40
FORCED VIBRATION TEST (Jan - Nov, 1963)S---^ EARTHQUAKE
SECOND MODE
FIRST MODE
1
I ERROR BAR
9-TH FLOOR S 82 E ACCELERATION
V
BSMT S 82 E ACCELERATION
-401 I I I I 1 I I I I I I I
0 10
TIME-SECONDS
20
Figure 13. Frequency variation of first and second translational modes Lytle Creek earthquake, 1970, data on J.P.L. buildingS 82 E response

374
NUa/
EU
F. E. UDWADIA AND M. D. TRIFUNAC
3.2
3.0
2.8
2.6
1.0 r
0.8
0.6
40
0
-40
40
l
FORCED VIBR . TEST (Jan.-Nov, 1963).^--^ EARTHQUAKE
FIRST MODE
I ERROR OAR
BSMT S 08 W ACCELERATION
I I I I I I I I I
10 20TIME-SECONDS
Figure 14 . Frequency variation of first and second translational modes Lytle Creek earthquake, 1970, data on J.P.L. buildingS 08 W response

TIME AND AMPLITUDE DEPENDENT RESPONSE OF STRUCTURES 375
I ERROR BAR
WU- 1.0
0.8
EARTHQUAKE
FORCED VIBR. TEST (Jan-Nov,1963)----- AMBIENT VIBR . TEST (Jul, 1971)
---------------------------
i
FIRST MODE
NUa,
E0
0.6
2009 TH 'AF^L^O^O^RA-S 82 E ACCELERATION
MWVYVV"
EU
200'-
200
BSMT S 82 E ACCELERATION
2001 11 1 1 1 1 I 1 1 1 1 I 1 1 1 1 1 1 1 1 1 1
20 40 60 So
TIME-SECONDS
Figure 15. Frequency variation of first and second translational modes San Fernando earthquake, 1971, data on J.P.L.building S 82 E response

376
NUa)
EU
NUc)
EU
2.8r
2.6
2.4
0.8
0.6
0.4
200-
0N
200'-
200 -
I ERROR BAR
9-TH FLOOR S 08 W ACCELERATION
BSMT S O8 W ACCELERATION
2001 1 I 1 10 20 40
I I
60 80
TIME-SECONDSFigure 16. Frequency variation of first and second translational modes San Fernando earthquake , 1971, data on J.P.L,
building S 08 W response
SIGNIFICANCE OF THE OBSERVED NON-LINEARITIES AND CONCLUSIONS
The foregoing summary of different tests on two typical modern buildings shows trends that may prove tobe of value in assessing the potential damage of other similar buildings subjected to earthquakes, blasts orhigh wind loads. It has been known for some time that the natural frequencies determined from ambientvibration tests after an earthquake could be lower by as much as 10-20 per cent when compared with themeasurements from the same or similar pre-earthquake tests.26 This detailed study of two typical buildingsshows, however, that these changes may be significantly larger than the reductions inferred from post-earthquake ambient vibration tests and that these changes are strongly time-dependent.
Two case studies, of course, are not sufficient to permit drawing any general conclusions at this time and manyother experiments will have to be carried out before we begin to understand the full significance of the apparentfrequency changes that accompany the large amplitude vibrations of structures. Nevertheless, the picturethat emerges from the data presented in this paper is that reductions in the apparent fundamental frequencyof vibration during moderate earthquake excitations may amount to as much as 50 per cent without beingaccompanied by observable damage. Following the earthquake there is an apparent recovery of structuralstiffness. Whether this recovery is complete or only partial appears to depend on the amplitude levels of theresponse throughout the complete excitation sequence. This recovery appears to be almost instantaneousfor small earthquake excitations which are characterized in this paper by the Borrego Mountain and Lytle
F. E. UDWADIA AND M. D. TRIFUNAC
FORCED VIBR . TEST (Jan-Nov 1963)----- AMBIENT VIBR . TEST (Jul, 19'fl)!--^ EARTHQUAKE
-+-%,/ SECOND MODE

TIME AND AMPLITUDE DEPENDENT RESPONSE OF STRUCTURES 377
Creek earthquakes. However, following the San Fernando earthquake the apparent frequencies of the twobuildings studied here may still be in the process of recovery. Although some structures undergo repairsafter large earthquakes, thus causing the frequency to recover, in the two case studies illustrated here thisdoes not seem to be a governing factor.
The type of frequency reduction described in the above two case studies may be due to the effects of
soil-structure interaction, non-linear response of soils and/or the non-linear response of structural elements.The failure of non-structural elements during strong ground shaking (like the cracking of plaster, facadewalls, etc.) could also be responsible for the reduction of the fundamental periods observed during strongground shaking. Irrespective of the fact that we still do not know the precise causes for the observedreductions of the apparent frequencies of structural response to intermediate and large excitations, it isalready possible to see the significance that these observations may have for accurate characterization of theenergy absorption potential of structures. The apparent frequency changes may be thought of as beingcaused by a time-dependent non-linear hysteretic behaviour.
At the present time we have no detailed knowledge of the mechanism of `frequency recovery' as observedin these two structures. Though several causes for such a behaviour can be proposed, a considerable amountof research needs to be done to establish the nature of the factors that primarily affect the extent of such arecovery.
ACKNOWLEDGEMENTS
We are indebted to Professors G. W. Housner, D. E. Hudson and P. C. Jennings for their critical readingof the manuscript and for offering many valuable suggestions. We thank Miss Sharon Vedrode for editingthe manuscript.
This research was supported by grants from the National Science Foundation and the Earthquake ResearchAffiliates programme at the California Institute of Technology.
REFERENCES
1. U.S. Coast and Geodetic Survey, `Earthquake investigations in California, 1934-35', Special Publication No. 201,U.S. Dept. of Commerce, Washington, D.C. (1936).
2. R. Crawford and H. S. Ward, `Determination of the natural periods of building', Bull. Seism. Soc. Am. 54, 1743-1756(1964).
3. H. S. Ward and R. Crawford, `Wind induced vibrations and building modes', Bull. Seism. Soc. Am. 56, 793-813 (1966).4. R. B. Blanford, V. R. McLamore and J. Aunon, `Structural analysis of Millikan Library from ambient vibrations',
Earth Sciences Teledyne Co. Report No. 616-0268-2107 (1968).5. V. R. McLamore, `Ambient vibration survey of Chesapeake Bay Bridge', Teledyne Geotronics Report No. 0370-2152
(1970).6. M. D. Trifunac, `Wind and microtremor induced vibrations of a twenty-two story steel frame building', Earthquake
Engng Res. Lab., EERL 70-01, California Institute of Technology, Pasadena (1970).7. M. D. Trifunac, `Ambient vibration test of a thirty-nine story steel frame building', Earthquake Engng Res. Lab.,
EERL 70-02, California Institute of Technology, Pasadena (1970).8. D. E. Hudson, `Synchronized vibration generators for dynamic tests of full-scale structures', Earthquake Engng Res. Lab.,
California Institute of Technology, Pasadena (1962).9. D. E. Hudson, W. 0. Keightley and N. N. Nielsen, `A new method for the measurement of the natural periods of
buildings', Bull. Seism. Soc. Am. 54, 233-241 (1964).10. W. 0. Keightley, `A dynamic investigation of Bouquet Canyon Dam', Earthquake Engng Res. Lab., California Institute
of Technology, Pasadena (1964).11. W. 0. Keightley, G. W. Housner, and D. E. Hudson, `Vibration test of the Encino Dam intake tower', Earthquake
Engng Res. Lab., California Institute of Technology, Pasadena (1961).12. M. D. Trifunac, `Comparison between ambient and forced vibration experiments', Int. J. Earthq. Engng. Struct. Dyn.
1, 133-150 (1972).13. F. E. Udwadia and M. D. Trifunac, `Ambient vibration tests of full-scale structures', Proc. 5th Wld Conf. Earthq. Engng,
Rome, Italy (1973).14. J. H. Kuroiwa, `Vibration test of a multistory building', Earthquake Engng Res. Lab., California Institute of Technology,
Pasadena (1967).15. P. C. Jennings and J. H. Kuroiwa, `Vibration and soil-structure interaction tests of a nine-story reinforced concrete
building', Bull. Seism. Soc. Am. 58, 891-915 (1968).16. Seismological Field Survey, U.S.C.G.S. and Earthquake Engineering Research Laboratory, California Institute of
Technology, `Strong-motion instrumental data on the Borrego Mountain earthquake of 9 April 1968', EarthquakeEngng Res. Lab., California Institute of Technology, Pasadena (1968).

378 F. E. UDWADIA AND M. D. TRIFUNAC
17. M. D. Trifunac, A. G. Brady and D. E. Hudson, `Strong motion earthquake accelerograms, corrected accelerogramsand integrated ground velocity and displacement curves', II, Part W, Earthquake Engng Res. Lab., EERL 74-59,California Institute of Technology, Pasadena (1974).
18. M. D. Trifunac, A. G. Brady and D. E. Hudson, `Strong motion earthquake accelerograms, corrected accelerogramsand integrated ground velocity and displacement curves', II, Part G, Earthquake Engng Res. Lab., EERL 73-52,California Institute of Technology, Pasadena (1973).
19. V. R. McLamore, `Post earthquake vibration measurements, Millikan Library' (unpublished report) (1972).20. N. N. Nielsen, `Vibration tests of a nine-story steel frame building', J. Engng Mech. Div., ASCE92, EM1, 81-110 (1966).21. F. E. Udwadia and M. D. Trifunac, `Two-dimensional ambient vibration tests of structures', Abstract, Seism. Soc. Am.,
Hawaii (1972).22. D. E. Hudson, `Dynamic tests of full-scale structures', in Earthquake Engineering (Ed. R. L. Wiegel), Prentice-Hall,
New Jersey, 1970, Chap. 7.23. D. E. Hudson, `Dynamic properties of full-scale structures determined from natural excitations', Proc. Symp., Stanford
University (1972).24. J. Wood, `Analysis of the earthquake response of a 9-story steel frame building during the San Fernando earthquake',
Earthquake Engng Res. Lab., EERL 72-04, California Institute of Technology, Pasadena, California (1972).25. P. C. Jennings, `Force deflection relations from dynamic tests', J. Engng Mech. Div., ASCE 93, EM2, 115-129 (1967).26. W. K. Cloud and R. P. Maley, `Building-period measurements during an earthquake with comments on instruments',
Proc. Conj: Earthq. Anal. Struct., Rumania (1970).


![Autonomous Precision Control of Satellite Formation Flight ...ruk.usc.edu/bio/udwadia/papers/Autonomous Precision...dynamical systems [20–26] and satellite formation systems [27–30]](https://img.pdfslide.us/doc/110x75/60f67a5f67bc8c763b272407/autonomous-precision-control-of-satellite-formation-flight-rukuscedubioudwadiapapersautonomous.jpg)