Embed Size (px)
Citation preview
EARTH, WIND AND FIRE
1
Unpacking the political, economic and
security implications of discourse on the
Green Economy
MYTELKA, L., MSIMANG, V. AND PERROT, R
29 JANUARY 2016
EARTH, WIND AND FIRE
EARTH, WIND AND FIRE
2
EARTH, WIND AND FIRE
UNPACKING THE POLITICAL,
ECONOMIC AND SECURITY
IMPLICATIONS OF DISCOURSE
ON THE GREEN ECONOMY

EARTH, WIND AND FIRE
3
This Research Report was prepared under the Research Funding Programme, ‘Research and Policy
Development to Advance a Green Economy in South Africa'
By:
EARTH, WIND AND FIRE
4
GREEN FUND
RESEARCH AND POLICY DEVELOPMENT TO ADVANCE A GREEN ECONOMY IN SOUTH A FRICA
GREEN ECONOMY RESEA RCH REPORTS
The Government of South Africa, through the Department of Environmental Affairs, has set up the
Green Fund to support the transition to a low-carbon, resource-efficient and pro-employment
development path. The Green Fund supports green economy initiatives, including research, which
could advance South Africa’s green economy transition. In February 2013, the Green Fund released a
request for proposals (RFP), ' Research and Policy Development to Advance a Green Economy in South
Africa’, inviting interested parties with relevant green economy research projects to apply for research
funding support. The RFP sought to strengthen the science-policy interface on the green economy by
providing an opportunity for researchers in the public and private sectors to conduct research which
would support green economy policy and practice in South Africa. Sixteen research and policy
development grants were awarded in 2013. This peer-reviewed research report series presents the
findings and policy messages emerging from the research projects.
The Green Economy Research Reports do not represent the official view of the Green Fund,
Department of Environmental Affairs or the Development Bank of Southern Africa (DBSA). Opinions
expressed and conclusions arrived at, are those of the author/s.
Comments on Green Economy Research Reports are welcomed, and may be sent to: Green Fund,
Development Bank of Southern Africa, 1258 Lever Road, Headway Hill and Midland 1685 or by email to
Green Economy Research Reports are published on:
www.sagreenfund.org.za/research
Please cite this report as: Mapungubwe Institute for Strategic Reflection (MISTRA) 2015. Earth, Wind and Fire: unpacking the political, economic and security implications of discourse on the Green Economy. Johannesburg. Real African Publishers.
EARTH, WIND AND FIRE
5
TABLE OF CONTENTS:
List of Contributors
List of Abbreviations
Introduction
SECTION I
Chapter 1: The Trojan Horses of Global Environmental and Social Politics — Radhika Perrot
Chapter 2: LTMS and Environmental and Energy Policy Planning in South Africa: Betwixt Utopia and
Dystopia — Louise Scholtz, Manisha Gulati and Saliem Fakir
Chapter 3: Historical Review of the Relationship between Energy, Mining and the South African
Economy — M. B. Ting
Chapter 4: Lost in Procurement: An Assessment of the Development Impact of the Renewable Energy
Procurement Programme — Fumani Mthembi
SECTION II
Chapter 5: Making Transitions to Clean and Sustainable Energy in the South African Urban Transport
Sector: Linkages to Growth and Inclusive Development — Lynn Krieger Mytelka
Chapter 6: ‘Green’ Policymaking and Implementation at City-level: Lessons from Efforts to Promote
Commuter Cycling in Johannesburg — Simone Haysom
Chapter 7: The Energy and Water Nexus: The Case for an Integrated Approach for the Green Economy
in South Africa — Manisha Gulati
Chapter 8: Waste Re-Use: Case of Oil Extracted from Waste Tyres and Improvement of the Waste Tyre
Industry — T. J. Pilusa and E. Muzenda
Chapter 9: Energy-efficient Low-income Housing Development in South Africa: The Next Build
Programme — Lyndall (Lynda) Mujakachi
SECTION III
Chapter 10: Off-grid Renewable Electrification as a Viable and Complementary Power Planning
Paradigm in Southern Africa: A Quantitative Assessment — Ogundiran Soumonni
SECTION IV
Summary of Policy Recommendations
EARTH, WIND AND FIRE
6
LIST OF CONTRIBUTORS
Radhika Perrot is a Senior Researcher in the Knowledge Economy and Scientific Advancement (KESA)
Faculty at the Mapungubwe Institute for Strategic Reflection (MISTRA) in Johannesburg, South Africa. Her
research interest is in science, technology and innovation policies (S&T&I) of low-carbon energy
technologies, covering issues and topics around socio-technological factors of renewable energy
technologies and innovation and market competition and firm strategies in local and global markets.
Prior to moving to South Africa, she worked in India, the Netherlands and Belgium researching and writing
on topics around renewable energy development. At MISTRA, she is researching and project
coordinating a number of projects such as the political and economic discourse on the green economy
in South Africa; the socio-economics and ethics of nano- and biotechnologies; the curse of epidemics
and the socio-psychological, economic and political implications; low-carbon innovation in Africa, and
the politics of nuclear in South Africa. She is a Ph.D. Candidate at the United Nations University (UNU-
MERIT) – University of Maastricht, the Netherlands, and a Research Fellow at the Institute of Economic
Research on Innovation (IERI) of the Tshwane University of Technology in Pretoria.
Manisha Gulati is an Energy Economist with the World Wide Fund for Nature (WWF) South Africa. She has
over 14 years of multidisciplinary experience drawing on development, resource and environmental
economics covering India and South Africa. Her areas of expertise are energy, low-carbon development,
the green economy and resources nexus. She specialises in quantitative and qualitative analysis, and
policy formulation and advisory. At WWF South Africa, Manisha leads the work on energy, low-carbon
transition and green economy for South Africa. She co-manages the food-energy-water nexus
programme. Manisha started her career at The Energy and Resources Institute (TERI), India’s leading
energy and environment focused research organisation and has since worked in the consulting and
financing sectors. She is an economics graduate from St Stephen’s College, India and holds a Master’s
Degree in Business Economics from the University of Delhi, India. She has several publications to her credit.
Louise Scholtz has an MBA and M.Phil. Sustainable Development and Planning, and is Manager in the
Living Planet Unit at WWF-SA. Her focus areas include research relating to energy policy and
infrastructure, sustainable strategies and development, and the green economy. She is also the lead on
the following WWF-SA programmes/projects: WWF China/Africa Programme – with a particular focus on
engagement with the Forum on China/Africa Cooperation (FOCAC); Climate Solver; 'Greening of Social
Housing' project – partnering with the National Association of Social Housing Organisations (NASHO) and
Communicare; and Sustainable Public Procurement Project – partnering with the International Institute
for Sustainable Development (IISD) and the Government of the Western Cape. Given her prior legal
experience and knowledge, she is also particularly interested in the pivotal role institutions have to play
in enabling and supporting sustainable development. She has contributed to reports and publications
on housing, renewable energy, general sustainability issues and governance.
Saliem Fakir is the Head of the Policy and Futures Unit at the World Wide Fund for Nature, South Africa.
EARTH, WIND AND FIRE
7
The unit’s work is focused on identifying ways to manage a transition to a low-carbon economy. Saliem
Fakir previously worked for Lereko Energy (Pty) Ltd (2006), an investment company focusing on project
development and financial arrangements for the renewable energy, biofuels, waste and water sectors.
He served as Director of the International Union for Conservation of Nature and Natural Resources, South
Africa (IUCN-SA) office for eight years (1998–2005). Prior to IUCN, he was Manager for the Natural
Resources and Management Unit at the Land and Agriculture Policy Centre. Between 2002 and 2005, he
served as Chair of the Board of the National Botanical Institute. He also served on the board of the Fair
Trade in Tourism Initiative and was a member of the Technical Advisory Committee of the Global
Reporting Initiative in Amsterdam. He currently serves on the advisory board of Inspired Evolution One –
a private equity fund for clean technology. He is also a columnist for the South African Centre for Civil
Society and Engineering News. Saliem’s qualifications are: B.Sc. Honours molecular biology (WITS),
Masters in Environmental Science, Wye College, London, and he did a senior executive management
course at Harvard University in 2000.
Marie Blanche Ting is currently a doctoral researcher based at the Science Policy Research Unit (SPRU),
University of Sussex, UK. Prior to starting her Ph.D., she worked for four years at South Africa’s Department
of Science and Technology (DST) as a Senior Specialist: Bio-economy, and before that she worked for
more than four years at Sasol as a Senior Scientist with a special focus on environmental technologies.
She holds a Masters in Climate Change and Development from the Institute of Development Studies
(IDS), UK as a Mandela-Sussex Scholar. She also holds a Masters in Bioprocess Engineering from UCT. Her
interests are in the intersection between science, technology, policy, and sustainable development.
Fumani Mthembi is the founding member of the Pele Energy Group, an energy utility research and
development organisation. She is responsible for Knowledge Pele, the research and development
advisory of the Pele Group. Her clients range from universities to independent power producers and the
thematic focus of her work ranges from social assessments to mapping informal economies and risk and
trial experiments. Her primary function is to set the research agenda and manage the business. Fumani
has a BA Honours in Politics and Development Studies, Wits University and a Masters in Science, Society
and Development, Sussex University.
Professor Lynn Krieger Mytelka is former Director of UNU-INTECH, the Netherlands, and Director of the
Division on Investment, Technology and Enterprise Development, UNCTAD, Geneva. She taught at
Carleton University, Ottawa, Canada, where she was Professor, Faculty of Management and Public
Policy and subsequently a Distinguished Research Professor. She held an Honorary Professorship at the
University of Maastricht, the Netherlands until 2010. Her research covers a broad range of issues in
development; science and technology, including innovation systems; clustering and technological
upgrading in traditional industries; North-South cooperation; biotechnology; strategic partnerships;
multinational corporations and competitiveness. Currently she is on the Executive Committee of the
Global Energy Assessment, and has undertaken numerous research and capacity-building projects and
consultancies for various governments and international agencies, including the EU, OECD, UNDP,
UNCTAD, UNIDO, IDRC and the World Bank. Her recent publications are Making Choices About
Hydrogen: Transport Issues for Developing Countries (edited with Grant Boyle, 2008) and Innovation and
EARTH, WIND AND FIRE
8
Economic Development (ed.), the International Library of Critical Writings in Economics, Cheltenham, UK:
Edward Elgar, 2007.
Simone Haysom is an independent researcher. She has several years’ experience working for the think
tank of the Overseas Development Institute in London, and has run her own consultancy, Cities in Flight,
since 2013. She specialises in issues related to rapid urbanisation, migration, displacement, and
humanitarian assistance. She has an M.Phil. University of Cambridge, and is currently a Miles Morland
Fellow.
T. J. Pilusa holds a Ph.D. in Mechanical Engineering from the University of Johannesburg. He has more
than eight years’ experience in the mining, metallurgy and waste management industries. He is a
member of the South African Institute of Mechanical Engineers (SAIMechE). He has published more than
35 international peer reviewed and refereed scientific papers in journals and conferences. He is a
recipient of several awards and scholarships for academic excellence. His main areas of research are in
alternative fuels, waste to energy, environmental pollution and waste management. His research involves
classifications of industrial wastes, energy recovery, beneficiations processes and energy utilisation
mechanisms.
Edison Muzenda is a Full Professor and Head of the Chemical, Materials and Metallurgical Engineering
Department at Botswana International University of Science and Technology. He was previously a Full
Professor of Chemical Engineering, the Research and Postgraduate Coordinator, as well as Head of the
Environmental and Process Systems Engineering and Bioenergy Research Groups at the University of
Johannesburg. Professor Muzenda holds a Ph.D. in Chemical Engineering from the University of
Birmingham, United Kingdom. He has more than 16 years’ experience in academia in institutions such as
the National University of Science and Technology, Zimbabwe; University of Birmingham; University of the
Witwatersrand and the University of Johannesburg. His current research activities are mainly focused on
waste-to-energy projects with the South African National Energy Development Institute (SANEDI), the City
of Johannesburg (Pikitup) and the Recycling and Economic Development Initiative of South Africa
(REDISA). He has published more than 260 international peer reviewed and refereed scientific articles in
the form of journals, conferences, books and book chapters, and supervised more than thirty
postgraduate students.
Lyndall (Lynda) Mujakachi has experience in policy development, environmental management, local
economic development and disaster management and has worked in the SADC region. Her research
interests include sustainable energy in the built environment; the political economy of transitioning to a
low-carbon economy; knowledge exchange between universities, research institutions and government,
focusing on adoption and adaptation of research knowledge and the requisite policy development. She
has her own consultancy, Andly Consulting, and is a member of the South African Planning Institute
(SAPI). She has a BSc. in Public Administration and MSc. in Rural and Urban Planning.
Dr Ogundiran Soumonni is a Senior Lecturer in Innovation Studies at the Wits Business School in
Johannesburg and South African Research Chairs Initiative (SARChi) Research Associate at the Tshwane
EARTH, WIND AND FIRE
9
University of Technology. He obtained his Ph.D. in Public Policy from the Georgia Institute of Technology
in Atlanta, Georgia, USA, where he focused on energy and environmental policy as well as innovation
studies. Dr Soumonni’s teaching interests include subject matter on creativity and innovation,
‘technopreneurship’, and philosophical paradigms in scientific research. His primary research interest lies
in the area of innovation for sustainability from both a policy and a firm-level perspective. Some of his
previous publications span subject matter on electricity policy, biofuels policy, nanotechnology policy,
and innovation policy and management. Prior to embarking on his doctoral studies, he worked as a
materials engineer in the area of energy-efficient lighting, following undergraduate degrees in physics
and mathematics, and a Master’s degree in materials science and engineering, respectively. He is an
active member of the International Network on Appropriate Technology.
LIST OF ABBREVIATIONS
In the List of Contributors
DST Department of Science and Technology
FOCAC Forum on China/Africa Cooperation
IDS Institute of Development Studies
IERI Institute of Economic Research
IISD International Institute for Sustainable Development
IUCN International Union for Conservation of Nature and Natural Resources
MPRDA Mineral and Petroleum Resources Development Act
REDISA Recycling and Economic Development Initiative of South Africa
S&T&I Science, technology and innovation policies
SAIMechE South African Institute of Mechanical Engineers
SANEDI South African National Energy Development Institute
SAPI South African Planning Institute
SARChi South African Research Chairs Initiative
SPRU Science Policy Resource Unit
TERI The Energy and Resources Institute
UNU-MERIT United Nations University Maastricht Economic and Social Research institute on
Innovation and Technology
WWF World Wide Fund for Nature
Chapter 1: The Trojan Horses of Global Environmental and Social Politics
BASIC Brazil, South Africa, India and China
CCS Carbon Capture and Storage
COP Conference of Parties
EST Environmentally Sound Technologies
GATT General Agreement on Tariffs and Trade
GDP Gross Domestic Product
GHG Greenhouse Gases
IAC Inter-Agency Committee
IPCC Intergovernmental Panel on Climate Change
IPR Intellectual Property Rights
OECD Organisation for Economic Co-operation and Development
PES Payment for Environmental Services
RED Radical Ecological Democracy
UN United Nations
UNEP United Nations Environment Programme
UNFCC United Nations Framework Convention on Climate Change
US United States
EARTH, WIND AND FIRE
10
WB World Bank
WCED World Commission on Environment and Development
Chapter 2: LTMS and Environmental and Energy Policy Planning in South Africa: Betwixt Utopia
and Dystopia
BAU Business as Usual
CCS Carbon Capture and Storage
DERO Desired Emission Reduction Outcomes
GWC Growth Without Constraints
IPPC Intergovernmental Panel on Climate Change
IRP Integrated Resource Plan
LTMS Long-term Mitigation Scenarios
MEC Minerals-Energy Complex
MPA Mitigation Potential Analysis
MW Megawatts
NAMAs Nationally Appropriate Mitigation Actions
NDP National Development Plan
PICC Presidential Infrastructure Coordinating Commission
PPD Peak, Plateau and Decline Projections
R&D Research and Development
RBS Required By Science
SIPS Strategic Integrated Projects
WHR Waste Heat Recovery
Chapter 3: Historical Review of the Relationship between Energy, Mining and the South African
Economy
ANC African National Congress
BEE Black Economic Empowerment
COSATU Confederation of South Africa Trade Unions
CSP Concentrated Solar Power
CTL Coal to Liquids
DEAT Department of Environmental Affairs and Tourism
DME Department of Minerals and Energy
DMR Department of Mineral Resources
DOE Department of Energy
DTI Department of Trade and Industry
EIUG Energy Intensive Users Group
GHG Greenhouse Gases
GW Gigawatt
GWh Gigawatt hours
IEA International Energy Association
IEC Independent Electoral Commission
IPP Independent Power Producers
IRP Integrated Resource Plan
ISMO Independent Systems Market Operator
LTMS Long-term Mitigation Scenarios
Mt Million tons
MPRDA Mineral Petroleum Resources Development Act
MEUs Municipal Electricity Undertakings
NDP National Development Plan
NEDLAC National Economic Development and Labour Council
NEMA National Environmental Management Act
NUM National Union of Mineworkers
NUMSA National Union of Metal Workers of South Africa
OECD Organisation for Economic Co-operation and Development
PGMs Platinum Group Metals
PPD Peak Plateau Decline
PV Photo Voltaic
SACP South African Communist Party
SADC Southern African Development Community
SIMS State Intervention in the Minerals Sector
EARTH, WIND AND FIRE
11
Tpc Tons per capita
Twh Terrawatt hours
Chapter 4: Lost in Procurement: An Assessment of the Development Impact of the Renewable
Energy Procurement Programme
BBBEE Broad-based Black Economic Empowerment
CLO Community Liaison Officer
COD Commercial Operations Date
CSI Corporate Social Investment
DFI Development Finance Institution
DOE Department of Energy
ED Economic Development (Obligations)
EPC Engineering, Procurement and Construction (Contractor)
IDP Integrated Development Plan
IPP Independent Power Producer
M&E Monitoring and Evaluation
NDP National Development Plan
NERSA National Energy Regulator of South Africa
O&M Operations and Maintenance
PPA Power Purchase Agreement
PRA Participatory Rapid Appraisal
RE Renewable Energy
REIPPPP Renewable Energy Independent Power Producer Procurement Programme
SED Socio-economic Development
Chapter 5: Making Transitions to Clean and Sustainable Energy in the South African Urban
Transport Sector: Linkages to Growth and Inclusive Development
BRT Bus Rapid Transit
CCI Clinton Climate Initiative
DTBSA Daimler Truck and Bus Groups in South Africa
EU European Union
HFCs Hydrogen Fuel Cells
HFCV Hydrogen Fuel Cell Vehicle
ITP Integrated Transport Plan
MBSA Mercedes Benz South Africa
NECAR New Electric Car
OFMSW Organic Fraction of Municipal Solid Waste
PEM Proton Exchange Membrane
SACN South Africa Cities Network
Chapter 6: ‘Green’ policymaking and implementation at city-level: lessons from efforts to promote
commuter cycling in Johannesburg
BRT Bus Rapid Transport
C40 C40 Cities Climate Leadership Group
CBD Central Business Districts
DA Democratic Alliance
GCRO Gauteng City Region Observatory
ICLEI Local Governments for Sustainability
JUCA Johannesburg Urban Cyclists Association
NMT Non-Motorised Transport
KWV German Bank for Reconstruction and Development
Chapter 7: The Energy and Water Nexus: The Case for an Integrated Approach for the Green
Economy in South Africa
AMD Acid Mine Drainage
CCS Carbon Capture and Storage
CSP Concentrated Solar Power
EARTH, WIND AND FIRE
12
EWN Energy and Water Nexus
FGD Flue-gas Desulfurisation
GTL Gas-to-Liquids
GW Gigawatts
IRP Integrated Resource Plan
MDG Millennium Development Goals
R&D Research and Development
RE Renewable Energy
Tcf Trillion cubic feet
WMA Water Management Areas
Chapter 8: Waste Re-Use: Case of Oil Extracted from Waste Tyres and Improvement of the Waste
Tyre Industry
ASTM American Society for Testing and Materials
CAPEX Capital Expenditure
CHFO Crude Heavy Fuel Oil
CI Compression Ignition
CIE Compression Ignition Engine
CoJ City of Johannesburg
CoT City of Tshwane
CTDO Crude Tyre Derived Oil
DF Diesel Fuel
DoE National Department of Energy
EBITDA Earnings Before Taxes, Depreciation and Amortisation
EIA Environmental Impact Assessment
Ekh Ekurhuleni
ESD Electrostatic Discharge
ETRMA European Tyre and Rubber Manufacturers Association
GDP Gross Domestic Product
HFO Heavy Fuel Oil
ICE Internal Combustion Engine
IWTMP Integrated Waste Tyre Management Plan
MISTRA Mapungubwe Institute for Strategic Reflection
NDP National Development Plan
NOPAT Net Operating Profit After Tax
NRF National Research Foundation
OPEX Operating Capital
PBIT Profit Before Interests and Tax
REDISA Recycling and Economic Development Initiative South Africa
ROD Record Of Decision
RSA Republic of South Africa
SANEDI South African National Energy Development Institute
TDF Tyre Derived Fuel
TPA Tons Per Annum
US$ United States Dollar
UV Ultra Violet
ZAR South African Rand
Chapter 9: Energy Efficient Low-income Housing development in South Africa: The Next Build Programme
ANC African National Congress
DoE Department of Energy
FBAE Free Basic Alternative Energy
FBE Free Basic Electricity
GWh Gigawatt hour
IDP Integrated Development Plan
iEEECO Integrated Energy Environment Empowerment and Cost Optimisation
kWh Kilowatt hour
MFMA Municipal Finance Management Act
MW Megawatt
PV Photovoltaic
EARTH, WIND AND FIRE
13
R&D Research and Development
RDP Reconstruction and Development Programme
REIPPPP Renewable Energy Independent Power Producer Procurement Programme
SANS South African National Standards
SHS Solar Home System
SIP Strategic Integrated Project
SME Small and Medium Enterprise
SWH Solar Water Heater
Chapter 10: Off-grid Renewable Electrification as a Viable and Complementary Power Planning
Paradigm in Southern Africa: A Quantitative Assessment
AC Alternating Current
ADP Abiotic Depletion Potential
AP Acidification Potential
BE Basic Electricity
CCGT Combined Cycle Gas Turbine
CF Capacity Factor
CHP Combined Heat and Power
COE Cost of Electricity
CRF Capital Recovery Factor
DC Direct Current
DG Distributed Generation
DoE Department of Energy
DRC Democratic Republic of Congo
EIA Environmental Impact Assessment
EP Eutrophication Potential
FBAE Free Basic Alternative Energy
FBE Free Basic Electricity
GHG Greenhouse Gas
GWP Global Warming Potential
HOMER Hybrid Optimisation Model for Electric Renewables
IEA International Energy Agency
INEP Integrated National Electrification Programme
LCA Life Cycle Assessment
LCIA Life Cycle Impact Assessment
LCOE Levelised Cost of Electricity
NASA National Aeronautics and Space Administration
NPC Net Present Cost
NREL National Renewable Energy Laboratory
NuRA Nuon-RAPS
PED Primary Energy Demand
POCP Petrochemical Ozone Creation Potential
PPP Purchasing Power Parity
PV Photovoltaic
RET Renewable Energy Technology
SADC Southern African Development Community
SAPP Southern African Power Pool
SHS Solar Home System
US EPA United States Environmental Protection Agency
WAPP West African Power Pool
EARTH, WIND AND FIRE
14
INTRODUCTION
Radhika Perrot
Over the past couple of years, South Africa adopted various policy measures to promote the
development of renewable energy and other low-carbon and sustainable technologies, mainly driven
by a concern to reduce emissions by more than 30 per cent by the beginning of the next decade and
to make low-carbon sources of energy a substantial part of the total energy mix. Although the goal is
ambitious, insufficient progress has been made in terms of development and deployment of low-carbon
and environmentally improved technologies and innovations. South Africa is still the most energy-
intensive country per capita (as compared to other BASIC countries, i.e. Brazil, India and China), and
national energy consumption data for 2006 reveals that 95 per cent of the country’s electricity is
generated from coal and 75 per cent of the country’s primary energy comes from coal.
Although efforts have been made to include renewable energy in the national total energy mix1 through
the Renewable Energy Independent Power Producers Programme (REIPPP), there are criticisms that the
amount allocated to renewable energy generation capacity until 2030 (3,725 MW) is not enough to
make a substantial contribution to the total energy mix and for the programme to be eventually effective
in generating growth through new industries and jobs. The nuclear power component, on which much
of the hoped-for reduction in carbon emissions seems to swing, is a controversial option that would in any
case not have come on stream by 2020. Moreover, the plausibility of the energy mix proposed in the
Integrated Resource Plan (IRP 2010–2030) to reduce emissions has not been adequately tested, and the
validity of its assumptions on projected demand has already been questioned by a draft revision of the
document.
The MISTRA research project on which this book is based set out to investigate and understand the low-
carbon path undertaken by South Africa in its drive to mitigate emissions and make low-carbon sources
of energy a substantial part of the total energy mix. Various government departments are engaged in
relevant sectors of the economy, adopting a myriad policies and strategies in an effort to mitigate
greenhouse gas (GHG) emissions. But often such efforts are constrained by factors that characterise the
transition to low-carbon systems, namely the path-dependent nature of South Africa’s institutions, industry
and large organisational incumbents.
Fossil-fuel based electricity generation and transportation systems have together created techno-
institutional complexes in South Africa that have locked-out the development of new sustainable
technologies, including a transition to a low-carbon economy based on renewable energy technologies.
Technological and institutional lock-ins act as barriers to sustainable innovation and they occur through
combined interactions among socio-economic and socio-technological systems and governing
institutions. In fact, such dependencies disable governing institutions from fully comprehending and
1 The Integrated Resource Plan of 2010–2030 outlines the required new generation capacity for the next 20 years and it takes into account the different energy carriers required to ensure that stability for the national energy supply, and renewable energy as part of this mix.
EARTH, WIND AND FIRE
15
effectively implementing new technologies, ideas and knowledge because new and sustainable
innovations require new sets of institutional capabilities, knowledge bases and, most importantly, an
integrated approach towards policymaking.
Issues related to the transition to a green economy and sustainable development such as path
dependencies and carbon lock-in demand a revision2 of both development processes and institutions
and organisations that have been built on old structures, behaviours and systems. The embeddedness
and ubiquity of the current system in South Africa suggests the need for conventional policy and decision-
making in silos to give way to an integrated approach that reduces trade-offs and builds synergies across
energy systems and interrelated sectors.
In an effort to understand the South African green economy landscape better, the various chapters of
this book examine issues ranging from global and domestic climate change and sustainable energy
issues, to the mineral-energy complex issues that have given rise to local and sector-specific problems.
Each chapter seeks to convey policy choices and recommendations, but at the centre of all these
recommendations is a clear articulation of the need for an integrated mix of policy instruments in South
Africa to mitigate emissions and promote the development of a low-carbon economy through the low-
carbon and sustainable energy technologies and low-carbon innovation across various sectors of the
economy.
Three different but overlapping major themes are covered in the book:
Section I analyses the co-evolutionary role of governments, civil societies and industries and the influence
of their interactions on sustainability actions and on climate change mitigation strategies in South Africa.
Chapter 1 begins with a critique of the global discourse on sustainable development and its recent
reincarnation since the 1992 Earth Summit in Rio – the green economy. The evolution of the discourse on
global warming, the courses of action and nature of negotiation that evolved, including an
understanding of how these have been articulated and interpreted by countries in the North and the
South are discussed. The chapter provides a few considerations of the critical need to reframe current
discussions around sustainable development and the green economy through an understanding of
interpretative flexibilities from a sociological perspective; and of the need to recognise the
interdependencies of sustainable development such as society, the economy, technology and the
natural environment.
Chapter 2 brings the discussion to South Africa where it critically analyses the climate change discourse
within the Long-Term Mitigation Strategy (LTMS) process, and points out challenges of environmental and
energy planning within its context. The chapter argues that energy and environmental policies in the
country have been hampered by policy dissonance because they largely ignore ‘data from the real
world’ such as vested interests, the political economy and the critical role of coal, which is still a key driver
2 A quote often attributed to Albert Einstein, i.e. ‘You cannot solve a problem using the same thought process that created it’, is appropriate in this regard.
EARTH, WIND AND FIRE
16
of the economy. In South Africa, a cheap and abundant supply of coal is both a determinant of existing
energy policies and an obstacle in the transition to a low-carbon economy. Although the LTMS provides
a good overview of the climate change mitigation challenge in South Africa, there are a number of
reasons as to why the LTMS is not working, which the chapter sets out to analyse. Further, climate policies
of seven countries have been analysed for a conceptual understanding of what constitutes a ‘coherent’
or integrated climate policy for a comparative understanding of the country-specific mitigation
challenges and the effect of fossil fuel path-dependencies on the transition to a low-carbon economy
in each country.
The major challenge for sustainable development in South Africa or any other country is in the energy
sector, and in South Africa it accounts for more than 70 per cent of Greenhouse Gas (GHG) emissions. In
South Africa, the strong influence of the power relations in the energy sector has been observed and
discussed in Chapter 3. The chapter analyses the feasibility of sustainable energy development in the
mining sector which has co-evolved and been structured around interests, ideas, and institutions that
have locked in its path to a high-carbon intensive economy. The influence of power and lobbying by
groups such as mining businesses and trade unions is examined here. The technological and institutional
lock-ins that characterise the South Africa economy have sustained a minerals-energy complex that
impacts not only on climate change issues, but also the broader challenges of poverty and inequality.
Chapter 4 examines the socio-economic development limitations of the renewable energy programme
in South Africa – the Renewable Energy Independent Power Producers Programme (REIPPP). It analyses
the design of the renewable energy on-grid procurement system that sets out development socio-
economic targets in rural and poor communities in South Africa. The chapter then makes
recommendations on incorporating an expanded interpretation of development that would ensure that
the government is using the right indicators to measure the impact of the programme on development.
Section II of the book analyses the dynamics in the transition to a low-carbon economy through an
exploration of a number of sectors such as transportation, water usage and waste. Such an analysis is
intended to improve an understanding of the processes involved in the formation and uptake of
sustainable technologies, thereby identifying the key associated challenges for policymakers that are
managing the transformation process. Local and city-level authorities have become important
institutional players for policy decisions around sustainability and pollution, all of which have considerable
impact on climate change. There is, therefore, a need to identify the opportunities at these local or city-
level spaces, including, in particular, the transportation and waste sector, which accounts for a
significant proportion of GHG emissions in the country.
As a part of the process towards this understanding, Chapter 5 analyses and compares the development
of the bus rapid transit (BRT) systems in Johannesburg and Cape Town and the extent to which their
development has played a role in stimulating a move towards energy transitions to low-carbon
technologies. The chapter analyses the cases of the Rea Vaya in Johannesburg and MyCity in Cape
Town, while investigating past policy practices, norms and habits that have created institutional and
technological lock-ins, and provides recommendations on how such lock-ins and dependencies can be
EARTH, WIND AND FIRE
17
overcome. The development of the BRT systems is largely in the hands of provincial governments and
major cities that make their own choices (often different from each other) about the purchase of fuels
and bus type. Within the country, and between the two cities analysed, the development of multiple,
new and competing types of buses has given rise to uncertainties in choices that might not survive a
transition to clean fuels in South Africa if it continues on the current ‘development’ path. This is likely to
lead towards an incongruent path, leading to a multiplicity in the development of know-how and skills in
the local bus manufacturing capacity within the country, ultimately to duplication of efforts and waste
of resources.
As a city-level case exploration, Chapter 6 analyses the efforts to promote the ‘green’ goal by the City
of Johannesburg, whilst analysing the practices and changes that have created the current momentum.
Its findings point to the critical role played by some actors who are from outside the domain of city-level
governance efforts such as cycling advocacy lobbies and universities. This chapter and the chapters in
this section show that the transition to low-carbon energy systems in transportation will require new and
paradigmatic changes at the institutional, technological and consumer levels.
The two biggest challenges facing South Africa today are the frequent electricity outages and the
potential water crisis. Whilst the electricity crisis is receiving the required attention for an appropriate and
timely intervention, little is discussed about an impending water crisis that is waiting to explode in an
extremely water-scarce country such as South Africa. The biggest cause of both the crises is ironically not
from increased demand for energy or water usage but rather from insufficient maintenance of water
and energy infrastructure, including the negligence of energy and water conservation policies and
practices in the country.
Chapter 7 explores the relationship between energy and water and elaborates on the critical need for
a parallel and integrated development of water and energy policies in South Africa. Often in policy
debates, the connection between water and energy is never well articulated while evidence suggests
a strong codependence of electricity production from coal and water use, and how a shortage of water
will affect electricity availability. Unfortunately, even future planning documents and tools such as the
IRP 2030 do not consider the risks of potential water scarcity for the planned generation capacity and
electricity supply or the electricity sector’s ability to provide reliable and sustainable energy supply in the
event of water insecurity.
Changes in the production processes of industries, institutional changes and consumer habits that are
required in the transition to low-carbon energy systems often take considerable time. In the shorter term,
however, increases in energy efficiencies such as the conserving of energy in buildings, industrial
processes and co-generation of energy in industries are good and successful examples of energy saving
and conservation practices, where benefits such as reducing GHG emissions are achieved without
increasing energy cost through new or additional energy generation capacity.
Evaluating a category of energy-efficient and energy-conservation measures and practices in South
Africa, Chapter 8 analyses the particular case of the waste tyre industry in the province of Gauteng, and
EARTH, WIND AND FIRE
18
the associated policy regulation and industry practices along the value-chain of its waste tyre disposal.
Approximately 55 per cent of the 7.25 million new tyres produced in 2011 were sold in Gauteng, the
majority of which would end up as waste and add to the over 70 million tyres that have so far been piling
up as scrap tyre waste. The Department of Environmental Affairs (DEA), through the Recycling and
Economic Development Initiative of South Africa (REDISA), has recently instituted a R2.30 per kilogram
levy on all tyre manufacturers to ensure that tyres do not end up on waste dumps. And by evaluating
the best method in reusing or recycling waste tyres, the chapter provides a quantitative assessment of
the economic feasibility of pyrolysis as a method for waste-tyre treatment, including generation of energy
from the wasted tyres. It also provides recommendations on how to make waste tyre treatment methods
such as pyrolysis economically feasible including the creation of economic opportunities such as new
jobs.
After the end of apartheid in 1994, a number of policies and programmes were initiated that set out to
reconstruct and assist in achieving the country’s social and developmental goals. One such initiative was
the development of housing for the low-income population, called the Reconstruction and
Development Programme (RDP). Chapter 9 evaluates the RDP programme in terms of gauging the
implementation of energy efficiency in these households, including the implementation of renewable
energy technologies and solutions such as rooftop solar. The chapter highlights the need and importance
of the coordination of policy action between national and provincial government and departments,
and continual monitoring and evaluation of these projects post implementation.
Section III of the book explores regional optimal energy strategies as there is compelling evidence from
many countries in Africa that shows the need for off-grid renewable energy systems, and the importance
and benefits of which are gaining ground on the continent. Policymakers need to send strong signals to
all development and regional partners within the Southern African Development Community (SADC) of
their commitment to the development of renewable energy resources as part of the process of
sustainable development within the continent. Chapter 10 makes a quantitative assessment of the
technological, economic and environmental implications of extending electrification through off-grid
electrification solutions in southern Africa. The chapter demonstrates how solar photovoltaics and wind
turbines can meet the basic electricity requirements of individual households in non-electrified areas and
provides policy implications for increased energy access, sustainability and technological competence
building up in the region.
Section IV summarises in point form the policy implications and individual recommendations arising from
all the chapters. Overall, this book argues that the complex and interrelated nature of the transition to a
low-carbon economy, and towards sustainable development, demands that the issues and concerns
pertaining to the green economy be resolved through a deeper understanding of the interrelated nature
of these issues, and it is thus important that policy approaches are devised that are integrated in their
approach.
Policymaking processes must attempt to take cognisance of the socio-technical practices and
institutional factors that contribute to sustainable development and thereby build synergies across

EARTH, WIND AND FIRE
19
industrial and energy systems and interrelated sectors.
EARTH, WIND AND FIRE
20
SECTION I
Co-evolutionary Role of Governments, Civil
Societies and Industries
EARTH, WIND AND FIRE
21
Chapter 1: The Trojan Horses of Global
Environmental and Social Politics
A Discourse on Sustainable Development, the Green Economy and Climate Change
Radhika Perrot
One has to make up his mind whether he wants simple answers to his questions
– or useful ones …
You cannot have both.
J. A. Schumpeter
ABSTRACT
This chapter offers a critique of the dominant discourse on sustainable development, the green
economy, and climate change policies from the perspective of developing countries. It examines how
the hegemonic discourse around market-led economic growth principles, such as green growth, have
led to decades of mitigation deadlocks and further widened the gulf between the countries of the North
and the South. Indeed, a few considerations are critical in reframing the discussions around sustainable
development and its recent reincarnation – the green economy – through an understanding of
interpretative flexibilities from a sociological perspective; and of the interdependencies of sustainable
development such as society, the economy, technology and the natural environment.
THE OXYMORON OF SUSTAINABLE DEVELOPMENT
Our Common Future3 was the first document that placed environmental issues firmly on the political
agenda and made it an international mandate. It aimed to discuss the environment and development
as one single issue with focal attention given to population, food security, the loss of species and genetic
resources, energy, industry, and human settlements. The report sought to address these critical issues by
proposing new forms of international cooperation whilst a crucial part of its mandate was to ‘raise the
level of understanding and commitment to action on the part of individuals, voluntary organizations,
businesses, institutes, and governments’ (1987: 347). An international scientific committee was constituted
in 1988 called the Intergovernmental Panel on Climate Change (IPCC),4 which aimed to raise the level
of understanding of human-induced climate change through scientific information and evidence.
Although the Report understood the complexity and interdependence of the impact of human-induced
climate change (such as industries, land, forestry, population and sub-sectors), it is the lack of analysis
around economic growth, and its sustaining modes of production and consumption, that diluted an in-
depth understanding and discussion of a development that was truly sustainable. Many developing
countries not only had cheap resources and labour, they had less stringent environmental regulations
than developed countries. As a result, many large industrialised countries set up pollutive factories and
3 Also known as the Brundtland Report, it was published by the United Nations World Commission on Environment and Development (WCED) in 1987. 4 The IPCC assesses the scientific, technical and socio-economic information relevant for the understanding of the risk of human-induced climate change. The IPCC produces reports that support the United Nations Framework Convention on Climate Change (UNFCCC), which is the main international treaty on climate change. It does not carry out its own original research, nor does it do the work of monitoring climate or related phenomena itself, but it bases its assessment on the published literature, which includes peer-reviewed and non-peer-reviewed sources (IAC, 2010).
EARTH, WIND AND FIRE
22
other industries in many developing countries of the world that had low environmental standards or weak
enforcement.5 Extractive industries such as coal, metals and petroleum are major sources of
environmental damage, with a direct exploitative relationship with the natural environment, and yet the
effects of pollution from such industries had received less attention (Stollery, 1985). So, in the absence of
a critical analysis of economic growth and the market-led principles governing it, the report further
postulated that such growth could be reformed and expanded (Ahmed, 2004) and unsuccessfully
attempted to bring together environmental protection and economic expansion (Hove, 2004).
Section III, Article 27 of Our Common Future postulates that:
In the short run, for most developing countries except the largest a new era of economic
growth hinges on effective and coordinated economic management among major
industrial countries – designed to facilitate expansion, to reduce real interest rates, and to
halt the slide to protectionism. In the longer term, major changes are also required to make
consumption and production patterns sustainable in a context of higher global growth.
The changes suggested, regarding the modes of production and consumption of existing economic
growth trajectories, which were in effect responsible for the degradation of the environment, were not
identified, nor were the modes in those of developed countries seriously questioned. Rather, the
‘changes’ and ‘expansion’ for sustainable development were suggested for developing countries, with
explicitly guided considerations of what was perceived to be ‘higher economic growth’.
Soon thereafter, in 1991, a Hague Report on Sustainable Development published the outcomes of a
symposium to inform the upcoming UN 1992 Earth Summit in Rio. This report, however, acknowledged
that it was impossible to pursue a global dualistic model of development – one which suggested that the
North would continue to pursue the same path to material consumption, while another model was
suggested for the poor South. The report estimated that, ‘If the same material standards had to be
replicated in the South, it would require 10 times the present amount of fossil fuel and roughly two
hundred times as much mineral wealth’ (The Hague Report, 1991).
Thus began the junkie politics of sustainable development and climate change6 between the countries
of the North and the South. The sceptical countries of the South, with their colonial and neocolonial
experiences imposed by the North, felt they were once again being handed down solutions and imp-
ositions, many in the form of restrictive trade agreements that undermined economic growth. One of the
recommendations in the Our Common Future report, which had no direct evidence of a link to
sustainable development, required developing countries ‘to halt the slide to protectionism’ (Article 27,
Section III). The General Agreement on Tariffs and Trade (GATT), one of several major international
agreements that sought to liberalise trade by removing protective tariffs, quotas, and other barriers, was
established in 1994. Many formerly protectionist developing countries were slowly coerced into
5 The pollution haven hypothesis posits that, when large industrialised nations seek to set up factories abroad to avoid the cost of meeting the high environmental standards in their own country, they will often look for the cheapest option in terms of resources and labour that offers the land and material access they require. However, this often comes at the cost of environmentally sound practices. 6
One minute, people ride high on NGO calls to save the planet, and in the next minute they lash out on the realities of international relations (Ruth, 2015).
This, Ruth calls the junkie politics of the climate.
EARTH, WIND AND FIRE
23
embracing free trade and market-led principles and joined the GATT, while around the same time, the
United States and Europe, the original framers of the GATT, adopted protectionist measures on entire
industrial sectors like steel, chemicals, and electronics, including food and agriculture.
Although developed countries meekly acknowledged their role in massive environmental degradation
and pollution in their quest towards industrialisation, they did not fully accept that high economic growth
trajectories based on often harmful and long-cycle modes of consumption and production patterns had
been the main cause. The infamous London smog of 1952, and the covering and diverting of the polluted
river Zenne that runs through the city of Brussels in Belgium, filled with massive garbage and decayed
organic matter, were cited by developing countries as examples of the developed countries’ quest to
industrialise without regard to air quality and environment.
So, amidst distrust between countries of the North and the South, it was therefore not surprising that in
1992 the Rio Earth Summit agenda on sustainable development failed to make a plausible impact. The
notion of sustainability that emerged from this summit politicised the debate on environment and growth
– negotiations between government, business, and ‘pragmatic’ environmentalists assumed that new
markets and technologies could simultaneously boost economic growth and preserve the environment
(Kallis, 2015). Environmental problems were largely confined to the realm of technological improvement
(discussed below), and thus sustainability decisions and mitigation agreements were to remain within the
domain of technical experts, technocrats and policy elites.
Production and consumption decisions and patterns that are directly linked to economic growth, and
upon which most national growth policies are premised, were never questioned as the direct source of
unsustainable practices. This outlook, which persists to this day, is especially problematic for countries that
are still ‘developing’ or ‘emerging’, for the definition and intention of the goals of economic
development (as always understood from the perspective of economic growth theory and practice)
emerge as conflictual with sustainable development. The 1992 Earth Summit in Rio failed to provide a
framework for action or to articulate specific and tangible ways in which the achievement of sustainable
development could be put into action. In the process, the dire development situations of many
developing countries were watered down (Hove, 2004). There was little appreciation of extractive
production processes and wasteful consumption that sustain such production as part of the problem,
which had led to rampant mining and deforestation.
So, since the 1992 Rio Summit, sustainable development has been lost in a myriad misinterpreted
translations, and for many it ‘appears at best an empty phrase and at worst a Trojan horse for the
redefinition of the public interest by a powerful few’ (Voß and Kemp, 2005, pg. 3). It became a loosely
interpreted word for Brazil, India and China (or the BASIC countries) that were emerging as economic
strongholds in the early and late 1990s. In their context, social progress meant following the industrialised
or developed countries in the pattern of building skyscrapers, bridges, concrete houses, and putting
more cars on the road. Deforestation, uprooting indigenous people, and vanishing wetlands, hills and
mountains were seen as unavoidable in the quest for such ‘development’ (Perrot and Soummoni, 2015).
Modernisation and the imperative of high economic growth rates were pursued from the perspective of
EARTH, WIND AND FIRE
24
Modernisation Theory, which is largely based on the view that to develop means to become 'modern'
by adopting Western cultural values and social institutions.
In all the discussions on sustainable development as articulated in Agenda 21 – the summary document
of the outcomes of the Rio Summit – developing countries were considered the main (and new) culprits
of the environmental crisis. According to Lippert (2004), the three major causes of the environmental crisis
(which formed the hegemonic discourse of sustainable development after the Summit) were:
Poverty in developing countries
In their argument, poverty meant too little development and proposed that it could be
overcome by economic growth or the trickle-down effect of economic growth. Such an
argument also implied that countries of the North did not have to change their growth paths.
Section 3.2 and 3.3 of Agenda 21 explicitly argued: ‘An effective strategy for tackling the
problems of poverty, development and environment simultaneously […is…] economic growth in
developing countries that is both sustained and sustainable and direct action in eradicating
poverty by strengthening employment and income-generating programmes.’
Population growth
It was argued that, if too many people depended on the limited resources of the planet, it would
create a stress on the earth’s carrying capacity and destroy its ecological systems. Population
stabilisation was proposed and population growth was seen as ‘evidently’ a problem of the
developing countries. Fred Pearce, in his recent 2010 book The Coming Population Crash: and
Our Planet's Surprising Future, disproved the half-century presumption that population growth is
the driver of ecological apocalypse, arguing that it is not overpopulation that causes climate
change it is overconsumption. Pearce (2014) writes, ‘But why do we blame the poor in Africa for
having babies when the real issue is overconsumption closer to home? It is the ravenous
demands of the rich world that is enlarging the human footprint on our planet – pumping
greenhouse gases into the air, polluting the oceans, trashing forests and the rest. Any further rise
in numbers of poor people will barely figure in that.’
Lack of ecological modernisation
An opinion argued that the cause of the environmental crisis is the lack of ‘ecological
modernisation’. Such a focus is techno-centric as solutions to the crisis are seen as existing only
with technical experts and users, ignoring the fundamental issue of socio-economic
transformation. Evidently, all developing countries lacked the technological sophistication and
machinery and technical knowledge for ‘ecological modernisation’, and such machinery and
technological expertise7 were evidently with the countries of the North.
FRAMING THE SUSTAINABILITY PROBLEM
As evident from global discourse from the 1990s to the present, sustainable development has been
understood as an end state rather than as a kind of problem framing. It cannot be determined once
and for all but it is rather about the organisation of processes and not about particular outcomes (Voß
7 Lippert (2004) criticises the heavy emphasis put on efficiencies and the greening of research and technologies to attain sustainable development and such an approach points at solutions for problems that are not realised by people but only by rational scientists and specialists.
EARTH, WIND AND FIRE
25
and Kemp, 2005). There are many different ways in which a problem can be resolved and different
strategies that can search for solutions to reach sustainable social and technological development
paths. According to Voß and Kemp, 2005, the process towards sustainable development goals is reflexive
when there is recognition of the complexities and uncertainties of the natural reality of the problem.
When the complexity of an issue is not reflexively addressed, the required impact and importance of
interdependencies of sustainability (viz. the interdependencies between society, the economy,
technological and the natural environment) is missed. This is precisely because socio-economic,
technological, and ecological elements are embedded within each sustainability problem.
So, a key feature of sustainable development is the enormous complexity of systemic interactions and
levels, for the process of sustainable transition also takes place through interactions between multi-level
structures – the local, regional and global levels. Further, the interaction between these levels and the
sub-systems of each level, and the interactions within each, add to the structural complexity of the issue
(Voß and Kemp, 2005). And without a proper understanding of the systemic interactions between the
various meta-levels structures, it would be impossible to transform an existing system into a sustainable
one or provide solutions to the issue. Such a multi-level understanding takes a sociological perspective
into account by analysing the process of alignment between the different levels and each level’s sub-
systems and social and technical elements.
So then, the framing of a sustainability problem should come from a perspective that links the sociological
with an evolutionary analysis. A sociological perspective gives importance to interpretative flexibility,
which means that different actors have different understandings of the same idea. If an idea is to be
accepted there has to be wide and shared understanding. At the climate change negotiations,
interpretative flexibility persists around the setting of sustainable goals and emission targets – what it
means to be sustainable or to grow economically widely differs between countries. An evolutionary
perspective, on the other hand, understands the process orientation of sustainable development. It
characterises the transitions of, say, an existing fossil-fuel-based transport or electricity system to a cleaner
or more sustainable system, through an understanding of the characteristics of a systemic transition, akin
to a biological evolution: variation amongst the actors of a system or a population; retention of systemic
characteristics from one generation to the next; and selection of better or superior characteristics that
survived a competitive environment.
Voß and Kemp (2005) have identified three features that contribute to the complexity of sustainable
development problems: heterogeneous interactions, uncertainty, and path dependency. Within each
system are a number of heterogeneous actors that not only have interpretative flexibility about
sustainable development and sustainability goals, but interact with each other through heterogeneous
institutions,8 social values,9 knowledge base, user practices and strategies, among others. As a system is
being transformed into a sustainable one, there are characteristics from an old system that are retained
(the retention feature of an evolutionary process). When transitions are path dependent and
8 Institutions define the rules and norms and regulate how actors in a system should interact with each other. 9 People and actors in a system hold different values, and if they evaluate an idea or option they make different decisions, and thus the interpretative flexibility.
EARTH, WIND AND FIRE
26
characteristic of all systemic transitions they are influenced, constrained and enabled by structures that
have grown out of particular historical developments (Voß and Kemp (2005). And due to the complex
dynamics of such transitions, sustainable development paths cannot be predicted with certainty.
Therefore, sustainability as an orientation towards societal development does generate ambiguous goals
– social conflicts are inherent in the concept and need to be carried out with it (Voß and Kemp, 2005).
At a broader level, sustainability needs to be pursued across the entire landscape, and across many
levels in both rural and urban areas. There are several elements of sustainable alternative paths in
thousands of initiatives, resistance struggles and movements for social transformation around the world.
Kothari (2014) believes that the ‘radical ecological democracy’ (RED)10 is an emerging framework, and
puts collectives and communities at the centre of governance and the economy. Radical
environmentalists recognise that sociological ecology, with its focus on connecting humans with one
another, is at odds with growth that separates and conquers (Kallis, 2015). The RED approach offers a
systemic approach to social transformation, resting on political, economic, sociocultural and ecological
pillars.
In Kothari (2014), the new vision of a sustainable political pillar is one of participatory democracy in which
political boundaries become sensitive to ecological and cultural diversity. Grassroots and local initiatives
through village and city councils and communities must become embedded within larger institutions of
governance. There are many examples of cases that are attempting to combine localisation with the
larger-scale, national and provincial decision-making. In India, around 72 riverine villages have formed
the Arvari River Parliament, which meets regularly to make ecological, economic and social decisions;
India’s north-eastern state of Nagaland has enacted legislation empowering villages with substantial
decision-making, including control over the allocation of government funds for education, health and
power. In Venezuela, communal councils used social, cultural and economic relations to define
geographical boundaries.
Further, according to Kothari (2014), the vision of a new economic pillar rests on efforts to decentralise
control over natural resources11 and production chains through ownership by cooperatives. There are
many examples of Indian villages that have revitalised local economies and reduced social inequalities.
For example, Jharcraft of India has enhanced the livelihoods of 250,000 families by providing credit,
technological assistance, marketing opportunities and recognition of cooperative-led production.
The sociocultural pillar of the RED is one that maintains and combines traditional knowledge and wisdom
as cultural sources to generate responses and appropriate adaptive mechanisms to ecological (and
climate) change, social and political changes and uncertainty. It also includes the dismantling and
democratisation of knowledge and science from its long monopolisation by corporations and the state.
In fact, indigenous people have been active in international conventions on creating indicators for
sustainability, justice and other goals (Kothari, 2014).
11 Such control rests on the principle of subsidiarity: the belief that those living closest to ecosystems and resources have the greatest stake in them and at least some of the essential knowledge for managing them (Kothari, 2014).
EARTH, WIND AND FIRE
27
RED ideas and analysis are similar to the so-called de-growth imperative, which involves a rethinking of
the organisation of society. De-growth alternatives began to emerge as the formal economy fell into
crisis, and activities include urban gardens, producer-consumer cooperatives, decentralised forms of
renewable energy, alternative food networks, and so on. These activities are geared towards a more
locally based economy; they have short production and consumption cycles; they do not have a built-
in tendency to accumulate and expand; and they are less resource intensive than their counterparts in
the formal economy (Kallis, 2015).
Within the UN climate change discussions (and as signatories) there are many poor countries, many of
them African, who are yet to benefit from growth. And, to some extent, de-growth in the countries of the
North can provide an ecological space for countries in the South. For example, a strong carbon cap for
countries in the North and better terms of trade for countries in the South can help compensate past
carbon and resource debt and redistribute wealth between countries of the North and the South (Kallis,
2015). Such rethinking – particularly RED and the de-growth imperative – requires the spread of certain
core values of sustainable development that are geared towards equity and social justice: to empower
every person to be a part of decision-making; and its holistic vision of human well-being encompassing
physical, material, sociocultural, intellectual and spiritual dimensions, including the sharing of non-
monetary wealth (Kothari, 2014; Kallis, 2015).
Elsewhere, Davis (2015) argues that shared interest and common good are vital for a renewed climate
diplomacy, especially in leading towards Paris COP21 in 2015, and will constitute, not so much benefits
that accrue to global GDP, but shared values such as a love of nature; respect for the history, identity
and traditions of other nations and people; careful tending to children’s inheritance; and solidarity with
the world’s poor. In this sense, de-growth in the North should provide a space for ecological alternatives
and visions; and the re-emergence of shared practices, such as the practice of human solidarity
reflected in ubuntu in Africa.
Green Economy: A Slippery Slope
A recent reincarnation of sustainable development is the green economy. In 2008, amidst confusion and
ambiguity on what constituted sustainable development and sustainability goals, coupled with the need
to assuage perceived risks and fears from the global economic crisis, organisations such as the OECD,
UNEP and the World Bank introduced the terminology, the green economy.
While the concept has its utility in terms of placing the economy at the centre of the green discussion –
and vice versa – to resolve the current environmental crisis, it does have inherent damaging implications.
Ironically, the very forces that caused the economic crisis, such as unbridled markets and capital, are
being identified as the beacons of hope for the green economy (Death, 2014; Perrot and Soummoni,
2015). In other words, we cannot uncritically look at market-based instruments such as putting a price on
carbon and trading, the emergence of profit-driven green companies, and payment for environmental
services (PES). The extent to which mechanisms and principles of market-capitalism can be used to
advance green technologies and the commoditising of nature, especially in developing countries, has
to be critically interrogated.
EARTH, WIND AND FIRE
28
As a result, countries have remained confined to a pillar approach to sustainability – in which the
environment, society, technology and the economy are viewed separately. In January 2015, during his
visit to India, Barack Obama urged the country to reduce dependence on fossil fuels, to which the Indian
government responded with the retort that ‘the country was not under any pressure to major cuts in
emissions as it will not set targets that will undermine efforts to end poverty’ (The Guardian, 2015). Under
the new government in India, and in less than a year, the Modi government, strongly in favour of
businesses and economic growth, is weakening India’s existing environmental laws and thereby
threatening the rights of those who rely on the forests for their livelihoods (Mahapatra, 2014).12
Such fallacies of unwarranted assumptions are frequently made in political statements – that economic
growth, and now a ‘green economy’ (narrowly framed in the manner of neo-liberalism) will combat
poverty, create jobs and reduce income inequality. But growth is only a condition and not a guarantee
for poverty alleviation (Christoplos, 2014). Many countries in the global South fear that an accelerated
phase-out of carbon-based energy will bring the end not only of ‘development’, but of any meaningful
prospect for global economic justice (Athanasiou, 2014).
The apprehension on the part of the countries of the South is further reinforced by the conduct of the
countries of the North, who have time and again shown inconsistencies when it came to setting and
achieving emission reduction targets. Canada, for example, was active in the negotiations that led to
the Kyoto Protocol in 1997 and the Liberal government signed the accord in 1997 and their parliament
ratified it in 2002. But when the Conservative Party came to power in 2006, Canada began strongly to
oppose the Kyoto Protocol and the imposition of binding targets unless mitigation targets were also
imposed on countries such as China and India.13 Canada has had increases in annual emissions over the
last 15 years, largely fuelled by the fossil-fuel sector, transport and most recently expansions of the oil
sands. A group, led by former United Nations Secretary-General Kofi Annan, is condemning Canada as
an international climate laggard that falls short even of impoverished Ethiopia in the effort to combat
global warming (McCarthy, 2015).
The other climate laggard amongst the developed countries is Australia, which is the highest per-capita
emitter of greenhouse gases among the OECD countries. In October 2014, the Australian Prime Minister
declared that ‘coal is good for humanity’ while opening a coalmine. He added that coal is vital for the
future energy needs of the world and people should stop the ‘demonisation of coal’. An African Progress
Panel, co-chaired by Kofi Annan and former US Treasury Secretary, Robert Rubin, says Canada and
Australia ‘appear to have withdrawn entirely from constructive international engagement on climate’
(McCarthy, 2015).
It is in the context, not only of the broader philosophical issues, but also against the backdrop of these
12 The current Indian government is threatening to dilute a number of important environmental protection legislations such as the Environment Protection Act, the Wildlife Protection Act, the Forest Conservation Act, among others (Mahapatra, 2014). 13 As Annex II countries, India and China, or the BASIC countries, were exempt from GHG reduction requirements under the terms of the Kyoto Protocol.
EARTH, WIND AND FIRE
29
experiences, that RED and de-growth theorists argue that the issue is about imagining and enacting
alternative visions to modern growth-based development.
The goal of higher economic growth rates in the context of how economic growth has been
perpetuated through market-led principles is well-nigh impossible without harming the environment. So
the dominant discourse of the green economy as the driver of economic growth and reduction of
poverty that is prevalent in the BASIC countries evidently has its serious limitations from political and
ecological viewpoints.14
Death (2014) proposes two lines of critique to South Africa’s green growth emphasis, which can be
extrapolated to the emphasis on green growth strategies in India and China at the moment:
The overall articulation of the green economy concept is not very coherent, and provides little
potential to drive sustained economic growth. Green economy holds little promise of becoming
the organising concept for development in South Africa.
Even if South Africa pursues a green economic path in a sustained and significant manner, there
are worrying implications and contradictions, such as a relentless narrow focus on economic
growth against the backdrop of high levels of inequality; commodification of nature (PES and
bio-economy); and the intensification of industrial agriculture and genetic modification.
If the goal is to fight poverty and reduce income inequality, the focus must be on who are directly
exposed to climate change impacts and environmental risks, and a shift from top-down to bottom-up
policies is needed; but currently the green-growth discourse reflects a bias against the poor (Christoplos,
2014) and countries are narrowly focused on securing their own national interests and avoiding costly
commitments to emission reductions or long-term funding for adaptation (Roos, 2010). Unless the poor
are meaningfully involved in decision-making, green growth policies will prove counterproductive.15
INTERNATIONAL GOVERNANCE SYSTEMS OF GLOBAL CLIMATE CHANGE When Our Common Future was first introduced, there was an assumption that all countries would
coordinate their activities and work to achieve the common goal, but decades of international climate
mitigation negotiations and discussions, and ensuing disagreements on greenhouse gases (GHG) or
emission reduction strategies, including the failure of the top-down approach of the Kyoto Protocol
mechanism, have shown that, in addition to ideologies, policy approaches and structures, lack of
coordinated action(s) among countries have stymied international consensual agreements on emission
reductions.
Coordination failure of complementary activities is a form of market failure that originates from a lack of
information and lack of trust between economic actors (Lϋtkenhorst, et al. 2014). Coordination failures
at climate change negotiations for the past few decades have resulted from a lack of trust and an undue
14 See Death (2014) for a detailed critique of the South Africa green economy discourse. 15 A pro-poor green growth strategy emphasises participation, transparency, accountability and non-discrimination, which are based on the Swedish government’s concept of human-rights-based development (Christoplos, 2014).
EARTH, WIND AND FIRE
30
focus on market-led economic growth that has further engulfed the countries of the North and South.
Referring to the reality of the Anthropocene era, Falk (2014) writes that transnational and global political
action is still largely entrapped in old habits of thought, action and interaction, and the myopic time
horizons of the sovereign priority of states are too short to adequately respond to the deepest challenge
of the human future.
Falk proposes two future trajectories on which the long-term success of the transition to global and
national sustainable practices, and effective international coordination of activities, will depend: (1) a
revolutionary change in political consciousness and (2) government interest and diplomacy that
facilitate the pursuit of human and global interests. The former is actor-orientated, i.e. achieving transition
without changing the structure of the world order (Falk, 2014) and the latter is system-orientated, which
requires changing economic structures, technologies and institutions (Falk, 2014; Lϋtkenhorst, et al. 2014).
There, however, needs to be substantial convergence between these two trajectories if global climate
change discourse and agreements are to become effective.
In the context of developing countries, it will be critical to explore government failure and sustainable
governance processes and structures that are not championing environmental causes. According to
Lutkenhorst, et al. (2014), government failure is always part of the equation of political decision-making
and may be as great a risk as, or even greater than, market failure. In democratic societies, it is expected
that the predominant form of regulatory or political capture is derived from lobbying rather than straight
corruption (Lutkenhorst, et al. 2014). But, in the absence of environmental lobbying, or interest groups’
effectiveness in decision-making in countries such as South Africa, India and China, as prevalent in more
developed democracies, it would be important to analyse what groups or whose economic and/or
political interests climate change policies are serving.
Climate Change Response of the Basic Countries
A 2014 special issue of the Oxford Development Studies explores how few and new ‘rising powers’ are
currently challenging global ‘rules of the game’ on social and environmental issues. These rising powers
are the emerging economies of Brazil, China, India and South Africa (BASIC), and are characterised by
six distinctive criteria16 that make them different from other technologically advanced strong growth
economies such as South Korea and Taiwan (Nadvi, 2014). They will matter, and critically, in global
discussions of climate change and in the setting of global environmental regulations and standards, for
they hold immense potential to impact global environmental conditions, largely because of their
increasing significance, not only on global production, but also on consumption. These countries have
increasing interdependence with the rest of the world in terms of trade and capital flows, and thus have
huge global environmental impact implications (Nadvi, 2014).
As the environmental Kuznets curve hypothesises,17 and as these countries (the BASIC economies in our
16 See Nadvi (2014) for a characterisation of BRICS: strong economic growth since the 1990s; significant participation in global trade; a large domestic market; strong state involvement in the economy; availability of private and public capital for investment; growing space for civil society in public-private discourse. 17 The environmental Kuznets curve hypothesises that in the early stages of economic growth, environmental degradation and pollution increase, but beyond a certain level of income per capita (which will vary for different indicators) the trend
EARTH, WIND AND FIRE
31
analysis) are expected to have better economic conditions, there is interest in knowing if domestic
demands for better social and environmental quality and standards will improve once a certain level of
development or growth has been achieved, as measured against how and what the industrialised
countries have achieved. It is also critical to know, in their quest for economic development and growth,
if these countries will attach importance to the ethical aspects of their production and consumption
decisions or economic growth. Some of these countries, such as India and China, have already
extensively and irreversibly compromised on domestic social and environmental quality and standards
in favour of rapid and unsustainable economic growth.
The interpretative flexibility of how countries have approached environmental and sustainable issues thus
far, and questions concerning trade-offs between economic growth and environmental quality and
standards, have critical implications for how global negotiations around climate change will be directed.
This applies to future post-Kyoto climate discussions, including the upcoming COP 21 in Paris in December
2015. The BASIC18 voices, or the rising powers, will determine if any international agreements will be
reached. Currently, the ‘ethical’ debate of these countries has tended towards trading off the
environment for ‘development’; sustainable development has been given little bargaining space, as
most often myopic visions of leaders, a lack of political will and ‘blame-games’ have constrained
international greenhouse gas (GHG) mitigation and adaptation agreements and strategies. Social and
environmental quality and (sustainable) economic growth are looked upon as trade-offs and mutually
exclusive and this is because environmentalists, business leaders and policymakers have all made the
environment an economic rather than a political issue (Unmϋβig, 2014).
One the biggest challenges for the BASIC countries remains – one of initiating and implementing forms
of ecological modernisation and pathways that will likely lead towards sustainable growth and
development. The BASIC countries should strive to re-frame the climate change negotiations towards
discussion of sustainability solutions, exchange experiences and give moral leadership to the global
negotiations by positing approaches that transcend the current paradigms. In this way, they will help
unlock the decades-long North-South logjam around global sustainability, climate change and
development, primarily by winning over the majority of humanity across the globe towards approaches
that are reasonable, just and socially sustainable.
ADAPTATION – THE MISSING DISCOURSE
Adaptation19 as a climate change policy was only put on the international agenda in the 2000s.
However, mitigation and climate financing continue to dominate the climate change agenda (Death,
2014; Madzwamuse, 2014) and adaptation has been ignored out of fear of admitting defeat and
undermining support for the Kyoto framework (Roos, 2010). According to Christoplos (2014), the green
reverses, so that at high-income levels economic growth leads to environmental improvement. This implies that the environmental Kuznets curve is an inverted U-shaped function of income per capita. 18 This analysis, however, will refer to the BASIC countries as were constituted as a negotiation group for the COP in Copenhagen in 2009 and signed the Copenhagen Accord.
19 The IPCC defines adaptation as the adjustment in natural or human systems to a new or changing environment, and also involves efforts to limit our vulnerability to climate change. It defines mitigation as an anthropogenic intervention to reduce the sources or enhance the sinks of greenhouse gases (GHG).
EARTH, WIND AND FIRE
32
growth20 rhetoric suggests the existence of ‘win-win’ solutions whilst, in truth, adaptation to climate
change has been a more important but under-discussed challenge for many developing countries.
Political and climate policy advocates from developing countries have shied away from discussing
adaptation or the issues of people who are most vulnerable to climate change due to a belief that to
do so would weaken political resolve to pursue effective mitigation (Thomson and Rayner, 1998).
Figure 1 below shows the disparate policy inclinations of the mitigation and adaptation agendas of the
United Nations Framework Convention on Climate Change (UNFCCC), showing the heavy bias of
mitigation policies towards pro-growth agendas. Little attention has been paid to adaptation in
international and national climate change discourses and politics even though this is where a large part
of the focus of poor countries in Africa and the BASIC countries should be. Should the scale and the
absence of modes of production in African countries, similar to traditional industrialisation, which make
them less pollutive than other emerging and developed countries, be seen as an advantage? Africa has
more projects to protect biodiversity than other major areas of the world and these projects are
vulnerable to the effects of climate change. Countries in Africa are particularly vulnerable to climate
change and tend to have a much higher share of their economy in climate-sensitive sectors (Smith and
Lenhart, 1996).21
20 Death (2014) discusses four types of Green Economy discourses: Green Revolution; Green Transformation; Green Growth; and Green Resilience. Although evidence of the four discourses can be found in South Africa, different state actors and institutions have different positions on the green economy; the green growth discourse is the most embedded and most widespread of these discourses, articulated as such in the 2011 White Paper on Climate Change, the Green Economy Accord, and National Development Plan (NDP), among others. 21 See Smith and Lenhart (1996) for a description of a number of government policies that could be implemented in anticipation of climate change to reduce its potential adverse effects. The policy options are divided into five climate-sensitive sectors: water resources, coastal resources (sea-level rise), forests, ecosystems, and agriculture.
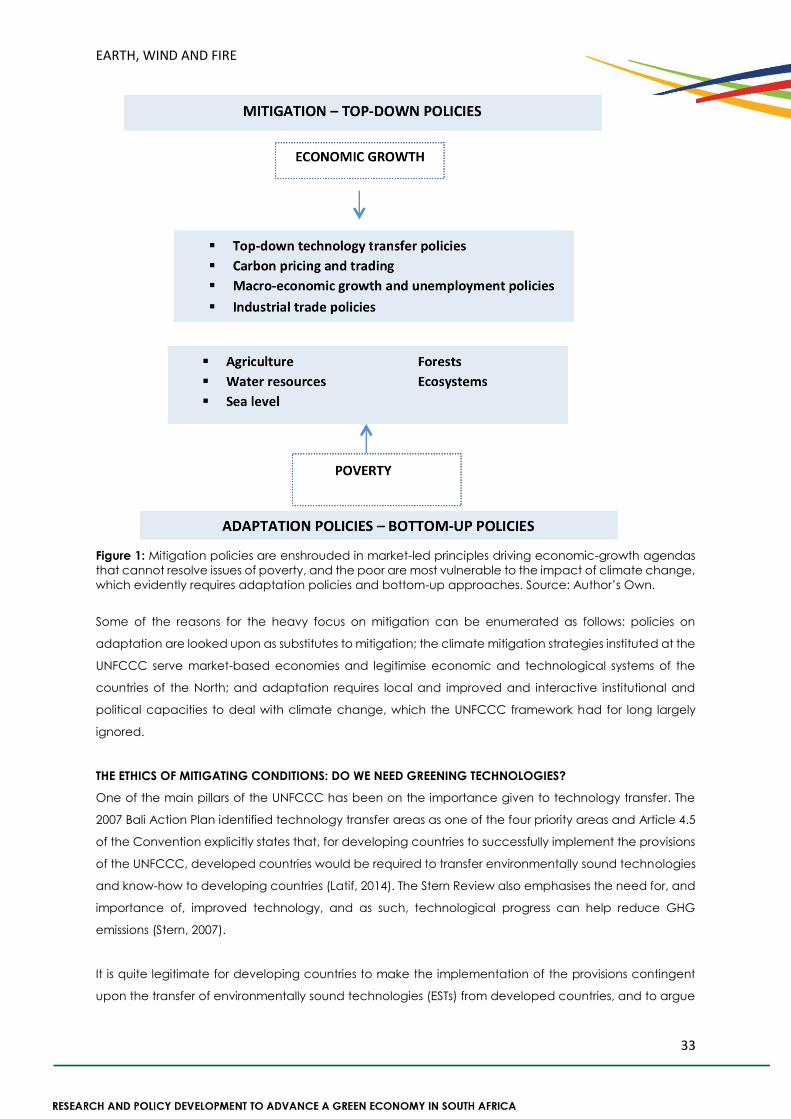
EARTH, WIND AND FIRE
33
Figure 1: Mitigation policies are enshrouded in market-led principles driving economic-growth agendas
that cannot resolve issues of poverty, and the poor are most vulnerable to the impact of climate change,
which evidently requires adaptation policies and bottom-up approaches. Source: Author’s Own.
Some of the reasons for the heavy focus on mitigation can be enumerated as follows: policies on
adaptation are looked upon as substitutes to mitigation; the climate mitigation strategies instituted at the
UNFCCC serve market-based economies and legitimise economic and technological systems of the
countries of the North; and adaptation requires local and improved and interactive institutional and
political capacities to deal with climate change, which the UNFCCC framework had for long largely
ignored.
THE ETHICS OF MITIGATING CONDITIONS: DO WE NEED GREENING TECHNOLOGIES?
One of the main pillars of the UNFCCC has been on the importance given to technology transfer. The
2007 Bali Action Plan identified technology transfer areas as one of the four priority areas and Article 4.5
of the Convention explicitly states that, for developing countries to successfully implement the provisions
of the UNFCCC, developed countries would be required to transfer environmentally sound technologies
and know-how to developing countries (Latif, 2014). The Stern Review also emphasises the need for, and
importance of, improved technology, and as such, technological progress can help reduce GHG
emissions (Stern, 2007).
It is quite legitimate for developing countries to make the implementation of the provisions contingent
upon the transfer of environmentally sound technologies (ESTs) from developed countries, and to argue
EARTH, WIND AND FIRE
34
that there is a moral and ethical imperative for them to be given access to technologies to help combat
climate change, but this has led to ambiguous sustainability goals. The question has been posed, though,
as to whether this can be pursued without:
The Undermining of Responsibility by Developing Countries to Take any Necessary Action
At the 2009 COP in Copenhagen, South Africa announced a 34 per cent reduction in emissions by 2020
below business-as-usual, with emissions expected to level out and decline in real terms from 2036. But the
government added that the achievement of these national targets is subject to the availability of
significant financial, technological and other support from the international community or developed
countries. Other emerging countries, such as India, have stated that a lack of access to improved
technologies and ESTs is going to become a major impediment in combating climate change.
Yet, developing countries have not detailed or explained what kind of technologies would help combat
climate change and how. There has to be sufficient knowledge and absorptive capacity in the
technology recipient countries to be able to adequately use and adapt the ESTs. Moreover, no
technology can be indiscriminately applied to every socio-economic context, and it is also critical to
understand how the use of a new technology will impact the distribution and use of land, water and
other resources (Christoplos, 2014). Emphasis has been placed on the transfer of those technologies that
continue to sustain economic growth and those that have large-scale and commercial applications
such as carbon capture and storage (CCS), shale gas fracking and large-scale wind and solar projects.
While these technologies do have some positive impact, without people-centred approaches they are
often of little advantage to people most affected by climate change – the poor who constitute the
majority of the population in countries such as India, China, South Africa, Brazil and other African
countries.
The Stalemating and Creation of Deadlock Situations in Climate Negotiations
Further, developing countries have to clearly flesh out how intellectual property rights (IPRs) for
environmentally sound and clean energy technologies are a barrier to combating climate change (Latif,
2014). Many companies from developed countries are strongly opposed to sharing their IPRs. Yet, in such
discussions, there needs to be an appreciation of the role of IPRs as essential incentives to promote
innovation. Perhaps, as with the negotiations, cajoling and even defiance that characterised the debate
around pharmaceuticals over the past few decades, a new equilibrium needs to be established in this
relationship.
Thus, a middle ground in the UNFCCC discussions around technology transfer may be found and current
deadlocks broken. Latif (2014) provides a number of parameters to help structure the discussion on this
complex issue and thus avoid a deadlock: minimise the importance of IPRs while giving more importance
to an enabling environment, finance and absorptive capacity; scrutinise litigation cases between
companies of the North and the South to understand the implications of the technology transfer of
climate change technologies, and whether IPR is actually an issue as it has not prevented the
emergence of industry champions in China and India; and draw on practices and lessons of existing
bilateral R&D and technology partnerships between developed and developing countries.
EARTH, WIND AND FIRE
35
RECOMMENDATIONS AND CONCLUSIONS
Political arguments that a green economy and green growth will create new jobs and overcome poverty
are often overstated in relation to a real transition towards sustainable development. Such statements
unfortunately only legitimise market-led principles of economic growth that continue to support modes
of production and consumption that are often not energy-saving, whilst taking all attention away from
those elements that are in serious need of contemplation and critical policy intervention, such as
grassroots and informal sectors of the economy. For developing countries such as the BASIC group, there
should be a serious focus on linking sustainable development and climate change to poverty.
The world is in need of a climate change framework for transnational and global political action that
embraces new and alternative thoughts and action. Examples of these are those proposed by de-
growth and the radical ecological democracy proponents, which put collectives and communities at
the centre of sustainable governance and the economy, and provide a holistic vision of human well-
being encompassing physical, material and sociocultural dimensions. Such thinking requires the spread
of certain core values of sustainable development, and the sharing of these values among countries.
It is these alternative frameworks and modes of thinking and action that will unlock technological,
institutional and economic systems from old habits and thinking. Now is the time to scrutinise the specific
ways in which the current world order has been created, the kind of thinking and practices that have
led to its failings, and the systemic interventions required to extricate humanity from the current malaise.
There is a need for framing the issue of sustainable development in a manner that embraces the social
complexity or the human and multidimensional nature of the issues. That requires a revolutionary change
in political consciousness within and across national boundaries, including a keen appreciation of the
conditions of the poor and marginalised across the globe. Domestic and national climate change and
sustainable development policies of at least the major countries in the North and the South must be
embedded within a broader transparent international effort and discourse.
Both at the UNFCCC and at the national levels of the BASIC countries, the important issue of adaptation
as a climate change policy has been an under-discussed challenge. It has, however, gained ground
since COP 20 in December 2014, and will be one of the critical proposals in the agenda for COP21 in
December 2015. This must be sustained and intensified, taking into account the fact that the poor,
especially in Africa, Asia and Latin America are in the majority, and extensively dependent on climate-
sensitive sectors for their sustenance.
References
Ahmed, F. 2004. ‘An Examination of the Development Path Taken by Small Island Developing States:
Jamaica a Case Study’, Master’s thesis. Canada: the University of Western Ontario.
Athanasiou, T. 2014. ‘Climate Crossroads: Toward a Just Deal in Paris’, A Great Transition Initiative
Viewpoint. Available at: www.greattransition.org [Accessed: 20 March 2015].
Christoplos, I. 2014. ‘The Downside of Green Growth, Technological Choices’. Available at
www.danc.eu [Accessed: 28 March 2015].
Davis, R. 2015. ‘A Meaningful Step on a Long and Winding Road’ in Ed Wallis (ed.). 2015, Making a
Global Deal on Climate Change a Reality. Fabian Society. Chapter 1, pp. 1–8.
Death, C. 2014. ‘The Green Economy in South Africa: Global Discourses and Local Politics’, Politikon:
EARTH, WIND AND FIRE
36
South African Journal of Political Studies, 41(1) 1–22.
Falk, R. 2014. ‘Changing the Political Climate: A Transitional Imperative’, A Great Transition Initiative
Essay. Available at: www.greattransition.org [Accessed: 16th March 2015].
IAC. 2010. ‘Evaluation of IPCC’s assessment process, climate change assessments: a Review of the
processes and procedures of the IPCC’. Available at www.interacademycouncil.net [Accessed: 30
March 2015].
Kallis, G. 2015. ‘The Degrowth Alternative’. A Great Transition Initiative Viewpoint. Available at:
www.greattransition.org [Accessed: 20 March 2015].
Kothari, A. 2014. ‘Radical Ecological Democracy: A Path Forward for India and Beyond’. A Great
Transition Initiative Essay. Available at: www.greattransition.org [Accessed: 20 March 2015].
Lippert, I. 2004. ‘An Introduction to the Criticism on Sustainable Development’. Available at:
www.academia.edu [Accessed: 10 May 2015].
Lütkenhorst, W., Altenburg, T., Pegels, A. and Vidican, G. 2014. ‘Green Industrial Policy: Managing
Transformation Under Uncertainty’. Discussion Paper 28/2014. German Development Institute.
Madzwamuse, M. 2014. ‘Drowning Voices: The Climate Change Discourse in South Africa’. Heinrich Boll
Stiftung-Southern Africa, 3 February. Available at: http://za.boell.org/2014/02/03/drowning-voices-
climate-change-discourse-south-africa-publications [Accessed: 10 April 2015].
Mahapatra, B. 2014. ‘The Modi Government’s War on Environment’. 12 November 2014. Open India.
Available at: www.opendemocracy.net [Accessed: 10 April 2015].
McCarthy, S. 2015. ‘UN panel calls Canada a climate laggard’, Available at:
www.theglobeandmail.com [Accessed: 20 April 2015].
Our Common Future, Chapter 3: ‘The Role of the International Economy’, Article 27, taken from
A/42/427, Our Common Future: Report of the World Commission on Environment and Development.
Available at: www.un-documents.net [Accessed: 8 August 2015].
Pearce, F. 2010. The Coming Population Crash: and Our Planet's Surprising Future. Boston,
Massachusetts: Beacon.
Pearce, F. 2014. ‘It’s Not Overpopulation That Causes Climate Change, it’s Overconsumption’, The
Guardian, 9 September 2014. Available at: www.theguardian.com. [Accessed: 24 May 2015].
Perrot, R. and Summoni, D. 2015. ‘A Critique of the Green Economy in Africa’, Foresight for
Development. Available at: www.foresightfordevelopment.org [Accessed: 20 April 2015].
Roos, J. 2010. ‘How to Eat an Elephant: A Bottom-Up Approach to Climate Policy’, The Breakthrough
Institute. Available at: www.thebreakthrough.org [Accessed: 10 May 2015].
Smith, J. B. and Lenhart, S. S. 1996. ‘Climate Change Adaptation Policy Options’. Climate Research,
6(2), 193–201.
Stollery, K. R. 1983. ‘Mineral Depletion with Cost as the Extraction Limit: A Model Applied to the
Behaviour of Prices in the Nickel Industry’, Journal of Environmental Economics and Management, 10:
151–165.
The Hague Report. 1991. ‘Sustainable Development: From Concept to Action’, Dutch Ministry of
Development Cooperation.
Voß, J. P. and Kemp, R. 2006. ‘Sustainability and Reflexive Ggovernance: Introduction’, Reflexive
Governance for Sustainable Development, 3–28.
EARTH, WIND AND FIRE
37
Chapter 2
TMS and Environmental and Energy Policy Planning
in
South Africa: Betwixt Utopia and Dystopia
Louise Scholtz, Manisha Gulati and Saliem Fakir
Only a crisis – actual or perceived – produces real change. When that crisis occurs, the actions that are
taken depend on the ideas that are lying around. That, I believe, is our basic function: to develop
alternatives to existing policies, to keep them alive and available until the politically impossible becomes
the politically inevitable (Milton Friedman, Capitalism and Freedom, 1962, cited in Seguiono, 2014: 8).
It is ... impossible to draw a clear line between energy resources, climate policies and geopolitics (De
Micco, et al. 2013).
INTRODUCTION
While there is consensus that the environmental challenges facing the world will require a major
transformation, ‘widely differing interpretations exist about the nature of this transformation, with
competing assumptions about the institutions required and the drivers of change (Cook, et al. 2012: iii).’
Any transition to a low carbon trajectory is highly dependent, not only on policies and legislation, but also
on the level of acceptance and support by the status quo for the envisaged transition. As such, both
existing and ‘future power relations, governance arrangements, and participatory processes’ are central
to envisioning and implementing the transition (Cook, et al. 2012). Related to this is the debate on
whether existing ‘democratic forms of governance’ will be able to drive the urgent changes in policy
required or whether more coercive and autocratic governments may be necessary (Held and Hervey,
2012: 5). In addition, Scholvin (2014: 186) alerts that, though economic and political causes are important,
one should not lose sight of how natural conditions and endowments direct policy. ‘Nature is linked with
path dependency’, demonstrated by the extent to which historical energy policies translated into
‘material structures in geographical space limit the policy options available today’.
In the case of South Africa, an ample supply of coal is both the main determinant of existing energy
policies and the obstacle to a transition to a low carbon economy. South Africa is a carbon-intensive
economy that derives 86 per cent of its electricity from coal (Fakir and Gulati, 2012), emits 520–540 million
megatons of carbon a year (estimates for 2010 based on the inventory for the year 2000) (Marquard,
Trollip and Winkler, 2011), contributes 1.49 per cent of total global CO₂ emissions, and with per capita
emissions of nine tons in 2005, compared to an average for Annex I countries of 14 tons, for non-Annex-I
EARTH, WIND AND FIRE
38
countries22 of 4.8 tons, and a world average of 6.7 tons (Marquard, Trollip and Winkler, 2011). Presently,
the country is in twelfth place on the list of carbon emitters in the world and first in Africa (Satgar, 2014).
Compounding matters is the country’s minerals-energy complex (MEC) that is still central to the South
African economy, raising questions as to whether climate mitigation can be seen as a coherent project
in South Africa.
Nevertheless, the Government has taken steps towards an effective climate change response with
regards to emissions reductions and the long-term transition to a climate-resilient, equitable and
internationally competitive low-carbon economy. These steps first found expression in the Long Term
Mitigation Scenarios (LTMS). Adopted in 2008, the LTMS explores the country’s options for climate change
mitigation. It overlays a number of possible emissions trajectories, from the (unrestricted) Business as Usual
(BAU) at the top, through reductions expected from three sets of interventions improving on current
development plans, to bringing the country broadly in line with reductions required within an effective
international climate change mitigation effort. The central question this paper seeks to address is whether
the LTMS and related policies adequately address climate change and support and drive the transition
to a low-carbon economy in South Africa. The paper (in the main) argues that the LTMS, in particular,
and energy and environmental policy, as a whole, was developed in a manner that largely ignores ‘data
from the real world’ such as vested interests, the political economy and the critical role of coal as key
driver of the economy (Sequino, 2014: 1), and is hampered by policy dissonance.
By highlighting the challenges of environmental and energy planning in the context of the LTMS, this
chapter aims to provide a framing for some of the debates in the book. A wider analysis of the climate
policies of seven countries provides a conceptual framework to understanding the levers that inform
‘coherent’ climate policy.
The first part of this chapter delves down into the relevant South African policies and the LTMS in
particular, i.e. it’s role in policymaking, and its limitations. The second part sets out the challenges to
environmental and energy planning in view of these shortcomings. Part three highlights approaches by
specific countries and commonalities relevant to South Africa, while the conclusion alerts to opportunities
and challenges that can impact on South Africa’s low-carbon future.
PART 1: SOUTH AFRICA’S LONG-TERM MITIGATION SCENARIOS
Overview of LTMS
South Africa’s comprehensive response to climate change mitigation interventions began with the LTMS
document, which assesses the mitigation potential and opportunities for the country and purports to be
the basis for an informed policy on tackling climate change. The LTMS lays down a number of emission
22 Annex-I countries refers to industrialised countries that were members of the Organisation for Economic Co-operation and Development (OECD) in 1992, plus countries with economies in transition including the Russian Federation, the Baltic States, and several Central and Eastern European States that have ratified or acceded to the United Nations Convention on Climate Change, which sets an overall framework for intergovernmental efforts to tackle the challenge posed by climate change; Non-Annex-I countries are mostly developing countries that have ratified or acceded to the United Nations Convention on Climate Change but are not included in Annex I (United Nations Framework Convention on Climate Change, undated).
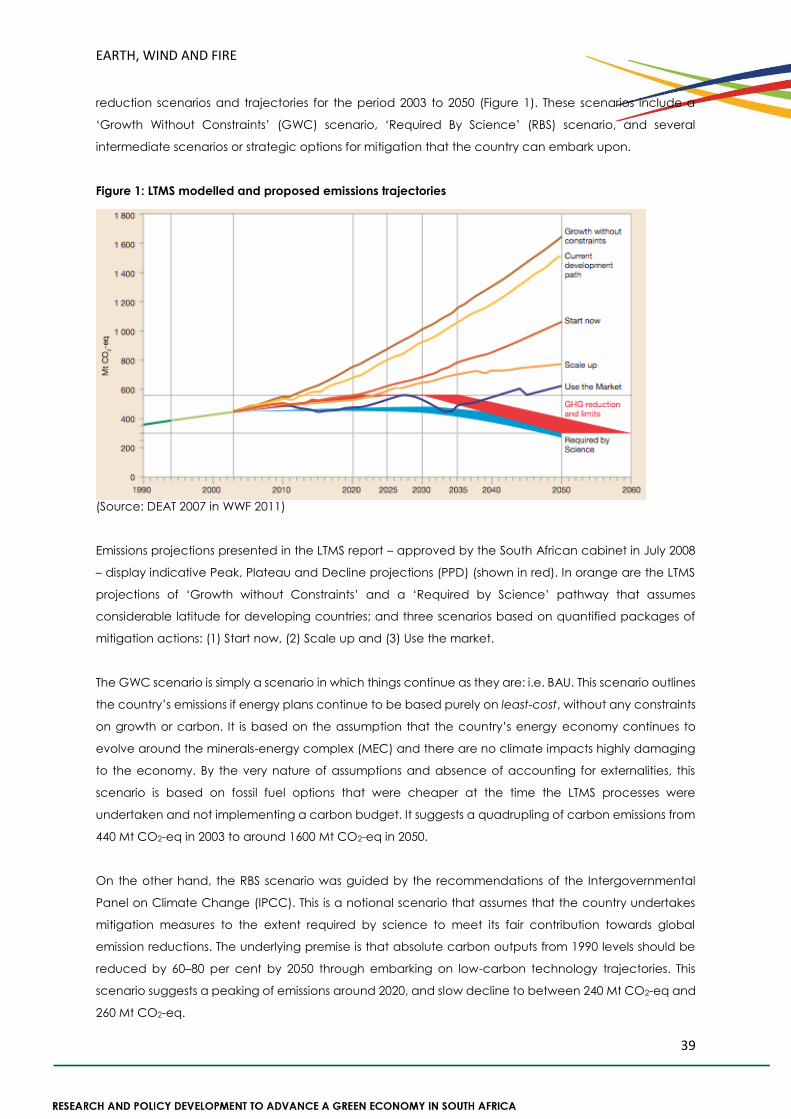
EARTH, WIND AND FIRE
39
reduction scenarios and trajectories for the period 2003 to 2050 (Figure 1). These scenarios include a
‘Growth Without Constraints’ (GWC) scenario, ‘Required By Science’ (RBS) scenario, and several
intermediate scenarios or strategic options for mitigation that the country can embark upon.
Figure 1: LTMS modelled and proposed emissions trajectories
(Source: DEAT 2007 in WWF 2011)
Emissions projections presented in the LTMS report – approved by the South African cabinet in July 2008
– display indicative Peak, Plateau and Decline projections (PPD) (shown in red). In orange are the LTMS
projections of ‘Growth without Constraints’ and a ‘Required by Science’ pathway that assumes
considerable latitude for developing countries; and three scenarios based on quantified packages of
mitigation actions: (1) Start now, (2) Scale up and (3) Use the market.
The GWC scenario is simply a scenario in which things continue as they are: i.e. BAU. This scenario outlines
the country’s emissions if energy plans continue to be based purely on least-cost, without any constraints
on growth or carbon. It is based on the assumption that the country’s energy economy continues to
evolve around the minerals-energy complex (MEC) and there are no climate impacts highly damaging
to the economy. By the very nature of assumptions and absence of accounting for externalities, this
scenario is based on fossil fuel options that were cheaper at the time the LTMS processes were
undertaken and not implementing a carbon budget. It suggests a quadrupling of carbon emissions from
440 Mt CO2-eq in 2003 to around 1600 Mt CO2-eq in 2050.
On the other hand, the RBS scenario was guided by the recommendations of the Intergovernmental
Panel on Climate Change (IPCC). This is a notional scenario that assumes that the country undertakes
mitigation measures to the extent required by science to meet its fair contribution towards global
emission reductions. The underlying premise is that absolute carbon outputs from 1990 levels should be
reduced by 60–80 per cent by 2050 through embarking on low-carbon technology trajectories. This
scenario suggests a peaking of emissions around 2020, and slow decline to between 240 Mt CO2-eq and
260 Mt CO2-eq.
EARTH, WIND AND FIRE
40
A comparison of the GWC and RBS scenarios suggests a difference of around 1300 Mt CO2-eq in 2050.
This gap is more than three times the annual emissions in 2003. This difference in emissions would be the
mitigation cap that would be imposed on the country in the event of strict adherence to the RBS
scenario. In other words, adherence to the RBS necessitates cost-effective low-carbon solutions that do
not allow the emissions of an additional 1300 Mt CO2-eq per annum if the country needs to grow without
constraints.
The LTMS provides the underpinning for informed debate about South Africa’s future development. In
doing so it surfaces three important issues. First, it conveys the recognition that high carbon and energy
intensity is not a sustainable and flexible pathway for South Africa’s economy in the long-term because
increased dependence on carbon-intense fossil fuels will show diminishing benefits with time. Second, it
shows that significant shifts can be made in energy and transport sectors. (Issues of affordability and
pace of scale will be key to the nature of change and transition.) Third, low-carbon technology
trajectories and markets offer economic opportunities that can reduce system risks to external shocks,
inflation and price volatility. Simultaneously, they have the potential to create and generate new types
of economic sectors and growth levers.
LTMS and policymaking
Relying on the LTMS, South Africa’s policy framework has committed to climate change mitigation and
adaptation interventions in the country being informed by, and monitored and measured against, a PPD
emission trajectory where GHG emissions peak in 2020–25, plateau for approximately a decade, and
decline in absolute terms thereafter. The RBS scenario also informed the country’s bold and ambitious
targets announced in Copenhagen in 2009. These targets (referred to as the Copenhagen Commitment)
involve a reduction in the country’s carbon emissions by 34 per cent in 2020, and 42 per cent by 2025,
conditional on finance, technology and capacity-building support from the international community.
The LTMS findings have given important impetus to the 2011 National Climate Change Response White
Paper, which is the first coherent outline of national government’s responsibilities relating to mitigation
and adaptation and is the basis for future government action. The strategy laid down in this paper adopts
a strongly sectoral approach, emphasising immediate implementation of ‘Near- term Priority Flagship
Programmes’ focusing both on reducing emissions and on adaptation (in an approach it characterises
as ‘climate change resilient development’).
Subsequently, a number of steps have been taken to incorporate climate change into national and sub-
national policies. A carbon constraint has been introduced into energy planning, a large-scale
renewables power purchase programme has been initiated, policy measures have been introduced to
incentivise the uptake of energy efficiency, levies such as a vehicle carbon emissions tax and a tax on
incandescent light bulbs have been introduced, and a carbon tax is proposed to be levied from 2016
(National Treasury, Republic of South Africa, 2014).
The government has undertaken a mitigation potential analysis (MPA) for key sectors to analyse emissions
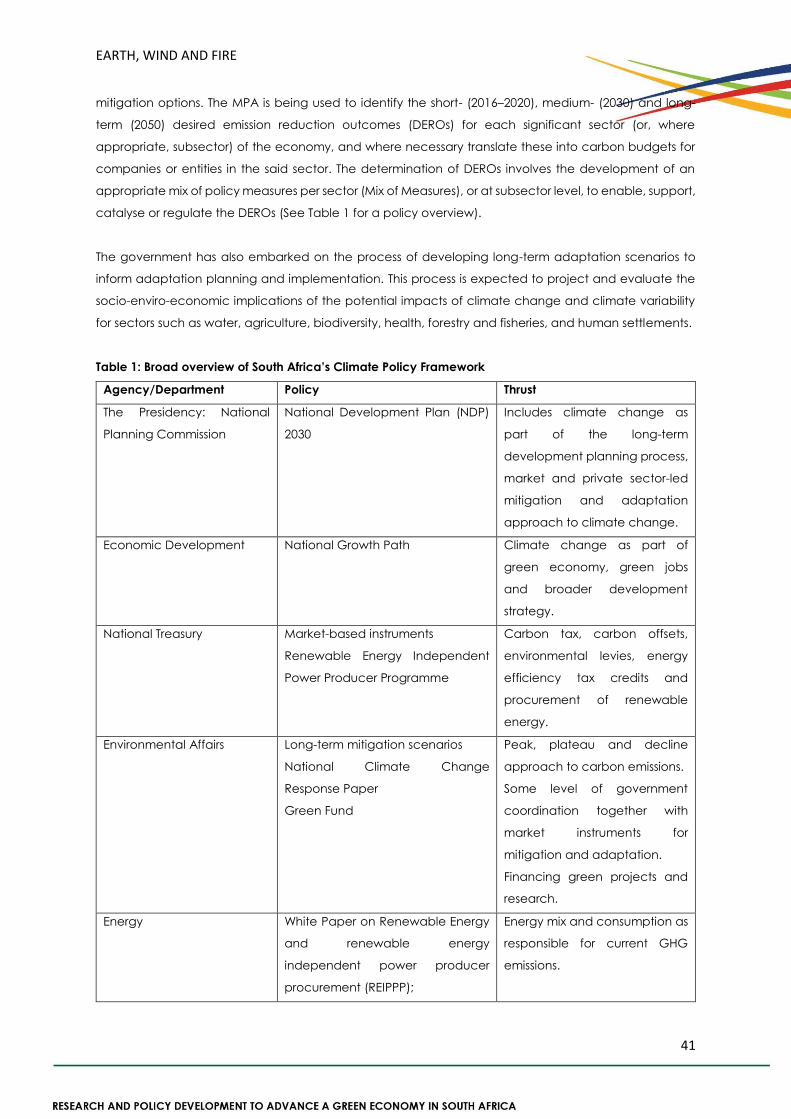
EARTH, WIND AND FIRE
41
mitigation options. The MPA is being used to identify the short- (2016–2020), medium- (2030) and long-
term (2050) desired emission reduction outcomes (DEROs) for each significant sector (or, where
appropriate, subsector) of the economy, and where necessary translate these into carbon budgets for
companies or entities in the said sector. The determination of DEROs involves the development of an
appropriate mix of policy measures per sector (Mix of Measures), or at subsector level, to enable, support,
catalyse or regulate the DEROs (See Table 1 for a policy overview).
The government has also embarked on the process of developing long-term adaptation scenarios to
inform adaptation planning and implementation. This process is expected to project and evaluate the
socio-enviro-economic implications of the potential impacts of climate change and climate variability
for sectors such as water, agriculture, biodiversity, health, forestry and fisheries, and human settlements.
Table 1: Broad overview of South Africa’s Climate Policy Framework
Agency/Department Policy Thrust
The Presidency: National
Planning Commission
National Development Plan (NDP)
2030
Includes climate change as
part of the long-term
development planning process,
market and private sector-led
mitigation and adaptation
approach to climate change.
Economic Development National Growth Path
Climate change as part of
green economy, green jobs
and broader development
strategy.
National Treasury Market-based instruments
Renewable Energy Independent
Power Producer Programme
Carbon tax, carbon offsets,
environmental levies, energy
efficiency tax credits and
procurement of renewable
energy.
Environmental Affairs Long-term mitigation scenarios
National Climate Change
Response Paper
Green Fund
Peak, plateau and decline
approach to carbon emissions.
Some level of government
coordination together with
market instruments for
mitigation and adaptation.
Financing green projects and
research.
Energy White Paper on Renewable Energy
and renewable energy
independent power producer
procurement (REIPPP);
Energy mix and consumption as
responsible for current GHG
emissions.
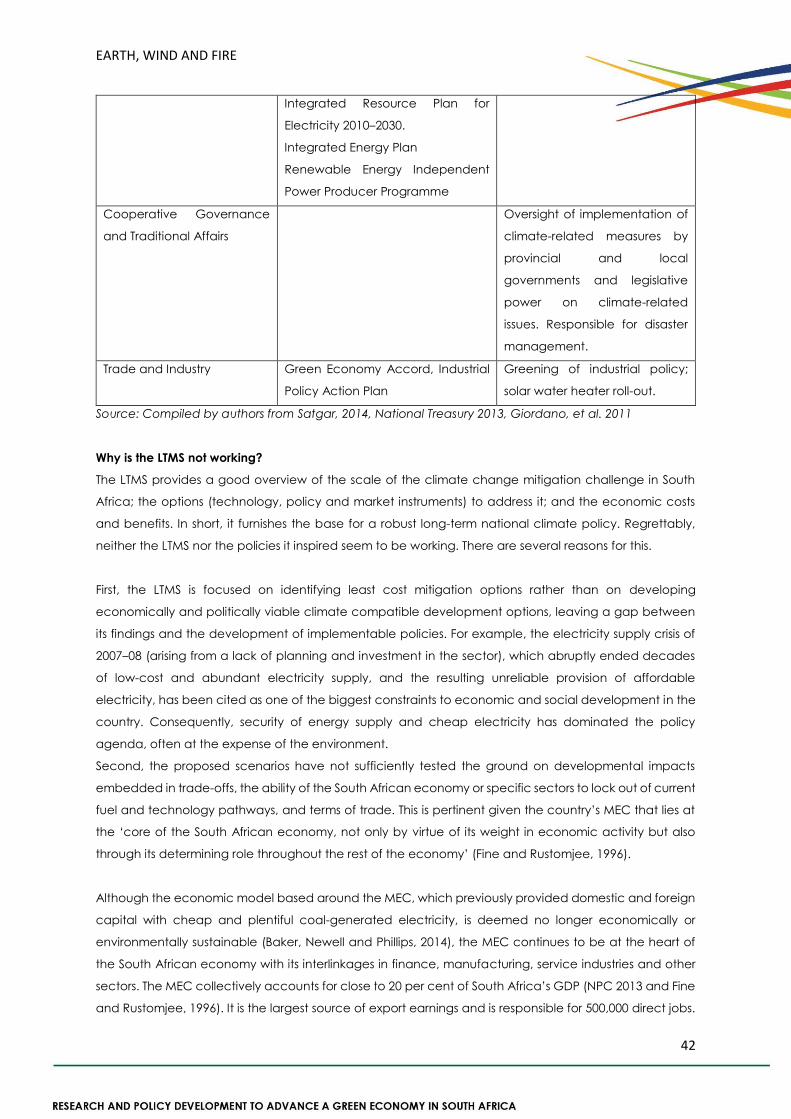
EARTH, WIND AND FIRE
42
Integrated Resource Plan for
Electricity 2010–2030.
Integrated Energy Plan
Renewable Energy Independent
Power Producer Programme
Cooperative Governance
and Traditional Affairs
Oversight of implementation of
climate-related measures by
provincial and local
governments and legislative
power on climate-related
issues. Responsible for disaster
management.
Trade and Industry Green Economy Accord, Industrial
Policy Action Plan
Greening of industrial policy;
solar water heater roll-out.
Source: Compiled by authors from Satgar, 2014, National Treasury 2013, Giordano, et al. 2011
Why is the LTMS not working?
The LTMS provides a good overview of the scale of the climate change mitigation challenge in South
Africa; the options (technology, policy and market instruments) to address it; and the economic costs
and benefits. In short, it furnishes the base for a robust long-term national climate policy. Regrettably,
neither the LTMS nor the policies it inspired seem to be working. There are several reasons for this.
First, the LTMS is focused on identifying least cost mitigation options rather than on developing
economically and politically viable climate compatible development options, leaving a gap between
its findings and the development of implementable policies. For example, the electricity supply crisis of
2007–08 (arising from a lack of planning and investment in the sector), which abruptly ended decades
of low-cost and abundant electricity supply, and the resulting unreliable provision of affordable
electricity, has been cited as one of the biggest constraints to economic and social development in the
country. Consequently, security of energy supply and cheap electricity has dominated the policy
agenda, often at the expense of the environment.
Second, the proposed scenarios have not sufficiently tested the ground on developmental impacts
embedded in trade-offs, the ability of the South African economy or specific sectors to lock out of current
fuel and technology pathways, and terms of trade. This is pertinent given the country’s MEC that lies at
the ‘core of the South African economy, not only by virtue of its weight in economic activity but also
through its determining role throughout the rest of the economy’ (Fine and Rustomjee, 1996).
Although the economic model based around the MEC, which previously provided domestic and foreign
capital with cheap and plentiful coal-generated electricity, is deemed no longer economically or
environmentally sustainable (Baker, Newell and Phillips, 2014), the MEC continues to be at the heart of
the South African economy with its interlinkages in finance, manufacturing, service industries and other
sectors. The MEC collectively accounts for close to 20 per cent of South Africa’s GDP (NPC 2013 and Fine
and Rustomjee, 1996). It is the largest source of export earnings and is responsible for 500,000 direct jobs.
EARTH, WIND AND FIRE
43
It is expected to continue to play an important role in the economy, with some estimates (NPC 2013)
suggesting that its contribution to GDP can double by 2030 and it could add another 200,000 jobs.
It is argued that the lack of good data sets and tools renders it difficult to fully consider development
impacts. The available data sets, though the best available, were inadequate because the sort of data
required for such an exercise did not exist in the country. After all, this was the first time that the country
was doing such an exercise. Nevertheless, it is important to recognise that the above-mentioned
economic realities constrain the country’s abilities to embark on a low-carbon transition on the basis of
an RBS scenario even though this goal has been somewhat modified as a result of South Africa’s
international commitments.
Third, the LTMS is naïve about the ‘political settlement’23, i.e. the evolution, distribution and structure of
social power, which profoundly influences and impacts on the likelihood of a particular policy achieving
its expected outcomes, and it does not support the low-carbon transition. In South Africa’s case, the
political settlement is dominated by the carbon-intensive MEC. The constellation of class forces
underpinning the MEC, spanning and joining elites (party-state-business), regularly and repeatedly
employs networks and connections to influence and shape praxis in ways that protect the core MEC
sectors (see Baker, 2013). This network works tirelessly to modify the organisational conditions governing
the generation and allocation of rents.24
Climate-related policy intervention changes income flows of environmentally damaging companies
negatively, and creates negative rents for such companies. Thus, by their very nature, these policies
create conditions where the carbon-intensive MEC in South Africa loses rents. Additionally, it changes
the conditions that the MEC has to fulfil to maintain or gain rents. This is because the MEC has to invest in
new technology or more efficient modes of production to lower its environmental impact.
Some other aspects of the political settlement are the mode of policymaking and the structure of the
electricity sector in the country. In terms of climate-related policymaking, there is no centralised lead
agency to directly control environmental matters in an integrated fashion. At least 21 of the 32 sectoral
departments are concerned with climate change. The LTMS does not spell out the actual possible
combination of approaches, policies, measures and actions to achieve optimal mitigation or how to
dovetail different policy measures such as taxes, emissions reduction targets, efficiency targets,
standards and regulatory measures. This is left to the implementing government departments and
23 The political settlement refers to the configuration of capabilities and distribution of organisational and bargaining power across economic, political and bureaucratic organisations in a society (Khan, 2010). Thus, a political settlement includes governance agencies or the bureaucracies within the state that are charged with the management of policies to monitor and enforce policies. The technical capabilities of governance agencies and the relative power of these organisations relative to other organisations jointly determine the ability of governance agencies to enforce policies (Khan, 2013). 24 Rents are defined as incomes higher than the minimum a person or organisation would have accepted, the minimum usually being defined as the income in the next-best opportunity available to that individual or organisation (Khan, 2013).
EARTH, WIND AND FIRE
44
agencies. The DEROs process could achieve such coordination. However, experience with this process,
and discussions with experts and stakeholders involved, suggests otherwise. In the absence of
combinations and dovetailing, the resulting ineffectiveness and poor targeting is of little or no surprise.
In the electricity sector there are structural supply problems. The sector is characterised by the absence
of competition and supply diversity at the wholesale or retail level. End-users have no choice in terms of
energy supplier or technology and cannot switch to another supplier with a lower carbon footprint.
Fourth, though the LTMS is a useful introduction to technology options for mitigation, these options do not
adequately address the cost, scale and institutional barriers that (either) limit options or the pace at
which a particular technology pathway can be embarked upon. Technologies, institutions, business
strategies and user practices have evolved in a manner that has locked the country into an energy and
carbon-intensive economic pathway. This lock-in is systemic and mutually reinforcing: the technology
lock-in delays the adoption of more efficient technologies thereby causing the institutional lock-in and
the institutional lock-in makes it difficult to direct investment to new, more carbon-efficient classes of
infrastructure.
Fifth, the LTMS lacks a techno-economic assessment and feasibility stress test in terms of the ability of
different sectors to adjust to emissions reduction targets. Take the example of cement, which is central
to the National Development Plan (NDP), as well as the National Infrastructure Development Plan, the
New Growth Path and the Industrial Policy and Action Plan. The cement production process is inherently
resource intensive. Cement is a low-value, high-volume material with a high material and energy
throughput. Clinker production (i.e. calcination of limestone) accounts for around 50 per cent of the total
emissions from cement manufacturing. The percentage of clinker substitutes as a percentage of the total
mix of materials in South Africa has increased from 12 per cent in 1990 through 23 per cent in 2000 to 41
per cent in 2009. Technology and the burning process, which remained constant for a number of years,
prevent further emissions reduction possibilities. New investments in terms of technological upgrades to
improve efficiency and reduce emissions can range between R50–60 million. Given the age of the plants
and the falling demand for cement in the country, such investment is not justified. It would be better,
some argue, to close down these plants (Scholtz and Gulati, unpublished).
Future emissions reduction opportunities for the South African cement industry range from waste heat
recovery (WHR) to the use of waste and secondary materials in kilns, carbon capture and storage (CCS),
and use of innovative cement materials. However, each of these poses challenges. Novel cements using
innovative materials are limited both by limited proven long-term durability and economic viability. Given
that cement is a homogenous product and that there is very little product differentiation, and products
from different producers can generally be substituted for each other, there is no advantage in producing
lower emissions intensive products at higher costs. CCS is limited by substantially high capital and
operational costs. The exact capital expenditure needed per plant is difficult to determine at present,
but is estimated by the European Cement Research Academy to be around €330–360 million to deploy
oxyfuel technology at a new one million tonne/year plant, about €100 million for retrofitting oxyfuel
technology and €100–300 million to retrofit an existing plant with post-combustion technology (Scholtz
EARTH, WIND AND FIRE
45
and Gulati, unpublished). Operational costs of a plant equipped with post-combustion carbon capture
technology are estimated to be double the cost of a conventional cement plant, while oxyfuel use would
incur 25 per cent higher operating costs (Scholtz and Gulati, unpublished).
Similarly, WHR may be limited by the initial investment costs and a long payback period. The use of waste
and secondary materials in kilns is cost effective and the resulting increase in energy efficiency enhances
the business case for WHR with the continuing rise in electricity prices in the country. But problems such
as the absence of assured and affordable supply chains of waste, lack of waste segregation, and poor
economics make this option more expensive and cumbersome than burning coal.
Sixth, the LTMS is still to grapple with whether South Africa is best as a technology leader or as an adopter.
Evidence seems to suggest that its capabilities are best placed in the spectrum of rapid adoption rather
than being low-carbon technology leaders. This is of particular significance because a technology
leader requires access to a highly skilled workforce, state wherewithal for long Research and
Development (R&D) horizons, incentives and ability to mobilise (risk averse) pre-market finance that can
carry new technologies and innovations beyond the ‘Valley of Death’.25
Given South Africa’s historical ‘entanglement with mining and fossil fuels’ (Rafey, 2013) and technological
lock-in into fossil fuel based and carbon intensive technology and infrastructure at the systemic level,
innovation has tended to focus on using fossil fuels (more) efficiently. The South African energy innovation
system is locked into fossil fuels and has resulted in the country becoming a world leader in fossil fuel
based technologies (Scholtz and Gulati, 2013). One such example is Sasol’s coal-to-liquid fuel plants, a
technology commercialised nowhere else in the world. The NDP 2030 reinforces this – Satgar (2014: 143),
for example, points out that many of the ‘techno fixes’ referred to in the Plan focus on the reduction of
the carbon footprint by existing and future coal-powered power stations through retrofitting, clean coal
technologies and further investigation of the feasibility of carbon capture and storage. Against this
backdrop, South Africa has not innovated on low-carbon technologies and has been adopting
technologies developed elsewhere.
At the same time, however, ‘borrowing and applying frontier technologies’ is often difficult, and imply
export capability to earn foreign exchange to do so. Government subsidies – via the provision of
‘economic rents’ can potentially deliver cost containment. By keeping costs low, companies can be
incentivised to migrate to new industries in which they have little experience. Additional tools could
include cheap credit and the promise of bailout support (Sequino, 2014: 4, 5). All of these would present
a challenge and prove problematic to the MEC dominated political settlement.
Finally, the LTMS does not address the issue of the country’s absorptive capacities in respect of climate
friendly technologies. These capacities pertain to skills required to operate and maintain new
technologies but also include the motivating or persuasion factors for end-users to adopt these
technologies.
25 ‘Valley of Death’ is a term used to describe a stage in technology development that lies between the stage when a technology has been financed at the laboratory, or even pilot stage, and when it is rolled out commercially on a large scale. In this stage, a technology is too capital intensive for a venture capital firm to continue investing, but too risky for a bank or private equity firm to bring it to scale.
EARTH, WIND AND FIRE
46
PART 2: CHALLENGES TO ENVIRONMENTAL AND ENERGY PLANNING IN VIEW OF THESE SHORTCOMINGS
The above-identified limitations of the LTMS make pursuing environmentally friendly energy planning
significantly more challenging. Additionally, the multitude of implementing agencies and diverse sectoral
plans that target low carbon development with little integration amongst them has meant that different
plans have different visions and approaches to achieve the objectives of economic development and
low carbon transition. For example, while the Industrial Policy Action Plan and the 10-year innovation plan
envisage a skills and innovation-based economic transition, the energy plan adopts a traditional
infrastructural-driven approach to the transition and targets economic development through
exploitation of natural resources, especially coal and its export. Similarly, there has been much debate
over the link between the tax and the carbon budget. A carbon budget is not fundamentally different
from a cap on emissions. A process of carbon budgeting involves the allocation of carbon, which is a
limited resource. The viability of placing a cap on emissions, while at the same time taxing emissions, is
therefore debatable. There is, however, no clarity on how the carbon tax and the carbon budget are
going to interact.
Then there is the issue of sufficient will or capacity on the part of the government to radically transform
the South African economy in a more environmentally sustainable direction (Death, 2014: 19). A similar
question relates to the extent to which it is responsive to the social, economic and political realities of
South Africa, its natural endowments and development needs. These disconnects can be illustrated
through examples from policymaking across sectors in the country.
The first example is that of electricity planning. Given that coal accounts for 86 per cent of the country’s
electricity generation – thereby making the electricity sector account for half of the country’s emissions
– the electricity system is a key point of intervention from the climate change and lower-carbon
perspective. Yet, planning for electricity generation capacity expansion, as conducted in the form of
the Integrated Resource Plan (IRP), continues to be overwhelmingly anchored in least-cost optimisation
(Burton and Coetzee, undated). Consequently, in absolute terms, coal increases by 6,000 MW to a total
of 50,771 MW (even though proportionally it decreases from 85 per cent to 65 per cent). Moreover,
demand forecasts presuppose the ongoing dependence of the economy on energy-intensive industry
(Burton and Coetzee, undated). It is estimated that 11,000 of the 16,000 MW of the new coal-fired plant
in the IRP goes towards meeting forecast energy demand from industry (Trollip and Tyler 2011 in Burton
and Coetzee). In fact, the final IRP states that the policy requirement for continuing a coal programme
could result in this coal-fired generation (new coal to be built by 2026) being brought forward. Existing
coal-fired generation is run at lower load factors26 to accommodate the new coal options while the
emissions target applies.
This suggests an inefficient use of the electricity system, so as to meet emissions constraints imposed on
the model as well as meet the goals of a ‘coal policy’ that has never been clearly delineated by
government (Burton and Coetzee, undated). (Again, this is a clear case of the ‘political settlement’
26 The load factor of a power plant is the ratio of a power plant’s actual output over a period of time to the maximum possible output that can be produced by the power plant if it operated to its full capacity continuously over the same period of time.
EARTH, WIND AND FIRE
47
influencing electricity planning and the mix of technologies therein). The other side of the coin in this case
could be to say that the additional coal-fired power proposed in the IRP is the plateau in the PPD
emissions trajectory. However, the IRP has not provided for such a technical analysis.
The update to the IRP 2030 that is currently under discussion reinforces the fixation with coal. It suggests
that regional coal options are attractive due to the emissions not accruing to South Africa, and in cases
where the pricing is competitive with South African options, regional coal would be preferred
(Department of Energy, Republic of South Africa, 2013). It then suggests that alternatives to extending
the life of the existing fleet of coal-fired power plants would be to build new coal-fired generation that is
more efficient and has lower emission rates, and non-emitting alternatives would be considered under
more aggressive climate mitigation objectives (Department of Energy, Republic of South Africa, 2013).
However, there is no discussion of what more aggressive climate mitigation objectives would mean.
Similarly, the least-cost options are emphasised throughout the proposed revisions. The update states
that: if the price of power from hydro power plants, inclusive of the transmission requirements to evacuate
the power from the plants, can be maintained within the 60 cents per kWh benchmark for new coal,
then these options should be pursued as and when they arise (Department of Energy, Republic of South
Africa, 2013).
Finally, the update acknowledges the shortage of electricity supply until 2016 and states that the only
options available to manage the situation are increased energy efficiency and demand side responses,
and improved utilisation of existing generation resources (Department of Energy, Republic of South
Africa, 2013). The latter refers to the improvement of Eskom’s fleet performance and incentivising
production from existing non-Eskom generation. It completely ignores the role that distributed power
solutions using renewables can play in alleviating the shortage and meeting the electricity needs of the
people.
The second example comes from the Strategic Integrated Projects (SIP). The NDP for South Africa
incorporates the National Infrastructure Development Plan (mentioned above). The Infrastructure Plan
lists a series of ambitious and far-reaching initiatives aimed at transforming South Africa’s economic
landscape, addressing unemployment and improving basic service delivery. To this end, 18 SIPs have
been developed and approved by Cabinet and the Presidential Infrastructure Coordinating Commission
(PICC). The identified projects will provide new infrastructure, assist in terms of rehabilitating and
upgrading existing infrastructure, and will also play a crucial role in facilitating the regional integration for
African cooperation and economic development on the continent.
These SIPs, particularly those pertaining to the development of rail infrastructure, logistics and industrial
corridors, require increasing production of materials such as cement, aluminium, iron and steel, the
production of which is inherently carbon-intensive by nature. In the event that technology in these sectors
is limited, the costs associated with cleaner technological alternatives are high, the ease of adjusting
production processes to new cleaner technologies is low, the possible time frames for such adjustments
are high, and therefore emissions would increase drastically in these sectors.
EARTH, WIND AND FIRE
48
The third example comes from the proposed implementation of the carbon tax. First and foremost, the
analysis associated with the carbon tax as presented by National Treasury does not talk to how the tax
helps achieve the RBS scenario. Second, the proposal for the levy of the tax ignores the structure and
economic reality of different sectors. For example, the modes of electricity generation or the electricity
generation capacity mix are determined by the government through the IRP. Therefore, a carbon tax
will not alter the electricity mix. So, the emissions reduction possible from this sector would be limited to
that dictated by the IRP. Unless this is changed, the carbon tax is unlikely to result in the reduction of
emissions in this sector, which accounts for half of the country’s emissions. Moreover, given the structure
of the electricity sector, price signals to end-users by way of a carbon tax will not lower the carbon
intensity of the electricity fuel mix any further than what the government has already determined through
the IRP. Finally, the tax scheme ignores that IRP 2030 uses GHG emissions as a constraint in the underlying
modelling that determines the future electricity generation capacity. Specifically, it limits electricity sector
emissions to 275Mt per annum from 2025 in line with the PPD trajectory suggested by the LTMS.
The political settlement argument, complemented by the poor coordination between energy planning
and carbon tax, explains why the tax would not be effective in changing production or consumption
behaviour in the electricity sector. In the absence of intervention in the economic organisation of social
power and significant institutional and political retooling, the carbon tax would degenerate into an
added cost at all levels in the economy.
The issue at stake here is that the Constitution, architecture and functioning of the intertwined social,
economic and political power (enshrined in the political settlement) is not conducive to (at best) and
resists (at worst) tax and rent reforms. The MEC does not favour the carbon tax and has been vocal about
competitiveness impacts, job losses, and the further weakening of the mining and manufacturing sectors.
There has been little discussion of the new economic activities that could be incentivised by the tax, the
shift of the manufacturing base in the country to cleaner technologies and products, and investments in
the related capabilities. The implementation of the tax has been postponed from 2013 to 2016 and it
would not be wrong to say that the objective reality and the bargaining power of the MEC have played
a role in this shift in time frame.
PART 3: CLIMATE POLICY – LEARNING AND INSIGHTS FROM ELSEWHERE
In the country’s defence, it must be said that government’s ambivalent attitude to climate mitigation
and the failure to align energy and related policy to the envisaged future mitigation objectives is not
unique. Examples of intransigence in addressing climate change can be found in other countries. Also
highlighted are instances where governments have been proactive in implementing effective mitigation
measures and policies. The countries chosen are those that present an opportunity of learning for South
Africa. These include Russia, China, India and Brazil in their capacity as BRICS partners, facing similar
trade-off challenges to those of South Africa and including a mix of political regimes and natural
resources. As a counterpoint, Chile and Australia are included, as examples of two countries that seem
to be following divergent pathways to climate mitigation. Included as well is Canada, whose federal
model is an interesting example of the challenges posed by internal trade-offs, very similar to the trade-
offs required in the UNFCCC process in which jurisdictions of vastly different sizes, economic clout and
EARTH, WIND AND FIRE
49
commitment to climate action pursue their own interests (McCarthy, 2015).
Australia (ranked 60), the worst performing industrial country in the German Watch/CAN Climate Change
Performance Index 201527 (Burck, 2014), is like South Africa (ranked 37) (ibid.), abundant in low-cost coal
and with an energy mix dominated by coal-fired electricity generation and energy intensive industries
that make a significant contribution to economic growth, employment and regional development in
Australia (DIICCSRTE, 2013). Though its unconditional Copenhagen pledge involves a 5 per cent
reduction from 2000 levels by 2020 (Climate Action Tracker, 2014), emissions are set to increase
substantially under the Australian Government’s climate policies to more than 50 per cent above 1990
levels by 2020. The Copenhagen pledge, even if fully achieved, would allow emissions to be 26 per cent
above 1990 levels of energy and industry GHGs. In addition, it has reversed legislation, in particular
repealing the core elements of their Clean Energy Future Plan, effectively abolishing the carbon pricing
mechanism that sought to reduce their renewable target, and blocking other clean energy and climate
policy measures. This in spite of the effectiveness of the carbon pricing mechanism in reducing emissions
from the electricity and other covered sectors, reducing these by about 7 per cent per annum. Up until
the time of repeal, this reduction was projected to have been sufficient to meet Australia’s Copenhagen
pledge (Climate Action Tracker, 2014).
Then there is Russia (ranked 56) (ibid.), another resource rich country and the third largest emitter of
greenhouse gases after China and the USA, with one of the highest per capita energy-related CO2
emissions in the world (Matthews, 2014). Historically, Russia has made little effort to curb its carbon
emissions, and has felt little need to invest in renewable resources because of its enormous natural gas,
oil and coal resources (De Micco, et al. 2013). Ironically, Russia was one of the biggest benefactors of
carbon credits under the mechanisms of the Kyoto Protocol due to the severe downturn of its economy
in 1990. The economic recovery subsequently, and accompanying growth, has led to a growth of GHG
emissions, but Russia will remain in over-compliance with Kyoto targets without any mitigation measures,
as their carbon emissions are still lower. As a result, Russia (and other Eastern European countries) is not
subject to any real caps or incentives to reduce their emissions because their caps are calculated from
a high base of the USSR peak emissions (Lioubimtseva, 2010).
At this stage, nothing indicates that Russia intends to change direction. Russia has refused to join the post-
2013 extension of the Kyoto protocol. ‘Without the effort and dedication of a small group of committed
climate experts and stakeholders, Russia’s climate policy would boil down to a simple “green” image-
building exercise targeted towards other governments – much talk, very little walk’ (Kokorin and Korppoo,
2014). In spite of recently initiated legislation to address climate change, and Prime Minister Dmitry
Medvedev’s ‘willingness’ to consider limiting carbon emissions and support for renewable energy
investment – which is driven by economic rather than climate change issues – Russia will not deviate
27 On the basis of standardised criteria, the index evaluates and compares the climate protection performance of 58 countries that
together are responsible for more than 90 per cent of global energy-related CO2 emissions. The revised methodology is still primarily centred on objective indicators. Thereby, 80 per cent of the evaluation is based on indicators of emissions (30 per cent for emissions levels and 30 per cent for recent development of emissions), efficiency (5 per cent level of efficiency and 5 per cent recent development in efficiency), and renewable energy (8 per cent recent development and 2 per cent share of total primary energy supply). The remaining 20 per cent of the CCPI evaluation is based on national and international climate policy assessments by approximately 300 experts from the respective countries (Burck, 2014).
EARTH, WIND AND FIRE
50
much from the economically viable development path that is very close to a BAU trajectory that ‘rejects
additional costs associated with emission reductions’. To conclude, Russia is driven by economic and
geostrategic and political factors rather than issues relating to climate change and is pursuing a climate
change strategy that reflects the realities of local energy supplies – whether or not regions and states
possess significant reserves – as well as government’s pursuit of national security. It is, in other words,
impossible to draw a clear line between energy resources, climate policies and geopolitics (De Micco,
et al. 2013).
Chile, unranked by the Climate Change Performance Index 2015, presents quite a different picture and
speaks to countries’ pursuit of energy security. It has pledged an emission reduction level of 20 per cent
below BAU in 2020 (as projected from 2007), using a mix of measures such as Nationally Appropriate
Mitigation Actions (NAMAs). There has also been a change in government’s previous strategy to address
increasing demand, replacing additional coal-fired power plants with the development of LNG import
facilities and investment in oil and gas explorations. The government’s Energy Agenda 2014–2018 also
proposes additional policies that may contribute to further emissions reductions, and it implemented the
Non-conventional Renewable Energy Law, which aims to achieve a 20 per cent renewable energy
target in 2025 (Energy Tracker, 2014).
Chile is the fifth-largest consumer of energy in South America, but is only a minor producer of fossil fuels
and is heavily dependent on energy imports (EIA, 2014). It is the world’s leading copper producer, and
many copper mines in the country are powered by coal-fired power plants that rely on imported oil and
gas. Importing around four-fifths of its current fossil fuel demand is economically disadvantageous as well
as environmentally costly for Chile. Government’s view is that the private copper mining companies
should use technologies to reduce their pollutants or change the fuel that they use, and a carbon tax
will support this (Phillips, 2014).
In this context, the announcement made by President Bachelet in September 2013 that Chile intends to
enact new environmental tax legislation, making the country the first in South America to tax carbon
dioxide (CO2) emissions, comes as no surprise. The intention is to start measuring carbon dioxide emissions
from thermal power plants in 2017 and start charging the new tax from 2018. It will target the power
sector, particularly generators operating thermal plants with capacity equal or larger than 50 MW; while
thermal plants fuelled by biomass and smaller installations will be exempt. Four companies are expected
to pay the bulk of the new tax: Endesa, AES Gener, Colbún and E.CL., and these companies have
warned of price hikes in electricity rates and complained that other industrial sectors were excluded
(Teixeira, 2013).
Once again, while the proposed carbon tax points to a desire to mainstream climate change mitigation,
there are real economic and geopolitical factors underpinning climate change policies with energy use
particularly relevant given its links to economic structure and development. In the Chilean context this is
a viable prospect. Chile has vast renewable energy potential and in 2013 it doubled its renewable energy
target, requiring utilities to get 20 per cent of their power from renewable sources by 2025. It has extremely
high potential for solar power generation and has good wind power potential both on and offshore. It
EARTH, WIND AND FIRE
51
could also develop significant geothermal power by taking advantage of its position along the ‘Ring of
Fire’, a tectonic hot spot. Its renewable energy capacity grew 40 per cent in 2013 to just over one
gigawatt, and more than 10 times that capacity of energy has been proposed in other renewable
projects, most of which are solar (Phillips, 2014).
Canada, ranked 58th, is probably best known for its decision to withdraw from the Kyoto Protocol in
December 2011, only hours after the UN summit was over (Holmes, 2012). However, despite this, Canada
has maintained its target under the convention – a 17 per cent reduction in emissions below 2005 levels
by 2020, which translates to a 7 per cent increase in emissions from 1990 levels. On the face of it,
Canada’s Intended National Determined Contribution (INDC) submitted in May, and described as
‘inadequate’, is equivalent to a reduction of 2 per cent below 1990 industrial GHG emissions. However,
the inclusion of land use, land use change and forestry, and net-net accounting is likely to be the
equivalent of 11 per cent of 1990 industrial emissions (Climate Action Tracker, 2015).
What underpins the recalcitrance of Canada to commit more wholeheartedly to the climate change
mitigation project? Arguably, Canada is facing similar challenges to the UNFCCC where geopolitics and
disagreements over allocation of the cost of mitigation between North and South are standing in the
way of a binding protocol. Canada follows a federal model that translates into a ‘jurisdictional divide on
climate change’. While the provinces are responsible for natural resource management, including oil
and gas developments and their electricity sectors, the federal government regulates pollution and
greenhouse gases. Accordingly, all major sources of emissions contributing to climate change can be
addressed through both federal and provincial policies. This has resulted in some provinces taking the
lead, whilst others (such as Alberta and Saskatchewan), rather than acting to curb global warming
emissions, are investing heavily in more polluting industries, in particular the development of oil sand fields.
Although these two provinces only represent 14 per cent of the population and 10 per cent of the
economy, their GHG emissions are nearly five times what they are in the rest of the country (Holmes, 2012:
8).
Essentially, the debate is twofold with one camp arguing for:
... a level playing field with industries and citizens facing the same rules across the country — could
produce a dynamic environment with all provinces bringing their strengths and working together while
ensuring each region of the country takes responsibility for its impacts (Holmes, 2012: 9).
Whilst the other argues that:
Canadian climate policies [must] recognize and accommodate differences in regional circumstances,
similar to the recognition of national circumstances in the UNFCCC process (Gibbons, 2012).
Not surprisingly, Alberta and Saskatchewan favour the second option.
To date, the federal government has sidestepped the issue, which explains the uncoordinated, unilateral
action taken by each province and the federal government (Gordon and Macdonald, 2011). In allowing
provinces to determine their own climate policy, the federal government has managed to avoid setting
a more ambitious national target, and then meeting it – a difficult task to execute in a country ‘where
EARTH, WIND AND FIRE
52
the richest western provinces rely heavily on oil and coal for export and power, and the most populous
central Canadian provinces import virtually all their fossil fuels’ (McCarthy, 2015]. Essentially, and speaking
to other countries highlighted in this section, Canada faced the challenge of formulating and
coordinating a climate policy that reconciles the needs and strategies of a Chile with those of a Russia.
South Africa’s other BRICS partners, China, Brazil, and India, (ranked 45, 49 and 31 respectively by the
Index) (ibid.) have formally pledged under the UNFCCC to a quantified national-level or economy-wide
objective to limit the growth of GHG emissions. For China and India this objective is intensity-based,
expressed in carbon dioxide (CO2) emissions per unit of gross domestic product (GDP), with the aim to
reduce their economy’s CO2 intensity below the 2005 level by 2020, though in both countries the goal is
expressed as a range: a 40–45 per cent reduction in China, and a 20–25 per cent reduction in India.
Brazil, like South Africa, has set goals against BAU emissions projections in 2020, i.e. GHG emissions as they
are expected to be in the absence of new policy (Moarif and Rastogi, 2014).
In all three countries, climate change is not necessarily the single or principal driver of renewable energy
development. In addition, there are suggestions that both China and Brazil implement mitigation actions
as long as there are no other interests involved (Ucros, 2014). In instances where conflicts of interest
develop with environmental policies, both countries have prioritised development over climate
mitigation policies. This is also the case with India, which intends to drive its development by increased
imports of coal.
A more country perspective lens reveals the paradoxical nature of China to date. As the world’s largest
greenhouse gas emitter, it has a poor reputation on environmental issues and was regarded as
obstructive at the Copenhagen climate change talks in 2009. Subsequently, it has invested significant
resources into policies that reduce greenhouse gas emissions (Williams, 2014); mandated that state-
owned enterprises should purchase renewable electricity (Moarif and Rastogi, 2014); set quantitative
and binding energy targets to reduce energy intensity (energy consumption per unit of GDP) by 20 per
cent; and set goals for increasing ‘non-fossil’ – renewable and nuclear – energy to 10 per cent of its
primary energy. Nevertheless, China continues to be one of the world’s largest producers of coal, which
is also its dominant source of energy. Added to this is its commitment to economic growth, which
underpins poverty alleviation, social stability and, ultimately, government legitimacy, even if it is not
compatible with emission reduction targets.
Like China, India faces the twin challenges of fast tracking its development towards poverty reduction
on one hand, and on the other, responding to environmental threats like climate change by avoiding
and reducing rising greenhouse gas (GHG) emissions. India pledged to reduce the emission intensity of
its GDP by 20 to 25 per cent by 2020 compared to 2005 levels (Carbon Action Tracker, 2014). The country’s
National Action Plan on Climate Change released in 2008, with eight goals, covers both mitigation and
adaptation. It targets an increase in solar power generation as a key focus area to help the country
become a global leader in solar energy deployment, and the extension of access to electricity, energy
efficiency initiatives to yield savings of 10,000 MW by 2012, a 20 per cent improvement in water use
efficiency through pricing, and other measures to mitigate water scarcity that is projected to worsen as
a result of climate change, and afforestation of six million hectares of degraded forest lands, and
EARTH, WIND AND FIRE
53
expanding forest cover from 23 per cent to 33 per cent of India’s territory.
Subsequently, the government has taken various measures to develop renewable energy and now plans
to accelerate the deployment of renewable energy to more than 160 GW by 2022, including 100 GW
solar energy and 60 GW wind energy (MNRE 2015). It has launched an energy efficiency scheme based
on the Perform, Achieve, and Trade mechanism, whereby the country’s largest energy users are set
benchmark efficiency levels, with trade of energy savings credits occurring between participants who
exceed their targets and those who fail to meet them.
However, the Indian Government is clear that an environmental protection programme needs to be
calibrated to the country’s development needs that include expansion of infrastructure, home building
programmes, affordable energy generation, poverty alleviation, access to education, healthcare and
equal job opportunities (MoP 2015). The government believes that, for a country whose per-capita GDP
is a modest $1,500, it is unreasonable to burden the common person with significantly higher costs in the
present, considering the large investments required, while major polluters in the world have not done so
themselves during their own development period (MoP, 2015). It has been clear to state that, from a cost
perspective, while the trajectory of renewables looks promising, fossil fuel based thermal power continues
to be the cheapest source of electricity generation. Consequently, India aims to double the use of
domestic coal from 565 million tons in 2013 to more than a billion tons by 2019 (Harris, 2014). The
government is trying to sell coal-mining licenses as swiftly as possible after years of delay and has signalled
that it may denationalize commercial coal mining to accelerate extraction (Harris, 2014).
Brazil is sitting pretty by comparison, with 80 per cent of its electricity produced by hydropower (Ritti, 2015)
and it has been effective in using state-owned companies to establish a competitive biofuels market.
However, it is not clear if the emerging biofuel industry has been developed for environmental purposes.
Ucros (2014) argues that this industry is an initiative to create jobs – over 20,000 jobs – and to create a
stimulus for family agriculture. Brazil has also maximised its oil production rent by channelling funds into
preferential financing programmes benefiting climate mitigation activities (Moarif and Rastogi, 2014). It
has pledged to reduce its emissions by 36.1 per cent to 38.9 per cent in 2020 compared to BAU emissions.
According to the analysis of Climate Action Tracker (2014), the country will meet this pledge with current
policies.
Similar to China, Brazil needs to balance development objectives with environmental concerns. Its
Brazilian National Plan on Climate Change states unequivocally that ‘the government will support and
encourage the development of new industries on clean energy and technology as long as it contributes
to the country’s economic growth’ (Ucros, 2011: 20). This tension is clearly demonstrated by the trade-
offs between protecting its rain forest and agricultural needs. Much of Brazil’s climate policies focus on
combatting carbon emissions caused by deforestation, the largest source by far in Brazil (Ucrós, 2011).
The central pieces of policy are the national Forest Code, the Action Plan for Deforestation Prevention
and Control in the Legal Amazon (PPCDAm), and the Cerrado (PPCerrado) (Carbon Action Tracker,
2014). However, controlling deforestation is challenging. This is not only because much of it is done
illegally, but also because of Brazil developing into an agribusiness superpower, which has led to an
EARTH, WIND AND FIRE
54
increase in demand for farmland. Increased soybean production for the development of biofuel has
further exacerbated the situation (Ucros, 2011).
However, Brazil’s present energy mix might change dramatically in the near future, which could impact
considerably on its ability to fulfil its pledges. Hydropower has proven to be vulnerable to droughts. Its
biofuel industry is under pressure since the discovery of offshore oil reserves in 2007. Government has
contributed $60 billion of taxpayers’ money toward pumping up Petrobras and it has subsidised gasoline
and diesel, impacting negatively on the biofuel industry. Similarly, fossil fuels are seen as an alternative to
hydropower, and 70 per cent of the new energy investments in Brazil over the next decade, some $300
billion worth, are projected to go to fossil fuel projects (Ritti, 2015).
PART 4: RECOMMENDATIONS AND CONCLUSION
The objectives for the LTMS were for South African stakeholders to understand future scenarios for climate
action based on the best available information and provide the base for the development of long-term
national climate policy as well as positions for international negotiations. However, the LTMS and the
policies it inspired have not been wholly effective.
Given the complexity of the challenges highlighted in this chapter, coupled with the path dependency
of the MEC, and the maintaining of coal power plants, albeit with a ‘modest contribution’ from
renewable energy (Satgar, 2014),28 the question is whether policies can break the status quo and lead
to real change. Yet, this situation is not unique. The experience from other countries shows that policies
rarely address climate change in isolation; rather, they are designed to fulfil a range of parallel objectives,
be they energy security, reduced air pollution, economic restructuring, or targeted industrial
development (Moarif and Rastogi, 2014). Access to a ready supply of fossil fuels is a major hindrance in
the sustained roll-out of climate policy, as shown by Russia, Australia, and the backtracking of Brazil and
Canada.
What does this mean for South Africa? The country does not lack policies, strategies or climate-related
goals. The big bottleneck is the implementation of policy interventions and sector strategies that are
burdening not just the sectors covered by policies, but the country at large through adverse multiplier
effects. What is required are policy synergies that integrate the social and economic priorities of the
country, across and within government, specifically between policies for climate change, industrial
development, job creation, poverty reduction and the energy sector.
The government needs to exploit critical junctures such as the present electricity crisis to move beyond
short- and medium-term vested interests, as well as old policies and understandings and implement
solutions that deliver results. Critical junctures are moments when existing political and institutional
structures fail to provide either adequate solutions to pressing problems or explanations of challenging
28 This is also spelt out in the NDP – 2030, as follows: ‘South Africa has a rich endowment of natural resources and natural deposits, which, if responsibly used, can fund the transition to a low-carbon future and a more diverse and inclusive economy’ (South African Government, 2012 [provide correct date] in Satgar, 2014: 143).
EARTH, WIND AND FIRE
55
events, and thus lose governance legitimacy and their ability to determine action and interpretation
(Katznelson in Sorenson, 2015).
In critical junctures, the ‘structural constraints imposed on actors during the path-dependant phase are
substantially relaxed’. This provides an opportunity for ‘policy entrepreneurs and other actors to reshape
existing institutions and create new arrangements’. It provides the possibility of multiple futures, a ‘window
of political opportunity’, albeit still constrained by larger economic, political and ideological structures
and forces. However, actors can influence outcomes and, where there are ‘positive feedback effects’,
break the chain of path dependency and in so doing change the rules (Sorenson, 2015). If the new rules
become long lasting they have the potential to change the existing ‘patterns of distributional
advantage’ (Lowndes in Sorenson, 2015).
Recalling Milton Friedman, the politically inevitable is upon us. The transition from the politically impossible
to politically inevitable compels us to re-imagine and rethink our policy ‘utopia’ refracted through
Realpolitik (the dystopia of the working and functioning of the political settlement) and grounded in
material re-making of economics and development. Reconnecting real world economics and
transformative mitigation is the imperative.
References
Baker, L. 2013. ‘Low Carbon transitions in South Africa’s minerals-energy complex?’ Paper presented at
the International Initiative promoting political economy, International Social Sciences, The Hague.
Burck, J., Marten, F. and Bals, C. 2014. ‘The Climate Change Performance Index Results: 2015’. Available
at: http://www.legambiente.it/sites/default/files/docs/germanwatchccpi2015results8.12.14.pdf
[Accessed 8 June 2015].
Climate Action Tracker. 2014. Available at: http://climateactiontracker.org/ [Accessed 30 October
2014].
Climate ActionTracker. 2014. ‘Australia: Emissions set to soar by 2020’, December. Available at:
http://climateactiontracker.org/news/179/Australia-Emissions-set-to-soar-by-2020.html [Accessed 10
January 2015].
Cook, S., Smith, K. and Utting, P. 2012. ‘Green Economy or Green Society? Contestation and Policies for
a Fair Transition’, Occasional Paper Ten, November. Available at:
http://www.unrisd.org/80256B3C005BCCF9/httpNetITFramePDF?ReadForm&parentunid=B24EA25289BD
528AC1257AC5005F6CA5&parentdoctype=paper&netitpath=80256B3C005BCCF9/(httpAuxPages)/B24
EA25289BD528AC1257AC5005F6CA5/$file/10%20Cook-Smith-Utting.pdf
[Accessed: 11 October 2014].
Cornwall, A. and Brock, K. 2005. ‘What do Buzzwords do for Development Policy? A Critical Look at
“Participation”, “Empowerment” and “Poverty Reduction”’, Third World Quarterly, Vol. 26, No. 7, pp.
1043–1060.
EARTH, WIND AND FIRE
56
Death, C. 2014. ‘The Green Economy in South Africa: Global Discourses and Local Politics’, Politikon: South
African Journal of Political Studies, 41:1, 1–22, DOI: 10.1080/02589346.2014.885668
Available at: http://dx.doi.org/10.1080/02589346.2014.885668 [Accessed: 11 December 2015].
De Micco, P., et al. 2013. ‘Policy Briefing on EU and Russian policies on energy and climate change’,
Policy Briefing, December. Requested by the European Parliament's Delegation to the EU-Russia
Parliamentary Cooperation Committee. Available at:
http://www.europarl.europa.eu/RegData/etudes/briefing_note/join/2013/522304/EXPO-
AFET_SP(2013)522304_EN.pdf [Accessed: 4 April 2015].
Department of Energy, Republic of South Africa. 2013. Integrated Resource Plan for Electricity (IRP) 2010–
2030, Update Report 2013.
Department of Industry, Innovation, Climate Change, Science, Research and Tertiary Education
(DIICCSRTE)© Commonwealth of Australia. 2013. ‘National Communication on Climate Change A report
under the United Nations Framework Convention on Climate Change, Australia’s Sixth’, Available at:
http://unfccc.int/resource/docs/natc/aus_nc6.pdf [Accessed: 20 January 2015].
Fakir, S. and Gulati, M. 2012. ‘Carbon Tax in South Africa’. Presentation to Economic Development
Department and National Treasury, 18 May.
Gibbens, R. 2009. Sharing the Load. Addressing the Regional Economic Effects of Canadian Climate
Policy: A Critique of the Pembina Institute and the David Suzuki Foundation Study of the Economic
Implications of Reducing Greenhouse Gas Emissions in Canada. The West in Canada Research Series,
December. Available at: http://cwf.ca/pdf-docs/publications/sharing-the-load-december10-2009-
CWF-critique-of-pembina-suzuki-report.pdf [Accessed 8 June 2015].
Gordon, D. and Macdonald, D. 2011. ‘Intergovernmental Coordination in Australia and Canada’.
Available at: http://www.cpsa-acsp.ca/papers-2011/Gordon-Macdonald.pdf
[Accessed 8 June 2015].
Harris, G. 2014. ‘Coal Rush in India Could Tip Balance on Climate Change’, New York Times, November
17. Available at: http://www.nytimes.com/2014/11/18/world/coal-rush-in-india-could-tip-balance-on-
climate-change.html?_r=0 [Accessed 14 February 2015].
Held, D. and Hervy, A. F. 2009. ‘Democracy, Climate Change and Global Governance, Policy Network
Paper, November.
Holmes, M. 2012. ‘All Over the Map 2012: Institutions and Federal Climate Change Governance: a
Comparison of Provincial Climate Change Plans’. David Suzuki Foundation, March. Available at:
http://www.davidsuzuki.org/publications/downloads/2012/All%20Over%20the%20Map%202012.pdf
[Accessed 8 June 2015].
EARTH, WIND AND FIRE
57
Khan, F. and Mohamed, S. 2014. ‘From the MEC to the Green Economy Conglomerate:
Wiring a Green Economy-Green Society-Developmental State Circuit’, New Agenda: South African
Journal of Social and Economic Policy 56: 47–53.
Khan, M. 2013. 'Political Settlements and the Design of Technology Policy.' In: Stiglitz, J. and Lin, J. Y. and
Patel, E. (eds.), The Industrial Policy Revolution II. Africa in the 21st Century. London: Palgrave, pp. 243–
280.
Kokorin, A. and Korppoo, A. 2014. ‘Russia’s Greenhouse Gas Target 2020: Projections, Trends, and Risks’,
Friedrich-Ebert-Stiftung, April. Available at: http://library.fes.de/pdf-files/id-moe/10632.pdf
[Accessed: 15 April 2015].
Lioubimtseva, E. 2010. ‘Russia's Role In The Post-2012 Climate Change Policy: Key Contradictions And
Uncertainties’. Forum on Public Policy. Available at:
http://forumonpublicpolicy.com/spring2010.vol2010/spring2010archive/lioubimtseva.pdf
[Accessed: 30 March 2015].
Marquard, A., Trollip H. and Winkler, H. 2011. Opportunities for and Costs of Mitigation in South African
Economy. Republic of South Africa: Energy Research Centre, University of Cape Town and Department
of Environmental Affairs.
Matthews, H. D., et al. 2014. ‘National Contributions to Observed Global Warming’, Environmental
Research Letters, Vol. 9, no. 1. Available at: http://iopscience.iop.org/1748-9326/9/1/014010/pdf/1748-
9326_9_1_014010.pdf [Accessed 20 May 2015].
McCarthy, S. 2015. ‘Greenhouse Gas Emissions: Who’s Responsible for Climate Policy in Canada?’
The Globe and Mail, March 23. Available at: http://www.theglobeandmail.com/news/politics/canadas-
provinces-are-taking-the-the-lead-on-climate-but-should-they/article23583907/ [Accessed 9 June
2015].
Ministry of New and Renewable Energy, India. 2015. ‘PM To Inaugurate First Renewable Energy Global
Investors Meet On Sunday; Over 2500 Delegates and Exhibitors from 45 Countries To Participate In The
Three Day Event; Piyush Goyal Says RE-INVEST Aims To Project India As An Attractive Investment
Destination And To Evolve Innovative Financial Models’. Press release dated 13 February. Available at:
http://pib.nic.in/newsite/pmreleases.aspx?mincode=28 [Accessed 14 February 2015].
Ministry of Power. 2015. ‘Modi Government is Committed to Provide Affordable and Clean Power 24x7
For All’. Press release dated 12 January 2015. Release ID: 114557. Available at:
http://pib.nic.in/newsite/pmreleases.aspx?mincode=52 [Accessed 14 February 2015].
Moarif, S. and Rastogi, N. P. 2012. ‘Market Based Climate Mitigation Policies in Emerging Economies in
Emerging Economies’. Centre for Climate and Energy Solutions, December, Available at:
EARTH, WIND AND FIRE
58
http://www.c2es.org/docUploads/market-based-climate-mitigation-policies-emerging-economies.pdf
[Accessed: 20 April 2015].
National Treasury, Republic of South Africa. 2014. ‘CARBON OFFSETS PAPER. PUBLISHED FOR PUBLIC
COMMENT’. Pretoria.
Phillips, A. 2014. ‘Chile plans to enact the first carbon tax in South America’, April. Available at:
http://thinkprogress.org/climate/2014/04/08/3424238/chile-carbon-tax/ [Accessed 20 March 2015].
Ritti, C. 2015. ‘Could the oil drill kill Brazil?’ Brazilian Climate Observatory, 22 January.
Available at: http://www.trust.org/item/20150122112757-n3fyt/ [Accessed 15 March 2015].
Satgar, V. 2014. ‘South Africa’s emergent “Green Developmental State”?’ In The End of the
Developmental State, Michelle Williams (ed.), University of KwaZulu-Natal Press, p. 126–153.
Scholvin, S. 2014. ‘South Africa's Energy Policy: Constrained by Nature and Path Dependency’, Journal
of Southern African Studies, 40: 1, 185–202, DOI: 10.1080/03057070.2014.889361.
Available at: http://dx.doi.org/10.1080/03057070.2014.889361 [Accessed 10 February 2015].
Seguino, S. 2014. ‘How economies grow: Alice Amsden and the real world economics of late
industrialization’, Paper presented at the Alice H. Amsden Memorial Lecture, University of the
Witwatersrand, Johannesburg, South Africa, 4 September.
Sorensen, A. 2015. ‘Taking path dependence seriously: an historical institutionalist research agenda in
planning history’, Planning Perspectives, 30: 1, 17–38, DOI: 10.1080/02665433.2013.874299.
Available at: http://dx.doi.org/10.1080/02665433.2013.874299 [Accessed 28 January 2015].
Texeira, M. 2014. ‘Chile becomes the first South American country to tax carbon’, Reuters, September.
Available at: http://uk.reuters.com/article/2014/09/27/carbon-chile-tax-idUKL6N0RR4V720140927
[Accessed 20 May 2015].
The Guardian. 2013. ‘Japan under fire for scaling back plans to cut greenhouse gases’. Available at:
http://www.theguardian.com/global-development/2013/nov/15/japan-scaling-back-cut-greenhouse-
gases [Accessed 15 August 2015].
Therborn, G. 2014. ‘New masses?’ New Left Review 85, Jan./Feb., p. 7–16.
Ucrós, C. M. 2012. Climate Change Mitigation Policies in Developmental States: A Comparative
Approach to China and Brazil, London School of Economics and Political Science MSc China in
Comparative Perspective. Available at:
http://www.banrepcultural.org/sites/default/files/munoz_camila_tesis.pdf [Accessed 15 January 2105].
US Energy and Information Administration (EIA). 2014. ‘Overview of Chile’, July.

EARTH, WIND AND FIRE
59
Available at: http://www.eia.gov/countries/country-data.cfm?fips=CI [Accessed 15 January 2015].
‘United Nations Framework Convention on Climate Change’. Undated. Parties and Observers. Available
at: http://unfccc.int/parties_and_observers/items/2704.php [Accessed 17 June 2015].
Wainwright, J. and Mann, G. 2013. ‘Climate Leviathan’, Antipode, Vol. 43(1).
Williams, L. 2014. ‘China's Climate Change Policies: Actors and Drivers’, Lowy Institute for International
Policy, July. Available at: http://www.lowyinstitute.org/publications/chinas-climate-change-policies-
actors-and-drivers [Accessed 15 January 2015].
EARTH, WIND AND FIRE
60
CHAPTER 3
Historical Review of the Relationship between Energy,
Mining and the South African Economy
M. B. Ting
ABSTRACT
Mining, energy and industrial development have been key to growth and development in South Africa.
It is estimated that South Africa’s mineral wealth value is around $2.5 trillion (GCIS, 2012). Mining and the
electricity industry co-evolved together due to the abundance of inexpensive coal. The electricity
industry was spurred by the needs of a flourishing mining industry around the beginning of the twentieth
century. South Africa’s electricity industry is embedded in what is known as the Minerals-Energy Complex
(MEC). The MEC is described as the relationship between mining, energy-intensive mineral processing,
the coal-to-electricity sectors, and parts of the supportive transport and logistics infrastructure (Fine and
Rustomjee, 1996). However, the continued reliance of South Africa’s electricity system on coal is
increasingly under threat from international pressure to mitigate climate change. Additionally, sustained
dependence on a resource-based economy is risky, not only because of finite supply but, more
importantly, because emphasis on a global commodity market renders the economy vulnerable to short-
term volatile capital flows, and less long-term labour absorbing economic growth. The main objective of
this chapter is to discuss how South Africa faces the challenges and demands towards sustainable
transitions.
This chapter first provides a brief overview of South Africa’s mining and energy and the need for
sustainable development. After which, the underlying theoretical derivatives and framework are
discussed. Subsequently, it centres its discussion on interest, ideas, and institutions. It will analyse how
policies, discursive narratives and vested interests related to mining and energy have previously
interacted and currently interact, effectively creating barriers for the innovation of more sustainable
technologies.
As a way forward, a discussion takes place on a proposed implementation for sustainable mining and
energy that includes: the necessary requirements to adequately capacitate the socio-technical systems
that govern and implement mining and energy developments; continuous monitoring and evaluation
once policies are implemented; understanding the concept and implications of carbon lock-in given
the long-term life span of energy expansion; and meta-coordination of strategy implementation. Lastly,
a recommendation on further research is given on shifting from a resource-based economy towards a
knowledge-based economy. South Africa needs to go beyond beneficiation. Rather, it should expand
the process underlying the knowledge in obtaining these minerals and use it to diversify or enhance other
sectors of the economy. These could include technological innovation in the mechanisation process,
EARTH, WIND AND FIRE
61
machineries, parts, tools and equipment – all of which could spill over into important sectors such as
transportation, information technology, construction, and manufacturing.
INTRODUCTION
South Africa initially built its economy on two major primary sectors: mining and agriculture. Mining has
been the foundation of South Africa’s industrialisation and later the financialisation of the economy. Over
time, mining, energy and industrial development have been key to growth and development in South
Africa (Gentle, 2009; Winkler, 2009 and McDonald, 2009). It is estimated that South Africa’s mineral wealth
value is around $2.5 trillion (GCIS, 2012). A term to describe a tight configuration of industries associated
with mining is often called the Mineral Energy Complex (MEC) (Fine and Rustomjee, 1996). The MEC is
described as the relationship between mining, energy-intensive mineral processing, the coal-to-electricity
sectors and parts of the supportive transport and logistics infrastructure (Fine and Rustomjee, 1996).
Despite the recent years of poor performance of the mining sector, mining continues to be an important
part of the South African economy and this is unlikely to change for a few decades. South Africa has
many strategic minerals of global importance.
South Africa’s mining history and its relevance to its economy can be traced as far back as the discovery
of diamonds in Kimberley in 1871 and the Witwatersrand main gold reef in 1886. The wealth of its mineral
resources is evident with one of the largest reserves of Platinum Group Metals (PGMs), chromium, gold,
manganese (high grade ore), alumino-silicates, vanadium and other minerals in the world (Table 1). In
addition, the mining sector has also been a source of other competencies such as engineering, technical
and production expertise, and broad research and development activities. Most of South Africa’s
mineral wealth is exported as ores, concentrates, alloys or metals with some degree of beneficiation
downstream. The exceptions are iron and steel, as well as polymers from oil and coal, which are used as
inputs into the manufacturing sectors (ANC SIMS, 2012). As depicted in Table 1, the mineral wealth
reserves in the country have a long lifespan, and are expected to continue to play an important role in
the country.

EARTH, WIND AND FIRE
62
Table 1: A summary of South Africa’s mineral reserves and their relative global production percentages
(ANC Sims, 2012)
MINING AND ENERGY
Mining in South Africa and its associated sectors includes iron and steel, chemicals, non-ferrous metals,
non-metallic minerals, electricity and transport. The mining industry is also important to manufacturing as
it is linked via activities such as minerals beneficiation and metals production (Winkler, 2009) as well as
backward linkages in mining equipment. Therefore, the contribution of the MEC to the economy cannot
be viewed in isolation nor can it measured in absolute terms. The largest energy-intensive industrial
subsector in South Africa is iron and steel, which consumes around 27 per cent of the total energy used
by the industry sector (DOE, 2010). The South African mining and electricity industries co-evolved together
due to the availability and abundance of inexpensive coal. The electricity industry was spurred by the
needs of a flourishing mining industry around the beginning of the twentieth century (Gentle, 2009 and
Winkler, 2009). The major challenge for sustainable development in the context of climate change
mitigation lies in the energy sector, which accounts for more than 70 per cent of Green House Gas (GHG)
emissions. The share of final energy demand can be distributed as follows: industry (38 per cent),
residential (18 per cent), and transport (28 per cent) and other minor contributions (DOE, 2012).
Underlying the energy sector is an intensive coal-based system, the result of which is nine tons per capita
(tpc) of carbon emissions, rivalling that of Organisation for Economic Cooperation and Development
(OECD) countries with an average of 11 tpc (World Bank, 2010). Thus, a case for sustainable energy
development in the country is relevant because it is considered to be ‘carbon intensive’. The continued
reliance of South Africa’s electricity system on coal is increasingly under threat from international pressure
to mitigate climate change. Furthermore, resource-based economies are subject to finite supply and to
EARTH, WIND AND FIRE
63
global commodity cycles that are increasingly cognisant of trends towards environmental sustainability.
The main objective of this chapter is to provide insights into the barriers in South Africa’s mining and
energy complex that have to be addressed in order for sustainable development to be feasible.
FRAMEWORK
The analysis used for investigating the feasibility of sustainable energy development in the mining sector
was structured around an interests, ideas, and institutions framework (Figure 1). The main theoretical
derivative for this framework is drawn from Giddens’ (1984) structuration theory. Giddens (1984) defines
structuration theory as a means of understanding human social behaviour by analysing the interactions
between agency and structure. Agency is the capacity of actors who operate in a defined set of rules
and resources that are embedded in structures. According to Geels and Schot (2010), rules are described
as cognitive (belief systems, guiding principles, goals and search heuristics), regulative (standards, laws
and regulations) and normative (values and behavioural norms), (Geels and Schot, 2010). It is assumed
that actors are embedded in these structures, which are both a medium and outcome of action. For the
purposes of this chapter, rules and resources are framed according to three areas, namely: ideas,
institutions and interests.
Ideas refer to meaning and signification that is realised in practice. More specifically, it focuses its analysis
on discursive narratives, ideologies, belief systems, guiding principles, and mindsets that are related to
mining and energy in the country. Empirically, this chapter discusses the structure of the economy related
to mining and the role it may play in strategy or policy formulation around sustainable development,
historical availability of cheap coal and its relevance to trade and competitiveness, the recent trends in
the uncertainty around the oil price, the Long-Term Mitigation Strategy (LTMS), which has conscientised
the efforts needed to lower carbon emissions, and the role of labour and trade unions, which have
engaged in important debates in these and related issues.
In terms of institutions, these are socially embedded systems of rules through legislation and regulation;
not to be confused with organisations that are defined as groups of firms or networks of actors that are
assembled together by a collective purpose (Hodgson, 2006). To put it another way, institutions are rules
of the game and organisations are players that abide by these rules within a system. It is the interaction
between institutions and organisations that configure a socio-economic system. Relevant for this
chapter, institutions look at the legislative mandate governing the mining sector that enables the rules of
the game; financialisation that serves to strengthen profits and favour the MEC; the role of lobbying and
the influence of financial contributions to political parties and, lastly, the key Integrated Resource Plan
(IRP) that determines energy decisions in the country.
The last section is on interests and this refers to domination and how power is exercised. The aim is to
investigate influential groups and the power they may have in lobbying issues relative to their agendas.
These groups include the powerful MEC sectors, the influential role of the state-owned power utility,
Eskom, and continued reliance on coal for energy security.
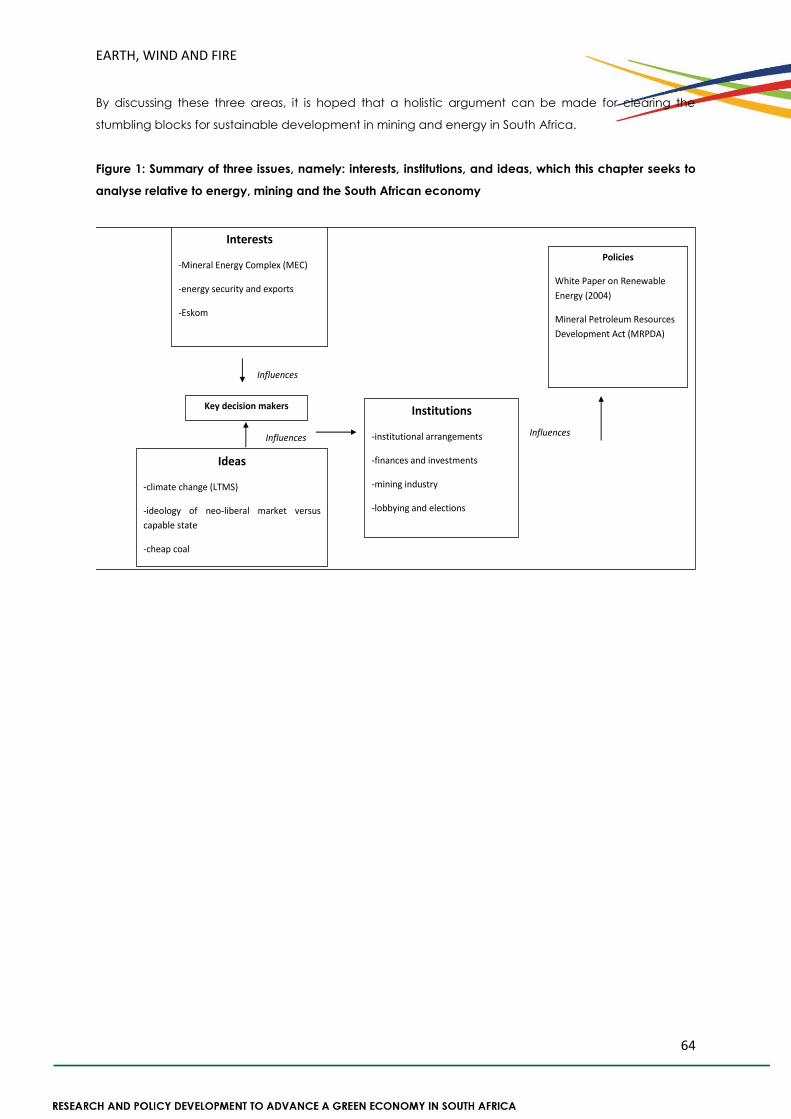
EARTH, WIND AND FIRE
64
By discussing these three areas, it is hoped that a holistic argument can be made for clearing the
stumbling blocks for sustainable development in mining and energy in South Africa.
Figure 1: Summary of three issues, namely: interests, institutions, and ideas, which this chapter seeks to
analyse relative to energy, mining and the South African economy
Interests
-Mineral Energy Complex (MEC)
-energy security and exports
-Eskom
Key decision makers Institutions
-institutional arrangements
-finances and investments
-mining industry
-lobbying and elections
Policies
White Paper on Renewable
Energy (2004)
Mineral Petroleum Resources
Development Act (MRPDA)
Ideas
-climate change (LTMS)
-ideology of neo-liberal market versus
capable state
-cheap coal
Influences
Influences Influences
EARTH, WIND AND FIRE
IDEAS
South Africa’s mineral wealth is due mostly to its platinum reserves, followed by coal, palladium, gold,
titanium, copper and others. The biggest mining companies in South Africa have significant investments
within the Johannesburg Stock Exchange (JSE), and these also belong to an Energy Intensive Users Group
(EIUG), which collectively (including associated industries such as materials beneficiation and materials
manufacturing) account for 44 per cent of electricity demand in the country (EIUG, 2015). Furthermore,
mining provides critical foreign exchange via trade exports; it contributes around 20 per cent to the GDP
(direct and indirect) and is an important source of jobs in the country. It is estimated that a social multiplier
for mining is a ratio of 10 to 1, thus, given the employment of 1.3 million people, the totality of people
dependent on the mining industry can be as high as 13 million. The mining sector is built upon a model
of high labour and low wages. However, to what extent this will continue in the future remains unclear,
not only because of increasing trends towards mechanisation, but also because of instability within the
labour force and wildcat strikes.
Furthermore, the inter linkages of growing inequality and social unrest cannot be ignored because most
miners earn wages that are not adequate to support large families. However, this labour model is
historically derived and embedded within the socio-economic framework. It should be appreciated that
sustainable energy development is only a part of a complex set of problems that policymakers need to
address. The country is experiencing developmental challenges that include widening inequality (Gini-
coefficient of 0.6), an unemployment rate of 25 per cent, and slow real economic growth of less than 2
per cent GDP per year. Sustainable energy development is part of a much wider set of issues facing the
country. To move forward it is important for key decision-makers to realise that some of the underlying
issues are rooted within ideologies that constrain advancement.
The following sections will now discuss key ideological issues.
Coal as the Dominant Resource
Coal accounts for 70 to 75 per cent of primary energy supply, 93 per cent of electricity generation and
30 per cent of petroleum liquid fuels (Eberhard, 2011; Winkler and Marquard, 2009; Winkler, 2009; Davidson,
2006). Coal production and consumption are intricate parts of the economy. The revenues are derived
from a range of activities from export, mining to the manufacture of synthetic fuels. South Africa has rich
coal reserves, albeit low in quality (high ash content). The low-grade coal has an average of 4,500 kcal
per kg, ash content of 29.5 per cent and sulphur of 0.8 per cent (Eberhard, 2011). The approximated coal
reserve stands at 32 billion tonnes making it the world’s largest recoverable deposit (World Energy Council,
2010). South Africa’s energy landscape has historically been tied to the strategic needs defined by the
government at specific times. Therefore, between 1948 and 1994, the main imperative from the
government was energy independence and self-sufficiency (particularly as it grew isolated from the
international community due to sanctions and other forms of isolation). Thus, the apartheid government
decided to secure its energy supply by utilising the coal to liquids (CTL) process for fuel production,
meaning that large quantities of both electricity and fuel are produced from coal: the former is provided
by Eskom and the latter by Sasol. Sasol is the world leader in the processing of coal to synthetic fuels,
having started production in the 1950s. It produces more than 40 per cent of South Africa’s domestic fuel
66
EARTH, WIND AND FIRE
66
and contributes 4 to 5 per cent of the country’s GDP. Coal accounts for more than 90 per cent of the
electricity produced in the country; the rest comes from nuclear power stations (5 per cent), hydro and
pumped storage (4 per cent), as well as biomass, solar, and wind, which together account for less than 1
per cent (Heun et al., 2010; Pegels, 2010; Davidson, 2006; Winkler, 2005).
Sasol and Eskom have a combined carbon dioxide emission of 300 million tonnes (Mt), which accounts
for 67 to 69 per cent of the total GHG output (Raubenheimer, 2011; Sasol 2010; UNSD, 2008). Coal is an
entrenched regime with powerful industrial players that have a huge role to play in the country’s
economy. To what extent the country reduces its reliance on coal is certainly a central issue in terms of
barriers to sustainable development. It is this balance between ensuring energy security through its rich
coal reserves, but also through simultaneous sustainable practices, which require the least economic
trade-offs. However, choosing carbon-intensive pathways that continue to lock in and reinforce business
as usual practices may in fact undermine desired developmental goals. Sustainable development can
offer ways of diversifying the economy in a manner that is in line with global trends towards greener
economies.
The Challenge of Cheap Coal and Electricity
The availability of inexpensive coal was critical to the establishment of the mining and electricity
industries. The term ‘mineral energy complex’ (MEC) was developed by the seminal study called The
Political Economy of South Africa, by Fine and Rustomjee, in 1996. The MEC has fundamentally formed
the energy economy of the country, which in turn has a major role in the energy landscape of the
country. The close involvement of the MEC has resulted in the country having one of the lowest electricity
prices in the world. It is reported that South Africa’s electricity prices were consistently 40 per cent of
average United States prices for the last four decades (Winkler and Marquard, 2009). In fact, Eskom,
through its association with the MEC, has taken advantage of large economies of scale in coal mining
and power generation. Thus, guaranteed demand meant that favourable contracts could be
negotiated over the long term. Furthermore, most of Eskom’s assets relating to electricity generation had
been paid off, which means that its expenditure was limited to low running costs. Although South Africa
has known since 1997 – as shown in its White Paper on Energy – that an electricity deficit would be
reached by 2007, no major new plants had been commissioned by this time. Thus, with an ageing
electricity infrastructure and lack of maintenance due to low generation reserves, the country has
undergone a series of blackouts since 2008. This means that, for a period of seven years, the country has
been experiencing uncertain electricity supply. To mitigate electricity shortfalls, diesel generators have
been used at significant cost. Unfortunately, the country’s state-owned power utility has recently faced
a series of credit downgrades, and the cost of using diesel has only aggravated this situation and has
serious implications for its ability to borrow money for new energy builds.
Cheap coal and cheap electricity have been central to South Africa’s competitiveness. Specific
industrial policy has promoted electricity intensive investments such as mineral processing (Winkler and
Marquard, 2009). Moreover, special electricity supply contracts between, for instance, Eskom and BHP
Billiton and its aluminium smelters were revealed in 1992, and again in 2001, showing sales at below cost
prices. The special deal had effectively tied Eskom to supplying BHP Billiton with cheap electricity for more
67
EARTH, WIND AND FIRE
67
than 20 years. To this day, these special deals continue to stress Eskom’s finances. However, new
electricity builds require financing and the reality of cheap electricity cannot continue. Any adjustments
to the dominant paradigm in the electricity sector are bound to have an impact on energy prices, as
well as the labour force, and disrupt a huge source of investment and income for the country. Cheap
electricity can no longer be considered for new plants. The present new build programme, irrespective
of the sources (coal, nuclear or renewables), has to factor in current levelised costs.
Coal and its Relevance to Civil Energy and Households
It is important to note that coal not only provides the country with significant liquid fuels but it is also a
means for government to provide basic energy access. ‘Civil energy’ has been described as a social
development goal by providing energy to households, commerce and services (Winkler and Marquard,
2009: 51). Energy is crucial for lighting, cooking, heating, clean water and sanitation, health care,
transport, industries and telecommunication. A strong narrative of the post-apartheid government was
to address the imbalances of the past by ensuring basic services such as ‘electricity for all’. Almost two-
thirds of the South African population did not have access to basic electricity before 1994. The rapid
electrification programme resulted in electrification rates that grew from 30 per cent in 1990 to 73 per
cent in 2006 (Winkler and Marquard, 2009). Household electricity access and final energy residential
demand should not be confused. As referred to earlier, in the context of overall energy demand, the
share of residential consumption stands around 15 per cent, but electricity access to the national grid
is currently around 70 to 80 per cent.
Thus, post-1994, South Africa had a period where the available electricity infrastructure did not match
the rapid growth in demand. At present, the country suffers from a double ‘lock-in’ of a high carbon
pathway due to the dominance of the MEC, but also its continued reliance on coal for its civil energy.
Civil energy is a strong principle for government because it is a developmental objective for energy
access. Historically, this meant access to grid connection with coal as the main resource. This carbon
lock-in makes it difficult to address issues of sustainable energy development because there are sunken
investments, entrenched regimes, and historical vested interests. Thus, in an energy policy setting, it can
be appreciated that a complexity of issues has to be carefully considered.
Influence of Labour: The Role of Trade Unions
Carbon cycles do not follow political cycles, in that climate change requires a long-term vision. Its effects
are anticipated in the medium term, which, though beyond the duration of most politicians’ careers,
requires immediate action. Hence, the certainty of mitigating options such as renewable energy needs
strong arguments so as to achieve buy-in from sectors that will ensure their implementation. In this respect,
one has to factor in the influence of members of society and their awareness of the effects and mitigation
of climate change. Moreover, people’s sentiments equal votes, which cannot be underestimated given
that this is the lifeblood of politics.
while voters tend to be strongly supportive of the idea of compliance with the international
environmental treaties, they can simultaneously be strongly resistant to the reality of higher taxes
and energy prices … the political incentives thus can be very different between ratification and
68
EARTH, WIND AND FIRE
68
implementation of that international commitment … Harrison and Sundstrom (2007: 15).
In South Africa, a sector that is influential and important to the vote is that of the trade unions.
Attending to the issues raised by them will constitute the surest route to electoral success
(Stedman, 1994: 191).
Through the Tripartite Alliance, it is often the case that the South African Communist Party (SACP) and
Congress of South African Trade Unions (Cosatu) field their preferred candidates through the African
National Congress (ANC), and consequently hold senior positions in the ANC as well as influence party
policy and dialogue (Johnson, 2011). There are influential people who hold various positions in one or
more of the parties that constitute this alliance. Added to this complexity is that the trade unions emerged
mostly from minerals and mining sectors. Hence, their significance cannot be underestimated since it
permeates both the political and economic spheres. In addition, hundreds of prominent unionists now
play leading roles in institutions of the new South Africa and are able to influence the broader processes
of change that are unfolding. Thus, a formidable group of people from politicians, trade unionists, to
business people are all interlinked with each other.
The effects of continued mining strikes in the country are indicative of how intricately the mining sector is
embedded in the economy. The five-month platinum strike from January to June 2014 resulted in
economic contraction during the first quarter of that year by as much as 0.6 per cent. Mining strikes had
an effect on manufacturing, as well as industries that included petroleum, basic chemicals and iron ore
(Singh, 2014). In addition, tensions within Cosatu and its affiliates have resulted in the exit of the National
Union of Metal Workers of South Africa (Numsa), which accounts for an estimated 17 per cent of Cosatu’s
membership (Letsoalo, et al. 2014). Part of the tension in this regard derives from contestation over
economic policy, and this cannot be taken lightly. It can lead to policy formulation that is logical, but
often hampered at the implementation stages due to the tensions among various actors. Evidence of
this is the National Development Plan (NDP), which has ambitious, bold plans for the country and yet
seems to be hampered at the level of implementation due, in part, to these tensions. As long as these
ideological mismatches are not addressed, they will continue to be a source of policy incoherence and
implementation inertia.
Uncertain Oil Price
In a world where the oil price has been assumed to take an upward trajectory, energy investments are
decided accordingly. These pertain to new projects in oil and gas exploration and production, as well as
renewable energy technologies. Often these investments are decided on the basis of economic costs
particularly associated with the price of crude oil. However, the basis of these assumptions no longer
holds, given that between June 2014 and January 2015 the oil price dropped by 60 per cent. Thus,
associating energy investments with the prediction of an oil price is becoming increasingly uncertain.
Added to this are unpredictable geopolitics, global economic developments and competing alternative
energy options. Renewable energies are also increasingly on par in terms of economic costs in
comparison to new fossil fuel derived plants. A good example is the cost of some solar technologies
becoming competitive with natural gas. Again, these expectations may change as the oil price
69
EARTH, WIND AND FIRE
69
fluctuates. The main point is uncertainty, particularly since there are now more competing energy sources
available. Conversely, it has been noted that, in spite of these uncertainties, the development of flex/fuel
engines can provide ways to bypass such ambiguities. Again, under these conditions an important
balance is needed in choosing the optimal technology that caters to societal needs. South Africa does
have huge amounts of coal reserves; potential shale gas in the Karoo region, and the Northern Cape is
an ideal place for renewable solar plants. Moreover, there are examples of a hybrid solar Photo Voltaic
(PV) cell usage combined with diesel engines at a scale of 1 MW being used in Chile and South Africa
(Lazenby, 2014; Chadbourne, 2014). Perhaps a modular approach of hybrid engines comprising solar
energy with gas could be applicable to South Africa given its historical transmission configuration and
natural endowments.
Long-term Mitigation Scenarios (LTMS)
In 2007, the Long-Term Mitigation Scenario (LTMS) project was published (See Chapter 2 of this book). This
landmark project developed various scenarios using energy and macro-economic models to explore the
consequences of various policy interventions at reducing GHG emissions (Winkler and Marquard, 2009).
The LTMS proposed that the country peak its carbon emissions by 2025, plateau for a decade and then
decline thereafter (DEAT 2007: 5). This process is known principally as ‘peak, plateau and decline’ (PPD),
a common phrase in the country’s climate change circles. According to the Department of
Environmental Affairs (DEA), the PPD was defined as an upper limit of 428 million tonnes of carbon dioxide
(Mt)/per annum in 2050 and a lower limit of 212 MT/per annum CO2. A scenario in the IRP update was
that electricity-derived carbon emissions would peak around 275 Mt/pa CO2 in 2022, plateau for 10 years,
and start to decline around 2034. The decline scenario was either moderate, which would result in
reaching 210 Mt/pa CO2 in 2050, or an aggressive decline that would enable a low limit of 140 Mt/pa
CO2. However, it is estimated that the two new coal-fired power plants (Kusile and Medupi) and the return
to service of three stations mothballed in the 1990s, are expected to have a combined coal consumption
of over 50 Mt per year, adding more GHG emission in the near future (IEA, 2009). The approximate
additional emission is 30 MT of CO2 annually (Rafey and Sovacool, 2011). The LTMS study was important
because it showed clearly the requirements for the country to reduce its future carbon emissions.
However, with two new coal plants, and more coal plants envisioned in the future, South Africa's energy
policy can be characterised as somewhat contradictory: on the one hand, it promotes sustainable
development whilst, on the other, it seems to be increasing its reliance on the extraction and consumption
of polluting (and unsustainable) resources.
INSTITUTIONS
Mineral and Petroleum Resources Development Act (MPRDA)
Currently, the main legislative framework for mining and petroleum resources in South Africa is the
MPRDA, which is under review. The most relevant section regarding sustainable development pertains
to environmental authorisation and management. This section covers cross-cutting issues such as water,
environment and licence to operate. According to the Department of Mineral Resources (DMR), it will
designate itself as the Competent Authority for the implementation of the National Environmental
Management Act (NEMA) on mining and prospecting sites, and the Minister of Environmental Affairs will
be the appeal authority. The DMR has noted that a single piece of legislation implemented across
70
EARTH, WIND AND FIRE
70
departments will require resources and, more importantly, coordination, particularly on areas of
monitoring and evaluation of compliance (DMR Annual Report 2013). Coordination is one of the critical
issues in implementing policies and strategies in government. This requires inter- and intra-departmental
coherent efforts where delineating ownership, responsibility and accountability are paramount.
Furthermore, various amendments to the MPRDA do send signals of legislative uncertainty to the mines
on the conditions they should operate in, as well as which policies are applicable. Thus, speedy
resolution of these issues, which is a key factor in private sector decision-making, is critical.
Adding to this complexity is the need for nexus thinking, where interlinking issues need to be tackled
holistically. According to the Mining Charter codes of good practice, environmental management is
captured under sustainable development and growth. However, these standards are more reactive-
based practices relative to compliance and monitoring and not enough towards pro-active measures.
The DMR does have state-owned entities (SOEs) under its jurisdiction, such as Mintek and the Council for
Geosciences, where excellent research and development are taking place. If a nexus approach were
to interlink energy, water and waste as a means of ensuring sustainable development in the mining
sector, more interdisciplinary research needs to take place in these areas. South Africa is not only a
water scarce country with a carbon-intensive energy system, the legacy of mining is showing, with major
signs of cumulative waste such as acid mine drainage. Solutions to these issues could enhance or
complement a more efficient process as environmental externalities can no longer continue to be on
the periphery.
Influence of the Business Lobby on Political Parties and Elections
South African legislation that currently governs elections is the Electoral Act of 1998 and the Public Funding
of Represented Political Parties Act of 1997. The former requires parties to commit to: free electioneering,
equal participation of women in political activities, allowing media access to electioneering activities,
and full cooperation with the Independent Electoral Commission (IEC) (Lodge and Scheideggar, 2005).
The latter determines the amount of money allocated to parties relative to the number of seats in both
the national and provincial legislatures. The proportional amount accounts for 90 per cent of the funding
and the remaining 10 per cent is on the basis of a threshold payment (Robinson and Brummer, 2006 and
Lodge and Scheidegger, 2005). The main concern with regard to these two acts is the complete absence
of matters pertaining to private funding. Lodge and Scheideggar (2005: 17) observed:
… there are no legal limits on how much parties can spend on electioneering or any requirements for
disclosure of the sources or amounts of private donations …
Thus, rich benefactors can (intentionally or unintentionally) become indispensable sources of funding with
hidden or visible motivations attached to such funding. According to Saffu (2002), in Africa, countries
without disclosure laws outnumber those with by a ratio of five to one. In the Southern African
Development Community (SADC) region, the majority of member states (Lesotho, Mauritius, Malawi,
Seychelles, South Africa, Tanzania, Zambia and Zimbabwe) do not have disclosure provisions for privately
raised political party and campaign funds. Namibia is an exception – while it does not require full
disclosure it obliges the disclosure of foreign donations. (Weissanbach, 2011) further pointed out that
71
EARTH, WIND AND FIRE
71
transitional states and young democracies tended to have fewer disclosure regulations. Of the 27
countries in Africa surveyed, 66 per cent did not have financial disclosure in place. This is indicative of
apathetic accountability on this issue and it has serious implications, particularly for resource-rich
countries. Collier (2007) stated that the natural resource trap is where bad governance in resource-rich
countries leads to the stifling of the economy. Furthermore, there is a tendency for minimal regulation in
these countries, undermining their capacity to gain full control of the sector. Combined with this is a huge
propensity to rely on guaranteed sources of income. As such, the state is less held to account by the
people.
In resource-rich countries, the implications of this abuse are increasing linkages between political
sponsorship and the advocacy of self-interests, cronyism and party funding (Robinson and Brummer,
2006 and Dunnigan, et al. 2005). Besides direct contributions to the parties, it would seem that, in order
to gain the sympathy of the ruling party, many companies could buy influence by transferring some
portion of their assets to favoured groups in the context of Black Economic Empowerment (BEE).
One consequence of BEE is the emergence of a symbiotic relationship between those in power and
those who are now empowered in important economic sectors. Robinson and Brummer (2006)
indicated that with the allegiances between these two groups comes certainty, which is an enviable
corporate asset. In South Africa, a study revealed that in the 1999 election period the political parties
spent in the order of R300 million to R500 million on their election campaigns, but only R66 million came
from public money (Robinson and Brummer, 2006). There is no legislation at present that forces political
parties to declare their funding sources. The ANC secretary-general at the time, Kgalema Motlanthe
(South African president from 2008 to 2009), revealed that the ANC was heavily reliant on donor funding.
It was reported that the ANC receives the largest share of South African corporate funding amounting
to 70 per cent (Lodge and Scheidegger, 2005). This report went further in identifying that the key donors,
amongst others, were the ‘mining sector’ (Lodge and Scheidegger, 2005: 18). Civil society is
campaigning for transparency in the identification of funders, which could go a long way towards
tackling the links between economic interests and political influence, to the extent that such influence
can impact negatively on socio-economic policy, including matters to do with the environment.
However, without disclosure laws, it is easier for businesses to field their interests through politicians by
some form of influence peddling in exchange for guaranteed investment deals. Given the entrenched
nature of mining and energy in the country’s history, it should be appreciated that underlying interests
in keeping the status quo are not easy challenges to overcome.
Integrated Resource Plan (IRP)
The Department of Energy (DOE) has updated its Integrated Resource Plan (IRP) with a decrease in
demand from 454 terawatt-hours (TWh) to a range of 345 TWh–416 TWh by 2030 (DOE, 2013). Thus, a
reduction of demand meant a decrease of 6.6 gigawatt (GW) of electricity capacity required. The IRP
update was very clear that modelling energy demand on the basis of an economy with high GDP
growth and a significant shift away from energy-intensive industry would be difficult to accomplish (DOE,
2013: 24). What was more realistic was a lower GDP forecast with minor changes in industry structure.
Thus, energy investment decisions had to take into account enough supply based on realistic demands,
but not over supply that would result in stranded capacity (DOE, 2013: 24). Ultimately, the IRP update
72
EARTH, WIND AND FIRE
72
argued that the more aggressive the constraint was for carbon emission, which included carbon taxes,
the greater the cost to the country’s economic competiveness. This is an important narrative to take
note of: the country does not foresee decoupling carbon emission from economic growth at a cost to
overall development. Again, balancing key issues of competitiveness with climate change mitigation is
a constant debate within the country. In other words, it would seem the sentiment is that appropriate
economic growth for the country should not limit overall developmental goals and, while GHG
mitigation is important, it may not be the most significant or decisive factor.
Financialisation
Financialisation is a term that is used by some to describe a combination of short-term capital inflows with
a long-term outflow of capital through offshore listing of domestic corporations (Ashman, et al. 2011). The
issue is important to this chapter because the MEC is a classic example of such finanicialisation. As South
Africa’s financial sector and system has matured (rated the strongest in Africa), so the financialisation of
the MEC has become a dominant feature of the mining sector (Ashman, et al. 2011). The MEC
developments have favoured short-term portfolio-based capital inflows rather than foreign direct
investments, which are long-term in nature (Ashman, et al. 2014). The extent to which this has evolved is
demonstrated by the size of stock portfolios the mining companies occupy within the Johannesburg
Stock Exchange (JSE). The JSE market capitalisation is more than double the size of the actual economy,
which is part of the global speculative commodity markets resulting in prices that are often not matched
by production costs and demand (Isaacs, 2014). The MEC has historically favoured a more exclusive
model – at first, the development and wealth creation of a white minority and, later, over the last 20
years, the new black elite as well as international capital. The political economy of the MEC itself, in turn,
has a big influence on the structure and ethos of other parts of the economy as the inter-linkages
between elites are strengthened. An emphasis on a global commodity market renders the economy
vulnerable to short-term volatile capital flows and less long-term labour absorbing economic growth.
Essential for transformative change in the country is less focus on short-term shareholder value, addressing
the dependency on the MEC, and identifying new areas of the economy that can be de-linked from the
MEC.
South Africa faces huge problems that will take years to fix. These include a high current account deficit
(6 per cent of GDP), low economic growth and continued labour friction, given infrastructure backlogs,
an inadequate education system, and toxic labour relations. When there is macro-economic volatility,
the rand exchange rate has to bear the brunt of this adjustment process (Isaacs, 2014). Furthermore,
profits from the MEC need to be structured in a way that addresses long-term investment in the country
and used appropriately to achieve development objectives, including the diversification of the
economy.
INTERESTS
Mineral Energy Complex (MEC)
The MEC is a set of activities that locked in and co-evolved several industries together: intensive mining,
mineral processing, the energy sector and associated industries. As a result, the MEC over time was central
to the South African economy. Alongside this dominance is the integration of economic sectors across
73
EARTH, WIND AND FIRE
73
mining, manufacturing and finance. Therefore, the contribution of the MEC to the economy cannot be
viewed in isolation, nor can it be measured in absolute terms. In a sense, South Africa suffers from a double
‘lock-in’ of a high carbon pathway dependency due its dominant MEC, but also reliance on coal for its
domestic energy derived from the MEC. The MEC also includes powerful and influential actors in the energy
landscape. A system of accumulation of capital is manifested within the MEC, where consolidation of
power in the hands of a few players has resulted in the creation of powerful and influential actors over
energy and economic policy, as well as access to and distribution of investment (Takala, 2008). The MEC
system had effectively incorporated different parts of the economic sectors through various forms of
control, ownership and its relations with the state (Mcdonald, 2009). The dominance of the mining industry
intrinsically gave way to a political economic system yielding to its requirements. This is reflected in energy
policies that are geared towards promoting the interests of the MEC; these include macroeconomic
stability that ensured suitable mineral exports, the creation of state-owned enterprises (such as Eskom),
which are largely involved in minerals and energy, and a labour market that was used to ensure a steady
supply of low-cost labour (Takala, 2008). Thus, the level at which the MEC is entrenched and fluid within the
economic structure of South Africa poses a formidable challenge in finding a potential space for alternative
sources of energy (other than fossil fuel).
Eskom
In order to consider sustainable energy development in the country, it is necessary to take into account
the dominant relevance of Eskom. This company has a 95 per cent stake in the sector and is vertically
integrated into the system. It is responsible for the generation, transmission and distribution of electricity.
The national utility is one of the largest electricity utilities in the world. It was ranked thirteenth in the world
by generation capacity in 2008 (EGI-SA, 2010). The majority of its customers are in mining, manufacturing
and industry. Eskom has undergone a series of transformations over the years, particularly when it was
converted into a tax-paying public company under the Companies Act, fully owned by the state (EGI-
SA, 2010; Gentle, 2009; Gaunt, 2008). Eskom’s direction changed from that of a public interest to that of
a corporation.
Eskom had to ensure the shareholder’s objectives were met, meaning that government and Eskom were
now closely aligned (Gaunt, 2008). Conversely, the Municipal Electricity Undertakings (MEUs) are owned
by the municipal councils, which, in their governance, are in turn accountable mostly to customers and
voters in the local community, giving rise to a different set of objectives (Gaunt, 2008). Therefore,
competing interests exist, particularly on issues surrounding increasing electricity costs. A mindset can
then develop in which Eskom’s main imperative is seen as ensuring profit while MEUs tend to address
electricity price affordability. Given that Eskom is entrenched, and a significant monopoly in the energy
system in the country, it will take some time to attain a different balance in the industry. In this regard,
the Independent Systems Market Operator (ISMO) Bill has been proposed for more than a decade. It is
a bill that would facilitate the introduction of Independent Power Purchasers (IPPs) to the system,
providing competition in electricity generation, and result in the unbundling of the current monopoly.
However, at present, the bill has almost been rejected in its totality because, among others, it would
undermine the state’s leverage in the energy industry and would cause too much disruption in the
context of the current generation shortfalls. So the dominance of Eskom remains, although the recent
74
EARTH, WIND AND FIRE
74
introduction of IPPs may change the balance somewhat. The issue of decoupling state-owned energy
supply to the mines also arises in this context. Furthermore, the issue of privatisation has been debated
for over a decade, but the preference within the state is to retain the status quo rather than restructuring
the entire electricity system. With the current challenge of load-shedding, the poor financial position of
Eskom, lack of progress in new energy builds, and inconsistent leadership at Eskom, critical questions are
starting to be asked about the proportion of IPPs in the system and funding models for Eskom, which
may include a sale of part of the company’s equity.
The ISMO bill is a good example of how competing interests continue to hamper energy reforms. As
previously discussed, Eskom has had mutually reinforcing relationships between its large and intensive
users, indicative of its historical ties to mining. Eskom depends on a few privately owned coal companies.
Furthermore, the majority of its customers are represented by 31 large industrial consumers known as the
Energy Intensive Users Group (EIUG), which accounts for 44 per cent of the electricity consumption (EGI-
SA, 2010). The five biggest coal companies are Anglo-American, Xstrata, BHP Billiton, Sasol mining and
Exxaro (Eberhard, 2011). Thus, the nucleus of economic growth and electricity infrastructure had started
from Mpumalanga Province due to rich coal and mining activities, and then stretched to the main cities
as the economy grew. As a result, the large industrial users have incurred minimal distribution costs and
this, in essence, has created a two-tier system. Eskom has a first tier customer base of industrial users and
a second tier service to the municipalities (Rustomjee, 2014). Thus, any major structural changes to Eskom
would cause instability, price uncertainty and disruption of the mutually entrenched relationship with its
existing users (Rustomjee, 2014), not to mention the possible economic impact it may have, as the main
imperative at present is to ensure short-term electricity supply with future grid stability.
The current electricity crisis in the country is focusing energies on urgent short-term solutions, and
sustainable development may not receive adequate attention and may be relegated to the long-term.
Thus, managing between these time frames is one of the key issues that will require attention in defining
energy projects. Without such a balance, the outcome may be to lock the country into business as usual
with more fossil fuel derived resources such as coal. However, greener options towards more renewables
are available and need to be pursued. Thus, despite well-informed reports such as the IRP update, or
LTMS, with parallel uncertainties in future oil prices or global commodities demand, it should be
appreciated that bold decisions are neither easy nor sequential. It is often repeated that vested interests
among a few players, particularly associated with the MEC, are key to energy investment decisions. As
long as these vested interests continue to dominate, and as long as they do not change their own
paradigms, deviations from the norm will confront persistent barriers. In the recent period, a number of
these large corporations have offered to contribute to electricity generation using gas (e.g. SASOL) or
even the more innovative fuel cell technology which uses a significant level of platinum group metals
(PGM). The latter, if it ever takes off in earnest, may open up possibilities for a new MEC relationship as it
combines beneficiation with green technology (in that, the by-product of the fuel cell generation
process is water).
Energy Security and Coal Exports
Another strong challenge for Eskom relates to the prospect of increased demand for low-grade coal.
75
EARTH, WIND AND FIRE
75
Traditionally, Eskom has had a reliable source of coal because it was of low quality and not suitable for
export. South Africa depends on its export revenues and coal accounts for the third largest export after
gold and platinum (Nkomo, 2009). Additionally, export revenues do not only fund the country’s import
expenses, they are also used for the development of new industrial sectors (NPC, 2011). This is a recurrence
of the country’s dependence on the MEC. The demand for RB3 low-grade coal has increased, particularly
in countries such as India and China. The quantity of coal imported by India rose by eight per cent in
March 2011 (Energy Global, 2011). Subsequently, Eskom is lobbying the government to recognise coal as
a ‘strategic national resource’ ensuring that it takes priority relative to energy security (Creamer, 2011).
Diversifying South Africa’s use of resources away from coal and into renewable energy will take time, and
so it will remain a critical asset. This reiterates the number of competing dynamics to be considered, both
in the short- and the long-term.
Cosatu, Climate Change and the Green Economy
The Congress of South African Trade Unions (Cosatu), with approximately 1.8 million members (StatsSA,
2005), is the largest trade union federation. Until recently, the single biggest affiliate was the National
Union of Mineworkers (Num) with 300,000 members. The largest union affiliate is now the National Union
of Metalworkers South Africa (Numsa), which, at the time of publication, was fighting its expulsion from
the federation. Cosatu has a structured alliance with the ruling party, namely the African National
Congress (ANC) and the South African Communist Party (SACP), which together form the Tripartite
Alliance (Piper and Matisonn, 2009; Webster, 1998; Mckinley, 2001). There are major policy dialogues that
occur within this alliance and it is an important source of information for the current ruling party, the ANC
(Mohanty, et al. 2011; Webster and Buhlungu, 2010; Buhlungu, 2008).
According to Cherry (2006), Cosatu has a multifaceted interaction with, and influence on, government
by means of the following:
Advocacy (for example social security for the poor, job creation and privatisation)
Negotiations in the National Economic Development and Labour Council (Nedlac)
Working through political processes of the Tripartite Alliance
Mass mobilisation (such as action through collective strikes)
These structures of communication cannot be understated because they can have significant
implications when it comes to implementing policies that may or may not be welcomed by Cosatu. There
is a tendency for the majority of the people to support mass action as a complementary strategy for
putting pressure upon elected politicians if the government fails to deliver promised benefits, most notably
demonstrated in ‘service delivery protests’ (Mohanty, et al. 2011 and Buhlungu, et al. 2008). Mass and
repeated strike action over prolonged periods of time can cripple the economy. Thus, Cosatu is central
to the ongoing dynamics within government policies and strategies, especially at the grass roots level, as
well as government, industrial sectors, and civil society.
The Mixture of Business and Politics
The most significant development in this sector has been BEE deals which have resulted in black-owned
coal companies controlling more than 30 per cent of South African coal production. The largest BEE
76
EARTH, WIND AND FIRE
76
deal of 2003 illustrates the lack of breadth in the empowerment process. The deal was between
ARMGold and Avmin for R10.6 billion. Analysis revealed that at least 72 per cent of the total deal value
benefited six narrow-based black consortia (some of which have politically well-connected
beneficiaries) (Dunnigan, 2005). The emergence of large black operators in an economy that had been
solely dominated by whites is not a backward step as such. However, the transfer of wealth from one
elite group to another – without a structural change in the path dependency – mostly perpetuates old
patterns of social inequality. The system of wealth accumulation and the continued privilege of elites
need to be confronted in the broader process of transformation. This skewed distribution of wealth has
also resulted in the creation of powerful actors that are influential in determining the energy policies of
the country. Moreover, this lopsided distribution of wealth may in fact keep the division of the ‘two world
economy’. The two world economy refers to one end of the spectrum where South Africa has high living
standards and access to infrastructure (which includes the basics such as electricity, water and
sanitation) that are comparable to those in more developed countries (Mcdonald, 2009 and Winkler
and Marquard, 2009). However, at the other end is the poor population who lack access to basic living
standards (housing, health, education and energy). This disproportionate situation is primarily due to the
legacy of apartheid, which has embedded many socio-economic challenges and issues.
WAY FORWARD
As a way of understanding this multitude of issues, a framework by Voss and Kemp, 2005, is discussed.
They proposed a reflexive governance approach whereby formulating policies should be an exercise of
flexibility and adaptability. Since sustainable energy development is a complex issue, knowledge from
various sources is required. Knowledge production cannot only rely on scientific sources; it also needs to
take into account the needs of societal actors (Voss and Kemp, 2005). There is a need to create
‘integrated knowledge production’ that enables information, not only from within the boundaries of
science and policy, but transcends these towards society in general (Voss and Kemp, 2005: 10). In terms
of uncertainty, future energy development cannot be predicted with precision, nor can it be predicted
for its systemic effects. Therefore, a level of ‘adaptivity’ and flexibility is needed relative to the institutions
and technological systems that govern implementation (Voss and Kemp, 2005: 11). An important factor
here is to capacitate the system to respond to changes adequately and proactively. Moreover, a
continuous system of monitoring and evaluation needs to be in place once policy implementation starts.
Energy investments have a long lifespan and changing trajectories is not easy as prior technologies are
path dependent or lock in for a certain timeframe. Specific patterns are realised, and stabilise within
social values, institutions and societal systems. An example here is coal-derived electricity. Most people
need a consistent and reliable electricity supply, and whether the source is carbon-intensive is usually a
secondary matter. Therefore, an energy technology choice needs to take into consideration the long-
term systemic effects. South Africa continues to be locked into a carbon intensive energy system, and
some may argue that business as usual needs to continue because coal is abundant and cheap.
However, South Africa needs to ask itself whether current efforts to gradually extricate itself from this
carbon-intensive system are adequate, and how stakeholders within the energy and sustainable
development community can work together towards optimal solutions.
77
EARTH, WIND AND FIRE
77
Strategy implementation requires meta-coordination, not only within and among government
departments, but also with various stakeholders. Major factors to consider for implementation are: 1) the
project must have a defined champion with clear mandates; 2) there should be sufficient institutional
capacity where projects are aligned to mainstream and existing initiatives at scale; 3) create a
conducive and supportive context for policy, regulation, and planning, and ensure ownership of the
integrated process; 4) ensure that projects are aligned to national priorities which should assist in
mainstreaming and alignment with broader mandates or enhance existing mandates and, lastly; 5) there
must be sufficient technical capacity to enable the project to be sustainable.
Among the measures required to reduce the country’s dependency on the MEC would be to take up in
earnest the opportunities opened up by the knowledge-based economy. This will ensure that the country
is more resilient to volatile commodity markets, and is less reliant on primary resources. The experience
from the mining industry can stand the country in good stead, particularly with regard to the knowledge
base that includes production or process engineering, as well as research and development. An
important consideration is to focus not only on the continuous output of mining resources and seeing the
minerals as an end in themselves. Rather, the knowledge underlying the processes of obtaining these
minerals should be utilised to diversify or enhance other sectors of the economy. Examples could include
technological innovation in mechanisation process, machineries, parts, tools and equipment – all of
which could spill over into important sectors such as transportation, information technology, construction
and manufacturing. Good economic policy and planning that have clear growth and development
objectives should dictate how mining investments flow and how revenues or income generated from the
mining sector are managed for the benefit of society as a whole.
CONCLUSION
There is no doubt that mining in the country will continue to be a dominant sector in the years to come.
However, the sector is undergoing major challenges that cut across significant issues that are at the heart
of the country’s developmental goals that include labour, economic growth and unemployment. The
role of the MEC is indicative of the entrenched regime that the mining sector plays within the economy.
The MEC has broadened itself into a system of wealth accumulation and has integrated large sectors
that include mining, transport, manufacturing and finance. As was discussed, the EIUG is also one of the
biggest companies in the mining sector, as well as the JSE. Due to a system of wealth accumulation,
there are a handful of players in this sector and thereby also a few powerful actors that are influential in
determining key policies and strategies. Thus, the argument in this chapter is that vested interests within
the MEC are key in understanding the implementation of energy policies in the country.
The issue of ideological mismatch between a developmental state and a more neo-liberal economy is
a fundamental obstacle. The influence and the role of trade unions cannot be overstated: major policy
dialogues take place within the Tripartite Alliance. Unbundling Eskom has been stalled several times and
is part of a larger privatisation debate that encompasses the nationalisation of mines and selling off some
of Eskom’s assets. The ideological mismatch has to be tackled because it is a root cause for policy
incoherencies and implementation inertia.
The subject of financialisation is indicative of a need for major reform in the structure of the economy.
78
EARTH, WIND AND FIRE
78
Investments made by the mining sector that favour profits flowing out of the country instead of long-term
financial investments are compounding developmental challenges. These include uneven wealth
distribution mostly skewed towards elitism and wealth concentration, thus inequality persists. The JSE total
market capitalisation is twice the size of the actual economy. The emphasis on a commodity market
renders the economy vulnerable to short-term volatile capital flows, and not necessarily long-term labour
absorbing economic growth. The current energy crisis provides an opportune moment to revisit the
country’s mining economic policy.
References
African National Congress (ANC). 2012. ‘State Intervention in the Minerals Sector (SIMS)’.
Ashman, S., Fine, B. and Newman, S. 2011. ‘The Crisis in South Africa: Neoliberalism, Financialization, and
Uneven and Combined Development’, Socialist Register, 47: 174–195.
Besada, H. 2007. ‘Fragile Stability Post-Apartheid South Africa’. Working paper no. 27, Centre for
International Governance Innovation (CIGI).
Bronkhorst, Q. 2014. ‘These are the biggest listed companies in South Africa’. Available at:
http://businesstech.co.za/news/general/59253/these-are-the-biggest-listed-companies-in-sa/
[Accessed 1 December 2014].
Buhlungu, S. 2008. ‘Gaining influence but losing power? Cosatu members and the democratic
transformation of South Africa’, Social Movement Studies, 7(1): 31–42.
Buhlungu, S., Southall, R., Webster, E. 2008. ‘Cosatu and the democratic transformation of South Africa’
in Buhlungu, S. (ed.) Trade Unions and Democracy, Cosatu Workers Political Attitudes in South Africa,
Cape Town: HSRC Press.
Chadbourne, 2014. ‘Renewable energy near mines’. Available at:
http://www.chadbourne.com/Renewable_Energy_Near_Mines_projectfinance/
[Accessed 1 June 2014].
Collier, P. 2007. The Bottom Billion, Why the Poorest Countries are Failing and What Can be Done About
It. Oxford, UK: Oxford University Press.
Creamer, T. 2011. ‘Eskom lobbying for a new coal dispensation to shore up domestic supply’, Engineering
News. Available at:
http://www.engineeringnews.co.za/article/eskom-lobbying-for-a-new-coal-dispensation-to-shore-up-
domestic-supply-2011-01-26 [Accesssed 1 March 2011].
Davidson, O. 2006. ‘Energy Policy’ in Winkler, H. (ed.), Energy Policies for Sustainable Development in
South Africa. Options for the Future. Energy Research Centre (ERC), University of Cape Town, South Africa.
79
EARTH, WIND AND FIRE
79
Department of Energy (DoE). 2010. Strategic Plan 2010/11–2012/13. Pretoria, South Africa.
Department of Energy (DoE). 2012. ‘Draft of the Second National Energy Efficiency Strategy of the
Republic of South Africa’, Pretoria, South Africa.
Department of Energy (DoE). 2013. Integrated Resource Plan for Electricity (IRP). 21 November 2013
update.
Department of Environmental Affairs and Tourism (DEAT). 2007. ‘Long-Term Mitigation Scenarios (LTMS)’,
Technical Summary, Pretoria, Scenario-building Team (SBT), Pretoria.
Dunnigan R., Fazaeli, K., Spies, J. 2005. ‘Black economic empowerment – difficulties and opportunities in
making right the wrongs of the past’. Available at:
http://faculty-course.insead.edu/dutt/emdc/projects/Sep-Oct05/Group_D.pdf
[Accessed 1 March 2012].
Eberhard, A. 2011. ‘The future of South African coal: market, investment, and policy challenges’, Working
Paper 100, Program on Energy and Sustainable Development (PESD). Stanford, California, USA: Stanford
University.
Electricity Governance Initiative – South Africa, (EGI-SA). 2010. The Governance of Power – Shedding a
Light on the Electricity Sector in South Africa. Cape Town: IDASA.
Fine, B. and Rustomjee, Z. 1996. The Political Economy of South Africa: From Minerals Energy Complex to
Industrialization. London: C. Hurst.
Gaunt, C. T. 2008. ‘Electricity distribution industry restructuring in South Africa: a case study’,
Energy Policy, 36: 3448: 3459.
Geels, F. W. and Schot, J. 2010. ‘The Dynamics of Transitions: A Socio-Technical Perspective’, in Grin, J.,
Rotmans and Schot, J. (eds.) Transition to Sustainable Development, New Directions in the Study of Long-
term Transformative Change. New York: Routledge.
Gentle, L. 2009. ‘Escom to Eskom: from racial Keynesian capitalism to neo-liberalism (1910–1994)’ in
McDonald, D.A. (ed.) Electric Capitalism, Recolonising Africa on the Power Grid. UK: Earthscan, Dunstan
House.
Giddens, A. 1984. Constitution of Society. Berkley and Los Angeles, CA, USA: University of California Press.
Government Communication Information System (GCIS). 2012. ‘Mineral resources’, Pocket Guide to
South Africa 2011/2012.
Harrison, K. and Sundstrom, L. M. 2007. ‘Introduction: The comparative politics of climate change’,
80
EARTH, WIND AND FIRE
80
Global Environmental Politics, 7 (4): 1–18.
Heun, M. K., Nieker, J. L., Swilling, M., Meyer, A. J., Brent, A., Fluri, T. P. 2010. ‘Learnable lesson on
sustainability from the provision of electricity in South Africa, Proceedings of the ASME 2010’, 4th
International Conference on Energy Sustainability. Phoenix, Arizona, USA, 17–22 May 2010.
Hodgson, G. 2006. ‘What are institutions?’ Journal of Economic Issues, XL: 1–25.
International Energy Agency (IEA). 2009. ‘Key world energy statistics, 2008’, International Energy Agency,
Paris, pp. 14–15.
Issacs, G. 2014. ‘The financialization of South African Economy and the havoc it wreaks’. Available at:
http://www.sacsis.org.za/site/article/1959 [Accessed 1 June 2014].
Kotze, C. 2014. ‘JSE resource listings plunge 50% in last 20 years but total market cap now a massive R2.82
trillion’. Available at: http://www.miningweekly.com/article/number-of-jse-listed-miners-decrease-while-
market-capitalisation-in-resource-sector-increases-2014-08-08
[Accessed 1 December 2014].
Lazenby, H. 2014. ‘Six cronimet projects progress to next South African IPP round’. Available at:
http://www.miningweekly.com/article/six-cronimet-projects-progress-to-next-south-african-ipp-round-
2014-03-10 [Accessed 1 December 2014].
Letsoalo, M., Mataboge, M., Huner, Q. 2014. ‘Cosatu split, how the ANC will suffer’. Available at:
http://mg.co.za/article/2014-11-13-cosatu-split-how-the-anc-will-suffer
[Accessed 1 December 2014].
Lodge, T. and Scheidegger, U. 2006. ‘South Africa country report based on research and dialogue with
political parties’, International Institute for Democracy and Electoral Assistance (IDEA).
Mcdonald, D. A. 2009. Electric Capitalism, Recolonising Africa on the Power Grid. UK: Earthscan, Dunstan
House.
McKinley, D. T. 2001. ‘Democracy, power and patronage: debate and opposition within the
African National Congress and the Tripartite Alliance since 1994’. Democratization, 8 (1): 183–206.
Mohanty, R., Thompson, L., Coelho, V. S. 2011. ‘Mobilising the state? Social mobilization and state
interaction in India, Brazil and South Africa’, Institute of Development (IDS) Working Paper, 359.
Nkomo, J. 2009. ‘Energy and economic development’ in Winkler, H. (ed.) Energy Policies for Sustainable
Development in South Africa. Options for the Future. Energy Research Centre (ERC), University of Cape
Town, South Africa.
Paton, C. and Marrian, N. 2014. ‘Cabinet leaning to break up Eskom’, Business Day. Available at:
81
EARTH, WIND AND FIRE
81
http://www.bdlive.co.za/business/energy/2014/08/05/cabinet-leaning-to-break-up-of-eskom
[Accessed 1 December 2014].
Pegels, A. 2010. ‘Renewable energy in South Africa: Potentials, barriers and options for support’, Energy
Policy, 38: 4945–4954.
Piper, L. and Matisonn, H. 2009. ‘Democracy by accident: The rise of Zuma and the
renaissance of the tripartite alliance’, Representation, 42 (2): 143–157.
Rafey, W. and Sovacool, B. K. 2011. ‘Competing discourses of energy development: The implications of
the Medupi coal-fired power plant in South Africa’, Global Environment Change, 21 (3): 1141–1151.
Raubenheimer, S. 2011. ‘Facing Climate Change: Building South Africa’s Strategy’, IDASA. Cape Town:
Unity.
Robinson, V. and Brümmer, S. 2006. ‘SA democracy incorporated. Corporate fronts and political party
funding’, Institute of Security Studies (ISS) paper 129.
Rustomjee, Z. 2014. ‘Vested interests have hijacked energy policy’, Business Day, Opinion and Analysis, 19
December 2014.
Saffu, Y. 2002. ‘Where money meets politics: Exploring policy options to regulate the influence of private
funders on South Africa politics’, Paper prepared for the ISS seminar, 31 October – 1 November 2002,
Leriba Lodge, Centurion, South Africa.
Sasol. 2010. ‘Annual review and summarized financial information, focused and energized’.
Singh, S., 2014. ‘Effects of the mining strikes on the South African economy’. Available at:
http://www.miningreview.com/effects-of-the-mining-strikes-on-the-south-african-economy/
[Accessed 20 December 2014].
Stedman, S. J, 1994. South Africa, the Political Economy of Transformation. Boulder, Colorado, USA: Lynne
Rienner Publishers.
Takala, L. 2008. ‘The role of industrial policy and the minerals-energy complex in the decline of South
African textiles and clothing’. The 11th Annual Global Conference of The Competitiveness Institute (TCI),
Cape Town, South Africa, 27–31 October 2008.
United Nations Statistics Division, (UNSD). 2008. ‘Millennium Development Goals indicators: Carbon
dioxide emissions (CO2)’.
Voss, J. P. and Kemp, R. 2005. ‘Reflexive governance for Sustainable development – incorporating
feedback in social problem solving’. Paper for International Conference of the European Society for
Ecological Economics (ESEE) Lisbon, Portugal, 14–17 June 2005.
82
EARTH, WIND AND FIRE
82
Webster, E. C. 1998. ‘The politics of economic reform: Trade unions and democratization in
South Africa’, Journal of Contemporary African Studies, 16(1): 39–64.
Webster, W. and Buhlungu, S. 2010. ‘Between marginalization and revitalisation? The state of trade
unionism in South Africa’, Review of African Political Economy, 31 (100): 229–245.
Weissenbach, K. 2011. ‘Party finance and party competition in dominant multi-party systems: the case of
South Africa’, Paper presented at the IPSA-ECPR Joint Conference: What happened to North-South? 16–
19 February. Sao Paulo, Brazil: University of Sao Paulo.
Winkler, H. 2005. ‘Renewable energy policy in South Africa: policy options for renewable electricity’,
Energy Policy, 33: 27–38.
Winkler, H. 2009. Cleaner Energy Cooler Climate. Developing Sustainable Energy Solutions for South
Africa. Cape Town, South Africa: HSRC Press.
Winkler, H. and Marquard, A. 2009. ‘Changing development paths: From an energy-intensive to low-
carbon economy in South Africa’, Climate and Development, 1: 47–65.
World Bank. 2010. Available at: http://data.worldbank.org/indicator/EN.ATM.CO2E.PC
[Accessed 1 May 2015].
World Energy Council. 2010. Survey of Energy Resources, 22nd edition. London, United Kingdom.
83
EARTH, WIND AND FIRE
83
CHAPTER 4
Lost in Procurement: An Assessment of the
Development Impact of the Renewable Energy
Procurement Programme
Fumani Mthembi
… but is it [development] that is being understood here or is its identity being evaded in reducing it to a
subset of practicable measurements?29
ABSTRACT
This chapter analyses the socio-economic development impact of the Renewable Energy Independent
Power Producers Program (REIPPP) in communities where renewable energy farms are located. A
number of limitations were observed and these limitations result from a range of factors such as
incomplete development targets, the reluctance of independent power producers to make investments
in socio-economic development, an absence of a shared understanding of development and, most
critically, a weak monitoring system. Therefore, this chapter argues that the design of the on-grid
procurement system, which explicitly and laudably sets out development targets for independent power
producers, is undermined by its conflation of compliance with development impact. In other words, the
failure to tease out the meaning and full potential of development through this sector is producing results
that fall short of and, in some instances, completely subvert the transformation intent behind the state’s
procurement of on-grid renewable energy. The chapter identifies 10 key themes to demonstrate the
missed opportunities with respect to development since the sector’s inception in 2011. Based on this,
solutions are proposed that incorporate an expanded interpretation of development into the existing
monitoring system to ensure that the state is measuring the right factors and independent power
producers are incentivised to invest in and account for impactful rather than check-box development.
INTRODUCTION
Development can be defined in multiple ways. Cowen and Shenton argue that ‘one of the confusions,
common through development literature is between development as an immanent and unintentional
process … and development as intentional activity’30. In truth, the alternatives presented by Cowen and
29 Adapted from Luke, T. W. 1995. ‘On Environmentality: Geo-Power and Eco-Knowledge in the Discourses of Contemporary Environmentalism’, Cultural Critique, No. 31, The Politics of Systems and Environments, Part 3, pp. 57–81 ‘but is it the environment that is being understood here or is its identity being evaded in reducing it to a subset of practicable measurements?’ 30 Cowen M. and Shenton, R. 1998. Doctrines of Development. London: Routledge.
84
EARTH, WIND AND FIRE
84
Shenton represent the extreme ends of a single spectrum. In other words, this characterisation is almost
akin to free market versus state-controlled economics, with mixed economy variations lying somewhere
in between. What this paper is assessing – the Renewable Energy Independent Power Producer
Procurement Programme (REIPPPP) – resides in the ‘mixed economy’ zone as – although defined by the
state – it is an initiative aimed at liberalising South Africa’s energy sector by including private companies
in power generation. In other words, our concern is intentional development.
What this chapter seeks to demonstrate is that, in some cases, the Department of Energy has not
succeeded in matching development intent with development practice and that, while in the short run
the negative impacts of these shortcomings are not obvious, the long-run social risks stemming from this
dissonance are substantial. Indeed, the title phrase of this paper, ‘Lost in Procurement’, is a pun derived
from the expression ‘lost in translation’, which indicates an instance in language translation that does not
allow for the full meaning of one language to be captured in another. Similarly, it is argued in this chapter
that the full meaning of development is lost or compromised when it is translated into the current
language of compliance, which is expressed through the REIPPPP’s Economic Development framework.
More fundamentally, however, it is important to appreciate that the notion of development is value-
laden. Its articulation is a function of how society perceives itself and its related, collective aspirations31.
To determine the meaning of development, this chapter anchors itself in South Africa’s vision for itself as
expressed in the National Development Plan: ‘… by 2030, we seek to eliminate poverty and reduce
inequality. We seek a country wherein all citizens have the capabilities to grasp ever broadening
opportunities available.’32 Therefore, this chapter’s analysis of the DOE’s economic development
framework, as set out for the on-grid renewable energy sector, seeks to determine whether each target
and, crucially, the observed practices linked to the implementation of each target, make our intent, our
national vision for development, more or less attainable.
What is patently clear is that ‘you cannot manage what you don’t measure’ and, therefore, it is not
compliance as the act of measuring that this paper argues against. Instead, it is the assumption that the
current compliance framework as expressed through Economic Development (ED) obligations is a
sufficient means for the attainment of development. The chapter therefore assesses ED in terms of
poverty reduction, the expansion of capabilities and long-term sustainability of socio-economic
investments. In doing this, the chapter seeks to unpack and propose solutions to how best to deliver value
for money through the current economic development framework. It is necessary to state upfront that
the current ED framework is seen as a sound foundation or starting point. What is thus suggested is
augmentation rather than a complete overhaul of what is already in place. This point is supported by
other researchers who, having assessed South Africa’s procurement legislation, conclude that what is
necessary is improvement upon what exists rather than the creation of something entirely new.33
31 Chambers, R. 1997. Whose Reality Counts? Putting the First Last. London: ITDG. 32 National Planning Commission. 2011. National Development Plan. 33 Turley, L. and Perera, O. 2014. ‘Implementing Sustainable Public Procurement in South Africa: Where to
Start?’ IISD Report.
85
EARTH, WIND AND FIRE
85
What we seek to critically discuss then is state procurement in the context of the Renewable Energy (RE)
sector. Renewable energy, being newly liberalised in South Africa,34 presents an opportunity to achieve
greater development impact through the design, implementation and monitoring of the sector’s
procurement system. This system, REIPPPP, which began in 2011, is a competitive bidding process through
which the state, as the sole buyer of energy for the national electricity grid, assesses the proposals of
Independent Power Producers (IPPs). The state’s assessment is based on two factors: price, which is linked
to finance and technology, as well as economic development, which is comprised of seven elements
(which will be discussed in the background section of the chapter). For the purposes of this chapter, it is
economic development (ED) that is placed in the spotlight in order to make evident the nature and
urgency of the misalignment between the intentions of the programme and the practices that pervade
its implementation. Each element of economic development is dealt with in detail, barring local content.
This issue requires dedicated separate attention given its interplay with local manufacturing and thus, the
Industrial Policy Action Plan (IPAP 2).
RESEARCH AND ANALYSIS APPROACH
Because the sector is new, many assessments have tended towards descriptions of its machinations and
its expected outcomes based on bid submissions. For example, Eberhard, et al. published a paper in 2014
titled ‘South Africa’s Renewable Energy IPP Procurement Program: Success Factors and Lessons’ which
provides a comprehensive history of REIPPPP and includes statistical data on the sector’s composition
and trends thus far. The economic development impact of the sector, which is linked to a 20-year outlook
(pegged to the length of Power Purchase Agreement (PPA), has not been dealt with in much detail
owing to an absence of data. It is true that there is not sufficient data at this point to comment on whether
the right social investments were made towards community development, for example.
However, what are immediately observable are sector practices in relation to economic development.
It is these practices that are already providing a rich set of clues into how various stakeholders perceive
development. They also reveal weaknesses in the DOE’s monitoring mechanisms and, critically, point
towards the generation of social risks that cannot be captured or punished using the current measures.
As is known, it is the protracted under-appreciation of social risk that results in violent and expensive forms
of social upheaval. Certainly, cases such as Marikana35 reveal that a dogmatic marriage to suboptimal
technocracies will, in the long run, result in total breakdown. Therefore, in proposing changes to the
current ED framework, we propose openness in principle to constant adjustment in the ways in which ED
is monitored to ensure that social risks don’t lead to costly eruptions.
But how exactly do we come to grips with sector practices in a context where competing private actors
34 South Africa’s first Independent Power Producers in the Renewable Energy Sector were decided in
November 2011 upon the awarding of preferred bidder status to 28 bidders. Of these, 27 went on to be granted Power Purchase Agreements: licences for energy production in December of 2012. 35 For a summary of initial Marikana Commission outcomes, see: http://mg.co.za/article/2014-09-16-key-lessons-for-lonmin-as-marikana-commission-wraps-up
86
EARTH, WIND AND FIRE
86
are not compelled to share how they execute their plans? This speaks to the data collection challenge
at the heart of this chapter. Data was collected by researching communities based in Limpopo, North-
West, Free State, Northern Cape and the Western Cape and the impact of these programmes
understood.
The chapter opens with a detailed description of economic development, identifying each element and
how the state measures compliance. It follows with an assessment of 10 key hurdles to development.
These hurdles identify different types of design and implementation failures that undermine the ultimate
goal of development. Associated with each hurdle is a proposed solution as well as further research
questions that must be pursued to strengthen the scientific understanding of how widespread certain
forms of malpractice are as well as the potential veracity of the solutions that the chapter points to.
BACKGROUND: ECONOMIC DEVELOPMENT IN THE RENEWABLE ENERGY SECTOR
To start with, it is critical to understand the timetable of renewable energy power plants to gain
perspective on when and how the social risks identified in this chapter unfold. There have been four
bidding windows each year since the inception of REIPPPP in 2011. The success of a bid is typically
announced three to six months after the bid submission, after which another six-month period is granted
for Independent Power Producers to reach financial close. At this point, they are awarded Power
Purchase Agreements (PPA) by the state. Construction typically begins three months after the award of
a PPA and lasts, on average, for 18 months, depending on the size of the power plant and the speed at
which it reaches Commercial Operation Date (COD), which is a technical milestone determined by the
state. In all then, it can take up to three years for a power plant to become fully operational. Therefore,
of the first three bidding rounds that have been awarded, only Round 1 (28 awarded) and Round 2 (19
awarded) projects have been granted power purchase agreements. Furthermore, while Round 1
projects have largely reached the operations phase, Round 2 projects are mostly in the final phases of
construction. The 17 Round 3 projects that were successful have not yet signed their PPAs with the
government.
The key implication of this timetable is that many of the development risks that are identified fall into the
realm of missed opportunities. For example, the failure to train workers during construction is not likely to
result in a workers’ protest because workers do not understand this to be an entitlement, but serves as a
missed development opportunity given the unchanged skills profile of the labour force. The longer-term
issues, such as the inability to generate a class of Black industrialists or the absence of communities from
the planning process, are issues that will manifest over the course of the 20-year life cycles of the projects.
Thus, this chapter is about understanding the foundational deficiencies that may compromise
development in the long run.
Economic development in the renewable energy sector is 30 points out of a possible 100, which means
that, when bidding for a license to supply electricity to the national grid, each bidder should focus 30 per
cent of its energies on matters of ED.
87
EARTH, WIND AND FIRE
87
Economic development is disaggregated into seven areas, known as pillars:
job creation;
local content;
preferential procurement;
top management;
ownership;
enterprise development, and
socio-economic development.
Upon granting a license,36 the IPP is expected to fulfil the ED obligations it committed to in its initial bid
and is subsequently monitored on a quarterly basis by the DOE.
Put differently, each element of economic development constitutes a performance commitment to the
state. The DOE determines minimum standards known as ‘thresholds’, and measures the quality of a bid
on the IPP’s ability to not only meet but also exceed the threshold requirements. The table below is a
summary of how each economic development element is measured by the DOE. It does not include
actual thresholds or targets as these change with every bidding round. It is thus intended to provide an
understanding of what is measured and how it is measured. It is worth stating that this chapter does not
interrogate whether the DOE’s current thresholds are set at a level that is consistent with national
imperatives. Rather, we challenge the issues surrounding these targets to indicate that, regardless of how
they have been set, the prospects of using them to approach true development are compromised under
the current conditions.
ED Summary Table
The table below provides a summary of each ED element that is measured by the DOE, indicating the
calculation method as well as the evidence that the DOE requires to monitor the performance of IPPs.
ED Element Measure Phase of
Measurement
Evidence of
Activity
1. Job Creation Construction
and 20-year
operation
South African
citizens
Per cent of employees who are South
African citizens relative to total employees
measured in terms of time worked
- Letter of
appointment
- ID
- Time sheet
- Salary advice
36 The term ‘license’ is used loosely to mean the signing of multiple agreements between the DOE and IPPs, which grant IPPs permission to construct and operate their planned power plants and bind the state to the purchase of the resultant energy.
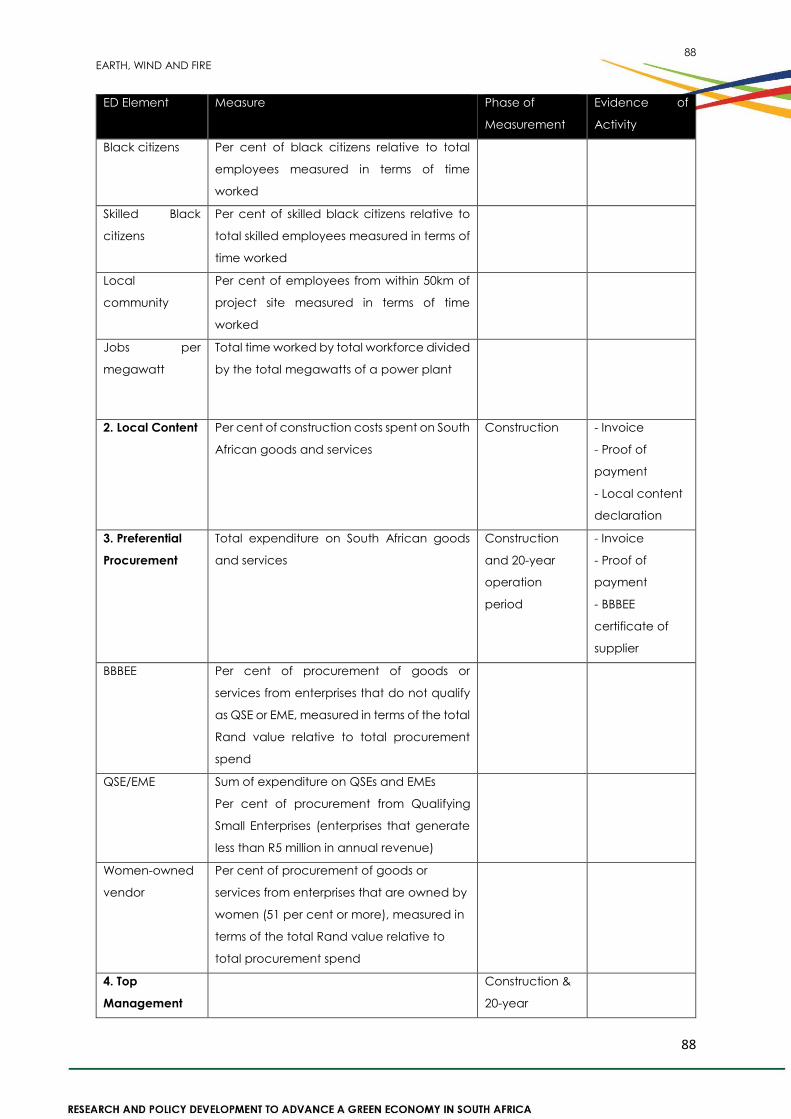
88
EARTH, WIND AND FIRE
88
ED Element Measure Phase of
Measurement
Evidence of
Activity
Black citizens Per cent of black citizens relative to total
employees measured in terms of time
worked
Skilled Black
citizens
Per cent of skilled black citizens relative to
total skilled employees measured in terms of
time worked
Local
community
Per cent of employees from within 50km of
project site measured in terms of time
worked
Jobs per
megawatt
Total time worked by total workforce divided
by the total megawatts of a power plant
2. Local Content Per cent of construction costs spent on South
African goods and services
Construction - Invoice
- Proof of
payment
- Local content
declaration
3. Preferential
Procurement
Total expenditure on South African goods
and services
Construction
and 20-year
operation
period
- Invoice
- Proof of
payment
- BBBEE
certificate of
supplier
BBBEE Per cent of procurement of goods or
services from enterprises that do not qualify
as QSE or EME, measured in terms of the total
Rand value relative to total procurement
spend
QSE/EME Sum of expenditure on QSEs and EMEs
Per cent of procurement from Qualifying
Small Enterprises (enterprises that generate
less than R5 million in annual revenue)
Women-owned
vendor
Per cent of procurement of goods or
services from enterprises that are owned by
women (51 per cent or more), measured in
terms of the total Rand value relative to
total procurement spend
4. Top
Management
Construction &
20-year
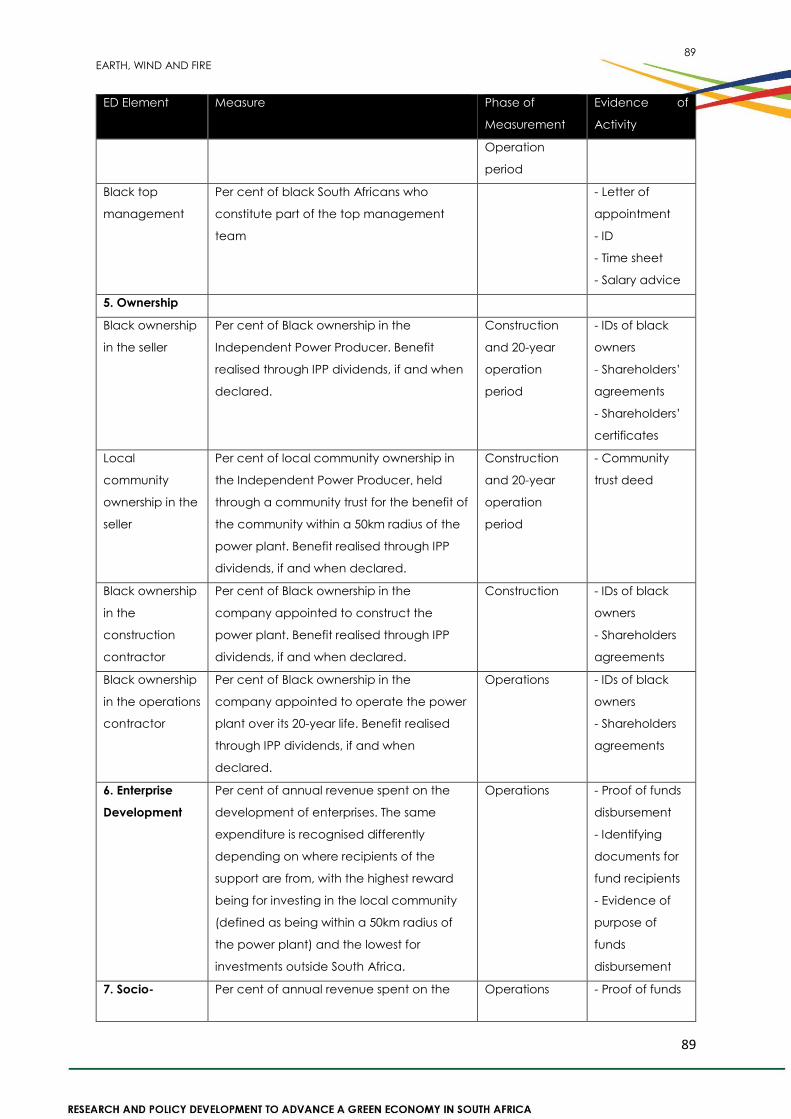
89
EARTH, WIND AND FIRE
89
ED Element Measure Phase of
Measurement
Evidence of
Activity
Operation
period
Black top
management
Per cent of black South Africans who
constitute part of the top management
team
- Letter of
appointment
- ID
- Time sheet
- Salary advice
5. Ownership
Black ownership
in the seller
Per cent of Black ownership in the
Independent Power Producer. Benefit
realised through IPP dividends, if and when
declared.
Construction
and 20-year
operation
period
- IDs of black
owners
- Shareholders’
agreements
- Shareholders’
certificates
Local
community
ownership in the
seller
Per cent of local community ownership in
the Independent Power Producer, held
through a community trust for the benefit of
the community within a 50km radius of the
power plant. Benefit realised through IPP
dividends, if and when declared.
Construction
and 20-year
operation
period
- Community
trust deed
Black ownership
in the
construction
contractor
Per cent of Black ownership in the
company appointed to construct the
power plant. Benefit realised through IPP
dividends, if and when declared.
Construction - IDs of black
owners
- Shareholders
agreements
Black ownership
in the operations
contractor
Per cent of Black ownership in the
company appointed to operate the power
plant over its 20-year life. Benefit realised
through IPP dividends, if and when
declared.
Operations - IDs of black
owners
- Shareholders
agreements
6. Enterprise
Development
Per cent of annual revenue spent on the
development of enterprises. The same
expenditure is recognised differently
depending on where recipients of the
support are from, with the highest reward
being for investing in the local community
(defined as being within a 50km radius of
the power plant) and the lowest for
investments outside South Africa.
Operations - Proof of funds
disbursement
- Identifying
documents for
fund recipients
- Evidence of
purpose of
funds
disbursement
7. Socio- Per cent of annual revenue spent on the Operations - Proof of funds
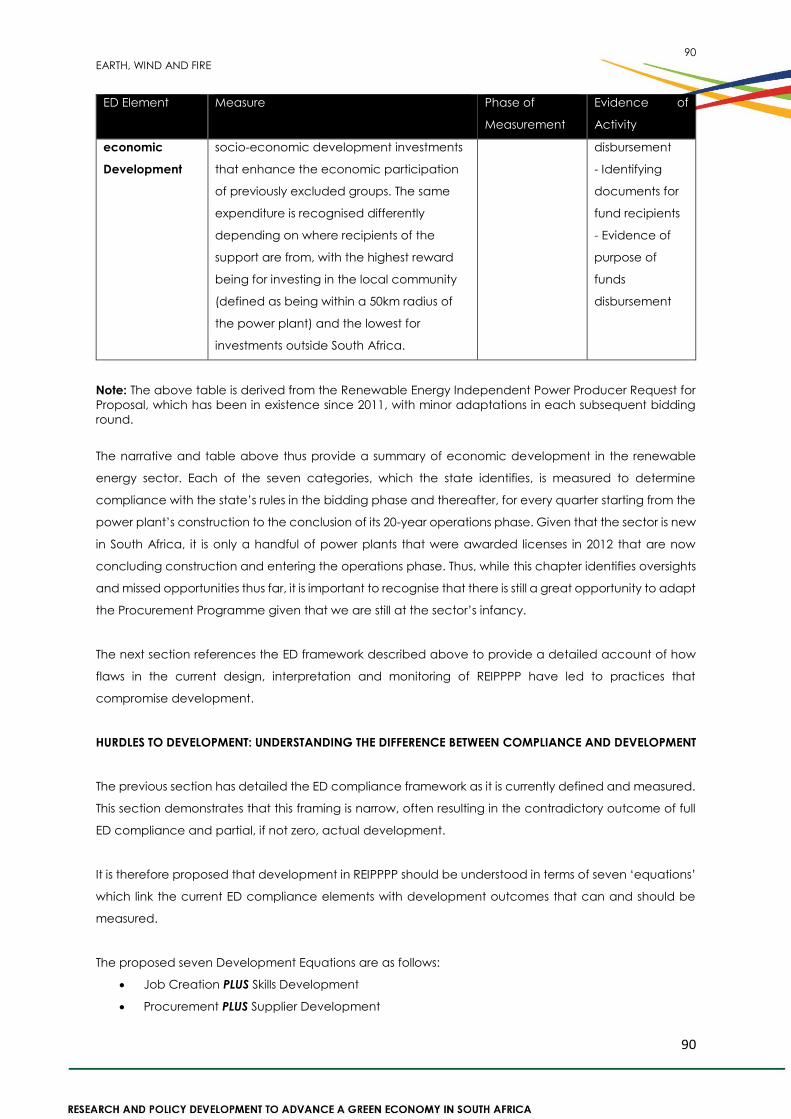
90
EARTH, WIND AND FIRE
90
ED Element Measure Phase of
Measurement
Evidence of
Activity
economic
Development
socio-economic development investments
that enhance the economic participation
of previously excluded groups. The same
expenditure is recognised differently
depending on where recipients of the
support are from, with the highest reward
being for investing in the local community
(defined as being within a 50km radius of
the power plant) and the lowest for
investments outside South Africa.
disbursement
- Identifying
documents for
fund recipients
- Evidence of
purpose of
funds
disbursement
Note: The above table is derived from the Renewable Energy Independent Power Producer Request for
Proposal, which has been in existence since 2011, with minor adaptations in each subsequent bidding
round.
The narrative and table above thus provide a summary of economic development in the renewable
energy sector. Each of the seven categories, which the state identifies, is measured to determine
compliance with the state’s rules in the bidding phase and thereafter, for every quarter starting from the
power plant’s construction to the conclusion of its 20-year operations phase. Given that the sector is new
in South Africa, it is only a handful of power plants that were awarded licenses in 2012 that are now
concluding construction and entering the operations phase. Thus, while this chapter identifies oversights
and missed opportunities thus far, it is important to recognise that there is still a great opportunity to adapt
the Procurement Programme given that we are still at the sector’s infancy.
The next section references the ED framework described above to provide a detailed account of how
flaws in the current design, interpretation and monitoring of REIPPPP have led to practices that
compromise development.
HURDLES TO DEVELOPMENT: UNDERSTANDING THE DIFFERENCE BETWEEN COMPLIANCE AND DEVELOPMENT
The previous section has detailed the ED compliance framework as it is currently defined and measured.
This section demonstrates that this framing is narrow, often resulting in the contradictory outcome of full
ED compliance and partial, if not zero, actual development.
It is therefore proposed that development in REIPPPP should be understood in terms of seven ‘equations’
which link the current ED compliance elements with development outcomes that can and should be
measured.
The proposed seven Development Equations are as follows:
Job Creation PLUS Skills Development
Procurement PLUS Supplier Development
91
EARTH, WIND AND FIRE
91
Ownership PLUS Operational Involvement
Management PLUS Key Roles for Black/South African Managers
Socio-economic and Enterprise Development PLUS Community Participation
Development Spend PLUS Impact Measurement
Measuring PLUS Management
What is demonstrated in the coming subsections, through 10 topics that have been titled ‘The 10 Hurdles’,
are the current compliance practices that are at odds with development. This discussion makes evident
the conceptual gaps in the design of REIPPPP and demonstrates how these gaps have resulted in
practices that in fact undermine national development aims. By doing this, the intention is to make clear
the case for ‘The Seven Equations of Development’. The end of this section will suggest a practical way
forward, which clearly shows how to incorporate the proposed ‘Seven Equations of Development’ into
the existing framework to ensure that development is both measured and managed in the sector.
Hurdle 1: Exclusion of Development from the Framing of Risk
The notion of risk is central to the RE Procurement Programme. Technology and finance are vetted on
multiple levels, starting with the owners, to the banks that fund the projects, to the development financiers
that fund Community Trusts and, ultimately, by the Department of Energy. Much of this is in aid of balance
sheet protection, including the most important balance sheet of all, the national fiscus. And it is only right
that this should happen because this programme entails the expenditure of billions of rand that should
be carefully guarded.
The problem, however, is that the risks of bad development are seldom considered in the planning and
vetting of RE projects. This has remained the case since the start of the programme because the
outcomes of bad development are generally expressed at the level of the communities that host RE
power plants. By definition then, the effects of bad development are not fully known by Johannesburg
and Cape Town-based managers and the affected, often-remote communities, are unaware of their
rights or potential for recourse. Below is a consideration of bad development at community level, which
provides an indication of the major risks that currently simmer at the surface of RE projects.
The Mechanics of it: Good Compliance, Bad Development
Lack of dedicated development expertise
All projects, by virtue of their close links with communities, require a community liaison officer (CLO).
However, the inexperience of many IPPs in the South African context has resulted in the complete
absence of CLOs or the appointment of incompetent individuals who are deemed to be right for the job
because, to many, development is science-less fluff. Therefore, many projects suffer from poor
community relations owing to two factors: poor communication and a lack of dedicated attention. These
two issues are a function of a greater problem: development professionals are few and far between in
the sector, and this lack is felt from within the DOE to DFIs and ultimately, at project level.
Some IPPs stand out for their appointment of development professionals. These IPPs tend to form part of
92
EARTH, WIND AND FIRE
92
larger corporations with shareholders that require triple bottom line accountability. For the most part,
however, development professionals are missing in action, which is why relations with communities are,
for the most part, strained and ripe for crippling political interference.
Politicised job opportunities
Who gets to work on the construction of a power plant? This question is most loaded in relation to local
community members who often comprise the bulk of the unskilled and semi-skilled labour force on RE
construction sites. Recognising the difficulties that come with the task of employing locals, many projects
have opted to delegate this responsibility to local politicians or local government. The local individuals in
charge then ‘supply’ a group of labourers, which projects tend to hire without much due diligence
testing.
What the ED Compliance framework fails to monitor is:
where and how local employment opportunities are advertised;
what the selection process is for determining who does/does not get work;
how transparent the employment processes are with respect to the local community;
what the process is for getting one’s name on a local database for unemployed people (in cases
where such databases are relied upon)
o Is it fair?
Has the local councillor advertised the work opportunities to all communities within a 50km radius,
including those that do not fall into their ward? and
Has the local councillor positioned the work opportunities as somehow connected to their
political party?
These questions are pertinent because these projects are usually situated in communities that are
afflicted with high poverty and unemployment. In these contexts, employment is highly politicised,
meaning that projects are often drawn into local party politics and are viewed as complicit in local
systems of patronage due to their oblivion or outright neglect.
Exclusion of local business sector
The programme understands ‘local procurement’ to mean ‘of South Africa’. What this means then is that,
in some cases, truly local enterprises from communities surrounding the project are completely excluded
from participating as service providers. This outcome, perfectly compliant, misses the opportunity to
stimulate the growth of the local economy. This often occurs because: ‘the IPP knows not what the
engineering contractor does’.
The structure of RE projects generally results in a complete delineation of duties that sees the engineering
contractor do all the subcontracting related to the construction and, later on, operations. Therefore,
unless the IPP includes a requirement for community-based service providers in their contract with the
engineering firm, the obligation does not exist. Another risk related to this separation of functions is that
engineering firms do not always collaborate with IPPs in devising strategies around improving local
procurement. The result is that the budget for enterprise development, held by the IPP, is not utilised to
93
EARTH, WIND AND FIRE
93
convert community-based suppliers into ‘procurement ready’ vendors. This is explored in further detail at
a later stage of this section. Suffice to say that community-based suppliers are excluded because the
compliance framework does not require their inclusion and because engineering firms usually lack the
understanding to leverage funds from IPPs in order to make local vendors procurement ready.
Much like job creation, there exist, at the local level, databases pertaining to the local business
community. Therefore, where projects have identified services that can easily be supplied by local
businesses such as the washing of solar panels, they might seek out community-based businesses.
However, it is often the case that contractors rely on local politicians or local government to avoid the
responsibility of directly interfacing with the communities they are located in. The result is that contracts
are then awarded to entities that are connected to the local political power structures.
Socio-economic development during construction
One of the most critical risk factors inherent to the design of the programme is the timing of social
development investments. The programme is designed to enable IPPs to direct funds towards
development during the operations phase of power plants. The logic is that, at that point, the plant is
generating income from the supply of power and is therefore able to free up revenue for socio-economic
and enterprise development.
What this timetable has not fully understood is that the construction of mega projects, often in very poor
communities, indicates from the very first day that there is big money in the air. So, naturally, projects
have found themselves under pressure from communities that insist that there be some level of social
investment during the construction phase. Why does this happen? It happens because the current design
of REIPPPP has at its heart a notion that says it is reasonable to ask of IPPs to risk millions on physical
infrastructure, but somehow it is unfair to ask of those same IPPs to invest, at risk, in the communities they
are located in. This is rooted in a failure to articulate the return that can be realised from positive social
relations. Indeed, experience tells us that, just by completing the development equation with respect to
jobs and procurement, that is by investing in skills and supplier development, IPPs would demonstrate
high levels of goodwill and avoid pressures that see them sponsoring random social projects under duress.
Location! Location! Location!
The current framework is designed to incentivise projects to focus their efforts on the communities closest
to them. Project sites are typically chosen on the basis of access to land, proximity from and ease of
connection to a sub-station, ease of access to national roads and general ease of land use such as
minimal interference with natural life. Because of these requirements, projects are typically located in
areas with low populations. Therefore, a project that commits to investing its socio-economic and
enterprise development contributions within a 50km radius achieves more points than a project investing
the same amount beyond the 50km radius. The natural outcome is that all projects commit to investing
all their social development revenues within the 50km radius because what they are after are maximum
compliance points, which is not the same thing as maximum development impact.
The real nature of the development problem with respect to where investments are made relates to three
94
EARTH, WIND AND FIRE
94
issues.
The first is that, at times, projects are located in areas so remote that there are less than 5,000 people
living within the 50km radius. This means, for example, that over a 20-year period, less than 5,000 people
will be the recipients of up to R100 million (a conservative estimate of dividend earnings due to a
community with a shareholding in power plants), which would imply an over-saturation of investments
that could have a higher impact if spread amongst more communities.
The second issue is that working within the 50km radius to achieve maximum compliance can also result
in the construction of false borders within related communities. This is not unlike the straight lines that cut
up Africa into nation states: straight lines that create unnecessary bureaucratic complexity and impose
a regime of inclusion and exclusion in the name of compliance points.
The final issue is that complying with the 50km radius is also a recipe for generating high levels of inequality
within neighbouring communities. This is compounded by situations where two power plants are built right
next to each other making a single community the recipient of benefits from both. This inequality has the
potential for a myriad problems related to falsification of identity, the influx of the excluded group into
the suddenly wealthy community and the stirring of tensions and resentment related to what is a highly
artificial premise for accessing benefit.
How Does This Compromise Development?
The real and ultimate outcome of not appreciating the risks entailed in poor compliance design and the
resultant development malpractices are life-threatening community protests that might include the
possibility of power plants being set alight by angry communities. The irony is that, while projects are
willing to take into account the possibility of the sun not shining for protracted periods despite millennia
of experience to the contrary, the possibility of community-level protests as a result of development
malpractice is not taken seriously, despite South Africa’s history as well as the current trend of violent
community protests for improved service delivery.
The implication is that all actors involved are risking these energy assets. Because development is not
understood, and few are willing to appoint dedicated professionals to this function, the short-term risk is
reputational but, in the long-term, we risk catalysing sustained community development where funds
would otherwise not exist. Turley and Perera make a similar point in their assessment of sustainable
procurement. They identify the resourcing of municipalities with sustainable development professionals
as a key component of identifying, mitigating and managing the social risks that emerge from such
investments.37
Future Research Implications
Part of the reason that the return to social investment is undervalued is because there exists little to no
research about social risk: what it is, how to measure it, how to manage it and how to realise returns to
investments. This research is necessary to provide both evidence and cases around which to base social
37 Turley, L. and Perera, O. 2014. ‘Implementing Sustainable Public Procurement in South Africa: Where to Start?’ IISD Report.
95
EARTH, WIND AND FIRE
95
investment choices.
Hurdle2: Treating Communities as the Sole Representative of Black South Africans
The current design of the procurement programme makes it possible to treat a community, represented
through a community trust, as the sole representative of Black South Africans in the ownership structure
of IPPs. This is not inherently problematic, but can only be an appropriate strategy in cases where
individuals who have the fund-raising and deal-making experience to negotiate on behalf of their
communities represent the community trust in question.
The Mechanics of it: Good Compliance, Bad Development
In reality:
Most community trusts are formed for the purpose of a specific bid. In these cases, the
representatives of the community are usually new to their roles as board members or trustees
and bring no personal experience in terms of fund-raising or engineering.
Those trusts that have been in existence for longer are often products of previous bidding rounds
and have not begun to operate because their trusts have not received dividends and, therefore,
there have been no decisions to make. This means that, once more, the community members
who represent the community on the trust’s board generally have limited relevant experience.
Because IPPs are allowed to elect their own representatives to the trusts’ boards, these
individuals, representing the IPPs interests, make all key decisions regarding how the community
is to be funded and what the focus of the community trust should be.
Furthermore, this means that the IPP, as a project company, can in fact be comprised of a single
entity, effectively negotiating with itself due to the inability of community trustees to participate.
Therefore, where South Africans and Black people are intended to participate, it is entirely possible (and
has been the case) that foreign-owned companies can construct an entire bid and be deemed
successful from a compliance point of view, without any meaningful contribution from local parties.
How Does This Compromise Development?
Ownership as a factor of production is rewarded through profits. However, the rewards that accrue to
ownership, which make it possible to reproduce profits over time, are a function of the capability to
organise capital and all other factors of production towards a single purpose. This means that, to convert
the element of ownership into a capability that can be reproduced by South Africans it needs to be
approached not just as a question of the outcome, that is, whether or not a Black person receives a
dividend when profits are declared. Instead, ownership needs to be approached as a question of
capabilities, which are expressed in multiple processes, and life stages of an IPP: from project
development to fund-raising to deal-making and, crucially, to operational involvement in the core
business of the IPP. This means that the DOE should request substantiating information that details the
involvement of South Africans in general and Black South African owners in particular, in all phases of the
IPP’s life.
In particular, where community trusts are concerned, there should be an awareness of the limitations of
trustees with a view to developing their capabilities over time. Instead, the strategy of choice is to give
community trusts economic interest without decision-making power, which is viewed as a way of
96
EARTH, WIND AND FIRE
96
protecting them from the full implications of the fiduciary duties that would accrue to trustees. But this is,
at best, a stopgap. It cannot be treated as something that will self-correct over time in the absence of
any intervention. Rather, the long-term strategy should be to train trustees so that they may play a
meaningful role, not just in community-level issues, but also in the management of the power plants
owned by their communities. This is not a requirement of the programme thus far, which explains why
some projects find the assignment of Black South African ownership entirely to communities to be a good
strategy because it guarantees that one half of the ownership equation will always be unable to
negotiate or vet the decisions of the other. What the DOE and development financiers should be asking
is what the strategy is to ensure that currently passive community trusts can grow into genuine
shareholders with the ability to negotiate their interests and, ultimately, to continue the work of the trusts
in the absence of these projects. This is a question of empowerment and a question of sustainability.
Failure to answer it is inadvertent complicity with a long-term tokenistic role for communities as
shareholders represented by community trusts.
Future Research Implications
The key research questions that stem from the capabilities question are related to prioritisation. What skills
are most pertinent to the active participation of Black South Africans? What vehicles would be the most
effective in imparting those skills? And, in the interim, what services must be availed to participating
entities that are still in the early stages of skills development?
Hurdle 3: The Problem of Absent Black South African Owners
Related to the point above is the challenge of absenteeism where Black owners are concerned. One
unfortunate by-product of Black Economic Empowerment (BEE) is that it has created a schism between
the Black firms that are created solely for the purpose of investment holding and the firms that are
created for the purpose of operating the assets they own. There are, of course, some great examples of
firms that have a core operational competency as well as the ability to raise funding for large investments
such as are required for RE projects, but these are in the minority. To address this, the current procurement
programme recognises ownership on two levels: the level of the IPP and the level of its most immediate
contractors responsible for construction and operations. Therefore, in the ideal world, the Black entities
with fund-raising experience apply their trade at the level of IPP ownership and the entities with
engineering capabilities can apply their trade in the construction and operations of power plants. There
is also a view that the requirement to have Black people in top management positions takes care of the
skills transfer question at the highest level. Not so simple.
The Mechanics of it: Good Compliance, Bad Development
As already indicated, at the level of IPPs, the Black owners who participate are typically skilled
financiers. However, they only concern themselves with the financial return profile of the project
and do not get involved in the operations.
Unfortunately, it is also the case that the Black ownership in construction and operations
companies is comprised of passive investors who are not actually involved in the management
or operations of those firms.
97
EARTH, WIND AND FIRE
97
Therefore, the assumption that Black owners of construction/operations companies can
become recipients of the technical capabilities entailed in designing and managing renewable
energy power plants is erroneous.
In effect then, the entrepreneurial capabilities that are required to create and maintain an RE
power plant, from fund-raising to engineering, are not being transferred to whole Black South
African entities that have that complete set of skills.
If we are to accept that we do not require a single entity with all the key competencies that comprise
an IPP, then we might find comfort in the existence of the requirement for Black top managers. But here
too exists a challenge. From a compliance perspective, a project can claim to have only one or two top
managers, all Black and female. In this way, the project is awarded full compliance points. That these
two individuals may be focused on non-core issues is not something the DOE monitors. Even more
concerning is the fact that there may be a host of foreign individuals who occupy the key roles in the top
management of an IPP who are completely invisible to the DOE. This is because the structure of a top
management team is completely discretionary and therefore makes it possible to conceal the reality of
the limited role of Black top management in the actual running of IPPs. Per the compliance obligations,
such a concealment of the reality is not a contravention and, despite agreement that this sort of
behaviour goes against the spirit of the DOE’s intentions, there is no way to reward or punish IPPs, because
the DOE has not explicitly set out to measure whether or not Black top managers are at the heart of
executive decision-making.
How Does This Compromise Development?
The above is a problem for development because it means we have so far failed to create a complete
entrepreneurial class for this sector. Instead, it is possible to be compliant with a structure that reinforces
passive Black involvement, confining this class to the role of dividends collectors or, indeed, highly paid
Black top managers whose functions are mostly ceremonial. Rather, what is needed is a level of detail
regarding the operational roles of Black owners in IPPs, construction companies and full top
management structures that indicate what Black top managers actually do in relation to their
counterparts in executive management. This should be interrogated in the assessments of bids and
monitored throughout the life of the power plant.
Firstly, this approach will avoid the problem of token Blacks or South Africans. Secondly, it will avoid the
problem of foreign IPPs subverting their responsibility to partner in a mutually beneficial way with local
entities. Thirdly, and most importantly, it will result in what is actually required: the creation of a class of
Black or South African industrialists who can single-handedly create renewable energy IPPs in the future.
Indeed, there will be challenges regarding the experience and capital that Black or South African entities
with such aspirations can currently bring to the fore, but the benefit of the last 20 years is that, despite
the shortcomings of BBBEE, many operational Black entities have emerged who, if unable to bring a
cheque, can bring a myriad capabilities that are required to run an IPP. Where there are gaps in the
experience of such entities, these should be identified in the Detailed Economic Development Reports
of bidding IPPs, in tandem with a development strategy to overcome them.
98
EARTH, WIND AND FIRE
98
Future Research Implications
‘Local ownership may be desirable, but it is not the same thing as capacity building, which involves the
development of managerial, technical and operational skills in national firms and the domestic labour
force. And to achieve the highest level of industrial capacity building, policymakers must focus in a
coordinated way on basic policy deficiencies affecting infrastructure development, trade/industrial
policy, and skills development and transfer.’38
The current call for Black industrialists indicates the state’s awareness of this challenge at the national
level. What is of interest is research that explores enterprises that have participated in BBBEE deals, the
skills they had going into the deals and the ways in which they have subsequently developed. It may be
the case that skills do in fact trickle down through a less regulated manner than what is proposed. Of
even greater interest is how this process of up-skilling occurs and what incentives drive the parties
involved in giving and receiving.
Hurdle 4: Jobs without Skills Development
The job creation impact of RE projects is monitored very closely. The DOE concerns itself with who is
employed, their nationality, race and gender, the employment of local community members and the
identities of the skilled workforce. One of the job creation challenges faced by the RE sector is the limited
time period in which power plants can actually generate meaningful, mass employment. Typically, an
RE power plant is a fully automated generation facility that does not require person-power to convert its
energy source into electricity. Therefore, labour is most pertinent to the construction phase, which
typically takes 9 to 36 months. Thereafter, the plant does not require a large workforce as the bulk of
activities related to its maintenance include activities such as washing solar panels, landscaping and
security.
To give an indication, Eberhard, et al. demonstrate that the last three rounds of REIPPPP have produced
64 successful projects which will result in the generation of 3,915MW of energy.39 Of those projects, two
are hydro, one is landfill gas and the rest are a combination of the dominant technologies: wind, solar
PV and CSP. The jobs created by these projects combined during construction are estimated at 19,108
per the DOE’s reporting.40
A job, according to REIPPPP, is calculated as 12 months of full-time employment, measured in terms of
time worked, rather than the number of people who are engaged. The REIPPPP Request for Proposals
refers: ‘A “Job” is accordingly calculated on the basis of total Person Months for the Construction
Measurement Period and the Operating Measurement Period, divided by 12.’41
38 Eberhard, et al. 2014. ‘South Africa’s Renewable Energy IPP Procurement Program: Success Factors and
Lessons’, PPIAF. 39 Eberhard, et al. 2014. ‘South Africa’s Renewable Energy IPP Procurement Program: Success Factors and Lessons’, PPIAF p. 14. 40 Eberhard, et al. 2014. ‘South Africa’s Renewable Energy IPP Procurement Program: Success Factors and Lessons’, PPIAF p. 27. 41 DOE. 2013. ‘RFP – Volume 5 – Economic Development Requirements’, Part 4.2.7.
99
EARTH, WIND AND FIRE
99
To be clear, per the DOE’s definitions:
A person month is 160 hours of work
A job is 12 person months
In other words, if one were to work the same job for 10 years as a full-time employee, they would accrue
120 person months, meaning the DOE’s statistics would reflect 10 jobs even though only one person has
worked that time. To get a sense of how many people are employed then, one has to divide the number
of jobs by the duration of employment. Construction periods vary depending on the size of the power
plant. It is reasonable to assume an 18-month period as representative of the average period. In that
case, we divide 19,108 by 1.5 years in order to get a sense of people employed during construction. This
would mean that roughly 12,738 people will have worked on constructing the first three rounds of power
plants, which is significant, but severely compromised by the fact that these jobs do not last beyond the
two-year mark.
Eberhard, et al. further report that the dominant technologies will generate 34,954 jobs. Using the same
division principle as above to get a sense of how many people will have jobs for the 20-year operations
phase of these projects, we divide the total jobs by the number of years. This gives us a total of 1,747.7
people who will enjoy the benefits of working on power plants during operations. This number lacks some
lustre relative to the R120 billion that has been invested in the sector over the first three rounds.42 This is
because this sector is not synonymous with creating long-lasting, quality jobs.
So how, then, can RE projects deepen their employment impact?
The Mechanics of it: Good Compliance, Bad Development
Currently, the question of employment impact does not feature in the programme’s compliance
requirements. Therefore, it is the case that people are employed for a short period and are released
when their roles are completed without any prospects for future employment. This outcome is completely
compliant.
How Does This Compromise Development?
To be fair, it is not the responsibility of IPPs to guarantee the future employment of staff they no longer
require. However, a developmental approach to this question would assess employment impact from
the perspective of employability. In other words, what IPPs can be measured against is how they improve
the future employment prospects of their labour force in the limited time they have with them. The answer
is two-fold: power plants must become sites of learning and such learning should be recognised through
certification for those who then demonstrate graduation from one skill set to the next. Failure to maximise
the limited time with workers simply perpetuates the underlying reasons for their unemployment. It is not
unreasonable to request that IPPs design training programmes for workers. The challenge is that the link
between job creation and skills development is not an obligation and, therefore, making this investment
42 Eberhard, et al. 2014. ‘South Africa’s Renewable Energy IPP Procurement Program: Success Factors and Lessons’, PPIAF p. 14.
100
EARTH, WIND AND FIRE
100
in workers currently constitutes undue expenditure.
Hurdle 5: Procurement without Supplier Development
Another common problem relates to entities that provide services for RE projects. The programme sets
out rules that require IPPs to procure from BBBEE accredited agencies and the value of their invoices is
then recognised in terms of their BBBEE level. In this way, the programme rewards procurement-spend on
entities that are highly compliant. Included in the compliance framework are the requirements to procure
from small enterprises and women-owned vendors.
The Mechanics of it: Good Compliance, Bad Development
There is, however, no obligation to procure from local communities and, furthermore, there exists no
obligation to develop the small suppliers from which projects procure. The result is a crude, last-minute
approach to procurement, which at its worst results in the creation of small enterprises and women-
owned vendors that assist with meeting compliance obligations but are not assisted to develop beyond
servicing the power plant.
How Does This Compromise Development?
This represents a missed opportunity for development because, with the correct level of support, small
enterprises should be able to leverage the experience of servicing power plants to grow into larger,
sustainable businesses: because, indeed, the growth of small businesses, particularly in new industries, is
a prerequisite for the growth and sustainability of the economy at large.
Future Research Questions
The acceptance of procurement as a tool for enhancing the economic participation of previously
excluded enterprises lacks an evidence basis. Indeed, Tait notes that the failure to review enterprise
development has led to a poor understanding of how to ensure that obligations result in sustained
benefit.43 This historical impact, then, is the question at the heart of procurement.
Hurdle 6: Research! Research! Research!
Power plants must submit detailed environmental impact assessments for consideration by the DOE.
These are scrutinised and, where there are gaps or risks, IPPs are usually requested to submit mitigation
strategies. Where communities are concerned, a document relying on census data and dated
Integrated Development Plans (IDP) is often deemed sufficient evidence of a socio-economic needs
assessment. And if the content is ever to be interrogated, it will not be by a financier or the DOE but most
likely a powerless NERSA official whose contribution can only be to raise a flag at a public hearing. This is
how unimportant social impact is in the RE sector.
Simply, the recourse is to insist on participatory research prior to the submission of a bid. Once a licence
is granted, the DOE should insist on participatory development planning – a form of development
43 Tait, L. 2014. ‘The Potential for Local Community Benefits from Wind Farms in South Africa’, Energy Research Centre, University of Cape Town.
101
EARTH, WIND AND FIRE
101
planning that will occur in collaboration with communities not solely in the plush Cape Town or
Johannesburg offices of IPPs. Furthermore, the DOE should insist on the monitoring and impact evaluation
of social investments, which goes beyond evidence of a money trail and assesses the effectiveness of
development interventions.
The problem of poor development planning has been identified by many who have followed the sector
closely. Wlokas, et al. identify the absence of community development guidelines as central to the
challenge, noting that IPPs are not experts in development and, therefore, that their limited
understanding and resultant negligence are to be expected.44
The bottom line is that conducting detailed and inclusive research in communities impacted by RE power
plants should be a minimum standard for demonstrating seriousness about achieving the development
aims of REIPPPP.
Hurdle 7: Community Participation
Here is a proposed definition of a community: a grouping of highly under-estimated individuals. Why?
Because most actors in the RE sector think it perfectly reasonable to remove the function of thought from
community members. After all, poor people are by definition uneducated and therefore unable to
articulate their needs and aspirations, right? Wrong.
And yet, there is nothing in the compliance framework that explicitly requires evidence that communities
have been consulted about how their collective identities are to be used to acquire electricity
generation licences. Certainly in the bidding process the environment’s interests are even more
important than those of the communities. And post the bidding process, a largely ceremonial process
run by NERSA is embarked upon to publicise the projects that are likely to be built in communities. These
hearings are generally held in towns that, although in the same province as the projects in question, may
be over 100km away from the communities impacted by them. In other words, NERSA hearings cannot
be relied upon to get the word out to communities or to listen to the views of community members.
There is a deeper problem that underlies the convenient distancing of communities from projects: the
fear of raising expectations, which is actually an expression of the inability to manage expectations. The
sector is replete with actors who harbour cynicism about communities, lack the flair to manage local
community politics, and undervalue constant, transparent communication with ordinary members of
communities. This issue is certainly not limited to the sector but it acts as a barrier to development relative
to the spirit of REIPPPP and the national transformation agenda.
But if communities knew more they would demand, at the very least:
to be notified that they are beneficiaries of community trusts;
44 Wlokas, H., et al. 2012. ‘Challenges for local community development in private sector-led renewable energy projects in South Africa: an evolving approach’, Journal of Energy in Southern Africa, Vol. 23, No. 4.
102
EARTH, WIND AND FIRE
102
to be consulted about the social needs that many IPPs claim to respond to;
to be notified of the individuals who are elected to represent their interests on community trust
boards;
to be made aware of the job opportunities and selection processes for the construction and
maintenance of power plants; and
accountability with respect to the plans that IPPs submit to the DOE regarding community
development.
The unintended effect of the generalised silence where communities are concerned is politicisation of
access to information. Those in the know form part of a connected minority who can use the power of
their knowledge to become unofficial gatekeepers. It also becomes an instrument for avoiding
accountability because the standards by which IPPs are to be judged are conveniently concealed.
Some erroneously link this form of gatekeeping to the heritage of traditional leadership. However, the
complicity (and sometimes active agency of foreign IPPs in limiting access to information and working
with a chosen few in communities) indicates that this behaviour is less inherent and more opportunistic.
Further Research Questions
What is necessary to help bridge the development training divide are short courses in development
studies and related disciplines, development for non-development professionals, as it were, to heighten
awareness of the issues. Furthermore, research demonstrating which tools are best suited to managing
community participation should be conducted and disseminated to create a shared set of minimum
standards across the sector.
Hurdle 8: Limited Time as a Guise for Limited Will/Capacity
The standard response to many of the above issues is that there is simply no time to address development
in a thorough manner. The power crisis is so urgent that some development concerns must be dealt with
at a later stage, would say a DOE official, a well-intentioned IPP or a DFI. However, if we consider the
complexity of the technical requirements to build a power plant, the long hard process of raising debt
and equity for such an endeavour and all the legal work that currently underpins REIPPPP, it would seem
will, not time, is the real issue.
Will is governed by depth of understanding and incentives. As it stands, development is not fully
understood by the people who hold the power. Some hold the view that development practitioners are
naive tree-huggers with no claim to science or professionalism; other IPPs are cynical about communities
and prefer to present their development obligations as non-negotiable acts of charity rather than the
entitlement that it is; many, afraid to confront the power dynamics that exist within communities, choose
to avoid responsibility by working through local politicians or community workers whose pasts or intentions
are not vetted. More often than not, however, it is a lack of understanding that leads IPPs to behave in
this manner.
Hurdle 9: Doing is Not Impacting/No Impact without Investment
There is a common view that, by doing something perceived to be positive for a community,
103
EARTH, WIND AND FIRE
103
development is achieved. This is the view of those who paint old age homes and place computer labs
in schools with intermittent electricity supply. ‘We’ve done it, branded it and have the glossy picture to
show for it.’ Therefore, development has taken place? Not. This understanding of development is
probably why decades of CSI have, in the majority of instances, not translated into the comprehensive
upliftment of communities. It is also the reason why one of the most influential development thinkers of
our times is Professor Esther Duflo, whose work is premised on questioning the impact of development
projects and investments. Doing what we perceive to be good is simply not correlated with achieving
development impact. This is why development requires expertise.
Despite this, the expertise of compliance, essentially auditing project activities, is ranked more highly than
development impact evaluation in the RE sector. In fact, impact evaluation is not a requirement of the
sector, meaning that, for the time being at least, doing is erroneously assumed to be the same thing as
impacting.
The additional assumption that pervades the RE sector is that all social development investments can be
directed to a capable community trust, whose sole function will be to identify existing community-based
organisations and enterprises to which funding is directed. Firstly, as discussed above, most community
trusts that represent communities in the shareholding of RE power plants are completely new structures
with very limited experience in the functions they are expected to carry out. Secondly, many power
plants are located in areas that are extremely under-developed, which by definition implies weak or
limited community structures. As evidence of how limited the understanding of communities is, it is
commonplace for projects to submit ED Reports that claim their newly established community trusts in
communities with few identifiable community-based organisations will handle the investment of millions
of rands. This is deemed compliant, despite its complete lack of development logic. Rather, what is
required, despite the effort it entails, is the creation of robust local organisations that can implement all
development functions at the community level from research to planning, implementation, monitoring
and reporting.
As with all the other hurdles explored, in the absence of definition and measures, development impact
cannot be guaranteed through the programme as it currently stands.
Hurdle 10: ‘You Cannot Manage What You Do Not Measure’
To compound what we have shown to be a limited understanding of development across the sector is
the very real issue of the DOE’s inability to monitor the development efforts of IPPs. This has led many IPPs
to view any investment in development as wasted expenditure because financiers and the DOE do not
provide incentives related to the quality of development work. Rationally then, unless the threat of a
community uprising looms, many IPPs practice minimum or bad development because, to begin with,
they lack a full understanding or appreciation of the returns on good development and, more
importantly, their efforts are not recognised or rewarded in any way under the current compliance
framework. Indeed, ‘you cannot manage what you don’t measure.’
In the proposed seven equations of development, what we contend is that the latter part of each
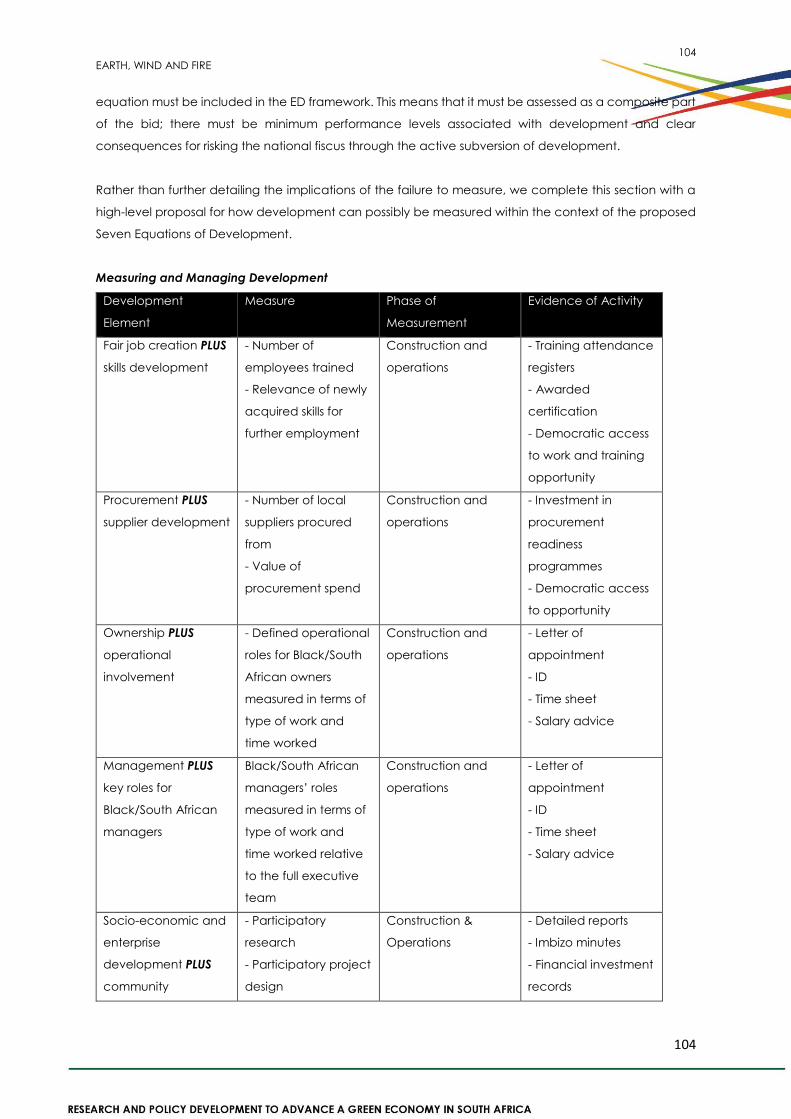
104
EARTH, WIND AND FIRE
104
equation must be included in the ED framework. This means that it must be assessed as a composite part
of the bid; there must be minimum performance levels associated with development and clear
consequences for risking the national fiscus through the active subversion of development.
Rather than further detailing the implications of the failure to measure, we complete this section with a
high-level proposal for how development can possibly be measured within the context of the proposed
Seven Equations of Development.
Measuring and Managing Development
Development
Element
Measure Phase of
Measurement
Evidence of Activity
Fair job creation PLUS
skills development
- Number of
employees trained
- Relevance of newly
acquired skills for
further employment
Construction and
operations
- Training attendance
registers
- Awarded
certification
- Democratic access
to work and training
opportunity
Procurement PLUS
supplier development
- Number of local
suppliers procured
from
- Value of
procurement spend
Construction and
operations
- Investment in
procurement
readiness
programmes
- Democratic access
to opportunity
Ownership PLUS
operational
involvement
- Defined operational
roles for Black/South
African owners
measured in terms of
type of work and
time worked
Construction and
operations
- Letter of
appointment
- ID
- Time sheet
- Salary advice
Management PLUS
key roles for
Black/South African
managers
Black/South African
managers’ roles
measured in terms of
type of work and
time worked relative
to the full executive
team
Construction and
operations
- Letter of
appointment
- ID
- Time sheet
- Salary advice
Socio-economic and
enterprise
development PLUS
community
- Participatory
research
- Participatory project
design
Construction &
Operations
- Detailed reports
- Imbizo minutes
- Financial investment
records

105
EARTH, WIND AND FIRE
105
Development
Element
Measure Phase of
Measurement
Evidence of Activity
participation - Training and
development plan for
trustees
- Case for beneficiary
community selection
- Case for trustee
selection
- Communication
strategy
- Development
practitioner CV
- Communication
strategy fulfilment
- Alignment of
development
strategy with
community desires
Development spend
PLUS impact
measurement
- Regular monitoring
and evaluation
- Regular impact
evaluation
Construction and
operations
- M&E reports
- Impact reports
- Mitigation strategies
Measuring PLUS
management
- Inclusion of
development
measures in bid
requirements and
funding requirements
- Articulation of
development risk in
every project
including mitigation
strategies
- Link development
obligations to Power
Purchase Agreement
Construction and
operations
- Inclusion of
development
considerations in DOE
clarification questions
- Quarterly
assessment of
development
elements by DOE
- Annual response to
development failures
through termination
points
The above recommendations are proposed as a starting point for the sector to assist all actors – project
developers, IPPs, financiers and the DOE – to assess and monitor the quality of a project with respect to
development. In each instance, there should be a clear identification of the implementation agent.
While the responsibility lies primarily with the IPPs, financiers and the DOE, these undertakings should be
dealt with as a collaborative effort, involving such state agencies as sector education and training
agencies and departments such as trade and industry, small business development and higher
education.
CONCLUSION: THE TIME IS NOW
This chapter has deliberately confined its critique and suggestions to the current REIPPPP framework
because, in spite of its design flaws, research and experience have shown that a more sustainable and
inclusive form of development is possible through a reconfiguration (rather than a total overhaul) of the
existing ED framework. Secondly, we seek to provide actors in this sector with practical ways of thinking
106
EARTH, WIND AND FIRE
106
about, measuring and implementing development in relation to compliance, hence the table presented
in the conclusion to the previous section. A clear choice was made to avoid naming and shaming
individual projects because the malpractices that have emerged in the sector are largely owing to the
programme’s design rather than explicit malicious intent. We believe that practices can and will improve
if the correct incentives are put in place. Therefore, it is less the story of individual perpetrators that makes
the case and more an understanding of generalised trends that must be internalised in order for genuine
change to come about.
We believe that ‘The 10 Hurdles’ that currently hinder development in the sector can be overcome by
measuring and managing the proposed ‘Seven Equations of Development’. By applying this thinking to
development, the programme can contribute the following to the national development agenda:
1. the creation of Black-owned and run energy companies, which also implies the establishment
of genuine Black/South African industrialists;
2. the transfer of skills from foreigners to locals in the most senior executive functions as well as the
most junior roles entailed in constructing and operating RE power plants;
3. the creation or growth of small enterprises that can leverage the experience of servicing power
plants to participate in other sectors with similar needs;
4. the development of communities into active agents in their own story of ‘good change’;45 and
5. impactful social investments owing to the participation of local communities in the articulation
of development strategies and their resultant stewardship in managing the investments made in
their communities.
However, this is not a nice-to-have that is secondary to the work of financing projects and identifying the
correct technologies. What this chapter has demonstrated is that failure to apply good development
thinking has already resulted in fractured community relations, unsustainable job and enterprise creation
and ineffectual social investments made to appease rather than advance communities.
It is thus our recommendation that financiers, the DOE and IPPs should immediately introduce changes
that will result in the management of the very real social risks that are currently being allowed to persist.
Communities are gradually waking up to what they are truly entitled to and bad development is not it.
There is certainly a role for communities to put pressure on IPPs and the DOE and the hope is that it takes
on a constructive form rather than the exacerbated infrastructure destruction that has come to typify
community protests. Indeed, the House of Traditional Leaders in the Eastern Cape has shown signs of
positive engagement on the question of land use by challenging the DOE’s rules with respect to
traditionally owned land. Their argument is that the rules of REIPPPP exclude their participation by
requiring that power plants be built on privately owned land, which naturally excludes the communally
held, untitled land of Black communities.46 Such engagement, in the case of communal land areas,
45 The term ‘good change’ is borrowed from Robert Chambers (2004: iii, 1–2), who argues that development is ‘good change’, thus making the two concepts synonymous. 46 http://www.iol.co.za/business/news/leaders-fight-for-wind-farms-1.1729636#.VQPJ6BCUdfw [Accessed 5 March 2015].
107
EARTH, WIND AND FIRE
107
should also genuinely involve communities is critical for revealing and addressing the development
shortcomings of REIPPPP. All this to say that, since it is not the intention of the programme to compromise
its own development objectives, let all social risks that result from it be understood, managed and
resolved to ensure that real development is attained and sustained.
108
EARTH, WIND AND FIRE
108
SECTION II
Transition to a Low-carbon Economy
109
EARTH, WIND AND FIRE
109
Chapter 5
Making Transitions to Clean and Sustainable Energy
in the South African Urban Transport Sector:
Linkages to Growth and Inclusive Development
Lynn Krieger Mytelka
ABSTRACT
This chapter analyses the development of the bus rapid transit (BRT) systems in Johannesburg (Rea Vaya)
and Cape Town (MyCiTi) and the extent to which they have played a role in stimulating a move towards
energy transitions. The two cities have each engaged in an effort to build their urban bus transport
infrastructure, mainly along the now traditional lines of bus rapid transit (BRT) systems, by the expansion of
their bus networks and the purchase of new buses. Looking at past practices, a central part of this analysis
is to understand the challenges of this sector and provide policy recommendations on how to overcome
the challenges of path dependency and lock-ins associated with the transition to a low carbon energy
system in the transport sector in South Africa.
INTRODUCTION
Since attention turned to the transport sector in the mid-1990s, the focus has largely been on its role in
facilitating mobility to and within South Africa’s cities. In the ensuing years, considerable progress was
made in building the public transport sector itself and in addressing the issue of transport planning ‘from
a policy perspective’ (Bickford, 2013). Nonetheless, as the literature review prepared by the South Africa
Cities Network (SACN) noted, a number of new issues have arisen that now require attention.
Several of these issues relate to the recent devolution of responsibilities and functions for the transport
sector to the local level and the ability of local authorities to ’become important institutional players in
the cities’ (Bickford, 2013). Others, triggered by the growing evidence of climate change and its impact
(GEA, 2012), take a broader perspective on the transport sector, linking it to the growing need to move
towards an energy transition.
The present chapter addresses this new set of issues and the interrelationship between them. Its focus is
on the identification of opportunities to begin a move towards energy transitions in the urban transport
sector, their linkage to current policy and practice in the development of renewable fuels and their
potential impact on innovation and inclusive development.
As part of this process, the chapter analyses the development of the bus rapid transit (BRT) systems and
the extent to which they have played a role in stimulating a move towards energy transitions, particularly
in the two cities, each of which has engaged in an effort to build its urban bus transport infrastructure
110
EARTH, WIND AND FIRE
110
mainly along the now traditional lines of the bus rapid transit (BRT) systems. These include Johannesburg
(Rea Vaya) and Cape Town (MyCiTi). Expansion of bus networks and the purchase of new buses as part
of a second phase is now underway in these two cities and this provides an opportunity to take a new
look at past practice and analyse the challenges that lie ahead in moving towards an energy transition
in this sector.
UNDERSTANDING TRANSITIONS
There is no universal ‘right’ pathway to clean and renewable energy. There is widespread recognition,
however, that the pace at which such technologies are being developed and diffused is far too slow
(Peters, 2011). A consensus is also emerging on the need to stimulate movement in this direction now.
Choices about how to proceed will have to be made and new strategies developed and implemented.
South Africa is not alone in facing such challenges. A number of recent studies have sought to analyse
the problems associated with energy transitions. Two of these dealt specifically with the process of making
choices about change, and they have informed the work to be undertaken here.
The first, through the lens of an innovation systems approach, analysed the growing interest in the
application of hydrogen and fuel cells in the transport sector that emerged in the mid-1990s and the
abrupt decline in the pursuit of an imminent hydrogen future that took place early in the new decade of
the 2000s (Mytelka, 2008, 15–38). It led to an awareness of the extent to which path dependency and
lock-in47 can slow the move towards an energy transition in the transport sector.
The second study combined innovation systems and energy transition perspectives (GEA: 2012, Chapter
25). It made clear the extent to which energy transitions are not isolated events but part of broad,
systemic processes of change (Smith, 1994; Grubler, 2004; Geels and Kemp, 2012) during which old and
new regimes co-existed, often for long periods of time, and outcomes are consequently unpredictable
as we shall see in the brief discussion below on making a late start in moving towards clean technology.
Successful energy transitions, moreover, have historically involved major changes not only in technology
but in production processes, management systems, organisational forms, government policies, skills,
knowledge (Freeman and Perez, 1988) and, above all, in the habits, practices and norms of the actors
involved (Mytelka, 2000). Combined, these processes create powerful self-reinforcing mechanisms that
make change very difficult but not impossible. How to overcome the challenges of path dependency
and lock-in is a central part of the analysis to be undertaken here.
A LATE START
South Africa took a late start in the modernisation of its liquid fuels and it is still in the process of eliminating
leaded gas from its roads. In part, this resulted from a lack of sufficient government incentives needed to
47 Path dependence is reflected in a range of beliefs and boundaries that shape choices about new technologies. These can include
engineering ‘beliefs about what is feasible or at least worth attempting’, and boundaries that shape processes of choice such as lines of research to pursue, kinds of products to produce, organisational routines and development trajectories to adopt (Teece, 1988; Mytelka, 2008). Path dependence also emerges in contexts where earlier investments result in high sunk costs, habits and practices are entrenched and ‘expert views’ are shaped by earlier thinking that narrow the range of choices to established technologies and evaluation techniques. See Section I, Chapter 1 for a discussion of these two concepts and the importance that a co-evolutionary role, played by governments, civil society and industry can plan in moving forward.
111
EARTH, WIND AND FIRE
111
move in that direction. Unleaded petrol, for example, only became available in South Africa in 1996. The
ban on lead in all grades of gasoline only took place in 2006 and the reduction of sulphur levels in diesel
fuels is still incomplete.
Although policies in Europe began to focus on cleaner fuels in the transport sector, the process of
conversion was slow and the costs high. Moreover, as might be expected in this early phase of a possible
energy transition, no consensus has yet been reached among the competing ranks of bus manufacturers
in South Africa, each of which appears to have embarked on a different pathway globally and in South
Africa.
Volvo, for example, focused on the electrification of its buses. Having first created a plug-in hybrid, the
Volvo 7900, which was available in 2013, it then moved on to develop a plug-in electric hybrid48 that was
launched in 2014. The new bus has an electric motor powered by lithium batteries along with a small
diesel engine. It is rapid-charged at selected bus stops. According to Hakan Agnevall, President of the
Volvo Bus Corporation, ‘Electric-hybrid buses and full-electric buses are tomorrow’s solution for urban
public transport’ (Hakan, 2014).
Daimler, on the other hand, focused on ‘cleaner’ diesel for its trucks and buses in keeping with EU
standards and policies. It also has had a long-term interest in hydrogen fuel cells in the automobile
industry. In 2010, with an eye to the future, however, it widened its range and launched its first series-
produced electric cars with a hydrogen fuel cell, the new B-Class. Its most recent bus is the Mercedes-
Benz Citaro G Blue Tec serial Hybrid that allows emission-free driving under battery power over short
distances. The diesel engine in this bus does not act as a primary drive unit, but rather drives the generator
to produce electric power as required: this energy is stored by maintenance- free lithium-ion batteries
mounted on the roof.
Scania moved in a different direction, announcing a new gas engine for its buses and trucks in September
2010. The gas engines are based on five-cylinder 9.3-litre diesel engine platforms. The engine
management system automatically adapts to the gas quality, which provides the opportunity to use
different biogas and natural gas mixtures. The gas tanks for buses are installed on the roof. Scania was
also involved in the development of clean technology in the bus sector in South Africa, a point to which
we will return later.
Unlike the interchangeability of fuels in the flex fuel cars and, more recently, flex fuel buses, introduced in
Brazil with considerable success (Grubler, et al. 2008), the problem engendered by the development of
a multiplicity of new types of buses in South Africa stems from the need to build different types of
infrastructure. For cities, the uncertainties of having to make choices from among a variety of new buses
that may or may not survive a transition, and do so at a time when older models are still available and
less costly, reduces the incentive to move ahead more rapidly towards clean fuels. To a certain extent
48 The initial hybrid was a vehicle with a gas engine and a battery-driven electric motor. The Plug-in Hybrid (PHEV) is an electric vehicle that is part gas and part electric and has plug-in capacity. The newest is an all-electric vehicle that uses no gas and is 100% percent electric.
112
EARTH, WIND AND FIRE
112
this appears to have carried over to the first buses purchased for the new bus rapid transit systems, as we
will see below.
The slow move towards clean energy has also been affected by the reluctance of the South African
Petroleum Industry Association (SAPIA), which, in 2009, argued that ‘the move towards cleaner exhaust
emissions would require investment of some R40 billion to upgrade existing refineries and change fuel
specifications in South Africa’ (Njobeni, 2009). Had the process begun then, however, it would likely have
been completed by now and at a lesser cost. Instead, the oil and gas industry is still reluctant to move
forward towards clean fuels despite their recent report that showed that diesel consumption is still rising
in South Africa (Sapia, 13 September 2014). In May 2013, moreover, Avhapfani Tshifularo, Executive
Director of SAPIA, speaking at the Fuel Dealers Conference in Johannesburg, stressed that refinery owners
were unable to foot the bill and government would thus have to make sure that the ‘costs were
recovered through the price structure’; that is, by passing the costs onto motorists.
Lastly, government policies are themselves now beginning to have a negative impact on the move
towards an energy transition in the public transport sector. This results from the continued focus on cleaner
fuels as opposed to stimulating a move towards ‘clean’ fuels. South Africa’s most recent road map, which
expired in 2014, for example, was still focused on the application of ‘cleaner’ fuels by 2017 as opposed
to a transition towards clean fuels by that time.
To this must be added the way that policies themselves can generate problems in overcoming path
dependence and lock-in. South Africa has a well-developed approach to consultation and a broad set
of stakeholders are part of that process. Once negotiated, however, many of these policies are delayed
or never carried out. In the initial biofuels policy, for example, South African fuel producers were to have
begun mandatory blending of petrol and diesel with biofuels from 1 October 2015. This has been
postponed and it is unclear when it might begin. Small farmers, large farmers, bus manufactures and
members of the business community have all been affected by this practice. More recently, Kobus van
Zyl, MD of the Daimler Truck and Bus Groups in South Africa (DTBSA) announced his strong opposition to
the delayed introduction of cleaner fuels, which had been planned for July 2017 (Engineering News, 4
July 2014), a point to which we will return in the conclusions.
MAKING CHOICES ABOUT CLEAN FUELS IN THE BUS RAPID TRANSIT SYSTEMS
In contrast to the above programmes and practices, which were part of national policies, the
development of the bus rapid transit systems was largely in the hands of provincial governments and
major cities, which were required to fund their own programmes and make choices about the purchase
of buses and fuels. Of particular interest is the extent to which this has opened up opportunities to move
towards an energy transition and contribute to inclusive development. This section looks at the first two of
the new bus rapid transit systems – Rea Vaya in Johannesburg and MyCiTi in Cape Town.
The Integrated Transport Planning Process (ITP), mandated by the National Land Transport Act of 2001
and its regulations, presented an opportunity for local authorities to address a number of transport issues.
113
EARTH, WIND AND FIRE
113
At the time, these were mainly focused on transport itself, access to it and the role of public participation
in the planning process. The Transition Act of 2003 took this one step further by directing governments to
rationalise public transport and decrease the destructive competition between different players, such as
the taxi drivers who dominated the urban transport sector in Johannesburg at the time and would later
become partners in Rea Vaya.
The first Bus Rapid Transit System feasibility study for the Johannesburg area was carried out in 2006 and
in August of that year a fact-finding mission to Bogota, Colombia, confirmed their interest in its creation.
In November of that year, the Johannesburg City Council approved Phase 1 of the future BRT System and
construction began.
In December 2009, a tender for the manufacture and maintenance of 143 buses for Phase 1A of the BRT
system was awarded to Scania South Africa for the supply and delivery of the chassis and engines for the
buses, while its partner, Marcopolo SA, would supply the bus bodies. Forty-one of the new buses would
be articulated buses, which can transport up to 112 passengers. The remaining 102 would be
complementary buses that can transport up to 81 passengers.
As Amos Masondo, the then Executive Mayor of Johannesburg, pointed out during a press conference
at the time, the buses would all have Euro IV diesel engines with Euro III engines being the minimum
standard recommended in the national specification (Masondo, 2009). According to Christoffer Ljungner,
Managing Director of Scania South Africa, the city council had set high standards regarding the
environmental impact of the bus engines and, after consultation with the Clinton Climate Initiative (CCI),
had decided that the engines should meet Euro IV environmental standards of CO2 emissions. This was
one level higher than the existing South African national standard and required a 60 per cent reduction
in particulate emissions and a 30 per cent reduction in nitrogen oxide emissions compared to Euro III.
Local government was also conscious of the need to create jobs and Rea Vaya provided an excellent
opportunity. From July to September of 2008, 173 jobs, mainly manual, were created. This rose to 467 from
October to December 2008; 1,836 from January to March 2009; and 2,803 from April to June 2009. They
had estimated that once fully operational, Rea Vaya would offer some 1,500 jobs (Rea Vaya Joburg,
2015). For the most part, however, this did not lead to the creation of jobs that were linked to
manufacturing, engineering or other production-related activities.
Lastly, although both Scania and Marcopolo had the capacity to manufacture the buses they planned
to use in South Africa, the need to ensure that they would be delivered in time for the FIFA World Cup
meant that they would have to abandon the production of the buses locally and import them all from
their respective companies in Brazil. It was agreed, however, that subsequent orders would be
manufactured in South Africa. The first of the complementary buses arrived from Brazil in February of 2009
(Engineering News, 6 February 2009). At the end of its first year, Scania had fulfilled its commitment to the
Rea Vaya project.
Phase 1 B was launched in Johannesburg in 2013. Mercedes-Benz South Africa (MBSA) was awarded the
114
EARTH, WIND AND FIRE
114
contract and would work with Marcopolo South Africa who would provide the [bus] bodies. The order
covers 134 Euro-compliant Mercedes-Benz chassis that were to be shipped as completely knocked-down
down sets (CKC) from Mercedes-Benz Brazil: the bodies were provided by Marcopolo, a superstructure
manufacturer with headquarters in Johannesburg. Phase 1C is to start operating in 2017.
As Rea Vaya moved into its fourth year, an opportunity opened up to upgrade the City’s older transport
system by purchasing between 125 and 175 new buses. In addition to requiring local content, the decision
by the City for Metrobus to use biogas follows from a number of studies that have indicated enormous
potential for the production of biogas from city waste sources such as landfill sites, sewer plants and grass
cuttings by Johannesburg City Parks and the Zoo (Maqekoane, 2013). In addition to providing solid waste
for use in the bus sector, organic fraction of municipal solid waste (OFMSW) has a number of unique
properties that favour its use. Among these are ‘its high efficiency due to its ability to give higher biogas
yields of good quality per unit weight than most available substrates and its abundance as well as
availability at low cost’ (Technology Selection of Biogas Digesters for OFMSW.2014). The City is currently
working in partnership with the University of Johannesburg and the South African National Energy
Development Institute to refine the technology for biodigesters that can use grass and other non-food
agricultural products to produce fuel. From these initiatives one has the impression that Johannesburg is
well on the road to clean technology in the transport sector.
Although Cape Town was somewhat slower in developing its Integrated Rapid Transit System, MyCiTi, too,
has taken a major leap forward in building the knowledge base for a move towards clean fuels and their
linkage to growth and inclusive development. In part this was stimulated by its early link to Scania, which,
in addition to its role in the first phase of Rea Vaya, was an early entrant into the development of cleaner
energy for buses in Europe. With financial support from the Swedish government, for example, between
2006 and 2009, Scania was able to introduce 140 buses fuelled by a combination of natural gas and
biogas into its network in Europe. Since then it has moved onto the development of ethanol buses and
trucks, over 1,000 of which are currently in operation in Europe (Stromberg, Director of Sustainable
Solutions, Scania).
Support from the Swedish government also provided the funds for a multiyear project in Cape Town that
focused on the use of waste as a base to produce ethanol. The biogas used in the buses is produced
from organic food waste and wastewater sludge.
Green Cape, a development agency established in the Western Cape in 2010, has been focusing on
opportunities to promote manufacturing and employment with a pro-green approach. Two of the
problem areas to which they have been paying particularly attention are biofuels and the waste
economy. Large cities have traditionally suffered from waste disposal problems, but this may be changing
and biofuels might have a role to play in this process. Jim Petry, Director of Energy at the Western Cape
provincial government, for example, looks at waste streams to produce ethanol and a Stellenbosch
University start-up, Stellenbosch Biomass Technologies, began to look for partners in the wine sector in the
Western Cape with whom to collaborate. The project would apply second-generation technology to
effect the enzymatic conversion of grape skin pomace cellulose into glucose, followed by conventional
115
EARTH, WIND AND FIRE
115
anaerobic alcoholic fermentation. Insoluble holocellulose and cutin residue from the converted slurry
would be turned into pellets as boiler fuel to provide the process energy. Ten rented buses would run on
waste from grape skins. In March 2014, Western Cape wine producer, Namaqua Wines, signed an
agreement with the Paarl-based distillation design and technology provider, Taurus Distillation, to
establish a 1.2-million-litre, 96.4 per cent fuel ethanol pilot plant at its Spruitdrift Cellar, near Vredendal. For
this purpose, Namaqua Wines registered Namaqua Fuels and applied for a fuel-manufacturing licence
for the latter, in accordance with the requirements of the Petroleum and Liquid Fuels Charter. Namaqua
Fuels would eventually blend the fuel ethanol with an additive to make ED95 fuel, which would fuel Scania
vehicles fitted with ethanol high-compression engines. The Namaqua Wines and Taurus cellulosic fuel
ethanol project was the culmination of an in-depth study on the feasibility of the waste-based production
of bioethanol to fuel public transport conducted by the Green Cape Sector Development Agency on
behalf of the Swedish International Development Agency, Scania, the Western Cape government and
the City of Cape Town (Edited by: Megan van Wyngaardt, 2014).
THE RE-EMERGENCE OF NATURAL GAS
Although both Cape Town and Johannesburg have begun to look into a future that links new energy and
job opportunities to the developing bus industry, the pathway to clean energy is far from secure as the
current re-emergence of natural gas suggests. Why has natural gas re-emerged at this juncture in the
development of clean fuels?
Natural gas is comprised mainly of methane, which has a higher hydrogen-to-carbon ratio than gasoline
or diesel and a higher octane number, which makes it possible for engines to operate at a higher
compression ratio. Natural gas also has the particular advantage of offering a significant reduction in
local air pollutants, especially particulate matter when compared with diesel fuel.
Where natural gas distribution infrastructure is already in place, it is possible to use the gas as a vehicle
fuel by installing refuelling systems in grids, for example. This, however, is not often the case in developing
countries. Instead, gasoline and diesel vehicles will need to be retrofitted for natural gas, unless they are
new vehicles that have been designed for natural gas. Natural gas vehicles can also be biofuel vehicles,
running on either gasoline or natural gas or dual-fuel vehicles that run on a mixture of diesel and natural
gas. Although the world supply of natural gas substantially exceeds that of oil, natural gas vehicles are
more expensive and have a shorter driving range than gasoline vehicles.
The move from gasoline or diesel fuel to natural gas is often portrayed as a positive one that brings us
closer to a clean technology. The reality, however, is quite different. Natural gas is still a major greenhouse
gas and, although it may be cleaner than coal, it reinforces earlier habits, practices and norms that delay
the move towards a transition by suggesting that it can play the role of a bridging fuel until we get
something better. Unfortunately, the evidence is beginning to show that it creates a barrier to further
change by locking in the new natural gas infrastructure, which has a lifespan of up to 50 years.49
49 Building infrastructure for natural gas, as in the case of fracking, can, for example, chain us to carbon-based energy for as long as 50 years, since the power plants are being built to last that long.
116
EARTH, WIND AND FIRE
116
Nonetheless, on 2 October 2014, Johannesburg Executive Mayor, Parks Tau, in his keynote address at the
Rea Vaya Transport summit in Johannesburg, announced the bold plan ‘to convert vehicles to run on
natural gas … as the preferred solution to the problem of high oil prices’. The city has 4,000 vehicles and
consumes about 19 million litres of fuel per year, excluding the Metrobus fleet (Tau, 2014).
NEW FUEL OPTIONS
Until recently, most biofuels were derived from food crops such as sugarcane, maize and palm oil. These
first generation biofuels were alternatively praised as a means to provide energy and reduce greenhouse
gas emissions, and criticised for contributing to the destruction of tropical forests and competing with
food crops in the use of agricultural land. For the most part, this has been the case, though there has
been some acceptance as the case of Brazil has illustrated over the years. Similarly, there is the less well-
known example of Jatropha (a plant crop used to produce biofuel), which in some cases has offered an
interesting approach to issues of sustainable energy and inclusive development. In 2007, for example, the
people of Garalo in Mali, rather than continue to rely on imported diesel fuel for a future off-grid
generator, chose to plant Jatropha on 440 ha of their land as part of a multi-goal project to stimulate
rural development by providing electricity for lighting, refrigeration, welding, and agricultural processing
machinery for use by businesses, health services and schools. Within a few years, the new grid had over
230 paying clients and the farmers, who were active players in the choice process, had not only chosen
to plant Jatropha for its oil content, but to intercrop Jatropha and local food crops such as maize,
sorghum, millet, peanuts, sesame and beans – thus dealing with the assumed need to choose between
food and fuel as some ardent supporters of green technology had earlier argued (Burrell, 2008; Access
Sarl, 2010).
First generation biofuels were later joined by a second generation of non-food crops, such as algae and
cellulosic materials. In many ways South Africa is an ideal place to develop algae production. It has heavy
industry, the pollution of which could be absorbed as an input into the production of algae along its
coastal planes. The key to successful development of algae as a biofuel is to produce the other things
that go along with it, since the economics are not all that attractive, which limits commercial involvement.
New ways around this, however, are currently underway in the work of local universities, particularly the
University of Cape Town and Stellenbosch University.
More recently, a third generation has emerged and has been gaining attention. These have often been
called Drop-in Fuels. Unlike many of the earlier efforts to develop clean fuels, the new drop-in biofuels
have a number of characteristics that are of particular interest in the broader development of clean fuels.
Among these are their interchangeability with existing aviation fuels, which is the leading current interest,
their ability to be integrated into existing petroleum fuel infrastructure, which reduces the cost of
adoption, and their use of hydrogen, which provides an opportunity for existing refineries to stay alive.
One of the most recent feedstock developments has been a tobacco plant hybrid, which is growing in
South Africa as part of a partnership between South African Airways, Dutch Aviation Biofuels company
SkyNRG, and Boeing to ‘create jet fuel from Solaris, a nicotine-free tobacco plant’ (Kinder, 2014).
117
EARTH, WIND AND FIRE
117
Currently, commercial drop-in biofuels, however, account for less than four per cent of the global biofuels
market with ‘the vast majority of drop-in biofuels derived via the oleo chemical platform which uses
feedstocks such as palm oil and used cooking oil, and are often referred to as hydro-treated esters and
fatty acids’ (Karatzos, et al. 2014). These biofuels have been successfully tested in aviation trials but their
price remains relatively high.
IS THE FUTURE HYDROGEN?
Unlike the newer biofuels discussed above, current interest in hydrogen fuels and fuel cells dates back to
Ballard, a Canadian start-up, based in British Columbia, which developed the first bus powered by
hydrogen fuel cells (HFCs) in 1993. Shortly thereafter, they signed a joint venture agreement with Daimler-
Benz to work with them on the application of hydrogen fuel cells in the development of their new electric
car (NECAR).
By the late 1990s, hydrogen fuel cells appeared to be a proven concept in the future development of
clean energy in the transport sector. In particular, proton exchange membrane (PEM) fuel cells used a
fuel supply to combine hydrogen and oxygen in an electrochemical process that generated an electric
current. The process involves an ion exchange polymer membrane as the electrolyte and electrodes of
fine metal mesh on which a platinum catalyst is deposited. It thus converts hydrogen directly into
electricity without combustion or moving parts, but the use of platinum continued to make the process
costly. Given the interest in clean transport technologies at the time, however, the use of hydrogen in fuel
cell vehicles (HFCV), by making them virtually pollution free, was a considerable asset (Mytelka, 2008). An
additional advantage for South Africa has, until now, been its abundant supply of platinum.
Since the turn of the century, however, there have been vigorous debates over the future of hydrogen,
the lack of available infrastructure for refuelling and the high cost of operating fuel cell vehicles.
Progressively, the time horizon was extended further into the future. Competition, notably from the
emergence of new vehicles such as the Toyota Prius, then in its first phase, and growing attention more
recently to electric vehicles, and especially hybrid buses and cars, has come to dominate the focus on
cleaner technology in the absence of a strong government movement towards clean technology.
Over the last decade, member states of the European Union, the United States of America, Japan and
several other countries moved beyond the earlier focus on hydrogen refuelling tests and demonstration
projects and several began to test opportunities for making hydrogen fuel cars. The cost of hydrogen
vehicles has begun to fall and cities in Europe and elsewhere have built some of the necessary
infrastructure. What then has been holding back the move towards the widespread use of hydrogen fuel
cells in the transport sector globally?
First, it is important to remember that energy transitions, at least for a time, will involve the coexistence of
old and new energy regimes. These are often based on different technologies and energy systems and
competition reigns among potential victors. It is thus important to note that hydrogen fuel cells are not
the only option available and that lead actors such as Toyota, Volvo, Daimler and Scania are strong
118
EARTH, WIND AND FIRE
118
players in the race to dominate the change process. Making choices under conditions of uncertainty
increases the difficulties in moving to new technologies.
Second, since the development of hybrids, Toyota and its competitors have worked hard to secure the
hybrid market and bring it closer to the hydrogen fuel cells of the future. In the past few years, new hybrids
have begun to reach the market. These cars, and in some cases, buses, are cross-breeds of one sort or
another with various abilities to operate as plug-in electric vehicles. In a few cases, they may even
operate as fuel cell vehicles for brief periods of time, while the bulk of the work is done by the more
conventional part of the vehicle. Of critical importance is the current lack of consistency across the board
and the competition to which it gives rise, without necessarily providing new sources of clean technology.
Third, a move towards the development of new uses for hydrogen fuel cells has recently emerged in
South Africa, and is being promoted by existing government and business interests. Both express the
current need to widen the use of platinum, which is increasingly under pressure as a key ingredient in the
production of hydrogen fuel cells whose cost, though considerably reduced over the years, has not yet
reached the level of ordinary cars and buses. Both of these projects are related to the need for electric
power, for which there are alternatives as the analysis by Donnell shows (Donnell, 22 May 2015).
Fourth, scientists at several major universities have developed new and promising research of relevance
to future hydrogen fuel cells and their use. At Stanford University in California, for example, researchers
have developed a cheap way to split water with a single catalyst to separate hydrogen and oxygen
continuously. This could be used as a renewable source of clean-burning hydrogen fuel for industrial and
transport applications (Cui, 2015). At Cambridge University, scientists have produced hydrogen (H2), a
renewable energy source from water using an inexpensive catalyst (Cambridge University research), and
the number of similar developments are increasing rapidly.
In sum, changes are taking place but they need to be identified and critically analysed. Some of these
are likely to play an important role in shaping the future direction of the hydrogen economy.
CONCLUSION: MOVING TOWARDS AN ENERGY TRANSITION
There is a clear need to begin a process of transition to clean urban transport systems in South Africa: this
cannot be done by building inflexible structures based on marginally cleaner bus technologies and
energy sources. From the analysis of choices made over the past decade, however, there appears to be
little incentive in South Africa to move away from the current approach. Some, but not all, of this may be
due to policies or the lack thereof. Governments at all levels, moreover, have moved to support policies
of their own choice such as the decision to abandon South Africa’s electric car and to encourage a
three-year alliance between Eskom and Nissan to test the latter’s electric vehicle, the Leaf, in a multi-
stakeholder partnership with the support of the departments of Environmental Affairs, Trade and Industry,
and Transport and Energy.
Other factors, such as the ups and downs of global pressures and prices are also likely to be of
119
EARTH, WIND AND FIRE
119
considerable importance in the decisions of local governments to move towards or away from clean
fuels in the transport sector. This is particularly striking in the return to natural gas as a clean fuel in the bus
sector, as we have seen above.
Within this context, what then might be some of the options to consider in moving from cleaner to clean
technologies in the urban bus transport sector and what kind of projects today will introduce the flexibility
that might enable movement towards change in the near future? Four of these stand out in particular.
First, it is important to remember that all change processes inevitably face challenges that emerge from
established habits, practices, norms and interests, or what we have called path dependence and lock-
in. Understanding these habits and practices and learning to work with and around them in a given
context is an important first step in an energy transition process.
Overcoming path dependence and lock-in require considerable knowledge about new fuel options as
they continue to emerge. In overcoming path dependence on the part of bus manufacturers and related
actors, for example, it would thus be critical to know how close to production new fuel options currently
are and, in the interim, how interchangeable they would be with existing alternative options as the
discussions of Scania and of drop-in fuels both illustrated.
Second, making decisions about moving to new fuels would also require an impartial analysis of the costs
that would be incurred and their likely evolution. In the absence of interchangeability, moreover, one
might anticipate the need for considerable collective action on the part of governments, users and
producers working together. Yet this, as we have seen, is currently elusive where policies that have been
announced are not put into practice or have been changed.
Third is the need to reduce the uncertainties that emerge under the moving conditions that characterise
energy transitions. Closer linkages between users and producers would be considerably enhanced by
greater knowledge about how interchangeable new technologies that are emerging might be and how
close these are to full development and use. The change process will also require considerable attention
to meeting the concerns of path dependence and lock-in, both of which are enhanced by the
weaknesses in carrying out policies and programmes that have been negotiated by stakeholders.
Fourth, and without being overly critical, it must be admitted that the oil and gas industry is still reluctant
to move towards clean fuels despite their recent report that shows that diesel consumption is still on the
rise in South Africa (SAPIA). Developing the capacity to work with and around such actors would be
critical. One of the options is to bring into the choice process linkages between users and producers and
their perspective on the nature of existing challenges and how these might be overcome. Closer linkages
between users and producers would also be enhanced by greater knowledge of how interchangeable
new technologies that are emerging might be and how close these are to full development and use.
In sum, moving towards an energy transition will thus require the development of new initiatives and a
longer-term perspective on new technologies and their ability to be converted into clean technologies
120
EARTH, WIND AND FIRE
120
over time. This is an important time to understand South Africa’s options and develop the strategies that
would enable movement towards an energy transition. Currently, as the above illustrates, the various
spheres of governments seem to be going their own way. That will need to change and new opportunities
for working together will have to be created.
References
Access Sarl. 2010. ‘Electrification Rurale à Base du Biocarburant le pourghère dans la commune rurale de
Garalo dans le Sud du Mali’. Bamako, Mali. Available at: http://access-mali.blogspot.com/2010/09/rural-
electrification-of-garalo.html [Accessed 30 March 2015].
ANFAVEA. 2008. Brazilian Automotive Industry Yearbook, Sao Paulo and Brasilia, Brazil: ANFAVEA
(Brazilian Automotive Industry Association).
Arup, G. B. 2013. ‘Literature review on public transport and mobility in municipalities’, South African Cities
Network (SACN).
Burrell, T. 2008. ‘Garalo Bagani Yelen, a Jatropha-fueled rural electrification project a Jatropha-fuelled
Rural Electrification for 10,000 People in the Commune of Garolo’, Mali Folkecenter (MFC), Nyetaa.
Available at: www.cleanenergyawards.com [Accessed 25 November, 2013].
Cowen, R. and S. Hultén. 1996. ‘Escaping Lock-in: the Case of the Electric Vehicle–Technology
Forecasting and Social Change’, University of Western Ontario and Stockholm School of Economics.
Available at: www.ehcar.net [Accessed 20 March 2015].
Cui, Y. 2015. ‘Stanford Researchers Develop Water Splitter for Production of Clean-burning Hydrogen
Fuel’. Available at: www.azocleantech.com [Accessed 20 July 2015].
de Bruyn, Chanel. 2009. ‘Scania, Marcopolo win BRT supply Contracts’. Engineering News.
Donnelly, L. 2015. ‘Fuel cell technology could power SA Inc.’, Mail & Guardian, South Africa. Available at:
http://mg.co.za/article/2015-05-21-fuel-cell-technology-could-power-sa-inc [Accessed 30 May 2015].
Edkins, M., Marquard, A. and Winkler, H. 2010. ‘South Africa’s renewable energy policy roadmaps’, for the
United Nations Environment Programme Research Project, Enhancing information for renewable energy
technology deployment in Brazil, China and South Africa. Cape Town: Energy Research Centre, University
of Cape Town. Available at: http://www.erc.uct.ac.za/Research/publications/10Edkinesetal-
Renewables_roadmaps.pdf
Geels, F. W., Dudley, G., Lyons, G. and R. Kemp. 2012. ‘The transition perspective as a new perspective
for road mobility study’, in Automobility in Transition? A Socio-technical Analysis of Sustainable Transport.
London, UK: Routledge.
121
EARTH, WIND AND FIRE
121
Global Energy Assessment (GEA). 2012. Cambridge, New York, Melbourne, Madrid, Cape Town,
Singapore, São Paulo, Delhi, Mexico City: Cambridge University Press. Report available at
www.globalenergyassessment.org [Accessed 15 March 2015].
Hakan Agneval. 2014. ‘Volvo Buses and ABB electro mobility cooperation’, Cision News. Available at
www.news.cision.com [Accessed 30 March 2015].
Karatzos, S., McMillan, J. D. and Saddler, J. N. 2014. The Potential and Challenges of Drop-in Biofuels’, IEA
Bioenergy Task 39 Summary.
Kigozi, R., Aboyade, A. O. and Muzenda, E. 2014. ‘Technology Selection of Biogas Digesters for OFMSW
via Multi-criteria Decision Analysis’, South African National Energy Development Institute (SANEDI).
Kinder, J. 2014. ‘Aviation Biofuels: Cleared for Take Off’, The Atlantic. Available at:
http://www.theatlantic.com/sponsored/boeing-whats-next-2014/fuels/156/ [Accessed 15 March 2015].
Lakadamyali, F. 2012. ‘Scientists produce H2 for fuel cells using an inexpensive catalyst under real-world
conditions’, Science Daily. Available at:
http://www.sciencedaily.com/releases/2012/08/120823112927.htm [Accessed 15 February 2015].
Maqekoane, L. 2013. ‘Green Buses Drive the City’, Rea Vaya Joburg.
Masondo, A. 2009. ‘Scania, Marcopolo win BRT supply contract’, Engineering News. Available at:
http://www.engineeringnews.co.za/article/scania-marcopolo-win-brt-supply-contracts-2009-01-28
[Accessed 30 March 2015].
Mehlomakulu, B. 2005. ‘Hydrogen and fuel-cell technology issues for South Africa: The Emerging debate’
in Mytelka, L. K. and G. Boyle (eds.), 2008, Making Choices About Hydrogen: Transport Issues for
Developing Countries, United Nations University Press, Tokyo and International Development Research
Centre, Ottawa, pp.324–345.
Mytelka, L. K. 2000. ‘Local Systems of Innovation in a Globalized World Economy’, Industry and Innovation,
7(1) 15–32.
Mytelka, L. K. 2008. ‘Hydrogen Fuel Cells and Alternatives in the Transport Sector: A Framework for
Aanalysis’ in Making Choices about Hydrogen: Transport Issues for Developing Countries (Editors: Lynn
Mytelka and Grant Boyle). Tokyo: UNU Press and Ottawa: IDRC Press, pp. 5–38.
Njobeni, S. 2009. ’South Africa: Switch to Clean Fuels To Cost SA R40 Billion', Business Day, South Africa.
Available at: http://allafrica.com/stories/200902270102.html [Accessed 15 February 2015].
122
EARTH, WIND AND FIRE
122
Parks, T. 2014. ‘Natural Gas is Viable’. Rea Vaya, Joburg.
Peters, D. 2011. ‘Roadmap Towards Cleaner Fuels in South Africa by 2017’, Tshwarisano LFB Investment
(Pty) Ltd. Available at:
http://www.tshwarisano.co.za/index.php?option=com_content&view=article&id=64:roadmap-towards-
cleaner-fuels-in-south-africa-by-2017&catid=49:2011-articles&Itemid=64 [Accessed 30 May 2015].
Rea Vaya News. 2015. ‘Rea Vaya Boosts Local Job Creation’. Available at: www.reaveya.org.za
[Accessed 30 March 2015].
Shankleman, J. 2014. ‘Volvo Buses Officially Launches the All-new Plug-in Electric Hybrid Bus’. Available
at: http://greenbigtruck.com/2014/10/volvo-buses-officially-launches-the-all-new-plug-in-electric-hybrid-
bus/ [Accessed 30 May 2015].
Teece, D., Dosi, G., Freeman, C., Nelson, R., Silverberg, G. and Soete, L. 1988. ‘Technological change and
the nature of the firm’, in Technical Change and Economic Theory, pp. 256–281. London, UK: Pinter.
Van Wyngaardt, M. 2014. ‘Wine Producers to Establish Ethanol Fuel Plant in Western Cape’, Engineering
News. Available at: http://www.engineeringnews.co.za/article/wine-producer-to-establish-ethanol-fuel-
plant-in-western-cape-2014-03-21 [Accessed 15 March 2015].
Vaz, E. and C. Venter. 2012. ‘The Effectiveness of Bus Rapid Transit as Part of a Poverty-Reduction Strategy:
Some Early Impacts in Johannesburg’. Available at:
http://repository.up.ac.za/bitstream/handle/2263/20221/Vaz_Effectiveness(2012).pdf?sequence=3
[Accessed 30 May 2015].
123
EARTH, WIND AND FIRE
123
Chapter 6
‘Green’ policymaking and implementation at city-
level: lessons from efforts to promote commuter
cycling in Johannesburg
Simone Haysom
ABSTRACT
While central government action to mitigate climate change stagnates and national targets remain
woefully unmet, government policy remains critical in addressing the challenge. Many international
networks and policy experts posit the role of cities and other sub-national government entities as a partial
workaround to this problem. Yet, the majority of city-level ‘solutions’ are drawn from examples taken from
the North. This chapter fleshes out the limits and opportunities of working at city level in a context like
South Africa, where many basic development goals have not yet been met.
A case study of efforts to promote commuter cycling in the City of Johannesburg explores the efforts to
promote a ‘green’ goal by local government against the backdrop of highly unequal access to mobility
and a very underdeveloped mass transit system. It analyses what has fed into impressive momentum, and
what might determine the success or failure of current efforts. Its findings point to the important role that
has been played by actors outside of government, such as cycling advocacy lobbies and the universities,
but ultimately argues that current efforts need to now focus on addressing equity issues related to making
bicycle access and the integration of cyclists in outlying townships into mass transit systems.
INTRODUCTION
At a recent conference in Pretoria on ‘Non-Motorised Transport’ (NMT), officials from the City of
Johannesburg Department of Transport declared their commitment to making Johannesburg ‘the most
cycle friendly city in South Africa’.50 This enthusiasm for commuter cycling is borne out in a range of plans
and commitments to promote cycling – from a five-year commitment to progressively expand bicycle
lanes, to behavioural change campaigns, to preventing cars from entering a large and vital business
district for an entire month as part of an eco-mobility festival to be held in 2015. A myriad smaller metros
across Gauteng are also accelerating their plans to promote non-motorised transport, as are the cities of
50 Remarks made at the Second National Non-Motorised Transport Conference Convened at Ditsong National Museum of Cultural History, organised by the Department of Environmental Affairs and Department of Transport, Pretoria, 31 October 2014.
124
EARTH, WIND AND FIRE
124
Durban and Cape Town.51
Currently, South Africa has ambitious national targets for mitigating climate change with little concrete
action to achieve them. Likewise, there is little direction from national government on promoting cycling,
but rather a national policy that focuses efforts on rural areas. Understanding the factors that have driven
the development of progressive cycling policy at city level and ensured its implementation sheds light on
how to move beyond the current climate change impasse, and might also suggest how to ‘ground’
national policies at local level in a hypothetical ‘carbon controlled’ future.
This chapter aims to contribute to our understanding of the multidimensional nature of ‘green’
policymaking and policy implementation by examining how one city has gone beyond national
leadership. In so doing, it explores the limitations and opportunities of trying to achieve ‘green’ goals
through city-level policymaking.
METHODOLOGY
Eighteen semi-structured interviews were conducted with a range of activists and lobbyists, including
those from the Johannesburg Urban Cyclists Association (JUCA); Critical Mass; the Monthly Cycles and
the organising team of the Freedom Ride; consultants working closely with local government, as well as
academics, urban planners, and former and current City of Johannesburg employees from the
Department of Planning and Development and the Department of Transport over a period of several
months between March and September 2014. Informants were specifically asked to comment on issues
related to equity, processes of policymaking and attempts to influence policy, the influence of
international networks, and how decision-making power was mediated through individual staff in the City
of Johannesburg. These interviews fed into a qualitative analysis underpinned by a review of the relevant
literature.
Observations were also undertaken through participation in commuter cycling advocacy events and
commuter cycling community recreational activities, as well as a conference organised by the
Department of Environmental Affairs and the Premier of Gauteng. Data collected by the Gauteng City
Region Observatory was used to contextualise findings.
THE ROLE OF CITIES IN MEETING ‘GREEN ECONOMY’ TARGETS
Cities are an increasingly prominent and important locus of action towards low-carbon societies. Though
their contributions are unlikely to replace national and international commitments to reduce emissions,
they can play a range of roles in fostering a transition to a low-carbon society (UN Habitat, 2011), for
example, through creating incentives in the local research and development industry, legislating against
bad practice, adopting cleaner technologies into municipal services and adopting growth strategies
51 See proceedings of the Second National Non-Motorised Transport Conference Convened at Ditsong National Museum of Cultural History, organised by the Department of Environmental Affairs and Department of Transport, Pretoria, 31 October 2014.
125
EARTH, WIND AND FIRE
125
that favour lower-carbon systems. Individual and collective actions taken by cities can have significant
results and provide a stepping-stone towards rules-based international actions to reduce and adapt to
climate change (Goldin, 2013). Higher population densities in cities mean that large numbers of people
can be reached through regulation as well as greater efficiencies in rolling out new technologies.
Municipal governments are also better able to bring together diverse stakeholders in partnerships to
tackle climate change initiatives from multiple perspectives (UN Habitat, 2011). This critical role as
‘interface’ between different groups in society is particularly important in democratic societies where
policies must be introduced to and accepted by different groups in society if they are to prove
sustainable and effective.
Cities have become important climate change actors because many governance decisions can and
have been made at city scale that are more progressive than international and even national debates.
In the US, cities such as New York, San Francisco and the City of Austin have made commitments to
reduce emissions that far outstrip the actions taken by national government (Kennan, 2014). Lutsey and
Sperling have even argued that the realisation of sub-national commitments in the US in 2008 would make
a tangible and significant impact on the national level of Greenhouse Gas (GHG) emissions (Lutsey and
Sperling, 2008). In Latin America, cities and their ‘visionary’ mayors, such as Curitiba in Brazil and Bogota
in Colombia, have begun standard examples of cutting-edge urban thinking in talk shops across the
world (Greenfeild, 2014; Jacobs, 2013; Seijas, n.d.). Across the world mayors increasingly choose to peg
their legacy on projects to ‘green’ their cities and are increasingly rewarded for it with accolades and
press attention (Green, 2013). For example, during his tenure as London Mayor, Boris Johnson publicly set
out to ‘revolutionise’ cycling in London, investing in more prominent cycle lanes and in large-scale efforts
to make cycling safer, including through training lorry drivers and improving traffic signage for drivers and
cyclists at dangerous junctions, and with recent commitments to increase integration with the
underground metro network (Walker, 2013). In New York, former mayor Michael Bloomberg has been
credited with constructing new bike lanes, improving old ones, and introducing a successful short-term
bicycle rental scheme called Citibikes, lending valuable support to a growing commuter cycling
phenomenon (The Economist, 2013).
CONTEXTUALISING THE ROLE OF CITIES IN SOUTH AFRICA
South Africa already shows promising signs of city-level initiatives in tackling climate change concerns.
Despite little guidance or leadership from the national level in operationalising goals to mitigate or adapt
to climate change, several South African cities have drawn up and begun to implement climate
adaptation plans, and there is a growing body of literature that addresses the particular dynamics that
adaptation planning has taken (Aylett, 2010; Mukheibir and Ziervogel, 2007; Roberts and O’Donoghue,
2013; Taylor, et al. 2014).
Less work has been done on mitigation. To truly maximise the amount that can be achieved at city-level,
we need to better understand the structures and cultures of local government and the dynamics of urban
politics that are specific to South Africa and how these affect policy development and implementation
at the local level.
126
EARTH, WIND AND FIRE
126
Forming partnerships and pushing an agenda related to sustainability goals in cities is by no means easy
in South Africa. There is a high level of contestation over urban services, low levels of awareness and
popular animation about sustainability issues, and the government is still locked in a large quantitative
push to deliver goods such as houses in order to redress high levels of inequality. The South African social
contract also largely understands development in marginalised areas as taking the same form as the
highly consumptive, highly environmentally destructive lifestyles in largely white middle-class suburbs
rather than alternative development paths that would emphasise, for example, compact
neighbourhoods and mixed-use development (Taylor, et al. 2014).
Issues of equity and democratic deliberation complicate efforts to suggest alternative routes of
development. How do cities justify adopting more environmentally sound technologies and practices,
which are often more expensive than ‘business as usual’ in the short to medium term, when for many
citizens basic needs such as access to sanitation and housing have not yet been met? How can
negotiations around these issues between different interests be effectively channelled into democratic
processes when issues of urban service delivery are so fractious and citizens often fail to ensure
accountability?
It is also not clear how to apply locally many of the prescriptions that seem to emerge from the
international literature. For example, the role of ‘policy entrepreneurs’, almost always in the form of an
ambitious mayor, are often held to be central to galvanising action (Bulkeley and Schroeder, 2008; Gore
and Robinson, 2009).
In South Africa, mayors have yet to feature prominently as political actors, although there is increasingly
attention given to the role of local government leaders. Cape Town is the only major city to have been
under control of the Democratic Alliance (DA), a party that is the primary opposition to the ruling party in
the national parliament. This has meant that, to a certain extent, it has been presented as a showcase
for the results of DA government, something that has highly politicised its administration and drawn a lot
of attention to the city’s leaders (Phakathi, 2014). The growing political importance of local government
can also be seen in the rise of municipal service delivery protests (Municipal IQ, 2014). In smaller metros,
it has often been local councillors who have received the brunt of criticism for the lack of, or poor quality
of, urban services. But these developments have not yet been analysed and framed in way that highlights
where local government decision-making power is really located, or how it is most effectively lobbied.
The influence of international networks also looms large in narratives of city-level change. Several of the
large South African cities are indeed enthusiastic participants in global networks that bring together cities
under the aegis of peer-to-peer learning and the showcasing of best practice amongst members. These
networks include C40 Cities Climate Leadership Group (C40) (Johannesburg is on the Steering Committee
and Cape Town is an observer city) and Local Governments for Sustainability (ICLEI) (19 South African
municipalities are members). Cape Town and Durban are seen as leaders amongst developing country
urban areas in climate change adaptation and their efforts are frequently referenced, for example, by
UN Habitat (See UN Habitat, 2011). But these networks are often referenced as evidence of momentum
rather than interrogated, with the exception of Roberts and O’Donoghue (2013), whose experience in
127
EARTH, WIND AND FIRE
127
Durban exposes that the value added by participation in these international processes is by no means
straightforward or automatic.
These themes are picked up below when the development of cycling policy in Johannesburg is analysed.
Challenges Facing Low-Carbon Transport Transition in Johannesburg
In South Africa, the energy sector is the largest contributor to CO2 emissions, having contributed around
89 per cent of emissions between 2000 and 2010 (DEA, 2013). Transport alone accounts for 10 per cent of
emissions (DEA, 2013). Addressing this requires several interventions in the transport sector, including a
move towards cleaner fuels, as discussed by Lynn Mytelka in Chapter 5 of this book, and moves to both
expand the public transport system and discourage carbon-intensive forms of travel.
Cycling fits into the mitigation landscape as it presents a carbon-free mode of commuting, or other trips.
Breaking down the carbon contribution of individual modal choices with the transport sector reveals that
19 per cent is accounted for by private vehicle trips and 11.5 per cent by trips on minibus-taxis (SANC,
2011).
However, transport planning in Johannesburg contends with a sprawling, low-density spatial form that
arose as a result of apartheid-era urban planning that sought to keep the black working class out of cities
or at least far from the urban city centre. This legacy has been further entrenched by housing and land
policy in the post-1994 era, which concentrated investment in public housing on the city outskirts, despite
the fact that employment opportunities are concentrated in one or more central nodes (Venter, 2011).
This means that many people in Johannesburg travel too far to reach their place of work for bicycle
commuting to be feasible for the entire journey.
This militates against cycling ever becoming an important primary mode of travel, although it could play
an important role as a feeder mode for public transport systems, and also replace private vehicle use for
some short trips. It would also need to replace, primarily, private vehicle use, and secondarily, public
transport use, in order to have an impact on greenhouse gas emissions. As such it should be seen as an
intervention that plays a relatively small role in a transition to low-carbon development on its own, but is
useful in tandem with the expansion of reliable, affordable and low-carbon public transport systems.
CASE STUDY: CREATING COMMUTER CYCLISTS IN JOHANNESBURG
Problem and Context
Very little is known about the existing population of bicycle commuters in Johannesburg, including
granular data about which trips they choose to make by bicycle or how far their commutes are. This
population is in any case small: in 2013, only 0.4 per cent of all trips in Johannesburg were made by bicycle
(Wray and Gotz, 2014). NMT – mixing cycling and walking – is the main mode of transport for eight per
cent of the population, but this is made up primarily of walkers. A recent ‘quality of life’ survey conducted
by the GCRO revealed that ‘many NMT users have below average quality of life compared to other

128
EARTH, WIND AND FIRE
128
transport users – a finding which challenges an emerging international argument that NMT users tend to
have higher quality of life in urban contexts’ (Culwick, 2014). The same survey revealed that 46 per cent
of cyclists (from a statistically inadequate sample) believe their infrastructure is below average or poor
(Culwick, 2014). People who use NMT tend be poorer on average than people who take public transport,
and much poorer than private car users (Culwick, 2014). This indicates that walking, and perhaps cycling
too, is primarily something people do out of necessity rather than choice at present. Several experts noted
that cyclists have historically been marginalised by policy and planning in the city, and little had been
done to ensure their safety or ease of movement through the city.
The tiny numbers of existing cyclists, and the indications that many are forced by circumstance to forego
public transport, suggests that new commuter cyclists will have to be drawn from different and more
diverse groups in order to lead to a significant modal shift while acknowledging the existing challenges
with distance. Several different strategies would need to be pursued.
Firstly, most trips in Gauteng are made to access work or to look for work, so integrating cycling with public
transport routes to economic hubs is vital, especially for people who live in peripheral suburbs (Wray and
Gotz, 2014). The greatest dissatisfaction for residents of Gauteng with their current mode of transport is
high costs (Wray and Gotz, 2014). Cycling could therefore serve as a feeder mode to reach the nearest
public transport or mini-bus pick-up point, particularly for people who wish to save on transport costs and
who currently use private transport to reach Gautrain stations, bus stops or minibus pick-up points.
Secondly, a strategy focused on wealthier residents who are private-vehicle users could encourage
people who already live close to work to cycle to reach their offices, or to conduct short trips for shopping
or social visits instead of driving.
Lastly, an important constituency of potential cyclists are school children and students (though as cycling
would primarily replace walking this would have limited impact on reducing carbon emissions). Existing
NMT users feature a higher number of learners and students than other modes, with 10 per cent of NMT
trips used to get to a place of study, compared to six per cent for other modes (Culwick, 2014). Currently
51 per cent of school children walk to school, yet only two per cent ride bicycles. School transport is an
important issue in the province as 37 per cent of households in GCRO’s survey reported having one or
more child in school. These could form ‘lead’ users in promoting commuter cycling.
One of the primary challenges that all of these strategies face is low levels of bicycle ownership and the
inability to cycle – a 2010 survey conducted by the City of Johannesburg indicated that 91 per cent of
respondents had no bicycle (though with the highest rate of bicycle ownership in relatively wealthy
suburbs) (City of Johannesburg, 2014).
Days of extremely hot weather and summer thunderstorms, the city’s undulating topography, as well
as safety concerns from both other road users and criminals are often raised anecdotally as factors that
would discourage cyclists. However, current NMT users do not list these as primary concerns.
129
EARTH, WIND AND FIRE
129
The Development of Commuter Cycling Infrastructure and Policy
Despite the significant challenges such an initiative faces, the City has nonetheless chosen to champion
cycling as part of a larger drive to improve transport. The history of this development demonstrates both
key moments when leadership propelled efforts unexpectedly, others when key opportunities were
missed, examples of innovative policies that were explored and failed, and long periods when efforts
appeared to stagnate.
Most trace the beginning of these initiatives to work done at national level to reform transport systems
across the country in 2009. This did not initially benefit an urban cycling agenda. A draft national policy
released in 2009 framed the need for NMT infrastructure with reference to poverty and transport
marginalisation, thereby making rural areas the priority for future interventions (South African Department
of Transport, 2009). The Gauteng Provincial Government has nonetheless drawn on this policy – even if
only in draft form – in designing its transport plans for the province, which is almost entirely urban (Culwick,
2014).
In 2010, the Planning Department of the City of Johannesburg itself decided to devise an NMT framework
– a somewhat weaker piece of guidance than a fully-fledged policy – but this was drawn up by the
Department of Development Planning, and failed to win over the Department of Transport.
More significant than these developments were changes to transport infrastructure and planning that
were galvanised by the preparations for the Football World Cup in 2010. This gave momentum to plans
to install a mass transit system with the government ultimately choosing to invest in a high speed rail link
between the Oliver Tambo International Airport, the Rosebank and Sandton Central Business Districts
(CBD) in Johannesburg, and Pretoria; as well as a bus-rapid transit (BRT) system modelled on systems rolled
out in Colombia and Brazil (Venter, 2013). While the core routes were completed before or shortly after
the 2010 World Cup, both of these are still in the process of being expanded to achieve greater coverage.
When the plans and strategy for implementing were first drawn up, the City had the intention to include
infrastructure in the stations and sensitivity in the planning of the network to integrate cyclists. But,
according to officials who were involved at that period, time pressure prevented NMT concerns from
being taken into great account or infrastructure for cycle storage included in the stations.
The big project for the time was the Rea Vaya Bus Rapid Transport. The focus on NMT was always a part
of the vision for that project. Somewhere along the line, because we got so involved in taxi industry
negotiations, the focus on NMT infrastructure got downplayed (Interview, 28 May 2014).
Many respondents lamented that NMT had been an ‘afterthought’ to BRT and that opportunities to
create cycling parking space or facilitate the integration of cycling with the BRT and Gautrain systems
was not made possible. Currently, it is not possible to take a bicycle on BRT or Metrorail trains, and there
is no safe cycle parking near their stations. Bicycles can only be brought on the Gautrain if they are in
bag, but even this loophole is not widely publicised and the guards will deny entry to anyone not
complying with this rule (Hucthinson, 2014). In effect, it is impossible for cyclists to integrate their journeys
130
EARTH, WIND AND FIRE
130
with trips on public mass transit.52 To this day the City maintains that they cannot allow bikes on trains and
buses because of safety concerns (bikes injuring other commuters) and the lack of space during peak
hours.
Nonetheless, the measures taken during the World Cup catapulted Johannesburg’s transport
infrastructure and mainstreamed a range of ‘green’ concerns as well as a desire to present the City as
one with ‘modern’ and ‘global’ infrastructure. It also created ring-fenced funding for transport and the
requirement that new integrated transport plans include attention to cycling and walking facilities.
Additionally, some of the cycle lanes coming to completion only now were also initiated in this period.
The network of bicycle lanes in Soweto and Orlando have their origins in a grant offered by the German
Bank for Reconstruction and Development (KWV) for projects that promoted ‘green energy’ (including
energy savings or efficiency) that could be showcased at the World Cup. The Soweto-Orlando
municipality won funding for their cycle routes but, due to the slow speed of local government
implementation, these lanes were only completed in 2014, nearly four years later.
Between 2010 and 2014, there was little evidence of progress: infrastructure remained incomplete, safety
hazards were acute and a vital opportunity to achieve crucial integration with mass transit had been
missed. If projects promoting the interests of pedestrians or cyclists got implemented they were generally
ad hoc: ‘NMT was an afterthought to Mass Transit. … Small NMT projects got done by individual ward
councillors to get some political mileage, as they were easily funded (Interview, June 8 2014).’
Advocates within and outside of local government also remarked upon what they perceived as strong
’hostility’ to the idea that cycling could be promoted in Johannesburg in the face of the challenges
outlined above. One informant, who had close involvement in transport policy work in local government,
said: ‘Part of the problem was the idea that “these are nice concepts from the rest of the world but they
are not practical for Johannesburg” (Interview, June 8, 2014).’ Another remarked that the Department of
Transport responded to the cycle agenda as if it were ‘fundamentally opposed to the identity of the City’
(Interview, 8 June 2014). During the period before and shortly after the World Cup, at least one senior
figure had made major strides with promoting ‘eco-mobility’. But after this official left there was the sense
that cycling lacked a champion within local government.
From around 2012, cycling advocacy groups began to lobby the city more forcefully to take measures
to promote cycling. Many people who had been directly and indirectly involved in meetings between
the city and these groups felt that plans and suggestions had been met with a high degree of negativity
from local government; in return, civil society was also perceived to have unrealistic expectations about
how long it takes for local government to implement decisions once they have been taken due, primarily,
to the slow bureaucracy around tender processes. At times, dialogue between these civil society groups
and local government threatened to break down.
Informants inside and outside of the city remarked on a shift in early 2014. Around this time an individual
52 It is unclear what the response from the minibus taxi industry would be, but the passenger would likely have to purchase multiple fares
to make up for the space the bicycle occupies and responses would vary from operator to operator.
131
EARTH, WIND AND FIRE
131
involved in cycling advocacy who had good lines of communication with local government put forward
a proposal for an event that would promote commuter cycling under the banner of commemorating the
death of former president Nelson Mandela. The ‘Freedom Ride’ would symbolically link the heart of the
city with the formerly marginalised, outlying suburb of Soweto (Freedom Ride, 2014).
In 2014, several other plans that had been under development began to bear fruit. Cycle lanes linking
the city’s main universities began to be constructed and cycle lanes in Soweto reached completion.
Initially, these lanes will be shared with other road users; over time, they will be upgraded and dedicated
for cyclists’ use only, and some will have physical barriers that separate them from motor vehicle lanes.53
These have been accompanied by strong statements of support for the commuter cycling agenda by
the office of the mayor, such as repeated statements that: ‘Over time, we will eliminate the need for
private vehicles as the city progressively moves towards an effective public transport system, cycling lanes
and pedestrian walkways (Güles, 2013) see also (Samuels, 2014; Tau and Bloomberg, 2014).’
The city met with the universities to discuss the promotion of cycling on campuses and met monthly with
a range of civil society actors at the Jozi Cycle Forum to discuss plans, including a way of finding a system
and the sponsorship of a ‘Bicycle Empowerment Network’ centre in Soweto which would offer affordable
bicycle repair. A second ‘Freedom Ride’ was held in June 2014. Plans for 2015 are even more ambitious.54
Several policies have also consolidated around the push for NMT: Complete Streets and the Corridors of
Freedom.55 The challenges to adoption of cycling appear to be acknowledged. The City of
Johannesburg acknowledges the challenge that low density urban sprawl poses for the cycling agenda
by limiting its investment to connecting cyclists with destinations 2.5km to 6km from their homes or
workplace (City of Johannesburg, 2014). On paper, the city’s approach to cycling encompasses
infrastructure as well as behaviour change (safety training and promotion) and access to bicycles. In
practice, the provision of infrastructure is in a more advanced state than the other ‘pillars’ (see Box 1)
and, anecdotally, cycle lanes alone do not appear to be translating into greater numbers of trips by
bicycle.
53 These will link the University of Johannesburg and the University of the Witwatersrand, and lanes will also be laid down in Orange Farm and Ivory Park. These join 5.5km of lanes almost complete in Orlando, Soweto. 54 Two large cycling promotion events will take place: a ‘Freedom Ride’, preceded by a week’s worth of events and a large NMT conference, and an ‘Eco-Mobility’, co-sponsored by ICLEI, which will shut down parts of the busy Sandton precinct to cars. 50km of ‘Complete Streets’ will be laid down in Hillbrow, Sophiatown and Langlaagte, and dedicated cycling infrastructure, including a cycle bridge over a busy highway, are scheduled to be constructed in 2015 (City of Johannesburg, 2014). 55 ‘Corridors of Freedom’ policy aims to direct economic development towards major transport arteries and ‘Complete Streets’ aims to
redesign streets to accommodate pedestrians, cyclists, the disabled and a range of users other than cars.
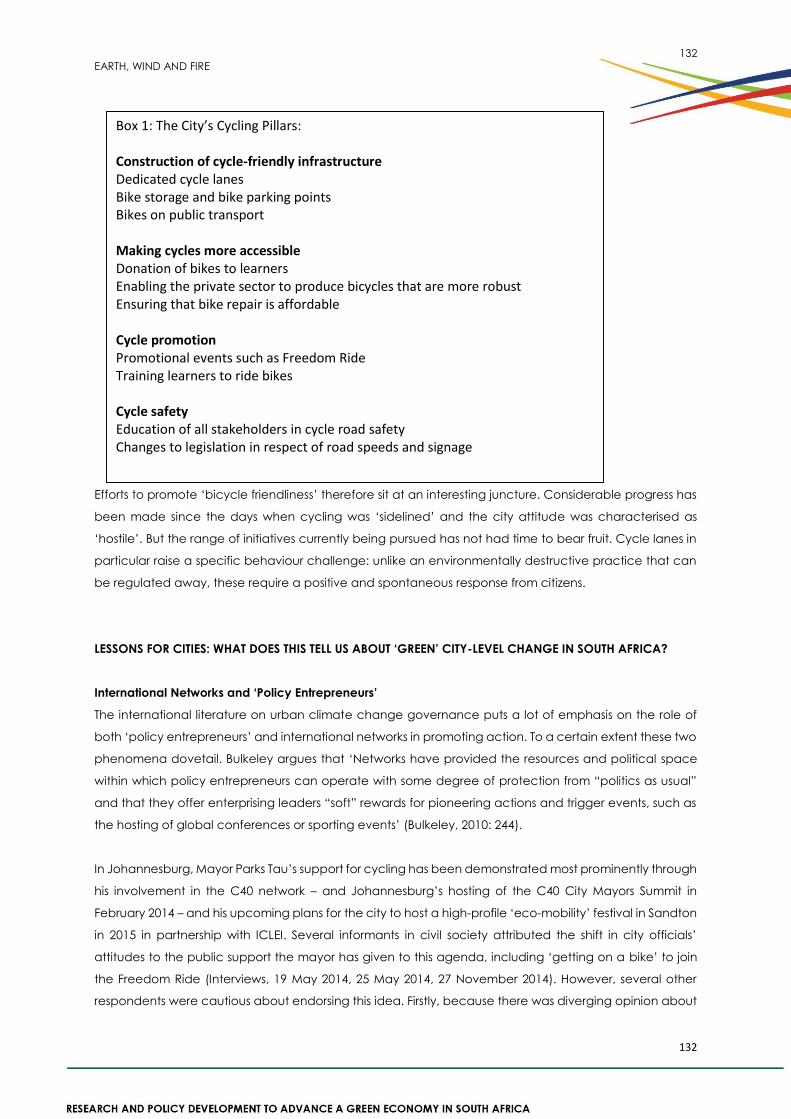
132
EARTH, WIND AND FIRE
132
Efforts to promote ‘bicycle friendliness’ therefore sit at an interesting juncture. Considerable progress has
been made since the days when cycling was ‘sidelined’ and the city attitude was characterised as
‘hostile’. But the range of initiatives currently being pursued has not had time to bear fruit. Cycle lanes in
particular raise a specific behaviour challenge: unlike an environmentally destructive practice that can
be regulated away, these require a positive and spontaneous response from citizens.
LESSONS FOR CITIES: WHAT DOES THIS TELL US ABOUT ‘GREEN’ CITY-LEVEL CHANGE IN SOUTH AFRICA?
International Networks and ‘Policy Entrepreneurs’
The international literature on urban climate change governance puts a lot of emphasis on the role of
both ‘policy entrepreneurs’ and international networks in promoting action. To a certain extent these two
phenomena dovetail. Bulkeley argues that ‘Networks have provided the resources and political space
within which policy entrepreneurs can operate with some degree of protection from “politics as usual”
and that they offer enterprising leaders “soft” rewards for pioneering actions and trigger events, such as
the hosting of global conferences or sporting events’ (Bulkeley, 2010: 244).
In Johannesburg, Mayor Parks Tau’s support for cycling has been demonstrated most prominently through
his involvement in the C40 network – and Johannesburg’s hosting of the C40 City Mayors Summit in
February 2014 – and his upcoming plans for the city to host a high-profile ‘eco-mobility’ festival in Sandton
in 2015 in partnership with ICLEI. Several informants in civil society attributed the shift in city officials’
attitudes to the public support the mayor has given to this agenda, including ‘getting on a bike’ to join
the Freedom Ride (Interviews, 19 May 2014, 25 May 2014, 27 November 2014). However, several other
respondents were cautious about endorsing this idea. Firstly, because there was diverging opinion about
Box 1: The City’s Cycling Pillars: Construction of cycle-friendly infrastructure Dedicated cycle lanes Bike storage and bike parking points Bikes on public transport Making cycles more accessible Donation of bikes to learners Enabling the private sector to produce bicycles that are more robust Ensuring that bike repair is affordable Cycle promotion Promotional events such as Freedom Ride Training learners to ride bikes Cycle safety Education of all stakeholders in cycle road safety Changes to legislation in respect of road speeds and signage
133
EARTH, WIND AND FIRE
133
whether the mayor’s support had involved tangible expenditure of political capital, or if it was more a
case of an opportunistic recognition of the political mileage to be gained from associating his tenure with
infrastructure which, while initiated many years ago, is only bearing fruit now. It is also clear from the
narrative described above that the city’s Department of Transport has been the primary power holder
on the issue of cycling. This department comes with its own political head in the form of the MMC for
Transport. Department of Transport staff emerge as having a real acceleration or chilling effect on policy
implementation.
People with direct experience of participating in international networks were surprisingly mixed in their
assessment of these too. Several informants commented that they felt these forums were often used to
push private sector interests, or the political careers of particular high-profile participants without a clear
benefit for participating cities. According to one local government staff member, one set of meetings
had been used to push the sale of electric cars, raising questions about whose agenda was being served:
‘To what extent are the discussions on sustainability and environment in these forums driven by economic
interest over and above what is good for the planet? (Interview, 28 May 2014).’ Another informant
described them as ‘a cheap and easy to way to tap into a “world class narrative” in which cycle lanes
are a “buzzword” (Interview, 22 September 2014)’. At the same time, networks were seen to have a
following in disseminating ideas and practices across the world. ‘These forums are useful for the sharing,
replication and modification of ideas and in order for cities to have a sense of clarity about their own
areas of focus (Interview, 28 May 2014).’
More fundamentally, officials within the city downplayed both the role of international networks and the
support of the mayor and attributed their own watershed moment with the cycling agenda to the
Freedom Ride. The fact that it was seen as a ‘success’ and generated good publicity for the
administration amongst local citizens had warmed officials to cycling, which they had previously worried
was a niche interest.
Civil Society and Deliberative Democracy
Action by the city has been tied to pressure and incentives from external organisations in several respects,
and much of it was the fruit of projects initiated many years previously. The first phase of cycle lanes
connects the CBD with the University of the Witwatersrand and the University of Johannesburg, and this
location has its origin in a proposal brought forward by the universities themselves to improve student
transport (not specifically cycle lanes). The cycle lanes in Orlando, as mentioned above, have their origins
in German development financing.
The advocacy group JUCA has also played an important technical role. JUCA, which ‘represents bike
commuters and aims to promote a bike-friendly Jo’burg’ researched and designed a set of possible cycle
routes for the city which would ‘link up residential and commercial centres, and which can be established
comparatively easily with a limited and specific infrastructure intervention by the City’ (JUCA, 2014). They
have also proposed a way-finding system to accompany this – a proposal the City has accepted and
assigned funding towards. Additionally, they have been consulted for technical input into the design of
the cycle lanes being rolled out and have provided feedback on their experience of the lanes as cyclists
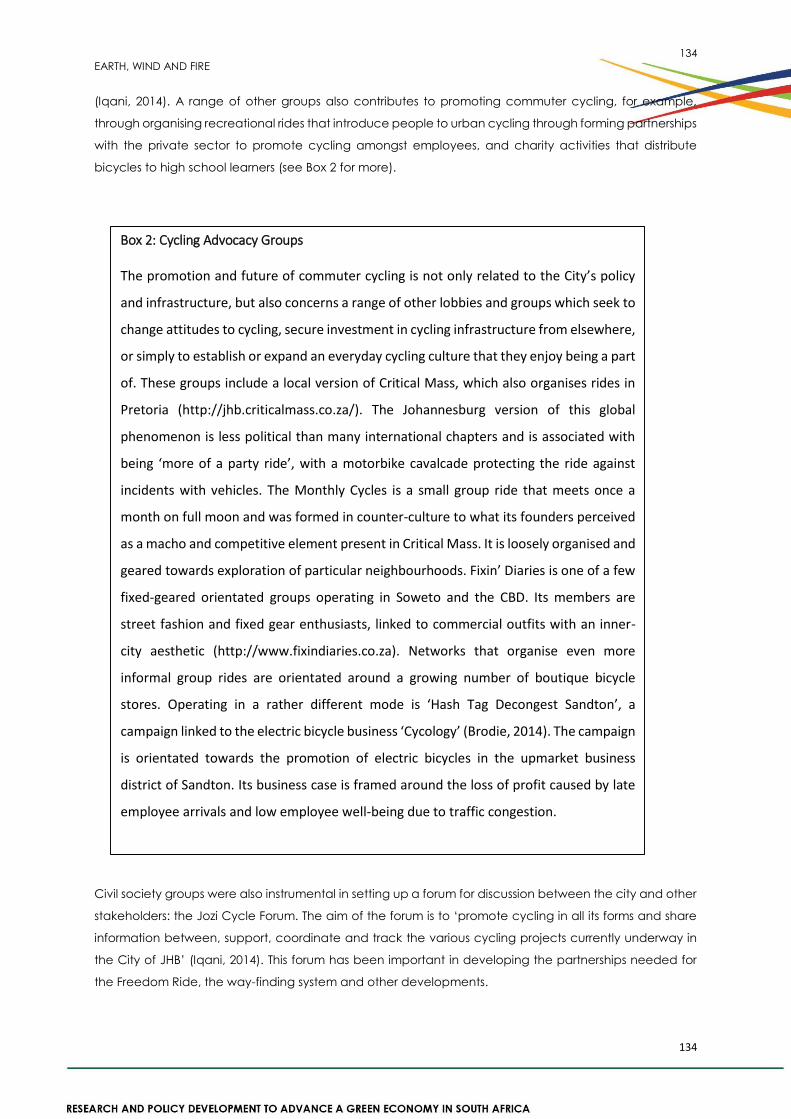
134
EARTH, WIND AND FIRE
134
(Iqani, 2014). A range of other groups also contributes to promoting commuter cycling, for example,
through organising recreational rides that introduce people to urban cycling through forming partnerships
with the private sector to promote cycling amongst employees, and charity activities that distribute
bicycles to high school learners (see Box 2 for more).
Civil society groups were also instrumental in setting up a forum for discussion between the city and other
stakeholders: the Jozi Cycle Forum. The aim of the forum is to ‘promote cycling in all its forms and share
information between, support, coordinate and track the various cycling projects currently underway in
the City of JHB’ (Iqani, 2014). This forum has been important in developing the partnerships needed for
the Freedom Ride, the way-finding system and other developments.
Box 2: Cycling Advocacy Groups The promotion and future of commuter cycling is not only related to the City’s policy
and infrastructure, but also concerns a range of other lobbies and groups which seek to
change attitudes to cycling, secure investment in cycling infrastructure from elsewhere,
or simply to establish or expand an everyday cycling culture that they enjoy being a part
of. These groups include a local version of Critical Mass, which also organises rides in
Pretoria (http://jhb.criticalmass.co.za/). The Johannesburg version of this global
phenomenon is less political than many international chapters and is associated with
being ‘more of a party ride’, with a motorbike cavalcade protecting the ride against
incidents with vehicles. The Monthly Cycles is a small group ride that meets once a
month on full moon and was formed in counter-culture to what its founders perceived
as a macho and competitive element present in Critical Mass. It is loosely organised and
geared towards exploration of particular neighbourhoods. Fixin’ Diaries is one of a few
fixed-geared orientated groups operating in Soweto and the CBD. Its members are
street fashion and fixed gear enthusiasts, linked to commercial outfits with an inner-
city aesthetic (http://www.fixindiaries.co.za). Networks that organise even more
informal group rides are orientated around a growing number of boutique bicycle
stores. Operating in a rather different mode is ‘Hash Tag Decongest Sandton’, a
campaign linked to the electric bicycle business ‘Cycology’ (Brodie, 2014). The campaign
is orientated towards the promotion of electric bicycles in the upmarket business
district of Sandton. Its business case is framed around the loss of profit caused by late
employee arrivals and low employee well-being due to traffic congestion.
135
EARTH, WIND AND FIRE
135
While the relationship between the city and NGO groups has been – and may continue to be – volatile,
an independently facilitated forum appears to have laid the groundwork for important interactions.56 ‘For
me it has been one of the most constructive partnerships with civil society. They don’t ask for money and
stipends. They come into town to meet us …’ explained one city official. ‘Sometimes they drive me up
the wall with all the debates … but the commitment, the volunteerism is great. I think that’s what makes
Johannesburg a dynamic city (Interview, 30 October 2014).’ An advocate emphasised that they saw
their role as representing groups who would not otherwise engage: ‘It’s important to build a constituency
of people who will raise their voice. People have been commuting by riding bikes for years, but they
remain very marginalised (Interview, 28 May 2014).’ A former government employee remarked that lobby
groups had been important in creating accountability: ‘It’s the ability to ask the right questions, to make
sure the projects committed to have been implemented, and that, as consultant and professional teams
are brought on board, the voice of community groups are not lost (Interview, 28 May 2014).’
Equity Concerns
The City of Johannesburg has explicitly framed cycling as an intervention that achieves several
objectives, many of which are not environmental. A promotional presentation in current use by the city
identifies the following four points as core elements of the ‘business case’ for greater investment in NMT:
Reduces congestion57
Reduces CO2 emissions, improves air quality and reduces noise in our neighbourhoods
Improves fitness and health of our communities
More people on our streets walking and cycling breaks down barriers and improves active
citizenry
The shift to promoting a greater modal share for cycling is presented as resolving citywide problems and
social cohesion. So far, its concrete manifestation has been through the construction of bicycle lanes.
Lanes, while taking the safety of cyclists seriously, do not solve the problem of distance raised above in
relation to the city’s unequal development. In Europe, four to six kilometres is considered an acceptable
cycling distance and most people will not commute longer than this. In South Africa, average commutes
are at least five to 10 kilometres,58 with people coming from outlying townships travelling far further. The
distance between Soweto and the old Johannesburg CBD is around 25km – the distance from Soweto to
the northern CBD, Sandton, is around 40km. One policy expert commented: ‘If your trip is 25km, a bike
lane isn’t going to make that trip any shorter, or to allow you to pick up a child or go shopping. In a place
like Jo’burg, the issue is really about distance and trip chaining. So a bike lane won’t really make a
difference (Interview, 22 September 2014).’
The city acknowledges this reality and aims to first target those people who are travelling shorter
56 One cycling advocate described how having the city facilitate the meeting had almost caused the discussion to break down: ‘we used to have a logjam with the city … it didn’t work having the city as facilitator. They were convening meetings but also having to defend themselves (Interview, 19 May 2014).’ 57 Of all of these, congestion is perhaps the most directly motivational for the City, lobby groups and business. The province’s population has doubled in the last 20 years, and will double again in the next 25, and the working population itself will increase to 1.75 times its current size (Second Non Motorised Transport Conference, 2014). A recent travel survey by the City of Johannesburg noted that the proportion of people using private vehicle rose from 53 per cent in 2010 to 57 per cent in 2014. The average trip time is 51 minutes (Minutes of Jozi Cycle Forum Meeting). 58 Statistics provided by cycling policy expert interviewed for this paper.
136
EARTH, WIND AND FIRE
136
distances, and this can be effective at linking people for discreet trips (e.g. to school, the shops, to work
if nearby). Cycling infrastructure has also been located both in the multi-ethnic and mixed class CBD, and
in predominantly low-income suburbs like Soweto (though in the more middle-class area of Orlando), and
the plans for infrastructure leading out of Alexandra are in the final stages of completion. However, it is
clear that cyclists, particularly in historically marginalised outlying suburbs, will not be integrated in a
citywide transport network unless they can combine journey by bicycle with trips on public transport.
Another crucial determinant of whether cycle lanes are used will be bicycle access, which is currently
heavily class based. A 2010 survey by the City of Johannesburg revealed that 91 per cent of the city’s
inhabitants do not own a bicycle. Research done by the city indicates that a sturdy bike would cost a
household a minimum of R2,150 (City of Johannesburg, 2014). In a city where many households live near
the poverty line, this is unaffordable. This currently presents perhaps the most difficult problem facing the
cycling agenda. While the city was initially enthusiastic about using affordable bike-share schemes to get
around this problem, extensive feasibility studies have deemed this to be an unrealistic option for the city,
highlighting concerns about affordability, security and safety, as well as the persistent problem of low-
density development and long commute distances (City of Johannesburg, 2014). An existing government
initiative that donates bicycles to learners, the Shova Kalula programme, has had poor results, having
woefully failed to meet targets for distribution and with a number of the bicycles being sold on or falling
into disrepair when those who receive them cannot afford to fix or them or have no access to bicycle
mechanics.
The risks of neglecting these aspects of cycling promotion are acute, as policy failure may result in a
backlash. One informant in local government expressed his concerns as such:
The other worry for me that might cause problem[s] is the cost of implementing the cycle lanes. In
Diepsloot [a poor township on the outskirts of the city] there is no clinic. With 20 million you can build a
clinic. Or provide toilets. Or water. The cycle lanes don’t come cheap. One day somebody is going to
say – maybe the Economic Freedom Fighters – why are all these bicycle lanes here and no one is using
them? (Interview, 30 October 2014).
CONCLUSIONS
The City of Johannesburg’s progress with implementing a cycling-friendly agenda has shown great
momentum, which continues to build. But it is not yet fully addressing major blockages, such as poor
access to bicycles and lack of integration with public transport, which will enable potential users to make
use of its investment in infrastructure.
At a more general level, the development of commuter cycling infrastructure and policy in Johannesburg
demonstrates some of the internal politicking in local government that allows such schemes to be
championed and implemented, and which may also slow or stall progress. These processes do not
happen independently of outside actors, which include a range of lobby groups that can serve to
increase accountability or to divert policy towards parochial concerns.
137
EARTH, WIND AND FIRE
137
Lessons can be drawn for other cities and other policy issues that require galvanizing action from a range
actors and encouraging citizen behaviour change under an umbrella of supportive policy led by local
governments.
Recommendations:
Current cyclists, while not numerous, are a constituency which has been marginalised in policy
and debate. More hard data should be collected about when, how often, and under what
conditions people currently cycle. Data should also be collected and monitored about road
accidents involving cyclists.
With cycle lanes underway and nearing completion for many key routes, the primary obstacles
to greater uptake of cycling lie in bicycle access and integration into a functioning mass transit
system.
Making bicycles and their repair affordable for low-income citizens should be a major priority of
further work. As bicycle-share schemes have been found not to be feasible, this is likely to rest on
models that rely on the state (or its NGO partners) providing bicycles at little or no cost, as in the
model put forward by Qhubeka.59 Solutions could also be sought through partnership with the
private sector, such as through a ‘Ride to Work’ as in the UK,60 though this only reaches people
in formal employment.
The integration of bicycles into other forms of public transport, such as the trains and buses, is
crucial to linking cyclists in far-flung suburbs with destinations in the city centre. While space
constraints may prevent this in peak hours, a system could be devised to allow bicycles on buses,
trains and the Gautrain during off-peak hours initially. This should be accompanied with safe
bicycle parking at stations.
Given the large challenge posed to eco-mobility solutions such as cycling by the vast distances
created by South Africa’s incredibly low-density urban development, the commuter cycling
cause must also be linked to demands to improve the public mass transit system and also for
policies that encourage densification of existing settlements.
The partnership between the state, private sector, universities and lobby groups feeds into
accountability and the momentum for policy implementation, as well as improving the content
of policies by providing ‘user’ input. Two initiatives appear to have galvanized and smoothed this
dynamic: an event, in the form of the Freedom Ride, for different actors to lobby around, and a
neutral forum to air grievances and coordinate action in the form of the Jozi Cycle Forum. These
could be replicated in other cities to strengthen momentum towards promoting cycling.
International networks, on the other hand, have had much more muted value. While the value
they have added in disseminating ideas and providing incentives for cities to excel as ‘pioneers’
in environmental innovation should be further examined, there is also an argument for directing
investment (of time and personnel) towards extending partnerships at the local level instead. For
59 Qhubeka is a not-for-profit organisation that donates hardy bicycles to its target groups (including school children and health care
workers) in exchange for their contributions through community work or as part of a contract involving, e.g. school attendance. http://qhubeka.org/2013/?page_id=30 60 This scheme enrols employers in helping their employees to buy ‘tax-free’ bikes, allowing an average saving of 50 per cent on the price of a new bike. http://www.cyclescheme.co.uk/
138
EARTH, WIND AND FIRE
138
example, with groups concerned with the safety of (child) pedestrians en route to school, or small
businesses that could benefit from foot (and cycle) traffic.
References
Aylett, A. 2010. 'Conflict, Collaboration and Climate Change: Participatory Democracy and Urban
Environmental Struggles in Durban, South Africa', International Journal of Urban and Regional Research,
34: 478–495. DOI: 10.1111/j.1468-2427.2010.00964.x.
Bulkeley, H. 2010. 'Cities and the Governing of Climate Change', Annual Review of Environment and
Resources, 35, 229–253. DOI: 10.1146/annurev-environ-072809-101747.
Bulkeley, H. and Schroeder, H. 2008. 'Governing Climate Change Post-2012: The Role of Global Cities –
London', Tyndall Centre Working Paper 123. Oxford: Tyndall Centre. Available at:
www.tyndall.ac.uk/content/governing-climate-change-post-2012-role-global-cities-london [Accessed
10 May 2015].
City of Johannesburg. 2014. 'Making Joburg a cycle friendly City: a call for partnership', Powerpoint
presentation used by the City of Johannesburg throughout 2014.
Department of Environmental Affairs (DEA). 2013. GHG Inventory for South Africa 2000–2010, August 2013,
research report commissioned by the DEA and published online. Available at:
https://www.environment.gov.za/sites/default/files/docs/greenhousegas_invetorysouthafrica.pdf
[Accessed 9 January 2015].
Freedom Ride. 2014. Freedom Ride – Jozi 2014.
Available at: www.freedomride.co.za/joburg/ [Accessed 10 May 2014].
Gore, C. D. and Robinson, P. J. 2009. 'Local Government Responses to Climate Change: Our Last, Best
Hope?', Changing climates in North American Politics: Institutions, Policymaking and Multilevel
Governance. Ed. Henrik Selin and Stacy Van Deveerr. Cambridge: MIT Press. 137–158.
Green, E. 2013. 'Can Mayors save the World?' The Atlantic.
Greenfield, A. 2014. 'Buses are the future of urban transport. No, really'. The Guardian.
Güles, N. 2013. 'Newsmaker – Parks Tau: My vision for Joburg'. City Press.
Hutchinson, J. L. 2014. 'How to smuggle a bicycle onto the Gautrain'. Johannesburg: Urban Cyclists
Association.
Iqani, M. 2014. 'Cycling Lanes are coming to Johannesburg'. Johannesburg: Urban Cyclists Association.
Iqani, M. 2014. 'Feedback on Braamfontein Cycle Lanes'. Johannesburg: Urban Cyclists Association.
139
EARTH, WIND AND FIRE
139
Jacobs, E. 2013. 'Why mayors have more chance of saving the world than global leaders do'. TED Blog.
JUCA, n.d. 'About JUCA'. Johannesburg. Urban Cyclists Association.
Kennan, H. 2014. 'Cities Step Up in Fight Against Climate Change', Energy Innovation. Available at:
http://energyinnovation.org/2014/10/cities-step-up-in-fight-against-climate-change/ [Accessed 10 May
2014].
Lutsey, N. P. and Sperling, D. 2008. 'America’s Bottom-Up Climate Change Mitigation Policy'. Institute of
Transportation Studies. UC Davis: Institute of Transportation Studies (UCD).
Mukheibir, P. and Ziervogel, G. 2007. 'Developing a Municipal Adaptation Plan (MAP) for climate change:
the city of Cape Town'. Environment and Urbanization, 19: 143–158. DOI: 10.1177/0956247807076912.
Municipal IQ. 2014. '2014 protests may reach new peak', 4 September.
Phakathi, B. 2014. 'Zille slams politicisation of Western Cape projects', Business Day Live, 8 August.
Roberts, D. and O’Donoghue, S. 2013. 'Urban environmental challenges and climate change action in
Durban, South Africa', Environment and Urbanization, 25: 299–319. DOI: 10.1177/0956247813500904.
Samuels, S. 2014. 'Joburg set to become more bicycle friendly', Midrand Report.
Seijas, A. 2014. 'Cities for People', Americas Quarterly, Winter 2014.
South African Department of Transport. 2009. 'Draft National Non-Motorised Policy'.
Tau, P. and Bloomberg, M. 2014. 'Green cities can help breathe new life into nations’ growth', Business
Day Live. Available at: www.bdlive.co.za/opinion/2014/10/13/green-cities-can-help-breath-new-life-into-
nations-growth [Accessed 10 May 2014].
Taylor, A., Cartwright, A., Sutherland, C. 2014. 'Institutional Pathways for Local Climate Adaptation: A
Comparison of Three South African Municipalities'. Agence Francais de Developement.
The Economist. ‘2013 Cycling in New York: End of a lovely ride?’ 3 December. Available at:
http://www.economist.com/blogs/democracyinamerica/2013/12/cycling-new-york [Accessed 9
January 2015].
UN Habitat, 2011. 'Climate Change Mitigation Responses in Urban Areas'. UN Habitat, Geneva.
Venter, C. 2011. 'Transport expenditure and affordability: The cost of being mobile'. Development Bank of
South Africa, 28, 121–140. DOI: 10.1080/0376835X.2011.545174.
140
EARTH, WIND AND FIRE
140
Venter, C. J. 2013. 'The lurch towards formalisation: lessons from the implementation of BRT in
Johannesburg, South Africa', Research in Transportation Economics, Vol. 39, 1: 114–120. DOI:
10.1016/j.retrec.2012.06.003.
Walker, P. 2013. 'Boris Johnson vows to continue London's "cycling revolution",' The Guardian, 9 December
2013. Available at: http://www.theguardian.com/uk-news/bike-blog/2013/dec/09/boris-johnson-
london-cycling-revolution [Accessed 9 January 2015].
Wray, C. and Gotz, G. 2014. 'Mobility in the Gauteng City-Region'. Johannesburg: Gauteng City-Region
Observatory.
ANNEXURE: PEOPLE INTERVIEWED AND ORGANISATIONAL AFFILIATION
1. Interview with Njogu Morgan, JUCA, 28 May 2014.
2. Interview with Rehanna Moosajy, former MEC for Transport, Gauteng, 28 May 2014.
3. Interview with Christina Culwick, GCRO focal point for NMT, 2 April 2014.
4. Interview with Geoff Bickford, SACN, 3 April 2014.
5. Interview with Thomas Coggin, Urban Joburg, 31 July 2014.
6. Interview with Carolyn Frick, formerly with the Department of Planning, City of Johannesburg and
author of the NMT guidelines, June 8 2014.
7. Interview Gail Jenning, independent consultant specialising in NMT, 22 September 2014.
8. Interview with Marcela Gerrero Casa, Director of Open Streets Cape Town, 7 September 2014.
9. Interview with Melvin Neale, co-organiser of Critical Mass, 25 May 2014.
10. Interview with Michael Flanagan: Master Students at WITS focusing on Eco-mobility, 31 July 2014.
11. Interview with David Du Preez, JUCA, 27 November 2014.
12. Interview with Mehita Iqani, Monthly Cycles, 27 November 2014.
13. Interview with Hastings Chikoko, C40, 15 April 2014.
14. Interview with Lisa Seftel, Executive Director, Department of Transport, City of Johannesburg, 30
October 2014.
15. Interview with Crispin Olver, LinkD and Chair of Jozi Cycle Forum, 19 May 2014.
16. Interview with Simphiwe Ntuli, City of Johannesburg, 30 October 2014.
17. Interview with Esther Lethlaka, City of Johannesburg, 30 October 2014.
18. Interview with Daisy Dwango, City of Johannesburg, 30 October 2014.
141
EARTH, WIND AND FIRE
141
CHAPTER 7
The Energy and Water Nexus: The Case for an
Integrated Approach for the Green Economy in
South Africa
Manisha Gulati
INTRODUCTION
The fundamental requirement of any economy is that it delivers food, water and energy security for all.
In a green economy this will be provided by renewable energy; green buildings, including green retrofits
for energy and water efficiency; clean transportation utilising alternative fuels, hybrid and electric
vehicles (see Mytelka’s Chapter 5); water management, including water demand management and
conservation, water reclamation, purification and recycling such as industrial and domestic effluent;
waste management (see Pilusa and Mazenda’s Chapter 8), brownfield remediation and sustainable
packaging; and land management, including organic agriculture, habitat conservation and restoration,
urban forestry and parks, reforestation and afforestation and soil stabilisation (PwC, 2011). From the
foregoing, it is clear that water and energy are key components of the green economy.
At a simplistic level, the relationship between water and energy pertains to energy intensity in the water
sector or the amount of energy needed for extracting, treating, transporting and distributing water,
disposing of waste water, and water intensity in the energy sector or the amount of water needed for
harnessing, extracting, producing and transmitting energy. Decisions about one can exacerbate scarcity,
or enable better management of the other from the perspective of conservation, consumption
efficiency, and reuse and recycling (of water). The energy-water relationship, therefore, goes beyond
simple footprint calculations and involves an understanding of the interdependencies and complications
of water and energy.
This relationship or nexus of water and energy is one of the key entry points into the green economy
debate and solutions. The philosophy of the green economy requires increased resource use efficiency,
improving energy and water security, securing sustainable access to water and energy, and maximising
the social amenity of energy and water. A nexus approach will support the transition to a green economy
by creating opportunities for addressing synergies and trade-offs across these two sectors and enhancing
policy coherence. Appreciation of this nexus will also highlight the set of green investment opportunities
that are starting to emerge.
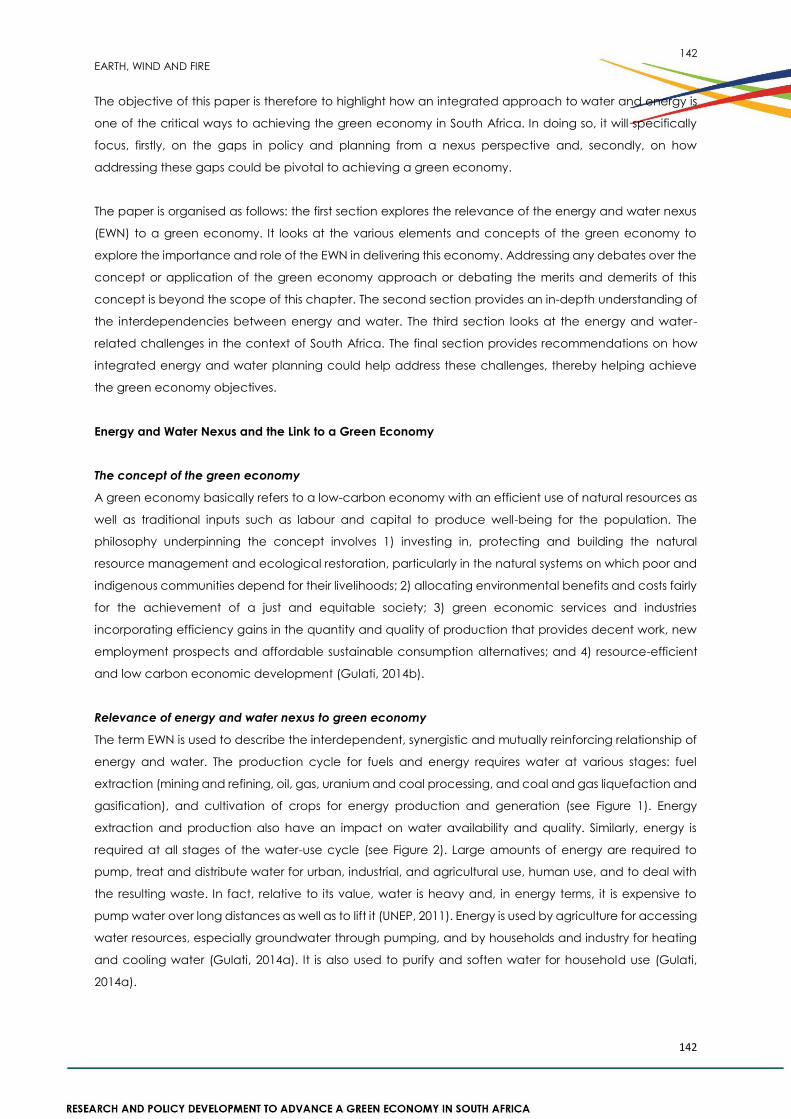
142
EARTH, WIND AND FIRE
142
The objective of this paper is therefore to highlight how an integrated approach to water and energy is
one of the critical ways to achieving the green economy in South Africa. In doing so, it will specifically
focus, firstly, on the gaps in policy and planning from a nexus perspective and, secondly, on how
addressing these gaps could be pivotal to achieving a green economy.
The paper is organised as follows: the first section explores the relevance of the energy and water nexus
(EWN) to a green economy. It looks at the various elements and concepts of the green economy to
explore the importance and role of the EWN in delivering this economy. Addressing any debates over the
concept or application of the green economy approach or debating the merits and demerits of this
concept is beyond the scope of this chapter. The second section provides an in-depth understanding of
the interdependencies between energy and water. The third section looks at the energy and water-
related challenges in the context of South Africa. The final section provides recommendations on how
integrated energy and water planning could help address these challenges, thereby helping achieve
the green economy objectives.
Energy and Water Nexus and the Link to a Green Economy
The concept of the green economy
A green economy basically refers to a low-carbon economy with an efficient use of natural resources as
well as traditional inputs such as labour and capital to produce well-being for the population. The
philosophy underpinning the concept involves 1) investing in, protecting and building the natural
resource management and ecological restoration, particularly in the natural systems on which poor and
indigenous communities depend for their livelihoods; 2) allocating environmental benefits and costs fairly
for the achievement of a just and equitable society; 3) green economic services and industries
incorporating efficiency gains in the quantity and quality of production that provides decent work, new
employment prospects and affordable sustainable consumption alternatives; and 4) resource-efficient
and low carbon economic development (Gulati, 2014b).
Relevance of energy and water nexus to green economy
The term EWN is used to describe the interdependent, synergistic and mutually reinforcing relationship of
energy and water. The production cycle for fuels and energy requires water at various stages: fuel
extraction (mining and refining, oil, gas, uranium and coal processing, and coal and gas liquefaction and
gasification), and cultivation of crops for energy production and generation (see Figure 1). Energy
extraction and production also have an impact on water availability and quality. Similarly, energy is
required at all stages of the water-use cycle (see Figure 2). Large amounts of energy are required to
pump, treat and distribute water for urban, industrial, and agricultural use, human use, and to deal with
the resulting waste. In fact, relative to its value, water is heavy and, in energy terms, it is expensive to
pump water over long distances as well as to lift it (UNEP, 2011). Energy is used by agriculture for accessing
water resources, especially groundwater through pumping, and by households and industry for heating
and cooling water (Gulati, 2014a). It is also used to purify and soften water for household use (Gulati,
2014a).
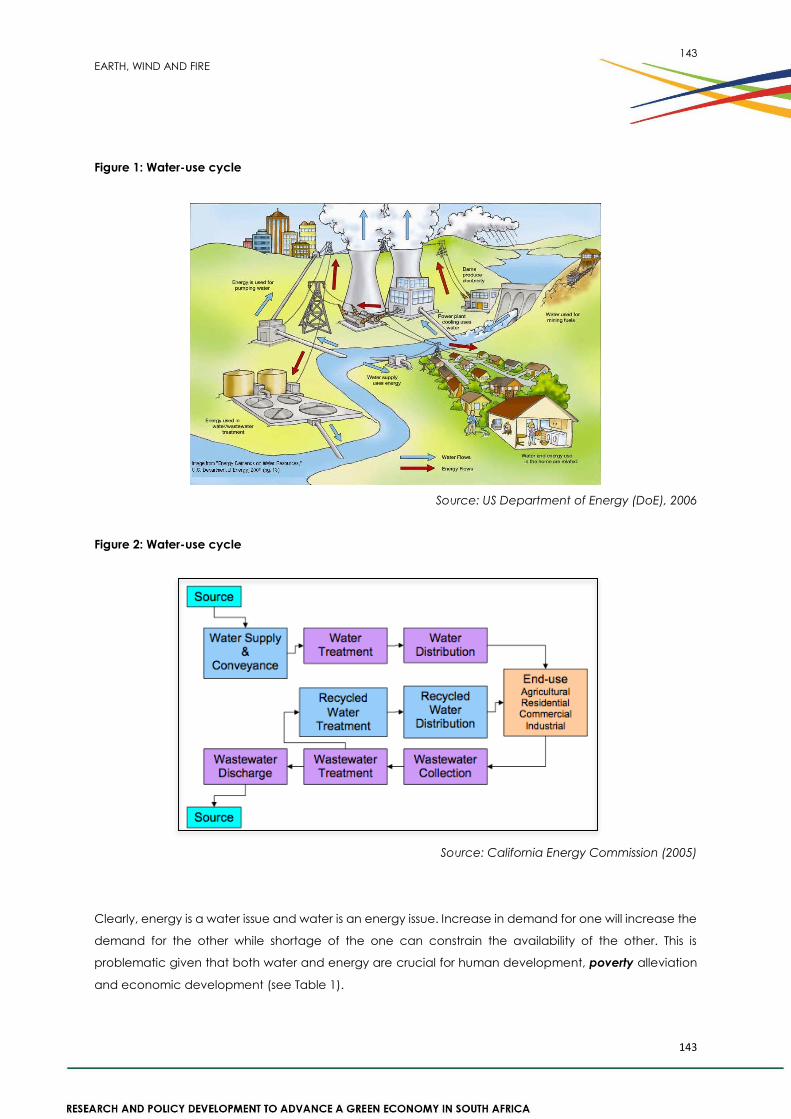
143
EARTH, WIND AND FIRE
143
Figure 1: Water-use cycle
Source: US Department of Energy (DoE), 2006
Figure 2: Water-use cycle
Source: California Energy Commission (2005)
Clearly, energy is a water issue and water is an energy issue. Increase in demand for one will increase the
demand for the other while shortage of the one can constrain the availability of the other. This is
problematic given that both water and energy are crucial for human development, poverty alleviation
and economic development (see Table 1).
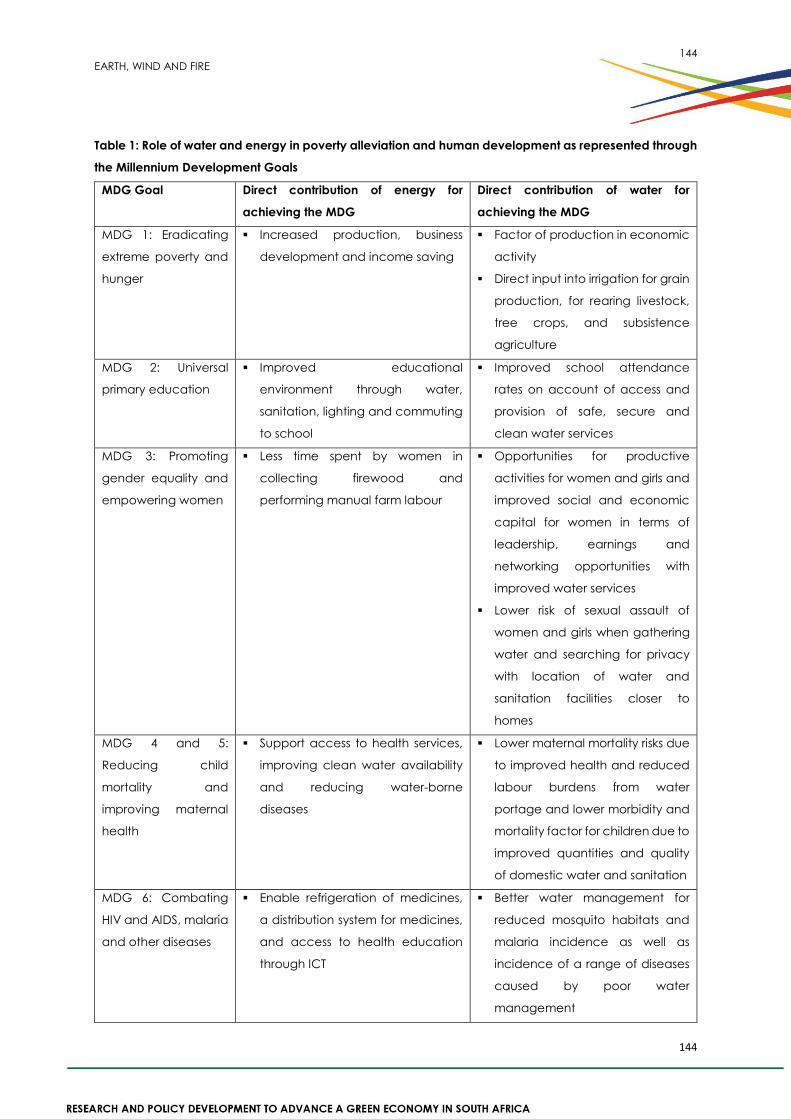
144
EARTH, WIND AND FIRE
144
Table 1: Role of water and energy in poverty alleviation and human development as represented through
the Millennium Development Goals
MDG Goal Direct contribution of energy for
achieving the MDG
Direct contribution of water for
achieving the MDG
MDG 1: Eradicating
extreme poverty and
hunger
Increased production, business
development and income saving
Factor of production in economic
activity
Direct input into irrigation for grain
production, for rearing livestock,
tree crops, and subsistence
agriculture
MDG 2: Universal
primary education
Improved educational
environment through water,
sanitation, lighting and commuting
to school
Improved school attendance
rates on account of access and
provision of safe, secure and
clean water services
MDG 3: Promoting
gender equality and
empowering women
Less time spent by women in
collecting firewood and
performing manual farm labour
Opportunities for productive
activities for women and girls and
improved social and economic
capital for women in terms of
leadership, earnings and
networking opportunities with
improved water services
Lower risk of sexual assault of
women and girls when gathering
water and searching for privacy
with location of water and
sanitation facilities closer to
homes
MDG 4 and 5:
Reducing child
mortality and
improving maternal
health
Support access to health services,
improving clean water availability
and reducing water-borne
diseases
Lower maternal mortality risks due
to improved health and reduced
labour burdens from water
portage and lower morbidity and
mortality factor for children due to
improved quantities and quality
of domestic water and sanitation
MDG 6: Combating
HIV and AIDS, malaria
and other diseases
Enable refrigeration of medicines,
a distribution system for medicines,
and access to health education
through ICT
Better water management for
reduced mosquito habitats and
malaria incidence as well as
incidence of a range of diseases
caused by poor water
management
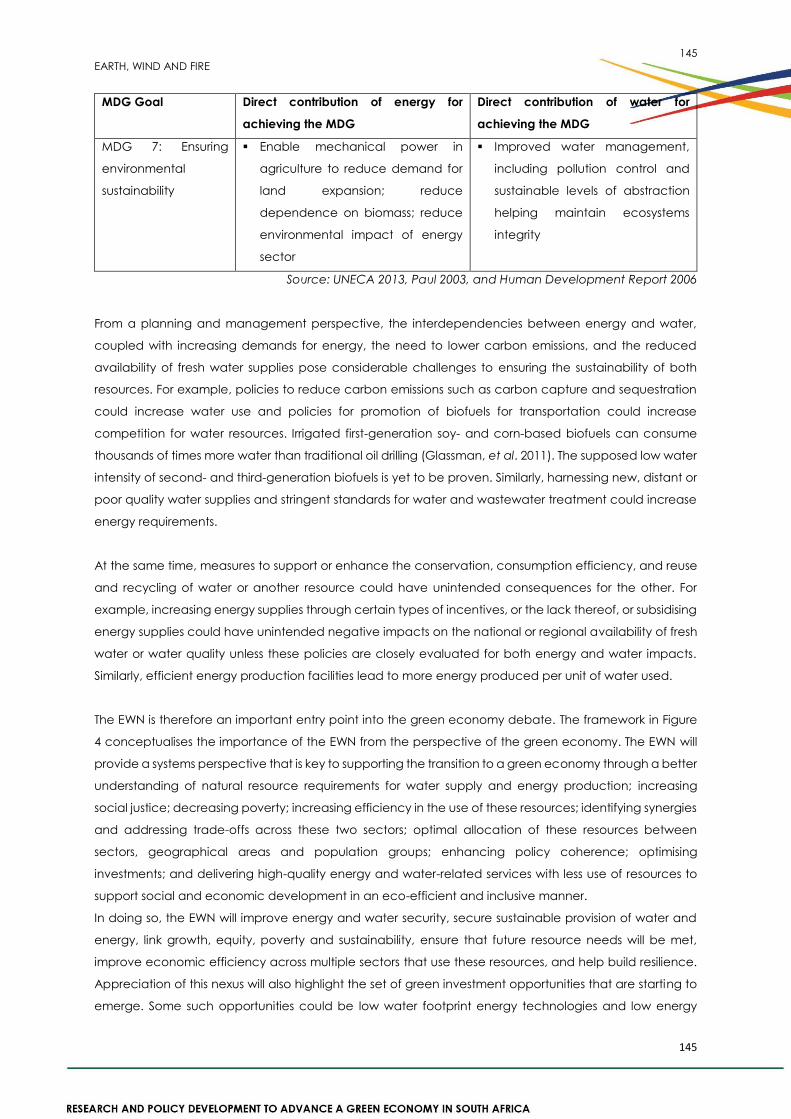
145
EARTH, WIND AND FIRE
145
MDG Goal Direct contribution of energy for
achieving the MDG
Direct contribution of water for
achieving the MDG
MDG 7: Ensuring
environmental
sustainability
Enable mechanical power in
agriculture to reduce demand for
land expansion; reduce
dependence on biomass; reduce
environmental impact of energy
sector
Improved water management,
including pollution control and
sustainable levels of abstraction
helping maintain ecosystems
integrity
Source: UNECA 2013, Paul 2003, and Human Development Report 2006
From a planning and management perspective, the interdependencies between energy and water,
coupled with increasing demands for energy, the need to lower carbon emissions, and the reduced
availability of fresh water supplies pose considerable challenges to ensuring the sustainability of both
resources. For example, policies to reduce carbon emissions such as carbon capture and sequestration
could increase water use and policies for promotion of biofuels for transportation could increase
competition for water resources. Irrigated first-generation soy- and corn-based biofuels can consume
thousands of times more water than traditional oil drilling (Glassman, et al. 2011). The supposed low water
intensity of second- and third-generation biofuels is yet to be proven. Similarly, harnessing new, distant or
poor quality water supplies and stringent standards for water and wastewater treatment could increase
energy requirements.
At the same time, measures to support or enhance the conservation, consumption efficiency, and reuse
and recycling of water or another resource could have unintended consequences for the other. For
example, increasing energy supplies through certain types of incentives, or the lack thereof, or subsidising
energy supplies could have unintended negative impacts on the national or regional availability of fresh
water or water quality unless these policies are closely evaluated for both energy and water impacts.
Similarly, efficient energy production facilities lead to more energy produced per unit of water used.
The EWN is therefore an important entry point into the green economy debate. The framework in Figure
4 conceptualises the importance of the EWN from the perspective of the green economy. The EWN will
provide a systems perspective that is key to supporting the transition to a green economy through a better
understanding of natural resource requirements for water supply and energy production; increasing
social justice; decreasing poverty; increasing efficiency in the use of these resources; identifying synergies
and addressing trade-offs across these two sectors; optimal allocation of these resources between
sectors, geographical areas and population groups; enhancing policy coherence; optimising
investments; and delivering high-quality energy and water-related services with less use of resources to
support social and economic development in an eco-efficient and inclusive manner.
In doing so, the EWN will improve energy and water security, secure sustainable provision of water and
energy, link growth, equity, poverty and sustainability, ensure that future resource needs will be met,
improve economic efficiency across multiple sectors that use these resources, and help build resilience.
Appreciation of this nexus will also highlight the set of green investment opportunities that are starting to
emerge. Some such opportunities could be low water footprint energy technologies and low energy
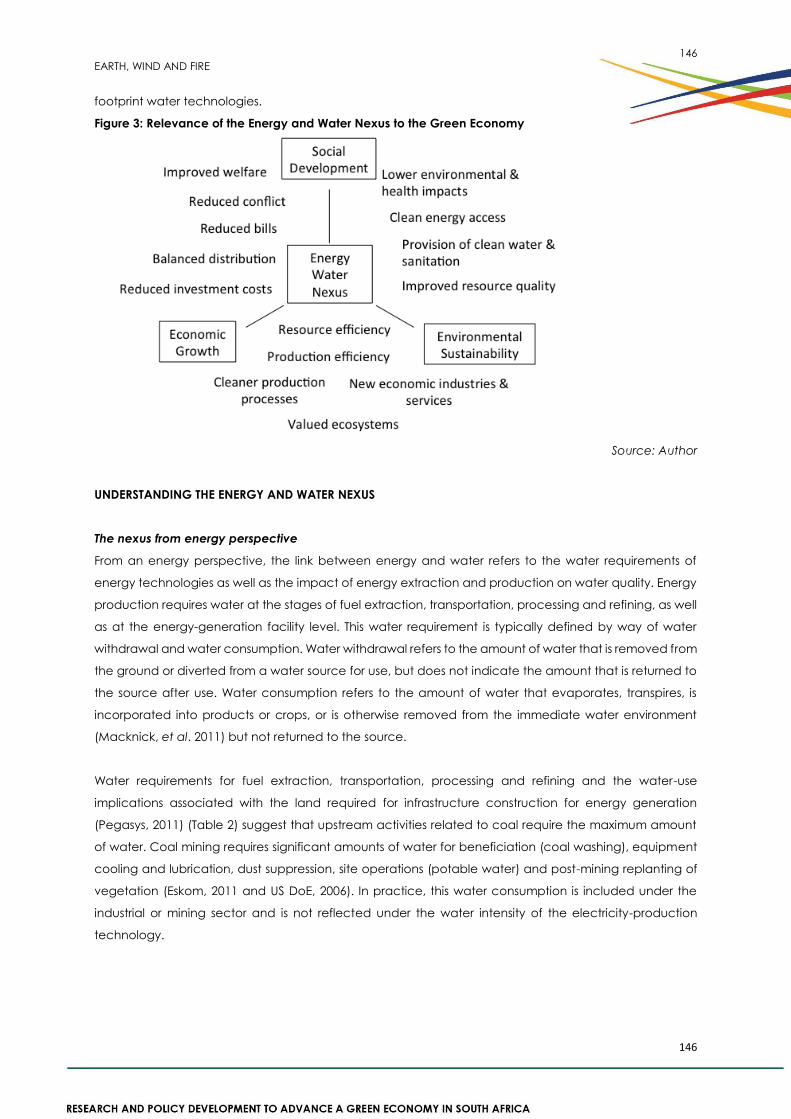
146
EARTH, WIND AND FIRE
146
footprint water technologies.
Figure 3: Relevance of the Energy and Water Nexus to the Green Economy
Source: Author
UNDERSTANDING THE ENERGY AND WATER NEXUS
The nexus from energy perspective
From an energy perspective, the link between energy and water refers to the water requirements of
energy technologies as well as the impact of energy extraction and production on water quality. Energy
production requires water at the stages of fuel extraction, transportation, processing and refining, as well
as at the energy-generation facility level. This water requirement is typically defined by way of water
withdrawal and water consumption. Water withdrawal refers to the amount of water that is removed from
the ground or diverted from a water source for use, but does not indicate the amount that is returned to
the source after use. Water consumption refers to the amount of water that evaporates, transpires, is
incorporated into products or crops, or is otherwise removed from the immediate water environment
(Macknick, et al. 2011) but not returned to the source.
Water requirements for fuel extraction, transportation, processing and refining and the water-use
implications associated with the land required for infrastructure construction for energy generation
(Pegasys, 2011) (Table 2) suggest that upstream activities related to coal require the maximum amount
of water. Coal mining requires significant amounts of water for beneficiation (coal washing), equipment
cooling and lubrication, dust suppression, site operations (potable water) and post-mining replanting of
vegetation (Eskom, 2011 and US DoE, 2006). In practice, this water consumption is included under the
industrial or mining sector and is not reflected under the water intensity of the electricity-production
technology.
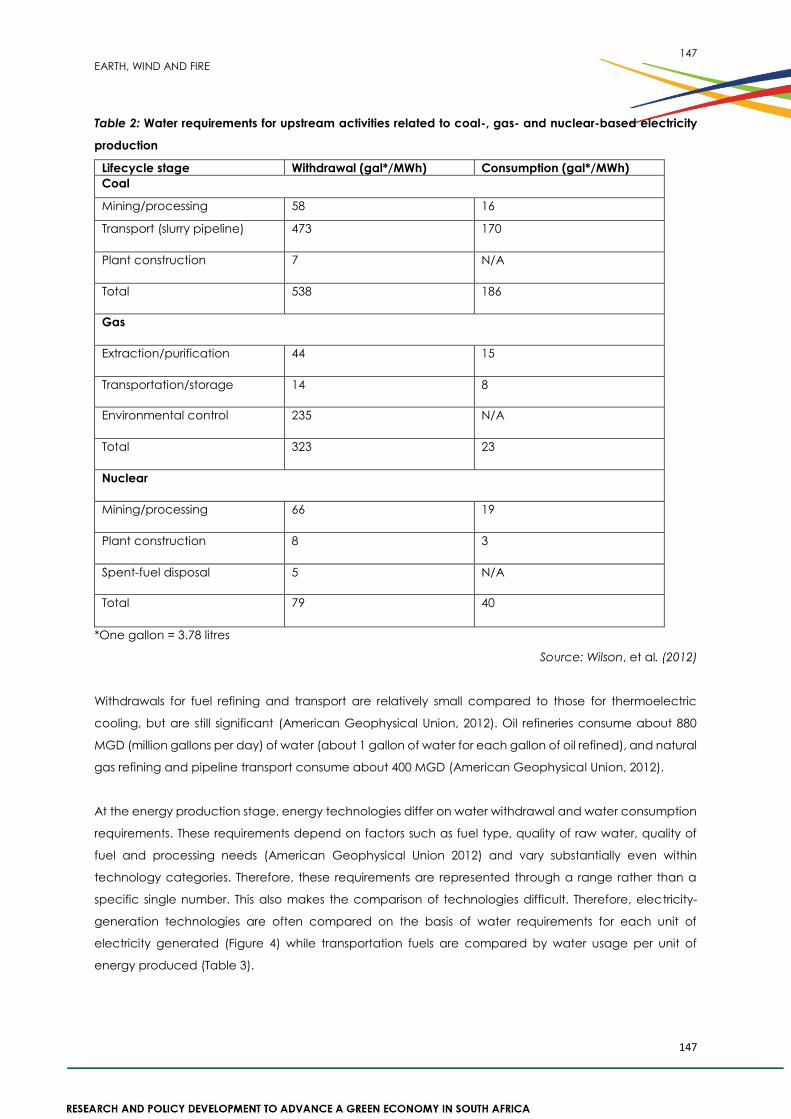
147
EARTH, WIND AND FIRE
147
Table 2: Water requirements for upstream activities related to coal-, gas- and nuclear-based electricity
production
Lifecycle stage Withdrawal (gal*/MWh) Consumption (gal*/MWh)
Coal
Mining/processing 58 16
Transport (slurry pipeline) 473 170
Plant construction 7 N/A
Total 538 186
Gas
Extraction/purification 44 15
Transportation/storage 14 8
Environmental control 235 N/A
Total 323 23
Nuclear
Mining/processing 66 19
Plant construction 8 3
Spent-fuel disposal 5 N/A
Total 79 40
*One gallon = 3.78 litres
Source: Wilson, et al. (2012)
Withdrawals for fuel refining and transport are relatively small compared to those for thermoelectric
cooling, but are still significant (American Geophysical Union, 2012). Oil refineries consume about 880
MGD (million gallons per day) of water (about 1 gallon of water for each gallon of oil refined), and natural
gas refining and pipeline transport consume about 400 MGD (American Geophysical Union, 2012).
At the energy production stage, energy technologies differ on water withdrawal and water consumption
requirements. These requirements depend on factors such as fuel type, quality of raw water, quality of
fuel and processing needs (American Geophysical Union 2012) and vary substantially even within
technology categories. Therefore, these requirements are represented through a range rather than a
specific single number. This also makes the comparison of technologies difficult. Therefore, electricity-
generation technologies are often compared on the basis of water requirements for each unit of
electricity generated (Figure 4) while transportation fuels are compared by water usage per unit of
energy produced (Table 3).
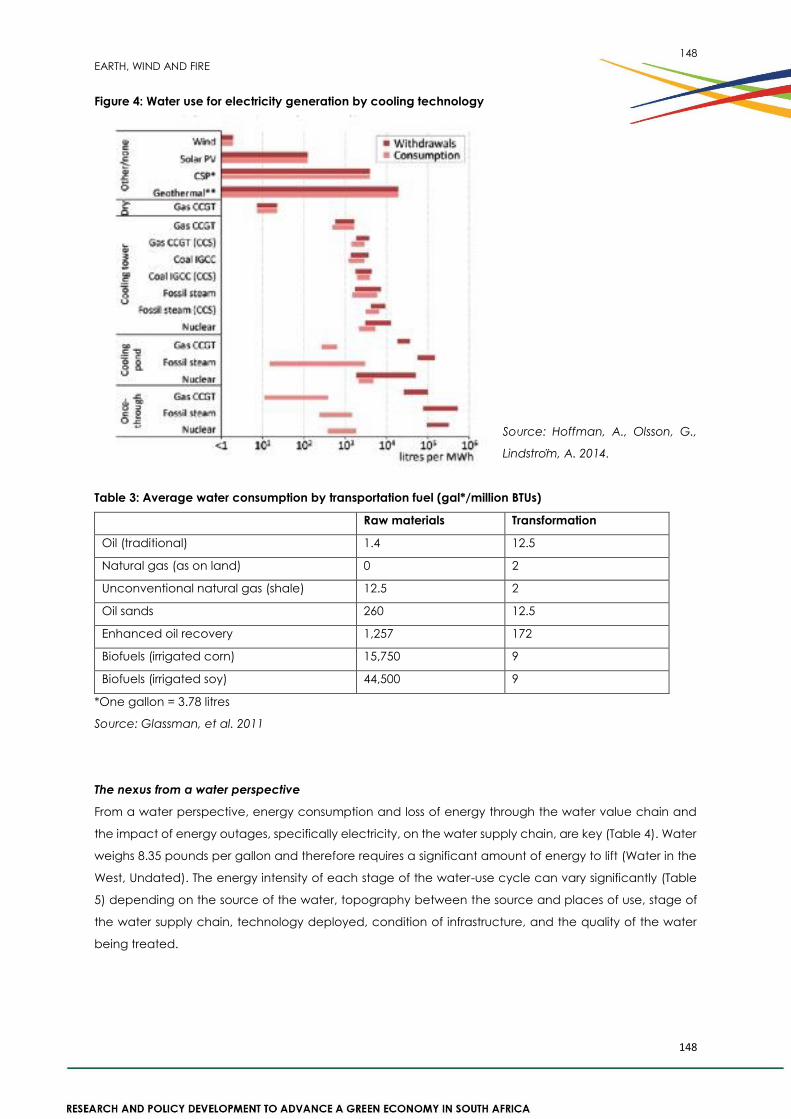
148
EARTH, WIND AND FIRE
148
Figure 4: Water use for electricity generation by cooling technology
Source: Hoffman, A., Olsson, G.,
Lindstrom, A. 2014.
Table 3: Average water consumption by transportation fuel (gal*/million BTUs)
Raw materials Transformation
Oil (traditional) 1.4 12.5
Natural gas (as on land) 0 2
Unconventional natural gas (shale) 12.5 2
Oil sands 260 12.5
Enhanced oil recovery 1,257 172
Biofuels (irrigated corn) 15,750 9
Biofuels (irrigated soy) 44,500 9
*One gallon = 3.78 litres
Source: Glassman, et al. 2011
The nexus from a water perspective
From a water perspective, energy consumption and loss of energy through the water value chain and
the impact of energy outages, specifically electricity, on the water supply chain, are key (Table 4). Water
weighs 8.35 pounds per gallon and therefore requires a significant amount of energy to lift (Water in the
West, Undated). The energy intensity of each stage of the water-use cycle can vary significantly (Table
5) depending on the source of the water, topography between the source and places of use, stage of
the water supply chain, technology deployed, condition of infrastructure, and the quality of the water
being treated.
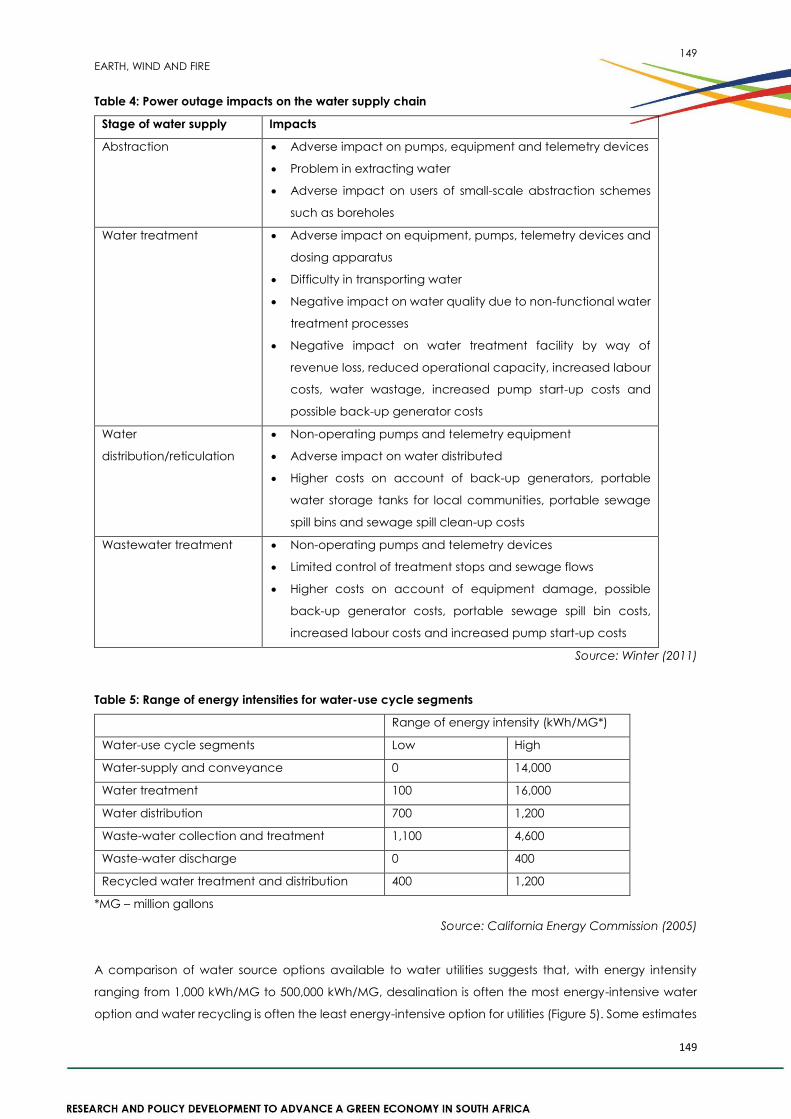
149
EARTH, WIND AND FIRE
149
Table 4: Power outage impacts on the water supply chain
Stage of water supply Impacts
Abstraction Adverse impact on pumps, equipment and telemetry devices
Problem in extracting water
Adverse impact on users of small-scale abstraction schemes
such as boreholes
Water treatment Adverse impact on equipment, pumps, telemetry devices and
dosing apparatus
Difficulty in transporting water
Negative impact on water quality due to non-functional water
treatment processes
Negative impact on water treatment facility by way of
revenue loss, reduced operational capacity, increased labour
costs, water wastage, increased pump start-up costs and
possible back-up generator costs
Water
distribution/reticulation
Non-operating pumps and telemetry equipment
Adverse impact on water distributed
Higher costs on account of back-up generators, portable
water storage tanks for local communities, portable sewage
spill bins and sewage spill clean-up costs
Wastewater treatment Non-operating pumps and telemetry devices
Limited control of treatment stops and sewage flows
Higher costs on account of equipment damage, possible
back-up generator costs, portable sewage spill bin costs,
increased labour costs and increased pump start-up costs
Source: Winter (2011)
Table 5: Range of energy intensities for water-use cycle segments
Range of energy intensity (kWh/MG*)
Water-use cycle segments Low High
Water-supply and conveyance 0 14,000
Water treatment 100 16,000
Water distribution 700 1,200
Waste-water collection and treatment 1,100 4,600
Waste-water discharge 0 400
Recycled water treatment and distribution 400 1,200
*MG – million gallons
Source: California Energy Commission (2005)
A comparison of water source options available to water utilities suggests that, with energy intensity
ranging from 1,000 kWh/MG to 500,000 kWh/MG, desalination is often the most energy-intensive water
option and water recycling is often the least energy-intensive option for utilities (Figure 5). Some estimates
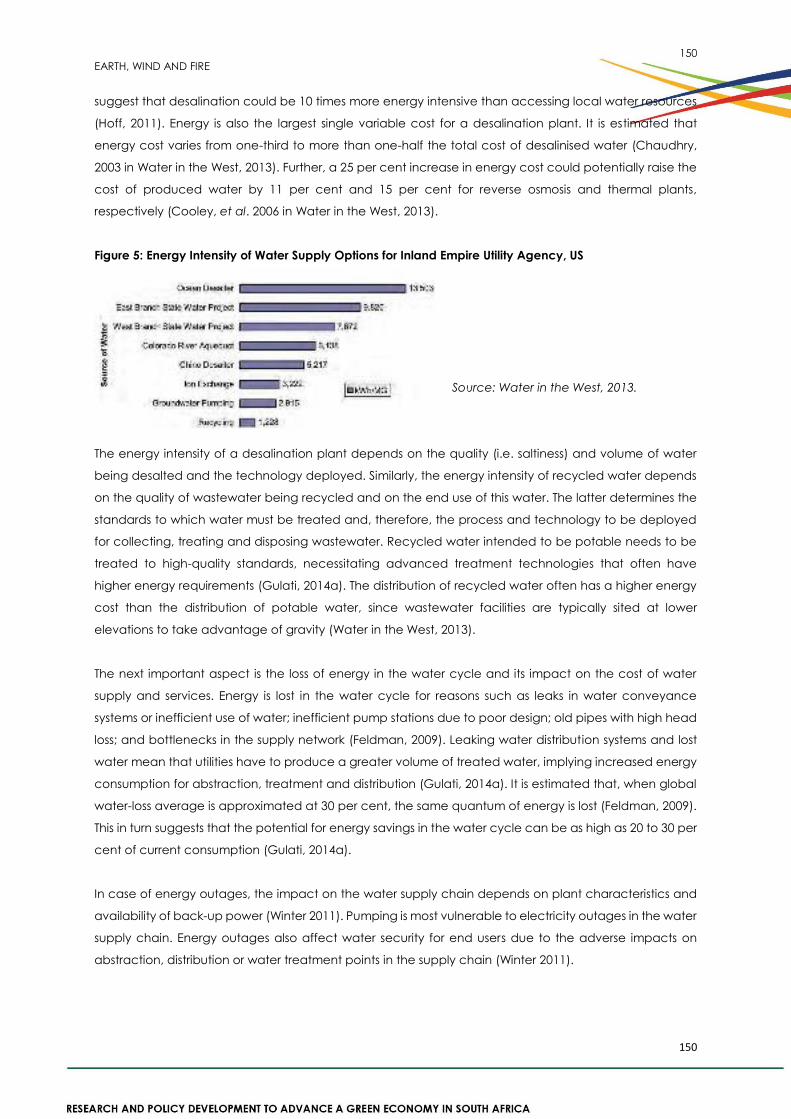
150
EARTH, WIND AND FIRE
150
suggest that desalination could be 10 times more energy intensive than accessing local water resources
(Hoff, 2011). Energy is also the largest single variable cost for a desalination plant. It is estimated that
energy cost varies from one-third to more than one-half the total cost of desalinised water (Chaudhry,
2003 in Water in the West, 2013). Further, a 25 per cent increase in energy cost could potentially raise the
cost of produced water by 11 per cent and 15 per cent for reverse osmosis and thermal plants,
respectively (Cooley, et al. 2006 in Water in the West, 2013).
Figure 5: Energy Intensity of Water Supply Options for Inland Empire Utility Agency, US
Source: Water in the West, 2013.
The energy intensity of a desalination plant depends on the quality (i.e. saltiness) and volume of water
being desalted and the technology deployed. Similarly, the energy intensity of recycled water depends
on the quality of wastewater being recycled and on the end use of this water. The latter determines the
standards to which water must be treated and, therefore, the process and technology to be deployed
for collecting, treating and disposing wastewater. Recycled water intended to be potable needs to be
treated to high-quality standards, necessitating advanced treatment technologies that often have
higher energy requirements (Gulati, 2014a). The distribution of recycled water often has a higher energy
cost than the distribution of potable water, since wastewater facilities are typically sited at lower
elevations to take advantage of gravity (Water in the West, 2013).
The next important aspect is the loss of energy in the water cycle and its impact on the cost of water
supply and services. Energy is lost in the water cycle for reasons such as leaks in water conveyance
systems or inefficient use of water; inefficient pump stations due to poor design; old pipes with high head
loss; and bottlenecks in the supply network (Feldman, 2009). Leaking water distribution systems and lost
water mean that utilities have to produce a greater volume of treated water, implying increased energy
consumption for abstraction, treatment and distribution (Gulati, 2014a). It is estimated that, when global
water-loss average is approximated at 30 per cent, the same quantum of energy is lost (Feldman, 2009).
This in turn suggests that the potential for energy savings in the water cycle can be as high as 20 to 30 per
cent of current consumption (Gulati, 2014a).
In case of energy outages, the impact on the water supply chain depends on plant characteristics and
availability of back-up power (Winter 2011). Pumping is most vulnerable to electricity outages in the water
supply chain. Energy outages also affect water security for end users due to the adverse impacts on
abstraction, distribution or water treatment points in the supply chain (Winter 2011).
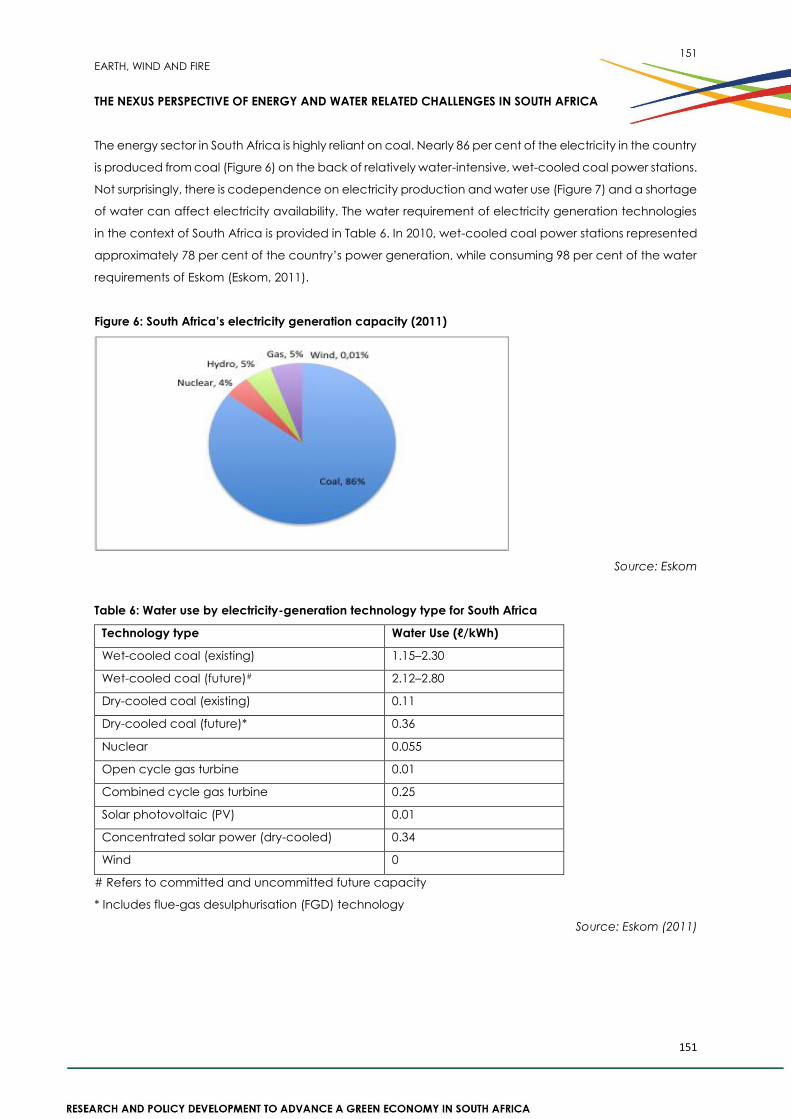
151
EARTH, WIND AND FIRE
151
THE NEXUS PERSPECTIVE OF ENERGY AND WATER RELATED CHALLENGES IN SOUTH AFRICA
The energy sector in South Africa is highly reliant on coal. Nearly 86 per cent of the electricity in the country
is produced from coal (Figure 6) on the back of relatively water-intensive, wet-cooled coal power stations.
Not surprisingly, there is codependence on electricity production and water use (Figure 7) and a shortage
of water can affect electricity availability. The water requirement of electricity generation technologies
in the context of South Africa is provided in Table 6. In 2010, wet-cooled coal power stations represented
approximately 78 per cent of the country’s power generation, while consuming 98 per cent of the water
requirements of Eskom (Eskom, 2011).
Figure 6: South Africa’s electricity generation capacity (2011)
Source: Eskom
Table 6: Water use by electricity-generation technology type for South Africa
Technology type Water Use (ℓ/kWh)
Wet-cooled coal (existing) 1.15–2.30
Wet-cooled coal (future)# 2.12–2.80
Dry-cooled coal (existing) 0.11
Dry-cooled coal (future)* 0.36
Nuclear 0.055
Open cycle gas turbine 0.01
Combined cycle gas turbine 0.25
Solar photovoltaic (PV) 0.01
Concentrated solar power (dry-cooled) 0.34
Wind 0
# Refers to committed and uncommitted future capacity
* Includes flue-gas desulphurisation (FGD) technology
Source: Eskom (2011)
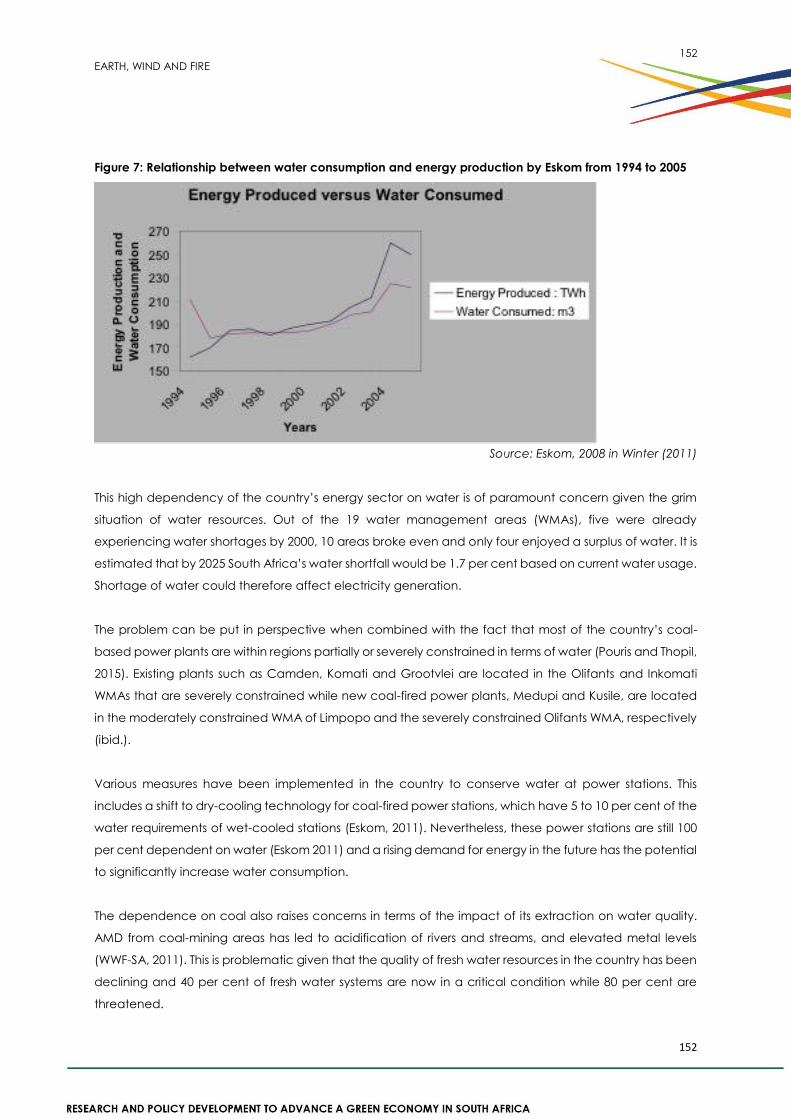
152
EARTH, WIND AND FIRE
152
Figure 7: Relationship between water consumption and energy production by Eskom from 1994 to 2005
Source: Eskom, 2008 in Winter (2011)
This high dependency of the country’s energy sector on water is of paramount concern given the grim
situation of water resources. Out of the 19 water management areas (WMAs), five were already
experiencing water shortages by 2000, 10 areas broke even and only four enjoyed a surplus of water. It is
estimated that by 2025 South Africa’s water shortfall would be 1.7 per cent based on current water usage.
Shortage of water could therefore affect electricity generation.
The problem can be put in perspective when combined with the fact that most of the country’s coal-
based power plants are within regions partially or severely constrained in terms of water (Pouris and Thopil,
2015). Existing plants such as Camden, Komati and Grootvlei are located in the Olifants and Inkomati
WMAs that are severely constrained while new coal-fired power plants, Medupi and Kusile, are located
in the moderately constrained WMA of Limpopo and the severely constrained Olifants WMA, respectively
(ibid.).
Various measures have been implemented in the country to conserve water at power stations. This
includes a shift to dry-cooling technology for coal-fired power stations, which have 5 to 10 per cent of the
water requirements of wet-cooled stations (Eskom, 2011). Nevertheless, these power stations are still 100
per cent dependent on water (Eskom 2011) and a rising demand for energy in the future has the potential
to significantly increase water consumption.
The dependence on coal also raises concerns in terms of the impact of its extraction on water quality.
AMD from coal-mining areas has led to acidification of rivers and streams, and elevated metal levels
(WWF-SA, 2011). This is problematic given that the quality of fresh water resources in the country has been
declining and 40 per cent of fresh water systems are now in a critical condition while 80 per cent are
threatened.
153
EARTH, WIND AND FIRE
153
In some cases, coal mining has impacted catchment water quality to the extent that the catchments
have been rendered unsuitable for the use of the very coal-fired power plants these mines supply. One
such example is the Olifants River catchment where coal mining has contaminated rivers and streams to
the extent that the water cannot be used in the coal-fired power stations there (WWF-SA, 2011). Water
from this catchment needs to be treated before being used in coal-fired power plants, incurring
additional costs and consuming additional energy, or it must be supplied from an alternative cleaner river
system (WWF-SA, 011). Similarly, the Camden power station in Mpumalanga is reliant on inter-basin
transfers from the unimpacted Usutu River system originating in Enkangala for water that is fit to use in the
power station (WWF-SA, 2011).
Although legislative changes have ensured that mine water is integrally considered in the mining process,
and have led to good practices such as the eMalahleni water purification plant situated in the Witbank
coalfields of the Mpumalanga province, turning mine effluent into a usable resource (WWF-SA, 2011)
across the industry requires significant technical and financial resources that are often beyond the reach
of smaller mining companies.
Heavy reliance on coal also makes the electricity sector account for half the country’s greenhouse gas
emissions. The electricity system is thus a key point of intervention from the environmental perspective.
Measures to this end include an increasing share of renewable energy (RE) in the electricity generation
capacity and the development of carbon capture and storage (CCS) technology that has the potential
to achieve emission reductions of between 80 and 85 per cent (Eskom, 2011), and installation of flue-gas
desulfurisation (FGD) technology at coal-fired power stations for meeting local air-quality standards.
These measures could have a significant bearing on the energy sector’s water requirements.
Some RE technologies, such as concentrated solar power (CSP), are water-intensive technologies, even
though they place a lower demand on water resources compared to coal-fired power generation. As
with coal power plants, CSP plants are also located, or are proposed to be located, in areas facing water
stress. This means that local water availability for these plants could potentially be a problem (Gulati,
2014a). This water requirement can be mitigated through the same dry-cooling technology as coal-fired
plants (Gulati, 2014a). The bidding process deployed to select the CSP projects to be developed in the
country does not provide for a preferential payment to CSP with dry cooling. Since the cost of
implementing this technology is about five times greater than the regular wet-cooling technology (Gulati,
2014a), it is important that CSP with dry cooling be incentivised in the process.
CCS technology could also increase water consumption of power plants between 46 and 90 per cent
depending on the technology deployed (Eskom, 2011). Similarly, retrofitting existing coal-fired power
stations with FGD and installing FGD at all new coal-fired power stations could dramatically increase
water requirements for the electricity sector (Figure 8), although the water requirements in 2030 are
expected to be lower than 2011 requirements (Eskom, 2011).
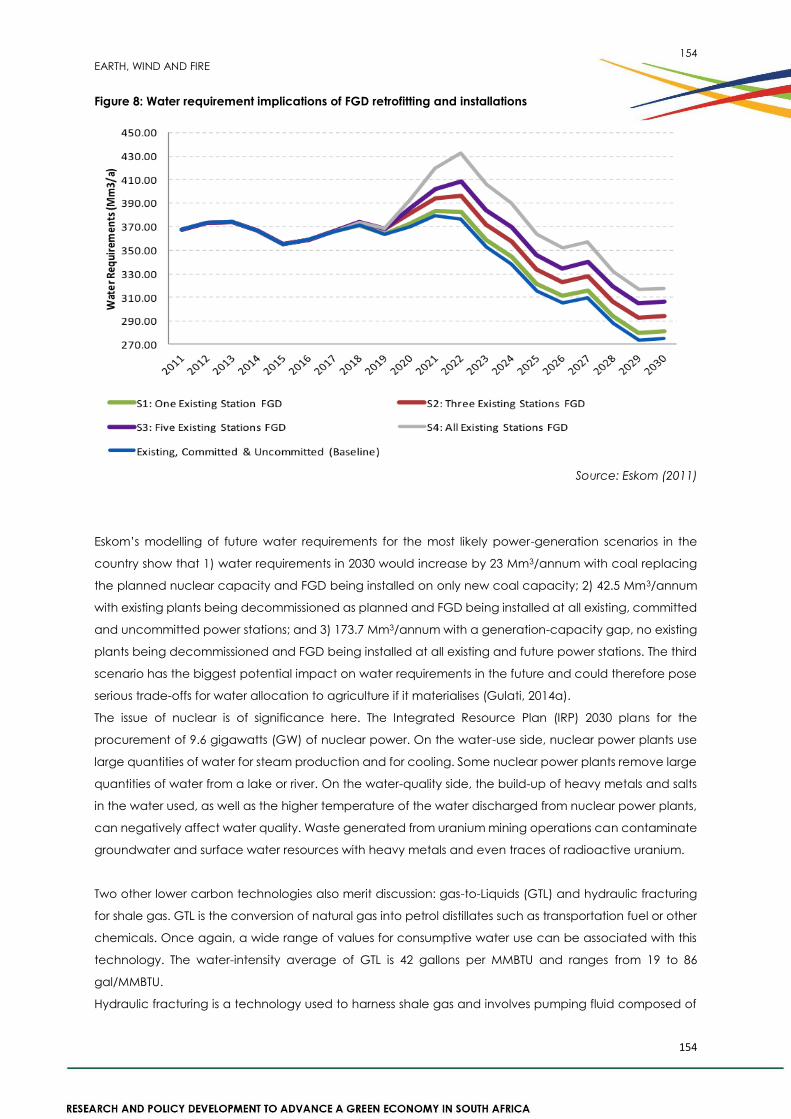
154
EARTH, WIND AND FIRE
154
Figure 8: Water requirement implications of FGD retrofitting and installations
Source: Eskom (2011)
Eskom’s modelling of future water requirements for the most likely power-generation scenarios in the
country show that 1) water requirements in 2030 would increase by 23 Mm3/annum with coal replacing
the planned nuclear capacity and FGD being installed on only new coal capacity; 2) 42.5 Mm3/annum
with existing plants being decommissioned as planned and FGD being installed at all existing, committed
and uncommitted power stations; and 3) 173.7 Mm3/annum with a generation-capacity gap, no existing
plants being decommissioned and FGD being installed at all existing and future power stations. The third
scenario has the biggest potential impact on water requirements in the future and could therefore pose
serious trade-offs for water allocation to agriculture if it materialises (Gulati, 2014a).
The issue of nuclear is of significance here. The Integrated Resource Plan (IRP) 2030 plans for the
procurement of 9.6 gigawatts (GW) of nuclear power. On the water-use side, nuclear power plants use
large quantities of water for steam production and for cooling. Some nuclear power plants remove large
quantities of water from a lake or river. On the water-quality side, the build-up of heavy metals and salts
in the water used, as well as the higher temperature of the water discharged from nuclear power plants,
can negatively affect water quality. Waste generated from uranium mining operations can contaminate
groundwater and surface water resources with heavy metals and even traces of radioactive uranium.
Two other lower carbon technologies also merit discussion: gas-to-Liquids (GTL) and hydraulic fracturing
for shale gas. GTL is the conversion of natural gas into petrol distillates such as transportation fuel or other
chemicals. Once again, a wide range of values for consumptive water use can be associated with this
technology. The water-intensity average of GTL is 42 gallons per MMBTU and ranges from 19 to 86
gal/MMBTU.
Hydraulic fracturing is a technology used to harness shale gas and involves pumping fluid composed of
155
EARTH, WIND AND FIRE
155
water, proppants and chemicals into the ground at very high pressure. The pressurised water and
chemicals create and enlarge cracks in the shale formation, increasing its permeability by 100- to 1,000-
fold and allowing hydrocarbons to flow more easily to the wellbore (Reig, Luo and Proctor, 2014). Shale
gas resources in the country are pegged at around 485 trillion cubic feet (Tcf), though the economically
recoverable reserve is yet to be determined (Fakir, 2015). The volume of water required for hydraulic
fracturing depends on the nature of the fractures that have to be performed. Based on experience in the
United States, drilling a single well can require between 0.2 million and 2.5 million litres of water and
hydraulic fracturing of a well can require between 7 million and 23 million litres of water, 25 per cent to 90
per cent of which might be consumptive use (Reig, Luo and Proctor, 2014). The water required by a single
well can be roughly equal to the water consumed by New York City in seven minutes, or by a 1,000-
megawatt coal-fired power plant in 12 hours (Reig, Luo and Proctor, 2014).
Limited experience with hydraulic fracturing and the wide range of values for consumptive water use
associated with it indicate the high levels of uncertainty about its possible impacts on freshwater
availability, although nationally the effects of water consumption for fracking may not be significant. That
said, given that South Africa is a water-stressed country, the vast water quantities needed over the life
span of a shale gas well, where water is used to fracture rock under high pressure, may pile further stress
on local fresh water sources (SIWI, 2014).
The problem with the use of potable water is that a quantity of it is permanently lost and what is returned
as flow-back and produced water (essentially wastewater from fracturing) is a mix of the originally
pumped fresh water (which is now contaminated) and formation water (water rich in brine from the
targeted shale gas-rich rock) (Fakir, 2015). Water that is not recycled or reused will incur an opportunity
cost given the local water stress (Fakir, 2015). If properly treated, returned water can be reused in other
fracking operations. But treatment methods for the returned water are often inadequate to achieve a
potable water standard. If improved treatment procedures are developed, it will most likely be at
considerable cost. Water quality is also under threat from fracking (SIWI, 2014). The risk of ground water
contamination can be high if stringent standards are not adhered to for drilling of the borehole, installing
the well casings and cementing them in place (Fakir, 2015).
The green economy demands not only a low carbon economy but also a low water-use economy.
Therefore, the low carbon transition needs to be planned with due consideration to the implications for
water requirements. Otherwise, the low carbon economy could risk constraining the country’s energy
supply further and go against the tenets of the green economy.
The country is currently facing an electricity crisis. This crisis is expected to continue at least over the next
two to three years. This is likely to aggravate the country’s water crisis, which is already projected to be
under stress with the growing population. There already exist examples of how the energy shortage in the
country has led to plummeting reliability of water systems while threatening public health and safety.
During the recurring rolling blackouts of 2007 and 2008, municipalities were unable to provide water and
wastewater services. While Cederberg and the City of Cape Town experienced higher costs on account
of damage to equipment and the cost of back-up services, Howick in KwaZulu-Natal and Zandvlei in the
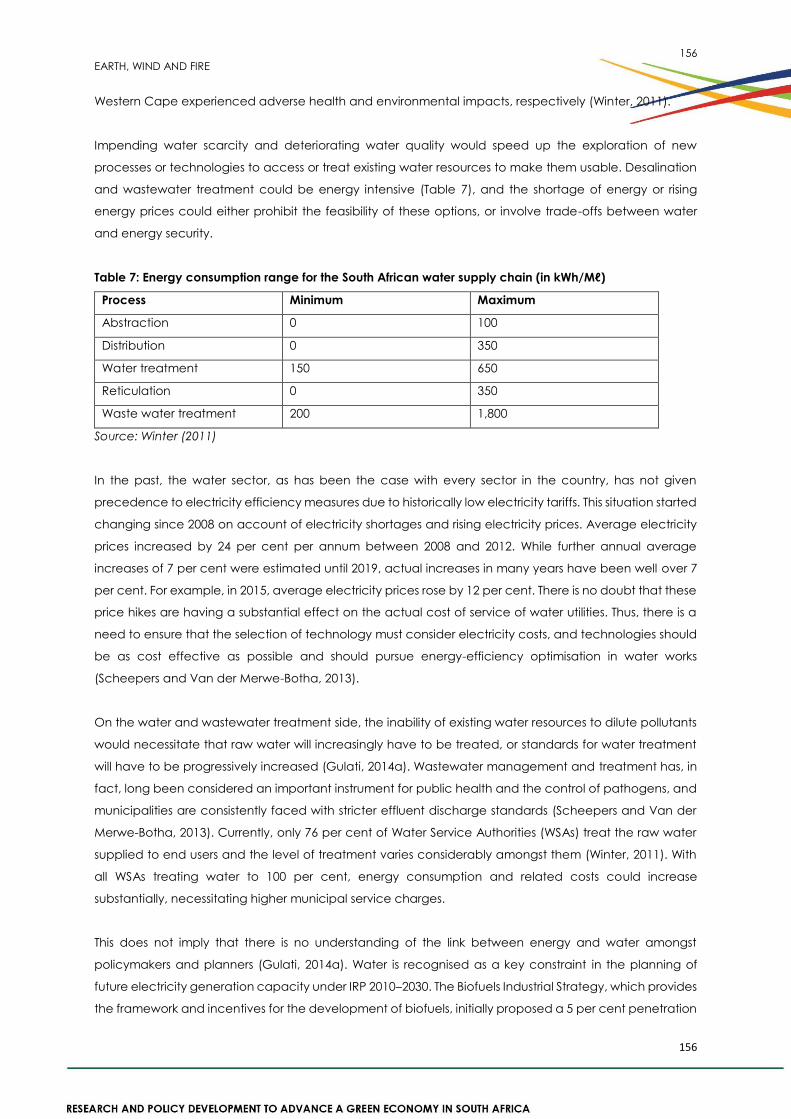
156
EARTH, WIND AND FIRE
156
Western Cape experienced adverse health and environmental impacts, respectively (Winter, 2011).
Impending water scarcity and deteriorating water quality would speed up the exploration of new
processes or technologies to access or treat existing water resources to make them usable. Desalination
and wastewater treatment could be energy intensive (Table 7), and the shortage of energy or rising
energy prices could either prohibit the feasibility of these options, or involve trade-offs between water
and energy security.
Table 7: Energy consumption range for the South African water supply chain (in kWh/Mℓ)
Process Minimum Maximum
Abstraction 0 100
Distribution 0 350
Water treatment 150 650
Reticulation 0 350
Waste water treatment 200 1,800
Source: Winter (2011)
In the past, the water sector, as has been the case with every sector in the country, has not given
precedence to electricity efficiency measures due to historically low electricity tariffs. This situation started
changing since 2008 on account of electricity shortages and rising electricity prices. Average electricity
prices increased by 24 per cent per annum between 2008 and 2012. While further annual average
increases of 7 per cent were estimated until 2019, actual increases in many years have been well over 7
per cent. For example, in 2015, average electricity prices rose by 12 per cent. There is no doubt that these
price hikes are having a substantial effect on the actual cost of service of water utilities. Thus, there is a
need to ensure that the selection of technology must consider electricity costs, and technologies should
be as cost effective as possible and should pursue energy-efficiency optimisation in water works
(Scheepers and Van der Merwe-Botha, 2013).
On the water and wastewater treatment side, the inability of existing water resources to dilute pollutants
would necessitate that raw water will increasingly have to be treated, or standards for water treatment
will have to be progressively increased (Gulati, 2014a). Wastewater management and treatment has, in
fact, long been considered an important instrument for public health and the control of pathogens, and
municipalities are consistently faced with stricter effluent discharge standards (Scheepers and Van der
Merwe-Botha, 2013). Currently, only 76 per cent of Water Service Authorities (WSAs) treat the raw water
supplied to end users and the level of treatment varies considerably amongst them (Winter, 2011). With
all WSAs treating water to 100 per cent, energy consumption and related costs could increase
substantially, necessitating higher municipal service charges.
This does not imply that there is no understanding of the link between energy and water amongst
policymakers and planners (Gulati, 2014a). Water is recognised as a key constraint in the planning of
future electricity generation capacity under IRP 2010–2030. The Biofuels Industrial Strategy, which provides
the framework and incentives for the development of biofuels, initially proposed a 5 per cent penetration
157
EARTH, WIND AND FIRE
157
level of biofuels in the national liquid fuels pool. This was reduced to 2 2 per cent after the National Treasury
expressed concerns over the water requirement implications of such a mandate.
However, policies have deficiencies. For example, IRP 2030 only considers water usage under the
decision-making criteria. It does not consider either the risks of potential water scarcity for the planned
generation capacity and electricity supply or the electricity sector’s ability to provide reliable and
sustainable energy supply in the event of water insecurity (Gulati, 2014a). Similarly, the mandate for all
new coal power plants to utilise dry-cooling technology can be short-sighted if it omits an effective and
long-term solution for a low water-intensive electricity system (ibid.).
POLICY RECOMMENDATIONS AND CONCLUSION
Understanding the EWN and managing energy and water resources in a comprehensive and systematic
way is critically important to meeting the basic needs of these resources and achieving the green
economy objectives. It provides the opportunity for integrated planning that is key to assessing pathways
that are affordable in the short-term and sustainable for the long-term, thereby meeting the concept of
the green economy. In fact, there are risks that energy and water policies developed in isolation to
increase efficiency in one sector may not only be creating additional demand in the other sector but
also creating risks pertaining to broader allied economic activity and lowering the resilience of relevant
social systems. Below are some recommendations that would facilitate the cooperative and adaptive
management of these vital resources and help to achieve the green economy goals for South Africa.
Addressing Data Gaps
There is a clear need to improve the quality of the data on energy-for-water and water-for-energy use.
The real understanding of the energy-water nexus and its impact on green economy objectives, such as
resource security and economic and social development, will be possible only with reliable, current and
comprehensive national and local-level data. Improved availability and accuracy of data will facilitate
informed decision-making; prioritise investments in both energy and water infrastructure; and lead to
better water and energy use practices. Examples of data requirements include water usage for liquid fuel
production; water usage for exploration of new energy sources; the impact of new energy sources on
water quality; energy use by new water sources; water usage patterns for new coal technologies;
mapping of water usage of coal power plants in relation to water inventories in water deficient WMAs;
the impact of low-carbon technologies on water usage; and water usage patterns in renewable energy
technologies (Pouris and Thopil, 2015 and Gulati, 2014a). Significant attention needs to be paid to
improvements in industry reporting, data collection and the sharing of data.
Integrated Resource Planning and Management
The EWN needs to be better recognised in policies, planning and related regulations, and laws dealing
with the management and development of water resources and energy systems. This will optimise
potential benefits, provide the right business and investment environment, protect the environment, and
further the basic philosophy of the green economy.
158
EARTH, WIND AND FIRE
158
This process could start with a review of existing policies to identify disincentives or positive synergies to
integrated planning and management and sustainable supply of the two resources. Sectoral policies and
plans for both water and energy need to better account for the multiple interrelationships of the two
resources, as well as the impact of these interrelationships on different sectors of the economy.
To begin with, water security needs to be central to the energy-planning debate. In the event of regional
integration of energy supplies and possible regional hydropower procurement, the energy-water nexus
could become an important debate. Then policies should support the upscaling of new energy-efficient
water technologies and water-efficient energy technologies, even though these may be expensive and
deter energy technologies that pose risks for water availability or quality. In the case of new and emerging
technologies, these must not be allowed unless the true scale of water impacts can be estimated.
There will be practical difficulties in achieving such integrated planning as water-resource planning is
carried out at the level of river basins and energy planning is done at a national level. Nonetheless,
coordinated planning will help meet the objectives of the green economy. Coordinated energy
efficiency and water conservation programmes could help garner savings of both water and energy,
and synergistic energy and water production could enhance both water and energy security. For
example, power plants and desalination or water treatment facilities could be co-sited and power plants
could provide electricity at a preferential rate to these water-related facilities.
For example, minimising water loss through an active leakage reduction programme will reduce the
energy wastage embedded in the lost water. Waste heat from power plants can be used in some
desalination cycles, and biogas from wastewater treatment plants can be used for combined heat and
power production. This is a relatively untapped energy source in the country.
Efficiency improvement
There is an urgent need to prioritise reduction in leakage and energy efficiency in the water sector.
Measures that can be considered to this end include water pressure management (as water leakage is
driven by water pressure), sludge management activities such as aeration efficiency improvement,
varying operating conditions, using chemical pre-treatment (this could lead to a potential electricity
saving of 250–280 MWh/year), and optimisation of the operation of the distribution system by pumping at
off-peak periods while ensuring minimum emergency levels in all reservoirs (Swartz, van der Merwe-Botha
and Freese, 2013). The latter will not only effect energy savings in terms of electrical energy used for
pumping, but may also delay upgrades to the water distribution system (ibid.). Energy audits form the key
to the identification of energy savings and therefore need to be mandated for water and wastewater
systems.
Appropriate pricing of water and energy resources
Appropriate resource pricing can play an important role in driving conservation and innovation in
management and use of both resources. Underpricing of resources encourages wasteful consumption of
resources and misses a valuable opportunity to secure resources for effective protection and
159
EARTH, WIND AND FIRE
159
management of water. Energy and water subsidies help drive the cycle of inefficient and energy-
intensive water use by hiding the true resource costs (Wolff, et al. 2004 in Water in the West, 2013). Of
course, principles of equity would need to be considered and applied when higher pricing of water and
energy resources is implemented. There is also a need to offer better incentives or to reconsider subsidies
to manage the risks posed by the one resource to the other. For example, CSP project developers need
to be given incentives to deploy the water-saving dry-cooling technology.
Increased funding for Research and Development (R&D)
The EWN presents the opportunity to develop more efficient technologies, practice cost-effective
approaches to using lower-quality, non-traditional sources of water to supplement or replace fresh water
for cooling and other power plant needs. Future R&D should focus on the following areas:
energy sources that can meet future water needs sustainably, specifically for the array of water-scarce
areas in the country;
technical solutions that successfully couple energy and water generation;
reducing water use in thermal power generation through advanced cooling technologies, scrubbing,
innovative source-water intake designs, use of non-traditional waters and increased power-plant
efficiencies;
treatment of returned water from fracking operations to enable its reuse;
applications and treatment methods for non-traditional or lower quality water sources such as saline or
brackish water specifically aimed at providing alternative or supplementary sources of water for energy
generation and for uses that could supplement water resources in water-stressed areas; and
determining the manner in which the state and the costs of the existing and future power supply affect
the costs of water-related technologies and the capacity to deliver water services in the country.
Creating consumer awareness
While the electricity tariff hikes and rising oil prices in recent years have created an awareness of energy
consumption amongst consumers, awareness remains rather low on the water-use front. Urgent steps
need to be taken by the government, and the water companies need to take steps to increase consumer
awareness of water use. Tools such as the certification and labelling of consumer products to reflect
embedded water and energy use in their manufacture or usage need to be mandated.
References
Eskom. 2011. ‘Eskom’s submission to the DWA for the National Water Resources Strategy review’.
Johannesburg.
Fakir, S. 2015. Framework to assess the economic reality of shale gas in South Africa. WWF-SA, South Africa.
Greenpeace Africa. 2012. Water hungry coal. Burning South Africa’s water to produce electricity.
Johannesburg.
Gulati, M. 2014a. Understanding the Food Energy Water Nexus: Through the Energy and Water Lens. WWF-
SA, South Africa.
Gulati, M. 2014b. ‘Financing the Green Economy Transition in Africa. Greening the Continent: Reflections
on Low-Carbon Development Pathways’, Perspectives Africa, Al-Zubaidi, L., Luckscheiter, L. and Omari,
K. (eds.), Issue 2, September. Cape Town: Heinrich-Boll-Stiftung, Regional Office Southern Africa.
160
EARTH, WIND AND FIRE
160
Hoffman, A., Olsson, G. and Lindstro m, A. 2014. ‘Shale Gas and Hydraulic Fracturing: Framing the Water
Issue’. Report No. 34. Stockholm: SIWI.
Paul, R. 2003. ‘Sectoral trends in the water sector (technology, policy and poverty) in South Asia’, South
Asia Conference on Technologies for Poverty Reduction, 10–11 October. New Delhi.
Pouris, A. and Thopil, G. A. 2015. Long-term Forecasts of Water Usage for Electricity Generation: South
Africa 2030. Report No. 2383/1/14. ISBN 978-1-4312-0646-9. Pretoria: Water Research Commission.
PricewaterhouseCoopers Inc. (PwC). 2011. ‘Water, food, energy and the green economy’.
Reif, P., Luo, T. and Proctor, J. N. 2014. Global Shale Gas Development: Water Availability and Business
Risks. Washington, DC: World Resources Institute.
Swartz, C. D., van der Merwe-Botha, M. and Freese, S. D. 2013. Energy Efficiency in the South African Water
Industry: A Compendium of Best Practices and Case Studies. Report No. TT 565/13. ISBN No: 978-1-4312-
0430-4. Pretoria: Water Research Commission.
United Nations Economic Commission for Africa (UNECA). 2013. ‘Enhancing Energy Access and Security
in Eastern Africa’. Draft background report. 17th Meeting of the Intergovernmental Committee of Experts,
18–22 February 2013. Kampala, Uganda.
United Nations Environmental Programme (UNEP). 2011. Towards a Green Economy: Pathways to
Sustainable Development and Poverty Eradication. www.unep.org/greeneconomy. ISBN: 978-92-807-
3143-9.
US Department of Energy (US DoE). 2006. ‘Energy Demands on Water Resources’. Report to Congress on
the Interdependency of Energy & Water. Washington DC.
‘Water in the West’. Undated. Water and Energy Nexus: A Literature Review. Stanford, California: Stanford
University.
Winter D. 2011. ‘Power Outages and their Impact on Southh Africa’s Water and Wastewater Sectors’.
Report to the Water Research Commission. WRC Report No. KV 267/11 ISBN 978-1-4312-0101-3.
EARTH, WIND AND FIRE
CHAPTER 8
Waste Re-Use: Case of Oil Extracted from Waste Tyres and
Improvement of the Waste Tyre Industry
T. J. Pilusa and E. Muzenda
EXECUTIVE SUMMARY
The work that went into this chapter was aimed at researching and identifying technologically feasible and economically
justifiable processes and pathways for the utilisation of waste tyres in South Africa. Drawing from the objectives of the
Recycling and Economic Development Initiative of South Africa (REDISA), this chapter seeks to motivate the utilisation
and unlocking of the potential of waste tyres for energy and material recovery in South Africa. The chapter focuses on
the economic feasibility of waste tyre treatment through pyrolysis in Gauteng. The authors also evaluate the role of existing
policy instruments, transition towards a low-carbon economy as well as optimal energy strategies influencing and
promoting efforts towards integrated waste tyre management in South Africa.
In line with the National Green Economy Strategy, West Rand Green IQ and the Gauteng Economic Strategy, in particular
the Gauteng Integrated Energy Strategy, Gauteng needs to explore alternatives for both energy sources and waste
treatment technologies. The successful implementation of an efficient Waste Tyre-to-Energy and Material Recovery
concept will contribute to overall sustainability by improving waste collection management, the sustainable utilisation of
waste tyres, improving the environment by increasing resource efficiency and energy poverty reduction, as well as
promoting economic development such as the optimisation of green jobs.
The South African government recognises the conversion of waste to energy in its plans and future strategies (Department
of Environmental Affairs, 2010).
The end-life of automotive tyres is associated with various environmental challenges. Combustion of waste tyres emits
significant amounts of toxic gases and particulate matter, which contribute significantly to air pollution. Illegal re-treading
of tyres increases the risks of road accidents and the stockpiling of waste tyres may results in fire hazards and air pollution.
Waste tyre stockpiles create breeding grounds for vermin carrying insects and mosquitoes, which threaten human and
animal health. Landfill disposal is not viable due to the non-biodegradability of the tyres and the large volumes they
occupy in landfill sites. They are also difficult to compact after disposal. Waste tyre treatment through pyrolysis results in
four revenue streams: tyre-derived fuel, refined carbon black, high tensile steel and sodium sulphite.
This study focused on:
Economics of waste tyre pyrolysis technology in the South African context
Quality of the products derived from this process
Methods of beneficiating these products for local and export markets
Potential uses of value-add products derived therefrom
Socio-economic benefits of the combined approach
An economic model was developed to assess the viability of pyrolysis technology as an alternative treatment method for
waste tyres using Gauteng Province in South Africa as a case study. This chapter focuses on the factors that influence the
viability of using pyrolysis technology as a treatment process for waste tyres with the aim of producing alternative fuel and
other high-value products. A financial model was formulated to evaluate the economic feasibility of such technology as
an alternative disposal method. Pyrolysis technology becomes more viable when there are guaranteed product off-takes
EARTH, WIND AND FIRE
at a given price. Further processing of the crude tyre oil and carbon black is important for production of consistent quality
products. Gauteng Province alone generates approximately 48,077tpa of waste tyres of which four per cent is already
allocated to three waste tyre pyrolysis recyclers in the province (REDISA, 2014). These facilities are equipped with 10tpd
modular batch reactors. One of the facilities is in the process of installing three additional reactors to increase the
treatment capacity to 40tpd, whereas the other facility has two 10tpd reactors but is limited to process 10tpd since it is
operating without an environmental impact assessment. If it is assumed that the balance will also be treated via pyrolysis
technology, a capital injection of R129 million will be required to set up three additional 30tpd waste tyres pyrolysis
treatment facilities to treat the balance of waste tyres. Based on the financial model evaluated, a complete 30tpd
treatment facility complete with product refinery modules has a potential return on investment and gross margin of 27.1
per cent and 40.6 per cent, respectively. Each facility can produce up to four million litres per annum of refined tyre-
derived fuel at a cost of R5.46 per litre and other secondary value-add products for local and export markets.
The chapter presents an economic evaluation of waste tyre pyrolysis technology taking into account primary products
‘upgrade/beneficiation/refinery, efficient plant energy re-utilisation and minimal environmental impact. Production of
alternative fuels from this technology is profitable and feasible depending on the product’s demand at the minimum
selling price. Successful application of the liquid fuels produced from this process will create an attractive market for fuel
at a higher selling price but lower than the conventional petroleum liquid fuels such as diesel. Based on the findings of this
study, the Recycling and Economic Development Initiative of South Africa’s (REDISA) Integrated Waste Tyre Management
Plan (IWTMP), established in terms of the Regulation 6(3) of the Waste Tyre Regulations in accordance to the National
Environmental Management: Waste Act, 2008 (Act No. 59 of 2008), must be supported as an integrated waste tyre
management option in South Africa. The REDISA plan and state-owned entities, such as the South African National Energy
Development Institute (SANEDI), are making a significant contribution towards meeting government objectives as defined
in the National Development Plan (NDP) 2030, such as economy and development, environmental sustainability and
resilience, and transforming human settlements. Therefore, important strategic efforts such as those by SANEDI, REDISA
and the Mapungubwe Institute for Strategic Reflection (MISTRA) can assist the South African government to optimise
research strategies and policies that promote transition to the low-carbon economy through investment in scientific
research and technological advancement as well as human capacity development.
BACKGROUND
Waste Tyre Quantities
It is estimated that 1.5 billion tyres are produced globally per year and the majority of these eventually end up as waste
tyres contributing a significant portion of the solid waste stream. The European Union generated an estimated 4.5 million
tonnes of new tyres in 2010, with 289 million tyres being replaced per year (ETRMA, 2011). In the United States,
approximately 500 million waste tyres were generated in 2007, with about 128 million used tyres already stockpiled
(Berrueco, et al. 2005). In Australia, around 52.5 million tyres reached their end of life between 2007 and 2008.
Approximately 64 per cent of these tyres were landfilled, or illegally dumped or stockpiled, while only 13 per cent were
recycled (ETRMA, 2011).
Disposal of waste tyres and rubber products in South Africa is becoming a growing concern since these products do not
decompose easily and take up a significant portion of disposal site space. There are an estimated 60 million scrap tyres
disposed across South Africa, with an additional 11 million adding to the stock pile in 2008 (Mahlangu, 2009). In 2011 alone,
7.25 million new tyres, excluding mining tyres and belting, were sold in South Africa: approximately 55 per cent of these
tyres were sold in Gauteng Province. The majority of these tyres are expected to add to the existing waste tyre matrix
(REDISA, 2013).
EARTH, WIND AND FIRE
It is well known that tyres possess highly volatile and low ash contents with a heating value greater than that of coal and
biomass. These properties make them ideal materials for thermal processes like pyrolysis, gasification and liquefaction
(Bridgwater, 2003; Kiran, et al. 2000; Morris and Waldheim, 1998). In 2009, the South African Department of Environmental
Affairs reacted to the potential danger to the environment caused by waste tyres by demanding that the tyre industry
be the first in South Africa to develop an industry waste management plan. The Recycling and Economic Development
Initiative of South Africa (REDISA) (Furlonger, 2014) drives the plan, which became effective in 2013. The initiative had
collected about 28,800 tonnes of old tyres by June 2014 (Furlonger, 2014). This shows a challenge in the management of
waste tyres as about 240,000 tonnes of new tyres enter the market every year in South Africa. The plan relies on
independent transporters delivering old tyres to regional storage depots from where they are passed on to recyclers
(Furlonger, 2014). Although REDISA is making a significant contribution, a huge market for waste tyres is required to address
this growing environmental challenge. Under the new plan, tyre manufacturers and importers are paying a levy of
R2,300/tonne, plus 14 per cent value added tax for any new tyre they introduce to South African roads (REDISA, 2014).
The funds raised will enable a move to kick-start a new industry around the collection, transport and disposal of every
waste tyre (Molewa, 2012). By creating income generating opportunities, and the researching of new recycling methods,
the new legislation will dramatically reduce the quantity of waste tyres in South Africa. The Recycling and Economic
Development Initiative of South Africa, as gazetted by the Water and Environmental affairs Minister on 23 July 2012, has
been well received. All tyre producers registered with REDISA must immediately comply with the approved REDISA
Integrated Waste Tyre Management Plan (IWTMP) in terms of the Regulation 6(3) of the Waste Tyre Regulations in
accordance to the National Environmental Management: Waste Act, 2008 (Act No. 59 of 2008). Pyrolysis, gasification,
and liquefaction are technologies that could be used to divert a significant portion of the scrap tyres currently being
landfilled.
Waste Tyre Pyrolysis Technology
There has been great interest in alternative treatment processes for waste tyres, amongst which is the use of pyrolysis
technology (Sienkiewicz, et al. 2012). Pyrolysis is the thermal degradation of the organic components of the tyres at typical
process temperatures of 400oC to produce oil, gas and char product, in addition to the recovery of the steel. The yields
and quality of these products are influenced by the reactor type used to pyrolyse the feedstock (Bhatt and Patel, 2012).
The fuel oil produced from this process is a complex chemical mixture containing aliphatic, aromatic, heteroatom and
polar fractions (Pilusa, et al. 2013). The fuel characteristics show that it has very similar properties to diesel fuel and can be
used in test furnaces and internal combustion engines (Murugan, et al. 1998).
The oil may be used directly as a fuel, added to petroleum refinery stocks, upgraded using catalysts to a premium grade
fuel, or used as a chemical feedstock (Islam, et al. 2010). The gases from tyre pyrolysis are typically composed of C1–C4
hydrocarbons and hydrogen with a high calorific value, of sufficient energy content to act as fuel to provide the heat for
the pyrolysis process (Martinez, et al. 2013). The solid char consists of the carbon black filler and also char (Qu, et al. 2006).
The liquid and gaseous fractions obtained are a valuable fuel source, while the solid fraction (char) has the recovery
potential of low-grade carbon black or as carbon adsorbent after applying an activation step (Kalitko, 2008). The
uncondensed gaseous fraction has properties close to those of synthesis gas as described by Bajus and Olahova (2011).
The main option for treating waste tyres is as fuel in cement kilns. Other energy recovery options for tyres include use in
power plants and co-incineration (Quek, et al. 2013). Large portions of tyres are used in material recovery options such as
crumb products for the production of rubberised flooring in sports fields and playgrounds, paving block and other rubber
applications. A significant proportion of the waste tyres are typically used in civil engineering applications such as road
and rail foundations and embankments (Islam, et al. 2011). However, there is very little use of waste tyres in civil
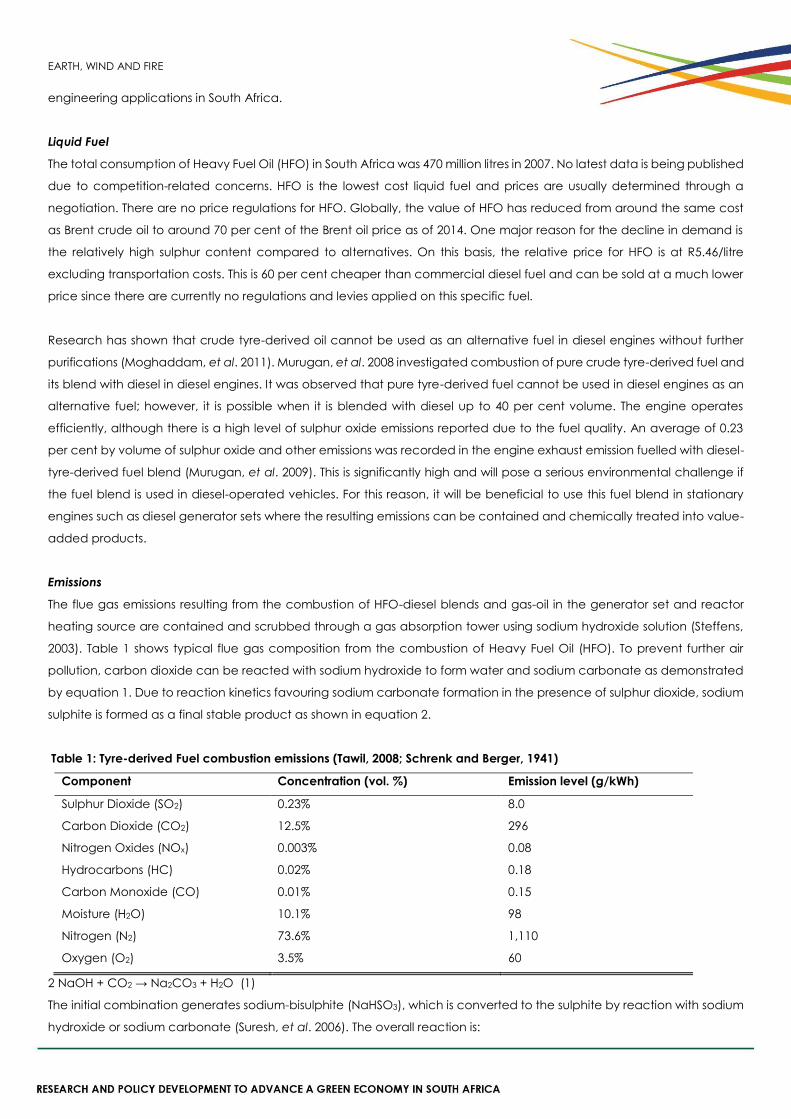
EARTH, WIND AND FIRE
engineering applications in South Africa.
Liquid Fuel
The total consumption of Heavy Fuel Oil (HFO) in South Africa was 470 million litres in 2007. No latest data is being published
due to competition-related concerns. HFO is the lowest cost liquid fuel and prices are usually determined through a
negotiation. There are no price regulations for HFO. Globally, the value of HFO has reduced from around the same cost
as Brent crude oil to around 70 per cent of the Brent oil price as of 2014. One major reason for the decline in demand is
the relatively high sulphur content compared to alternatives. On this basis, the relative price for HFO is at R5.46/litre
excluding transportation costs. This is 60 per cent cheaper than commercial diesel fuel and can be sold at a much lower
price since there are currently no regulations and levies applied on this specific fuel.
Research has shown that crude tyre-derived oil cannot be used as an alternative fuel in diesel engines without further
purifications (Moghaddam, et al. 2011). Murugan, et al. 2008 investigated combustion of pure crude tyre-derived fuel and
its blend with diesel in diesel engines. It was observed that pure tyre-derived fuel cannot be used in diesel engines as an
alternative fuel; however, it is possible when it is blended with diesel up to 40 per cent volume. The engine operates
efficiently, although there is a high level of sulphur oxide emissions reported due to the fuel quality. An average of 0.23
per cent by volume of sulphur oxide and other emissions was recorded in the engine exhaust emission fuelled with diesel-
tyre-derived fuel blend (Murugan, et al. 2009). This is significantly high and will pose a serious environmental challenge if
the fuel blend is used in diesel-operated vehicles. For this reason, it will be beneficial to use this fuel blend in stationary
engines such as diesel generator sets where the resulting emissions can be contained and chemically treated into value-
added products.
Emissions
The flue gas emissions resulting from the combustion of HFO-diesel blends and gas-oil in the generator set and reactor
heating source are contained and scrubbed through a gas absorption tower using sodium hydroxide solution (Steffens,
2003). Table 1 shows typical flue gas composition from the combustion of Heavy Fuel Oil (HFO). To prevent further air
pollution, carbon dioxide can be reacted with sodium hydroxide to form water and sodium carbonate as demonstrated
by equation 1. Due to reaction kinetics favouring sodium carbonate formation in the presence of sulphur dioxide, sodium
sulphite is formed as a final stable product as shown in equation 2.
Table 1: Tyre-derived Fuel combustion emissions (Tawil, 2008; Schrenk and Berger, 1941)
Component Concentration (vol. %) Emission level (g/kWh)
Sulphur Dioxide (SO2) 0.23% 8.0
Carbon Dioxide (CO2) 12.5% 296
Nitrogen Oxides (NOx) 0.003% 0.08
Hydrocarbons (HC) 0.02% 0.18
Carbon Monoxide (CO) 0.01% 0.15
Moisture (H2O) 10.1% 98
Nitrogen (N2) 73.6% 1,110
Oxygen (O2) 3.5% 60
2 NaOH + CO2 → Na2CO3 + H2O (1)
The initial combination generates sodium-bisulphite (NaHSO3), which is converted to the sulphite by reaction with sodium
hydroxide or sodium carbonate (Suresh, et al. 2006). The overall reaction is:
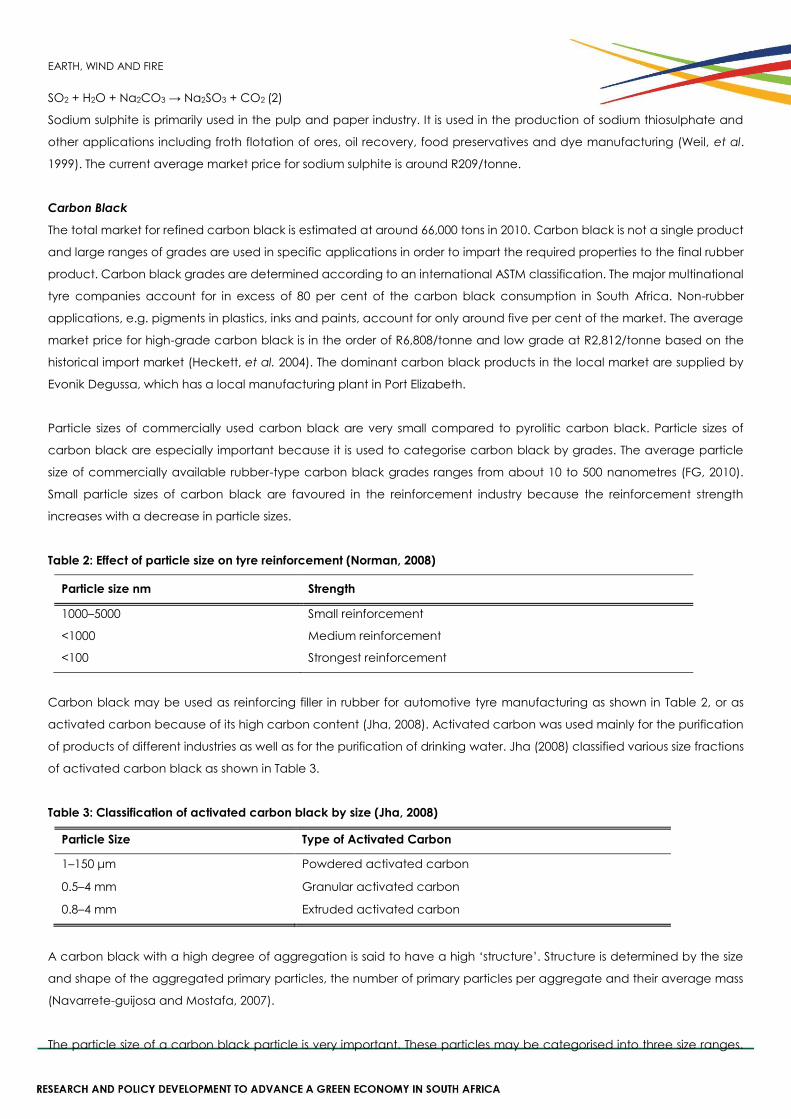
EARTH, WIND AND FIRE
SO2 + H2O + Na2CO3 → Na2SO3 + CO2 (2)
Sodium sulphite is primarily used in the pulp and paper industry. It is used in the production of sodium thiosulphate and
other applications including froth flotation of ores, oil recovery, food preservatives and dye manufacturing (Weil, et al.
1999). The current average market price for sodium sulphite is around R209/tonne.
Carbon Black
The total market for refined carbon black is estimated at around 66,000 tons in 2010. Carbon black is not a single product
and large ranges of grades are used in specific applications in order to impart the required properties to the final rubber
product. Carbon black grades are determined according to an international ASTM classification. The major multinational
tyre companies account for in excess of 80 per cent of the carbon black consumption in South Africa. Non-rubber
applications, e.g. pigments in plastics, inks and paints, account for only around five per cent of the market. The average
market price for high-grade carbon black is in the order of R6,808/tonne and low grade at R2,812/tonne based on the
historical import market (Heckett, et al. 2004). The dominant carbon black products in the local market are supplied by
Evonik Degussa, which has a local manufacturing plant in Port Elizabeth.
Particle sizes of commercially used carbon black are very small compared to pyrolitic carbon black. Particle sizes of
carbon black are especially important because it is used to categorise carbon black by grades. The average particle
size of commercially available rubber-type carbon black grades ranges from about 10 to 500 nanometres (FG, 2010).
Small particle sizes of carbon black are favoured in the reinforcement industry because the reinforcement strength
increases with a decrease in particle sizes.
Table 2: Effect of particle size on tyre reinforcement (Norman, 2008)
Particle size nm Strength
1000–5000 Small reinforcement
<1000 Medium reinforcement
<100 Strongest reinforcement
Carbon black may be used as reinforcing filler in rubber for automotive tyre manufacturing as shown in Table 2, or as
activated carbon because of its high carbon content (Jha, 2008). Activated carbon was used mainly for the purification
of products of different industries as well as for the purification of drinking water. Jha (2008) classified various size fractions
of activated carbon black as shown in Table 3.
Table 3: Classification of activated carbon black by size (Jha, 2008)
Particle Size Type of Activated Carbon
1–150 μm Powdered activated carbon
0.5–4 mm Granular activated carbon
0.8–4 mm Extruded activated carbon
A carbon black with a high degree of aggregation is said to have a high ‘structure’. Structure is determined by the size
and shape of the aggregated primary particles, the number of primary particles per aggregate and their average mass
(Navarrete-guijosa and Mostafa, 2007).
The particle size of a carbon black particle is very important. These particles may be categorised into three size ranges.
EARTH, WIND AND FIRE
The primary particles have the smallest size, which are typically 13–100nm in diameter depending on the parameters set
in carbon black processing (Nerulhuda, 2008). Such primary particles fuse and form in the furnace reactor, a second
larger level of structure or aggregates having size in the range 200–1000nm. The morphologies of these aggregates can
vary from linear, branched to completely compact and roughly spherical domain (Huang, et al. 2005). Further, these
carbon aggregates may percolate and form agglomerates, which have the largest size (exceeding 1,000 nm) (Guerrero,
et al. 2008). The easy formation of aggregate of the furnace carbon is due to the high inter-particular forces, while
agglomerates result from weakly bound aggregates, and might be broken down into aggregates by micro-milling.
Properties of Carbon Black
Carbon black consists of aggregates, defined as the smallest dispersible units, which are composed of partially fused,
reasonably spherical primary particles. Surface areas increase as primary particle size is reduced (Islam, et al. 2006). The
aggregates, in turn, are held together by attractive van der Waals forces to form agglomerates. These forces increase as
the size of the primary particle is reduced and agglomerate density is increased.
Characterisation of the surface properties of carbon black in terms of surface activity has been difficult compared to the
other fundamental properties. However, surface activity has been evaluated in terms of the oxygen content and/or
moisture adsorption rate (Khan, at al. 2010). For polar carbon black surfaces, oxygen content and acidity are important
measures of the effective surface activity (Islam, et al. 2006).
Sulphur is one of the most common impurities in carbon black. It can be introduced with the tyre rubber feedstock.
Inorganic contaminants in carbon black, such as Si, Al, and Cu can also be introduced with the rubber feedstock in the
form of trace metals, cracking catalyst residues, and from the carbon black reactor (Sha, et al. 2006). It is necessary to
obtain surface chemical states of these elements in terms of surface element distribution/concentration and chemical
structure for the surface chemistry information on carbon black (Tscharnuter, at al. 2011).
Applications of Carbon Black
Traditionally, carbon black has been used as a reinforcing agent in tyres. Today, because of its unique properties, the uses
of carbon black have expanded to include pigmentation, ultraviolet (UV) stabilisation and conductive agents in a variety
of everyday and specialty high-performance products, including:
Tyres and Industrial Rubber Products:
Carbon black is added to rubber as a filler, and as a strengthening or reinforcing agent. For various types of tyres, it is used
in inner liners, carcasses, sidewalls and treads utilising different types based on specific performance requirements.
Plastics:
Carbon blacks are now widely used for conductive packaging, films, fibres, mouldings, pipes and semi-conductive cable
compounds in products such as refuse sacks, industrial bags, photographic containers, agriculture mulch film, stretch
wrap and thermoplastic moulding applications for automotive, electrical/electronics, household appliances and blow-
moulded containers.
Electrostatic Discharge (ESD) Compounds:
Carbon blacks are carefully designed to transform electrical characteristics from insulating to conductive in products
such as electronic packaging, safety applications and automotive parts.
EARTH, WIND AND FIRE
High Performance Coatings:
Carbon blacks provide pigmentation, conductivity and UV protection for a number of coating applications including
automotive (primer basecoats and clear coats), marine, aerospace, decorative, wood, and industrial coatings.
Toners and Printing Inks:
Carbon blacks enhance formulations and deliver broad flexibility in meeting specific colour requirements.
Activated carbon:
Carbon black exhibits a high iodine absorption number making it a potential adsorbent for water purification and gold
recovery.
Solid Fuel:
Carbon black has higher calorific value, fixed carbon and low sulphur and ash contents; it can be potentially used as
high quality fuel either in granules or briquettes.
METHOD
The process flow diagram shown in Figure 1 was developed for the pyrolysis of waste tyres in Gauteng Province, South
Africa, as a benchmark to model the economic feasibility of this waste tyre treatment and utilisation option in South Africa.
Gauteng, the smallest province in South Africa, occupying only 1.5 per cent of the land area, is highly urbanised and
contributes up to 33.9 per cent of South Africa’s Gross Domestic Product (GDP) valued at R811 billion. Gauteng consists
of three main municipalities: City of Johannesburg (CoJ), Ekurhuleni (Ekh) and City of Tshwane (CoT) with a total 48,077
tonnes per annum (tpa) waste tyre generation. A total of three additional tyre pyrolysis plants, each with a capacity of
treating 30 tonnes per day waste tyre/rubber material will be required to manage the waste tyres in Gauteng Province.
Process Description
As proposed in the REDISA plan, the waste tyres will be delivered by an approved waste tyre distributor to a permitted
treatment facility where the total mass will be recorded at the weighbridge facility. The tyres’ rings will be trimmed and
cut into halves to extract the reinforced high tensile steel using a mechanical steel extractor. The steel cords will be baled
and sold as a recyclable product. The trimmed tyres will be mechanically shredded to approximately 10–15mm rubber
chips. The shredded rubber chips will be steam washed, dried and stockpiled before they are fed into a pyrolysis reactor
vessel. The steam will be generated using excess heat from the diesel generator set as shown in Figure 1.
The reactor vessel will be initially heated using gas or fuel burners. This heats up the enclosed rubber chips in the absence
of oxygen to temperatures of about 570oC until gasification occurs. The gases will be contained and condensed to form
condensed heavy fuel oil (CHFO), which will be further fractionated in a distillation column to form light diesel equivalent
tyre-derived fuel (TDF) and heavy fuel oil (HFO) (Sundarandian and Devaradjane, 2007). The HFO fraction will be blended
with low sulphur commercial diesel fuel at a 30:70 volume ratio to fuel a diesel generator set that provides electrical power
to all plant machinery.
This approach is considered the most economical option for combusting high sulphur HFO, since it allows for exhaust
emissions capture and chemical neutralisation into value-added products. The emission from the generator set and
reactor fuel burners will be contained and chemically treated through a gas absorption column to produce valuable
products such as gypsum and sodium sulphite, depending on the type of alkali-solution used. The waste heat from the
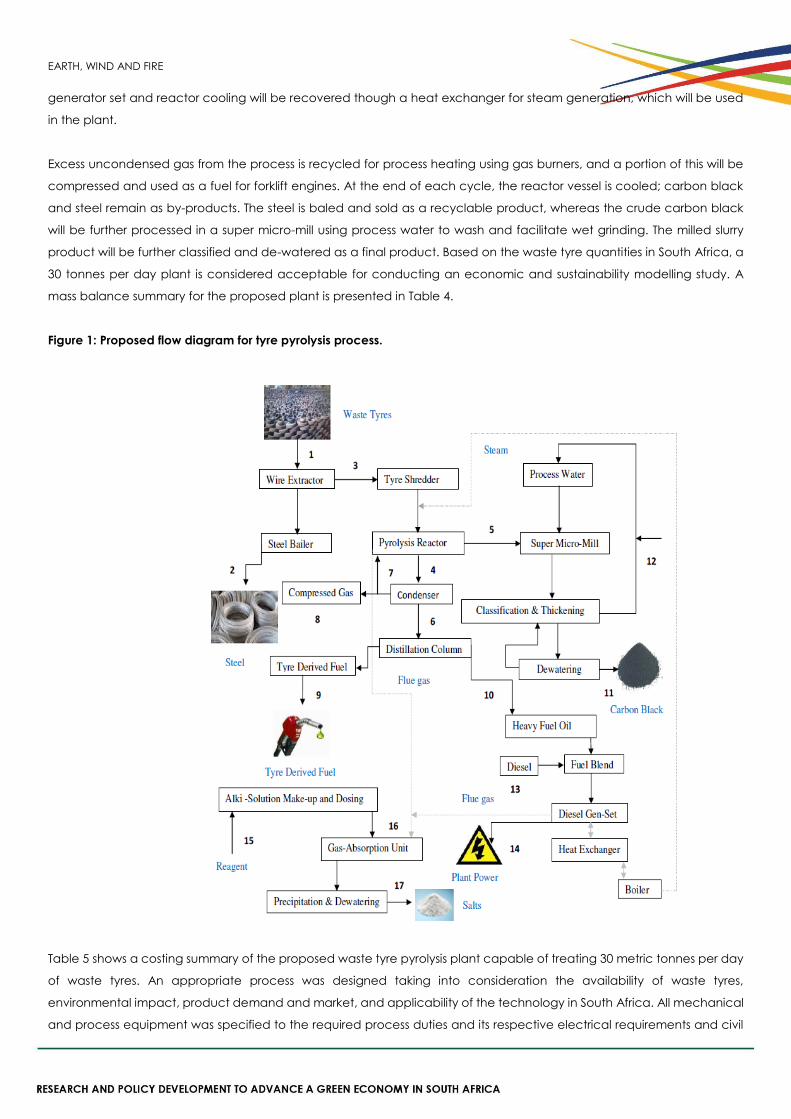
EARTH, WIND AND FIRE
generator set and reactor cooling will be recovered though a heat exchanger for steam generation, which will be used
in the plant.
Excess uncondensed gas from the process is recycled for process heating using gas burners, and a portion of this will be
compressed and used as a fuel for forklift engines. At the end of each cycle, the reactor vessel is cooled; carbon black
and steel remain as by-products. The steel is baled and sold as a recyclable product, whereas the crude carbon black
will be further processed in a super micro-mill using process water to wash and facilitate wet grinding. The milled slurry
product will be further classified and de-watered as a final product. Based on the waste tyre quantities in South Africa, a
30 tonnes per day plant is considered acceptable for conducting an economic and sustainability modelling study. A
mass balance summary for the proposed plant is presented in Table 4.
Figure 1: Proposed flow diagram for tyre pyrolysis process.
Table 5 shows a costing summary of the proposed waste tyre pyrolysis plant capable of treating 30 metric tonnes per day
of waste tyres. An appropriate process was designed taking into consideration the availability of waste tyres,
environmental impact, product demand and market, and applicability of the technology in South Africa. All mechanical
and process equipment was specified to the required process duties and its respective electrical requirements and civil
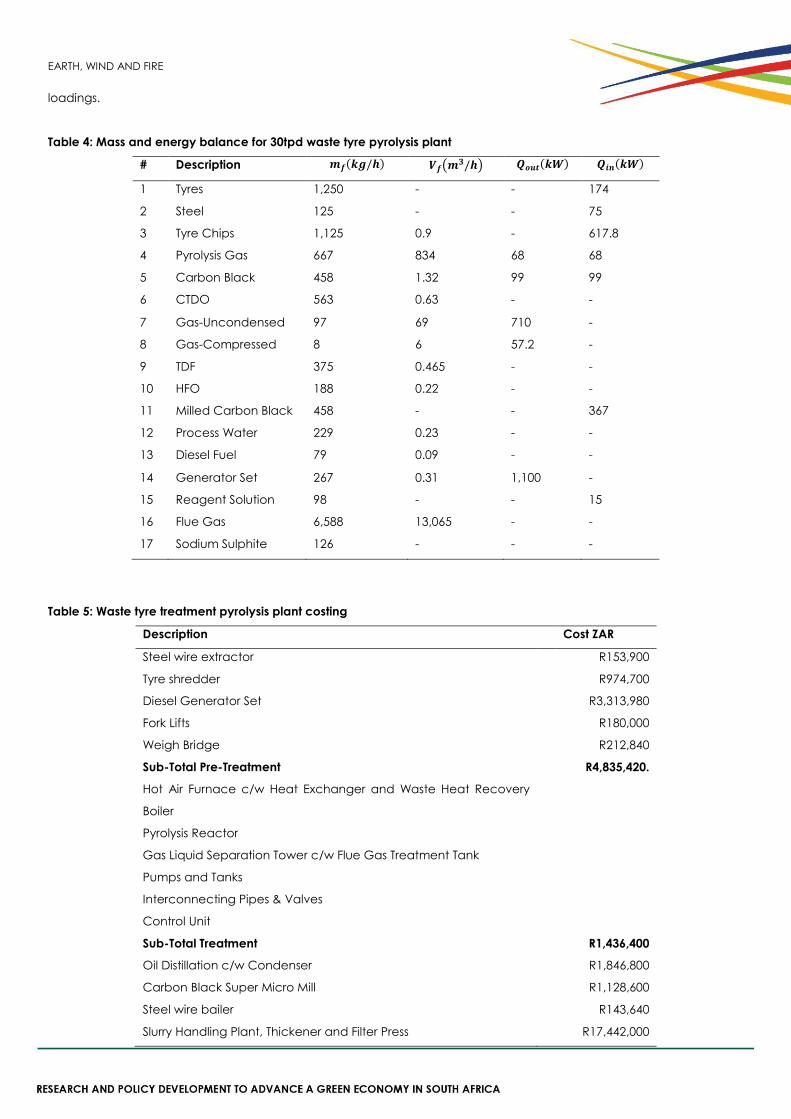
EARTH, WIND AND FIRE
loadings.
Table 4: Mass and energy balance for 30tpd waste tyre pyrolysis plant
# Description 𝒎𝒇(𝒌𝒈/𝒉) 𝑽𝒇(𝒎𝟑/𝒉) 𝑸𝒐𝒖𝒕(𝒌𝑾) 𝑸𝒊𝒏(𝒌𝑾)
1 Tyres 1,250 - - 174
2 Steel 125 - - 75
3 Tyre Chips 1,125 0.9 - 617.8
4 Pyrolysis Gas 667 834 68 68
5 Carbon Black 458 1.32 99 99
6 CTDO 563 0.63 - -
7 Gas-Uncondensed 97 69 710 -
8 Gas-Compressed 8 6 57.2 -
9 TDF 375 0.465 - -
10 HFO 188 0.22 - -
11 Milled Carbon Black 458 - - 367
12 Process Water 229 0.23 - -
13 Diesel Fuel 79 0.09 - -
14 Generator Set 267 0.31 1,100 -
15 Reagent Solution 98 - - 15
16 Flue Gas 6,588 13,065 - -
17 Sodium Sulphite 126 - - -
Table 5: Waste tyre treatment pyrolysis plant costing
Description Cost ZAR
Steel wire extractor R153,900
Tyre shredder R974,700
Diesel Generator Set R3,313,980
Fork Lifts R180,000
Weigh Bridge R212,840
Sub-Total Pre-Treatment R4,835,420.
Hot Air Furnace c/w Heat Exchanger and Waste Heat Recovery
Boiler
Pyrolysis Reactor
Gas Liquid Separation Tower c/w Flue Gas Treatment Tank
Pumps and Tanks
Interconnecting Pipes & Valves
Control Unit
Sub-Total Treatment R1,436,400
Oil Distillation c/w Condenser R1,846,800
Carbon Black Super Micro Mill R1,128,600
Steel wire bailer R143,640
Slurry Handling Plant, Thickener and Filter Press R17,442,000
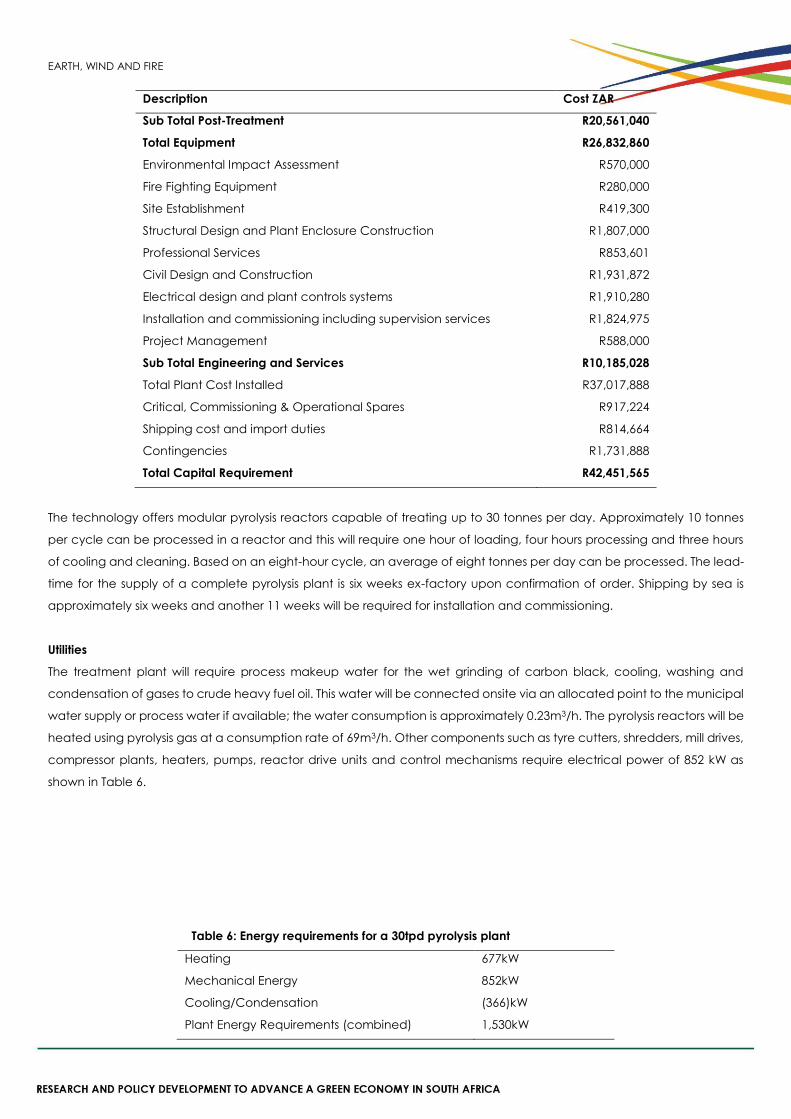
EARTH, WIND AND FIRE
Description Cost ZAR
Sub Total Post-Treatment R20,561,040
Total Equipment R26,832,860
Environmental Impact Assessment R570,000
Fire Fighting Equipment R280,000
Site Establishment R419,300
Structural Design and Plant Enclosure Construction R1,807,000
Professional Services R853,601
Civil Design and Construction R1,931,872
Electrical design and plant controls systems R1,910,280
Installation and commissioning including supervision services R1,824,975
Project Management R588,000
Sub Total Engineering and Services R10,185,028
Total Plant Cost Installed R37,017,888
Critical, Commissioning & Operational Spares R917,224
Shipping cost and import duties R814,664
Contingencies R1,731,888
Total Capital Requirement R42,451,565
The technology offers modular pyrolysis reactors capable of treating up to 30 tonnes per day. Approximately 10 tonnes
per cycle can be processed in a reactor and this will require one hour of loading, four hours processing and three hours
of cooling and cleaning. Based on an eight-hour cycle, an average of eight tonnes per day can be processed. The lead-
time for the supply of a complete pyrolysis plant is six weeks ex-factory upon confirmation of order. Shipping by sea is
approximately six weeks and another 11 weeks will be required for installation and commissioning.
Utilities
The treatment plant will require process makeup water for the wet grinding of carbon black, cooling, washing and
condensation of gases to crude heavy fuel oil. This water will be connected onsite via an allocated point to the municipal
water supply or process water if available; the water consumption is approximately 0.23m3/h. The pyrolysis reactors will be
heated using pyrolysis gas at a consumption rate of 69m3/h. Other components such as tyre cutters, shredders, mill drives,
compressor plants, heaters, pumps, reactor drive units and control mechanisms require electrical power of 852 kW as
shown in Table 6.
Table 6: Energy requirements for a 30tpd pyrolysis plant
Heating 677kW
Mechanical Energy 852kW
Cooling/Condensation (366)kW
Plant Energy Requirements (combined) 1,530kW
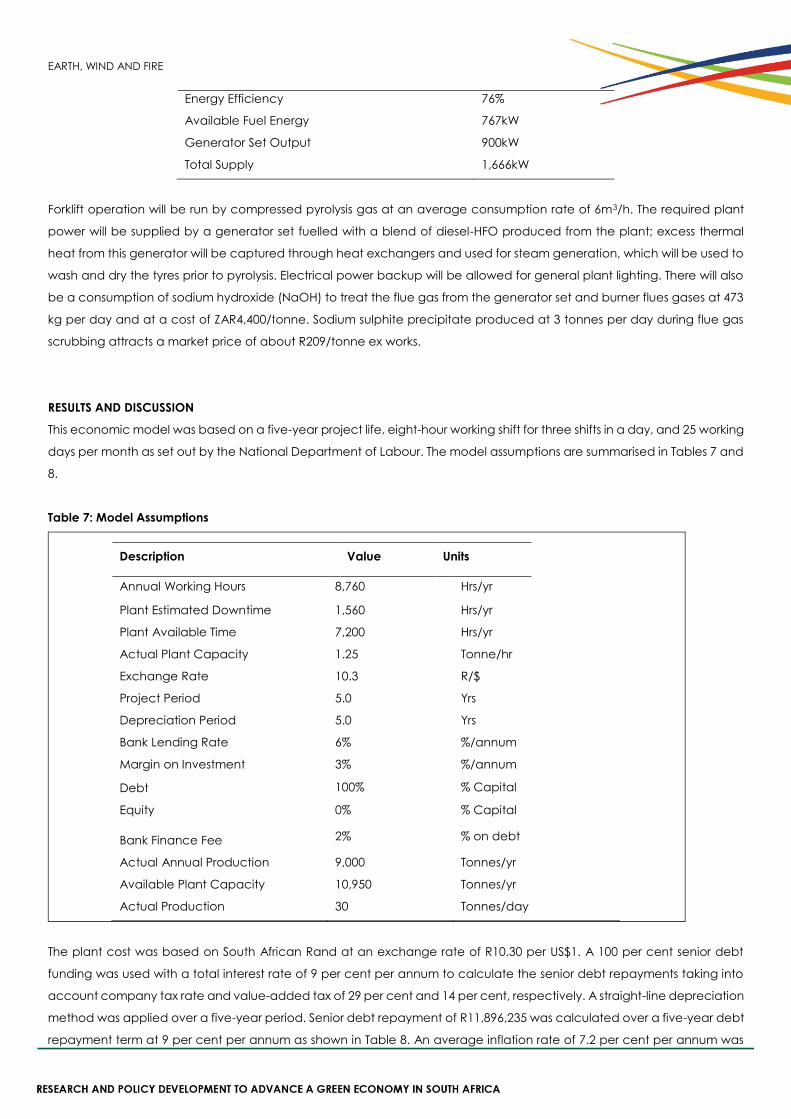
EARTH, WIND AND FIRE
Energy Efficiency 76%
Available Fuel Energy 767kW
Generator Set Output 900kW
Total Supply 1,666kW
Forklift operation will be run by compressed pyrolysis gas at an average consumption rate of 6m3/h. The required plant
power will be supplied by a generator set fuelled with a blend of diesel-HFO produced from the plant; excess thermal
heat from this generator will be captured through heat exchangers and used for steam generation, which will be used to
wash and dry the tyres prior to pyrolysis. Electrical power backup will be allowed for general plant lighting. There will also
be a consumption of sodium hydroxide (NaOH) to treat the flue gas from the generator set and burner flues gases at 473
kg per day and at a cost of ZAR4,400/tonne. Sodium sulphite precipitate produced at 3 tonnes per day during flue gas
scrubbing attracts a market price of about R209/tonne ex works.
RESULTS AND DISCUSSION
This economic model was based on a five-year project life, eight-hour working shift for three shifts in a day, and 25 working
days per month as set out by the National Department of Labour. The model assumptions are summarised in Tables 7 and
8.
Table 7: Model Assumptions
Description Value Units
Annual Working Hours 8,760 Hrs/yr
Plant Estimated Downtime 1,560 Hrs/yr
Plant Available Time 7,200 Hrs/yr
Actual Plant Capacity 1.25 Tonne/hr
Exchange Rate 10.3 R/$
Project Period 5.0 Yrs
Depreciation Period 5.0 Yrs
Bank Lending Rate 6% %/annum
Margin on Investment 3% %/annum
Debt 100% % Capital
Equity 0% % Capital
Bank Finance Fee 2% % on debt
Actual Annual Production 9,000 Tonnes/yr
Available Plant Capacity 10,950 Tonnes/yr
Actual Production 30 Tonnes/day
The plant cost was based on South African Rand at an exchange rate of R10.30 per US$1. A 100 per cent senior debt
funding was used with a total interest rate of 9 per cent per annum to calculate the senior debt repayments taking into
account company tax rate and value-added tax of 29 per cent and 14 per cent, respectively. A straight-line depreciation
method was applied over a five-year period. Senior debt repayment of R11,896,235 was calculated over a five-year debt
repayment term at 9 per cent per annum as shown in Table 8. An average inflation rate of 7.2 per cent per annum was
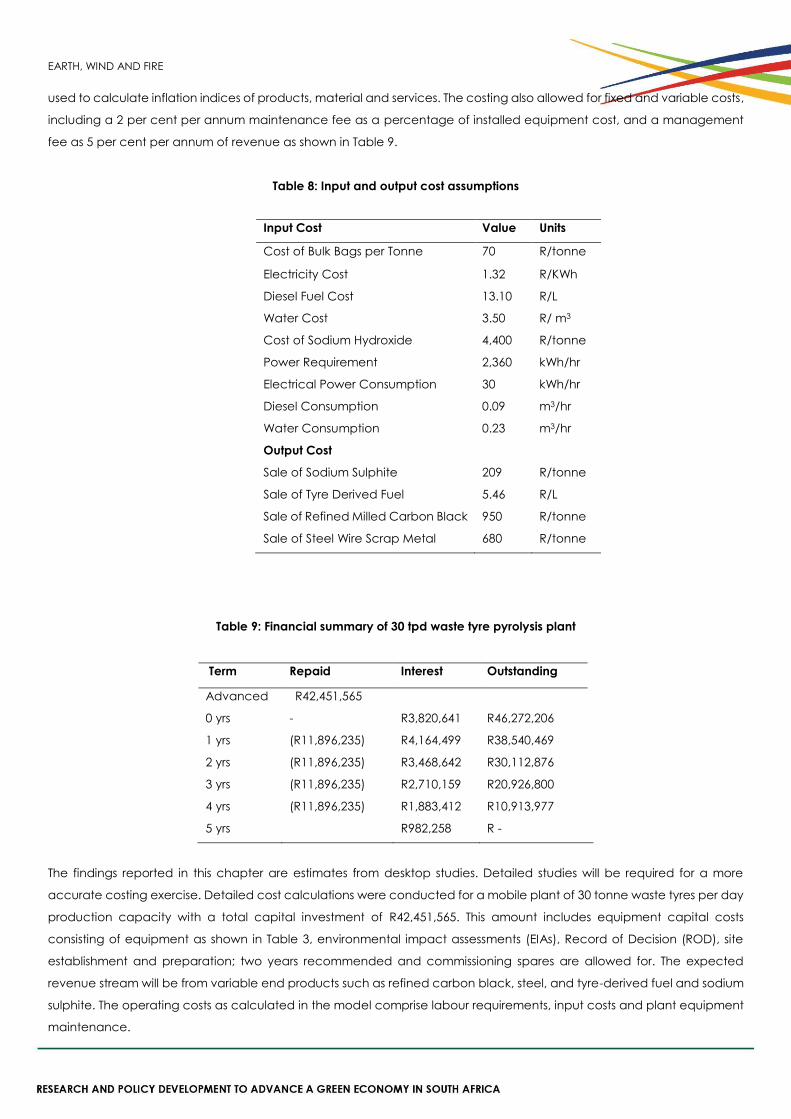
EARTH, WIND AND FIRE
used to calculate inflation indices of products, material and services. The costing also allowed for fixed and variable costs,
including a 2 per cent per annum maintenance fee as a percentage of installed equipment cost, and a management
fee as 5 per cent per annum of revenue as shown in Table 9.
Table 8: Input and output cost assumptions
Table 9: Financial summary of 30 tpd waste tyre pyrolysis plant
Term Repaid Interest Outstanding
Advanced R42,451,565
0 yrs - R3,820,641 R46,272,206
1 yrs (R11,896,235) R4,164,499 R38,540,469
2 yrs (R11,896,235) R3,468,642 R30,112,876
3 yrs (R11,896,235) R2,710,159 R20,926,800
4 yrs (R11,896,235) R1,883,412 R10,913,977
5 yrs R982,258 R -
The findings reported in this chapter are estimates from desktop studies. Detailed studies will be required for a more
accurate costing exercise. Detailed cost calculations were conducted for a mobile plant of 30 tonne waste tyres per day
production capacity with a total capital investment of R42,451,565. This amount includes equipment capital costs
consisting of equipment as shown in Table 3, environmental impact assessments (EIAs), Record of Decision (ROD), site
establishment and preparation; two years recommended and commissioning spares are allowed for. The expected
revenue stream will be from variable end products such as refined carbon black, steel, and tyre-derived fuel and sodium
sulphite. The operating costs as calculated in the model comprise labour requirements, input costs and plant equipment
maintenance.
Input Cost Value Units
Cost of Bulk Bags per Tonne 70 R/tonne
Electricity Cost 1.32 R/KWh
Diesel Fuel Cost 13.10 R/L
Water Cost 3.50 R/ m3
Cost of Sodium Hydroxide 4,400 R/tonne
Power Requirement 2,360 kWh/hr
Electrical Power Consumption 30 kWh/hr
Diesel Consumption 0.09 m3/hr
Water Consumption 0.23 m3/hr
Output Cost
Sale of Sodium Sulphite 209 R/tonne
Sale of Tyre Derived Fuel 5.46 R/L
Sale of Refined Milled Carbon Black 950 R/tonne
Sale of Steel Wire Scrap Metal 680 R/tonne
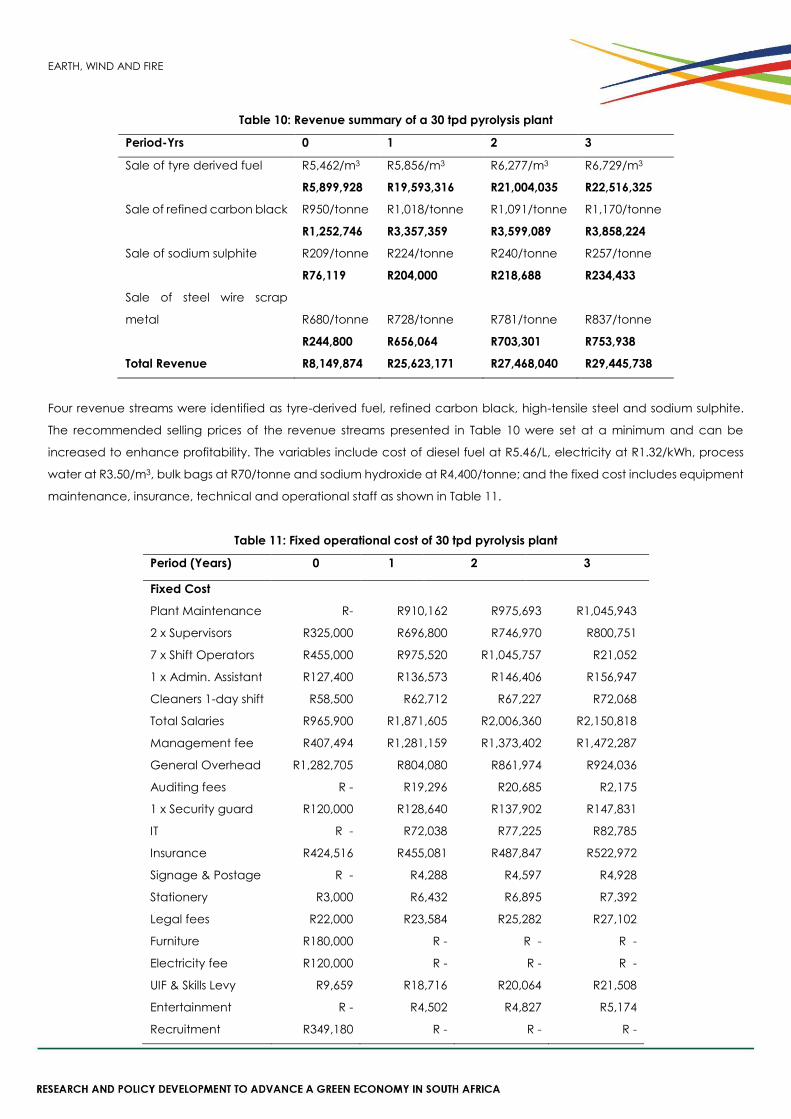
EARTH, WIND AND FIRE
Table 10: Revenue summary of a 30 tpd pyrolysis plant
Period-Yrs 0 1 2 3
Sale of tyre derived fuel R5,462/m3 R5,856/m3 R6,277/m3 R6,729/m3
R5,899,928 R19,593,316 R21,004,035 R22,516,325
Sale of refined carbon black R950/tonne R1,018/tonne R1,091/tonne R1,170/tonne
R1,252,746 R3,357,359 R3,599,089 R3,858,224
Sale of sodium sulphite R209/tonne R224/tonne R240/tonne R257/tonne
R76,119 R204,000 R218,688 R234,433
Sale of steel wire scrap
metal R680/tonne R728/tonne R781/tonne R837/tonne
R244,800 R656,064 R703,301 R753,938
Total Revenue R8,149,874 R25,623,171 R27,468,040 R29,445,738
Four revenue streams were identified as tyre-derived fuel, refined carbon black, high-tensile steel and sodium sulphite.
The recommended selling prices of the revenue streams presented in Table 10 were set at a minimum and can be
increased to enhance profitability. The variables include cost of diesel fuel at R5.46/L, electricity at R1.32/kWh, process
water at R3.50/m3, bulk bags at R70/tonne and sodium hydroxide at R4,400/tonne; and the fixed cost includes equipment
maintenance, insurance, technical and operational staff as shown in Table 11.
Table 11: Fixed operational cost of 30 tpd pyrolysis plant
Period (Years) 0 1 2 3
Fixed Cost
Plant Maintenance R- R910,162 R975,693 R1,045,943
2 x Supervisors R325,000 R696,800 R746,970 R800,751
7 x Shift Operators R455,000 R975,520 R1,045,757 R21,052
1 x Admin. Assistant R127,400 R136,573 R146,406 R156,947
Cleaners 1-day shift R58,500 R62,712 R67,227 R72,068
Total Salaries R965,900 R1,871,605 R2,006,360 R2,150,818
Management fee R407,494 R1,281,159 R1,373,402 R1,472,287
General Overhead R1,282,705 R804,080 R861,974 R924,036
Auditing fees R - R19,296 R20,685 R2,175
1 x Security guard R120,000 R128,640 R137,902 R147,831
IT R - R72,038 R77,225 R82,785
Insurance R424,516 R455,081 R487,847 R522,972
Signage & Postage R - R4,288 R4,597 R4,928
Stationery R3,000 R6,432 R6,895 R7,392
Legal fees R22,000 R23,584 R25,282 R27,102
Furniture R180,000 R - R - R -
Electricity fee R120,000 R - R - R -
UIF & Skills Levy R9,659 R18,716 R20,064 R21,508
Entertainment R - R4,502 R4,827 R5,174
Recruitment R349,180 R - R - R -
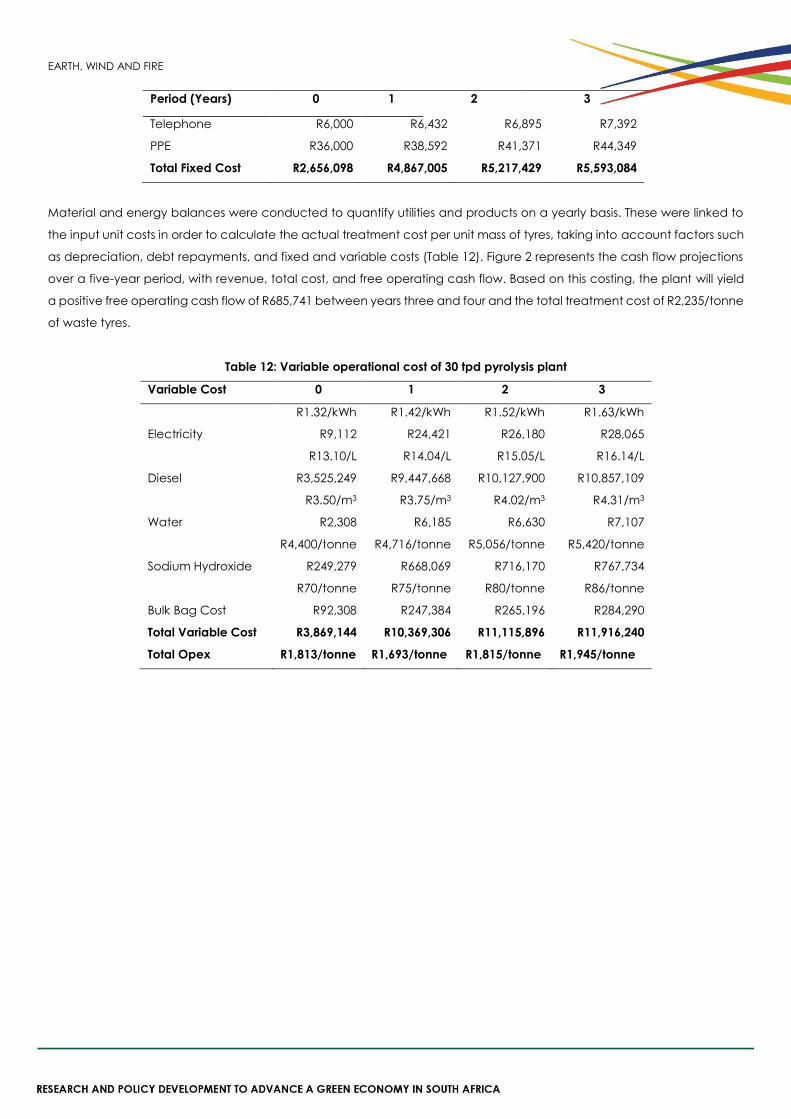
EARTH, WIND AND FIRE
Period (Years) 0 1 2 3
Telephone R6,000 R6,432 R6,895 R7,392
PPE R36,000 R38,592 R41,371 R44,349
Total Fixed Cost R2,656,098 R4,867,005 R5,217,429 R5,593,084
Material and energy balances were conducted to quantify utilities and products on a yearly basis. These were linked to
the input unit costs in order to calculate the actual treatment cost per unit mass of tyres, taking into account factors such
as depreciation, debt repayments, and fixed and variable costs (Table 12). Figure 2 represents the cash flow projections
over a five-year period, with revenue, total cost, and free operating cash flow. Based on this costing, the plant will yield
a positive free operating cash flow of R685,741 between years three and four and the total treatment cost of R2,235/tonne
of waste tyres.
Table 12: Variable operational cost of 30 tpd pyrolysis plant
Variable Cost 0 1 2 3
R1.32/kWh R1.42/kWh R1.52/kWh R1.63/kWh
Electricity R9,112 R24,421 R26,180 R28,065
R13.10/L R14.04/L R15.05/L R16.14/L
Diesel R3,525,249 R9,447,668 R10,127,900 R10,857,109
R3.50/m3 R3.75/m3 R4.02/m3 R4.31/m3
Water R2,308 R6,185 R6,630 R7,107
R4,400/tonne R4,716/tonne R5,056/tonne R5,420/tonne
Sodium Hydroxide R249,279 R668,069 R716,170 R767,734
R70/tonne R75/tonne R80/tonne R86/tonne
Bulk Bag Cost R92,308 R247,384 R265,196 R284,290
Total Variable Cost R3,869,144 R10,369,306 R11,115,896 R11,916,240
Total Opex R1,813/tonne R1,693/tonne R1,815/tonne R1,945/tonne
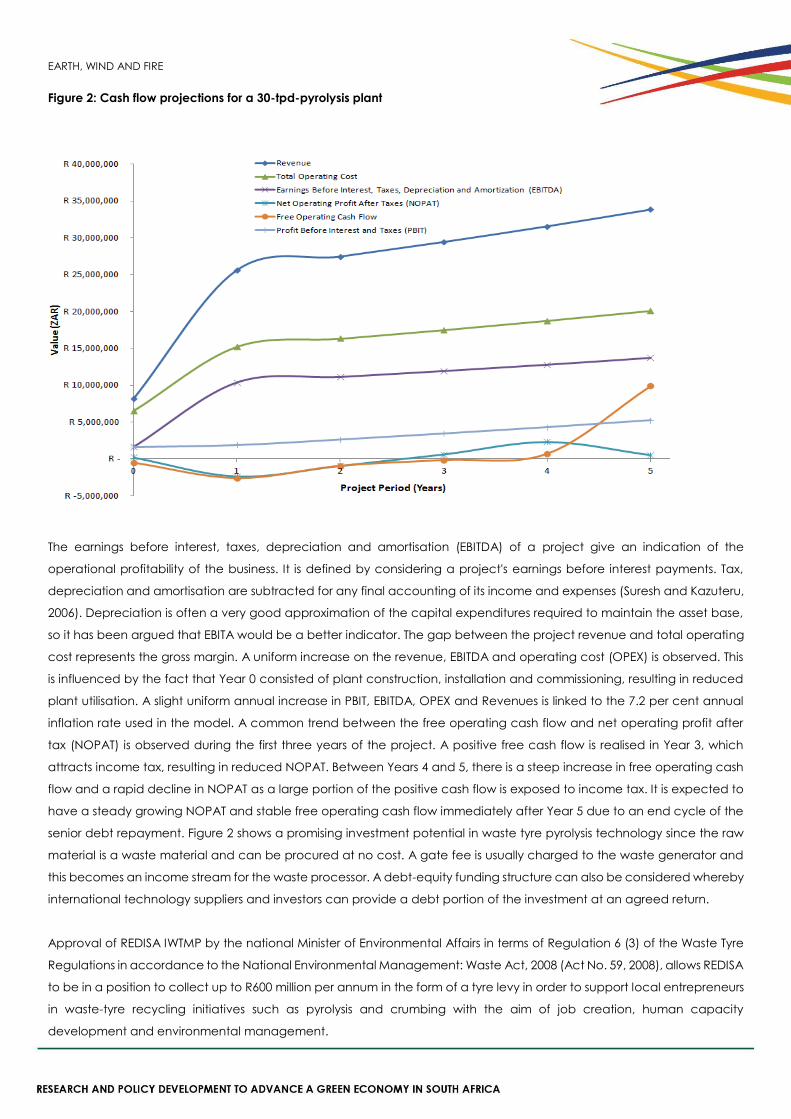
EARTH, WIND AND FIRE
Figure 2: Cash flow projections for a 30-tpd-pyrolysis plant
The earnings before interest, taxes, depreciation and amortisation (EBITDA) of a project give an indication of the
operational profitability of the business. It is defined by considering a project's earnings before interest payments. Tax,
depreciation and amortisation are subtracted for any final accounting of its income and expenses (Suresh and Kazuteru,
2006). Depreciation is often a very good approximation of the capital expenditures required to maintain the asset base,
so it has been argued that EBITA would be a better indicator. The gap between the project revenue and total operating
cost represents the gross margin. A uniform increase on the revenue, EBITDA and operating cost (OPEX) is observed. This
is influenced by the fact that Year 0 consisted of plant construction, installation and commissioning, resulting in reduced
plant utilisation. A slight uniform annual increase in PBIT, EBITDA, OPEX and Revenues is linked to the 7.2 per cent annual
inflation rate used in the model. A common trend between the free operating cash flow and net operating profit after
tax (NOPAT) is observed during the first three years of the project. A positive free cash flow is realised in Year 3, which
attracts income tax, resulting in reduced NOPAT. Between Years 4 and 5, there is a steep increase in free operating cash
flow and a rapid decline in NOPAT as a large portion of the positive cash flow is exposed to income tax. It is expected to
have a steady growing NOPAT and stable free operating cash flow immediately after Year 5 due to an end cycle of the
senior debt repayment. Figure 2 shows a promising investment potential in waste tyre pyrolysis technology since the raw
material is a waste material and can be procured at no cost. A gate fee is usually charged to the waste generator and
this becomes an income stream for the waste processor. A debt-equity funding structure can also be considered whereby
international technology suppliers and investors can provide a debt portion of the investment at an agreed return.
Approval of REDISA IWTMP by the national Minister of Environmental Affairs in terms of Regulation 6 (3) of the Waste Tyre
Regulations in accordance to the National Environmental Management: Waste Act, 2008 (Act No. 59, 2008), allows REDISA
to be in a position to collect up to R600 million per annum in the form of a tyre levy in order to support local entrepreneurs
in waste-tyre recycling initiatives such as pyrolysis and crumbing with the aim of job creation, human capacity
development and environmental management.
EARTH, WIND AND FIRE
CONCLUSIONS
Waste tyre pyrolysis technology is one of the proven technologies that can be applied as an alternative method for the
treatment and disposal of waste tyres and rubber products. Despite the findings discussed above, there is a need to assess
the current waste tyre pyrolysis plants in South Africa in order to evaluate factors leading to the plants not being
economically viable. Some of these factors include the following:
There is a complicated process of obtaining environmental permits to operate such plants.
There is a need for beneficiation and sale of carbon black as a supplementary revenue stream.
None of South Africa’s facilities is utilising excess gas produced in plant to optimise energy utilisation.
Most technologies are sourced from China and do not comply with relevant SABS codes.
Spare parts are not readily available in the country.
There is no guarantee of feedstock (waste tyres) and product off-take at pre-agreed price and quantities.
Most plants produce crude products of no value that require beneficiation. Therefore beneficiation of crude oil
into valuable chemicals improves the plant process economics.
There is a lack of knowledge of the technology and its relevance to the South African market.
The use of crude tyre-derived fuel as a direct fuel for any combustion system is not recommended due to the high level
of contamination and high sulphur content. Refining of crude tyre-derived oil through a desulphurising distillation process
is important in ensuring the production of clean low-cost fuel. Carbon black post-treatment via super micro-milling and
classification helps to produce various grades of high-quality carbon black for the local and export markets. The heavy
fuel fraction of the distillate can be used only with a low sulphur diesel blend in stationary combustion units such as
generator sets and boilers fitted with emission neutralisation systems. The refined tyre-derived fuel is suitable for use in
conventional diesel engines with blends of up to 1.5:1 volume ratio, tyre-derived fuel-diesel. Chemical treatment of flue
gases from the combustion of heavy fuel oil results in the production of valuable sodium sulphite. The application of
pyrolysis technology to the treatment of waste tyres was found to be economically feasible when considering a 30 tpd
plant capacity with a required capital investment of R42.5 million with a potential investment return and gross margin of
27.1 per cent and 40.6 per cent, respectively. Each facility will produce an alternative 4 million litres per annum of refined
tyre-derived fuel for application in diesel engines at the cost of R5.46/litre and other secondary value-add products for
local and export markets. The use of alternative fuels by the municipalities will help in reducing fuel bills and dependency
on conventional fuels such as diesel. This fuel can be used as diesel additive by municipal-owned public transport such
as buses, waste collection vehicles, and generator sets to run municipal wastewater works and pump stations.
This study supports the REDISA plan as it has the potential to make a significant contribution towards transport and waste
social costs reduction, environment and climate protection, alternative sources of energy, green jobs creation, capacity
building, skills transfer, postgraduate training, research and technological advancement in South Africa. There is no doubt
that the availability of waste tyres and the product off-take markets are the key drivers for the successful operation of
waste tyre pyrolysis technology.
References
Bajus, M. and Olahova, N. 2011. ‘Thermal Conversion of Scrap Tyres’, Petroleum and Coal, 53: 98–105.
Berrueco, C., Esperanza, E., Mastral, F. J., Ceamanos, J. and Garcia-Bacaicoa, P. 2005 ‘Pyrolysis of Waste Tyres in an
Atmospheric Static-Bed Batch Reactor: Analysis of the Gases Obtained’, Journal of Analytical and Applied Pyrolysis,
EARTH, WIND AND FIRE
74: 245–253.
Bhatt, P. M. and Patel, P. D. 2012. ‘Suitability of Tyre Pyrolysis Oil (TPO) as an Alternative Fuel for Internal Combustion’,
International Journal of Advanced Engineering Research and Studies, 1: 61–65.
Bridgwater, A. V. 2003. ‘Renewable fuels and chemical by thermal processing of biomass’, Chemical Engineering
Journal, 91: 87–102.
Cunliffe, A. M. and Williams, P. T. 1998. ‘Composition of oils derived from the batch pyrolysis of tires’, Journal of
Analytical and Applied Pyrolysis, 44 (3): 131–152.
Department of Environmental Affairs. 2010. ‘National Waste Management Strategy’.
ETRMA. 2011. End of Life Tyres: A Valuable Resource with Growing Potential, 2011 Edition. Brussels, Belgium: European
Tyre and Rubber Manufacturers Association.
Fredonia Group. 2010. World Carbon Black Industry Study with Forecasts for 2013 and 2018, 1–8.
Gauteng Integrated Energy Strategy. 2011.
Guerrero, A., Goñi, S. and Allegro, V. R. 2008. ‘Resistance of Class C Fly Ash Belite Cement to Simulated Sodium
Sulphate Radioactive Liquid Waste Attack’. Eduardo Torroja Institute for Construction Science.
Hackett, C., Durbin, T. D., Welch, W., Pence, J., Williams, R. B., Salour, D., Jenkins, B. M. and Aldas, R. 2004. ‘Evaluation
of Conversion Technology Processes and Products for Municipal Solid Waste’. Integrated Waste Management Board
Public Affairs Office, Publications Clearing House (MS-6).
Huang, K., Gao, Q., Tang, L., Zhu, Z. and Zhang, C. 2005. ‘A Comparison of Surface Morphology and Chemistry of
Pyrolytic Carbon Blacks with Commercial Carbon Blacks’, Journal of Power Technology, 160: 190–193.
Islam, M., Parveen, H. and Haniu, H. 2010. ‘Innovation in Pyrolysis Technology for Management of Scrap Tyre: a
Solution of Energy and Environment’, International Journal of Energy Science and Development, 1: 86–96.
Islam, M. R., Joardder, M. U. H., Hasan, S. M., Takai, K. and Haniu, H. 2011. ‘Feasibility Study for Thermal Treatment of
Solid Tyres Wastes in Bangladesh by Using Pyrolysis Technology’, Waste Management, 31: 2142–2149.
Jha, V. 2008. ‘Carbon Black Filler Reinforcement of Elastomers’, Ph.D. thesis, University of London, pp. 1–229.
Juma, M., Korenova, J., Markos, J., Annus, J. and Jelemesky, L. 2006. ‘Pyrolysis and Combustion of Scrap Tyres’,
Petroleum and Coal, 48: 15–26.
Kalitko, U. 2008. ‘Waste Tyre Pyrolysis Recycling with Steaming: Heat-Mass Balances & Engineering’, 9: 213–236. Minsk:
Belarus National Academy of Science.
Khan, N., Yahaya, E. and Faizal, M. 2010. ‘Effect of Preparation Conditions of Activated Carbon Prepared from Rice
Husk by CO2 Activation for Removal of Cu (II) from Aqueous Solution’, International Journal of Engineering &
Technology IJET-IJENS, 10: 47–51.
Kiran, N., Ekinci, E. and Snape, C. E. 2000. ‘Recycling of plastic waste via pyrolysis’, Resource Conservation and
Recycling, 29: 273–283.
Lehohla, P. 2012. ‘Census in brief 2011’. Statistics South Africa, Pretoria Report Number 03-01-41.
Mahlangu, M. L. 2009. ‘Waste Tyres Management Problems in South Africa and the Opportunities that can be
created through the Recycling thereof’, MA diss. in Environmental Management. University of South Africa.
Martinez, J. D., Puy, N., Murillo, R., Gracia, T., Navarro, M. V. and Mastral A. M. 2013. ‘Waste Tyre Pyrolysis: A review’,
Renewable and Sustainable Energy Reviews, 23: 179–213.
Moghaddam, M. S., Moghaddam A. Z., Zanjani N. G. and Salimipour, E. 2011. ‘Improvement fuel properties and
emission reduction by use of Diglyme-Diesel fuel blend on a heavy-duty diesel engine’, Second International
Conference on Environmental Engineering and Applications IPCBEE, Vol. 17.
Molewa, B. E. E. 2012. ‘National Environmental Management: Waste Act (59/2008): National Waste Management
Strategy’, South African National Department of Environmental Affairs 563, 35306.
Molewa, B. E. E. 2013. ‘National Environmental Management: Waste Act (59/2008): Approval of an Integrated
EARTH, WIND AND FIRE
Industry Waste Tyre Management Plan of the Recycling and Economic Development Initiative of South Africa’, South
African National Department of Environmental Affairs 569, 35927.
Morris, M. and Waldheim, L. 1998. ‘Energy recovery from solid waste using advanced gasification technology’, Waste
Management, 18: 557–564.
Murugan, S., Ramaswamy, M. C. and Nagarajan, G. 2008. ‘The use of Tyre Pyrolysis Oil in Diesel Engines’, Waste
Management, 28: 2743–2749.
Navarrete-guijosa, A. and Mostafa, S. T. 2007. ‘A Comparative Study of the Adsorption Equilibrium of Progesterone
by a Carbon Black and a Commercial Activated Carbon’, Journal of Applied Surface Science, 253: 5274–5280.
Norman, D. T. 2008. ‘Rubber grades of carbon black’. Product Development Witco Corporation, Concarb Division,
Houston, Texas, pp. 1–19.
Nurulhuda, B. A. 2008. ‘Preparation of Activated Carbons from Waste Tyres Char Impregnated with Potassium
Hydroxide and Carbon Dioxide Gasification’, MSc thesis, pp. 1–24.
Pilusa, J. and Muzenda, E. 2013. ‘Qualitative Analysis of Waste Rubber-Derived Oil as an Alternative Diesel Additive’,
International Conference on Chemical and Environmental Engineering (ICCEE).
Pilusa, J., Muzenda, E. and Shukla, M. 2013. ‘Molecular Filtration of Rubber Derived Fuel’, International Association of
Engineers.
Qu, W., Zhou, Q., Wang, Y., Zhang, J., Lan, W., Wu,Y., Yang, J. and Wang, D. 2006. ‘Pyrolysis of Waste Tyre on ZSM-5
Zeolite with Enhanced Catalytic Activities’, Polymer Degradation and Stability 91: 2389–2395.
Quek, A. and Balasubramanian, R. 2013. ‘Liquefaction of Waste Tyres by Pyrolysis for Oil and Chemicals – A Review’,
Journal of Analytical and Applied Pyrolysis, 101: 1–16.
REDISA, 2012. ‘Recycling and Economic Development Initiative of South Africa. Waste Tyre Volumes per Province’.
REDISA, 2013. ‘Recycling and Economic Development Initiative of South Africa. Waste Tyre Volumes per Province’.
Schrenk, H. H. and Berger, L. B. 1941. ‘Composition of Diesel Engine Exhaust Gas’, American Journal of Public Health
and the Nations Health, Vol. 31 No. 7: 31, 669–681.
Shah, J., Rasul, J.M., Mabood, F. and Shahid, M. 2006. ‘Conversion of Waste Tyres into Carbon Black and their
Utilization as Adsorbent’, Journal of the Chinese Chemical Society, 53: 1085–1089.
Sienkiewicz, M., Kucinska-Lipka, J., Janik, H. and Balas, A. 2012. ‘Progress in used tyres management in the European
Union: a review’, Waste Management 32: 1742–1751.
Steffens, D. 2003. ‘The Diesel Engine and the Environment’. Dynamic Positioning Committee, Marine Technology
Society Environment. Wartsila North America, Inc.
Sundarandian, S. and Devaradjane, G. 2007. ‘Performance and Emission Analysis of Biodiesel Operated CI Engine’,
Journal of Engineering, Computing and Architecture, 1(2): 1–22.
Suresh, B., and Kazuteru Y. 2006. CEH Marketing Research Report Zurich: Chemical Economic Handbook SRI
Consulting, pp. 771.1000A–771.1002.
Tawil E. 2008. ‘Boiler Fuels, Emissions and Efficiency – Course No: M02-028’. Continuing Education and Development,
Inc.
Tscharnuter, W. W., Zu, L. and Weiner, L. 2011. ‘ASTM Carbon Black Reference Materials: Particle Sizing Using a
Brookhaven Instruments BI-DCP, Disc Centrifuge Photosedimentometer Theory’. Brookhaven Instruments
Corporation, 1: 1–10.
Weil, E. D. and Sandler, R. 1999. Kirk-Othmer Concise Encyclopaedia of Chemical Technology, 4th edition, p. 1937.
New York: John Wiley & Sons, Inc.
Williams, P. T. 2013. ‘Pyrolysis of waste tyres: A review’. Waste Management. In press.
EARTH, WIND AND FIRE
Chapter 9
Energy-efficient Low-income Housing Development in South
Africa: The Next Build Programme
Lyndall (Lynda) Mujakachi
ABSTRACT
South Africa’s pathway to a low-carbon Green Economy is established in various frameworks and policies. These various
policies promote the following, inter alia: 1) Identifying opportunities for new areas of growth and economic participation;
2) Setting the country on a new growth and development path; and 3) Job creation and poverty reduction.
Since 1994, South Africa has been building houses for the low-income wage group, that is, those earning R3,500 per month
or less. A very small number of these houses have incorporated green energy measures, in spite of the fact that there are
policies that have been developed since 1994 that promote sustainable development and the need to move to a low-
carbon economy. The low-income housing development is a sector for which government has a captive market and
there is opportunity for government to push for the deployment of proven green energy technologies on a large scale
and hence create new industries.
However, the move from policy to implementation seems to present a challenge: the measures that need to be taken
have been articulated in various policies and the technology is available. The mechanisms to bridge policy to action are
not well coordinated. Implementing the green energy strategies will require strong political commitments, administrative
actions and financial investments to effect the bold decisions.
INTRODUCTION
Electricity and housing (or human settlements) development have been identified by the ANC government as sectors
that can contribute to the socio-economic transformation of South Africa (RDP61 1994: 31, 22). These sectors were
identified as contributing to the improvement of livelihoods and advancing the marginalised Black population into
mainstream economic activities, as well as galvanising new manufacturing activities in the economy.
The South African Constitution stipulates that its citizens have the right to access adequate housing. The Reconstruction
and Development Programme framework endorsed the right to housing. Since 1994, the government has embarked on
a national programme to provide housing for the low-income wage earners (people earning R3,500 per month or less)
and the indigent62 in urban and rural63 areas. Furthermore, the RDP framework pronounced the provision of electricity to
61 Other sectors identified in the RDP 1994 are: water and sanitation; telecommunications; transport. 62 In identifying indigent people, indicators such as type of housing are used, e.g. informal settlements, public housing/hostels, backyard shacks, RDP housing;
and/or social groups, e.g. disabled people dependent on the state, children, the unemployed, and the elderly who depend on a pension or state grant (van Reyneveld, et al. 2003). 63 According to the White Paper on Local Government 1998, the definition of ‘urban’ and ‘rural’ areas is based on a loose categorisation of settlement types.
Under ‘urban’, there are three sub-categories: (i) urban core, characterised by high population density with over 10 dwelling units per hectare, high levels of economic activities and high land values; (ii) urban fringe: these are settlements on the boundaries of municipalities, but outside the urban core, and include low-
EARTH, WIND AND FIRE
include the Black majority – 'electricity for all.’ The government has made great strides in the provision of electricity for
Blacks in urban and rural areas. In 1994, 36 per cent (comprising mostly the white population) had access to the ‘cheap
and abundant’ electricity (RDP 1994). It is estimated that over 80 per cent of the Black population in urban and rural areas
now have access to electricity.
In terms of meeting basic needs of the South African population, the RDP (1994) framework announced the following
housing standards: provide protection from weather; a durable structure; reasonable living space and privacy; sanitary
facilities; storm water drainage; a household energy supply (linked to grid electricity supply or other sources such as solar
energy); access to clean water (RDP 1994: 23). With reference to energy development, the RDP emphasised energy
efficiency and conservation. The following were pronounced: improvement of dwelling thermal performance; promotion
of energy-efficient appliances; use of solar water heaters; implementation of time of use electricity tariffs; utilising
sustainable energy sources such as solar power (RDP 1994: 31–32). The provision of renewable energy technologies and
energy-efficient housing has been promulgated in various policies and legislation; for example, the White Paper on Energy
Policy in South Africa (1998); White Paper on Renewable Energy (2003); Energy Efficiency Strategy (2005); South African
National Standards (SANS 204); New Growth Path (2011); Integrated Resource Plan (2010); White Paper on a Climate
Change Response Strategy (2012); Infrastructure Development Act (2014).
Since 1994, the government has built some 3 million64 low-income houses (or RDP houses in the local parlance). It is further
estimated that some 2.3 million65 people do not have housing, meaning they do not have their own house and/or are
living in an informal settlement (Presence, 2014). The figure is rising owing to the rapid rate of urbanisation and, according
to the Minister of Human Settlements, Lindiwe Sisulu, the housing delivery programme has fallen by an average of 25 per
cent over the past five years due to ‘blockages in the pipeline’ (Presence, 2014).
A small number of the newly built houses have incorporated green energy technologies and these have been mainly
pilot retrofitted housing units. The provision of housing is more than just brick and mortar. Low-income housing
development should be targeted with a developmental and sustainability motive, as pronounced in the various
frameworks and legislation, and it is about empowerment of individuals and communities. More often than not, the
ownership of a house is the single biggest investment that a low-income earner will make in his or her lifetime, and this has
the potential to improve the welfare of the low-income and indigent groups. The low-income housing development is a
sector in which government has a captive market and there is opportunity for government to push for the deployment of
proven green energy technologies on a large scale and hence create new markets and industries.
The aim of this chapter is to review the development and implementation of programmes to provide energy-efficient
housing to low-income and indigent households. These programmes are being implemented by municipalities and Eskom
(in areas that a municipality does not distribute electricity) and facilitated by the Department of Energy (DoE). The
Department of Human Settlements’ (DHS) mandate is to provide sustainable housing and, hence, it has to collaborate
with these and other agencies. As stipulated in the various policies and legislation, energy-efficient low-income housing
development can contribute to setting the country on a new growth trajectory through the emergence of new industries
from the development of new technologies; job creation and poverty reduction; and achieve social equity. This chapter
contributes to the ongoing debate on implementing energy-efficient low-income housing and proposes some
recommendations on the way forward.
income settlements and high-income low-density settlements; and (iii) small towns: these vary greatly, but most are economically and socially linked to surrounding rural hinterlands. ‘Rural’ areas are also listed according to sub-categories and have populations of around 5,000 or less inhabitants. 64 These are estimates. Lack of monitoring makes it difficult to establish accurate figures. 65 The figure ranges from 2–3 million. There has been no proper monitoring of low-income houses built since 1994.
EARTH, WIND AND FIRE
The chapter starts with a conceptual framework; the next section reviews various programmes that are being
implemented with regard to availing electricity to low-income and indigent households and the role that renewable
electricity is playing; followed by a section that presents a case study of a greenfield development comprising energy-
efficient low-income housing; and the last two sections deal with the way forward and the conclusion.
CONCEPTUAL ISSUES
South Africa has adopted the principle of sustainable development to guide socio-economic development. Sustainable
development is set to place the country on a developmental trajectory towards greater efficiency and innovation in
resource use and the integration of social, economic, ecological and governance systems (NFSD, 2008). Green economic
development is part of the continuum to achieve sustainable development. Green economic development is defined
as:
a system of economic activities related to the production, distribution and consumption of goods and services that result
in improved human well-being over the long term, while not exposing future generations to significant environmental risks
or ecological scarcities. It implies the decoupling of resource use and environmental impacts from economic growth
(Green Economy Summit Report 2011: 4).
Energy efficiency, in the context of sustainable development, refers to using energy whilst ensuring that the environmental
impacts of energy conversion and use are minimised (DoE, 2005: 1). South Africa’s economy is largely based on minerals
extraction and processing, which is energy intensive. In the past, South Africa has taken for granted its ‘cheap and
abundant’ electricity, but this changed as, in the 2000s, demand began to outstrip supply. Energy-efficient low-income
housing development, as articulated in the previous section, includes: improvement of dwelling thermal performance;
promotion of energy-efficient appliances; a household energy supply from the grid and other sources such as solar
energy; and a durable structure (RDP, 1994).
Energy-efficient low-income housing development presents an interesting case study in terms of transitioning to
renewable electricity. The building of low-income houses does not encompass the larger vision of ‘development’ and
‘sustainability’, even though these terms are invoked to justify that low-income housing provision contributes to social and
human development, and ultimately economic development. The low-income housing programme is characterised by
piecemeal measures: achieving target numbers of housing units built; implementing energy efficiency features such as
pre-paid meters; and providing solar technology for houses that are not connected to the grid. The goal of transitioning
to clean and renewable energy sources, as pronounced in various policies, seems to be lost in energy-efficient low-
income housing development, and yet, this is an area where government has a captive market.
As part of South Africa’s international commitments to reduce carbon emissions,66 its national objectives to achieve
sustainability,67 and as part of the programme to provide electricity to marginalised South Africans, there have been
programmes implemented by government to provide renewable energy technologies for electricity generation to
66 South Africa ratified the UNFCCC in August 1997 and acceded to the Kyoto Protocol in July 2002. About 95 per cent of electricity generation is from coal-fired
power stations. 67 In addition to the various frameworks and legislation, also refer to the Long- term mitigation strategy (LTMS) for South Africa (DEA 2011).
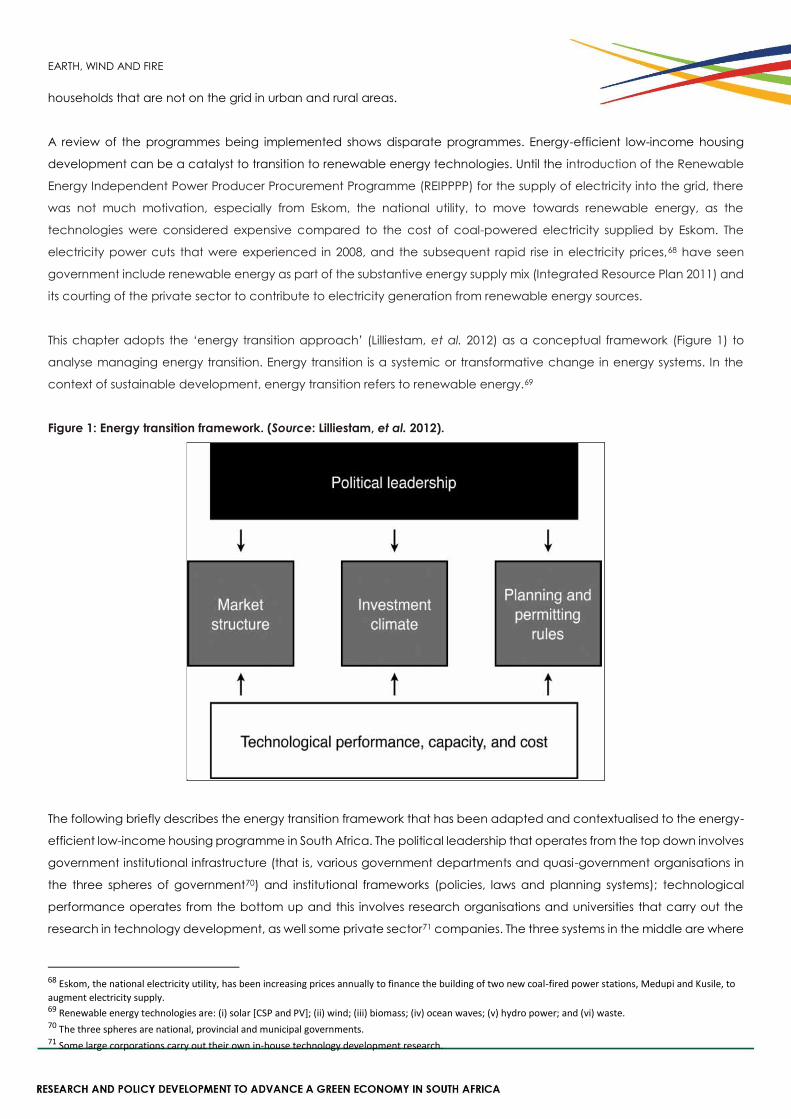
EARTH, WIND AND FIRE
households that are not on the grid in urban and rural areas.
A review of the programmes being implemented shows disparate programmes. Energy-efficient low-income housing
development can be a catalyst to transition to renewable energy technologies. Until the introduction of the Renewable
Energy Independent Power Producer Procurement Programme (REIPPPP) for the supply of electricity into the grid, there
was not much motivation, especially from Eskom, the national utility, to move towards renewable energy, as the
technologies were considered expensive compared to the cost of coal-powered electricity supplied by Eskom. The
electricity power cuts that were experienced in 2008, and the subsequent rapid rise in electricity prices,68 have seen
government include renewable energy as part of the substantive energy supply mix (Integrated Resource Plan 2011) and
its courting of the private sector to contribute to electricity generation from renewable energy sources.
This chapter adopts the ‘energy transition approach’ (Lilliestam, et al. 2012) as a conceptual framework (Figure 1) to
analyse managing energy transition. Energy transition is a systemic or transformative change in energy systems. In the
context of sustainable development, energy transition refers to renewable energy.69
Figure 1: Energy transition framework. (Source: Lilliestam, et al. 2012).
The following briefly describes the energy transition framework that has been adapted and contextualised to the energy-
efficient low-income housing programme in South Africa. The political leadership that operates from the top down involves
government institutional infrastructure (that is, various government departments and quasi-government organisations in
the three spheres of government70) and institutional frameworks (policies, laws and planning systems); technological
performance operates from the bottom up and this involves research organisations and universities that carry out the
research in technology development, as well some private sector71 companies. The three systems in the middle are where
68 Eskom, the national electricity utility, has been increasing prices annually to finance the building of two new coal-fired power stations, Medupi and Kusile, to
augment electricity supply. 69 Renewable energy technologies are: (i) solar [CSP and PV]; (ii) wind; (iii) biomass; (iv) ocean waves; (v) hydro power; and (vi) waste. 70 The three spheres are national, provincial and municipal governments. 71 Some large corporations carry out their own in-house technology development research.
EARTH, WIND AND FIRE
changes need to occur. These three are: the markets, that is, the low-income housing sector where power is bought and
consumed; new investment in renewables and infrastructure, mostly by the private sector and government; and the
planning and permitting rules that dictate the pace and placement of local economic development which should take
place at municipal level (Lilliestam, et al. (2012: 2). It should be noted that this framework is a representation of the real
world and will go through iterative changes during implementation. Transitioning to renewable energy for electricity
generation requires groundwork, not only in experimenting with new technologies to bring their costs down, but in
experimenting at sufficient scale so as to force the institutional development issues that come with them (Lilliestam, et al.
2012: 1).
POLICY IMPLEMENTATION IN ENERGY-EFFICIENT LOW-INCOME HOUSING
The government has enacted various policies and legislation that guide electricity development in post-1994 South Africa
so as to bring access and equity of electricity provision for all citizens, particularly the marginalised Black (African,
Coloured and Indian) people. The key policies are briefly described. The White Paper on Energy (1998) announced the
post-1994 government policy on transforming the energy sector and emphasises, inter alia, facilitating electricity access
to Black people. The White Paper on Renewable Energy (2003) pronounced the promotion and implementation of
renewable energy as part of the energy supply mix that includes coal. The government set a target of 10,000GWh
renewable energy contribution to final energy consumption by 2013 (this is yet to be achieved). The Energy Efficiency
Strategy (2005) presents guidelines for the implementation of energy efficiency practices as mandated in the White Paper
on Energy (1998), and links energy sector development with socio-economic development plans.
Reuters (2009) noted that the bulk of the electricity generated in South Africa is consumed by industry and commerce. It
is estimated that the residential sector consumes less than 20 per cent of electricity generated and the low-income
households consume much less. Households pay more on electricity tariffs compared to industry and commerce, that is,
R0.29 per kWh and R0.16 per kWh respectively. The affordability factor is important to secure energy in households,
especially in low-income households (2009: 249).
What are some of the programmes that have been developed and are being implemented in terms of ensuring access,
affordability and security of electricity for low-income and indigent households? In answering this question, an attempt is
made to investigate the impetus to the implementation of renewable electricity. The section will look at the National
Electrification Programme, free basic electricity (FBE), the pre-paid electricity meter system, free basic alternative energy
(FBAE), the solar water heating (SWH) subsidy programme, Solar Home System (SHS), and the Renewable Energy
Independent Power Producer Procurement Programme (REIPPPP).
National Electrification Programme
The National Electrification Programme was the post-1994 government’s response to electrify urban low-income and rural
households – announced as ‘electricity for all’ in the RDP (1994) framework. The programme was implemented by Eskom
and municipalities, and funded by government. The justification for this national programme was to improve the welfare
of low-income and indigent households and stimulate some income-generating activities. The programme stipulated that
both grid and non-grid power sources such as solar energy would be deployed.
In the mid-1990s (pre- and post-apartheid era), significant levels of electrification in urban areas were achieved. In the
post-2000 period, the government and Eskom focused on availing electricity to rural areas. It has been noted that the
South African electrification programme is considered an outstanding achievement (in terms of infrastructure
development) by a government of a developing country, producing results that have not been duplicated by other
developing countries (Mohlakoana, 2014). A notable development was how Eskom, an apartheid-era organisation, was
EARTH, WIND AND FIRE
able to rapidly transform itself and fit into the new political dispensation. Eskom became proactive in considering political
concerns during and after the political transition period by aggressively supplying electricity to Black households in urban
and rural areas (Mohlakoana, 2014; Marquard, 2006).
According to Mohlakoana 2014:
The implementation of this electrification policy was also made possible by the availability of generating
capacity and the “creative (low-cost) ways” (that is, using single-phase instead of a three-phase connection
for low-income areas households as they often use less electricity due to lack of and insufficient incomes)
that were used by Eskom to electrify low-income rural areas where most of the households had no electricity
... [and quoting Matinga 2010] … the South African electrification program has differed from electrification
programs in other Sub-Saharan African countries, because the country has largely financed its own program
(2014: 33).
Subsequent programmes (see below) implemented in urban and rural areas under the auspices of the National
Electrification Programme have resulted in over 80 per cent of the population having access to energy. The low-income
households in urban areas were supplied with electricity through connection to the grid (hence, it was mainly electricity
from Eskom’s coal powered stations). Many Black urban residential areas and some rural areas (that were close to the
grid) benefited from the programme. This programme set the foundation for embarking on the national electrification
agenda.
Free Basic Electricity
The publication of the White Paper on Energy Policy in 1998 emphasised that low-income households were to have access
to adequate basic energy services for cooking, heating, lighting and radio and television, regardless of capacity to pay.
The ANC government announced the provision of free basic electricity supply for low-income households in 2000 in its
election manifesto (Ruiters, 2009; Mapako and Prasad, 2005). Implementation began in 2003 and is being facilitated by
municipalities that distribute electricity and Eskom. Funds for this programme are allocated to municipalities through the
Equitable Share grant disbursed by the Department of Cooperative Governance and Traditional Affairs (DoE, 2007). No
funding is provided to Eskom from national government but Eskom claims for FBE from municipalities in terms of a service
level agreement between Eskom and each municipality.
Free basic electricity amounts to 50kWh72 per month. This provides basic lighting, basic media access, basic water heating
using a kettle, basic ironing to a low-income household that is connected to grid electricity (Ruiters, 2009: 251) The DoE
stipulates that it is not the intention of government to provide ‘free electricity’, but ‘free basic electricity’ and government
has deemed 50kWh per month as sufficient electricity to meet the needs of a low-income household as these households
generally have a low demand for electricity (DoE). The amount of electricity that is supplied as free basic electricity was
based on the recommendations of research conducted for Eskom and the DoE by the Energy Research Centre (ERC) at
the University of Cape Town between 2001 and 2002 (Dugard, 2009: 273).
Additional electricity requirements for indoor heating, hot water geysers and cooling systems are charged at the
approved tariff rate and this expenditure has to come out of the low-income household budget. The reality is that a low-
income house (for example, comprising a three-person family using refrigerator, heater, stove, television, and hot water
geyser) consumes on average 498kWh and can be expected to pay between R200 and R300 per month (Ruiters, 2009:
250) and the price of electricity has been rising since 2009. The free basic electricity allocation of 50kWh per month is
72 Municipalities that can afford to subsidise more than 50 kWh per month are encouraged to do so.
EARTH, WIND AND FIRE
definitely an inadequate electricity supply. Some low-income households supplement their FBE allocation by using
firewood (which is mostly collected for free) and paraffin for cooking, and candles for lighting.
According to Ruiters (2009):
A developmental approach to the level of supply might take a different view of the minimalist understanding
of needs. It is self-evident that low consumption is a reflection of the apartheid legacy, unemployment and
a produced inability to consume. To change this pattern of unhealthy under-consumption, more than 50 kWh
would have to be offered. In fact, municipalities often use 150 kWh as their cut-off for deciding whether or
not households should be seen as poor (2009: 251).
While South Africa prided itself on supplying cheap and abundant electricity prior to 1994, which was accessed mostly
by the white population, the provision of electricity to the larger population post-1994 also necessitated the increase in
generating capacity to meet rising demand. This, as well as the growth of the economy, has seen electricity tariffs
escalating rapidly, especially since 2008, as Eskom embarked on a programme to build new power stations (Medupi
and Kusile). Most low-income households cannot afford the increasing electricity tariffs and electricity supply is
frequently being cut off due to non-payment.
Pre-Paid Meter System
In an effort to address affordability of electricity by low-income households, a system of pre-paid meters was introduced.
South Africa is a recognised leader in the manufacture and installation of pre-paid meter equipment and this has
developed into a lucrative industry. Black Economic Empowerment (BEE) deals from this new industry benefited those
who were politically connected (Ruiters 2009: 257). The justification for introducing pre-paid meters were, inter alia, each
household would be able to manage its electricity consumption; less administration in terms of recovery of debts, less
disconnections and reconnections; and upfront payment improves municipal cash flow (Ruiters 2009: 257). With the
introduction of pre-paid meters, some jobs were lost, notably those of meter readers. It should be noted that, while pre-
paid meters were initially introduced as a measure to control unaffordable electricity consumption in the low-income
residential areas, pre-paid meters have found their way into middle- and high-income73 households. In middle- and high-
income residential areas, the voluntary adoption of pre-paid meters in households is to manage and control electricity
expenditure. In the low-income residential areas, pre-paid meters were a tool to control access to electricity to households
that are not able to pay, thus effectively limiting adequate access to electricity and thus being unable to realise the
‘electricity for all’ mantra.
The demand for electricity in low-income residential areas has resulted in most of the households not being able to afford
adequate electricity, resulting in their electricity supply being cut off for non-payment. The latter has given rise to illegal
connections – ‘Izinyoka’ – (and electrocution accidents are on the increase leading to injuries and fatalities) (Annegarn,
et al. 2010); and public protests demanding ‘affordable electricity’ are becoming commonplace. In 2012 Eskom was
owed R2 billion in electricity arrears by some residents in Soweto.
Free Basic Alternative Energy (FBAE)
The government provides free basic alternative energy (FBAE) in recognition of indigent households in urban and rural
73 A salary of above R15,001 per month is considered middle- to high-income. This figure is based on figures used to allocate low-income housing by
government. Hence, a low-income household earns R3,500 or less per month. A ‘gap market’ is where a household earns R3,501 to R15,000 but does not qualify for a bank loan to buy or build a house, hence the government steps in to assist.
EARTH, WIND AND FIRE
areas that are not connected to the electricity grid (DoE, 2007). The programme is administered by municipalities and
funded through the Equitable Share Grant, which is disbursed to municipalities by the Department of Cooperative
Governance and Traditional Affairs. The FBAE policy stipulates that, where no electricity infrastructure exists, the funding
for FBE (see above section) ‘must be channelled to fund FBAE and municipalities are encouraged to supplement the FBE
grant from their own income [thus] ensuring that indigent households receive FBAE’ (DoE, 2007, Chapter 2: 2.1).
The criteria for identifying areas that are to be provided with FBAE to indigent households are: most distant from the
electricity grid; where no Solar Home System74 (SHS) Programme is planned; where there are no immediate plans to
electrify the area; and/or where energy poverty is prevalent (DoE 2007). The energy carriers that are being funded under
the programme are paraffin, liquefied petroleum gas (LPG), coal, bio-ethanol gel, candles, firewood and biogas. FBAE is
allocated to the value of R55 per month and the policy stipulates that the figure should increase by the inflation rate plus
1.5 per cent (DoE, 2007). In implementing the FBAE programme, a municipality may use its own personnel or external
service providers (DoE, 2007).
The implementation of FBAE has not been without challenges. Firstly, in many municipalities there is a lack of indigent
policy75 and no registration of indigents. Secondly, the FBAE policy stipulates that municipalities are required to
supplement the FBAE allocation from their own budgets (DoE, 2007). Municipalities have continuously indicated that they
are not allocated the annual budgets they request and hence are operating with tight budgets. Thirdly, most communities
are not aware that there is provision to access FBAE. Fourthly, the provision of FBAE is more expensive than FBE since most
of the alternative energies are not regulated.
Lastly, lack of affordable and safe alternative energy is an aggravating factor in a low-income household. In a study
conducted by the Paraffin Safety Association Southern Africa (PASASA) in informal settlements, there was evidence that
the majority of households used paraffin for cooking, heating and lighting (PASASA, 2012: 8) as this was the energy carrier
the said households could afford. The study noted:
Currently, only one locally manufactured, non-pressurized, licensed, legal stove exists which is sold under the
brand name Panda. Although this product is reported to be used by 80% of households in South Africa, most
often, households are in possession of an unlicensed, unsafe version of the Panda which is being
manufactured by an unknown source and dominating the market due to its low-cost, wide distribution
network and ease of use. This unlicensed “old” Panda does not comply with South African standards and
regulations as outlined by the South African Bureau of Standards (SABS) and the National Regulator for
Compulsory Specifications (NRCS) however efforts to trace and prosecute these manufacturers have, as yet,
been unsuccessful. The structure of these micro-enterprises and the distribution of fuel and appliances more
widely have created a situation in which compliance with national standards and regulations is difficult to
assess and enforce (Pasasa, 2012: 8).
‘Shack’ fires caused by faulty appliances are commonplace in informal settlements. These fires do not affect one
household only but spread to several shacks in the informal settlement as there are no fireguards between the shacks.
The main victims of shack fires are children due to lack of adequate care and supervision (PASASA, 2012: 9). Furthermore,
some low-income households and informal settlements that do not have electricity connections are resorting to illegal
74 See below for an analysis on Solar Home System (SHS). 75 Refer to footnote [3] above.
EARTH, WIND AND FIRE
connections. This results in injuries and fatalities from electrocution (Annegarn, et al. 2010).
In all, energy carriers such as paraffin, coal and firewood, which are used by most low-income households, have health,
safety and environmental concerns. Coal and firewood contribute to poor indoor and outdoor air quality and this can
lead to respiratory problems (Annegarn, et al. 2011). Low-income households have aspirations to access modern sources
of energy such as grid electricity (preferred) and/or solar power systems. The rapid increases in price of electricity are
further delaying the replacement of combustion sources as a key source of energy in low-income households.
Solar Water Heating (SWH) Programme
The solar water heating (SWH) subsidy programme was introduced by Eskom in 2008. The SWH programme was one of
Eskom’s demand-side management strategies in response to the electricity load shedding that took place in 2008. Solar
water heaters have two designs: high-pressure systems and low-pressure systems. High-pressure systems are being installed
in medium- and high-income households and the low-pressure systems are being installed in low-income households as
part of the government’s retrofit programme. Eskom affords a partial subsidy for the installation of high-pressure systems,
which are mostly fitted in medium- to high-income households and there is a full subsidy for low-income households where
low-pressure systems are mostly installed. The SWH programme has witnessed the nascent emergence of small and
medium enterprises (SMEs) involved mainly in importing and selling equipment. Much of the SWH equipment for the low-
income household retrofit programme was imported from China, as it was less costly (Ledger, 2011).
In 2012, Eskom and the Department of Trade and Industry (dti) issued a government directive that low-pressure SWH
equipment, which was being installed as part of government’s retrofit programme, was to have 70 per cent local content
of components manufactured. Many businesses that had won tenders to install solar water heaters thrived from importing
the equipment, mostly from China. When Eskom invited new tenders for the low-cost systems in 2012, none of the
companies complied with the local content rules (Bega, 2015).
This may seem like a knee-jerk decision on the part of Eskom. However, as a state-owned enterprise (SOE), Eskom has a
responsibility to ensure that local manufacturing capacity is developed. This necessitates the restructuring of procurement
regulations. For example, the government has a goal to install 4 million solar water heaters in homes by 2030. There should
be a phased process of procurement: in the short-term, some equipment may need to be imported while local
manufacturing capacity is being developed (this requires industry to work in tandem with research organisations, that is,
universities and the Council for Scientific and Industrial Research (CSIR); based on monitoring and evaluation information,
decisions can be made on phased gradation thresholds that should be achieved in local content manufacturing by 2030.
So, let us say that a company responds to a request for a tender in supplying solar water heaters in year 10 of the
programme (assuming 2015 is the base year), and the threshold for local content is then pegged at 70 percent; the
company cannot claim ‘previous disadvantage’ or any other limitation because the regulatory instrument (assuming it
was promulgated in year 2015) would have stipulated the trajectory of local content requirements. The onus is on
prospective companies to embark on a pathway to develop the requisite capacity. This entails that government should
have a programme that assists companies, especially SMEs, in innovation and technology development and deployment.
The Innovation Hubs that are being established are designed to offer such assistance. Furthermore, this entails that
government may need to develop a computer register of low-income housing development targets as public information
over a three- to five-year rolling cycle and such information should be updated on a regular basis.
Eskom discontinued the SWH subsidy programme in December 2012. The SWH programme was transferred to, and will be
administered by, the Department of Energy. In February 2015, the Department of Energy issued a media release on the
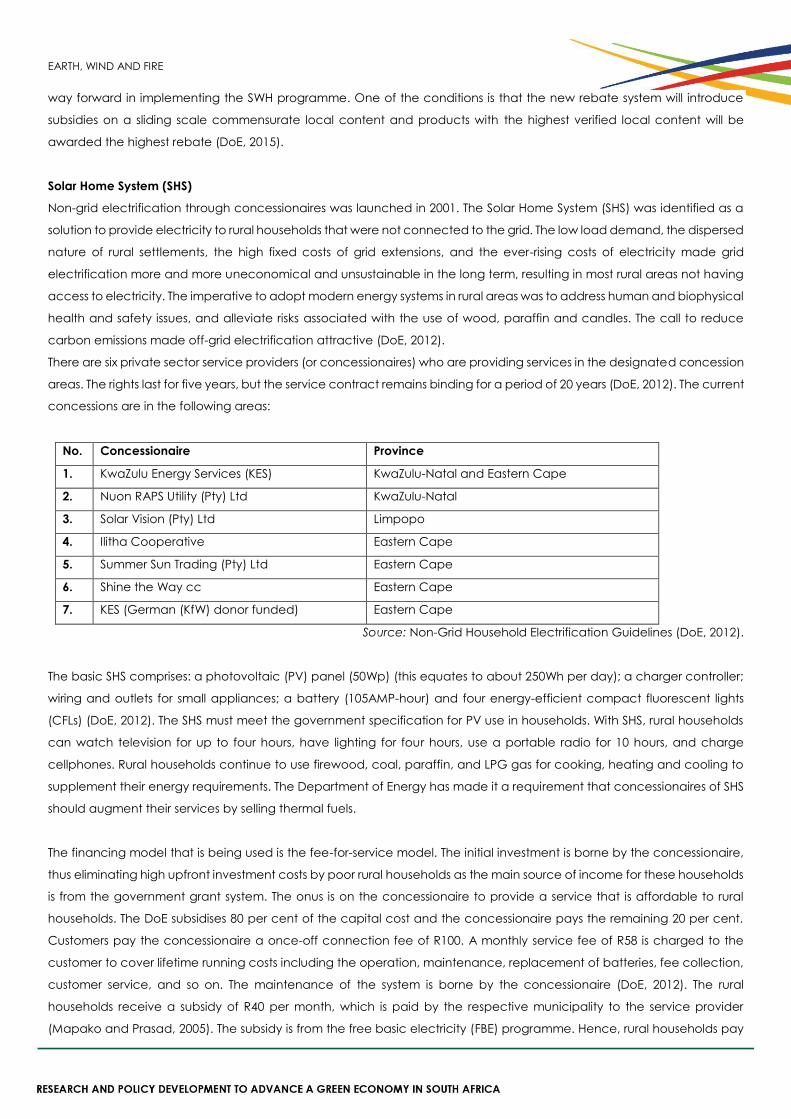
EARTH, WIND AND FIRE
way forward in implementing the SWH programme. One of the conditions is that the new rebate system will introduce
subsidies on a sliding scale commensurate local content and products with the highest verified local content will be
awarded the highest rebate (DoE, 2015).
Solar Home System (SHS)
Non-grid electrification through concessionaires was launched in 2001. The Solar Home System (SHS) was identified as a
solution to provide electricity to rural households that were not connected to the grid. The low load demand, the dispersed
nature of rural settlements, the high fixed costs of grid extensions, and the ever-rising costs of electricity made grid
electrification more and more uneconomical and unsustainable in the long term, resulting in most rural areas not having
access to electricity. The imperative to adopt modern energy systems in rural areas was to address human and biophysical
health and safety issues, and alleviate risks associated with the use of wood, paraffin and candles. The call to reduce
carbon emissions made off-grid electrification attractive (DoE, 2012).
There are six private sector service providers (or concessionaires) who are providing services in the designated concession
areas. The rights last for five years, but the service contract remains binding for a period of 20 years (DoE, 2012). The current
concessions are in the following areas:
No. Concessionaire Province
1. KwaZulu Energy Services (KES) KwaZulu-Natal and Eastern Cape
2. Nuon RAPS Utility (Pty) Ltd KwaZulu-Natal
3. Solar Vision (Pty) Ltd Limpopo
4. Ilitha Cooperative Eastern Cape
5. Summer Sun Trading (Pty) Ltd Eastern Cape
6. Shine the Way cc Eastern Cape
7. KES (German (KfW) donor funded) Eastern Cape
Source: Non-Grid Household Electrification Guidelines (DoE, 2012).
The basic SHS comprises: a photovoltaic (PV) panel (50Wp) (this equates to about 250Wh per day); a charger controller;
wiring and outlets for small appliances; a battery (105AMP-hour) and four energy-efficient compact fluorescent lights
(CFLs) (DoE, 2012). The SHS must meet the government specification for PV use in households. With SHS, rural households
can watch television for up to four hours, have lighting for four hours, use a portable radio for 10 hours, and charge
cellphones. Rural households continue to use firewood, coal, paraffin, and LPG gas for cooking, heating and cooling to
supplement their energy requirements. The Department of Energy has made it a requirement that concessionaires of SHS
should augment their services by selling thermal fuels.
The financing model that is being used is the fee-for-service model. The initial investment is borne by the concessionaire,
thus eliminating high upfront investment costs by poor rural households as the main source of income for these households
is from the government grant system. The onus is on the concessionaire to provide a service that is affordable to rural
households. The DoE subsidises 80 per cent of the capital cost and the concessionaire pays the remaining 20 per cent.
Customers pay the concessionaire a once-off connection fee of R100. A monthly service fee of R58 is charged to the
customer to cover lifetime running costs including the operation, maintenance, replacement of batteries, fee collection,
customer service, and so on. The maintenance of the system is borne by the concessionaire (DoE, 2012). The rural
households receive a subsidy of R40 per month, which is paid by the respective municipality to the service provider
(Mapako and Prasad, 2005). The subsidy is from the free basic electricity (FBE) programme. Hence, rural households pay
EARTH, WIND AND FIRE
R18 per month for SHS service.
In a study carried out in the Eastern Cape, it was observed that the poorest households were excluded from benefiting
from FBE due to the selection criteria employed to qualify for installation of an SHS. Poorer households could not afford
the initial once-off connection fee of R100 and the monthly service fee of R58 for an SHS. Further, it was noted that SHS
was not supplying the electricity needs of a household; hence, households had to supplement their energy needs with
wood and paraffin (Mapako and Prasad, 2005). Most rural households depend on the government grant as their source
of income. The said study further noted:
The absence of the subsidy at the commencement of SHS dissemination in the rural areas meant that the
solar off-grid electrified poor rural customers paid a fixed monthly fee of R58. The number of SHSs on offer was
restricted by the amount of subsidy the government could pay to the service providers/concessionaires. In
Eastern Cape Province, by the end of 2003, some two years after installation started, and some six months
after the launch of the FBE benefits, the subsidy was still not implemented, prejudicing poorer households
further. The service provider had removed systems from households unable to pay the monthly R58 regularly
(Mapako and Prasad, 2005).
Renewable Energy Independent Power Producer Procurement Programme (REIPPPP)
The Integrated Resource Plan (IRP 2010, promulgated 2011) has set out the amount of electricity that South Africa will
require by 2030 and the various technologies that will be employed to generate electricity. The IRP stipulates that the plan
will be continuously revised and updated as necessitated by changing circumstances (IRP, 2011: 7). The IRP heralds a
new age of energy generation in that renewable energy has been allocated the following amounts: solar photovoltaic
(PV) 8,400MW; concentrated solar power (CSP) 1,000MW; wind 8,400MW; and hydro76 power 2,609MW. Nuclear77 energy
was allocated 9,600MW. Gas was allocated 6,280MW.
Coal will continue to contribute substantially to the energy mix with 10,133 MW committed and new build options
amounting to 6,250MW (IRP 2010 updated 2013: 12). There is an ongoing research project on carbon capture and
storage (CCS) that is testing the feasibility of capturing carbon dioxide and storing it underground. The CCS project is
being conducted by the South African National Energy Development Institute (SANEDI) together with mining and
industrial companies (Financial Mail, 2014: 10); however, CCS is a technology that is still a long way from commercial
realisation (Eltrop, 2011).
The transition to renewable energy generation for electricity is being realised through the Renewable Energy Independent
Power Producer Procurement Programme (REIPPPP), which operates under the auspices of the IRP 2010. While the REIPPPP
may not have been specifically designed to address electricity requirements in low-income and indigent households,
some valuable lessons will cascade to the SHS and SWH programmes in terms of technology development and local
manufacturing.
The REIPPPP has opened the pathway to providing renewable electricity generation and augmenting Eskom’s electricity
generating capacity from its coal-fired power stations. The REIPPPP will, in the main, benefit industries and urban areas as
it is has been designed to feed into the grid. It should be noted that when the building of the two new power stations,
76 Hydroelectric power will be imported and there will be local small-scale generating plants. 77 Nuclear power is from the beneficiation of uranium. While nuclear power is carbon-free, it faces waste disposal problems (Foxon, 2002).
EARTH, WIND AND FIRE
Medupi and Kusile is completed, some of Eskom’s current fleet of power stations will need to be decommissioned as they
will have reached the end of their life span and new electricity generation capacity will be required. Renewable energy
generation for electricity is expected to have an increasing role.
In the bids that have taken place under the REIPPPP, private sector developers have been awarded 20-year contracts
for the development of solar, wind, mini-hydro, biomass and landfill gas projects to supply electricity to the national grid.
To date, a total of 79 projects have been commissioned under the REIPPPP since 2011, representing combined generating
capacity of 5,243MW that will be supplied into the grid. The 5,243 MW is just above the output from one of Eskom’s new
coal-fired plants, Medupi or Kusile (each will generate 4,800 megawatts). These are projects that have mobilised some
R168 billion of private sector funding (Lund, 2015). The REIPPPP is instrumental in bringing a decline in prices of renewable
energy supply to the national grid through the competitive bidding process. It remains to be seen how the falling delivery
costs of renewable energy for electricity will translate into a saving and benefit for the consumers, especially the low-
income households.
The introduction of REIPPPP for the supply of electricity into the grid has begun the process of introducing new technology
and the development of new industries. As part of the contractual obligations under the REIPPPP, developers have to
create jobs and local manufacturing and community upliftment (Financial Mail, 2014: 21). This is a welcome development
as South Africa has been progressively experiencing de-industrialisation and jobs are being lost in areas which employ
semi- and unskilled persons, that is, agriculture, mining and manufacturing. In Ekurhuleni, which is the main manufacturing
hub of South Africa, there is a lot of industrial floor space lying idle due to the decline in manufacturing. This can be used
to push-start the green economy through the manufacturing of renewable electricity components and building materials.
The metals and engineering industries, which were the cornerstone of the apartheid economy, have been stagnating
since 2000. The dti is envisaging local content in manufacturing to increase to a 45 per cent threshold by round three of
the REIPPPP bidding process and eventually reach 65 per cent.
Under the REIPPPP, a process of distributed spatial development is emerging. The various projects that are being
implemented in renewable electricity generation can be found throughout the country: solar projects can be found in
Eastern Cape, Western Cape and Northern Cape Provinces; wind is being established in North-West Province and solar
PV is being established in the Free State (Ntuli, 2014, pers. comm.).
Energy-efficient Low-income Housing
The Department of Energy (DoE) developed guidelines – Energy Efficient Strategy (2005) – for, inter alia, the construction
of thermally designed housing incorporating passive solar design. The Energy Efficient Strategy (2005) is supported by the
South African National Standards (SANS) 204 Energy Efficiency in Buildings (2011). The SANS regulation makes it compulsory
for all new buildings to be designed and built to standards that minimise the energy required to meet functional
requirements. The Energy Efficiency Strategy (2005) further announced the replacement of electric geysers with solar
water heaters (SWH).
Energy efficiency measures comprise passive features such as: north-facing orientation; insulation in ceilings; roof
overhang; window sizes that accommodate maximum lighting and ventilation; construction materials for floors and walls
that resist water absorption and provide thermal insulation (that is, warm in winter and cool in the warm to hot seasons),
as well as introducing renewable energy technologies into households. The SANS regulation provides a detailed and
comprehensive description of the building standards required, including water saving features, energy-efficient bulbs,
building requirements and standards for each climatic zone (South Africa has six climatic zones) (SANS, 2011).
EARTH, WIND AND FIRE
With an estimated 2.5 million backlog in low-income housing development, this presents a huge potential market for the
development and deployment of new technologies such as energy-efficient building materials and renewable energy
equipment. The existing low-income houses are another potential market to deploy energy-efficient technologies through
retrofitting. The DoE, in collaboration with the Department of Trade and Industry (dti), has presented a trajectory of local
manufacturing content thresholds with regard to the REIPPPP and SWH programmes (see above).
The current subsidies allocated for low-income housing construction do not incorporate renewable energy technologies.
However, passive energy efficiency features can be afforded by the current subsidy. It is incumbent upon the National
Department of Human Settlements to revise the housing subsidies in light of the national mandate to achieve energy
security and energy efficiency and to re-industrialise the economy. For example, the subsidy in the Western Cape
province has been increased from R75,000 to R110,000, which covers the construction of a 40 square meter house with
two bedrooms, a bathroom and combined living and kitchen area, and passive energy efficiency measures (Verwey,
2014) and this should be further increased to include renewable electricity technology to provide adequate supply for
lighting, cooking, refrigeration, communication (television and radio and charging cellphones) and heating. Pilot projects
that are incorporating the installation of SWH, solar panels, wind energy, and water tanks in low-income houses have
been funded from donor sources (Verwey, 2014). It is important that government explores new types of funding
instruments and the amount of funding required that include renewable energy technologies in low-income households.
With regard to retrofitting, it has been observed that many low-income houses are poorly built and are structurally unable
to accommodate installations such as rooftop solar panels and solar water heating. The media (print and electronic) has
on several occasions publicised cases of housing units in which walls are cracking before they are occupied. It is important
that building inspectors monitor and verify that contractors adhere to building standards.
The above interventions demonstrate that the South African government has been implementing programmes to
facilitate and ensure electricity provision in low-income and indigent households. Various policies have been
promulgated indicating that there is political will to introduce renewable energy generation for electricity.
The FBE programme is being impacted by the rapidly rising cost of electricity, and the 50kWh is insufficient to meet
household energy requirements for lighting, cooking and heating. Low-income households that are not connected to the
grid and/or cannot afford to pay for additional household electricity requirements have to resort to alternative energy
sources such as coal, paraffin and firewood (these are energy sources that are provided in the FBAE programme), and
these have attendant safety, health and environmental concerns. The demand for electricity has witnessed increasing
illegal activities associated with the need to access electricity, that is, illegal extensions and connections to houses that
are not connected with electricity, and illegal reconnections and tampering of meters (pre-paid meters) once the
amount of electricity units purchased has been used (Ruiters, 2009: 259).
The projects on implementing SHS and SWH indicate that renewable energy technologies are available, but they have
to be implemented at sufficient scale to create market demand. Furthermore, the prices of solar PVs have been gradually
reducing. Energy-efficient low-income housing presents an opportunity to implement renewable energy technology.
However, there is need for institutional capacity building at municipal level to facilitate the development of decentralised
renewable energy as part of local economic development. The programmes that are being implemented in various
municipalities do not seem to monitor lessons learnt from the various projects and what interventions can be scaled up to
the wider national level, like the electrification programme undertaken by Eskom and municipalities in the 1990s and
EARTH, WIND AND FIRE
2000s. These government initiatives have the potential to yield to market demand. The challenge is for the three spheres
of government to collaborate and develop capacity to coordinate the various projects, to develop a monitoring and
evaluation system, and to channel the ‘lessons learnt’ information into policy and into a national development
programme. The Department of Performance Monitoring and Evaluation in the Presidency is mandated to lead this
process.
The introduction of renewable energy technologies and the implementation of passive energy-efficient low-income
housing development herald a new developmental trajectory. South Africa’s success in achieving electrification to some
80 per cent of low-income and indigent households in urban and rural areas risks being negated by the escalating price
of electricity, and there is a push-back to the use of combustion fuels (that is, wood, coal and paraffin). In the energy
sector, government has been striving to reduce energy poverty, improve health and safety, provide affordable and
adequate electricity to low-income and indigent households, and job creation.
ENERGY-EFFICIENT LOW-INCOME HOUSING DEVELOPMENT: WITSAND IN CAPE TOWN78
The following section presents a case study on a ‘greenfield’ integrated housing development project that incorporates
energy efficiency features. While the introduction of energy efficiency and renewable technologies in low-income houses
is through subsidised retrofitting, the Witsand project demonstrates a development project that includes energy efficiency
features from the design stage. This is also a landmark project in that it incorporates and consolidates various legislations
that mandate the provision of energy-efficient low-income housing.
The Witsand project in Atlantis, Cape Town is an upgrade of a previous informal settlement. This area had no infrastructure
and was inhabited by approximately 1,000 informal dwellings. Sustainable human settlements development in the
Witsand context aimed at providing an integrated shelter with energy and water saving features, urban agriculture and
empowerment (skills transfer and job creation) to the local people (Guy, 2010).
PEER Africa, a not-for-profit organisation, has been implementing the Witsand low-income housing project in partnership
with the City of Cape Town. PEER Africa was also collaborating with the University of Johannesburg through the EnerKey
project that was conducting research on renewable energy development, as well as the University of Cape Town with
regard to monitoring and evaluation. PEER Africa has interpreted various government policies and developed an
integrated human settlement model which has been branded as iEEECO™ (integrated Energy Environment
Empowerment and Cost Optimisation) for the low-income groups.
PEER Africa began engagements with the City of Cape Town and the Witsand community in 2000. There was a delay in
project approval due to changes in housing policy. Further delays were experienced in getting approval for housing
development, land acquisition and the bureaucracy of subsidy applications, which led to the need for extensive conflict
resolution as residents grew increasingly dissatisfied with the pace of delivery.
The original site plan that had been drawn up by the City of Cape Town was redesigned in 2002 by the PEER Africa project
team assisted by town planning (MCA Town Planners) and engineering (ASCH Consulting Engineers) consulting
companies. The site plan was designed as an integrated/mixed residential development including social and economic
amenities and passive solar layout design. The site design was completed with the participation of the community housing
78 The information for this case study is based on various interactions with PEER Africa, that is, making joint presentations at various municipalities in Gauteng;
joint meetings with various Gauteng provincial government officials; presentations by PEER Africa and the University of Johannesburg at various conferences and workshops; a study tour undertaken by the author to Witsand in November 2010 and project reports from PEER Africa.
EARTH, WIND AND FIRE
committee. Workshops were held with the community in the informal settlement so that the residents could contribute to
the proposed development project.
The project was approved for the Phase 1 development (passive solar site plan, facilitation of the community housing
subsidy beneficiaries and self-help construction of 400 housing units) in June of 2004 and the flow of government funds
started in October 2004. The Phase 1 pilot was completed in 2006 and the National Energy Regulator of South Africa
(NERSA) and the University of Cape Town (UCT) certified the approach that had been adopted by PEER Africa. PEER
Africa intended to carry forward the lessons learned to Phase 2 and was targeting a scaled development of 1,000 passive
energy-efficient low-income houses and the installation of some renewable energy technologies. The City of Cape Town
issued a new request for proposal between May to June 2009 and PEER Africa submitted its proposal.
In the initial contract with the City of Cape Town, PEER Africa was contracted as a sole source service provider in terms of
the Municipal Finance Management Act (MFMA) as PEER Africa was assisting the municipality in implementing an
innovative human settlement project in which they had the expertise. According to the MFMA, a service provider can
only be contracted for three years. Since technology roll-out has to be tested over a period of time (a minimum of at least
10 years) in order to realise economic and social benefits, the three-year stipulation in the MFMA is an impediment for
public-private partnerships, especially partnerships that introduce new ideas. The Phase 2 residential construction phase
of the project was targeted to start in the last half of 2010, but the project encountered delays. In the meantime, PEER
Africa has continued to engage with the community and the City of Cape Town and carries out monitoring of the project
benefits.
The settlement layout is designed to maximise the use of free energy from the sun, that is, dwellings are north facing and
incorporate thermal-efficient building materials. It should be noted that at first the residents were apprehensive about
living in houses that did not face the street and/or were facing the back of the neighbour’s house. In low-income housing
development, the infrastructure design is done separately from the top structures and this creates a number of challenges
for architects and developers to achieve passive solar and other free basic energy benefits once the construction work
starts.
The province and the City of Cape Town approved an additional 52 units to be constructed during Phase 1 that saw the
size of the housing units increase from 36 square metres to 40 square metres. A number of additional features were
included in the new designs including: upgraded roof structures that included various types of roofs, e.g. tile roofs,
enhanced window designs and double storey units (densification). Some housing units were built according to the further
increased size of 50 square metres per unit. The project piloted the following renewable technology features: solar water
heating, solar home system (LED lighting and cell charger), water savings and rooftop storm water recovery.
The Witsand housing project developed a spiral hob that runs off-grid. This product can be used for cooking on the solar
heating system. Some private companies have developed a small solar home system that includes a cellphone charger
and lighting that can go into dwellings.
Since 2010, Peer Africa has been sourcing for international aid funding to continue the work in Witsand. The project has
received international recognition and accolades and PEER Africa staff and Witsand community members are invited to
make presentations at conferences. PEER Africa has continued to engage with the City of Cape Town and the Witsand
community.
EARTH, WIND AND FIRE
Besides energy efficiency benefits, there are health and safety benefits that go beyond the normal benefits of the low-
income housing programme, such as reduction in indoor pollution and amelioration of fires due to the elimination of open
flame for space heating (Guy, 2010). With specific reference to coastal areas, there is strict adherence to coastal area
building specifications leading to the reduction in mould formulation due to coastal condensation (Guy, 2010). The
Witsand low-income housing project provided important lessons for the municipality in drafting procurement and tender
documents in terms of how a municipality can incorporate new ideas that are required for improved service delivery.
Overall, the project has demonstrated a low-income housing development model that offers reduction in household
energy costs, water demand management, and reduction in household pollution. The next phases of the project would
have wanted to include household solid waste recycling, storm water recovery and reuse, as well as wind energy and
greening measures.
While the Witsand housing project has been recognised as a groundbreaking development, there has been no formal
adoption by the City of Cape Town. Some of the residents who have benefited from the iEEECO™ housing development
have presented at various workshops and have called for the project to be scaled up. Moreover, various provincial and
municipal government officials from Gauteng have conducted study tours to Witsand. It is, however, difficult to ascertain
how new ideas are interrogated, internalised and adopted (or thrown out) in municipal government. The imperative to
implement innovative programmes such as energy-efficient low-income houses that contribute to service delivery and
the potential to create local economic development is lost in government inertia.
WAY FORWARD
The low-income housing sector presents a ready market to introduce new renewable technologies and other innovative
features. The estimated 3 million low-income houses79 that have been built since 1994 can be retrofitted with renewable
electricity technologies and some municipalities have embarked on pilot projects. The estimated housing backlog of 2.5
million presents an opportunity for adopting integrated greenfield developments as pronounced in various legislation. The
low-income housing market is a captive market for the deployment of new sustainable housing materials and renewable
electricity technologies.
With reference to the energy transition framework, this section will reflect on the role of government and innovation and
market formation to assist in moving forward energy-efficient low-income housing development.
Roles and Responsibilities of National, Provincial and Municipal Governments
The roles of national, provincial and municipal governments are identified in the Constitution. This section will concentrate
on the evolving roles as per the National Development Plan, and focus on the municipal government as it is the sphere
of government that is at the front line of implementing development activities.
Since 1994, South Africa has implemented public sector reforms that are to ensure that the three spheres of government
operate as a seamless entity and not in silos. In a developmental state, towards which the ANC aspires, the national
government acts as the centre that sets policy frameworks. The provincial government, over and above provincial
mandates as defined in the Constitution, should define the strategies and coordinate municipal activities as per provincial
jurisdiction. The municipalities are the level of government that, together with the communities, are meant to act as
change agents in local communities. There should be a coordinated mechanism of monitoring and evaluation that has
79 The Department of Human Settlement has to ensure monitoring of the housing delivery programme.
EARTH, WIND AND FIRE
a bottom-up approach and feeds into the policy process. Furthermore, innovation hubs are being established that can
play an important role in facilitating linkages between municipalities and with R&D organisations.
The government published the National Development Plan (NDP, 2011) that sets out a developmental vision until 2030
and identifies target areas, for example: development of a low-carbon economy (renewable electricity falls under this
target area), sustainable human settlements and other economic infrastructure. It is incumbent upon national
government to provide the oversight and coordination in terms of policy. The provincial and municipal governments
should concentrate on implementation, monitoring and evaluation. For example, South Africa is a signatory to the United
Nations Framework Convention on Climate Change (UNFCCC). Before the national government had developed a
national climate change policy, Western Cape and Gauteng Provinces developed respective provincial strategies. The
City of Johannesburg developed its climate change policy before Gauteng Province. It should be recognised that
provinces and municipalities have plenty to do without being caught in a perennial cycle of policymaking. If one
examines the actions that need to be implemented to address climate change, they are already existing policies: e.g.
energy efficiency, renewable energy development and sustainable housing policies.
The term ‘developmental local government’ was coined in the Local Government White Paper in 1998 whereby local
government is committed to working with citizens within the community to find sustainable ways to meet their social,
economic and material needs and improve the quality of their lives (Atkinson, 2002: 9). Before 1998, municipalities were
primarily concerned with the operations and maintenance of basic functions within their localities. Since the publication
of the Local Government White Paper (1998), a new developmental role for municipalities has become paramount. This
involves a much more strategic, innovative and multi-sectoral involvement in infrastructural, economic, and social
development (Atkinson, 2002: 26).
The provincial and local governments have been in a cycle of policymaking and strategy-making as regards their
developmental role since 2000. The practical steps and interventions required to operationalise policies should be
enunciated in the Integrated Development Plan (IDP). The IDP is a legal document as per the Municipal Systems Act of
2000. The IDP interprets macro visions (policies and strategies from national and provincial government) and translates
and consolidates the same into ‘municipal reality’ (action plans and budgets). The process of drafting IDPs in many
municipalities, which should be an in-house activity, has been mainly out-sourced to consultants, who use the previous
plans as a basis for the subsequent IDP. Hence, much of the IDP continues with its previous momentum and small
incremental steps are made annually. The IDP should include green economy projects as announced in various policies
(Annegarn, 2013). Hence, skills development, the process of internalising plan crafting through continuous practice (learn-
by-doing) and making strategic choices for development, should be a focus area in terms of municipal capacity building.
Currently, the major source of revenue in municipalities is from the distribution of electricity, which is bought from Eskom
and on-sold to municipal residents. In order to decouple local government revenue generation from electricity
consumption, officials need to consider alternative revenue streams. Local government is required to play an increasing
role in facilitating local economic development.
Let us look at some factors that need to be addressed to effect the transition to energy-efficient low-income housing
development.
EARTH, WIND AND FIRE
Distributed renewable energy generation
Schedule 4 of the Constitution states low-income housing development is a provincial competence area (albeit, in recent
times, large metros have been delegated to provide low-income housing), and electricity (and gas) reticulation is a
municipal competence area. In practice, both Eskom and municipalities distribute electricity to domestic consumers.
Eskom’s domestic customers are mostly urban low-income households and rural households that were electrified as part
of the national electrification programme. It is important for national government to provide guidelines, in consultation
with provinces and municipalities, on distributed electricity development, that is, electricity generated from households
with rooftop solar panels and feeding excess capacity into the grid.80 In addition, the technology for solar PV systems to
use batteries to store electricity for use after sunset or days when there is no adequate sunlight is rapidly evolving so that
solar PV generators can deliver utility-scale power on demand (Chown, 2014).
Public Private Partnerships to facilitate innovation
A regulatory instrument needs to be developed to facilitate public-private partnerships81 for introducing innovations into
municipalities. The current three-year tenure for a sole sourcing contract under the MFMA is inadequate for new
technology roll-out. Technology has to be tested over a period of time through an iterative process of monitoring and
evaluation in order to realise economic and social benefits. Such a partnership between the municipality and an external
partner (whether it be a private company or university or research organisation) requires an effective contractual
arrangement so that both parties win. The service provider should be able to get a return on investment. The municipality
has the regulatory and oversight role but should attract new investments to reduce service delivery backlogs (Atkinson,
2002). However, many councillors are uncomfortable with external organisations that may be deemed to benefit from
providing services to the municipality, especially since there is the political imperative of Black Economic Empowerment
(BEE) which seeks to spread job creation and wealth creation to the larger Black community. Furthermore, most councillors
operate on the basis of their elected terms. The Infrastructure Development Act (2014) supports long-term infrastructure
development that goes beyond a single electoral tenure. This necessitates the updating of the MFMA to meet the
requirements of the Infrastructure Development Act (2014).
Procurement Regulations
Procurement regulations for service providers should stipulate adherence to existing regulations. For example, SANS 204
has comprehensive guidelines for the construction of energy-efficient houses in the various climatic zones, but these are
not being implemented. Low-income housing development has continued to perpetuate apartheid era standards and/or
maintain the status quo, that is, basic housing that is connected to the Eskom grid for electricity supply. Progressive
contracts in low-income housing retrofitting programmes should be designed to motivate and incentivise local
manufacturing capacity of renewable electricity equipment. The announcement by the DoE that the new SWH rebate
system will introduce subsidies on a sliding scale commensurate with local content and products with the highest verified
local content will be awarded the highest rebate is a welcome development (DoE, 2015).
There are concerns over the promotion and introduction of technology in low-income housing developments without a
clear contractual understanding of the service level required and the detailed legal service level contract. The Non-Grid
Household Electrification Guidelines (DoE, 2012) provide information such as application process by municipalities,
funding, contractual agreements, maintenance, monitoring and reporting, re-use of de-installed equipment and
community awareness and education. These guidelines will have to be scaled up in future guidelines from the current
80 This refers to residential areas that are near the grid. 81 Investigate Municipal Infrastructure Investment Unit (MIIU) to facilitate Municipal Services Partnerships (MSPs) (ref. Atkinson, 2002).
EARTH, WIND AND FIRE
minimalist understanding of low-income household requirements and take into account a more holistic and
developmental approach to the provision of non-grid or renewable energy for electricity generation.
Funding for energy-efficient low-income housing development
The current low-income housing subsidies can accommodate passive energy efficiency features but do not include
renewable energy equipment installations at the construction stage. It is important that the subsequent low-income
housing build programme should include installation of appliances such as solar PV panels, SWH and so on at the
construction stage. The inclusion of renewable energy equipment will contribute to the growth and expansion of the
manufacturing industry in South Africa. The development of a sustainable market (with potential to export) will see a
decrease in the cost of the equipment. The Department of Human Settlements (DHS), DoE and National Treasury will need
to devise innovative funding mechanisms for scaling up the inclusion of renewable energy technologies.
A further motivation to accelerate energy-efficient housing development that includes renewable energy technologies
is that, currently, Eskom is responsible for providing the infrastructure and installing electricity. Eskom regulations stipulate
that the utility will not provide electricity until 80 per cent of the construction work on low-income houses at a project site
has been completed and the houses are occupied. As most, if not all, municipalities are experiencing high demand for
housing, most low-income housing recipients move into accommodation that is without electricity.
When the renewable energy technology becomes fully developed, households will be able to sell their excess electricity
to Eskom by feeding into the grid. This is what is happening in Germany and other European countries that are
implementing distributed renewable electricity generation.
Future funding should incorporate sustainable design criteria and installation of appropriate technologies that include the
following: thermally efficient design, sustainable building materials, energy efficiency, renewable energy options,
sustainable water and sanitation systems, and waste minimisation and recycling.
Municipal government officials are change agents
A developmental municipality is required to facilitate new ideas that will improve service delivery. Political and
management buy-in is critical in ensuring that new ideas are institutionalised and implemented. One of the key roles of a
municipality is to be a change agent. Some municipal officials have embedded ideas and resist change. For example,
PEER Africa had to negotiate to change the existing site plan and design so that it could accommodate the north-facing
orientation to achieve passive energy. This was initially met with resistance from town planners who wanted to maintain
the ‘tried, tested and proven’ process of site planning for low-income residential areas where houses face the street.
Mohlakoana (2014) concluded that policy implementation processes do not only fail due to lack of financial resources.
Municipal officials, as change agents, should demonstrate the following characteristics: motivation, cognition
(internalising and interpreting new ideas and information), and the capacity and power to influence the policy
implementation process (2014: 337). Capacity building of municipal officials and councillors, which includes study tours
to learn from practical experiences in other countries, is an ongoing programme. However, there is concern that there
are no tangible outcomes to the municipal capacity building programme, given the challenges of service delivery.
Annegarn (2013) posited the following:
EARTH, WIND AND FIRE
It is important that all levels of government should be made responsible to deliver on the green economy in
a coordinated manner. The move to a low carbon economy has to be a key performance indicator (KPI) of
officials at all levels (Annegarn, 2013).
Monitoring and Evaluation
Monitoring and evaluation is an important function in service delivery programmes of government. The purpose of
monitoring and evaluation is to: monitor and evaluate the results of the implementation, provide a basis for decision-
making regarding the enhancement of existing programmes, promote accountability, and ensure that best practices are
documented and inform policy and new developments. The various policies and Acts stipulate that monitoring and
evaluation has to be embedded in all programmes. However, the lack of enforcement capacity within government is a
significant limiting factor and this needs to be addressed with capacity building of municipal officials. For example, the
amount of FBE (50kWh) per month is still based on a study conducted in 2002. There is a need to assess the impact of this
programme on low-income households and to better appreciate the changing needs of these households.
Innovation and Market Formation
South Africa has the capacity to implement innovative programmes on a national scale, for example, the national
electrification programme and the Motor Industry Development Programme (MIDP), which demonstrate innovation and
market formation. The major drawback in instituting energy efficiency and renewable energy technologies in low-income
housing development was the low price of electricity prior to 2008 compared to the cost of generation using renewable
options. The rapidly rising electricity prices since then, the falling prices of green technologies, as well as load shedding
has provided an impetus for the implementation of renewable energy technologies.
There are various projects that the government is implementing with regard to deploying renewable energy technologies
in low-income houses, for example, the implementation of solar home systems and solar water heaters. However, there
does not seem to be a process of developing these projects beyond the current small-scale initiatives. Further, it is
important to monitor the programme and document the lessons that emanate from implementing the various projects
that address energy efficiency and the introduction of renewable technologies in low-income housing. As such, they can
be evaluated, important lessons consolidated, and scaled up to a national infrastructure development programme.
The low-income housing market presents a unique opportunity to deploy renewable energy technologies. The onus is on
municipal governments to internalise, translate and champion national policies for implementation.
CONCLUSION
This chapter has presented some of the green energy development activities that are taking place in the low-income
housing sector as pronounced in various policies. While the said projects demonstrate that some implementation is going
on, this remains at pilot and/or small-scale levels. The lack of monitoring and evaluation of most projects has resulted in
the absence of information on lessons learnt for development of future projects and programmes.
South Africa has the capacity to implement large-scale national programmes. The electrification programme has
demonstrated wide-ranging impact on the welfare of low-income and indigent households. The national utility, Eskom,
further demonstrated a capacity and innovative ideas to ensure that the goal of electricity for all is largely achieved via
the national electrification programme. However, more can be done to move towards renewable electricity
development, especially in low-income and indigent households. While innovative pilot projects are being implemented
to address access and affordability to the wider population, there is a need to have a developmental approach that
EARTH, WIND AND FIRE
looks at adequate free basic services per household.
A policy framework exists to enable the national implementation of energy-efficient and renewable energy technology
in the development of low-income houses. National and provincial government departments have to coordinate their
work, as some of the enabling legislation resides in different spheres and departments. Municipalities have to incorporate
green energy development in their respective IDPs as pronounced in various policies.
Research organisations and universities need to be more intensely involved in the green energy development
programme. The policymakers require information that is based on sound research so that they make informed decisions.
The implementation of a national project on energy efficiency and renewable energy technology deployment for low-
income housing has to be accompanied by continual monitoring and evaluation and this capacity has to be developed
in all municipalities.
The energy-efficient low-income housing and renewable energy development have the potential to transform the
economy through innovation and the development of new industries. Energy-efficient low-income housing development
is an area where government has a captive market.
References and further reading
African National Congress. 1994. The Reconstruction and Development Programme – A policy framework. Johannesburg:
Umanyano Publications, ISBN 0-9583834-1-3.
Annegarn, H. 2013. ‘Potholes on the road to a Green Economy and what needs to be done to fill them’ in L. Mujakachi,
H. du Plessis and H. Annegarn (eds.), Implementing Strategies Towards a Low- carbon Economy. Proceedings of the
Government Cluster Policy Workshop convened by the Human Sciences Research Council (HSRC), 4 March, Pretoria.
Annegarn, H., D. M. Guy and L. Mujakachi. 2010. ‘Sustainable Human Settlement Development: The Witsand Housing
Development in Atlantis, Western Cape Province’. Presentation made to the SALGA (Gauteng) Human Settlements Sub-
Committee, 30 July 2010. SeTAR Centre, University of Johannesburg.
Annegarn, H., D. M. Guy and L. Mujakachi. 2011. ‘Green Housing: Integrated Energy Efficiency, Empowerment and Cost
Optimisation in Housing Delivery’. Presentation made at the launch of the West Rand District Municipality Green IQ.
Muldersdrift, 16 May 2011. SeTAR Centre, University of Johannesburg.
Atkinson, D. 2002. A Passion to Govern: Third Generation Issues Facing Local Government in South Africa. Human Sciences
Research Council and Centre for Development and Enterprise, June 2002.
Bega, S. 2015. ‘Solar water heating on ice’, Saturday Star, 24 January 2015. Available at:
www.iol.co.za/business/companies/solar-heating-sector-on-ice-1.1808583 [Accessed May 2015].
Chown, D. 2014. ‘Renewable Energy: The universe’s complexity’ in Financial Mail: The Green Report 2014, 30 October
2014. Available at: www.financialmail.co.za [Accessed July 2015].
Department of Cooperative Governance and Traditional Affairs. 1998. White Paper on Local Government, 9 March 1998.
Department of Energy. 1998. White Paper on the Energy Policy of the Republic of South Africa. ISBN: 0-9584235-8-X.
December 1998.
Department of Energy. 2003. White Paper on the Renewable Energy Policy of the Republic of South Africa. General Notice
513 of 2004. Government Gazette No. 26169, November 2003.
Department of Energy. 2005. Energy Efficiency Strategy of the Republic of South Africa, March 2005.
EARTH, WIND AND FIRE
Department of Energy. 2007. Free Basic Alternative Energy Policy (Households Energy Support Programme). General
Notice 391 of 2007, Government Gazette No. 29760, 2 April 2007.
Department of Energy. 2011. ‘Electricity Regulation Act No. 4 of 2006: Electricity Regulations on the Integrated Resource
Plan 2010–2030’, Regulation Gazette No. 9531, Vol. 551. Government Gazette No 34263. 6 May.
Department of Energy. 2012. Non-Grid Household Electrification Policy Guidelines, 19 March 2012.
Department of Energy. 2013. Integrated Resource Plan for Electricity (IRP) 2010–2030. Update Report 2013. Department of
Energy, 21 November 2013.
Department of Energy. 2015. Media Release: ‘Solar Water Heater Programme Update’. Pretoria, 4 February 2015.
Available at: www.energy.gov.za/files/media/pr/2015/MediaRelease-Solar-Water-Heater-Programme-Update-
4February2015.pdf [Accessed May 2015].
Department of Environmental Affairs. 2008. People-Planet-Prosperity: A National Framework for Sustainable Development
in South Africa, July 2008.
Dugard, J. 2009. ‘Power to the people? A rights-based analysis of South Africa’s electricity services’ in D. A. McDonald
(ed.) Electric Capitalism – Recolonising Africa on the Power Grid. Cape Town: HSRC Press. ISBN 978-0-7969-2237-3, pp. 264–
287.
Economic Development Department. 2014. Annual Report 2013/2014 of the Economic Development Department – Vote
28. July 2014. Republic of South Africa.
Eltrop, L. 2011. ‘The EnerKey Research Programme’ in L. Mujakachi and H. Annegarn (eds.) Proceedings of the Energy and
Climate Protection Conference – A Reader. Unpublished proceedings of conference held at Turbine Hall, Johannesburg,
5–6 October 2011. SeTAR Centre, University of Johannesburg.
Foxon, T. J. 2002. ‘Technological and institutional ‘lock-in’ as a barrier to sustainable innovation’. ICCEPT Working Paper,
November 2002. Available at: http://www.iccept.ic.ac.uk/public.html [Accessed April 2014].
Guy, D. 2010. Witsand integrated Energy, Environment, Empowerment and Cost Optimization (iEEECO™) Benchmark
Human Settlement. Cape Town: PEER Africa.
Ledger, J. 2011. ‘Sustainable energy supply – alternative energy technologies’ in L. Mujakachi and H. Annegarn (eds.)
Proceedings of the Energy and Climate Protection Conference – A Reader. Unpublished proceedings of conference held
at Turbine Hall, Johannesburg, 5–6 October 2011. SeTAR Centre, University of Johannesburg.
Lilliestam, J., A. Battaglini, C. Finlay, D. Fürstenwerth, A. Patt, G. Schellekens and P. Schmidt. 2012. ‘An alternative to a
global climate deal may be unfolding before our eyes’ in Climate and Development, Vol. 4, No. 1, January 2012, pp. 1–
4.
Lund, T. 2015. ‘Renewable Energy: Some light on horizon’, Financial Mail, 23 April 2015. Available at:
www.financialmail.co.za/2015/04/23/renewable-energy-some-light-on-horizon [Accessed May 2015].
Mapako, M. and G. Prasad. 2005. ‘The Free Basic Electricity (FBE) policy and rural-grid connected households, solar home
system (SHS) users and unelectrified households’ in Proceedings of Domestic Use of Energy Conference 2005. Cape
Peninsula University of Technology (CPUT).
Marquard, A. 2006. ‘The Origins and Development of South African Energy Policy’, Ph.D. thesis, University of Cape Town.
January 2006.
Mohlakoana, N. 2014. ‘Implementing the South African Free Basic Alternative Energy Policy – A Dynamic Actor
EARTH, WIND AND FIRE
Interaction’, Ph.D. diss., University of Twente, Netherlands. December 2014.
Paraffin Safety Association Southern Africa (PASASA). 2012. ‘The Need for a Household Energy Strategy and Policy –
Submission to the National Planning Commission in response to the National Development Plan’. Report from the
stakeholder workshop held 3 May 2012. Johannesburg.
Prasad, G. (n.d.): South African Electrification Programme. Energy Research Centre, University of Cape Town.
Presence, C. 2014. ‘SA's “sad story of housing” – Lindiwe Sisulu’, Mail & Guardian, 15 July 2014. Available at:
http://mg.co.za/article/2014-07-15-sas-sad-story-of-housing [Accessed January 2015].
Presidential Infrastructure Coordinating Commission. 2012. Provincial and Local Government Conference: A summary of
the Infrastructure Plan, 13 April 2012.
Republic of South Africa. 2011. ‘Green Economy Summit Report’. 18–20 May 2010, Johannesburg. Available at:
www.sagreeneconomy.co.za [Accessed May 2015].
Ruiters, G. 2009. ‘Free basic electricity in South Africa: A strategy for helping or containing the poor’ in D. A. McDonald
(ed.) Electric Capitalism – Recolonising Africa on the Power Grid. ISBN 978-0-7969-2237-3, pp. 248–263. Cape Town: HSRC
Press.
South African Bureau of Standards (SABS). 2011. South African National Standard: Energy Efficiency in Buildings. SANS 204:
2011 Edition 1, August. ISBN 978-0-626-26403-1. Pretoria.
Van Ryneveld, P., S. Parnell and D. Muller. 2003. Indigent Policy: A Pro-Poor Income Strategy and Implementation Plan.
Prepared for the City of Cape Town, May 2003.
Verwey, B. 2014. ‘Energy Efficacy and Efforts to Promote Green Living’ in proceedings of Energy Efficient Housing Workshop
held 29–30 September 2014, Cape Town. Workshop convened by the Renewable Energy and Energy Efficiency
Partnership (REEEP), GreenCape and South African National Energy Development Institute (SANEDI).
EARTH, WIND AND FIRE
SECTION III
Regional Integration: Exploring Optimal Energy Strategies
EARTH, WIND AND FIRE
CHAPTER 10
Off-grid Renewable Electrification as a Viable and
Complementary Power Planning Paradigm in Southern
Africa: A Quantitative Assessment
Ogundiran Soumonni
ABSTRACT
The aim of this chapter is to present a quantitative assessment of some of the technological, economic and environmental
implications of extending electricity to households in southern Africa through off-grid electrification as an alternative and
complementary approach to the dominant centralised generation strategies. The first part of the chapter presents an
overview of the literature on the environmental impact of various energy technologies over their entire lifecycles in order
to provide a sense of scale with respect to the ecological advantage of renewable energy technologies (RETs). Based
on meteorological data, the chapter then provides an estimate of both the theoretical and practical potential for
distributed renewable electricity from solar and wind energy. Furthermore, using a ‘component sizing’ procedure, the
chapter demonstrates how solar photovoltaics, and wind turbines (and their associated components such as batteries,
charge controllers and inverters) can meet the basic electricity requirements of individual households in non-electrified
areas. Lastly, the chapter presents the results of a set of simulations using the Hybrid Optimization Model for Electric
Renewables (HOMER) software package to compare the costs of renewable electricity in a setting with little or no grid
access, when compared to the more widely available diesel generator sets. The results strongly suggest that a
decentralised, bottom-up and gradual approach to electrification is a viable and complementary policy paradigm for
energy planning in southern Africa. If adopted in a manner that encourages ongoing learning, the approach should
ultimately demonstrate more favourable implications for increased energy access, sustainability and technological
competence building in the region and in other similar contexts.
INTRODUCTION
The objective of this chapter is to present a quantitative analysis of some of the key environmental and economic
implications of extending distributed renewable electrification to residents of the southern African region not currently
connected to the existing grid.
The southern African region, as used in this chapter, refers to the 15 countries that are part of the Southern African
Development Community (SADC), which includes the 12 member countries of the Southern African Power Pool (SAPP)
and three island nations that are not currently part of the regional power pool. Although the accuracy of international
energy data varies by source, according to the SAPP, the average electrification rate of its member states is about 36 per
cent (SAPP, 2014), with the International Energy Agency (IEA) reporting rates ranging from about nine per cent in Malawi
and the DRC to 85 per cent in South Africa, and 97 per cent and 100 per cent in the island countries of Seychelles and
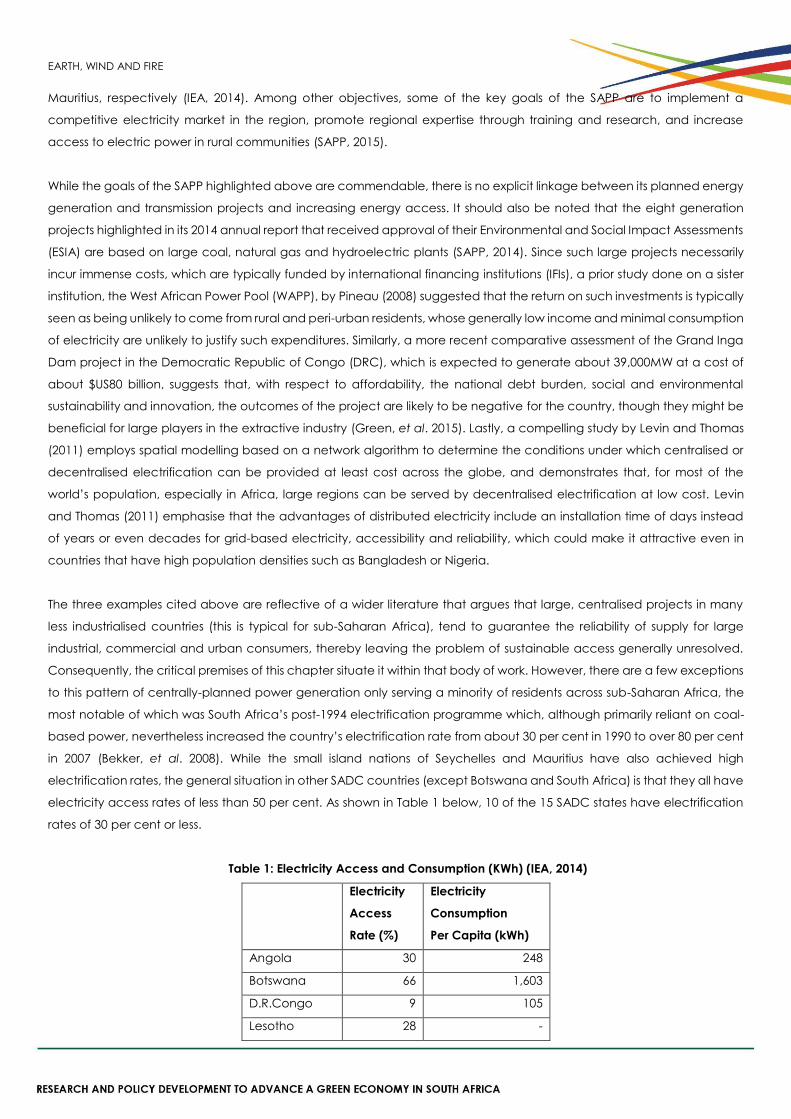
EARTH, WIND AND FIRE
Mauritius, respectively (IEA, 2014). Among other objectives, some of the key goals of the SAPP are to implement a
competitive electricity market in the region, promote regional expertise through training and research, and increase
access to electric power in rural communities (SAPP, 2015).
While the goals of the SAPP highlighted above are commendable, there is no explicit linkage between its planned energy
generation and transmission projects and increasing energy access. It should also be noted that the eight generation
projects highlighted in its 2014 annual report that received approval of their Environmental and Social Impact Assessments
(ESIA) are based on large coal, natural gas and hydroelectric plants (SAPP, 2014). Since such large projects necessarily
incur immense costs, which are typically funded by international financing institutions (IFIs), a prior study done on a sister
institution, the West African Power Pool (WAPP), by Pineau (2008) suggested that the return on such investments is typically
seen as being unlikely to come from rural and peri-urban residents, whose generally low income and minimal consumption
of electricity are unlikely to justify such expenditures. Similarly, a more recent comparative assessment of the Grand Inga
Dam project in the Democratic Republic of Congo (DRC), which is expected to generate about 39,000MW at a cost of
about $US80 billion, suggests that, with respect to affordability, the national debt burden, social and environmental
sustainability and innovation, the outcomes of the project are likely to be negative for the country, though they might be
beneficial for large players in the extractive industry (Green, et al. 2015). Lastly, a compelling study by Levin and Thomas
(2011) employs spatial modelling based on a network algorithm to determine the conditions under which centralised or
decentralised electrification can be provided at least cost across the globe, and demonstrates that, for most of the
world’s population, especially in Africa, large regions can be served by decentralised electrification at low cost. Levin
and Thomas (2011) emphasise that the advantages of distributed electricity include an installation time of days instead
of years or even decades for grid-based electricity, accessibility and reliability, which could make it attractive even in
countries that have high population densities such as Bangladesh or Nigeria.
The three examples cited above are reflective of a wider literature that argues that large, centralised projects in many
less industrialised countries (this is typical for sub-Saharan Africa), tend to guarantee the reliability of supply for large
industrial, commercial and urban consumers, thereby leaving the problem of sustainable access generally unresolved.
Consequently, the critical premises of this chapter situate it within that body of work. However, there are a few exceptions
to this pattern of centrally-planned power generation only serving a minority of residents across sub-Saharan Africa, the
most notable of which was South Africa’s post-1994 electrification programme which, although primarily reliant on coal-
based power, nevertheless increased the country’s electrification rate from about 30 per cent in 1990 to over 80 per cent
in 2007 (Bekker, et al. 2008). While the small island nations of Seychelles and Mauritius have also achieved high
electrification rates, the general situation in other SADC countries (except Botswana and South Africa) is that they all have
electricity access rates of less than 50 per cent. As shown in Table 1 below, 10 of the 15 SADC states have electrification
rates of 30 per cent or less.
Table 1: Electricity Access and Consumption (KWh) (IEA, 2014)
Electricity
Access
Rate (%)
Electricity
Consumption
Per Capita (kWh)
Angola 30 248
Botswana 66 1,603
D.R.Congo 9 105
Lesotho 28 -
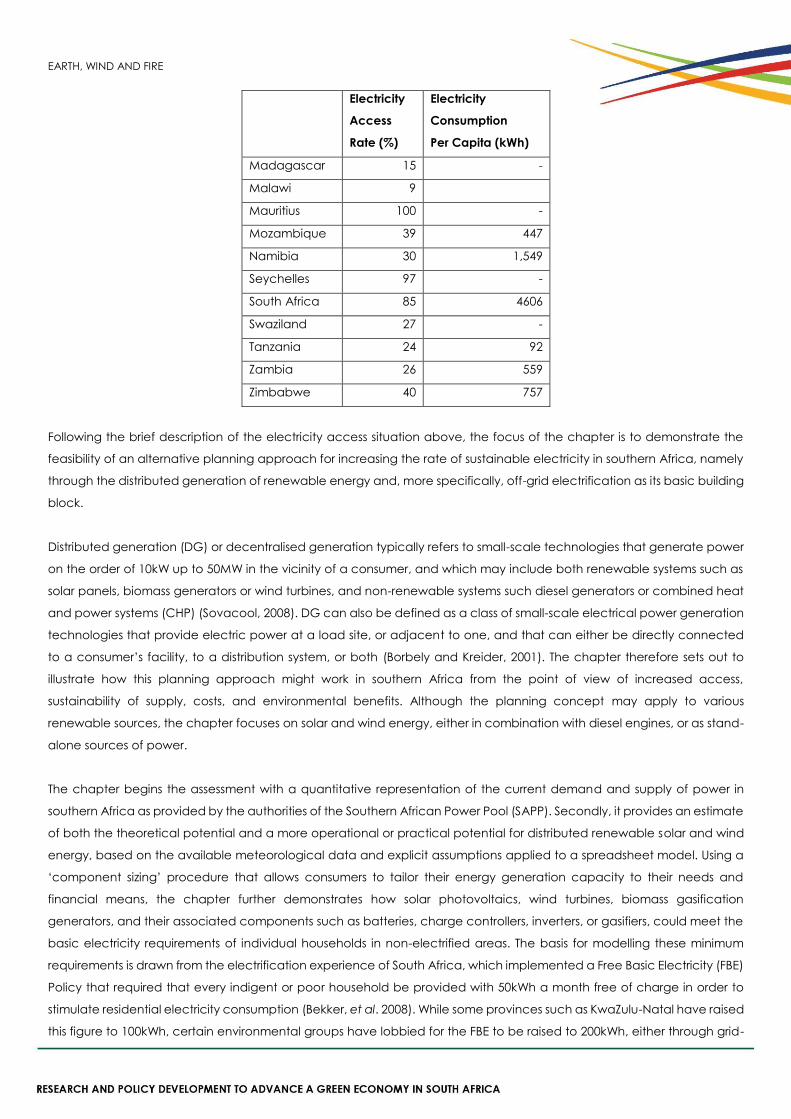
EARTH, WIND AND FIRE
Electricity
Access
Rate (%)
Electricity
Consumption
Per Capita (kWh)
Madagascar 15 -
Malawi 9
Mauritius 100 -
Mozambique 39 447
Namibia 30 1,549
Seychelles 97 -
South Africa 85 4606
Swaziland 27 -
Tanzania 24 92
Zambia 26 559
Zimbabwe 40 757
Following the brief description of the electricity access situation above, the focus of the chapter is to demonstrate the
feasibility of an alternative planning approach for increasing the rate of sustainable electricity in southern Africa, namely
through the distributed generation of renewable energy and, more specifically, off-grid electrification as its basic building
block.
Distributed generation (DG) or decentralised generation typically refers to small-scale technologies that generate power
on the order of 10kW up to 50MW in the vicinity of a consumer, and which may include both renewable systems such as
solar panels, biomass generators or wind turbines, and non-renewable systems such diesel generators or combined heat
and power systems (CHP) (Sovacool, 2008). DG can also be defined as a class of small-scale electrical power generation
technologies that provide electric power at a load site, or adjacent to one, and that can either be directly connected
to a consumer’s facility, to a distribution system, or both (Borbely and Kreider, 2001). The chapter therefore sets out to
illustrate how this planning approach might work in southern Africa from the point of view of increased access,
sustainability of supply, costs, and environmental benefits. Although the planning concept may apply to various
renewable sources, the chapter focuses on solar and wind energy, either in combination with diesel engines, or as stand-
alone sources of power.
The chapter begins the assessment with a quantitative representation of the current demand and supply of power in
southern Africa as provided by the authorities of the Southern African Power Pool (SAPP). Secondly, it provides an estimate
of both the theoretical potential and a more operational or practical potential for distributed renewable solar and wind
energy, based on the available meteorological data and explicit assumptions applied to a spreadsheet model. Using a
‘component sizing’ procedure that allows consumers to tailor their energy generation capacity to their needs and
financial means, the chapter further demonstrates how solar photovoltaics, wind turbines, biomass gasification
generators, and their associated components such as batteries, charge controllers, inverters, or gasifiers, could meet the
basic electricity requirements of individual households in non-electrified areas. The basis for modelling these minimum
requirements is drawn from the electrification experience of South Africa, which implemented a Free Basic Electricity (FBE)
Policy that required that every indigent or poor household be provided with 50kWh a month free of charge in order to
stimulate residential electricity consumption (Bekker, et al. 2008). While some provinces such as KwaZulu-Natal have raised
this figure to 100kWh, certain environmental groups have lobbied for the FBE to be raised to 200kWh, either through grid-
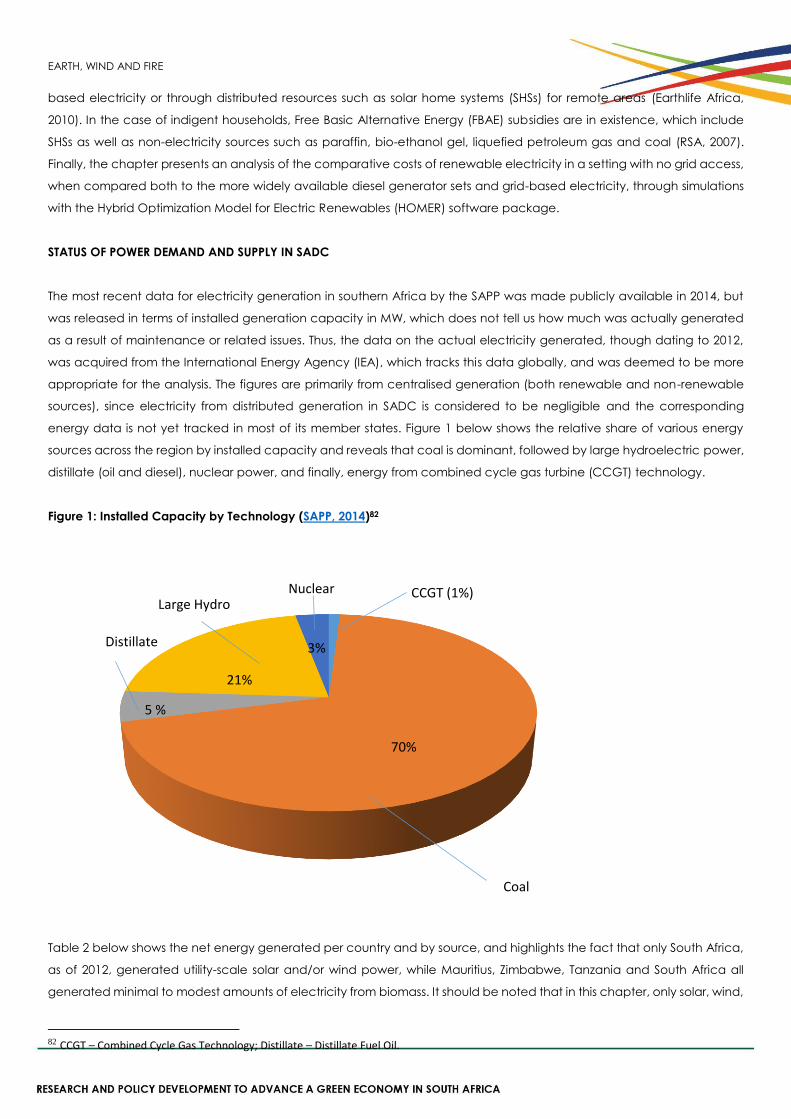
EARTH, WIND AND FIRE
based electricity or through distributed resources such as solar home systems (SHSs) for remote areas (Earthlife Africa,
2010). In the case of indigent households, Free Basic Alternative Energy (FBAE) subsidies are in existence, which include
SHSs as well as non-electricity sources such as paraffin, bio-ethanol gel, liquefied petroleum gas and coal (RSA, 2007).
Finally, the chapter presents an analysis of the comparative costs of renewable electricity in a setting with no grid access,
when compared both to the more widely available diesel generator sets and grid-based electricity, through simulations
with the Hybrid Optimization Model for Electric Renewables (HOMER) software package.
STATUS OF POWER DEMAND AND SUPPLY IN SADC
The most recent data for electricity generation in southern Africa by the SAPP was made publicly available in 2014, but
was released in terms of installed generation capacity in MW, which does not tell us how much was actually generated
as a result of maintenance or related issues. Thus, the data on the actual electricity generated, though dating to 2012,
was acquired from the International Energy Agency (IEA), which tracks this data globally, and was deemed to be more
appropriate for the analysis. The figures are primarily from centralised generation (both renewable and non-renewable
sources), since electricity from distributed generation in SADC is considered to be negligible and the corresponding
energy data is not yet tracked in most of its member states. Figure 1 below shows the relative share of various energy
sources across the region by installed capacity and reveals that coal is dominant, followed by large hydroelectric power,
distillate (oil and diesel), nuclear power, and finally, energy from combined cycle gas turbine (CCGT) technology.
Figure 1: Installed Capacity by Technology (SAPP, 2014)82
Table 2 below shows the net energy generated per country and by source, and highlights the fact that only South Africa,
as of 2012, generated utility-scale solar and/or wind power, while Mauritius, Zimbabwe, Tanzania and South Africa all
generated minimal to modest amounts of electricity from biomass. It should be noted that in this chapter, only solar, wind,
82 CCGT – Combined Cycle Gas Technology; Distillate – Distillate Fuel Oil.
CCGT (1%)
Coal
Distillate
Large HydroNuclear
70%
21%
5 %
3%
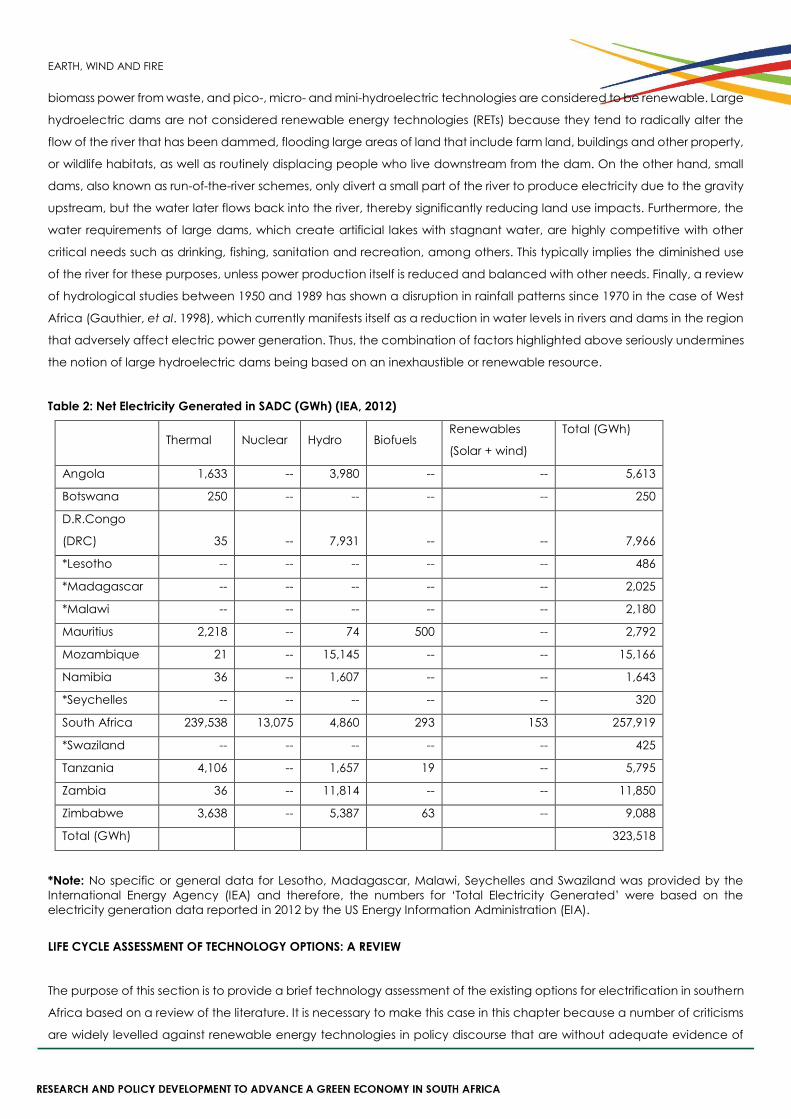
EARTH, WIND AND FIRE
biomass power from waste, and pico-, micro- and mini-hydroelectric technologies are considered to be renewable. Large
hydroelectric dams are not considered renewable energy technologies (RETs) because they tend to radically alter the
flow of the river that has been dammed, flooding large areas of land that include farm land, buildings and other property,
or wildlife habitats, as well as routinely displacing people who live downstream from the dam. On the other hand, small
dams, also known as run-of-the-river schemes, only divert a small part of the river to produce electricity due to the gravity
upstream, but the water later flows back into the river, thereby significantly reducing land use impacts. Furthermore, the
water requirements of large dams, which create artificial lakes with stagnant water, are highly competitive with other
critical needs such as drinking, fishing, sanitation and recreation, among others. This typically implies the diminished use
of the river for these purposes, unless power production itself is reduced and balanced with other needs. Finally, a review
of hydrological studies between 1950 and 1989 has shown a disruption in rainfall patterns since 1970 in the case of West
Africa (Gauthier, et al. 1998), which currently manifests itself as a reduction in water levels in rivers and dams in the region
that adversely affect electric power generation. Thus, the combination of factors highlighted above seriously undermines
the notion of large hydroelectric dams being based on an inexhaustible or renewable resource.
Table 2: Net Electricity Generated in SADC (GWh) (IEA, 2012)
Thermal Nuclear Hydro Biofuels
Renewables
(Solar + wind)
Total (GWh)
Angola 1,633 -- 3,980 -- -- 5,613
Botswana 250 -- -- -- -- 250
D.R.Congo
(DRC) 35 -- 7,931 --
--
7,966
*Lesotho -- -- -- -- -- 486
*Madagascar -- -- -- -- -- 2,025
*Malawi -- -- -- -- -- 2,180
Mauritius 2,218 -- 74 500 -- 2,792
Mozambique 21 -- 15,145 -- -- 15,166
Namibia 36 -- 1,607 -- -- 1,643
*Seychelles -- -- -- -- -- 320
South Africa 239,538 13,075 4,860 293 153 257,919
*Swaziland -- -- -- -- -- 425
Tanzania 4,106 -- 1,657 19 -- 5,795
Zambia 36 -- 11,814 -- -- 11,850
Zimbabwe 3,638 -- 5,387 63 -- 9,088
Total (GWh) 323,518
*Note: No specific or general data for Lesotho, Madagascar, Malawi, Seychelles and Swaziland was provided by the
International Energy Agency (IEA) and therefore, the numbers for ‘Total Electricity Generated’ were based on the
electricity generation data reported in 2012 by the US Energy Information Administration (EIA).
LIFE CYCLE ASSESSMENT OF TECHNOLOGY OPTIONS: A REVIEW
The purpose of this section is to provide a brief technology assessment of the existing options for electrification in southern
Africa based on a review of the literature. It is necessary to make this case in this chapter because a number of criticisms
are widely levelled against renewable energy technologies in policy discourse that are without adequate evidence of
EARTH, WIND AND FIRE
specification. For instance, it is often stated that the challenge with renewable energy technologies is their supposedly
high cost, without clear reference to either capital costs or lifecycle costs, or price distortions such as the absence of
carbon taxes on fossil fuels or compensatory subsidies for renewables. Another source of contention relates to diverging
interpretations about which technologies are more environmentally beneficial than others, depending on the point at
which they are assessed (either at the end-use or some other unspecified set of points). For instance, some commentators
argue that the manufacturing of solar PV panels is so energy-intensive that the gains in terms of pollution are minimal over
conventional fossil-based generation, while others argue for large-scale biofuels investments on account of their lower
emissions at the point of use, without necessarily accounting for the loss of trees and plant cover from the land clearing
that is needed to grow energy crops. Thus, in either case, there is a lot of doubt in the public mind as to whether renewable
energy solutions are even beneficial in the long run with respect to their energy intensity during the manufacturing phase,
their reliability and other factors. While the systematic cost comparisons are presented in the fifth section, the technology
assessment provided here offers a review of quantitative comparisons of these technologies, which have been done
across their entire life cycles.
A life cycle can be defined as the total life span that a product goes through from the extraction of the raw material used
to produce it, its manufacture, its use and, ultimately, to its disposal as waste into the environment (Nieuwlaar, 2004). A
Life Cycle Assessment (LCA) then refers to the evaluation and analysis of the life cycles of various products. While an LCA
is typically limited to environmental issues, the term can sometimes include social and economic considerations as well
(Nieuwlaar, 2004). However, the LCA is used in this chapter only in reference to environmental issues, and is distinguished
from the more widely known Environmental Impact Assessment (EIA) because of the emphasis of the LCA on the products
themselves. The results obtained from a levelised cost of electricity (LCOE) analysis, which is a standard analytical
technique for comparing the life cycle costs of different systems (Byrne, et al. 2007), are subsequently presented in the
HOMER modelling exercise in the fourth section. Furthermore, the net present costs (NPC) of the optimised technology
options presented in that section are the same as the life cycle costs according to developers of the HOMER software
package that was used in the modelling exercise.
Although there are methodological debates around life cycle assessments, they go beyond the scope of this chapter,
and the goal of this section, then, is simply to use examples from the peer-reviewed literature to demonstrate the types of
materials and pollutants, as well as their general orders of magnitude that should be accounted for in selecting a
particular energy system. The current section sheds more light on the LCA characteristics of the main energy systems used
in much of sub-Saharan Africa, more generally, for both centralised and distributed generation (DG). The centralised
generation technologies are primarily based on hydropower, oil, natural gas, and, to a lesser extent, biomass power, while
the DG technologies include diesel generators, solar photovoltaic panels, wind turbines and biomass gasification systems.
With respect to LCA, the difference between fossil fuel-based energy systems and non-fossil-based sources, including
nuclear energy, is that in the former, the main environmental impacts come from combustion and their associated waste
and flue gases, while in the latter, the impacts are based on the environmental profile of the materials used in their
manufacture (Nieuwlaar, 2004).
The life cycle assessment described below of a 3kW community hydroelectric power system that was juxtaposed with
assessments of a diesel generator and electricity from the grid in Thailand can be compared favourably to the sub-
Saharan African context in general, and large areas of southern Africa as well. In that assessment, Pascale, et al. (2011)
demonstrated that when placed in a rural setting, the 3kW run-of-the-river generator produced better environmental and
financial outcomes than both a diesel generator and grid-based power generated from various sources, including:
natural gas (72%), coal (15%) and large dams (7%). Their result was in contrast to most other LCA studies that had previously
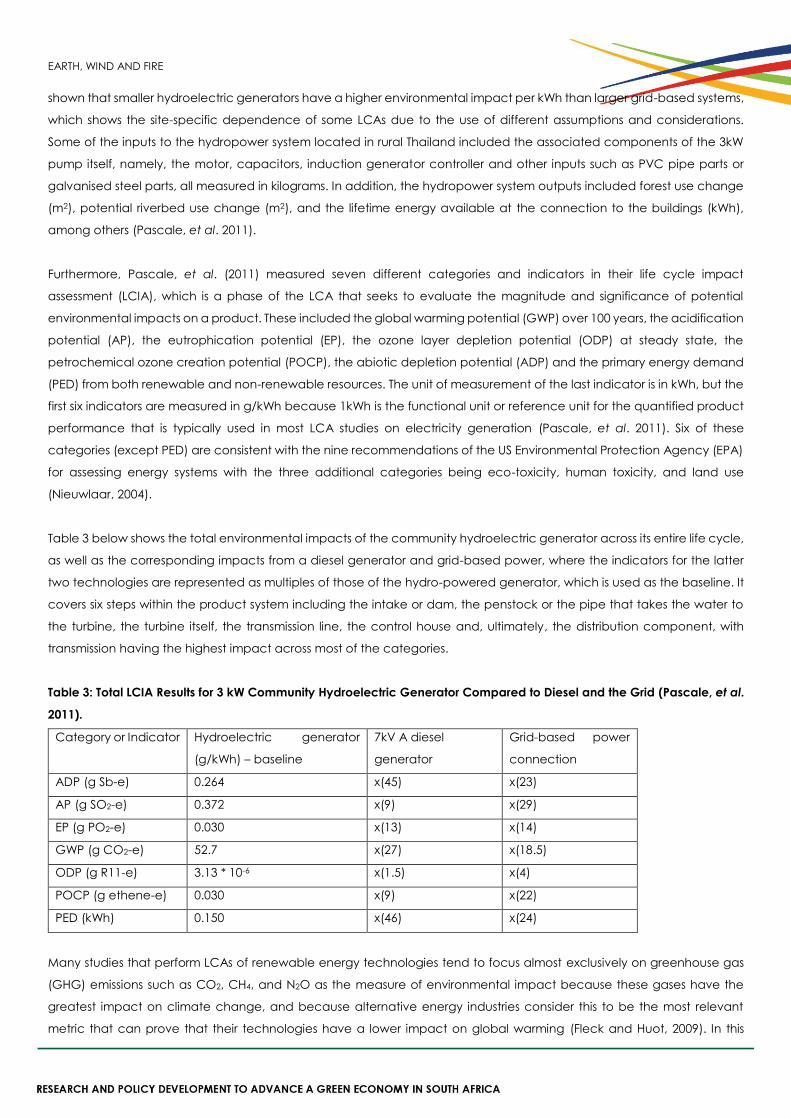
EARTH, WIND AND FIRE
shown that smaller hydroelectric generators have a higher environmental impact per kWh than larger grid-based systems,
which shows the site-specific dependence of some LCAs due to the use of different assumptions and considerations.
Some of the inputs to the hydropower system located in rural Thailand included the associated components of the 3kW
pump itself, namely, the motor, capacitors, induction generator controller and other inputs such as PVC pipe parts or
galvanised steel parts, all measured in kilograms. In addition, the hydropower system outputs included forest use change
(m2), potential riverbed use change (m2), and the lifetime energy available at the connection to the buildings (kWh),
among others (Pascale, et al. 2011).
Furthermore, Pascale, et al. (2011) measured seven different categories and indicators in their life cycle impact
assessment (LCIA), which is a phase of the LCA that seeks to evaluate the magnitude and significance of potential
environmental impacts on a product. These included the global warming potential (GWP) over 100 years, the acidification
potential (AP), the eutrophication potential (EP), the ozone layer depletion potential (ODP) at steady state, the
petrochemical ozone creation potential (POCP), the abiotic depletion potential (ADP) and the primary energy demand
(PED) from both renewable and non-renewable resources. The unit of measurement of the last indicator is in kWh, but the
first six indicators are measured in g/kWh because 1kWh is the functional unit or reference unit for the quantified product
performance that is typically used in most LCA studies on electricity generation (Pascale, et al. 2011). Six of these
categories (except PED) are consistent with the nine recommendations of the US Environmental Protection Agency (EPA)
for assessing energy systems with the three additional categories being eco-toxicity, human toxicity, and land use
(Nieuwlaar, 2004).
Table 3 below shows the total environmental impacts of the community hydroelectric generator across its entire life cycle,
as well as the corresponding impacts from a diesel generator and grid-based power, where the indicators for the latter
two technologies are represented as multiples of those of the hydro-powered generator, which is used as the baseline. It
covers six steps within the product system including the intake or dam, the penstock or the pipe that takes the water to
the turbine, the turbine itself, the transmission line, the control house and, ultimately, the distribution component, with
transmission having the highest impact across most of the categories.
Table 3: Total LCIA Results for 3 kW Community Hydroelectric Generator Compared to Diesel and the Grid (Pascale, et al.
2011).
Category or Indicator Hydroelectric generator
(g/kWh) – baseline
7kV A diesel
generator
Grid-based power
connection
ADP (g Sb-e) 0.264 x(45) x(23)
AP (g SO2-e) 0.372 x(9) x(29)
EP (g PO2-e) 0.030 x(13) x(14)
GWP (g CO2-e) 52.7 x(27) x(18.5)
ODP (g R11-e) 3.13 * 10-6 x(1.5) x(4)
POCP (g ethene-e) 0.030 x(9) x(22)
PED (kWh) 0.150 x(46) x(24)
Many studies that perform LCAs of renewable energy technologies tend to focus almost exclusively on greenhouse gas
(GHG) emissions such as CO2, CH4, and N2O as the measure of environmental impact because these gases have the
greatest impact on climate change, and because alternative energy industries consider this to be the most relevant
metric that can prove that their technologies have a lower impact on global warming (Fleck and Huot, 2009). In this
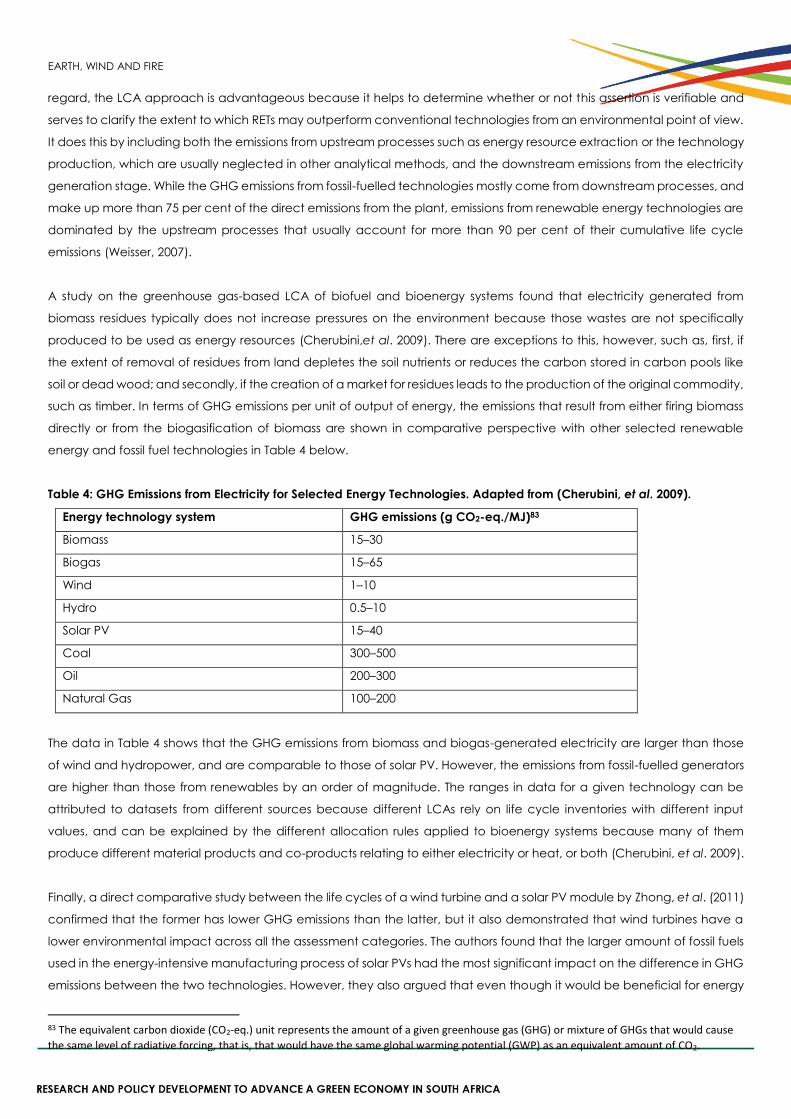
EARTH, WIND AND FIRE
regard, the LCA approach is advantageous because it helps to determine whether or not this assertion is verifiable and
serves to clarify the extent to which RETs may outperform conventional technologies from an environmental point of view.
It does this by including both the emissions from upstream processes such as energy resource extraction or the technology
production, which are usually neglected in other analytical methods, and the downstream emissions from the electricity
generation stage. While the GHG emissions from fossil-fuelled technologies mostly come from downstream processes, and
make up more than 75 per cent of the direct emissions from the plant, emissions from renewable energy technologies are
dominated by the upstream processes that usually account for more than 90 per cent of their cumulative life cycle
emissions (Weisser, 2007).
A study on the greenhouse gas-based LCA of biofuel and bioenergy systems found that electricity generated from
biomass residues typically does not increase pressures on the environment because those wastes are not specifically
produced to be used as energy resources (Cherubini,et al. 2009). There are exceptions to this, however, such as, first, if
the extent of removal of residues from land depletes the soil nutrients or reduces the carbon stored in carbon pools like
soil or dead wood; and secondly, if the creation of a market for residues leads to the production of the original commodity,
such as timber. In terms of GHG emissions per unit of output of energy, the emissions that result from either firing biomass
directly or from the biogasification of biomass are shown in comparative perspective with other selected renewable
energy and fossil fuel technologies in Table 4 below.
Table 4: GHG Emissions from Electricity for Selected Energy Technologies. Adapted from (Cherubini, et al. 2009).
Energy technology system GHG emissions (g CO2-eq./MJ)83
Biomass 15–30
Biogas 15–65
Wind 1–10
Hydro 0.5–10
Solar PV 15–40
Coal 300–500
Oil 200–300
Natural Gas 100–200
The data in Table 4 shows that the GHG emissions from biomass and biogas-generated electricity are larger than those
of wind and hydropower, and are comparable to those of solar PV. However, the emissions from fossil-fuelled generators
are higher than those from renewables by an order of magnitude. The ranges in data for a given technology can be
attributed to datasets from different sources because different LCAs rely on life cycle inventories with different input
values, and can be explained by the different allocation rules applied to bioenergy systems because many of them
produce different material products and co-products relating to either electricity or heat, or both (Cherubini, et al. 2009).
Finally, a direct comparative study between the life cycles of a wind turbine and a solar PV module by Zhong, et al. (2011)
confirmed that the former has lower GHG emissions than the latter, but it also demonstrated that wind turbines have a
lower environmental impact across all the assessment categories. The authors found that the larger amount of fossil fuels
used in the energy-intensive manufacturing process of solar PVs had the most significant impact on the difference in GHG
emissions between the two technologies. However, they also argued that even though it would be beneficial for energy
83 The equivalent carbon dioxide (CO2-eq.) unit represents the amount of a given greenhouse gas (GHG) or mixture of GHGs that would cause
the same level of radiative forcing, that is, that would have the same global warming potential (GWP) as an equivalent amount of CO2.
EARTH, WIND AND FIRE
from solar PVs to be used to help power the assembly phase, a bigger challenge would remain in the disposal phase
because only small quantities of the recycled waste can currently be reaped from solar PVs as compared to wind turbines.
In the case of a wind turbine system, Fleck and Huot (2009) found that the most emission-intensive process was in the
production of the battery banks, followed by the tower production, and thirdly, battery bank delivery, with the turbine
production process itself and all other processes accounting for only eight per cent of the system’s GHG emissions.
In conclusion, this section has undertaken to clarify the appearance of equally viable contradictory views about the
ecological viability of renewable energy technologies over conventional energy sources. It has shown that the
preponderance of evidence based on life cycle assessments is in favour of RETs over fossil-based distributed sources, as
well as grid-based electricity from large hydroelectric dams and fossil-fuelled generators.
ESTIMATION OF RENEWABLE RESOURCES
Following the case made in the preceding section, this section then seeks to address another popularly expressed
scepticism about the practical availability of renewable energy sources. It thereby illustrates the abundance of these
resources, specifically with respect to meeting the electricity requirements of the region. The renewable resources chosen
in this section are based on a cursory view of meteorological maps that suggest their availability, and the assessment of
these resources is deemed sufficient to support the argument that is being advanced in this chapter.
Solar Energy
Solar energy technologies can exist as either solar thermal systems or solar photovoltaics (PV). The first set of technologies
focus sunlight on a fluid to produce steam that can then be used in a turbine to generate electricity, while the latter
convert sunlight directly into electricity. I focus here on the energy potential from solar home systems (SHSs), as these are
more suitable for residential use. SHSs typically include the PV modules, batteries, a charge controller and an inverter.
However, it should be noted that while an inverter is primarily needed only if one intends to use appliances that operate
with Alternating Current (AC), it is also a useful device to have in order to provide the flexibility to connect with an existing
or future centralised grid.
The approach employed to obtain the meteorological data for assessing the solar potential was obtained in the following
manner. In order to find geographical coordinates for the countries in the region, the Google Earth software was used to
select two diagonally located cities or towns on a given country’s map so as to increase the chances of capturing any
significant climatic contrasts in that particular country and consequently, in the region overall. The average insolation
incident on a horizontal surface was then acquired by entering each coordinate into a database on surface meteorology
and solar energy that is maintained by the Atmospheric Science Data Center of the US government’s National
Aeronautics and Space Administration (NASA) database. The software associated with the database then derives the
average solar radiation resolved over the area between the two locations for the user. The latitude, longitude, elevation
and corresponding resolved average solar insolation data (collected over a 22-year period from July 1983 to June 2005)
of the selected locations for analysis are displayed in Table 5 below.
Estimation of Electricity Potential from Solar Photovoltaics
The goal of the first part of the calculations in this sub-section is to illustrate that solar energy can meet the electricity
requirements of the region, as well as show how various sizes of solar PV modules could meet the minimum electricity
requirements of a non-electrified household. Based on the characteristics of current solar technologies, the solar resource
in southern Africa is shown to be sufficient to meet all its electricity needs many times over. This kind of expansive
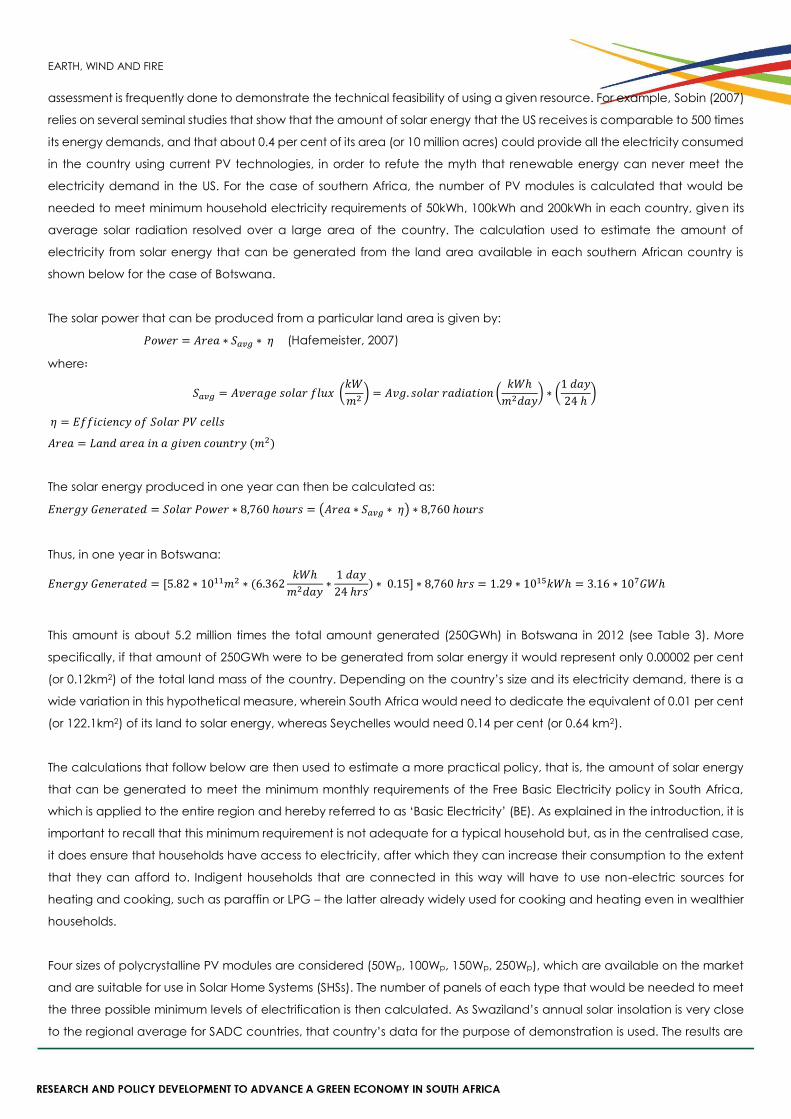
EARTH, WIND AND FIRE
assessment is frequently done to demonstrate the technical feasibility of using a given resource. For example, Sobin (2007)
relies on several seminal studies that show that the amount of solar energy that the US receives is comparable to 500 times
its energy demands, and that about 0.4 per cent of its area (or 10 million acres) could provide all the electricity consumed
in the country using current PV technologies, in order to refute the myth that renewable energy can never meet the
electricity demand in the US. For the case of southern Africa, the number of PV modules is calculated that would be
needed to meet minimum household electricity requirements of 50kWh, 100kWh and 200kWh in each country, given its
average solar radiation resolved over a large area of the country. The calculation used to estimate the amount of
electricity from solar energy that can be generated from the land area available in each southern African country is
shown below for the case of Botswana.
The solar power that can be produced from a particular land area is given by:
𝑃𝑜𝑤𝑒𝑟 = 𝐴𝑟𝑒𝑎 ∗ 𝑆𝑎𝑣𝑔 ∗ 𝜂 (Hafemeister, 2007)
where∶
𝑆𝑎𝑣𝑔 = 𝐴𝑣𝑒𝑟𝑎𝑔𝑒 𝑠𝑜𝑙𝑎𝑟 𝑓𝑙𝑢𝑥 (𝑘𝑊
𝑚2 ) = 𝐴𝑣𝑔. 𝑠𝑜𝑙𝑎𝑟 𝑟𝑎𝑑𝑖𝑎𝑡𝑖𝑜𝑛 (𝑘𝑊ℎ
𝑚2𝑑𝑎𝑦) ∗ (
1 𝑑𝑎𝑦
24 ℎ)
𝜂 = 𝐸𝑓𝑓𝑖𝑐𝑖𝑒𝑛𝑐𝑦 𝑜𝑓 𝑆𝑜𝑙𝑎𝑟 𝑃𝑉 𝑐𝑒𝑙𝑙𝑠
𝐴𝑟𝑒𝑎 = 𝐿𝑎𝑛𝑑 𝑎𝑟𝑒𝑎 𝑖𝑛 𝑎 𝑔𝑖𝑣𝑒𝑛 𝑐𝑜𝑢𝑛𝑡𝑟𝑦 (𝑚2)
The solar energy produced in one year can then be calculated as:
𝐸𝑛𝑒𝑟𝑔𝑦 𝐺𝑒𝑛𝑒𝑟𝑎𝑡𝑒𝑑 = 𝑆𝑜𝑙𝑎𝑟 𝑃𝑜𝑤𝑒𝑟 ∗ 8,760 ℎ𝑜𝑢𝑟𝑠 = (𝐴𝑟𝑒𝑎 ∗ 𝑆𝑎𝑣𝑔 ∗ 𝜂) ∗ 8,760 ℎ𝑜𝑢𝑟𝑠
Thus, in one year in Botswana:
𝐸𝑛𝑒𝑟𝑔𝑦 𝐺𝑒𝑛𝑒𝑟𝑎𝑡𝑒𝑑 = [5.82 ∗ 1011𝑚2 ∗ (6.362𝑘𝑊ℎ
𝑚2𝑑𝑎𝑦∗
1 𝑑𝑎𝑦
24 ℎ𝑟𝑠) ∗ 0.15] ∗ 8,760 ℎ𝑟𝑠 = 1.29 ∗ 1015𝑘𝑊ℎ = 3.16 ∗ 107𝐺𝑊ℎ
This amount is about 5.2 million times the total amount generated (250GWh) in Botswana in 2012 (see Table 3). More
specifically, if that amount of 250GWh were to be generated from solar energy it would represent only 0.00002 per cent
(or 0.12km2) of the total land mass of the country. Depending on the country’s size and its electricity demand, there is a
wide variation in this hypothetical measure, wherein South Africa would need to dedicate the equivalent of 0.01 per cent
(or 122.1km2) of its land to solar energy, whereas Seychelles would need 0.14 per cent (or 0.64 km2).
The calculations that follow below are then used to estimate a more practical policy, that is, the amount of solar energy
that can be generated to meet the minimum monthly requirements of the Free Basic Electricity policy in South Africa,
which is applied to the entire region and hereby referred to as ‘Basic Electricity’ (BE). As explained in the introduction, it is
important to recall that this minimum requirement is not adequate for a typical household but, as in the centralised case,
it does ensure that households have access to electricity, after which they can increase their consumption to the extent
that they can afford to. Indigent households that are connected in this way will have to use non-electric sources for
heating and cooking, such as paraffin or LPG – the latter already widely used for cooking and heating even in wealthier
households.
Four sizes of polycrystalline PV modules are considered (50Wp, 100Wp, 150Wp, 250Wp), which are available on the market
and are suitable for use in Solar Home Systems (SHSs). The number of panels of each type that would be needed to meet
the three possible minimum levels of electrification is then calculated. As Swaziland’s annual solar insolation is very close
to the regional average for SADC countries, that country’s data for the purpose of demonstration is used. The results are
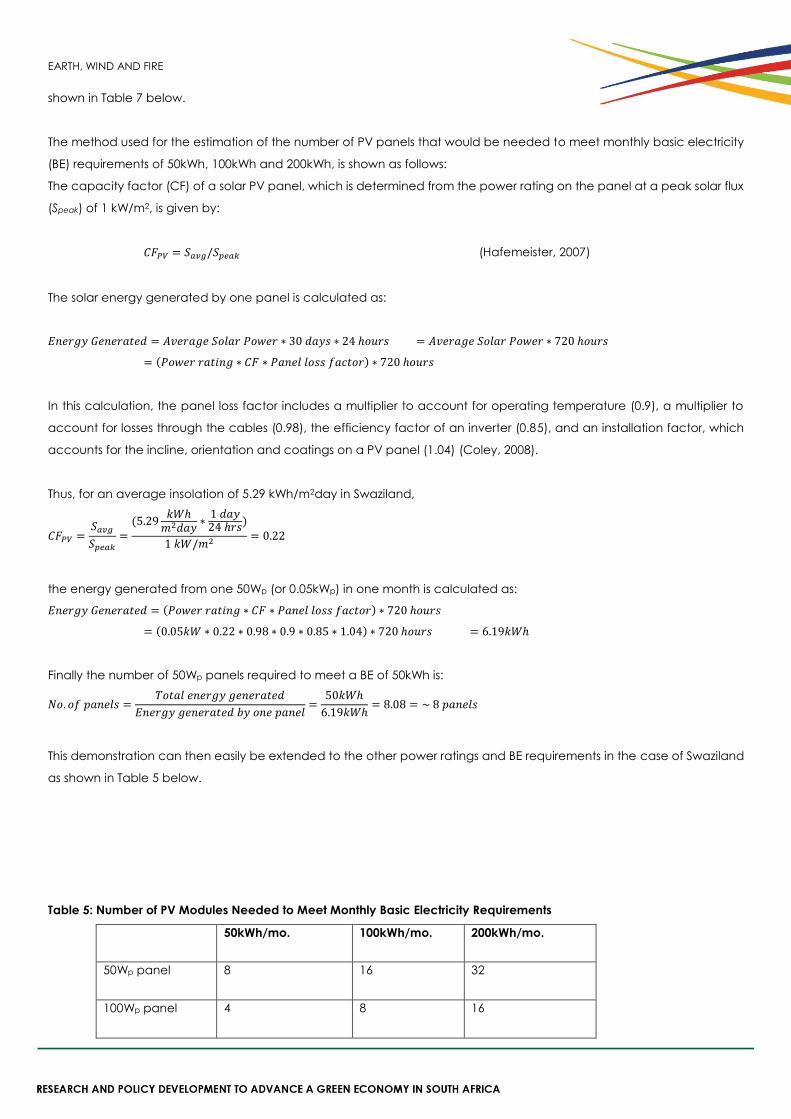
EARTH, WIND AND FIRE
shown in Table 7 below.
The method used for the estimation of the number of PV panels that would be needed to meet monthly basic electricity
(BE) requirements of 50kWh, 100kWh and 200kWh, is shown as follows:
The capacity factor (CF) of a solar PV panel, which is determined from the power rating on the panel at a peak solar flux
(Speak) of 1 kW/m2, is given by:
𝐶𝐹𝑃𝑉 = 𝑆𝑎𝑣𝑔/𝑆𝑝𝑒𝑎𝑘 (Hafemeister, 2007)
The solar energy generated by one panel is calculated as:
𝐸𝑛𝑒𝑟𝑔𝑦 𝐺𝑒𝑛𝑒𝑟𝑎𝑡𝑒𝑑 = 𝐴𝑣𝑒𝑟𝑎𝑔𝑒 𝑆𝑜𝑙𝑎𝑟 𝑃𝑜𝑤𝑒𝑟 ∗ 30 𝑑𝑎𝑦𝑠 ∗ 24 ℎ𝑜𝑢𝑟𝑠 = 𝐴𝑣𝑒𝑟𝑎𝑔𝑒 𝑆𝑜𝑙𝑎𝑟 𝑃𝑜𝑤𝑒𝑟 ∗ 720 ℎ𝑜𝑢𝑟𝑠
= (𝑃𝑜𝑤𝑒𝑟 𝑟𝑎𝑡𝑖𝑛𝑔 ∗ 𝐶𝐹 ∗ 𝑃𝑎𝑛𝑒𝑙 𝑙𝑜𝑠𝑠 𝑓𝑎𝑐𝑡𝑜𝑟) ∗ 720 ℎ𝑜𝑢𝑟𝑠
In this calculation, the panel loss factor includes a multiplier to account for operating temperature (0.9), a multiplier to
account for losses through the cables (0.98), the efficiency factor of an inverter (0.85), and an installation factor, which
accounts for the incline, orientation and coatings on a PV panel (1.04) (Coley, 2008).
Thus, for an average insolation of 5.29 kWh/m2day in Swaziland,
𝐶𝐹𝑃𝑉 =𝑆𝑎𝑣𝑔
𝑆𝑝𝑒𝑎𝑘=
(5.29𝑘𝑊ℎ
𝑚2𝑑𝑎𝑦∗
1 𝑑𝑎𝑦24 ℎ𝑟𝑠
)
1 𝑘𝑊/𝑚2 = 0.22
the energy generated from one 50Wp (or 0.05kWp) in one month is calculated as:
𝐸𝑛𝑒𝑟𝑔𝑦 𝐺𝑒𝑛𝑒𝑟𝑎𝑡𝑒𝑑 = (𝑃𝑜𝑤𝑒𝑟 𝑟𝑎𝑡𝑖𝑛𝑔 ∗ 𝐶𝐹 ∗ 𝑃𝑎𝑛𝑒𝑙 𝑙𝑜𝑠𝑠 𝑓𝑎𝑐𝑡𝑜𝑟) ∗ 720 ℎ𝑜𝑢𝑟𝑠
= (0.05𝑘𝑊 ∗ 0.22 ∗ 0.98 ∗ 0.9 ∗ 0.85 ∗ 1.04) ∗ 720 ℎ𝑜𝑢𝑟𝑠 = 6.19𝑘𝑊ℎ
Finally the number of 50Wp panels required to meet a BE of 50kWh is:
𝑁𝑜. 𝑜𝑓 𝑝𝑎𝑛𝑒𝑙𝑠 =𝑇𝑜𝑡𝑎𝑙 𝑒𝑛𝑒𝑟𝑔𝑦 𝑔𝑒𝑛𝑒𝑟𝑎𝑡𝑒𝑑
𝐸𝑛𝑒𝑟𝑔𝑦 𝑔𝑒𝑛𝑒𝑟𝑎𝑡𝑒𝑑 𝑏𝑦 𝑜𝑛𝑒 𝑝𝑎𝑛𝑒𝑙=
50𝑘𝑊ℎ
6.19𝑘𝑊ℎ= 8.08 = ~ 8 𝑝𝑎𝑛𝑒𝑙𝑠
This demonstration can then easily be extended to the other power ratings and BE requirements in the case of Swaziland
as shown in Table 5 below.
Table 5: Number of PV Modules Needed to Meet Monthly Basic Electricity Requirements
50kWh/mo. 100kWh/mo. 200kWh/mo.
50Wp panel 8 16 32
100Wp panel 4 8 16
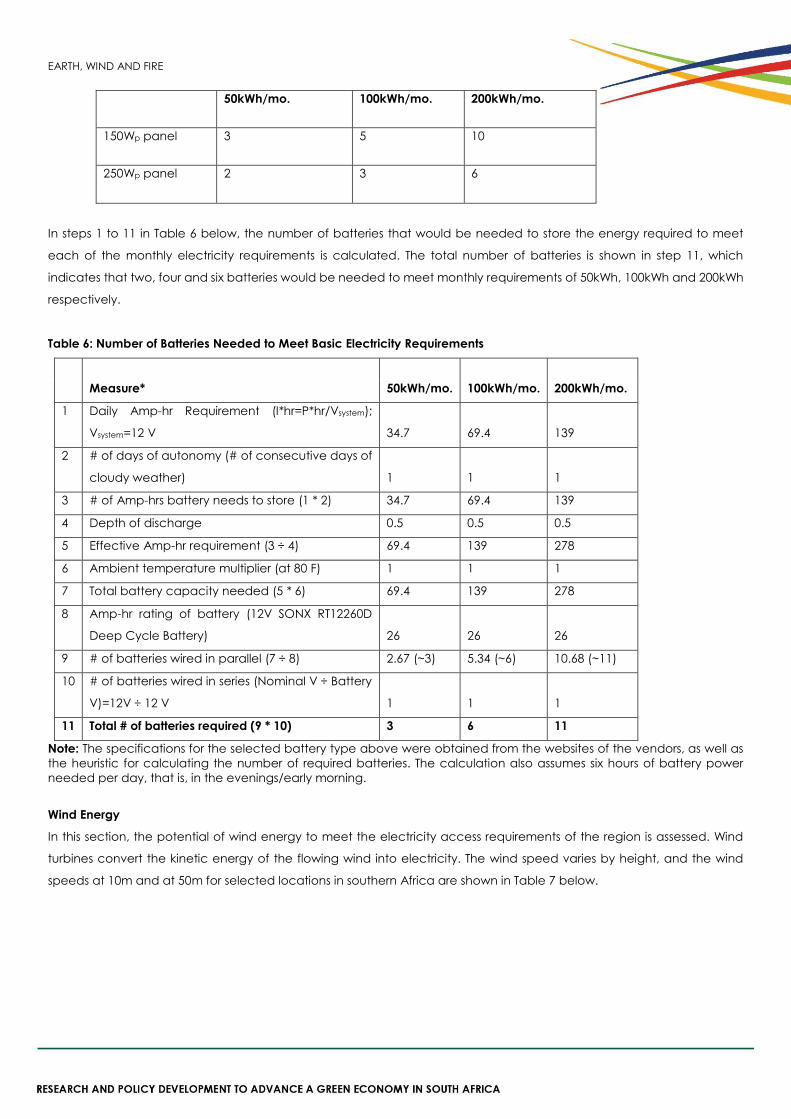
EARTH, WIND AND FIRE
50kWh/mo. 100kWh/mo. 200kWh/mo.
150Wp panel 3 5 10
250Wp panel 2 3 6
In steps 1 to 11 in Table 6 below, the number of batteries that would be needed to store the energy required to meet
each of the monthly electricity requirements is calculated. The total number of batteries is shown in step 11, which
indicates that two, four and six batteries would be needed to meet monthly requirements of 50kWh, 100kWh and 200kWh
respectively.
Table 6: Number of Batteries Needed to Meet Basic Electricity Requirements
Measure* 50kWh/mo. 100kWh/mo. 200kWh/mo.
1 Daily Amp-hr Requirement (I*hr=P*hr/Vsystem);
Vsystem=12 V 34.7 69.4 139
2 # of days of autonomy (# of consecutive days of
cloudy weather) 1 1 1
3 # of Amp-hrs battery needs to store (1 * 2) 34.7 69.4 139
4 Depth of discharge 0.5 0.5 0.5
5 Effective Amp-hr requirement (3 ÷ 4) 69.4 139 278
6 Ambient temperature multiplier (at 80 F) 1 1 1
7 Total battery capacity needed (5 * 6) 69.4 139 278
8 Amp-hr rating of battery (12V SONX RT12260D
Deep Cycle Battery) 26 26 26
9 # of batteries wired in parallel (7 ÷ 8) 2.67 (~3) 5.34 (~6) 10.68 (~11)
10 # of batteries wired in series (Nominal V ÷ Battery
V)=12V ÷ 12 V 1 1 1
11 Total # of batteries required (9 * 10) 3 6 11
Note: The specifications for the selected battery type above were obtained from the websites of the vendors, as well as
the heuristic for calculating the number of required batteries. The calculation also assumes six hours of battery power
needed per day, that is, in the evenings/early morning.
Wind Energy
In this section, the potential of wind energy to meet the electricity access requirements of the region is assessed. Wind
turbines convert the kinetic energy of the flowing wind into electricity. The wind speed varies by height, and the wind
speeds at 10m and at 50m for selected locations in southern Africa are shown in Table 7 below.
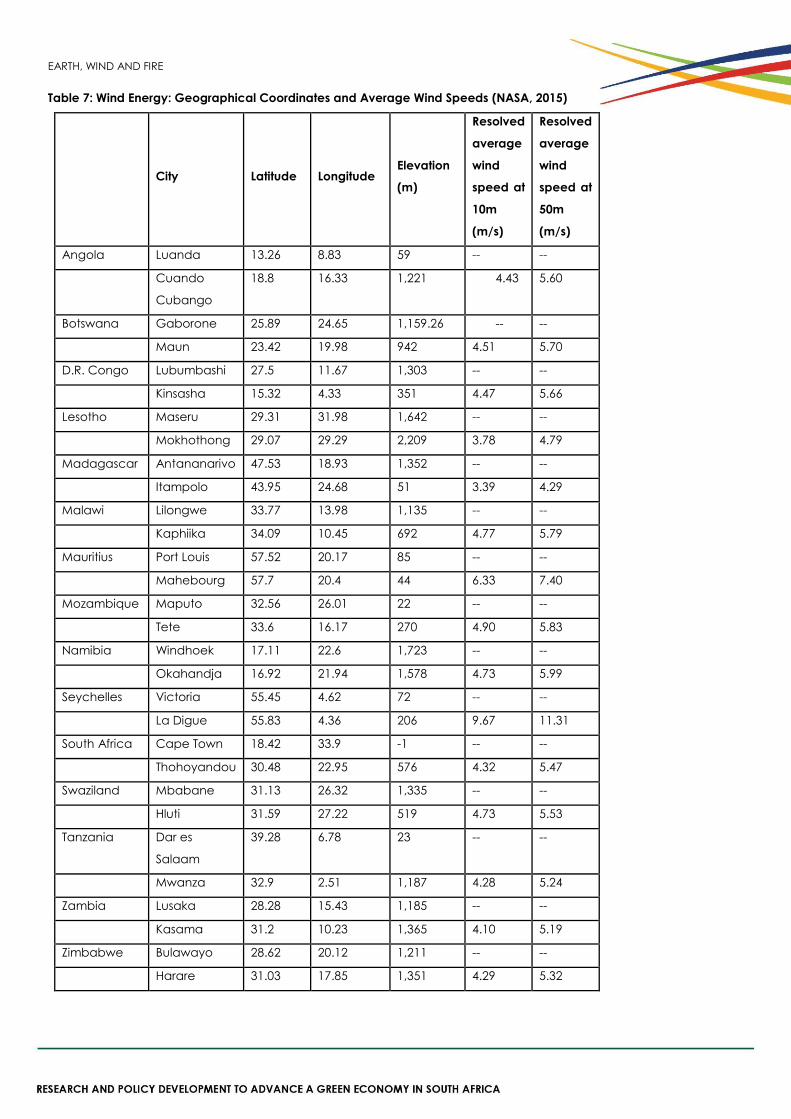
EARTH, WIND AND FIRE
Table 7: Wind Energy: Geographical Coordinates and Average Wind Speeds (NASA, 2015)
City Latitude Longitude Elevation
(m)
Resolved
average
wind
speed at
10m
(m/s)
Resolved
average
wind
speed at
50m
(m/s)
Angola Luanda 13.26 8.83 59 -- --
Cuando
Cubango
18.8 16.33 1,221 4.43 5.60
Botswana Gaborone 25.89 24.65 1,159.26 -- --
Maun 23.42 19.98 942 4.51 5.70
D.R. Congo Lubumbashi 27.5 11.67 1,303 -- --
Kinsasha 15.32 4.33 351 4.47 5.66
Lesotho Maseru 29.31 31.98 1,642 -- --
Mokhothong 29.07 29.29 2,209 3.78 4.79
Madagascar Antananarivo 47.53 18.93 1,352 -- --
Itampolo 43.95 24.68 51 3.39 4.29
Malawi Lilongwe 33.77 13.98 1,135 -- --
Kaphiika 34.09 10.45 692 4.77 5.79
Mauritius Port Louis 57.52 20.17 85 -- --
Mahebourg 57.7 20.4 44 6.33 7.40
Mozambique Maputo 32.56 26.01 22 -- --
Tete 33.6 16.17 270 4.90 5.83
Namibia Windhoek 17.11 22.6 1,723 -- --
Okahandja 16.92 21.94 1,578 4.73 5.99
Seychelles Victoria 55.45 4.62 72 -- --
La Digue 55.83 4.36 206 9.67 11.31
South Africa Cape Town 18.42 33.9 -1 -- --
Thohoyandou 30.48 22.95 576 4.32 5.47
Swaziland Mbabane 31.13 26.32 1,335 -- --
Hluti 31.59 27.22 519 4.73 5.53
Tanzania Dar es
Salaam
39.28 6.78 23 -- --
Mwanza 32.9 2.51 1,187 4.28 5.24
Zambia Lusaka 28.28 15.43 1,185 -- --
Kasama 31.2 10.23 1,365 4.10 5.19
Zimbabwe Bulawayo 28.62 20.12 1,211 -- --
Harare 31.03 17.85 1,351 4.29 5.32
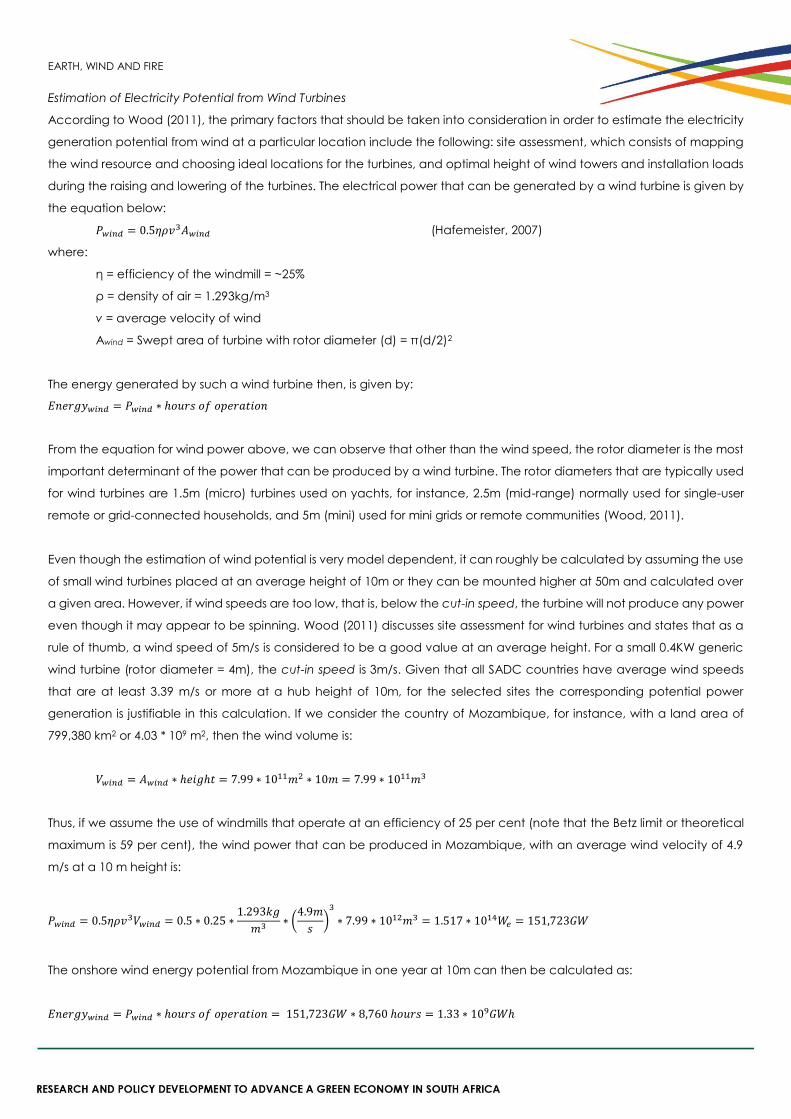
EARTH, WIND AND FIRE
Estimation of Electricity Potential from Wind Turbines
According to Wood (2011), the primary factors that should be taken into consideration in order to estimate the electricity
generation potential from wind at a particular location include the following: site assessment, which consists of mapping
the wind resource and choosing ideal locations for the turbines, and optimal height of wind towers and installation loads
during the raising and lowering of the turbines. The electrical power that can be generated by a wind turbine is given by
the equation below:
𝑃𝑤𝑖𝑛𝑑 = 0.5𝜂𝜌𝑣3𝐴𝑤𝑖𝑛𝑑 (Hafemeister, 2007)
where:
η = efficiency of the windmill = ~25%
ρ = density of air = 1.293kg/m3
v = average velocity of wind
Awind = Swept area of turbine with rotor diameter (d) = π(d/2)2
The energy generated by such a wind turbine then, is given by:
𝐸𝑛𝑒𝑟𝑔𝑦𝑤𝑖𝑛𝑑 = 𝑃𝑤𝑖𝑛𝑑 ∗ ℎ𝑜𝑢𝑟𝑠 𝑜𝑓 𝑜𝑝𝑒𝑟𝑎𝑡𝑖𝑜𝑛
From the equation for wind power above, we can observe that other than the wind speed, the rotor diameter is the most
important determinant of the power that can be produced by a wind turbine. The rotor diameters that are typically used
for wind turbines are 1.5m (micro) turbines used on yachts, for instance, 2.5m (mid-range) normally used for single-user
remote or grid-connected households, and 5m (mini) used for mini grids or remote communities (Wood, 2011).
Even though the estimation of wind potential is very model dependent, it can roughly be calculated by assuming the use
of small wind turbines placed at an average height of 10m or they can be mounted higher at 50m and calculated over
a given area. However, if wind speeds are too low, that is, below the cut-in speed, the turbine will not produce any power
even though it may appear to be spinning. Wood (2011) discusses site assessment for wind turbines and states that as a
rule of thumb, a wind speed of 5m/s is considered to be a good value at an average height. For a small 0.4KW generic
wind turbine (rotor diameter = 4m), the cut-in speed is 3m/s. Given that all SADC countries have average wind speeds
that are at least 3.39 m/s or more at a hub height of 10m, for the selected sites the corresponding potential power
generation is justifiable in this calculation. If we consider the country of Mozambique, for instance, with a land area of
799,380 km2 or 4.03 * 109 m2, then the wind volume is:
𝑉𝑤𝑖𝑛𝑑 = 𝐴𝑤𝑖𝑛𝑑 ∗ ℎ𝑒𝑖𝑔ℎ𝑡 = 7.99 ∗ 1011𝑚2 ∗ 10𝑚 = 7.99 ∗ 1011𝑚3
Thus, if we assume the use of windmills that operate at an efficiency of 25 per cent (note that the Betz limit or theoretical
maximum is 59 per cent), the wind power that can be produced in Mozambique, with an average wind velocity of 4.9
m/s at a 10 m height is:
𝑃𝑤𝑖𝑛𝑑 = 0.5𝜂𝜌𝑣3𝑉𝑤𝑖𝑛𝑑 = 0.5 ∗ 0.25 ∗1.293𝑘𝑔
𝑚3 ∗ (4.9𝑚
𝑠)
3
∗ 7.99 ∗ 1012𝑚3 = 1.517 ∗ 1014𝑊𝑒 = 151,723𝐺𝑊
The onshore wind energy potential from Mozambique in one year at 10m can then be calculated as:
𝐸𝑛𝑒𝑟𝑔𝑦𝑤𝑖𝑛𝑑 = 𝑃𝑤𝑖𝑛𝑑 ∗ ℎ𝑜𝑢𝑟𝑠 𝑜𝑓 𝑜𝑝𝑒𝑟𝑎𝑡𝑖𝑜𝑛 = 151,723𝐺𝑊 ∗ 8,760 ℎ𝑜𝑢𝑟𝑠 = 1.33 ∗ 109𝐺𝑊ℎ

EARTH, WIND AND FIRE
At 50m, where the wind speed is 5.83m/s, the wind energy potential from Mozambique would be equal to 1.12 * 1010
GWh, which is higher by an order of magnitude.
At 10m, the wind energy potential is about 87,636 times the met demand of 15,166GWh in Mozambique, while at 50m it
is about 739,765 times the demand. As with the solar energy resource in the previous section, the analysis above shows
that there is also a sufficient wind energy resource to meet the electricity needs of the region in principle. More specifically,
the amount of land that is needed to produce Mozambique’s current electricity generated is 0.001% (or 7.99km2) at a
height of 10m and 0.0001% (0.8km2) at a height of 50m.
In order to demonstrate the consumption of this energy resource in practice, the three Basic Electricity (BE) scenarios of
50kWh/month, 100kWh/month and 200kWh/month as in the previous section are used, and how the small wind turbine
rotor dimensions of 1.5m, 2.5m, and 5m could meet this demand is estimated. For a wind turbine with a rotor diameter of
2.5m, for example, the electricity produced in Mozambique with an average annual wind speed of 4.9m/s at 10m is:
𝑃𝑤𝑖𝑛𝑑 = 0.5𝜂𝜌𝑣3𝐴𝑤𝑖𝑛𝑑 = 0.5𝜂𝜌𝑣3𝜋(𝑑
2)2 = 0.5 ∗ .25 ∗
1.293𝑘𝑔
𝑚3∗ (
4.9𝑚
𝑠)
3
∗ 𝜋 (2.5𝑚
2)
2
= 93.168𝑊𝑒
The energy that can be generated in one month is then calculated as:
𝐸𝑛𝑒𝑟𝑔𝑦𝑤𝑖𝑛𝑑 = 𝑃𝑤𝑖𝑛𝑑 ∗ ℎ𝑜𝑢𝑟𝑠 𝑜𝑓 𝑜𝑝𝑒𝑟𝑎𝑡𝑖𝑜𝑛 = 93.168 𝑊𝑒 ∗ 30 𝑑𝑎𝑦𝑠 ∗ 24 ℎ𝑜𝑢𝑟𝑠 = 67,081𝑊ℎ = 67.081𝑘𝑊ℎ
Thus, the number of turbines needed to meet a BE of 50 kWh per month is:
𝑁𝑜. 𝑜𝑓 𝑡𝑢𝑟𝑏𝑖𝑛𝑒𝑠 =𝑇𝑜𝑡𝑎𝑙 𝑒𝑛𝑒𝑟𝑔𝑦 𝑔𝑒𝑛𝑒𝑟𝑎𝑡𝑒𝑑
𝐸𝑛𝑒𝑟𝑔𝑦 𝑔𝑒𝑛𝑒𝑟𝑎𝑡𝑒𝑑 𝑏𝑦 𝑜𝑛𝑒 𝑡𝑢𝑟𝑏𝑖𝑛𝑒=
50𝑘𝑊ℎ
67.081𝑘𝑊ℎ= 0.54 = ~ 1 𝑡𝑢𝑟𝑏𝑖𝑛𝑒
This calculation is extended to the other rotor diameters and for all the BE requirements for southern Africa as a whole and
the results are shown in Table 12 below. The number of batteries needed to meet the BE requirements is approximately
the same as that shown in Table 8. Thus, two, four and six batteries are needed in combination with the turbines to produce
BE requirements of 50kWh, 100kWh and 200kWh respectively.
Table 8: Number of Wind Turbines per Household Needed to Produce Minimum Electricity Requirements
BE = 50kWh/mo. BE = 100kWh/mo. BE = 200kWh/mo.
1.5m turbine 2 3 6
2.5m turbine 1 1 2
5m turbine 1 1 1
The analyses above have revealed some of the technology and resource combinations by which solar and wind energy
could increase energy access and meet minimum basic electricity requirements in southern Africa. The amount of energy
that would need to be generated for each country to meet the minimum monthly basic electricity requirements per
household of its non-electrified population is then estimated. The comparison between this energy needed to meet the
minimum B.E. requirements and the actual energy generated is shown in Table 9 below. It is evident from the table that,
for the countries with low electricity access rates, more energy is required to meet the minimum B.E. of 50kWh a month
than the current energy generated by those countries. Ideally, this should be done through renewable energy to reduce
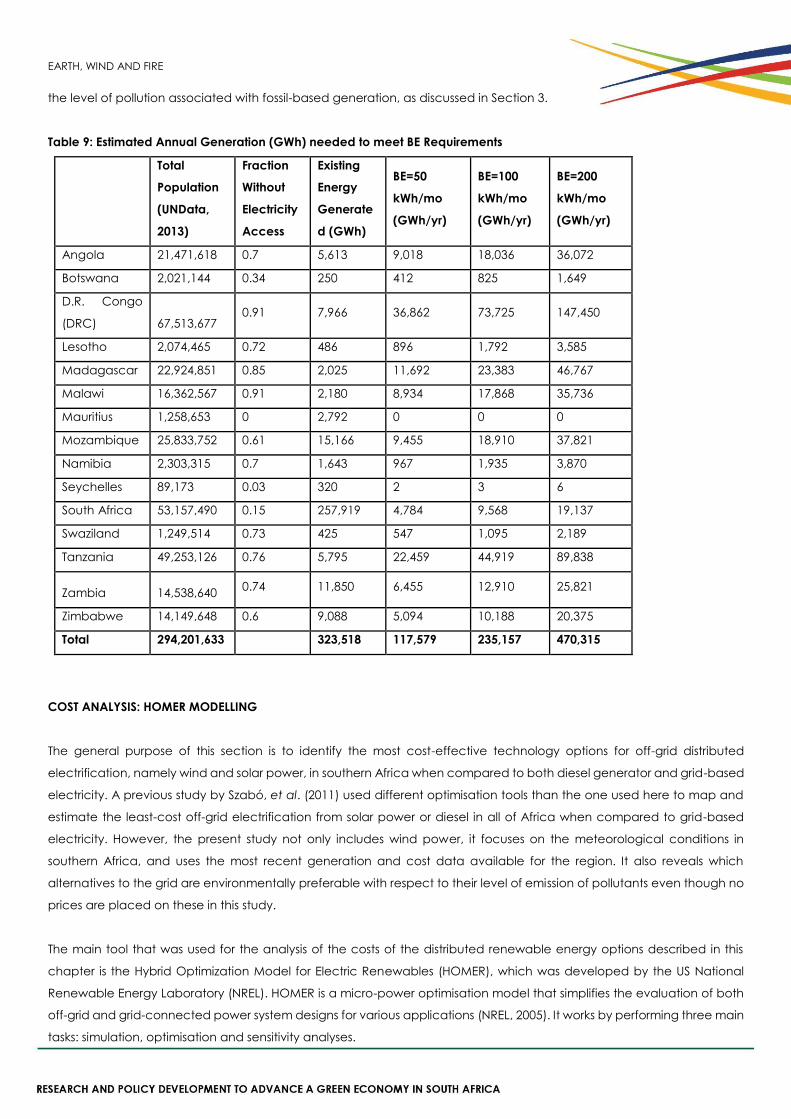
EARTH, WIND AND FIRE
the level of pollution associated with fossil-based generation, as discussed in Section 3.
Table 9: Estimated Annual Generation (GWh) needed to meet BE Requirements
Total
Population
(UNData,
2013)
Fraction
Without
Electricity
Access
Existing
Energy
Generate
d (GWh)
BE=50
kWh/mo
(GWh/yr)
BE=100
kWh/mo
(GWh/yr)
BE=200
kWh/mo
(GWh/yr)
Angola 21,471,618 0.7 5,613 9,018 18,036 36,072
Botswana 2,021,144 0.34 250 412 825 1,649
D.R. Congo
(DRC) 67,513,677 0.91 7,966 36,862 73,725 147,450
Lesotho 2,074,465 0.72 486 896 1,792 3,585
Madagascar 22,924,851 0.85 2,025 11,692 23,383 46,767
Malawi 16,362,567 0.91 2,180 8,934 17,868 35,736
Mauritius 1,258,653 0 2,792 0 0 0
Mozambique 25,833,752 0.61 15,166 9,455 18,910 37,821
Namibia 2,303,315 0.7 1,643 967 1,935 3,870
Seychelles 89,173 0.03 320 2 3 6
South Africa 53,157,490 0.15 257,919 4,784 9,568 19,137
Swaziland 1,249,514 0.73 425 547 1,095 2,189
Tanzania 49,253,126 0.76 5,795 22,459 44,919 89,838
Zambia 14,538,640 0.74 11,850 6,455 12,910 25,821
Zimbabwe 14,149,648 0.6 9,088 5,094 10,188 20,375
Total 294,201,633 323,518 117,579 235,157 470,315
COST ANALYSIS: HOMER MODELLING
The general purpose of this section is to identify the most cost-effective technology options for off-grid distributed
electrification, namely wind and solar power, in southern Africa when compared to both diesel generator and grid-based
electricity. A previous study by Szabó, et al. (2011) used different optimisation tools than the one used here to map and
estimate the least-cost off-grid electrification from solar power or diesel in all of Africa when compared to grid-based
electricity. However, the present study not only includes wind power, it focuses on the meteorological conditions in
southern Africa, and uses the most recent generation and cost data available for the region. It also reveals which
alternatives to the grid are environmentally preferable with respect to their level of emission of pollutants even though no
prices are placed on these in this study.
The main tool that was used for the analysis of the costs of the distributed renewable energy options described in this
chapter is the Hybrid Optimization Model for Electric Renewables (HOMER), which was developed by the US National
Renewable Energy Laboratory (NREL). HOMER is a micro-power optimisation model that simplifies the evaluation of both
off-grid and grid-connected power system designs for various applications (NREL, 2005). It works by performing three main
tasks: simulation, optimisation and sensitivity analyses.
EARTH, WIND AND FIRE
The software first simulates the operation of a given system configuration by making energy balance calculations for each
of the 8,760 hours in the year, and then determines whether the configuration is possible. It does this by verifying whether
it can meet the electric demand under specified conditions and by estimating the installation and operating costs over
the lifetime of the project, which include capital costs, replacement costs, operation and maintenance costs, fuel and
interest. HOMER optimises the system by simulating all its possible configurations and displays them as a list of the lowest
to the highest net present cost, which it also defined as the life cycle cost, in order to compare different design
alternatives. The software also performs a sensitivity analysis by repeating the optimisation process for each sensitivity
variable that is specified, such as a range of wind speeds or a range of diesel prices.
The cost analysis in this section evaluates four scenarios as follows: 1) Diesel only; 2) Solar power versus diesel; 3) Wind
power versus diesel; 4) Hybrid solar-wind power versus diesel. The analyses that are presented in this section include a
description of all the technology and cost assumptions that are made, a display of the net present cost (life cycle cost)
of the optimised technology options, the levelised cost of electricity for each energy resource, and a display of the
emissions released by each of the resource options. The rand costs of components and fuels in South Africa are relied on
since these are available online (Sustainable.co.za, 2015) and because that is the currency that the SAPP uses in its
analyses. Thus, it is assumed that the results presented can be generalised for the SADC region in terms of purchasing
power parity (PPP).
Table 10: Technical Specifications and Costs of Selected Components of Energy Systems
Capacity Capital Costs Fuel Costs Lifetime
Solar PV 250W R3,009 R0 20 years
Wind turbine 400kW R16,006 R0 15 years
Diesel
Generator
4kW R25,400 R11.318/L 15,000 hrs
Deep Cycle
Battery
12V, 26 Amp-
hr
R743 N/A 5 years
Inverter 12V, 150W R389 N/A 12 r
s
Simulation
A sample schematic of the solar-wind-diesel hybrid scenario that was conducted in HOMER is shown in Figure 2 below
where Generator 1 represents the diesel generator, and the primary load represents a basic electricity load of
200kWh/month (or 6.7kWh/d). The icon with ‘S6CS25P’ label represents a deep-cycle battery, while the icons under
‘Resources’ allow the modeller to import characteristics such as average daily wind speed for every month of the year,
the average daily solar radiation per month, modify the average daily amount of biomass used per month (tonnes/day)
and the average price of the biomass used ($/tonne), and enter the average fuel price ($/L) in the case of diesel.
For the icons under ‘Other’, the user can modify parameters such as the annual real interest rate (for which 6 per cent is
used here), the project lifetime, and/or the system capital and O&M costs. A converter icon is also shown because the
diesel generator runs on electricity in an Alternating Current (AC) form, while the wind and solar generators run on a Direct
Current (DC), which requires a converter in the form of an inverter (to convert DC to AC) or what is generically called a
‘converter’ to convert AC to DC. However, if household devices use a type of current that is the same as that of the
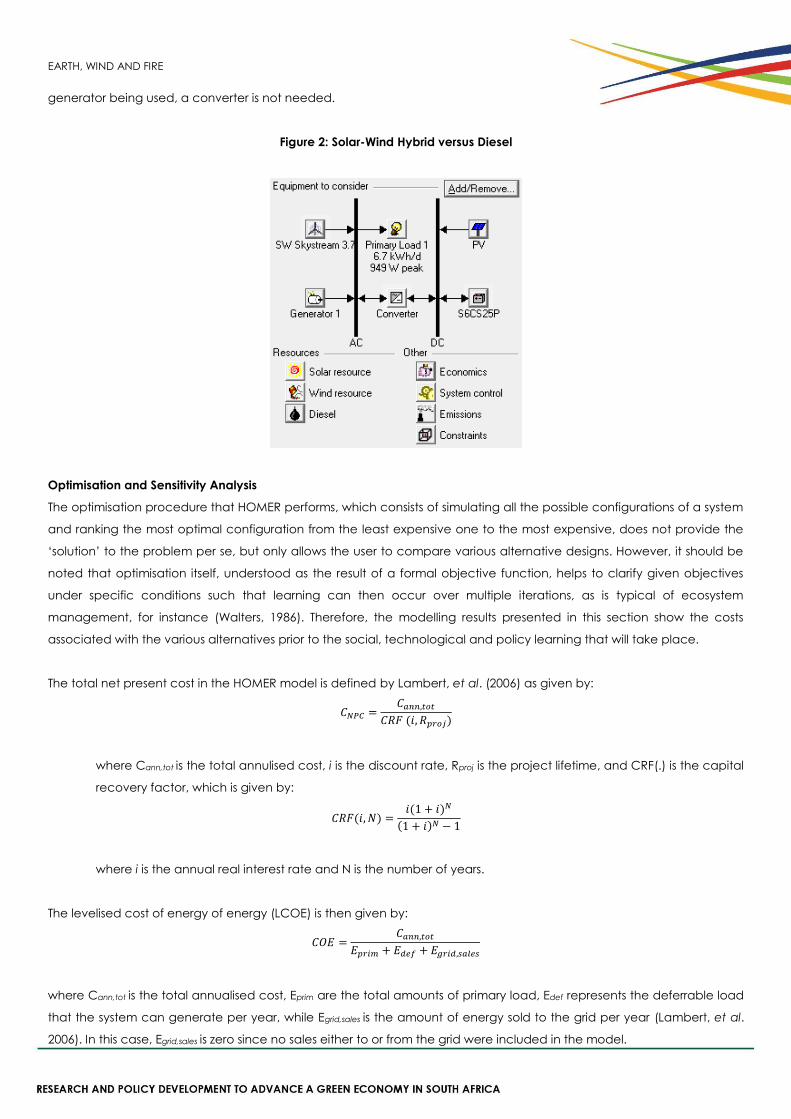
EARTH, WIND AND FIRE
generator being used, a converter is not needed.
Figure 2: Solar-Wind Hybrid versus Diesel
Optimisation and Sensitivity Analysis
The optimisation procedure that HOMER performs, which consists of simulating all the possible configurations of a system
and ranking the most optimal configuration from the least expensive one to the most expensive, does not provide the
‘solution’ to the problem per se, but only allows the user to compare various alternative designs. However, it should be
noted that optimisation itself, understood as the result of a formal objective function, helps to clarify given objectives
under specific conditions such that learning can then occur over multiple iterations, as is typical of ecosystem
management, for instance (Walters, 1986). Therefore, the modelling results presented in this section show the costs
associated with the various alternatives prior to the social, technological and policy learning that will take place.
The total net present cost in the HOMER model is defined by Lambert, et al. (2006) as given by:
𝐶𝑁𝑃𝐶 =𝐶𝑎𝑛𝑛,𝑡𝑜𝑡
𝐶𝑅𝐹 (𝑖, 𝑅𝑝𝑟𝑜𝑗)
where Cann,tot is the total annulised cost, i is the discount rate, Rproj is the project lifetime, and CRF(.) is the capital
recovery factor, which is given by:
𝐶𝑅𝐹(𝑖, 𝑁) =𝑖(1 + 𝑖)𝑁
(1 + 𝑖)𝑁 − 1
where i is the annual real interest rate and N is the number of years.
The levelised cost of energy of energy (LCOE) is then given by:
𝐶𝑂𝐸 =𝐶𝑎𝑛𝑛,𝑡𝑜𝑡
𝐸𝑝𝑟𝑖𝑚 + 𝐸𝑑𝑒𝑓 + 𝐸𝑔𝑟𝑖𝑑,𝑠𝑎𝑙𝑒𝑠
where Cann,tot is the total annualised cost, Eprim are the total amounts of primary load, Edef represents the deferrable load
that the system can generate per year, while Egrid,sales is the amount of energy sold to the grid per year (Lambert, et al.
2006). In this case, Egrid,sales is zero since no sales either to or from the grid were included in the model.
EARTH, WIND AND FIRE
The results of the optimisation for each set of loads, for example, 50kWh/month basic electricity requirement
(1.67kWh/day), while the sensitivity analysis runs the optimisation procedure again for 100kWh/month, 200kWh/month,
400kWh/month and 800kWh/month as shown in Tables 12 to 15 below for all four scenarios. The sensitivity analysis feature
in HOMER most closely models the concept of component sizing, which has been used in this chapter to capture the
possibility of gradually and adaptively building up electricity generation infrastructure. Thus, the main purpose of the
sensitivity analysis was to determine what combination of the components could produce the daily equivalent of the
monthly primary loads of 50kWh, 100kWh, 200kWh, 400kWh and 800kWh, and to subsequently observe the evolution of
the levelised cost of electricity (LCOE) with an increase in consumption.
In Table 11 below, for the diesel-only scenario, the labels in order are as follows: The Diesel (kW) tab represents the installed
capacity of the diesel generator, followed by the initial capital required to install it, the operating costs per year, the total
Net Present Cost (NPC) or life cycle cost, the levelised cost of electricity (LCOE), and the fraction of renewable energy in
the resource used.
Tables 12, 13 and 14 also show the components of the PV and wind turbine systems, and display the net present costs of
all the feasible configurations.
Table 11: Diesel only
Pri. Load
(kWh/d)
Diesel
(kW)
Initial
capital
Operating
cost (R/yr)
Total NPC LCOE
(R/kWh)
Renewable
fraction
1.667 0.65 R4,128 12,154 R159,492 20.51 0
3.333 0.65 R4,128 12,154 R159,492 10.26 0
6.667 0.65 R4,128 14,181 R185,409 5.96 0
13.333 0.65 R4,128 20,981 R272,337 4.38 0
20 1.3 R8,255 35,160 R457,723 4.91 0
26.667 1.3 R8,255 41,966 R544,721 4.38 0
Table 12: Solar power versus diesel
Pri. Load
(kWh/mo)
PV (kW) Diesel
(kW)
Initial
capital
Total NPC LCOE
(R/kWh)
Renewable
fraction
50 0.5 0.65 R14,993 R20,707 2.66 0.93
100 1 0.65 R21,011 R31,421 2.02 0.92
200 2 0.65 R33,047 R53,952 1.73 0.92
400 5 0.65 R73,613 R100,134 1.61 0.97
600 5 1.3 R77,740 R157,816 1.69 0.87
800 10 1.3 R146,836 R199,749 1.61 0.97
Table 13: Wind power versus diesel
Pri. Load 1
(kWh/d)
Wind
turbine
Diesel
(kW)
Initial
capital Total NPC
LCOE
(R/kWh)
Renewable
fraction
EARTH, WIND AND FIRE
50 1 0.65 R24,981 R70,352 9.05 0.14
100 1 0.65 R24,981 R113,904 7.32 0.07
200 1 0.65 R24,981 R187,547 6.03 0.04
400 1 0.65 R24,981 R297,474 4.78 0.02
600 1 1.3 R29,108 R472,259 5.06 0.01
800 1 1.3 R29,108 R569,826 4.58 0.01
Table 14: Solar-Wind hybrid power versus diesel
Pri. Load
(kWh/d)
PV
(kW)
Diesel
(kW)
Initial
capital
Total NPC LCOE
(R/kWh)
Renewable
fraction
50 0.5 0 R26,871 R35,628 4.58 1
100 1 0.65 R37,017 R50,314 3.24 0.95
200 2 0.65 R49,053 R71,628 2.30 0.94
400 5 0.65 R89,619 R120,528 1.94 0.97
600 5 1.3 R93,746 R177,852 1.91 0.87
800 10 1.3 R162,842 R220,011 1.77 0.97
The tables above show that the levelised cost of electricity (LCOE) is reduced as consumption increases. This demonstrates
that the economies of scale are clearly beneficial over the life cycle of the respective energy generation technologies.
However, only the solar-diesel scenario shows a significant uptake of the renewable energy component (minimum 87 per
cent, maximum 97 per cent). The wind-diesel scenario still relies on diesel to keep the cost at a minimum, while the solar-
wind-diesel scenario also primarily relies on solar power to keep the cost at a minimum. Thus, over the average area of
the various countries modelled, solar power is the most cost-effective resource across the region. What this suggests is
that, outside of specifically well-resourced areas with respect to wind energy, household residents are not likely to benefit
from this resource as much as solar, which is virtually ubiquitous in the region. Table 15 and Figure 3 below show the
evolution of the cost of electricity for the four hybrid scenarios with increased consumption.
Table 15: Levelised Cost of Electricity (LCOE) across Four Hybrid Scenarios
Primary
Load (kWh)
Diesel
(R/kWh) Solar-diesel
(R/kWh)
Wind-diesel
(R/kWh)
Solar-wind-
diesel
(R/kWh)
50
20.5
(0.00)
2.66
(0.93)
9.05
(0.14)
4.58
(1.00)
100
10.27
(0.00)
2.02
(0.92)
7.32
(0.07)
3.24
(0. 95)
200
5.96
(0.00)
1.73
(0.92)
6.03
(0.04)
2.30
(0. 94)
400
4.39
(0.00)
1.61
(0.97)
4.78
(0.02)
1.94
(0. 97)
600
4.91
(0.00)
1.69
(0.87)
5.06
(0.01)
1.91
(0.87)
800
4.38
(0.00)
1.61
(0.97)
4.58
(0.01)
1.77
(0.97)
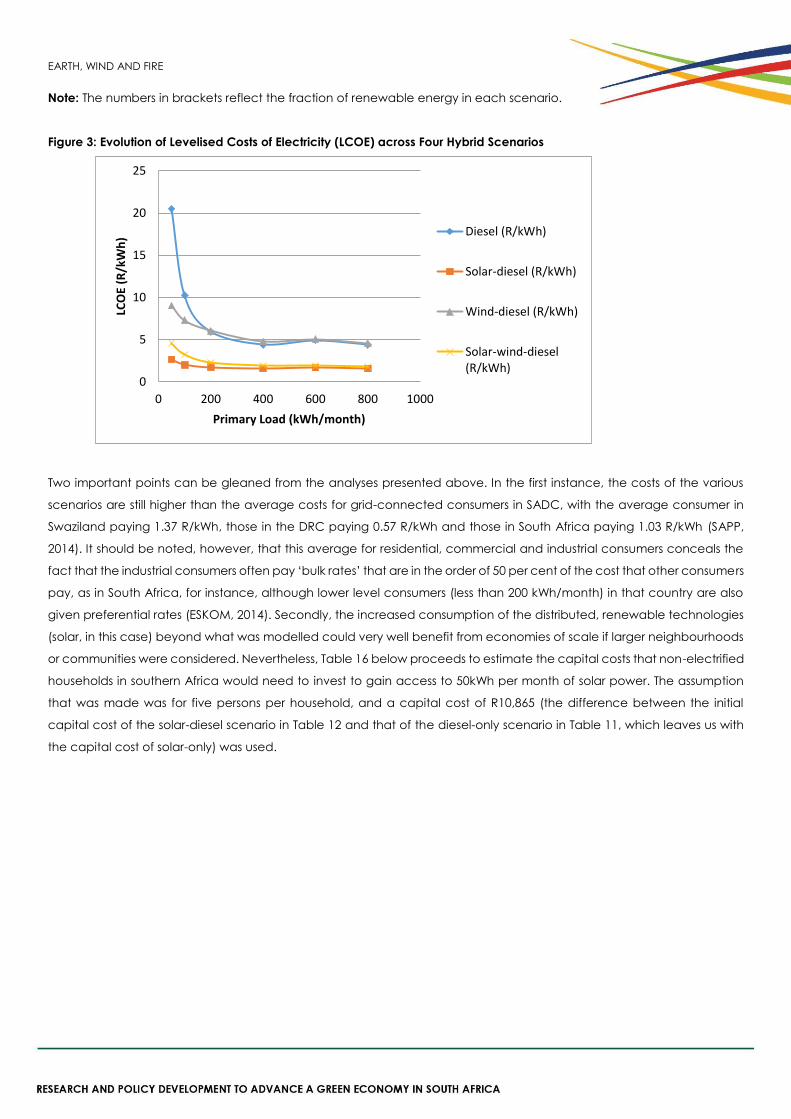
EARTH, WIND AND FIRE
Note: The numbers in brackets reflect the fraction of renewable energy in each scenario.
Figure 3: Evolution of Levelised Costs of Electricity (LCOE) across Four Hybrid Scenarios
Two important points can be gleaned from the analyses presented above. In the first instance, the costs of the various
scenarios are still higher than the average costs for grid-connected consumers in SADC, with the average consumer in
Swaziland paying 1.37 R/kWh, those in the DRC paying 0.57 R/kWh and those in South Africa paying 1.03 R/kWh (SAPP,
2014). It should be noted, however, that this average for residential, commercial and industrial consumers conceals the
fact that the industrial consumers often pay ‘bulk rates’ that are in the order of 50 per cent of the cost that other consumers
pay, as in South Africa, for instance, although lower level consumers (less than 200 kWh/month) in that country are also
given preferential rates (ESKOM, 2014). Secondly, the increased consumption of the distributed, renewable technologies
(solar, in this case) beyond what was modelled could very well benefit from economies of scale if larger neighbourhoods
or communities were considered. Nevertheless, Table 16 below proceeds to estimate the capital costs that non-electrified
households in southern Africa would need to invest to gain access to 50kWh per month of solar power. The assumption
that was made was for five persons per household, and a capital cost of R10,865 (the difference between the initial
capital cost of the solar-diesel scenario in Table 12 and that of the diesel-only scenario in Table 11, which leaves us with
the capital cost of solar-only) was used.
0
5
10
15
20
25
0 200 400 600 800 1000
LCO
E (R
/kW
h)
Primary Load (kWh/month)
Diesel (R/kWh)
Solar-diesel (R/kWh)
Wind-diesel (R/kWh)
Solar-wind-diesel(R/kWh)
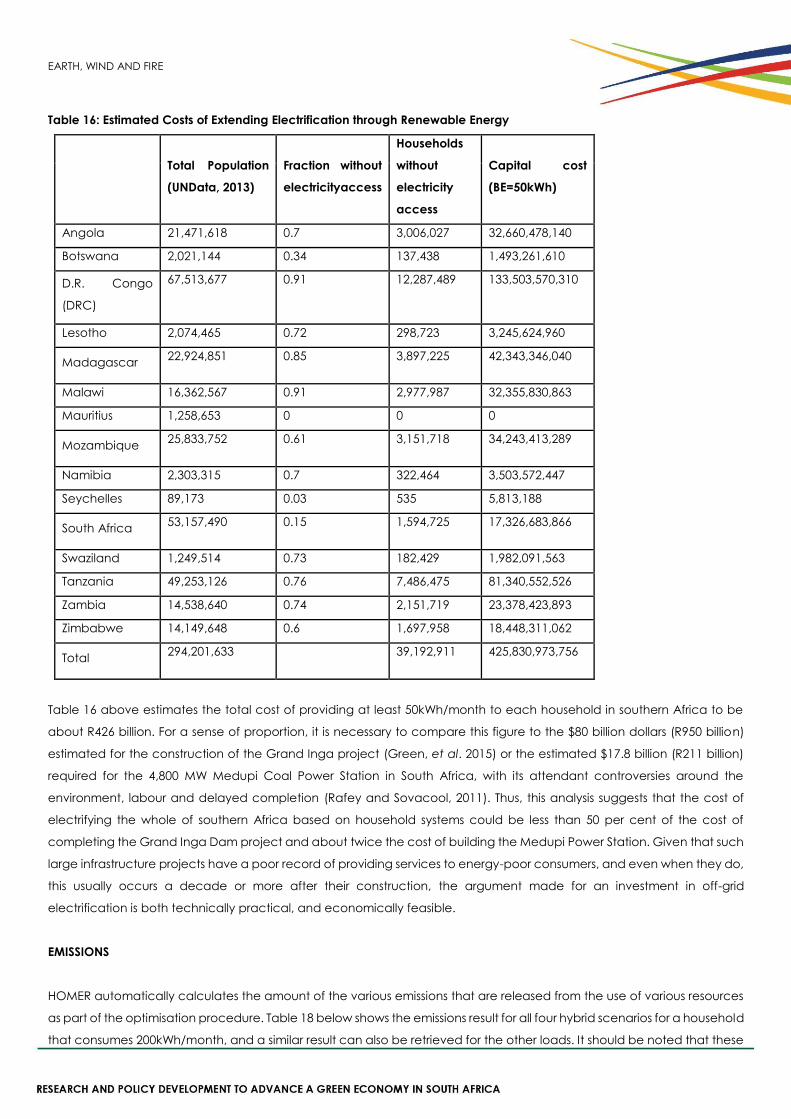
EARTH, WIND AND FIRE
Table 16: Estimated Costs of Extending Electrification through Renewable Energy
Total Population
(UNData, 2013)
Fraction without
electricityaccess
Households
without
electricity
access
Capital cost
(BE=50kWh)
Angola 21,471,618 0.7 3,006,027 32,660,478,140
Botswana 2,021,144 0.34 137,438 1,493,261,610
D.R. Congo
(DRC)
67,513,677 0.91 12,287,489 133,503,570,310
Lesotho 2,074,465 0.72 298,723 3,245,624,960
Madagascar 22,924,851 0.85 3,897,225 42,343,346,040
Malawi 16,362,567 0.91 2,977,987 32,355,830,863
Mauritius 1,258,653 0 0 0
Mozambique 25,833,752 0.61 3,151,718 34,243,413,289
Namibia 2,303,315 0.7 322,464 3,503,572,447
Seychelles 89,173 0.03 535 5,813,188
South Africa 53,157,490 0.15 1,594,725 17,326,683,866
Swaziland 1,249,514 0.73 182,429 1,982,091,563
Tanzania 49,253,126 0.76 7,486,475 81,340,552,526
Zambia 14,538,640 0.74 2,151,719 23,378,423,893
Zimbabwe 14,149,648 0.6 1,697,958 18,448,311,062
Total 294,201,633 39,192,911 425,830,973,756
Table 16 above estimates the total cost of providing at least 50kWh/month to each household in southern Africa to be
about R426 billion. For a sense of proportion, it is necessary to compare this figure to the $80 billion dollars (R950 billion)
estimated for the construction of the Grand Inga project (Green, et al. 2015) or the estimated $17.8 billion (R211 billion)
required for the 4,800 MW Medupi Coal Power Station in South Africa, with its attendant controversies around the
environment, labour and delayed completion (Rafey and Sovacool, 2011). Thus, this analysis suggests that the cost of
electrifying the whole of southern Africa based on household systems could be less than 50 per cent of the cost of
completing the Grand Inga Dam project and about twice the cost of building the Medupi Power Station. Given that such
large infrastructure projects have a poor record of providing services to energy-poor consumers, and even when they do,
this usually occurs a decade or more after their construction, the argument made for an investment in off-grid
electrification is both technically practical, and economically feasible.
EMISSIONS
HOMER automatically calculates the amount of the various emissions that are released from the use of various resources
as part of the optimisation procedure. Table 18 below shows the emissions result for all four hybrid scenarios for a household
that consumes 200kWh/month, and a similar result can also be retrieved for the other loads. It should be noted that these
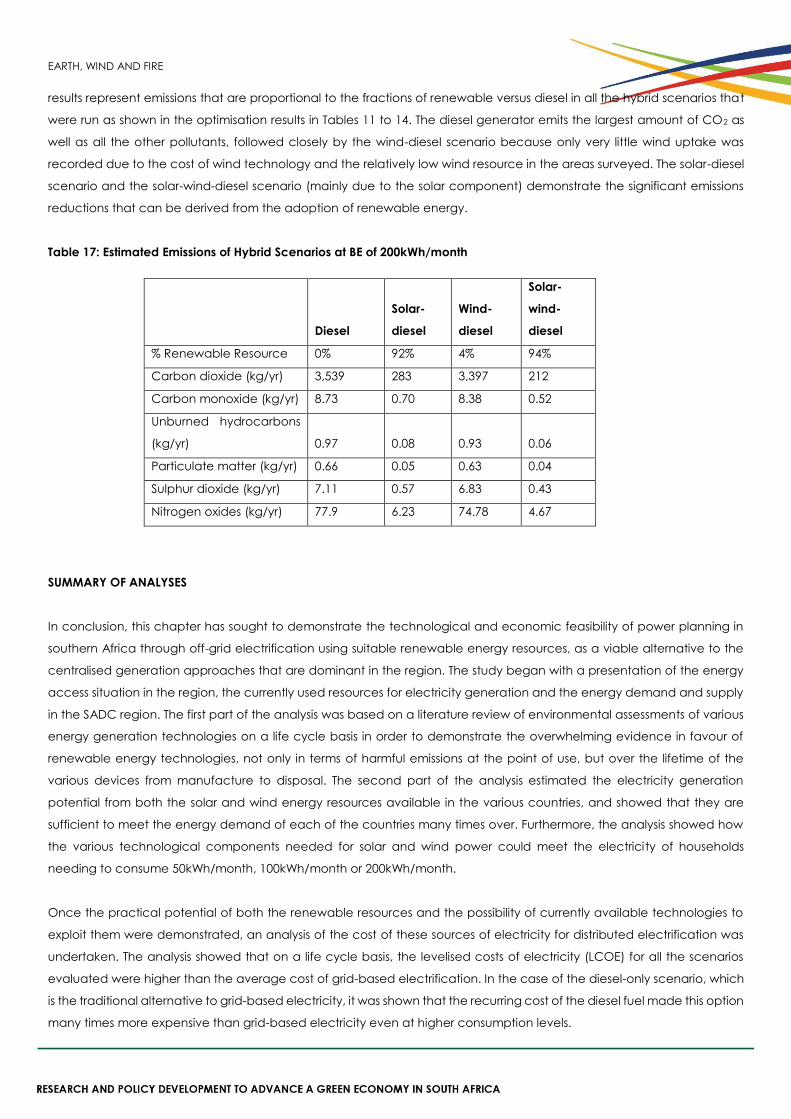
EARTH, WIND AND FIRE
results represent emissions that are proportional to the fractions of renewable versus diesel in all the hybrid scenarios that
were run as shown in the optimisation results in Tables 11 to 14. The diesel generator emits the largest amount of CO2 as
well as all the other pollutants, followed closely by the wind-diesel scenario because only very little wind uptake was
recorded due to the cost of wind technology and the relatively low wind resource in the areas surveyed. The solar-diesel
scenario and the solar-wind-diesel scenario (mainly due to the solar component) demonstrate the significant emissions
reductions that can be derived from the adoption of renewable energy.
Table 17: Estimated Emissions of Hybrid Scenarios at BE of 200kWh/month
SUMMARY OF ANALYSES
In conclusion, this chapter has sought to demonstrate the technological and economic feasibility of power planning in
southern Africa through off-grid electrification using suitable renewable energy resources, as a viable alternative to the
centralised generation approaches that are dominant in the region. The study began with a presentation of the energy
access situation in the region, the currently used resources for electricity generation and the energy demand and supply
in the SADC region. The first part of the analysis was based on a literature review of environmental assessments of various
energy generation technologies on a life cycle basis in order to demonstrate the overwhelming evidence in favour of
renewable energy technologies, not only in terms of harmful emissions at the point of use, but over the lifetime of the
various devices from manufacture to disposal. The second part of the analysis estimated the electricity generation
potential from both the solar and wind energy resources available in the various countries, and showed that they are
sufficient to meet the energy demand of each of the countries many times over. Furthermore, the analysis showed how
the various technological components needed for solar and wind power could meet the electricity of households
needing to consume 50kWh/month, 100kWh/month or 200kWh/month.
Once the practical potential of both the renewable resources and the possibility of currently available technologies to
exploit them were demonstrated, an analysis of the cost of these sources of electricity for distributed electrification was
undertaken. The analysis showed that on a life cycle basis, the levelised costs of electricity (LCOE) for all the scenarios
evaluated were higher than the average cost of grid-based electrification. In the case of the diesel-only scenario, which
is the traditional alternative to grid-based electricity, it was shown that the recurring cost of the diesel fuel made this option
many times more expensive than grid-based electricity even at higher consumption levels.
Diesel
Solar-
diesel
Wind-
diesel
Solar-
wind-
diesel
% Renewable Resource 0% 92% 4% 94%
Carbon dioxide (kg/yr) 3,539 283 3,397 212
Carbon monoxide (kg/yr) 8.73 0.70 8.38 0.52
Unburned hydrocarbons
(kg/yr) 0.97 0.08 0.93 0.06
Particulate matter (kg/yr) 0.66 0.05 0.63 0.04
Sulphur dioxide (kg/yr) 7.11 0.57 6.83 0.43
Nitrogen oxides (kg/yr) 77.9 6.23 74.78 4.67
EARTH, WIND AND FIRE
On the other hand, the solar-diesel scenario, which demonstrated a high uptake (> 90%) of the solar resource, showed
that its LCOE was consistently declining and was not much more expensive than grid-based electricity at consumption
levels greater than 200kWh/month. However, the cost of the wind-diesel scenario was expensive due to the relatively high
cost of the wind generation technology and the modest energy resource over the areas surveyed. The solar-wind-diesel
scenario was also favourable, due to the cost-effective solar resource and a slight contribution from wind. Thus, this part
of the analysis showed that of the two renewable resources, solar power is the preferred option from both a resource and
a cost perspective.
It should be noted that the bulk of the costs of the renewable energy scenarios was in the capital costs, since the fuel
costs are non-existent. Thus, the costs of supplying the initial equipment for generating 50kWh/month per household in
southern Africa were estimated, which is consistent with the Free Basic Electricity (FBE) policy in South Africa that was
responsible (in conjunction with institutional and technical innovations) for its rapid electrification programme. The results
suggest that the total costs needed to provide every non-electrified household in the region with a minimum of 50
kWh/month of solar power would represent less than 50 per cent of the estimated cost of completing the Grand Inga
Dam and about twice the cost of one power station, the Medupi Coal Power Station. Given that the residential consumers
in South Africa represented approximately 94 per cent of ESKOM’s customers and used about 20 per cent of the total
electricity generated in 2006 (National Treasury, 2011), then the following proposition can be considered. In the event of
an ambitious regional electrification programme, the prospect that only two times the allocated costs for new generation
at one South African power plant could supply power to all the non-electrified residents in the wider region (or half of
them, if a quarter of the generating capacity of each of the two plants were dedicated to residential consumers) and
within a much shorter period of time, remains compelling. This strongly suggests that the generalised neglect or deficiency
of state-based initiatives for widespread electrification in sub-Saharan Africa in general, and in southern Africa more
specifically (with few exceptions such as South Africa with respect to grid expansion, and some of the island nations),
cannot continue to be justified on the basis of cost, while simultaneously championing the development of mega projects
and restructuring efforts that, since the early 1980s, have only made marginal contributions to either electricity access or
reliability of supply (Turkson, 2000) – a situation that appears to continue to deteriorate. More fundamentally, the
overwhelming support for rural electrification in countries that have achieved near-universal access such as China, Tunisia
or Mexico (Barnes, 2007), and empirical support for the link between off-grid electrification and human development in
Brazil’s Luz para Todos (Light for All) programme (Gómez and Silveira, 2010), for instance, all point to the soundness of such
an approach.
In addition, it should be pointed out that the scenarios investigated in this study by no means exhaust the opportunities
for off-grid electrification, with biomass power from waste crops being one option that would be especially suited to
farming communities in rural areas. For instance, a modelling-based assessment of hybrid PV-fuel cell systems coupled
with batteries by Lagorse, et al. (2009) demonstrates its potential for an off-grid application related to stand-alone street
lighting systems, but the study’s findings underscore the fact that such an option is particularly attractive for locations that
are distant from the equator and where PV-battery systems cannot work all year round. Thus, while South Africa, in
particular, with its rich platinum reserves, has the potential to develop proton exchange membrane fuel cells for off-grid
applications (Ferreira and Perrot, 2013), the reality of the region’s generally exceptional solar radiation suggests that this
technology is not likely to be a cost-competitive solution in the short to medium term. Lastly, the scenario analysis in this
chapter has shown that the renewable energy scenarios (particularly the two that included solar power) would result in
less pollution at the point of use than in the diesel-based scenario. Thus, if one considers the extended delays that are
typically associated with large power generation infrastructure as well as the environmental ramifications of both fossil-
fuelled generators and large hydroelectric dams, along with the cost and debt implications of constructing those, the
EARTH, WIND AND FIRE
combined analyses presented in this chapter show convincingly that power planning based on off-grid electrification
deserves serious contemplation in the near future.
RECOMMENDATIONS
While the analyses offered in this study may be revised and some of its assumptions may be subjected to critique, the
objective was to make a credible case for an alternative planning paradigm based on the magnitude of the demand,
resources and costs of the available technologies. A few additional recommendations for implementing such a paradigm
are offered as follows:
Financing
The current study has pointed out that sub-Saharan African countries and regions have been able to generate the capital
needed for large energy infrastructure projects with highly skewed distributional consequences and that the approach
suggested here would only represent a very small percentage of those costs even if the capital costs of the off-grid
technologies were entirely paid for. Other approaches to financing off-grid electrification would be other forms of
subsidies (partial), remittances, rotating credit and savings associations, village and cooperative savings and credit
institutions, or investment funds for manufacturing and research, as discussed in more detail in a study by Soumonni and
Soumonni (2011). With specific reference to southern Africa, the Integrated National Electrification Plan (INEP) of the
Department of Energy (DoE) of South Africa supports a rural concessions programme for solar home systems by providing
80 per cent of the capital costs, with the one run by the Nuon-RAPS (NuRA) private utility since 1999 having achieved
notable success in KwaZulu-Natal (Lemaire, 2007).
Technological Capability Building
The technical capability needed to install and maintain the energy generation technology is minimal at the moment, but
this represents an opportunity for training young people at all post-secondary levels including technical and artisan
training institutes, as well as traditional polytechnics and universities. Adopting this paradigm of electrification would
provide an opportunity to foster an approach to education that is more directly linked to pressing developmental issues,
while simultaneously creating opportunities for entrepreneurship and work opportunities.
Industrial Consumers
It has been suggested in this study that large infrastructure projects tend to favour large industrial consumers that are
predominantly linked to the extractive sectors of the economy. Yet, such consumers have the financial means and the
opportunity to also explore opportunities for distributed electrification through co-generation or Combined Heat and
Power (CHP). If the preferential electricity supply arrangements for such consumers were more equitably revised with
respect to other societal groups, they may find that the possibilities of generating a large proportion of their own power
may be cost-effective and competitive with the current prices they pay. In addition, for the various countries, promoting
such an approach through policy instruments could both stimulate manufacturing (i.e. non-extractive industry), promote
associated job growth and negate the need for building expensive and ecologically compromised large power stations,
as suggested in a number of recent studies (Brown, et al. 2013, Baer, et al. 2015).
Grid-connected Residential and Commercial Consumers
In many countries in southern Africa, many grid-connected consumers are experiencing power cuts or load shedding,
including in countries that have historically had access to an abundant energy supply, such as South Africa. This recent
development has tended to relegate issues of electricity access to the background, in favour of the reliability of supply
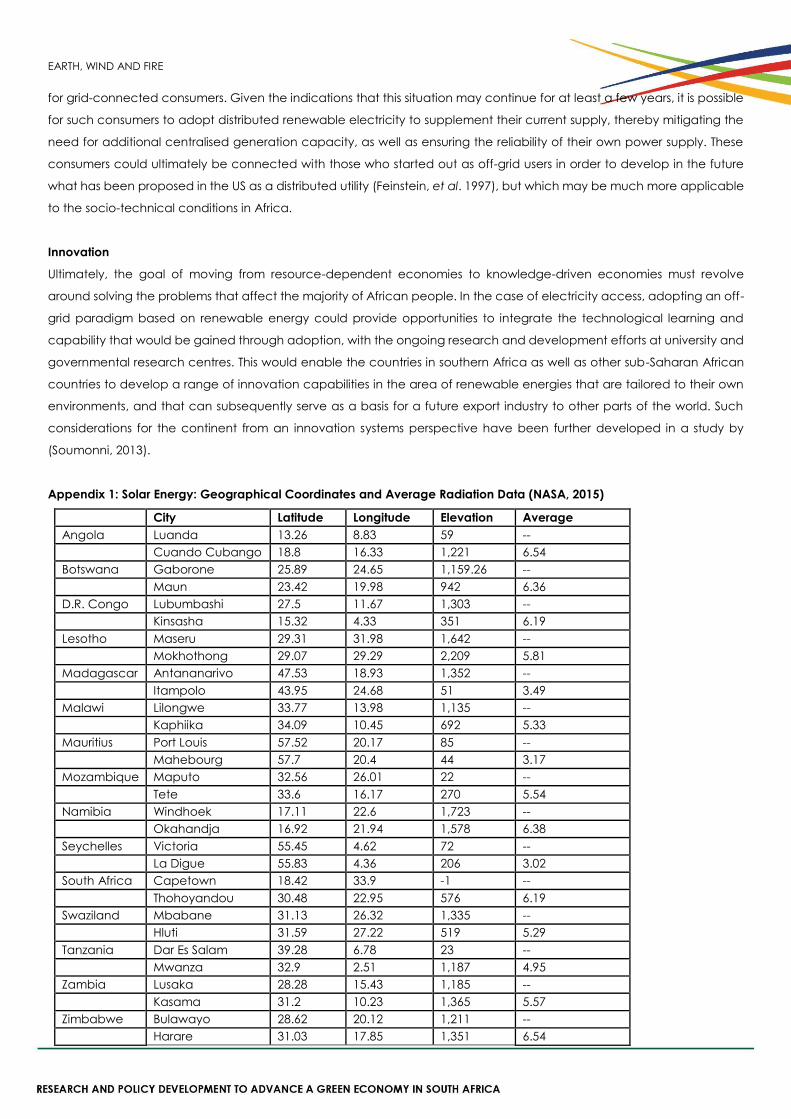
EARTH, WIND AND FIRE
for grid-connected consumers. Given the indications that this situation may continue for at least a few years, it is possible
for such consumers to adopt distributed renewable electricity to supplement their current supply, thereby mitigating the
need for additional centralised generation capacity, as well as ensuring the reliability of their own power supply. These
consumers could ultimately be connected with those who started out as off-grid users in order to develop in the future
what has been proposed in the US as a distributed utility (Feinstein, et al. 1997), but which may be much more applicable
to the socio-technical conditions in Africa.
Innovation
Ultimately, the goal of moving from resource-dependent economies to knowledge-driven economies must revolve
around solving the problems that affect the majority of African people. In the case of electricity access, adopting an off-
grid paradigm based on renewable energy could provide opportunities to integrate the technological learning and
capability that would be gained through adoption, with the ongoing research and development efforts at university and
governmental research centres. This would enable the countries in southern Africa as well as other sub-Saharan African
countries to develop a range of innovation capabilities in the area of renewable energies that are tailored to their own
environments, and that can subsequently serve as a basis for a future export industry to other parts of the world. Such
considerations for the continent from an innovation systems perspective have been further developed in a study by
(Soumonni, 2013).
Appendix 1: Solar Energy: Geographical Coordinates and Average Radiation Data (NASA, 2015)
City Latitude Longitude Elevation
(m)
Average
resolved Solar
Radiation
(kWh/m2day)
Angola Luanda 13.26 8.83 59 --
Cuando Cubango 18.8 16.33 1,221 6.54
Botswana Gaborone 25.89 24.65 1,159.26 --
Maun 23.42 19.98 942 6.36
D.R. Congo Lubumbashi 27.5 11.67 1,303 --
Kinsasha 15.32 4.33 351 6.19
Lesotho Maseru 29.31 31.98 1,642 --
Mokhothong 29.07 29.29 2,209 5.81
Madagascar Antananarivo 47.53 18.93 1,352 --
Itampolo 43.95 24.68 51 3.49
Malawi Lilongwe 33.77 13.98 1,135 --
Kaphiika 34.09 10.45 692 5.33
Mauritius Port Louis 57.52 20.17 85 --
Mahebourg 57.7 20.4 44 3.17
Mozambique Maputo 32.56 26.01 22 --
Tete 33.6 16.17 270 5.54
Namibia Windhoek 17.11 22.6 1,723 --
Okahandja 16.92 21.94 1,578 6.38
Seychelles Victoria 55.45 4.62 72 --
La Digue 55.83 4.36 206 3.02
South Africa Capetown 18.42 33.9 -1 --
Thohoyandou 30.48 22.95 576 6.19
Swaziland Mbabane 31.13 26.32 1,335 --
Hluti 31.59 27.22 519 5.29
Tanzania Dar Es Salam 39.28 6.78 23 --
Mwanza 32.9 2.51 1,187 4.95
Zambia Lusaka 28.28 15.43 1,185 --
Kasama 31.2 10.23 1,365 5.57
Zimbabwe Bulawayo 28.62 20.12 1,211 --
Harare 31.03 17.85 1,351 6.54
EARTH, WIND AND FIRE
References
Africa, E. 2010. 'Free Basic Electricity: A Better Life for All'. Johannesburg, South Africa: Sustainable Energy & Climate
Change Project, Earthlife Africa.
Baer, P., Brown, M. A. and Kim, G. 2015. 'The job generation impacts of expanding industrial cogeneration', Ecological
Economics, 110, 141–153.
Barnes, D. F. 2007. 'The Challenge of Rural Electrification'. In: Barnes, D. F. (ed.) The Challenge of Rural Electrification:
Strategies for Developing Countries. Washington, DC: RFF Press.
Bekker, B., Eberhard, A., Gaunt, T. and Marquard, A. 2008. 'South Africa's rapid electrification programme: Policy,
institutional, planning, financing and technical innovations', Energy Policy, 36, 3115–3127.
Borbely, A.-M. and Kreider, J. F. 2001. 'Distributed Generation: An Introduction'. In: Borbely, A.-M. & Kreider, J. F. (ed.)
Distributed Generation: The Power Paradigm of the New Millenium. Boco Rotan: CRC Press.
Brown, M., Cox, M. and Baer, P. 2013. 'Reviving Manufacturing with a federal cogeneration policy', Energy Policy, 52, 264–
276.
Byrne, J., Zhou, A., Shen, B. and Hughes, K. 2007. 'Evaluating the potential of small-scale renewable energy options to
meet rural livelihood needs: A GIS and lifecycle cost-based assessment of Western China's options', Energy Policy,
4391–4401.
Cherubini, F., Bird, N. D., Cowie, A., Jungmeier, G., Schlamadinger, B. and Woess-Gallasch, S. 2009. 'Energy- and
greenhouse gas-based LCA of biofuel and bioenergy systems: Key issues, ranges and recommendations',
Resources, Conservation and Recycling, 434–447.
Coley, D. 2008. Energy and Climate Change: Creating a Sustainable Future. West Sussex: Wiley.
DME. 2007. 'Free Basic Alternative Energy Policy (Household Support Programme)'. South Africa: Department of Minerals
and Energy.
Eskom 2014. 'International Benchmarking of Electricity Tarrifs'. Research Report.
Feinstein, C. D., Orans, R. and Chapel, S. W. 1997. 'The Distributed Utility: A New Electric Utility Planning and Pricing
Paradigm', Annual Review of Energy and the Environment, 22, 155–185.
Ferreira, V. and Perrot, R. 2013. 'Innovation and Hydrogen Fuel Cell Manufacturing'. In: MISTRA (ed.) South Africa and the
Global Hydrogen Economy: The Strategic Role of Platinum Group Metals. Johannesburg: Real African Publishers.
Fleck, B. and Huot, M. 2009. 'Comparative life-cycle assessment of a small wind turbine for residential off-grid use',
Renewable Energy, 2688–2696.
Gauthier, F., Lubes-Niel, H., Sabatier, R., Masson, J. M., Paturel, J. E. and Servat, E. 1998. 'Variabilité du regimé
pluviométrique de l'Afrique de l'Ouest non sahélienne entre 1950 et 1989', Hydrological Sciences-Journal-des
Sciences Hydrologiques, 43, 15.
Gómez, M. F. and Silveira, S. 2010. 'Rural electrification of the Brazilian Amazon – Achievements and lessons', Energy Policy,
38, 6251–6260.
Green, N., Sovacool, B. K. and Hancock, K. 2015. 'Grand Designs: Assessing the African Energy Security Impliactions of the
Grand Inga Dam', African Studies Review, 48, 133–158.
Hafemeister, D. W. 2007. Physics of Societal Issues: Calculations on National Security, Environment, And Energy. New York:
Springer.
IEA. 2012. IEA Statistics. Available at: http://www.iea.org/statistics/statisticssearch/ [Accessed 20 July 2015].
IEA. 2014. World Energy Outlook 2014 Electricity Database – Electricity Access in Africa in 2012. Available at:
http://wwwworldenergyoutlook.org/resources/energydevelopment/energyaccessdatabase/ [Accessed 20 July
EARTH, WIND AND FIRE
2015].
Lagorse, J., Paire, D. and Miraoui, A. 2009. 'Sizing optimization of a stand-alone street lighting system powered by a hybrid
system using fuel cell, PV and battery', Renewable Energy, 34, 683–691.
Lambert, T., Gilman, P. and Lilienthal, P. 2006. 'Micropower System Modeling with Homer'. In: Farret, F. A. and Simões, M.
G. (eds.) Integration of Alternative Sources of Energy. Hoboken, New Jersey and Canada: John Wiley & Sons, Inc.
Lemaire, X. 2007. 'Concession for rural electrification with solar home systems in KwaZulu-Natal (South Africa)'. Centre for
Management under Regulation – Sustainable Energy Regulation Network, Warwick Business School.
Levin, T. and Thomas, V. M. 2011. 'Least-cost network evaluation of centralized and decentralized contributions to global
electrification', Energy Policy, 41, 286–302.
NASA. 2015. NASA Surface meteorology and Solar Energy: Daily Averaged Data. Available at:
http://eosweb.larc.nasa.gov/ [Accessed 20 July 2015].
National Treasury. 2011. 'Local Government Budgets and Expenditure Review: 2006/07–2012/13'. South Africa.
Nieuwlaar, E. 2004. 'Life Cycle Assessment and Energy Systems', Encyclopedia of Energy, 3, 647–654.
NREL. 2005. Getting Started Guide for HOMER Version 2.1. Available at: http://homerenergy.com/user_interface.html
[Accessed 20 July 2015].
Pascale, A., Urmee, T. and Moore, A. 2011. 'Life cycle assessment of a community hydroelectric power system in rural
Thailand', Renewable Energy, 2799–2808.
Pineau, P.-O. 2008. 'Electricity sector integration in West Africa', Energy Policy, 36, 210–223.
Rafey, W. and Sovacool, B. K. 2011. 'Competing discourses of energy development: The implications of the Medupi coal-
fired power plant in South Africa', Global Environmental Change, 21, 1141–1151.
SAPP. 2014. Annual Report. Available at: http://www.sapp.co.zw/docs/Annual%20report-2014.pdf [Accessed 20 July
2015].
SAPP. 2015. Vision and Objectives. Available at: http://www.sapp.co.zw/ [Accessed 20 July 2015].
Sobin, R. 2007. 'Energy Myth Seven – Renewable Energy Systems Could Never Meet Growing Electricity Demand in
America'. In: Sovacool, B. K. and Brown, M. A. (eds.) Energy and American Society – Thirteen Myths. Dordrecht:
Springer.
Soumonni, O. 2013. 'Towards a Technology Policy for Renewable Energy Development in Africa: A Systems of Innovation
Perspective', African Journal of Science, Technology, Innovation and Development, 5, 289–295.
Soumonni, O. C. and Soumonni, O. Y. 2011. 'Promoting West African Ownership of the Power Sector: Alternative Financing
for Distributed Generation of Renewable Electricity', Journal of African Business, 12, 310–329.
Sovacool, B. 2008. 'Distributed Generation in the US – Three Lessons', Cogeneration and On-Site Power Production, 69–72.
SUSTAINABLE.CO.ZA. 2015. SA's No. 1 Online Eco Store. Available at: http://www.sustainable.co.za/ [Accessed 20 July
2015].
Szabó, S., Bódis, K., Huld, T. and Moner-Girona, M. 2011. 'Energy solutions in rural Africa: mapping electrification costs of
distributed solar and diesel generation versus grid extension', Environmental Research Letters, 6, 1–9.
Turkson, J. K. 2000. Power Sector Reform in SubSaharan Africa. Houndmills, Basingstoke, Hampshire and London: St. Martin's
Press.
Walters, C. J. 1986. Adaptive Management of Renewable Resources. New York: Macmillan.
Weisser, D. 2007. 'A guide to life-cycle greenhouse gas (GHG) emissions from electric supply technologies', Energy, 1543–
1559.
Wood, D. 2011. Small Wind Turbines: Analysis, Design, and Application. London, Dordrecht, Heidelberg and New York:
Springer.
Zhong, Z. W., Song, B. and Loh, P. E. 2011. 'LCAs of a polycrystalline photovoltaic module and a wind turbine', Renewable
Energy, 2227–2237.
EARTH, WIND AND FIRE
SECTION IV
Summary of Policy Recommendations
The various chapters of this book offer a number of policy recommendations and considerations towards a smooth
transition to a low-carbon economy in South Africa, covering critical sectors of the green economy such as energy,
transportation, waste and water.
SECTION I: THE CO-EVOLUTIONARY ROLE OF GOVERNMENTS, CIVIL SOCIETIES AND INDUSTRIES
Chapter 1: The Trojan Horses of Global Environmental and Social Politics
This chapter offers a critique of the dominant discourse on sustainable development, the green economy and climate
change policies and examines how the hegemonic discourse around market-led economic growth principles, such as
green growth, have led to decades of mitigation deadlocks and has further widened the gulf between the countries of
the North and the South. A few considerations are critical in reframing the discussions around sustainable
development and the green economy:
There is a need to approach the issue of sustainable development in a manner that embraces the social
complexity and the human and multidimensional nature of the issues. This requires a revolutionary change in
political consciousness within and across national boundaries, including a keen appreciation of the conditions
of the poor and marginalised across the globe; and the climate change and sustainable development policies
of at least the major countries in the North and the South must be embedded within a broader transparent
international effort and discourse.
The world is in need of a climate change framework for transnational and global political action that embraces
new and alternative thoughts and action. Such thinking requires the spread of certain core values of
sustainable development and the sharing of these values among countries.
Alternative frameworks and modes of thinking and action will unlock technological, institutional and economic
systems from old habits and path dependencies. Now is the time to scrutinise the specific ways in which the
current world order has been created, the kind of thinking and practices that have led to its failings, and the
systemic interventions required to extricate humanity from the current malaise.
Both at the UNFCCC and at the national levels of the BASIC (Brazil, South Africa, India and China) countries,
the important issue of adaptation as a climate change policy has been an under-discussed challenge. It has,
however, gained ground since COP20 in December 2014, and features on the agenda of COP21 in December
2015. This must be sustained and intensified, taking into account the fact that the poor, especially in Africa,
EARTH, WIND AND FIRE
Asia and Latin America, are in the majority and are extensively dependent on climate-sensitive sectors for their
sustenance.
Chapter 2: LTMS and Environmental and Energy Policy Planning in South Africa: Betwixt Utopia and Dystopia
The chapter argues that the LTMS and the energy and environmental policies it inspired have not been wholly
effective. There are several reasons for the marked ineffectiveness of the LTMS and therefore a number of
recommendations in this regard:
The experience from other countries shows that policies rarely address climate change in isolation; rather,
they are designed to fulfil a range of parallel objectives, be they energy security, reduced air pollution,
economic restructuring or targeted industrial development.
The big bottleneck is the implementation of policy interventions and sectoral strategies which is burdening
not just the specific sector but the country at large through adverse multiplier effects. Policy synergies that
integrate the social and economic priorities of the country, across and within government spheres, specifically
between policies for climate change, industrial development, job-creation, poverty reduction and the energy
sector are needed.
The government needs to exploit ‘critical junctures’ such as the present electricity crisis to move beyond short-
and medium-term vested interests as well as old policies and understandings and implement solutions that
deliver results.
In ‘critical junctures’, the structural constraints imposed on actors during the path-dependant phase are
substantially relaxed. This provides an opportunity for policy entrepreneurs and other actors to reshape
existing institutions and create new arrangements. Actors can influence outcomes and, where there are
positive feedback effects, break the chain of path dependency and in so doing there is an opportunity to
change the rules.
The transition from the politically impossible to the politically inevitable compels us to re-imagine and rethink
our policy ‘utopia’ and ensure that it is grounded in material remaking of economics and development.
Reconnecting real world economics and transformative mitigation is the imperative right now.
Chapter 3: Historical Review on the Relationship Between Energy, Mining and the South African Economy
This chapter uses a co-evolutionary lens to discuss the (deep) challenges of a smooth transition to a low-carbon
economy in South Africa. A number of recommendations and suggestions are made on how the complexity of the
energy intensive challenge could be overcome and clean energy policies could thereby be effectively implemented:
The role of the Minerals Energy Complex (MEC) is indicative of the entrenched regime that the mining sector
plays within the economy. The MEC has broadened itself to a system of wealth accumulation and has
integrated large sectors that include mining, transport, manufacturing and finance. Due to this system of
wealth accumulation, there are a handful of players in this sector, and thereby also few powerful actors that
EARTH, WIND AND FIRE
are influential in determining key policies and strategies. An evaluation of the vested interests within the MEC
is key in understanding the implementation of energy policies in the country.
The issue of ideological mismatch between a developmental state and a mature market-based economy is a
fundamental challenge. As such, issues such as social compacting in an environment in which one sector is
perceived to be strategically networked and more influential, the debates about the place and role of state-
owned enterprises such as Eskom, and the ongoing discourse on nationalisation versus privatisation remain
unresolved. The ideological mismatch has to be tackled because it is a root cause of policy incoherence and
implementation inertia.
The subject of financialisation is indicative of a need for major reform in the structure of the economy.
Investments made by the mining sector that favour most profits flowing out of the country instead of long-
term financial investments are compounding developmental challenges. These include uneven wealth
distribution, mostly skewed towards elitism and towards wealth concentration, thus aggravating inequality.
The JSE total market capitalisation is twice the size of the actual economy. This imbalance renders the
economy vulnerable to short-term volatile capital flows, and not necessarily long-term labour absorbing
economic growth. The current energy crisis provides an opportune moment to revisit the country’s mining
economic policy.
Chapter 4: Lost in Procurement: An Assessment of the Development Impact of the Renewable Energy Procurement
Programme
The current design and the related practices of the REIPP Programme in terms of maximising the socio-economic
impact can be greatly improved. The analysis reveals 10 barriers that have hindered a positive impact on the
development aspect of the sector. By expanding the interpretation of development, the programme can contribute
the following to the national development agenda, through ‘Seven Equations of Development’:
The creation of BEE or black-owned and run energy companies, which also implies the establishment of Black
or South African industrialists.
The transfer of skills from foreigners to locals in the most senior executive functions as well as the most junior
roles entailed in constructing and operating RE power plants.
The creation or growth of small enterprises that can leverage the experience of servicing power plants to
participate in other sectors with similar needs.
The development of communities into active agents in their own story of ‘good change’.
Impactful social investments owing to the participation of local communities in the articulation of
development strategies and their resultant stewardship in managing the investments made in their
communities.
EARTH, WIND AND FIRE
SECTION II: TRANSITION TO A LOW-CARBON ECONOMY
Chapter 5: Making Transitions to Clean and Sustainable Energy in the South African Urban Transport Sector: Linkages
to Growth and Inclusive Development
In the transition to a low-carbon economy, South Africa has been continually focusing on cleaner fuels as opposed to
stimulating a move towards clean fuels. Some policy options to consider when moving from cleaner to clean
technologies in the urban bus transport sector, and reducing the uncertainties that emerge under the conditions that
characterise energy transitions and which might enable the movement towards change in the near future, are:
Understanding habits, norms and practices that create lock-ins and path dependencies when making fuel
choices, and learning to work with and around them is an important first step in an energy transition process.
Making decisions about moving to new fuels would also require an impartial analysis of the costs that would
be incurred and their likely evolution and the need for considerable collective action on the part of
governments, users and producers working together.
Considerable attention must be given to meeting the concerns of path dependence and lock-in, both of which
are enhanced by weaknesses in carrying out policies and programmes that have been negotiated by
stakeholders. One of the options is to bring into the choice process linkages among users and producers, as
well as their perspectives on the nature of existing challenges and how these might be overcome. Closer
linkages between users and producers is likely to enhance greater knowledge-sharing and transfer, including
knowledge about the interchangeability between (new) technologies and a deeper understanding of the
proximity of these technologies to full development and their use. Developing the capacity to work with and
around actors such as those from the petroleum, and oil and gas industry would be critical.
Chapter 6: Green Policymaking and Implementation at the City Level: Lessons from Efforts to Promote Commuter
Cycling in Johannesburg
The development of a commuter cycling infrastructure and associated policy development in Johannesburg
demonstrates the internal political dynamics in local government that allow such schemes to be championed and
implemented, but which may also slow or stall progress. These processes do not happen independently of outside
actors, which include a range of lobby groups that can serve to increase accountability or to divert policy towards
parochial concerns. A number of considerations to improve the commuter cycling infrastructure and make the
transition towards a low-carbon economy in the city are:
The integration of bicycles into other forms of public transport, such as the trains and busses, is crucial to
linking cyclists in far-flung suburbs with destinations in the city centre. While space constraints may prevent
this in peak hours, a system could be devised to allow bicycles on busses, trains and the Gautrain during off-
peak hours initially. This should be accompanied with safe bicycle parking at stations.
EARTH, WIND AND FIRE
With cycle lanes underway and nearing completion for many key routes, the other obstacle to greater uptake
of cycling lies in bicycle access. Making bicycles and their repair affordable for low-income citizens should be
a major priority of further work. Solutions could also be sought through partnership with the private sector.
Given the large challenge posed to eco-mobility solutions such as cycling by the vast distances created by
South Africa’s incredibly low-density urban development, the commuter cycling cause must also be linked to
demands to improve the public mass transit system and also for policies that encourage densification of
existing settlements.
Current cyclists, while not numerous, are a constituency who have been marginalised in policy and debate.
More hard data should be collected about when, how often, and under what conditions people currently cycle.
Data should also be collected and monitored about road accidents involving cyclists.
Partnership between the state, the private sector, universities (and research institutes) and lobby groups
should feed into the accountability and momentum for policy implementation, as well as in improving the
content of policies by providing ‘user’ input.
International networks, on the other hand, have had much more muted value. The value they have added in
disseminating ideas and providing incentives for cities to excel as ‘pioneers’ in environmental innovation
should be further examined. There is also recognition of the need for directing investment of time and
personnel towards extending partnerships at the local level instead.
Chapter 7: The Energy and Water Nexus: The Case for an Integrated Approach for the Green Economy in South Africa
Some recommendations that would facilitate the cooperative and adaptive management of water and energy and
thus help achieve the green economy goals for South Africa are:
Better data availability and accuracy: improved availability and accuracy of data will facilitate informed
decision-making, prioritise investments in both energy and water infrastructure and lead to better water and
energy use practices.
Integrated Resource Planning and Management: the relationship between water and energy needs to be
better recognised in policies, planning and related regulations and laws dealing with the planning,
management and development of water resources and energy systems.
Efficiency Improvement: there is an urgent need to prioritise leakage reduction and energy efficiency in the
water sector. Such measures include water pressure management, sludge management activities such as
aeration efficiency improvement, using chemical pre-treatment (this could lead to potential electricity savings
of 250–280 MWh/year), and optimisation of the operation of the distribution system by pumping at off-peak
periods, among others.
Appropriate resource pricing: appropriate pricing can play an important role in driving conservation and
innovation in management and use of both resources through various pricing mechanisms.
Increased funding for Research and Development (R&D) in smart technologies and innovations: there are
many opportunities to develop more efficient technologies, practise cost-effective approaches to using lower-
EARTH, WIND AND FIRE
quality, non-traditional sources of water to supplement or replace fresh water for cooling and other power
plant needs. Future R&D should focus on: energy sources that can meet future water needs sustainably,
specifically for the array of water-scarce areas in the country; technical solutions that successfully couple
energy and water generation; reducing water use in thermal power generation through advanced cooling
technologies, scrubbing, innovative source-water intake designs, the use of non-traditional waters and
increased power-plant efficiencies, among others.
Creating consumer awareness: urgent steps need to be taken by the government and the water companies to
increase consumer awareness of water use. Tools such as the certification and labelling of consumer products
to reflect embedded water and energy use in their manufacture or usage need to be mandated.
Chapter 8: Waste Re-Use: Case of Oil Extracted from Waste Tyres and Improvement of the Waste Tyre Industry
There is a need to assess the current waste tyre pyrolysis plants in South Africa in order to evaluate the economic and
technical viability of these plants. Currently, the factors making these plants non-feasible, and around which relevant
industrial policy interventions could be made, are:
The complicated process of obtaining environmental permits to operate such plants.
There is a need for beneficiation and sale of carbon black as a supplementary revenue stream.
None of the South African facilities is utilising excess gas produced in plant to optimise energy utilisation.
Localise technologies and ensure that they comply with relevant SABS codes.
Improve the availability of spare parts, which are not readily available in the country.
There is no guarantee of feedstock (waste tyres) and product off-take at pre-agreed prices and quantities.
Most plants produce crude products of no value and require beneficiation; therefore consideration must be
given to beneficiation of crude oil into valuable chemicals, which improves the plant process economics.
Chapter 9: Energy Efficient Low-income Housing development in South Africa: The Next Build Programme
The policy framework to enable the national implementation of energy efficient and renewable energy technology in
the development of low-income houses exists in the country. However, national and provincial government
departments have to coordinate policy action as some of the enabling legislation resides in different spheres and
departments.
Municipalities or city-level governments have to incorporate green energy development in their respective
IDPs. The implementation of a national project on energy efficiency and renewable energy technology
deployment for low-income housing has to be accompanied by continual monitoring and evaluation and this
capacity has to be developed in all municipalities.
Research organisations and universities will need to be involved in the green energy development programme,
to provide policy and decision makers with informed evidence on viable energy solutions and services.
EARTH, WIND AND FIRE
The energy efficient low-income housing and renewable energy development has the potential to transform
the economy through innovation and development of new industries. Energy efficient low-income housing
development is an area where government has a captive market.
SECTION III: EXPLORING REGIONAL OPTIMAL ENERGY STRATEGIES
Chapter 10: Off-grid Renewable Electrification as a Viable and Complementary Power Planning Paradigm in
Southern Africa: A Quantitative Assessment
A number of recommendations for implementing an alternative-planning paradigm based on the magnitude of the
demand, resources and costs of the available technologies for off-grid solutions are as follows:
Financing off-grid electrification could be in the form of subsidies (partial), remittances, rotating credit and
savings associations, village and cooperative savings and credit institutions, or investment funds for
manufacturing and research.
Training young people at all post-secondary levels including technical and artisan training institutes, as well as
traditional polytechnics and universities, would enhance the technical capabilities and skills base of the
country. Education that is directly linked to pressing developmental issues would create opportunities for
entrepreneurship and work opportunities for the youth.
Industrial consumers with their financial means could explore opportunities for distributed electrification
through co-generation or combined heat and power (CHP). There are possibilities of generating a large
proportion of their own power, which may be cost-effective and competitive with the current prices.
Promoting such an approach through policy instruments could stimulate manufacturing (i.e. non-extractive
industry), promote associated job growth, and negate the need for building expensive and ecologically
compromised large power stations.
Strategies and policies should encourage residential and commercial consumers to adopt distributed
renewable electricity to supplement their current supply, thereby mitigating the need for additional
centralised generation capacity, as well as ensuring the reliability of their own power supply where existing
access is erratic and short in supply.
Adopting an off-grid paradigm based on renewable energy could provide opportunities to integrate the
technological learning and capability that would be gained through adoption, with the ongoing research and
development efforts at universities and governmental research centres. This would enable the countries in
southern Africa as well as other sub-Saharan African countries to develop a range of innovation capabilities in
the area of renewable energies that are tailored to their own environment, and which can subsequently serve
a basis for a future export industry to other parts of the world.
EARTH, WIND AND FIRE


![Earth, Wind & Fire - [Book] Best Selection (Band Score)](https://img.pdfslide.us/doc/110x75/5439074fafaf9fb62e8b4c99/earth-wind-fire-book-best-selection-band-score.jpg)
![Earth Wind & Fire Medley [Lowden]](https://img.pdfslide.us/doc/110x75/563db91a550346aa9a9a0806/earth-wind-fire-medley-lowden.jpg)