Embed Size (px)
Citation preview
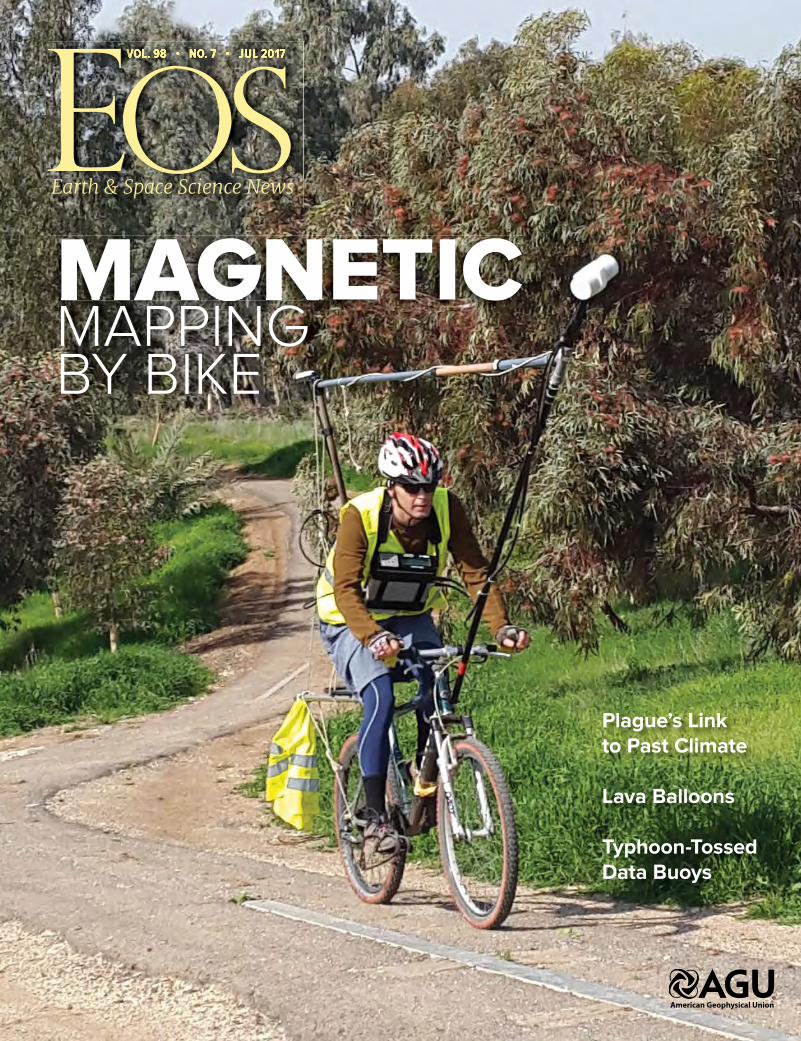
Plague’s Link to Past Climate
Lava Balloons
Typhoon-Tossed Data Buoys
VOL. 98 • NO. 7 • JUL 2017VOL. 98 • NO. 7 • JUL 2017
Earth & Space Science News
MAGNETICMAGNETICMAPPINGBY BIKE

Showcase your research to an international audience, debate
with your peers, and find new ways to create a positive impact
on society—only at AGU Fall Meeting. This is the largest and most
influential event dedicated to advancing Earth and space science.
Don’t miss your opportunity to accelerate your career.
D I S CO V E R A N D B Ediscovered
Final Abstract Submission Deadline: 2 Augustfallmeeting.agu.org
Submit your abstract by 26 Julyfor a chance to win a US$100 gift card.
Earth & Space Science News Contents
Earth & Space Science News Eos.org // 1
JULY 2017VOLUME 98, ISSUE 7
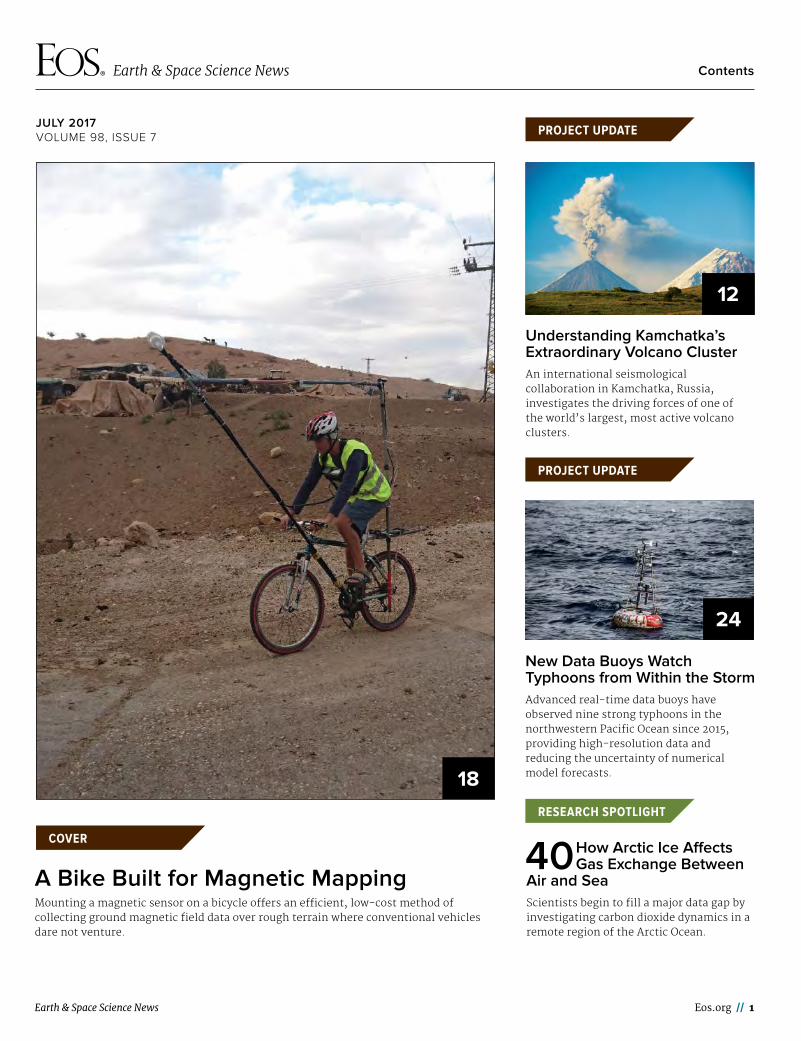
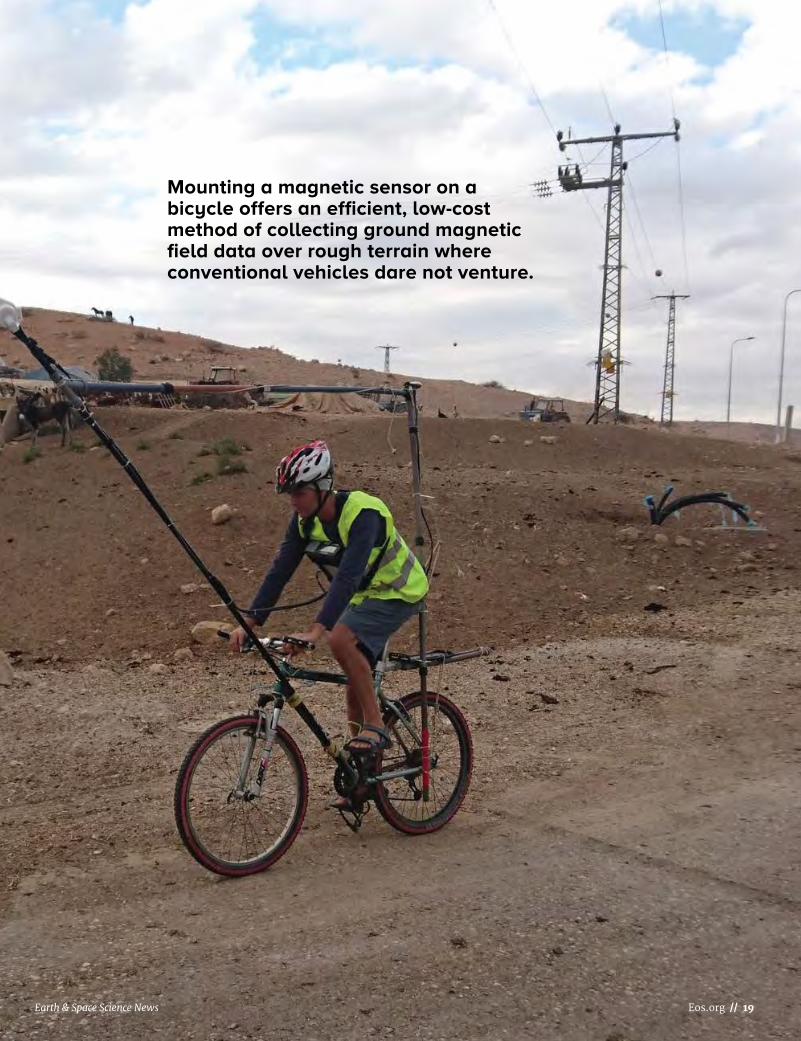
A Bike Built for Magnetic MappingMounting a magnetic sensor on a bicycle offers an efficient, low-cost method of collecting ground magnetic field data over rough terrain where conventional vehicles dare not venture.
COVER
18
Understanding Kamchatka’s Extraordinary Volcano ClusterAn international seismological collaboration in Kamchatka, Russia, investigates the driving forces of one of the world’s largest, most active volcano clusters.
PROJECT UPDATE
12
New Data Buoys Watch Typhoons from Within the StormAdvanced real-time data buoys have observed nine strong typhoons in the northwestern Pacific Ocean since 2015, providing high-resolution data and reducing the uncertainty of numerical model forecasts.
PROJECT UPDATE
24
RESEARCH SPOTLIGHT
40 How Arctic Ice Affects Gas Exchange Between
Air and SeaScientists begin to fill a major data gap by investigating carbon dioxide dynamics in a remote region of the Arctic Ocean.
July 2017
Contents
facebook.com/AmericanGeophysicalUnion linkedin.com/company/american-geophysical-union@AGU_Eos youtube.com/user/AGUvideos
Staff
Production and Design: Faith A. Ishii, Production Manager; Melissa A. Tribur, Senior Production Specialist; Elizabeth Thompson, Production and Editorial Assistant; Travis Frazier and Valerie Friedman, Electronic Graphics SpecialistsEditorial: Peter L. Weiss, Manager/Senior News Editor; Mohi Kumar, Scientific Content Editor; Randy Showstack, Senior News Writer; JoAnna Wendel, News Writer; Liz Castenson, Editorial and Production CoordinatorMarketing: Jamie R. Liu, Manager, Marketing; Angelo Bouselli and Tyjen Conley, Marketing Program Managers; Ashwini Yelamanchili, Digital Marketing CoordinatorAdvertising: Tracy LaMondue, Director, Development; Tel: +1-202-777-7372; Email: [email protected]
©2017. American Geophysical Union. All Rights Reserved. Material in this issue may be photocopied by individual scientists for research or classroom use. Permission is also granted to use short quotes, figures, and tables for publication in scientific books and journals. For permission for any other uses, contact the AGU Publications Office.
Eos (ISSN 0096-3941) is published monthly by the American Geophysical Union, 2000 Florida Ave., NW, Washington, DC 20009, USA. Periodical Class postage paid at Washington, D. C., and at additional mailing offices. POSTMASTER: Send address changes to Member Service Center, 2000 Florida Ave., NW, Washington, DC 20009, USA.
Member Service Center: 8:00 a.m.–6:00 p.m. Eastern time; Tel: +1-202-462-6900; Fax: +1-202-328-0566; Tel. orders in U.S.: 1-800-966-2481; Email: [email protected].
Use AGU’s Geophysical Electronic Manuscript Submissions system to submit a manuscript: http://eos-submit.agu.org.
Views expressed in this publication do not necessarily reflect official positions of the American Geophysical Union unless expressly stated.
Christine W. McEntee, Executive Director/CEO
Editor in ChiefBarbara T. Richman: AGU, Washington, D. C., USA; eos_ [email protected]
Christina M. S. CohenCalifornia Institute of Technology, Pasadena, Calif., USA; cohen@srl .caltech.edu
José D. FuentesDepartment of Meteorology, Pennsylvania State University, University Park, Pa., USA; [email protected]
Wendy S. GordonEcologia Consulting, Austin, Texas, USA; wendy@ecologiaconsulting .com
David HalpernJet Propulsion Laboratory, Pasadena, Calif., USA; davidhalpern29@gmail .com
Carol A. SteinDepartment of Earth and Environmental Sciences, University of Illinois at Chicago, Chicago, Ill., USA; [email protected]
Editors
Mark G. Flanner, Atmospheric SciencesNicola J. Fox, Space Physics and AeronomyPeter Fox, Earth and Space Science InformaticsSteve Frolking, Biogeosciences Edward J. Garnero, Study of the Earth’s Deep Interior Michael N. Gooseff, HydrologyBrian C. Gunter, GeodesyKristine C. Harper, History of GeophysicsSusan E. Hough, Natural HazardsEmily R. Johnson, Volcanology, Geochemistry, and Petrology Keith D. Koper, SeismologyRobert E. Kopp, Geomagnetism and PaleomagnetismJohn W. Lane, Near-Surface Geophysics
Jian Lin, TectonophysicsFigen Mekik, Paleoceanography and PaleoclimatologyJerry L. Miller, Ocean SciencesThomas H. Painter, Cryosphere SciencesPhilip J. Rasch, Global Environmental ChangeEric M. Riggs, EducationAdrian Tuck, Nonlinear GeophysicsSergio Vinciguerra, Mineral and Rock PhysicsAndrew C. Wilcox, Earth and Planetary Surface ProcessesEarle Williams, Atmospheric and Space ElectricityMary Lou Zoback, Societal Impacts and Policy Sciences
Editorial Advisory Board
2 // Eos
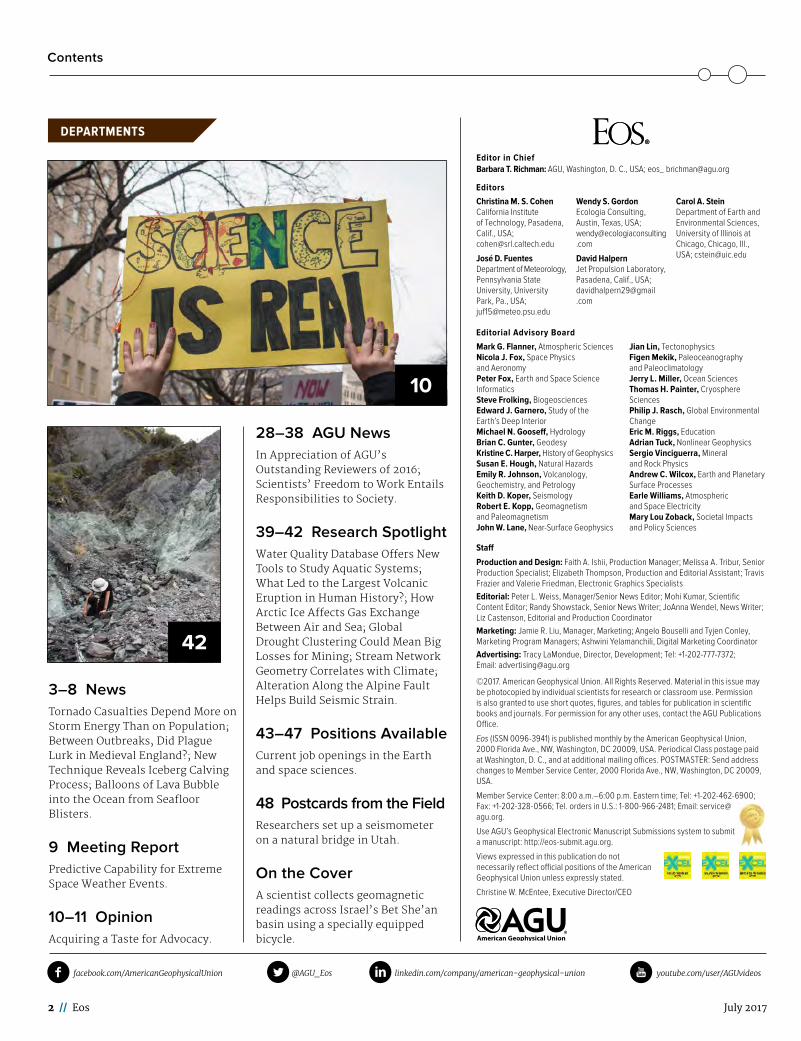
3–8 NewsTornado Casualties Depend More on Storm Energy Than on Population; Between Outbreaks, Did Plague Lurk in Medieval England?; New Technique Reveals Iceberg Calving Process; Balloons of Lava Bubble into the Ocean from Seafloor Blisters.
9 Meeting ReportPredictive Capability for Extreme Space Weather Events.
10–11 OpinionAcquiring a Taste for Advocacy.
28–38 AGU NewsIn Appreciation of AGU’s Outstanding Reviewers of 2016; Scientists’ Freedom to Work Entails Responsibilities to Society.
39–42 Research SpotlightWater Quality Database Offers New Tools to Study Aquatic Systems; What Led to the Largest Volcanic Eruption in Human History?; How Arctic Ice Affects Gas Exchange Between Air and Sea; Global Drought Clustering Could Mean Big Losses for Mining; Stream Network Geometry Correlates with Climate; Alteration Along the Alpine Fault Helps Build Seismic Strain.
43–47 Positions AvailableCurrent job openings in the Earth and space sciences.
48 Postcards from the FieldResearchers set up a seismometer on a natural bridge in Utah.
On the CoverA scientist collects geomagnetic readings across Israel’s Bet She’an basin using a specially equipped bicycle.
10
42
DEPARTMENTS
Earth & Space Science News
NEWS
Eos.org // 3
When a dark, swirling funnel cloud dips toward the ground, people liv-ing in a U.S. region in and near the
Great Plains popularly known as Tornado Alley know to move to a safe spot. Tornadoes can destroy concrete buildings and send railcars rolling, and these violent wind-storms account for roughly 20% of natural hazard–related deaths in the United States.
Despite tornadoes’ danger, the correlations among the number of storm- related casual-ties, a twister’s energy, and the size of the population in its path are not well understood. Better understanding of those relationships could help scientists, policy makers, and emer-gency management personnel predict future tornado deaths and injuries based on trends in population growth and tornado activity.
Now, in a new study, researchers have used a principle of economics to show that a torna-do’s casualty count depends more strongly on the energy of the storm than on the size of the local population.
This work is “likely to spur conversation
and additional research,” said Todd Moore, a physical geographer at Towson University in Towson, Md., who was not involved in the study. “It provides a framework that can be modified to include additional risk variables.”
Fear Becomes an ObsessionTyler Fricker grew up hearing his father’s stories of the 1974 Xenia, Ohio, tornado that killed 33 people and injured more than 1000 others. Fricker, now a geographer at Florida State University in Tallahassee and the lead author of the new study, has also lived through a few tornadoes of his own. He explains his fascination with tornadoes as “fear becoming an obsession.”
In the new research, he and his colleagues analyzed 872 casualty- causing tornadoes that swept through parts of the United States between 2007 and 2015. They defined “casu-alty” as a death or an injury related to a storm. “By understanding tornado behavior better…we get a deeper understanding of what may be causing the death and destruc-tion we see in these storms,” Fricker said.
The team borrowed a principle of econom-ics known as elasticity to investigate how a tornado’s casualty toll scaled with its energy and the size of the nearby population. Elas-ticity is commonly used by economists to investigate how two measurements—for example, supply and demand—are related.
The researchers used National Weather Ser-vice data to determine the energy dissipated by a tornado. They calculated this energy as pro-portional to the area of a tornado’s path multi-plied by its average wind speed raised to the third power. Knowing this quantity for each tornado allowed the team to uniformly define the intensity of each storm. The researchers then collected population measurements in roughly 1- kilometer by 1- kilometer squares for the path of each tornado using a database of world population maintained by Columbia University in New York.
Predicting CasualtiesArmed with these two parameters and the published casualty counts for each of the tor-nadoes in their sample, Fricker and his col-leagues investigated how casualties scaled with storm energy and the size of the nearby population. The scientists found that storm
energy was a better predictor of the number of storm- related injuries and deaths: Doubling the energy of a tornado resulted in 33% more casualties, but dou-bling the population of a tornado- prone area resulted in only 21% more casualties. These results, which the team reported in April in Geophysical Research
Letters ( http:// bit . ly/ GRL - tornado), can inform emergency planning, the team sug-gests.
The relatively larger impact of tornado energy on casualties might be cause for con-
Tornado Casualties Depend More on Storm Energy Than on Population
“By understanding tornado behavior better…we get a deeper understanding of what may be causing the death and destruction we see in these storms.”
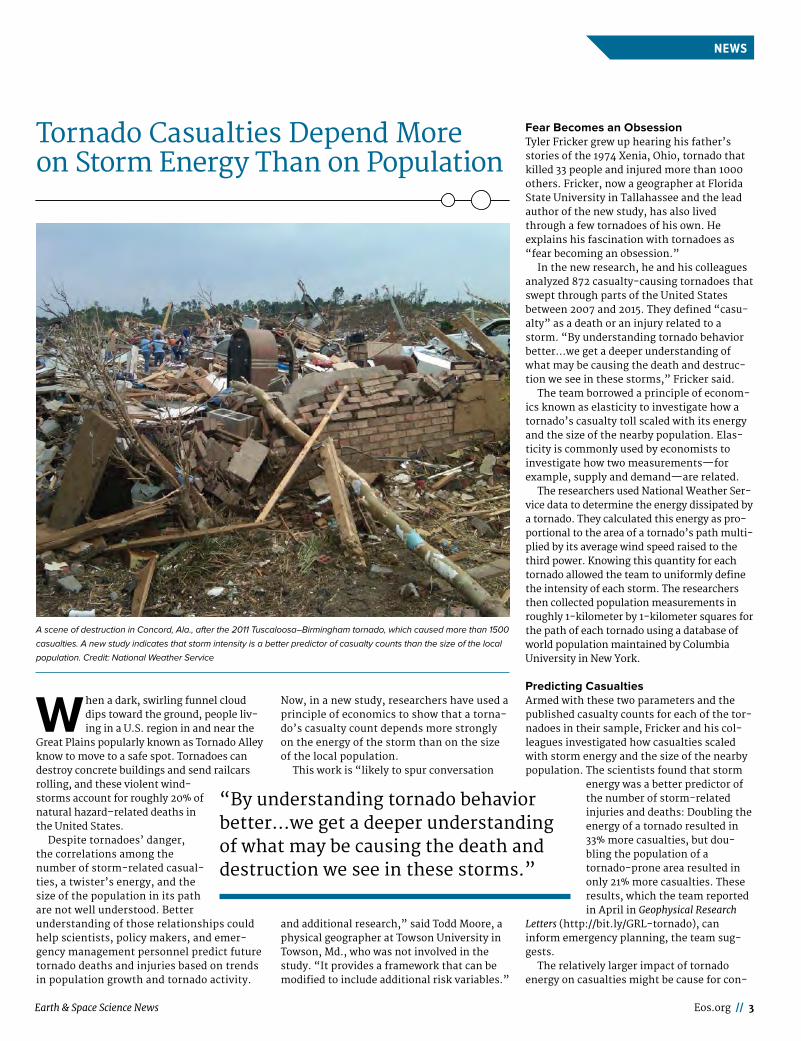
A scene of destruction in Concord, Ala., after the 2011 Tuscaloosa– Birmingham tornado, which caused more than 1500
casualties. A new study indicates that storm intensity is a better predictor of casualty counts than the size of the local
population. Credit: National Weather Service
4 // Eos July 2017
NEWSNEWS
R esearchers of the bubonic plague, also known as the Black Death, have long debated why the disease broke out
repeatedly in medieval Europe: Did traders from elsewhere bring the dreaded pestilence with them from infected areas, thus sparking new epidemics? Or was the Yersinia pestis bac-terium, now known to cause the plague, pres-ent but for some reason inactive during the 5 to 12 years that typically passed between outbreaks?
Now a researcher has found a pattern of recurrence by looking at ancient records of the Black Death and climatic conditions in what today is an eastern region of England called East Anglia. “It looks like, after a run of 1, 2, or 3 years of relatively average or slightly cool summers, once there is a jump to warm and dry weather, there is a large likelihood” of a plague epidemic, said Kathleen Pribyl of the University of East Anglia in Norwich, U.K., in April during the General Assembly of the European Geosciences Union in Vienna,
Austria. Her findings ( http:// bit . ly/ EGU - plague) suggest that the bacterium lingered silently in rodents during periods between plague flare- ups, only to threaten humans again when the rodent population exploded.
Rediscovering Past ClimateA climate historian, Pribyl reconstructed English climate between 1256 and 1431 using indirect evidence, for example, the date of the start of the grain harvest. She wondered whether she might discover in these data the influences that triggered plague epidemics or quelled them. She realized that she needed to extend her climate record to the end of the 15th century, when public health measures such as quarantining were introduced, which confined outbreaks and lowered their impact.
Pribyl found the data she needed in the work of a Dutch independent climate histo-rian, Jan Buisman, who has been compiling reports on weather phenomena and climate in the Low Countries, the coastal region now
Between Outbreaks, Did Plague Lurk in Medieval England?
cern, Fricker and his colleagues note. If cli-mate change is triggering more powerful tor-nadoes, an idea that’s been suggested and debated, emergency managers might have to contend with larger casualty counts in the future. But scientists are by no means certain that larger tornadoes are anticipated. “There is no doubt climate change is influencing hazards, but for tornadoes, we just simply don’t know to what extent yet,” said Stephen Strader, a geographer at Villanova University in Villanova, Pa., who was not involved in the study.
It is “far more likely” that the population, rather than the tornado energy, will double in the future, notes Victor Gensini, a meteorolo-gist at the College of DuPage in Glen Ellyn, Ill., who also was not involved in the study. Effective communication and good city plan-ning might help reduce storm- related casual-ties, Fricker and colleagues suggest. “It’s hard to control the behavior of tornadoes, but it’s somewhat within our control to smartly advance how we organize cities and suburbs,” said Fricker.
Many More FactorsOf course, changes in storm energy and popu-lation can’t fully explain all variations in storm- related deaths or injuries. “There are also more factors that combine to determine a casualty, one of the most important being what type of structure a person is in when the tornado strikes,” said Gensini.
Fricker said that he and his colleagues look forward to examining factors such as how a victim’s age, socioeconomic status, and race might correlate with vulnerability to harm from a tornado. “Maybe we’ll be able to profile communities more susceptible to casualties based on all of these other determinants,” he said.
The team hopes that their findings will be useful to emergency personnel, who could tar-get these most vulnerable populations when they disseminate information about tornado preparedness, for example. After all, “you might have only 10 or 15 minutes to get to a safe spot,” said Fricker.
By Katherine Kornei (email: hobbies4kk@ gmail . com; @ katherinekornei), Freelance Science Jour-nalist
“You might have only 10 or 15 minutes to get to a safe spot.”
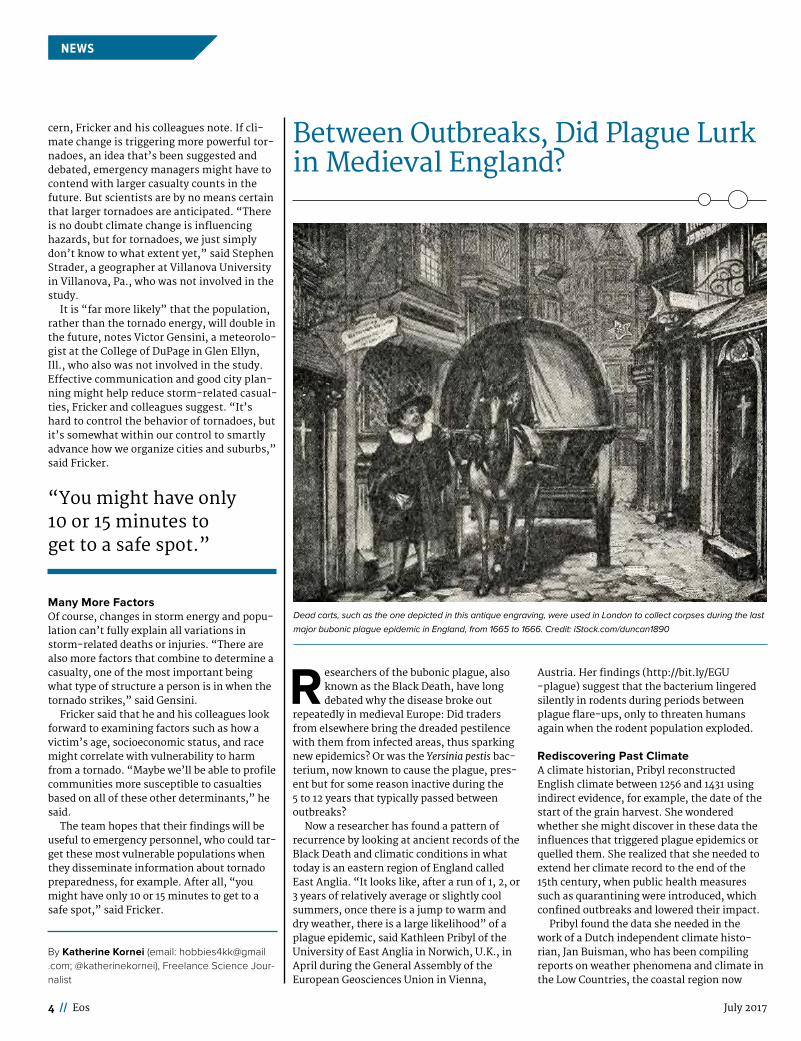
Dead carts, such as the one depicted in this antique engraving, were used in London to collect corpses during the last
major bubonic plague epidemic in England, from 1665 to 1666. Credit: iStock.com/duncan1890
Earth & Space Science News Eos.org // 5
NEWS
occupied mostly by the Netherlands and Bel-gium. This area, lying only 200 kilometers east of East Anglia across a stretch of the North Sea, was close enough for its weather records to be suitable to supplement the English data, Pribyl told Eos. Buisman’s records date from as early as 764 C.E.
With a sufficiently long temperature record thus established and with data on rainfall readily available via tree ring sequences, Pribyl could characterize each year: Was the winter cold or not? Was the summer cool, warm, dry, wet? At first, just like researchers before her, she saw no particular circumstances that would coincide with a plague outbreak. But that changed when she grouped summers not by their temperature but by the difference in average temperature from the preceding sum-mer. If a warm summer followed a normal one, then a plague outbreak was much more likely, she found.
This pattern, according to Pribyl, shows that it was not repeated arrivals from outside England that made the plague return again and again but the waxing and waning of the population of some host animal. Knowing the preference of Yersinia pestis, it was likely a rodent, she explained.
Vole TollIn England, the field vole and the common vole are likely candidates to have played the role of plague reservoirs, and these species have naturally fluctuating population sizes. A normal year or, better yet, a few normal years, followed by a warm year, said Pribyl, is just what sets up the population structure, the food situation, and the number of predators for a population explosion. This increase will, in turn, bring these rodents, and the fleas they carry, into closer contact with humans than in normal times, “especially after the population collapses again, which always happens at some point,” she said. “Because then the fleas will try to move to other hosts, and humans are as good as anything else. And that’s when transference of the disease becomes quite likely.”
Other signs from climate data also point to rodents as the reservoir. A slightly cold winter seems to have helped the plague: More snow would have insulated and hid the voles’ bur-rows. But outbreaks almost never occurred after a very cold winter, which would have killed a lot of voles, or a very mild one, when abundant rain would have flooded many bur-rows.
Imported Outbreaks?In an earlier study ( http:// bit . ly/ pnas - plague), Boris Schmid, an evolutionary biologist at the University of Oslo in Norway, and his col-
leagues analyzed a data set of 7711 plague out-breaks in Europe and compared them to pre-cipitation records from tree ring samples from Europe and Asia. Weather conditions that might have caused rodent numbers to spike, they reported, generally did not coincide with out-breaks. They con-cluded that most outbreaks of the plague must have been caused by renewed introduction of Yersinia pestis from Asia, brought into Europe by rats on merchant ships.
Pribyl, however, questions that research team’s analysis. “They looked at climate fluctuations for the whole of Europe and expected to find one kind of pattern. But that’s actually quite unlikely. With my data, I could look at just one region,” she noted.
Genes, TooHendrik Poinar, an evolutionary biolo-gist at McMaster University in Hamil-
ton, Ont., Canada, who did not participate in Pribyl’s study, told Eos that he found Pribyl’s conclusion that the plague did not enter Europe again and again but resided in a rodent reservoir “convincing and interest-ing.” Poinar took part in an investigation of the genome of a strain of Yersinia pestis that was found in Marseille, France, in the teeth of buried victims of one of the last outbreaks in Europe, in 1722. Last year, his group reported that this strain had descended from bacteria identified in 14th- century victims in London. So genetics, too, points at the plague emerg-ing repeatedly from a reservoir in or near Europe, Poinar said.
Could the source of the repeated English outbreaks have been in England itself, and could the field voles that Pribyl suspects indeed have been the reservoir? It’s quite pos-sible, Poinar said. “All these small, human- associated rodents could be important. All these should be tested. If she has samples, we’d be happy to test them!” he said.
By Bas den Hond (email: bas@ stellarstories . com), Freelance Science Journalist
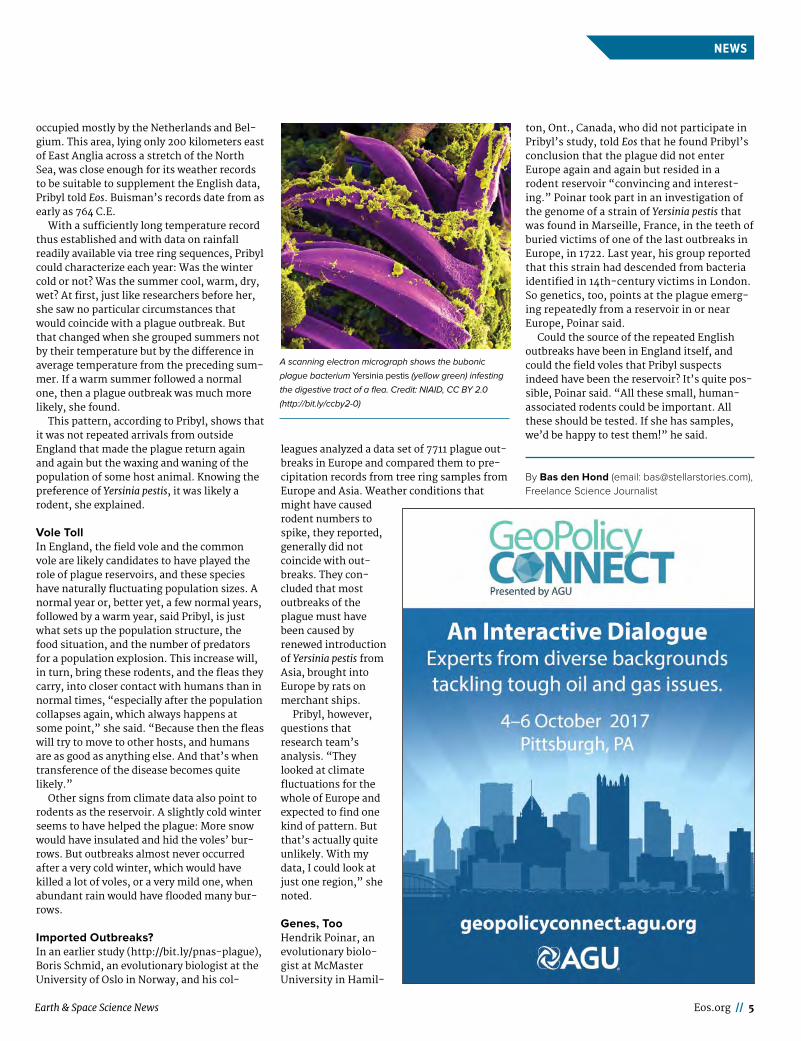
A scanning electron micrograph shows the bubonic
plague bacterium Yersinia pestis (yellow green) infesting
the digestive tract of a flea. Credit: NIAID, CC BY 2.0
( http:// bit.ly/ccby2-0)
6 // Eos July 2017
NEWSNEWS
W alking near the end of a massive tongue of glacial ice rising hundreds of meters above the sea, a group of
scientists spotted an unexpected and ominous sign. About 100 meters from the edge of the glacier was a crack a few meters wide. The crack was fresh—there had been no sign of it the day before. “We decided we wouldn’t walk farther,” said Guillaume Jouvet, a glaciologist at ETH Zurich in Switzerland.
He and his colleagues were on a 2015 expe-dition to Bowdoin Glacier in northwestern Greenland for the express purpose of deepening scientists’ understanding of when, how, and why such fissures form. But the fissures were just a means to an end; the team was out to piece together the series of events from the start of a crack to the moment when an iceberg breaks free at the glacial front.
The international team of research-ers, including Jouvet, led by glaciolo-gist Martin Funk, also of ETH Zurich, recently reported in The Cryosphere ( http:// bit . ly/ bowdoin - calving) that they used images collected by an unmanned aerial vehicle (UAV) to model how ice fractures propagated in this glacier, which is about half the area of Manhattan Island. The crack resulted in a 1- kilometer- long iceberg breaking away from the front of the glacier. Combining observations of visible ice frac-tures with modeling of a glacier’s interior, as the team has done, is a powerful technique for better understanding, and potentially predict-ing, when and where glaciers will produce ice-bergs, the researchers suggest.
This work “yields insights into the produc-tion of icebergs, which are increasingly affect-ing human societies,” said Mark Carey, a gla-cier researcher at the University of Oregon in Eugene, who was not involved in this research. The current number of icebergs drifting into North Atlantic shipping lanes is “among the highest in a century,” he added.
A video ( http://bit.ly/ bowdoin - video) that the researchers made of this revealing field-work includes footage taken by the UAV’s camera.
Flying EyeThe team’s 2015 observations of the glacier built on previous studies of the flowing ice
there by some of the same researchers using automatic cameras, GPS measurements, and ice- penetrating radar. This time, however, the scientists brought with them a piece of tech-nology that’s becoming popular in geophysics research: a UAV.
Team members mounted a camera on the battery- powered craft. Then, on 11 July, after overcoming reliability issues with the UAV’s compass related to the nearby North Pole, they guided the craft over the terminus of Bowdoin Glacier.
The camera snapped roughly 1000 overlap-ping photographs during the 30- minute flight. The researchers then used computer software to construct a three- dimensional model of the glacier from the data. The result-ing image was “like a satellite view, but [of] very high resolution,” said Jouvet.
The next day, the team explored the glacial front and noticed the crack near the glacier’s edge. But when they later reviewed the previ-ous day’s UAV images, they saw no sign of the crack.
Five days later, the team launched the UAV again and assembled another three- dimensional image of Bowdoin Glacier. This time, the researchers found the crack easily: It had grown to 750 meters long. By comparing the two high- resolution UAV data sets using a feature- tracking algorithm, Jouvet and his colleagues traced how the ice moved and cal-culated its velocity at 1- meter intervals. But the UAV images revealed only the glacier’s surface—the real mystery lay within. “We
wanted to somehow enter the glacier,” said Jouvet. For that, the researchers turned to modeling.
Hundreds of Artificial GlaciersMembers of the research team, which included scientists from ETH Zurich and Hokkaido University in Sapporo, Japan, sim-ulated on a computer more than 100 versions of the terminus of Bowdoin Glacier, each characterized by different internal properties such as bedrock topography, friction between bedrock and ice, and ice stiffness. They also modeled whether, at the time of the 16 July second flight, the crack might have been par-tially filled with water, a condition that would have widened it more than had it been empty.
By comparing the properties of these arti-ficial glaciers with the actual surface features
of Bowdoin Glacier, the team found a best fit model indicating that the crack was water filled and 175 meters deep, roughly two thirds of the total thickness of the glacier. “The fractur-ing process was quite advanced” by then, said Jouvet.
He and his colleagues didn’t attempt to predict exactly when Bow-doin Glacier’s massive iceberg would detach. That happened on 27 July, about a week after the researchers had left Greenland. A roughly 1- kilometer- long section of the gla-cier calved off as an iceberg, which then broke apart in the water. “Fish-ermen saw a lot of icebergs coming from Bowdoin Fjord” that day, Jouvet noted.
He added that the team’s technique of modeling ice fractures could “absolutely” be applied in more places than just Greenland. For instance, the method could be used to infer the properties of the enormous crack that’s currently developing in Antarctica’s much larger Larsen C ice shelf, which spans hundreds of square kilometers. However, he said, monitoring such a large area might be better accomplished with satellite images than with UAV images.
Now Jouvet is leading a project to actually predict the formation of cracks responsible for massive icebergs. The project is deploying a fleet of UAVs in northwestern Greenland this summer to collect its first data. Jouvet said that he hopes to record a large event, from the initiation of the first crack in the ice to the final launch of the iceberg.
By Katherine Kornei (email: hobbies4kk@ gmail . com; @ katherinekornei), Freelance Science Jour-nalist
New Technique Reveals Iceberg Calving Process
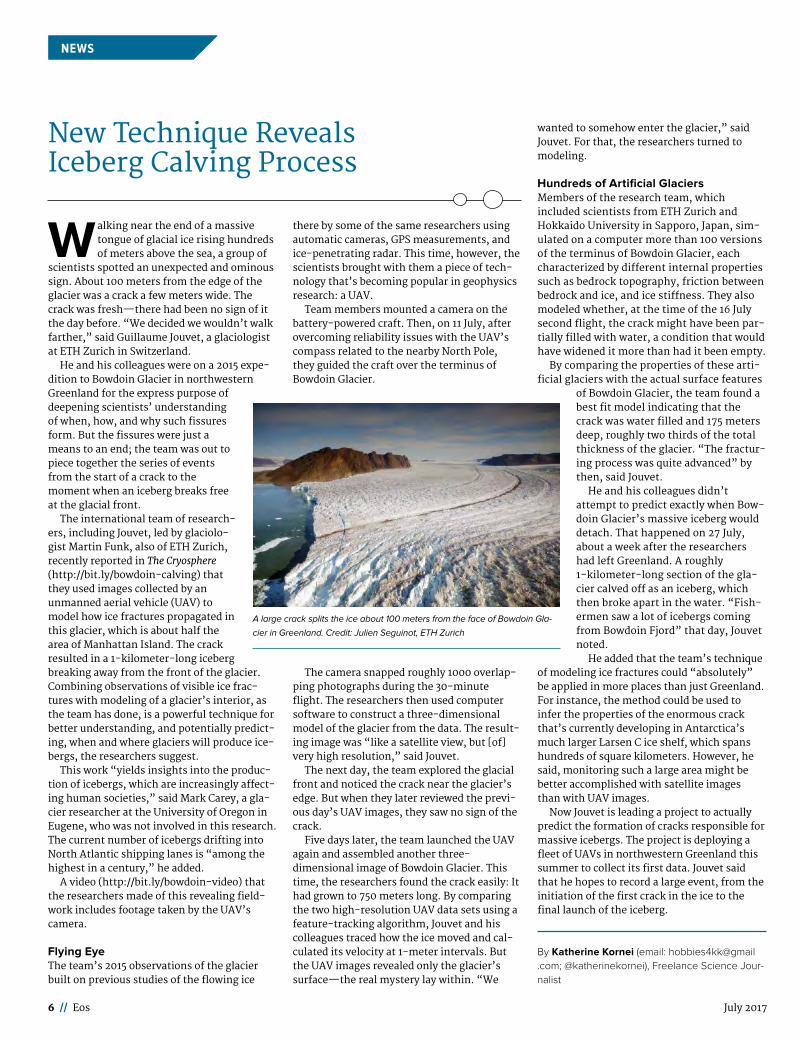
A large crack splits the ice about 100 meters from the face of Bowdoin Gla-
cier in Greenland. Credit: Julien Seguinot, ETH Zurich
Eos.org // 7
NEWS
Earth & Space Science News
Imagine you’re a fisherman at sea and sud-denly your boat is surrounded by dozens of floating pieces of hot, dark rock, hissing
and spewing vapor. Some rocks are no bigger than footballs and some are larger than refrig-erators. But just a few minutes later, the mys-terious chunks sink below the surface with no hint of where they came from.
That is exactly what happened to a group of fishermen in the Azores, Portugal, in late 1998. It turns out that they were witnessing the appearance of lava balloons: floating lumps of hollow, cooled lava burped up from the seafloor after an undersea volcanic erup-tion.
The fishermen described the balloons as “hot steaming stones whose high temperature caused minor damage to the fishing ropes,” with “fire coming out from the seawater spreading on the air like sparks of fireworks,” according to a report ( http:// bit . ly/ lava - balloons) by Portuguese scientists who were called to the scene. The fishermen later noticed a “large quantity of dead or injured fish” at the sea surface.
The balloons are a strange and rare phe-nomenon that serve a scientific purpose: They alert researchers to underwater eruptions that might otherwise go unnoticed, said Ulrich Küppers, a volcanologist at the University of Munich in Germany.
Küppers is trying to find out how and why these weird features form. He suspects that they are the result of trapped magmatic gas pushing upward through lava during some kinds of undersea eruptions. Küppers pre-
sented his theory at the AGU Chapman Con-ference on submarine volcanism in January in Hobart, Tasmania, Australia.
A Rare Thing to BeholdLava balloons are hollow pieces of cooled basalt, a fine- grained dark lava rock. These rough ellipsoids can be as small as 50 centi-meters and as long as 3 meters. They rise to the sea surface during some submarine erup-tions, and after a few minutes of bobbing on the surface, they absorb water and sink back down to the seafloor.
“When they’re floating at the sea surface, they’re a bit like icebergs,” Küppers said. “They’re mostly below the surface.”
So far, humans have documented the appearance of lava balloons only five times: off the coast of the island of Hawaii in Febru-ary 1877; near the Mediterranean island of Pantelleria, Italy, in October 1891; near the Mexican island of Socorro in late 1993 and early 1994; off the coast of the Azores, from 1998 to 2001; and in the Canary Islands, Spain, in October 2011.
But Küppers suspects that lava balloons may occur more often than volcanologists think. Because they float on the surface for only a few minutes, it’s hard to catch them in the act. Only for the Socorro, Azores, and Canary Island eruptions have scientists been able to directly observe the balloons while measuring other aspects of the eruption, like seismicity and water temperature.
How Did the Balloons Get There?After studying data—some collected by him, some collected by others—from the most recent three eruptions, Küppers noticed a few common traits. The balloons didn’t seem to explode or implode as they rose in the water column, and their size didn’t change along their journey to the sea surface. Maps of the seafloor around the eruptions revealed that the balloons all emerged from submarine eruptions in shallow water no deeper than a few hundred meters.
“There’s really a lot of open questions still about how...they form, but we have now a good couple of data sets about eruptive activity ongoing at the ocean floor,” he said.
After gathering balloons from the Azores eruption and analyzing data from the other four eruptions, Küppers has come up with a hypothesis for how the balloons emerge. Every now and then during a submarine erup-tion, gas accumulates just below the interface between the volcano’s magma and the water above.
The gas continues to rise because it’s less dense, bringing a coating of magma along with it. The magma that rises above the interface is
Balloons of Lava Bubble into the Ocean from Seafloor Blisters
Fishermen described the balloons as “hot steaming stones whose high temperature caused minor damage to fishing ropes.”
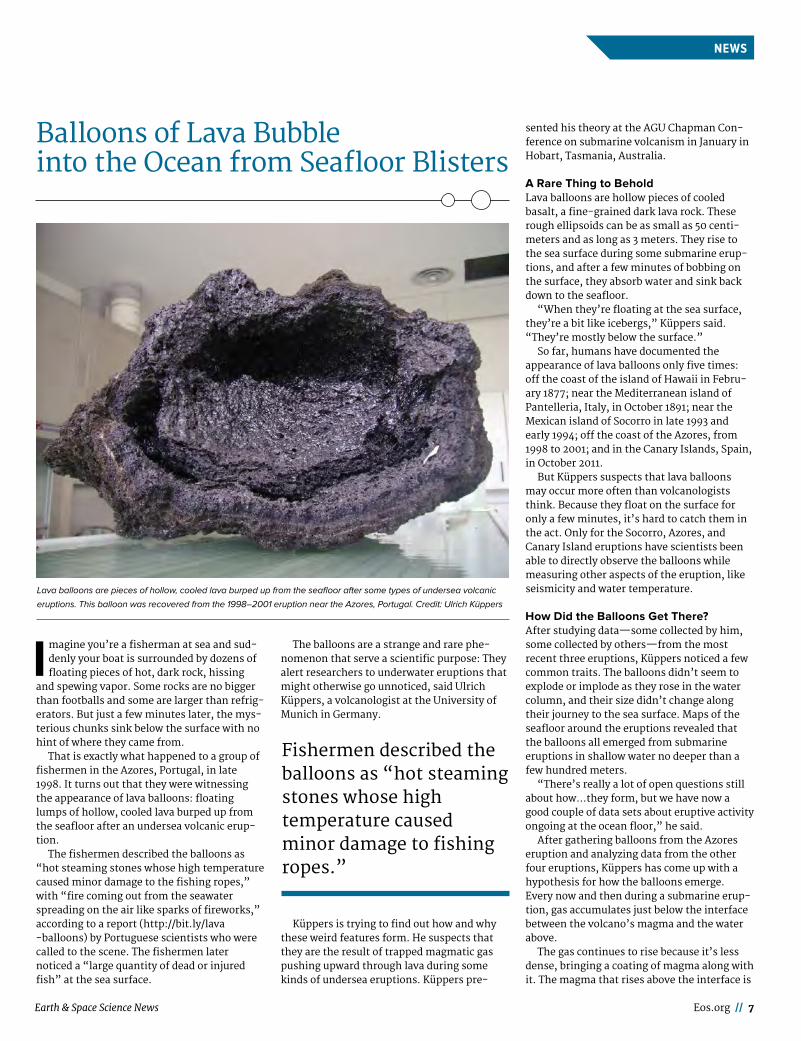
Lava balloons are pieces of hollow, cooled lava burped up from the seafloor after some types of undersea volcanic
eruptions. This balloon was recovered from the 1998–2001 eruption near the Azores, Portugal. Credit: Ulrich Küppers
8 // Eos July 2017
NEWSNEWS
earthspacescience.agu.org
Open Up Your ScienceEarth and Space Science welcomes original research papers spanning all of the Earth, planetary, and space sciences, particularly papers presenting and interpreting key data sets and observations.
instantly quenched when it meets cold seawa-ter, creating a thin crust of cooled lava over a gas- filled interior.
The rising gas keeps pushing the shell up. Under the right conditions, the balloon becomes buoyant enough that it detaches from the seafloor and rises through the water column. Some are light enough to reach the
sea surface, whereas others absorb water and sink back to the seafloor.
What Gas Propels the Balloons?Lava balloons appeared intermittently during the Azores eruption, which continued until early 2001. At one point, researchers from Portugal’s Research Institute for Volcanology
and Risk Assessment explored the eruption area with a remotely operated vehicle.
The team got lucky—they spotted some of these balloons as they rose and filmed them with the vehicle’s camera. Küppers and other researchers studied the footage and found gas bubbles emanating from the balloons that had traveled through the water column.
“If that was water steam, in contact with water in the Azores at 20 degrees [Celsius], it would instantly quench, condense, and the bubble would implode, disappear,” he said. “These bubbles survive over several frames, and this is reason for me to believe that these bubbles are primarily filled with carbon diox-ide.”
He suspects that the carbon dioxide origi-nates from the magma but separates from the melted rock and accumulates below the lava interface, bulging it outward, perhaps trigger-ing the process of lava balloon formation.
Lava BlistersDuring a research expedition to the Azores in July 2016, Küppers and his colleagues studied the 1998 eruption site in detail. “We have observed many balloon fragments in a heap at the seafloor,” so lava balloons have been launching at the spot for quite some time, he said. “I call it making lava blisters.”
Küppers hopes next to quantify the condi-tions of blister and balloon formation, such as how much gas is needed to bulge the lava interface, drive the lava out, and make it detach from the seafloor.
By Lauren Lipuma (@ Tenacious _ She), Contribut-ing Writer
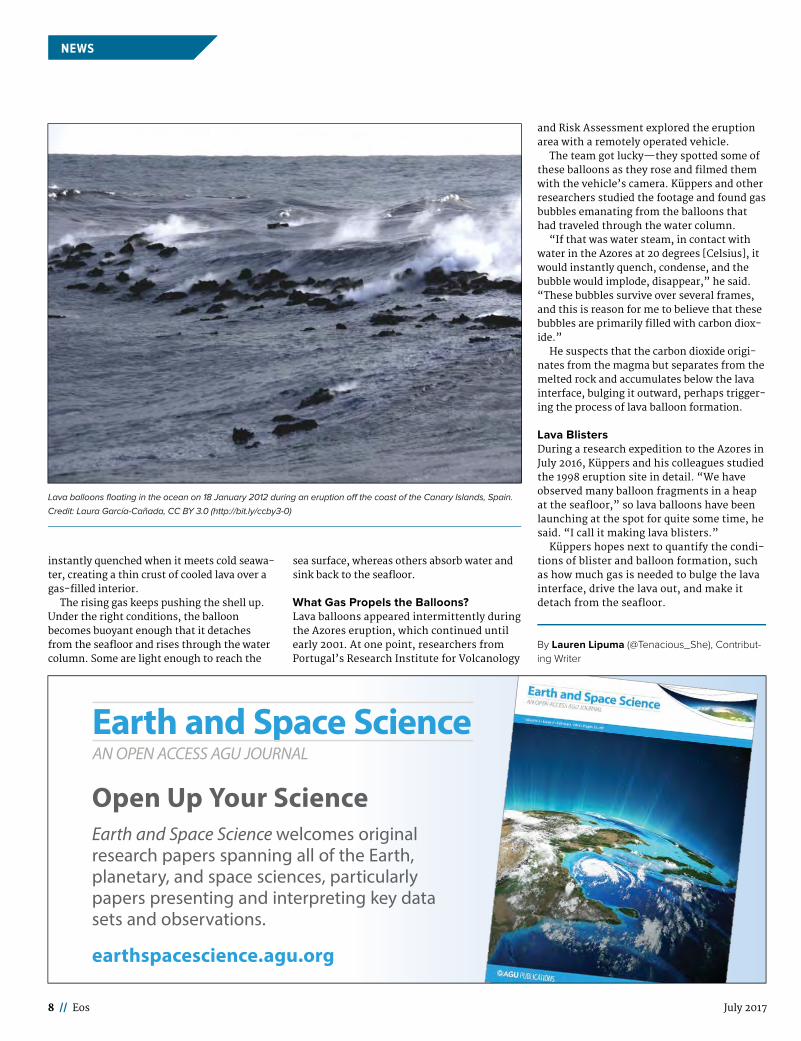
Lava balloons fl oating in the ocean on 18 January 2012 during an eruption off the coast of the Canary Islands, Spain.
Credit: Laura García- Cañada, CC BY 3.0 (http:// bit . ly/ ccby3-0)
Earth & Space Science News Eos.org // 9
MEETING REPORT
Space weather research is motivated by the quest to understand the effects of solar activity on the near- Earth space
environment and the severe impacts these effects can have on infrastructure systems and technologies in space and on Earth. As this sensitive infrastructure grows, so does the vul-nerability of our society to solar storms. The growing importance of extreme space weather events underscores the need to develop mod-eling and predictive capabilities for these low- probability but high- impact events.
A workshop last August brought together participants from universities, research cen-ters, and federal agencies. Participants assessed current capabilities in modeling severe space weather events, and they addressed potential approaches for developing capabilities that can facilitate preparedness and transition from research to operational forecasting.
A Developing Response to an Established RiskThe famous solar storm referred to as the Carrington Event of 1859 illustrates the
potential consequences of space weather events for everyday life on Earth. This event sparked auroras as far south as the Carib-bean and blew out telegraph systems. A comparable storm today would be devastat-ing.
Several recent intense geospace storms also serve as a warning. In particular, the 23 July 2012 solar storm, which had a magni-tude comparable to the Carrington Event, narrowly missed Earth but provided clear evidence of the likelihood of such intense events.
The U.S. government has provided a strong impetus to study space weather. In October 2015, the White House Office of Sci-ence and Technology Policy released the National Space Weather Strategy (see http:// bit . ly/ space - weather - strategy) and an accompanying action plan (see http:// bit . ly/ space - weather - action). A 13 October 2016 presidential executive order calls for space weather preparedness and efforts to mini-mize the extent of economic loss and human hardship from space weather (see http:// bit . ly/ space - weather - EO).
Workshop participants noted that despite major developments in space weather mod-els, space weather forecasting is still in an early stage. One of the challenges they dis-cussed is the dearth of spacecraft monitor-ing the solar wind between Earth and the Sun. At present these are limited to the L1 point, where Earth’s and the Sun’s gravi-ties balance out and where several spacecraft are stationed (Advanced Composition Explorer (ACE), Deep Space Climate Obser-vatory (DSCOVR), Wind, and Solar and Heliospheric Observatory (SOHO)).
Because of this dearth of data, a strategy for integrating data and modeling is essen-tial, attendees noted. They agreed that the example of terrestrial weather forecasting provides compelling guidance: Data assimi-lation and ensemble forecasting have pro-duced dramatic improvements in predic-tions. Such a strategy should aim to overcome the “valley of death”—the diffi-culties in the transition from research to operations that infamously claim so many promising ideas.
A Need for Advanced Modeling CapabilitiesAt the workshop, participants discussed chal-lenges in modeling and prediction of extreme events in general. However, they agreed that the severe consequences of such events require developing strategies or frameworks that combine the capabilities of first principles and data- driven approaches. Data- driven modeling is based on complexity sci-ence and does not require modeling assump-tions, so it is an important framework that has provided methods to quantify uncer-tainty. In space weather, such approaches are very relevant, especially considering the cur-rent state of numerical models.
Workshop participants identified the need for increasing open access to models in space weather research. To move toward forecast-ing, testing and validating models are essen-tial, which requires that models be readily accessible to the community. As in the case of terrestrial weather, there is a fundamental need for open- access numerical models to accelerate model development and their transition from the research community to operational use.
This workshop was funded by NSF/PREEVENTS grant AGS 1638499.
By A. Surjalal Sharma (email: ssh@astro . umd . edu) and Eugenia E. Kalnay, University of Mary-land, College Park; and Michael Bonadonna, National Oceanic and Atmospheric Administra-tion, Silver Spring, Md.
Predictive Capability for Extreme Space Weather EventsWorkshop on Modeling and Prediction of Extreme Space Weather EventsCollege Park, Maryland, 22–24 August 2016
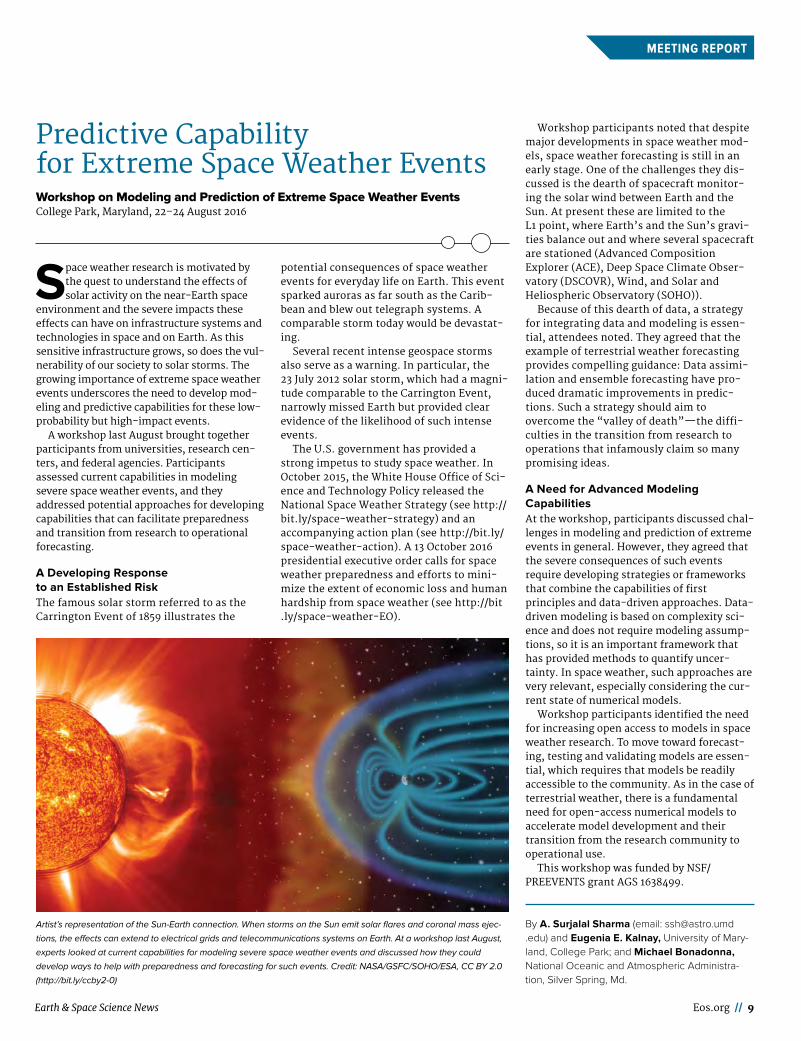
Artist’s representation of the Sun-Earth connection. When storms on the Sun emit solar flares and coronal mass ejec-
tions, the effects can extend to electrical grids and telecommunications systems on Earth. At a workshop last August,
experts looked at current capabilities for modeling severe space weather events and discussed how they could
develop ways to help with preparedness and forecasting for such events. Credit: NASA/GSFC/SOHO/ESA, CC BY 2.0
(http://bit.ly/ccby2-0)
10 // Eos July 2017
OPINION
On the Sunday before last year’s AGU Fall Meeting—about a month after the U.S. elections—I found myself in a
windowless room, deep in the basement of the San Francisco Marriott Marquis Hotel. It was 8:00 a.m., and I was shaking off jet lag to attend a science communications workshop hosted by AGU’s Sharing Science program.
Communications, in this context, means talking about science to people who aren’t sci-entists. The workshop covered three topics: interacting with the general public, which I love; talking to journalists, which is what drew me; and interactions with politicians. I figured I’d zone out through that last bit.
But that isn’t how things turned out.
A Eureka MomentLet’s back up a bit. Even when I was a postdoc in the Washington, D. C., area, almost 2 decades ago, I avoided politics like the plague.
This disengagement isn’t just unreasoned distaste. Some years ago, prompted by a request from a scientist I greatly admire to sign a policy statement I wholeheartedly agreed with, I thought long and hard about whether to engage in political discourse as a scientist.
In the end, after hearing a timely and ter-rific set of talks (see http:// bit . ly/ scipolicy), I did not sign that statement. Instead, I set-tled on the idea that science can tell us what is true but not what to do—that policy might be grounded in truth but ultimately reflects values.
That principle served me well enough for a decade, even in the face of growing unease about increasingly counterfactual arguments against the increasingly deep understanding of climate change. But times have changed, and it’s become unnervingly normal to advance political agendas by denying the truths that science provides.
Our democratic system means that I expect power to be mutable. But I also expect the rules to stay more or less the same, and these days that’s not such a sure bet.
Sitting in that basement room, listening to the people who argue for our work to the peo-ple who use what we learn (and pay for our curiosity), I knew that even if I’m unwilling to advocate for particular policies in my role as a scientist, I am more than ready to advocate for what we do and to make the case for stability, intellectual freedom, and openness in how we do it.
A Visit to CongressWith this readiness to advocate, I took advan-tage of a trip to Washington earlier this year to spend a day of my own time visiting members of Congress.
The visits were arranged by AGU’s public affairs staff, the same people who run AGU’s Congressional Visits Days. In the weeks before the trip, the staff helped me craft a message, then refine a script with stories and concrete requests. They identified whom I could meet with and what committee memberships or legislative sponsorships would make the visit most relevant. They joined me on those visits, guiding me through a bewildering building and an even more bewildering social world.
Acquiring a Taste for Advocacy
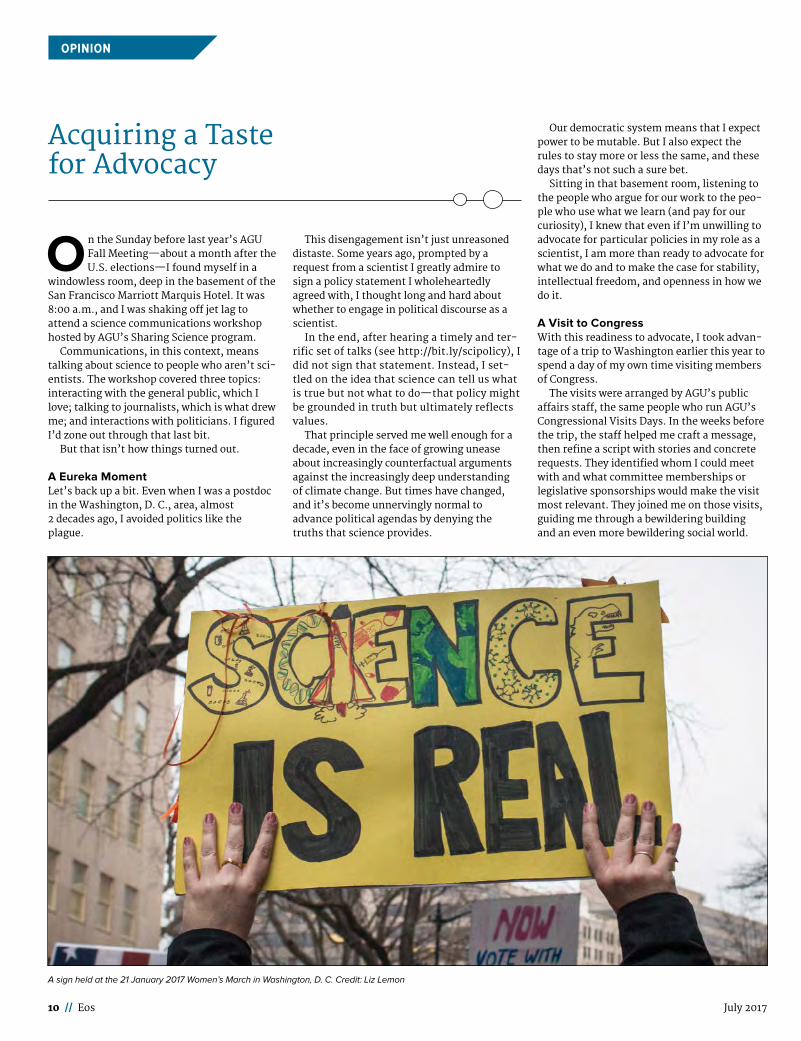
A sign held at the 21 January 2017 Women’s March in Washington, D. C. Credit: Liz Lemon
Earth & Space Science News Eos.org // 11
OPINION
Anecdotes make facts personal—and people, after all, are far more important than ideas.
The legislative side of the federal govern-ment is like another country: unfamiliar, sometimes uncomfortable, but easy enough to get the hang of, once I had dusted off my interview suit.
Capitol Hill runs on young people. Most staff are the age of graduate stu-dents, the really senior staff about as old as postdocs. Nonetheless, it quickly becomes apparent that these are smart people with knowledge and power.
Some social customs take getting used to. In everyday conversation, it would be rude to make a request without establishing a connection, but on the Hill “the ask” is the first thing on the table because this gives your hosts the chance to calibrate who you are and how to respond to you.
One- off stories have little value in scien-tific arguments, but they are gold in congres-sional offices. That’s partly because time is short (most visits last 30 minutes or less). But it’s also because anecdotes make facts personal—and people, after all, are far more important than ideas.
My biggest surprise, however, was learning firsthand how hard congressional staff work to find common ground. For my visit, AGU had arranged meetings with representatives from both political parties, guaranteeing that some
of the people I met would have viewpoints dif-ferent than my own. And yet every single staff member went out of his or her way to hear what I had to say, respond thoughtfully, and identify one or more points on which our agendas aligned.
No Landscape Is PermanentOf course, no single visit by one scientist is going to change any legislator’s well- developed policy stance. Does that mean the visits are pointless or self- indulgent?
I don’t think so. On the most basic level, politicians respond to public pressure and opinion, and newly engaged, vocal, and orga-nized communities can be valuable support or formidable opponents.
More fundamental, politicians have to triangulate an enormous range of priorities. The fate of Earth science is rarely the most pressing or compel-ling. And yet they listen, and I’d like to think that positions might change.
Musing on the way home from my congressional visit, I couldn’t shake the image of a stream running over
rocks. The landscape right now might seem so permanent, but then there’s the Grand Can-yon….
By Robert Pincus (email: robert . pincus@ colorado . edu), University of Colorado Boulder
Editor’s Note: For more information on AGU’s Sharing Science program and Congressional Visits Days, see https:// sharingscience . agu . org/ and http:// bit . ly/ AGUcvd.
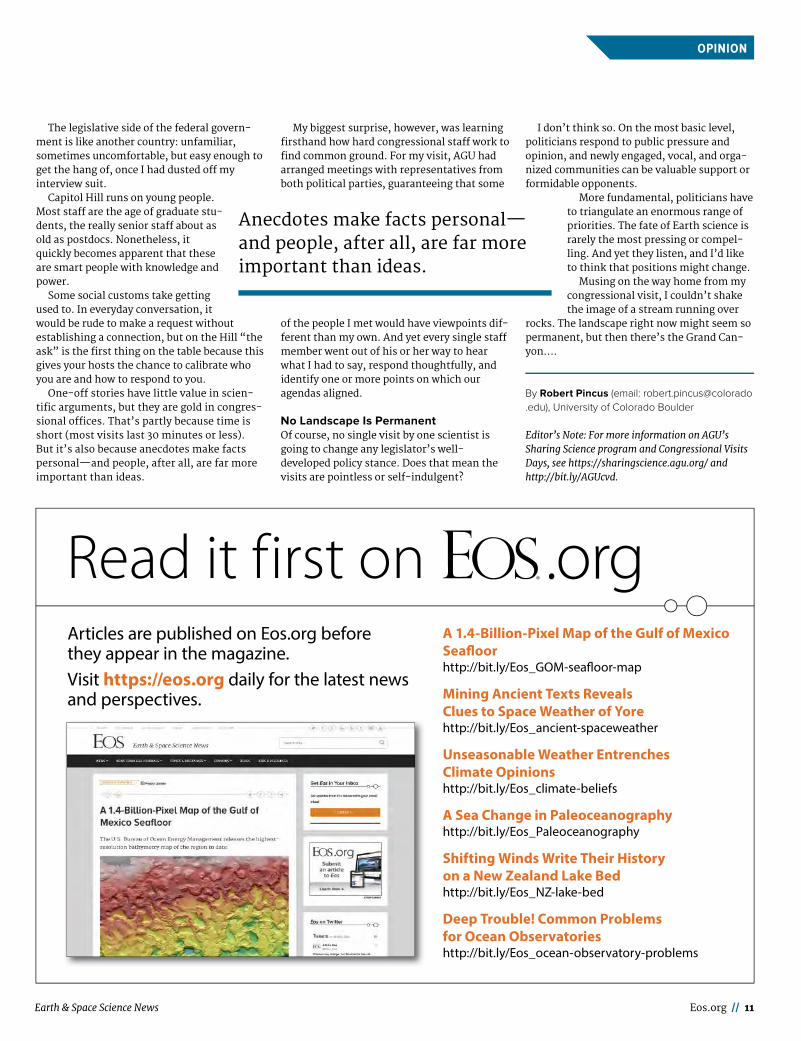
Read it first on A 1.4-Billion-Pixel Map of the Gulf of Mexico Sea� oorhttp://bit.ly/Eos_GOM-sea� oor-map
Mining Ancient Texts Reveals Clues to Space Weather of Yorehttp://bit.ly/Eos_ancient-spaceweather
Unseasonable Weather Entrenches Climate Opinionshttp://bit.ly/Eos_climate-beliefs
A Sea Change in Paleoceanographyhttp://bit.ly/Eos_Paleoceanography
Shifting Winds Write Their History on a New Zealand Lake Bedhttp://bit.ly/Eos_NZ-lake-bed
Deep Trouble! Common Problems for Ocean Observatorieshttp://bit.ly/Eos_ocean-observatory-problems
Articles are published on Eos.org beforethey appear in the magazine.Visit https://eos.org daily for the latest newsand perspectives.
12 // Eos July 2017
By Nikolai M. Shapiro, Christoph Sens- Schönfelder, Birger G. Lühr, Michael Weber, Ilyas Abkadyrov, Evegeny I. Gordeev, Ivan Koulakov, Andrey Jakovlev, Yulia A. Kugaenko, and Vadim A. Saltykov
VOLCANOCLUSTER
UNDERSTANDING KAMCHATKA’SEXTRAORDINARY
Earth & Space Science News Eos.org // 13
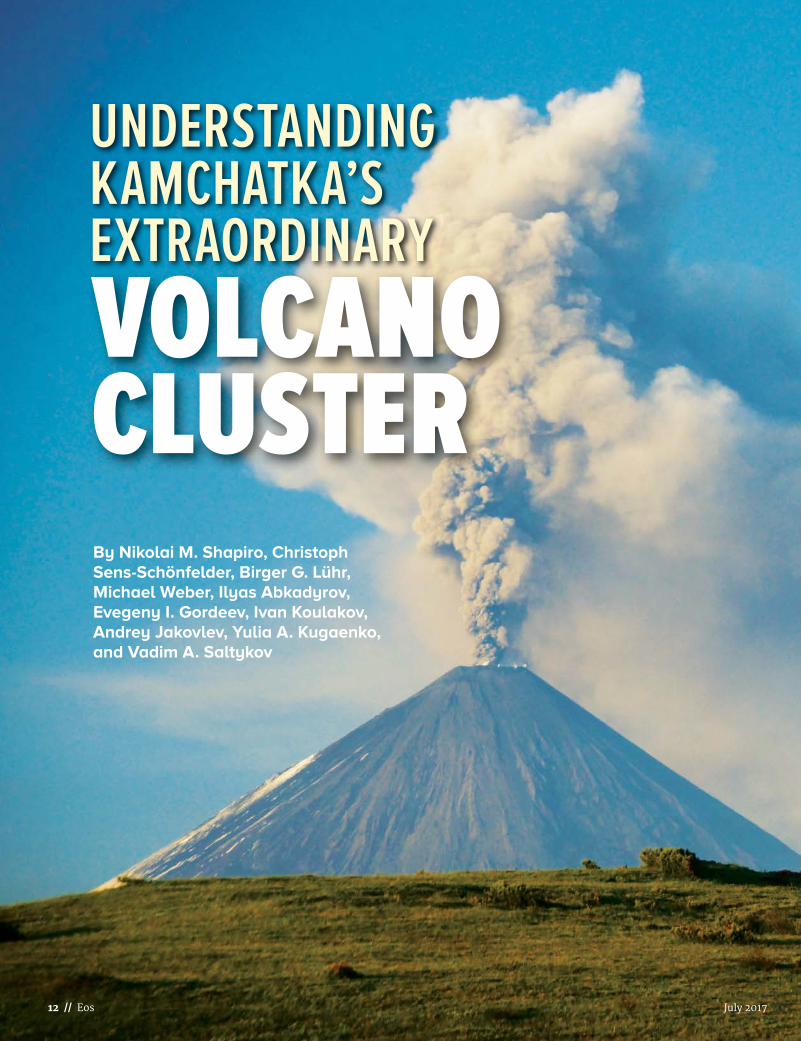
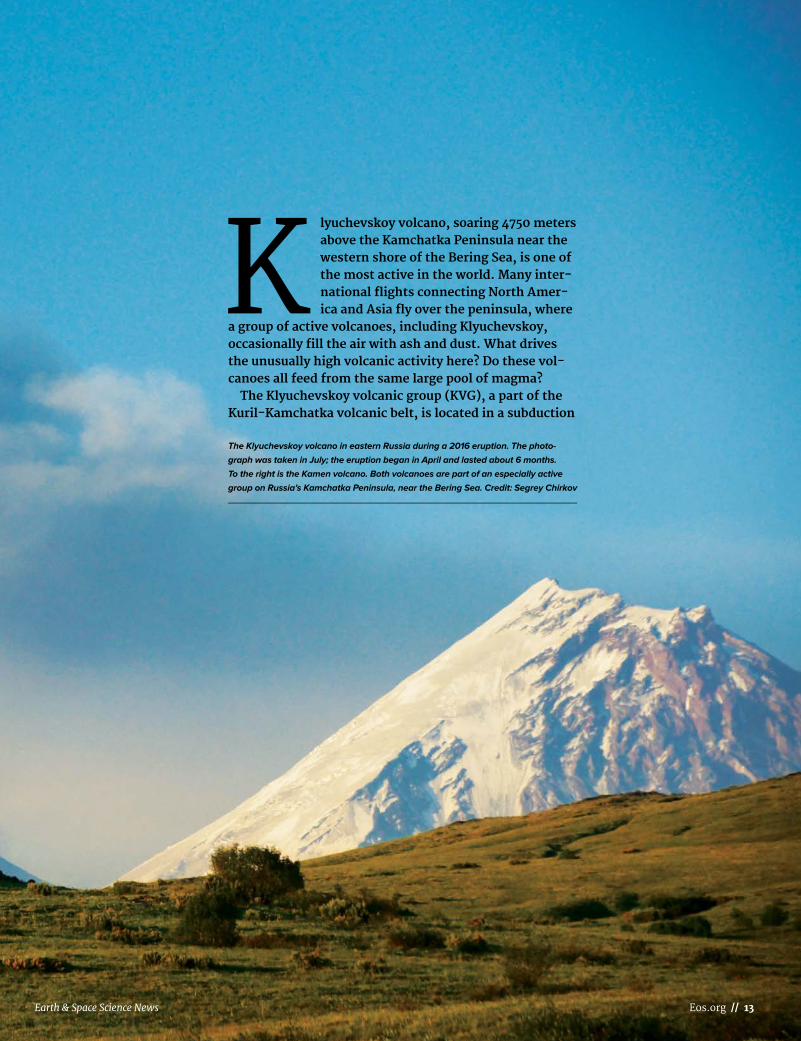
Klyuchevskoy volcano, soaring 4750 meters above the Kamchatka Peninsula near the western shore of the Bering Sea, is one of the most active in the world. Many inter-national flights connecting North Amer-ica and Asia fly over the peninsula, where
a group of active volcanoes, including Klyuchevskoy, occasionally fill the air with ash and dust. What drives the unusually high volcanic activity here? Do these vol-canoes all feed from the same large pool of magma?
The Klyuchevskoy volcanic group (KVG), a part of the Kuril- Kamchatka volcanic belt, is located in a subduction
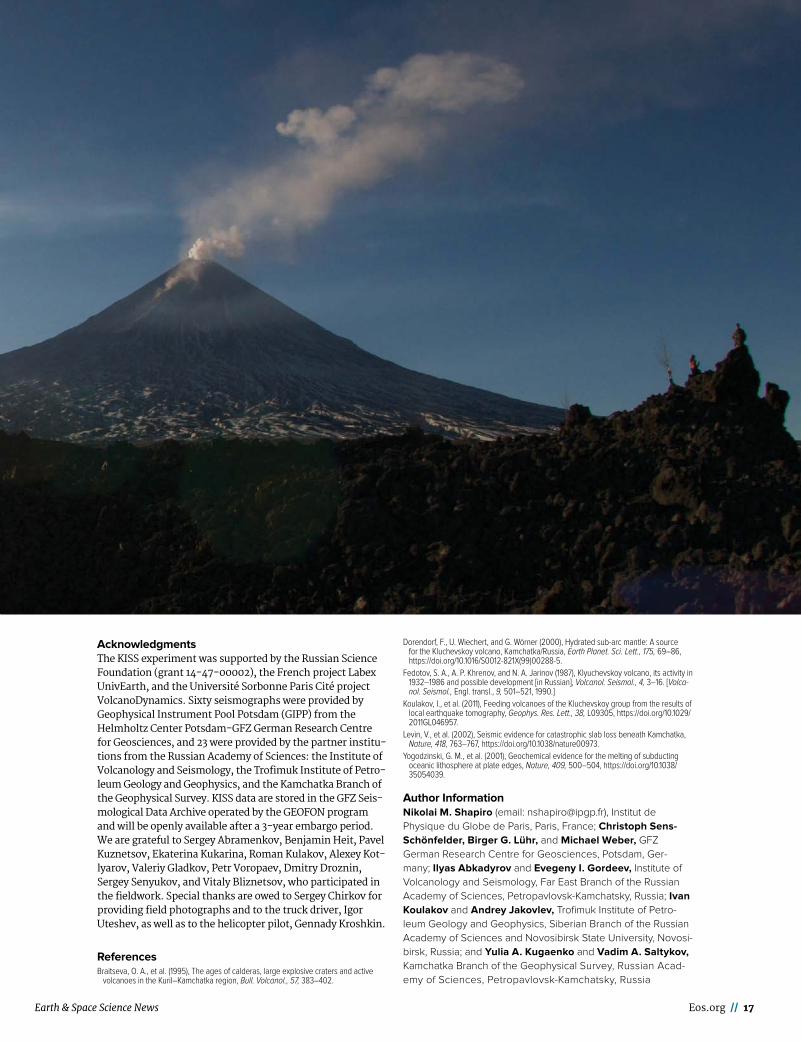
The Klyuchevskoy volcano in eastern Russia during a 2016 eruption. The photo-
graph was taken in July; the eruption began in April and lasted about 6 months.
To the right is the Kamen volcano. Both volcanoes are part of an especially active
group on Russia’s Kamchatka Peninsula, near the Bering Sea. Credit: Segrey Chirkov
VOLCANOCLUSTER
14 // Eos July 2017
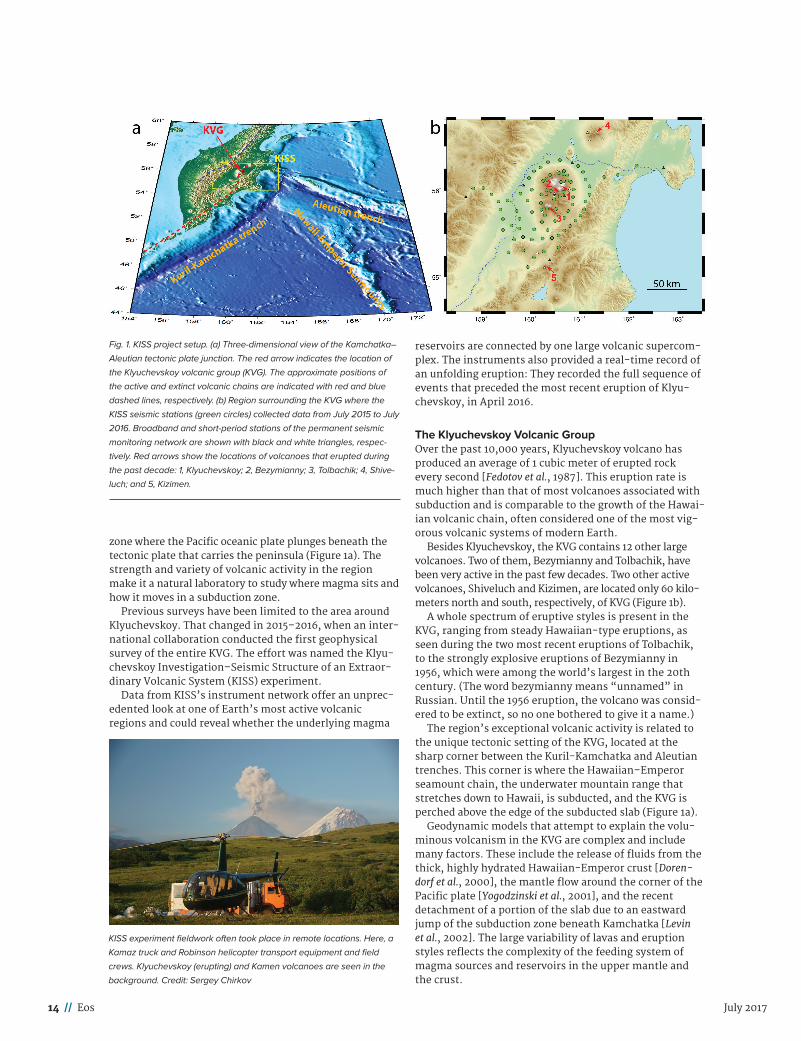
zone where the Pacific oceanic plate plunges beneath the tectonic plate that carries the peninsula (Figure 1a). The strength and variety of volcanic activity in the region make it a natural laboratory to study where magma sits and how it moves in a subduction zone.
Previous surveys have been limited to the area around Klyuchevskoy. That changed in 2015–2016, when an international collaboration conducted the first geophysical survey of the entire KVG. The effort was named the Klyuchevskoy Investigation– Seismic Structure of an Extraordinary Volcanic System (KISS) experiment.
Data from KISS’s instrument network offer an unprecedented look at one of Earth’s most active volcanic regions and could reveal whether the underlying magma
reservoirs are connected by one large volcanic supercomplex. The instruments also provided a real time record of an unfolding eruption: They recorded the full sequence of events that preceded the most recent eruption of Klyuchevskoy, in April 2016.
The Klyuchevskoy Volcanic GroupOver the past 10,000 years, Klyuchevskoy volcano has produced an average of 1 cubic meter of erupted rock every second [Fedotov et al., 1987]. This eruption rate is much higher than that of most volcanoes associated with subduction and is comparable to the growth of the Hawaiian volcanic chain, often considered one of the most vigorous volcanic systems of modern Earth.
Besides Klyuchevskoy, the KVG contains 12 other large volcanoes. Two of them, Bezymianny and Tolbachik, have been very active in the past few decades. Two other active volcanoes, Shiveluch and Kizimen, are located only 60 kilometers north and south, respectively, of KVG (Figure 1b).
A whole spectrum of eruptive styles is present in the KVG, ranging from steady Hawaiian type eruptions, as seen during the two most recent eruptions of Tolbachik, to the strongly explosive eruptions of Bezymianny in 1956, which were among the world’s largest in the 20th century. (The word bezymianny means “unnamed” in Russian. Until the 1956 eruption, the volcano was considered to be extinct, so no one bothered to give it a name.)
The region’s exceptional volcanic activity is related to the unique tectonic setting of the KVG, located at the sharp corner between the Kuril Kamchatka and Aleutian trenches. This corner is where the Hawaiian– Emperor seamount chain, the underwater mountain range that stretches down to Hawaii, is subducted, and the KVG is perched above the edge of the subducted slab (Figure 1a).
Geodynamic models that attempt to explain the voluminous volcanism in the KVG are complex and include many factors. These include the release of fluids from the thick, highly hydrated Hawaiian Emperor crust [Doren-dorf et al., 2000], the mantle flow around the corner of the Pacific plate [Yogodzinski et al., 2001], and the recent detachment of a portion of the slab due to an eastward jump of the subduction zone beneath Kamchatka [Levin et al., 2002]. The large variability of lavas and eruption styles reflects the complexity of the feeding system of magma sources and reservoirs in the upper mantle and the crust.
Fig. 1. KISS project setup. (a) Three- dimensional view of the Kamchatka–
Aleutian tectonic plate junction. The red arrow indicates the location of
the Klyu chevskoy volcanic group (KVG). The approximate positions of
the active and extinct volcanic chains are indicated with red and blue
dashed lines, respectively. (b) Region surrounding the KVG where the
KISS seismic stations (green circles) collected data from July 2015 to July
2016. Broadband and short- period stations of the permanent seismic
monitoring network are shown with black and white triangles, respec-
tively. Red arrows show the locations of volcanoes that erupted during
the past decade: 1, Klyuchevskoy; 2, Bezymianny; 3, Tolbachik; 4, Shive-
luch; and 5, Kizimen.
KISS experiment fieldwork often took place in remote locations. Here, a
Kamaz truck and Robinson helicopter transport equipment and field
crews. Klyuchevskoy (erupting) and Kamen volcanoes are seen in the
background. Credit: Sergey Chirkov
Earth & Space Science News Eos.org // 15
A Unique Natural LaboratoryBecause of its strong and variable activity, the KVG is a unique natural laboratory for studying volcanism in a subduction zone. Understanding how this zone functions requires detailed knowledge about the configuration of the subducted oceanic plates and about the distribution of magma conduits and reservoirs within the mantle wedge and the crust. A particularly important question is whether the individual KVG volcanoes are fed from independent magma sources or whether they form a single interconnected magmatic supersystem.
Gathering information about the deep KVG structure requires the use of geophysical methods. Past seismological studies [Koulakov et al., 2011] have revealed possible pathways of melts ascending from the subducting slab and a multilevel system of magma reservoirs in the crust. However, the structures that these studies illuminated are restricted mainly to a few tens of kilometers surrounding Klyuchevskoy volcano, where most existing permanent seismic stations are located (Figure 1b). A full understanding of the behavior of the KVG magmatic sys
tem requires an investigation of subsurface structures at a much larger scale.
The KISS ProjectTo undertake such a large scale seismological investigation of the KVG, we formed a consortium of institutions from Russia, France, and Germany and designed the KISS experiment. We operated a temporary network of 83 seismographs between August 2015 and July 2016.
The experiment took place in difficult terrain; helicopters and off road trucks were needed to transport the equipment and field crews to the installation sites. An eruption triggered mudflow destroyed one site, and a few others were wrecked by bears. Despite the harsh environment, the team recovered data from 77 instruments (Figure 1b).
Initial inspection of seismograms indicates that the network successfully recorded many tectonic and volcanic earthquakes and volcanic tremors. The collected data set, combined with records from permanent seismic stations, will be used to study various types of earthquakes associ
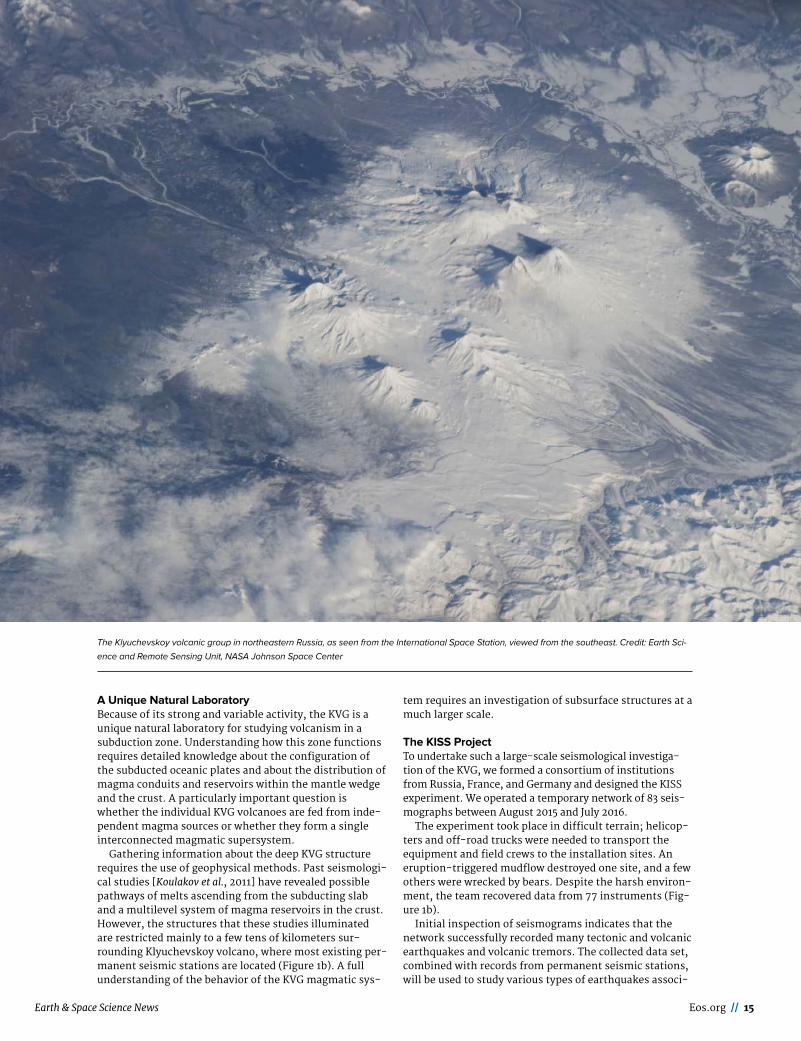
The Klyuchevskoy volcanic group in northeastern Russia, as seen from the International Space Station, viewed from the southeast. Credit: Earth Sci-
ence and Remote Sensing Unit, NASA Johnson Space Center
16 // Eos July 2017
ated with the volcanic and magmatic activity and to image the crust and upper mantle with multiscale seismic tomography.
These results will help us understand why exceptionally large amounts of melts are generated in the upper mantle at the Kamchatka Aleutian subduction corner and how these magmas are transformed during the ascent through the crust, producing the vigorous and very variable volcanism we see at the surface.
Monitoring the KVG for Hazardous EruptionsVolcanic eruptions regularly affect a few small settlements located near the KVG, and they pose a significant threat to aviation because many international flights that connect North America and Asia pass over Kamchatka. Large explosive eruptions such as those of Bezymianny in 1956 and Shiveluch in 1964, when about 1 cubic kilometer of erupted material was ejected, might be particularly dangerous.
Moreover, Kamchatka has a well established record of even larger caldera forming eruptions in the Holocene [Braitseva et al., 1995], with the largest of them forcibly ejecting about 150 cubic kilometers of rock fragments (tephra).
Considering that at present more than half of Kamchatka volcanic magmas are generated below the KVG, we cannot ignore the possibility of a future extreme explosive event in this region. We expect the results of the KISS experiment to help us evaluate such extreme event scenarios by improving our knowledge of the size of the KVG crustal magmatic reservoirs, along with the volume of potentially explosive magmas they might contain.
When the Klyuchevskoy volcano rumbled back to life and erupted in April 2016 (see http:// bit . ly/ Klyuchevskoy eruption), the KISS network recorded the full sequence of reactivation leading up to the eruption. We will use this data set to improve our knowledge of how the rise of magma and the preeruptive buildup of pressure are expressed in the continuous seismic signals. The data will also help refine the routine monitoring of the KVG and other nearby volcanoes performed by the Kamchatka Branch of Russia’s Geophysical Survey and by the Kamchatka Volcanic Eruption Response Team, which is operated by the Institute of Volcanology and Seismology.
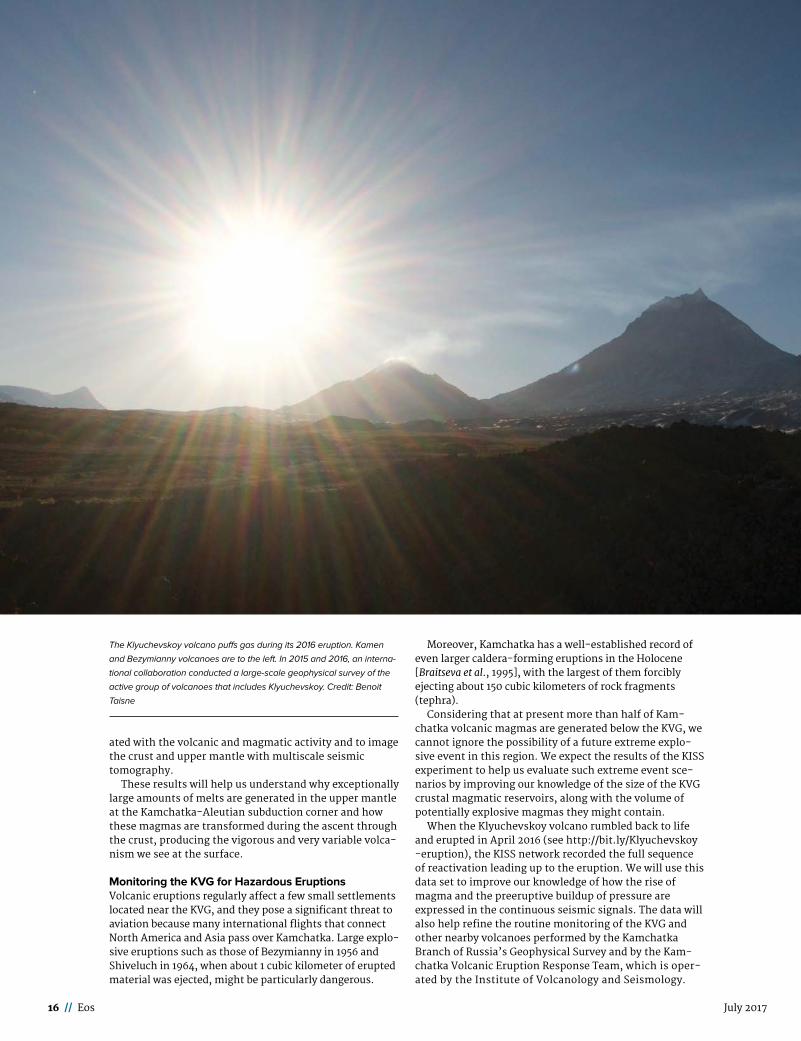
The Klyuchevskoy volcano puffs gas during its 2016 eruption. Kamen
and Bezymianny volcanoes are to the left. In 2015 and 2016, an interna-
tional collaboration conducted a large-scale geophysical survey of the
active group of volcanoes that includes Klyuchevskoy. Credit: Benoit
Taisne
Earth & Space Science News Eos.org // 17
Acknowledgments The KISS experiment was supported by the Russian Science Foundation (grant 14 47 00002), the French project Labex UnivEarth, and the Universite Sorbonne Paris Cite project VolcanoDynamics. Sixty seismographs were provided by Geophysical Instrument Pool Potsdam (GIPP) from the Helmholtz Center Potsdam GFZ German Research Centre for Geosciences, and 23 were provided by the partner institutions from the Russian Academy of Sciences: the Institute of Volcanology and Seismology, the Trofimuk Institute of Petroleum Geology and Geophysics, and the Kamchatka Branch of the Geophysical Survey. KISS data are stored in the GFZ Seismological Data Archive operated by the GEOFON program and will be openly available after a 3 year embargo period. We are grateful to Sergey Abramenkov, Benjamin Heit, Pavel Kuznetsov, Ekaterina Kukarina, Roman Kulakov, Alexey Kotlyarov, Valeriy Gladkov, Petr Voropaev, Dmitry Droznin, Sergey Senyukov, and Vitaly Bliznetsov, who participated in the fieldwork. Special thanks are owed to Sergey Chirkov for providing field photographs and to the truck driver, Igor Uteshev, as well as to the helicopter pilot, Gennady Krosh kin.
ReferencesBraitseva, O. A., et al. (1995), The ages of calderas, large explosive craters and active
volcanoes in the Kuril–Kamchatka region, Bull. Volcanol., 57, 383–402.
Dorendorf, F., U. Wiechert, and G. Wörner (2000), Hydrated sub- arc mantle: A source for the Kluchevskoy volcano, Kamchatka/Russia, Earth Planet. Sci. Lett., 175, 69–86, https:// doi . org/ 10 . 1016/ S0012 - 821X (99) 00288 - 5.
Fedotov, S. A., A. P. Khrenov, and N. A. Jarinov (1987), Klyuchevskoy volcano, its activity in 1932–1986 and possible development [in Russian], Volcanol. Seismol., 4, 3–16. [Volca-nol. Seismol., Engl. transl., 9, 501–521, 1990.]
Koulakov, I., et al. (2011), Feeding volcanoes of the Kluchevskoy group from the results of local earthquake tomography, Geophys. Res. Lett., 38, L09305, https:// doi . org/ 10 . 1029/ 2011GL046957.
Levin, V., et al. (2002), Seismic evidence for catastrophic slab loss beneath Kamchatka, Nature, 418, 763–767, https:// doi . org/ 10 . 1038/ nature00973.
Yogodzinski, G. M., et al. (2001), Geochemical evidence for the melting of subducting oceanic lithosphere at plate edges, Nature, 409, 500–504, https:// doi . org/ 10 . 1038/ 35054039.
Author InformationNikolai M. Shapiro (email: nshapiro@ ipgp. fr), Institut de Physique du Globe de Paris, Paris, France; Christoph Sens- Schonfelder, Birger G. Lühr, and Michael Weber, GFZ German Research Centre for Geosciences, Potsdam, Ger-many; Ilyas Abkadyrov and Evegeny I. Gordeev, Institute of Volcanology and Seismology, Far East Branch of the Russian Academy of Sciences, Petropavlovsk- Kamchatsky, Russia; Ivan Koulakov and Andrey Jakovlev, Trofimuk Institute of Petro-leum Geology and Geophysics, Siberian Branch of the Russian Academy of Sciences and Novosibirsk State University, Novosi-birsk, Russia; and Yulia A. Kugaenko and Vadim A. Saltykov, Kamchatka Branch of the Geophysical Survey, Russian Acad-emy of Sciences, Petropavlovsk- Kamchatsky, Russia
18 // Eos July 2017
A mountain bike scrambling across rough terrain is a common sight in many areas. Seeing one equipped with a magnetic sensor and other gear doing the same thing, however, may cause you to do a double take.
A team of researchers from the University of Haifa and the Geological Survey of Israel has designed such a sensor- equipped mountain bike. The setup holds promise to improve ground data collection for regional mapping.
Although walking with a magnetic sensor may be the cheapest and most widely used method of collecting field data, riding a sensor- equipped bicycle offers significantly
A BIKE BUILT FOR
By Uri Schattner
MAGNETICMAPPING
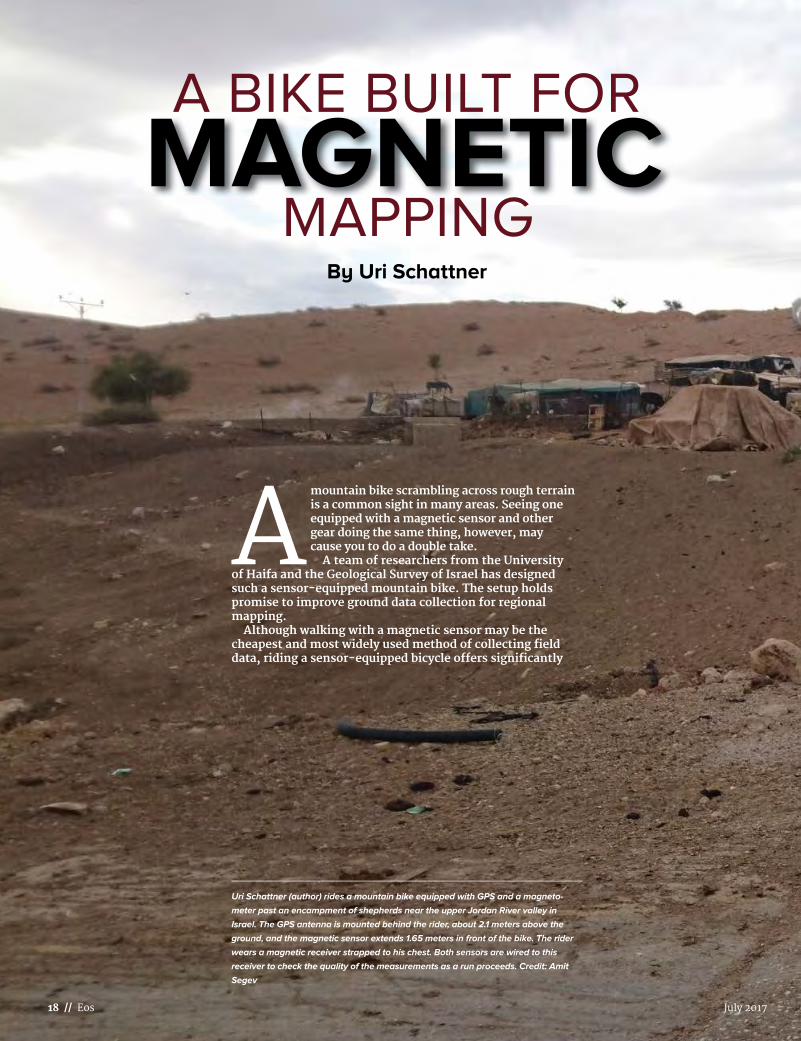
Uri Schattner (author) rides a mountain bike equipped with GPS and a magneto-
meter past an encampment of shepherds near the upper Jordan River valley in
Israel. The GPS antenna is mounted behind the rider, about 2.1 meters above the
ground, and the magnetic sensor extends 1.65 meters in front of the bike. The rider
wears a magnetic receiver strapped to his chest. Both sensors are wired to this
receiver to check the quality of the measurements as a run proceeds. Credit: Amit
Segev
Earth & Space Science News Eos.org // 19
By Uri Schattner
Mounting a magnetic sensor on a bicycle offers an effi cient, low- cost method of collecting ground magnetic fi eld data over rough terrain where conventional vehicles dare not venture.
20 // Eos July 2017
more efficient data collection while maintaining data quality and lowering costs considerably.
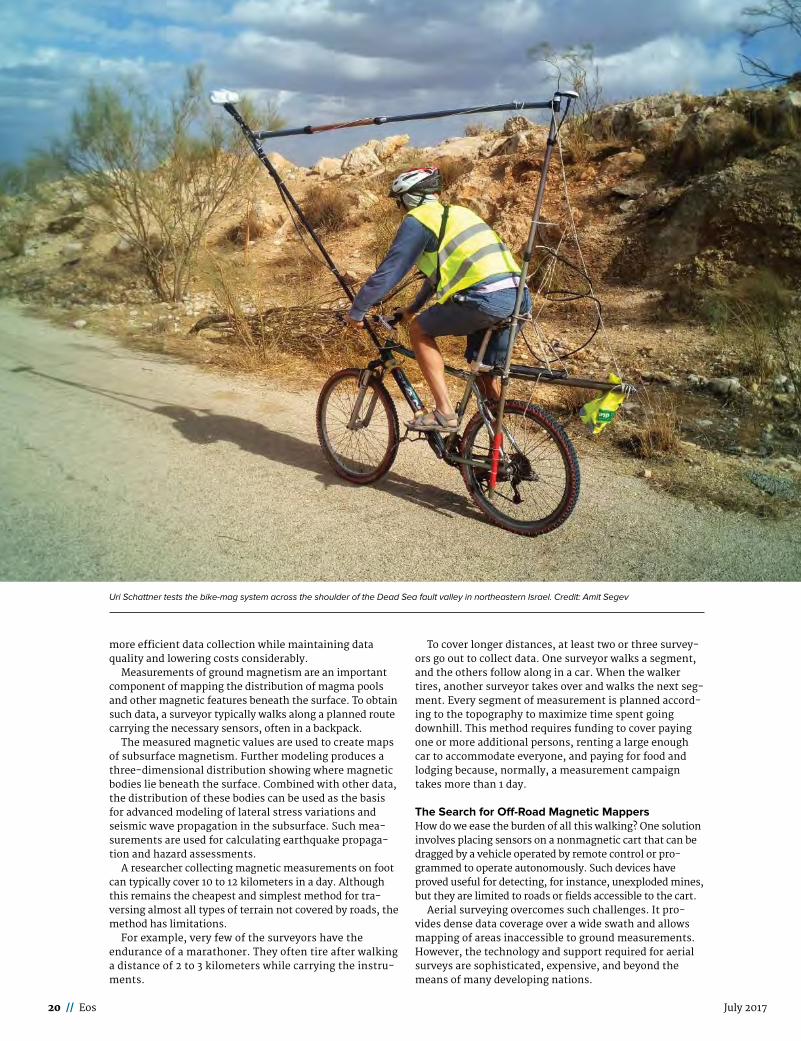
Measurements of ground magnetism are an important component of mapping the distribution of magma pools and other magnetic features beneath the surface. To obtain such data, a surveyor typically walks along a planned route carrying the necessary sensors, often in a backpack.
The measured magnetic values are used to create maps of subsurface magnetism. Further modeling produces a three dimensional distribution showing where magnetic bodies lie beneath the surface. Combined with other data, the distribution of these bodies can be used as the basis for advanced modeling of lateral stress variations and seismic wave propagation in the subsurface. Such measurements are used for calculating earthquake propagation and hazard assessments.
A researcher collecting magnetic measurements on foot can typically cover 10 to 12 kilometers in a day. Although this remains the cheapest and simplest method for traversing almost all types of terrain not covered by roads, the method has limitations.
For example, very few of the surveyors have the endurance of a marathoner. They often tire after walking a distance of 2 to 3 kilometers while carrying the instruments.
To cover longer distances, at least two or three surveyors go out to collect data. One surveyor walks a segment, and the others follow along in a car. When the walker tires, another surveyor takes over and walks the next segment. Every segment of measurement is planned according to the topography to maximize time spent going downhill. This method requires funding to cover paying one or more additional persons, renting a large enough car to accommodate everyone, and paying for food and lodging because, normally, a measurement campaign takes more than 1 day.
The Search for Off- Road Magnetic MappersHow do we ease the burden of all this walking? One solution involves placing sensors on a nonmagnetic cart that can be dragged by a vehicle operated by remote control or programmed to operate autonomously. Such devices have proved useful for detecting, for instance, unexploded mines, but they are limited to roads or fields accessible to the cart.
Aerial surveying overcomes such challenges. It provides dense data coverage over a wide swath and allows mapping of areas inaccessible to ground measurements. However, the technology and support required for aerial surveys are sophisticated, expensive, and beyond the means of many developing nations.
Uri Schattner tests the bike-mag system across the shoulder of the Dead Sea fault valley in northeastern Israel. Credit: Amit Segev
Earth & Space Science News Eos.org // 21
However, bicycle- mounted magnetic sensors provide an effi-cient, economical, low- tech design that maintains data accu-racy. The new design is potentially suitable for use in remote areas and developing countries.
While collecting data on the bike, we need only one driver and one rider. A segment of data col-lection can be several tens of kilo-meters long, with no replacement of surveyors along the way. The extra expenses are also lower than those used by walkers for the car, fuel, food, and accommodation if the measurements take more than 1 day.
In addition, over topographi-cally flat regions, the rider does not need the technician or the accompanying car at all. This gives the rider more uninterrupted stretches of time to collect data.
Equipping a Mountain BikeWe fixed the components of the magnetometer system to an aluminum- framed, hard- tail mountain bike. We used a design called the All- Terrain Bicycle Geomagnetic Map-ping System (ATBGMS; see http:// bit . ly/ ATBGMS), created by researchers from the University of South Florida. In ATBGMS, the magnetic sensor is fixed to a pole extending about 1.3 meters in front of the bike handlebar and turns along with the handlebar [La Femina et al., 1998].
This design worked well on paved roads and relatively smooth dirt roads. We could also easily carry the bike over obstacles such as fences and stairs.
However, the ATBGMS design was not robust enough to support the weight of the magnetic sensor over rougher terrain. Stresses on the equipment bent the handlebar and broke the front pole, dropping the magnetic sensor to the ground.
Designing a New Prototype: Bike- MagOur solution to the problems we encountered with ATBGMS was to make the sensor mounting more robust, using a set of polypropylene pipes assembled into a frame-work of vertical triangles. Anchored to the bike frame, this new framework placed the sensor at a fixed height above ground (2.2 meters), 1.65 meters in front of the handlebar.
In the new design, the sensor does not turn along with the handlebar but remains aligned with the bike frame and the direction of motion during measurements. At the same time, the framework is flexible enough to absorb shocks at a wide range of velocities during a ride.
Our “ bike- mag” design has several advantages. The location of the sensor on the framework rather than on the handlebar gives the rider more maneuverability. Moreover, the robustness and flexibility of the polypro-pylene framework extend data collection to rougher ter-rain, such as dirt roads, single tracks, and footpaths along uphill and downhill slopes.
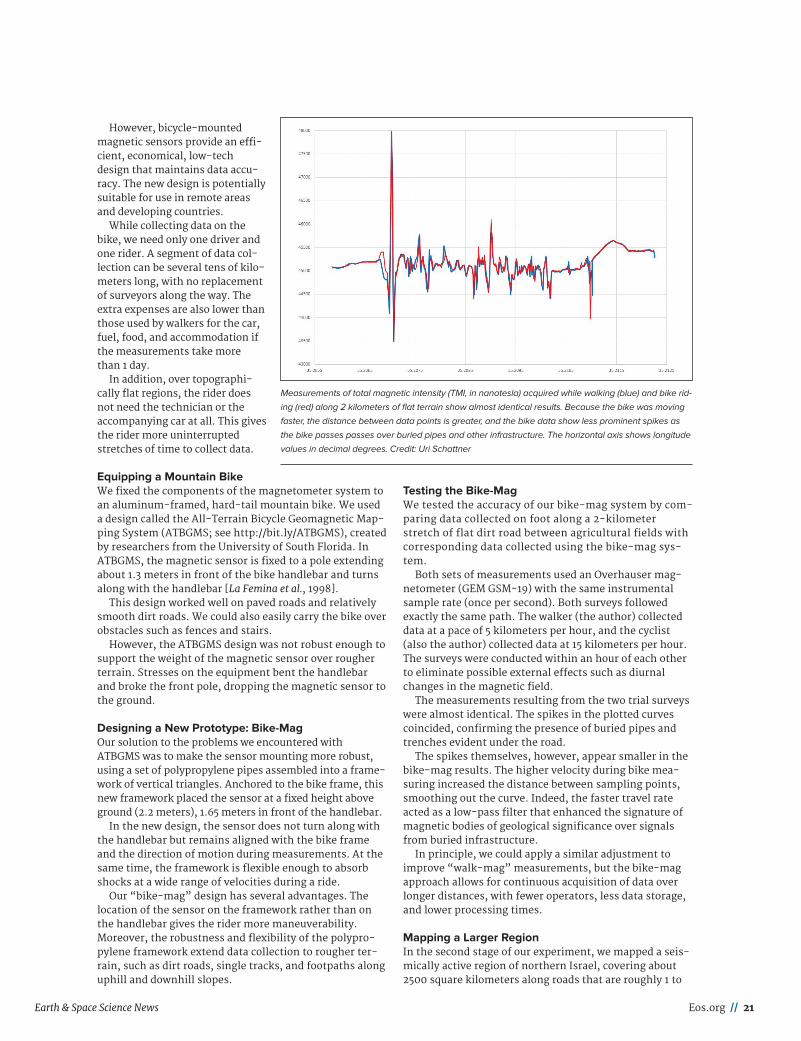
Testing the Bike- MagWe tested the accuracy of our bike- mag system by com-paring data collected on foot along a 2- kilometer stretch of flat dirt road between agricultural fields with corresponding data collected using the bike- mag sys-tem.
Both sets of measurements used an Overhauser mag-netometer (GEM GSM- 19) with the same instrumental sample rate (once per second). Both surveys followed exactly the same path. The walker (the author) collected data at a pace of 5 kilometers per hour, and the cyclist (also the author) collected data at 15 kilometers per hour. The surveys were conducted within an hour of each other to eliminate possible external effects such as diurnal changes in the magnetic field.
The measurements resulting from the two trial surveys were almost identical. The spikes in the plotted curves coincided, confirming the presence of buried pipes and trenches evident under the road.
The spikes themselves, however, appear smaller in the bike- mag results. The higher velocity during bike mea-suring increased the distance between sampling points, smoothing out the curve. Indeed, the faster travel rate acted as a low- pass filter that enhanced the signature of magnetic bodies of geological significance over signals from buried infrastructure.
In principle, we could apply a similar adjustment to improve “ walk- mag” measurements, but the bike- mag approach allows for continuous acquisition of data over longer distances, with fewer operators, less data storage, and lower processing times.
Mapping a Larger RegionIn the second stage of our experiment, we mapped a seis-mically active region of northern Israel, covering about 2500 square kilometers along roads that are roughly 1 to
Measurements of total magnetic intensity (TMI, in nanotesla) acquired while walking (blue) and bike rid-
ing (red) along 2 kilometers of flat terrain show almost identical results. Because the bike was moving
faster, the distance between data points is greater, and the bike data show less prominent spikes as
the bike passes passes over buried pipes and other infrastructure. The horizontal axis shows longitude
values in decimal degrees. Credit: Uri Schattner
22 // Eos July 2017
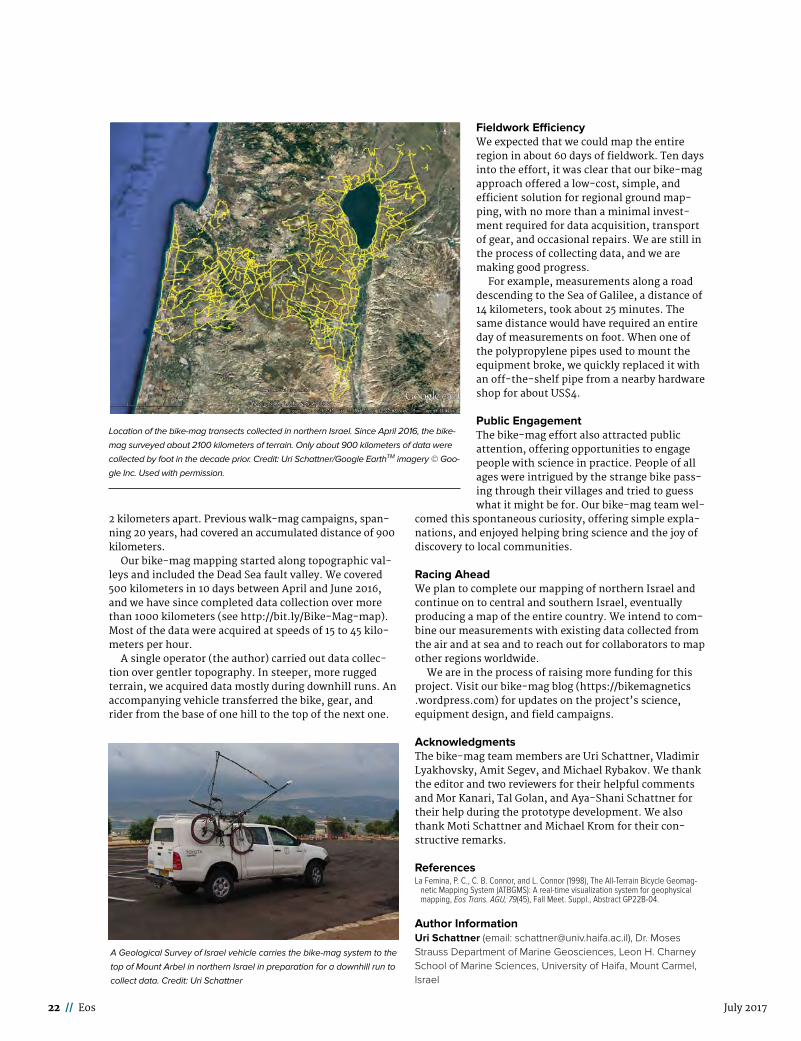
2 kilometers apart. Previous walk mag campaigns, spanning 20 years, had covered an accumulated distance of 900 kilometers.
Our bike mag mapping started along topographic valleys and included the Dead Sea fault valley. We covered 500 kilometers in 10 days between April and June 2016, and we have since completed data collection over more than 1000 kilometers (see http:// bit . ly/ Bike Mag map). Most of the data were acquired at speeds of 15 to 45 kilometers per hour.
A single operator (the author) carried out data collection over gentler topography. In steeper, more rugged terrain, we acquired data mostly during downhill runs. An accompanying vehicle transferred the bike, gear, and rider from the base of one hill to the top of the next one.
Fieldwork EfficiencyWe expected that we could map the entire region in about 60 days of fieldwork. Ten days into the effort, it was clear that our bike mag approach offered a low cost, simple, and efficient solution for regional ground mapping, with no more than a minimal investment required for data acquisition, transport of gear, and occasional repairs. We are still in the process of collecting data, and we are making good progress.
For example, measurements along a road descending to the Sea of Galilee, a distance of 14 kilometers, took about 25 minutes. The same distance would have required an entire day of measurements on foot. When one of the polypropylene pipes used to mount the equipment broke, we quickly replaced it with an off the shelf pipe from a nearby hardware shop for about US$4.
Public EngagementThe bike mag effort also attracted public attention, offering opportunities to engage people with science in practice. People of all ages were intrigued by the strange bike passing through their villages and tried to guess what it might be for. Our bike mag team wel
comed this spontaneous curiosity, offering simple explanations, and enjoyed helping bring science and the joy of discovery to local communities.
Racing AheadWe plan to complete our mapping of northern Israel and continue on to central and southern Israel, eventually producing a map of the entire country. We intend to combine our measurements with existing data collected from the air and at sea and to reach out for collaborators to map other regions worldwide.
We are in the process of raising more funding for this project. Visit our bike mag blog ( https:// bikemagnetics . wordpress . com) for updates on the project’s science, equipment design, and field campaigns.
AcknowledgmentsThe bike mag team members are Uri Schattner, Vladimir Lyakhovsky, Amit Segev, and Michael Rybakov. We thank the editor and two reviewers for their helpful comments and Mor Kanari, Tal Golan, and Aya Shani Schattner for their help during the prototype development. We also thank Moti Schattner and Michael Krom for their constructive remarks.
ReferencesLa Femina, P. C., C. B. Connor, and L. Connor (1998), The All- Terrain Bicycle Geomag-
netic Mapping System (ATBGMS): A real- time visualization system for geophysical mapping, Eos Trans. AGU, 79(45), Fall Meet. Suppl., Abstract GP22B- 04.
Author InformationUri Schattner (email: [email protected]), Dr. Moses Strauss Department of Marine Geosciences, Leon H. Charney School of Marine Sciences, University of Haifa, Mount Carmel, Israel
Location of the bike-mag transects collected in northern Israel. Since April 2016, the bike-
mag surveyed about 2100 kilometers of terrain. Only about 900 kilometers of data were
collected by foot in the decade prior. Credit: Uri Schattner/Google EarthTM imagery © Goo-
gle Inc. Used with permission.
A Geological Survey of Israel vehicle carries the bike- mag system to the
top of Mount Arbel in northern Israel in preparation for a downhill run to
collect data. Credit: Uri Schattner
Earth & Space Science News Eos.org // 23
Next generation ice core technology reveals true minimum natural levels of lead (Pb) in the atmosphere: insights from the Black Death Alexander F. More, Nicole E. Spaulding, Pascal Bohleber, Michael J. Handley, Helene Hoffmann, Elena V. Korotkikh, Andrei V. Kurbatov, Christopher P. Loveluck, Sharon B. Sneed, Michael McCormick, et al
Mapping Exposure to Particulate Pollution during Severe Haze Episode Using Improved MODIS AOT‐PM10 Regression Model with Synoptic Meteorology Classification Ketsiri Leelasakultum, Nguyen Thi Kim Oanh
Relative linkages of stream water quality and environmental health with the land use and hydrologic drivers in the coastal‐urban watersheds of southeast Florida Omar I. Abdul‐Aziz, Shakil Ahmed
Conceptualizing Holistic Community Resilience to Climate Events: Foundation for a Climate Resilience Screening Index J. Kevin Summers, Lisa M. Smith, Linda C. Harwell, Kyle D. Buck
Naturally occurring radium (Ra) in home drinking‐water wells in the Sandhills region of South Carolina, USA: Can high concentrations be predicted? Jeffrey M. Schrag
Anthropogenic carbon dioxide emissions may increase the risk of global iron deficiency M. R. Smith, C. D. Golden, S. S. Myers
Population of the temperate mosquito, Culex pipiens, decreases in response to habitat climatological changes in future K. Watanabe, S. Fukui, S. Ohta
Founding Editor: Rita R. ColwellUniversity of Maryland, College Park and Johns Hopkins University Bloomberg School of Public Health
GeoHealth publishes original research, reviews, policy discussions, and commentaries that cover the growing science on the interface among the Earth, atmospheric, oceans and environmental sciences, ecology, and the agricultural and health sciences.
Volume 1 • Issue 1 • June 2016 • Pages 1-57
Submit your manuscript at geohealth.agu.org
Read the latest articles:
24 // Eos July 2017
NEW DATA BUOYS WATCH TYPHOONS
from Within the Storm
By Sen Jan, Yiing Jang Yang, Hung- I Chang, Ming- Huei Chang,
and Ching- Ling Wei
Earth & Space Science News Eos.org // 25
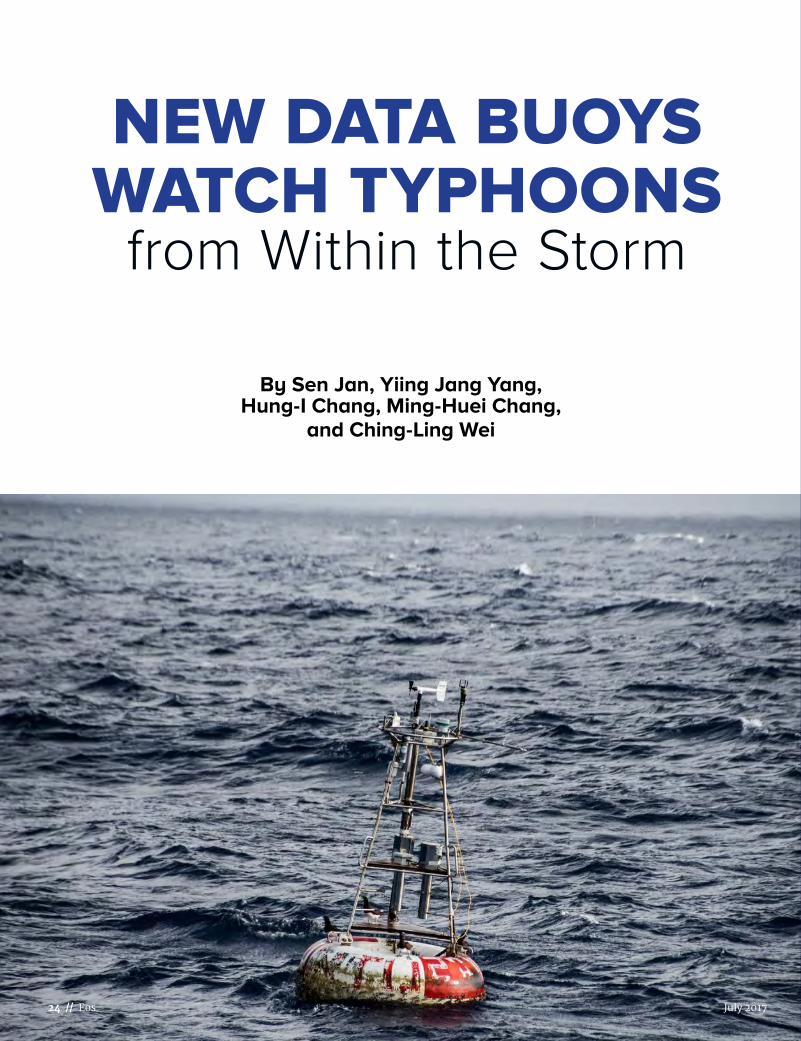
Two recently deployed ocean data buoys got a real test of their abilities last July when category 5 “super typhoon” Nepartak’s center passed within a few kilometers of where they were moored. This meeting was no accident: The
buoys were specifically designed to record data on passing typhoons and relay the information to Taiwan’s Central Weather Bureau.
Typhoons, hurricanes that occur in the northwestern Pacific Ocean, threaten coastal and inland populations of nearly 1 billion people living in Taiwan, Japan, Korea, China, and the Philippines. Broadcasting timely warning messages to the public is an essential part of minimizing the disastrous effects of typhoons in coastal and inland areas. However, accurate and timely warnings require better forecasting of typhoon tracks and intensities. High resolution data and real time observations of typhoons in the open ocean are important to better understanding their formation and evolutionary processes and to improving the performance of numerical predictions.
Although satellite remote sensing is valuable, these sensors cannot see far beneath the sea surface, making a real time data buoy network with subsurface observations the perfect complement during typhoons. However, establishing a high den
sity of buoy stations requires a large number of reliable instruments, as well as considerable support in the form of mooring supplies, satellite communications, and ship time.
A research and technical team composed of scientists and technicians at National Taiwan University (NTU) is working to establish just such a buoy network (see http:// bit . ly/ NTU data buoys) in the northwestern Pacific. The team is working to reduce the cost of data buoys and their associated maintenance using low–power consumption technologies, building on the basic concept of the Autonomous Temperature Line Acquisition System (ATLAS) [Hayes et al., 1991]. The new data acquisition system accommodates more meteorological and oceanic sensors than a standard ATLAS mooring and can transmit data at adjustable intervals via satellite to ground stations.
Economical, Reliable Observation and ForecastingTyphoons are capable of causing catastrophic destruction along their path. Typhoon Morakot, a category 2 storm, passed across southern Taiwan on 8 August 2009, bringing more than 2.7 meters of rain to Taiwan, the highest typhoon related rainfall in 50 years. The heavy rain caused floods and mudslides, resulting in more than 600 deaths and
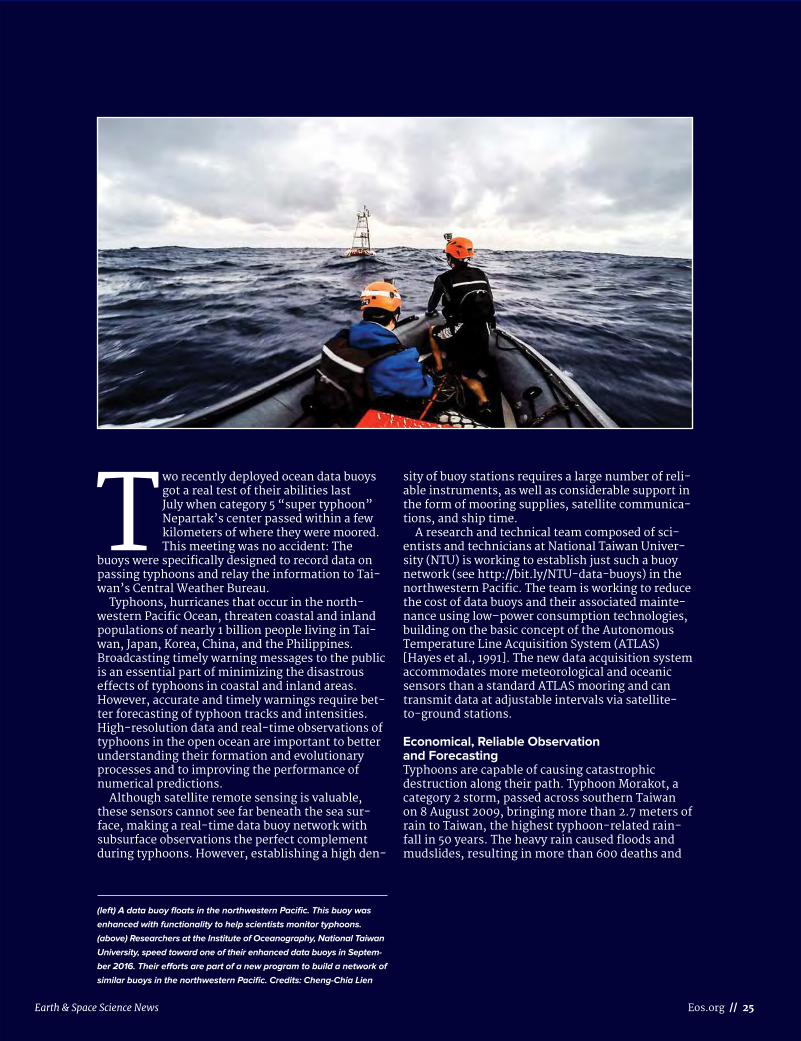
(left) A data buoy floats in the northwestern Pacific. This buoy was
enhanced with functionality to help scientists monitor typhoons.
(above) Researchers at the Institute of Oceanography, National Taiwan
University, speed toward one of their enhanced data buoys in Septem-
ber 2016. Their efforts are part of a new program to build a network of
similar buoys in the northwestern Pacific. Credits: Cheng-Chia Lien
26 // Eos July 2017
US$5 billion in property damage [National Disasters Preven-tion and Protection Commission, 2009]. On 8 November 2013, Super Typhoon Haiyan ripped through the central Philippine islands, causing more than 6000 deaths and US$2 billion in losses [Shull, 2013].
The threat of such death and destruction creates an obvious need for buoy observations in the Philippine Sea. Unfortunately, these kinds of on site observations are rare, presumably because of the high cost of setting up and maintaining deepwater buoy stations, the frequent failure of the buoys in extreme conditions, and the instrument damage and buoy relocation that can happen when the buoys become entangled in tuna fishing lines.
The new buoy project, initiated by the Institute of Oceanography at NTU, aims to overcome these difficulties with a less expensive but more robust data buoy, which we call the NTU buoy. The data collected by these new buoys will help improve our understanding of the ways in which the air and the sea exchange heat and how this exchange influences typhoon intensity. The NTU buoys will also provide real time data to weather forecast centers when a typhoon is approaching.
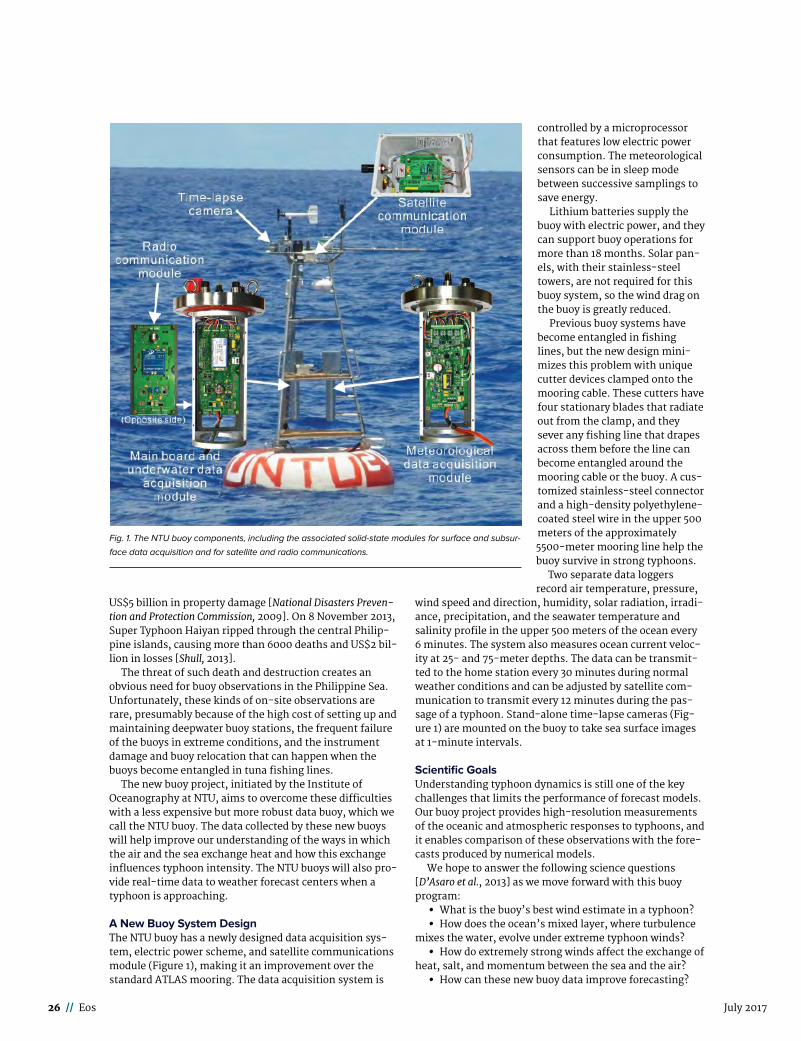
A New Buoy System DesignThe NTU buoy has a newly designed data acquisition system, electric power scheme, and satellite communications module (Figure 1), making it an improvement over the standard ATLAS mooring. The data acquisition system is
controlled by a microprocessor that features low electric power consumption. The meteorological sensors can be in sleep mode between successive samplings to save energy.
Lithium batteries supply the buoy with electric power, and they can support buoy operations for more than 18 months. Solar panels, with their stainless steel towers, are not required for this buoy system, so the wind drag on the buoy is greatly reduced.
Previous buoy systems have become entangled in fishing lines, but the new design minimizes this problem with unique cutter devices clamped onto the mooring cable. These cutters have four stationary blades that radiate out from the clamp, and they sever any fishing line that drapes across them before the line can become entangled around the mooring cable or the buoy. A customized stainless steel connector and a high density polyethylene coated steel wire in the upper 500 meters of the approximately 5500 meter mooring line help the buoy survive in strong typhoons.
Two separate data loggers record air temperature, pressure,
wind speed and direction, humidity, solar radiation, irradiance, precipitation, and the seawater temperature and salinity profile in the upper 500 meters of the ocean every 6 minutes. The system also measures ocean current velocity at 25 and 75 meter depths. The data can be transmitted to the home station every 30 minutes during normal weather conditions and can be adjusted by satellite communication to transmit every 12 minutes during the passage of a typhoon. Stand alone time lapse cameras (Figure 1) are mounted on the buoy to take sea surface images at 1 minute intervals.
Scientific GoalsUnderstanding typhoon dynamics is still one of the key challenges that limits the performance of forecast models. Our buoy project provides high resolution measurements of the oceanic and atmospheric responses to typhoons, and it enables comparison of these observations with the forecasts produced by numerical models.
We hope to answer the following science questions [D’Asaro et al., 2013] as we move forward with this buoy program:
• What is the buoy’s best wind estimate in a typhoon?
• How does the ocean’s mixed layer, where turbulence mixes the water, evolve under extreme typhoon winds?
• How do extremely strong winds affect the exchange of heat, salt, and momentum between the sea and the air?
• How can these new buoy data improve forecasting?
Fig. 1. The NTU buoy components, including the associated solid-state modules for surface and subsur-
face data acquisition and for satellite and radio communications.
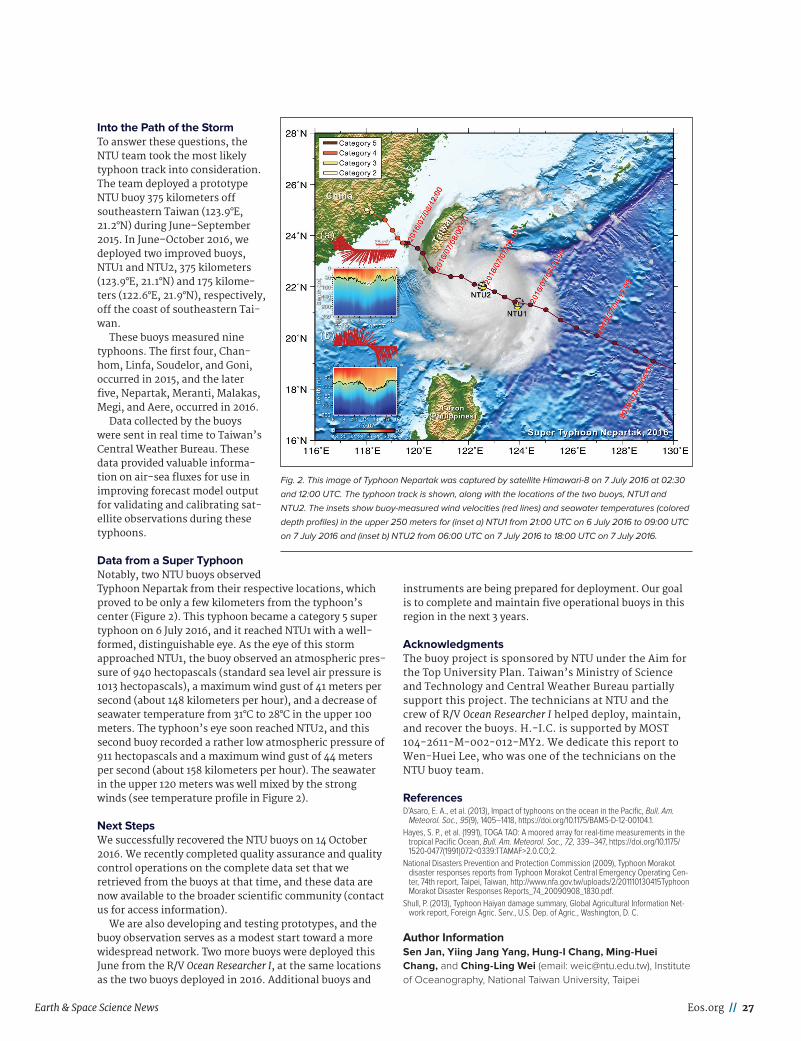
Earth & Space Science News Eos.org // 27
Into the Path of the StormTo answer these questions, the NTU team took the most likely typhoon track into consideration. The team deployed a prototype NTU buoy 375 kilometers off southeastern Taiwan (123.9°E, 21.2°N) during June–September 2015. In June–October 2016, we deployed two improved buoys, NTU1 and NTU2, 375 kilometers (123.9°E, 21.1°N) and 175 kilome-ters (122.6°E, 21.9°N), respectively, off the coast of southeastern Tai-wan.
These buoys measured nine typhoons. The first four, Chan- hom, Linfa, Soudelor, and Goni, occurred in 2015, and the later five, Nepartak, Meranti, Malakas, Megi, and Aere, occurred in 2016.
Data collected by the buoys were sent in real time to Taiwan’s Central Weather Bureau. These data provided valuable informa-tion on air- sea fluxes for use in improving forecast model output for validating and calibrating sat-ellite observations during these typhoons.
Data from a Super TyphoonNotably, two NTU buoys observed Typhoon Nepartak from their respective locations, which proved to be only a few kilometers from the typhoon’s center (Figure 2). This typhoon became a category 5 super typhoon on 6 July 2016, and it reached NTU1 with a well- formed, distinguishable eye. As the eye of this storm approached NTU1, the buoy observed an atmospheric pres-sure of 940 hectopascals (standard sea level air pressure is 1013 hectopascals), a maximum wind gust of 41 meters per second (about 148 kilometers per hour), and a decrease of sea water temperature from 31°C to 28°C in the upper 100 meters. The typhoon’s eye soon reached NTU2, and this second buoy recorded a rather low atmospheric pressure of 911 hectopascals and a maximum wind gust of 44 meters per second (about 158 kilometers per hour). The seawater in the upper 120 meters was well mixed by the strong winds (see temperature profile in Figure 2).
Next StepsWe successfully recovered the NTU buoys on 14 October 2016. We recently completed quality assurance and quality control operations on the complete data set that we retrieved from the buoys at that time, and these data are now available to the broader scientific community (contact us for access information).
We are also developing and testing prototypes, and the buoy observation serves as a modest start toward a more widespread network. Two more buoys were deployed this June from the R/V Ocean Researcher I, at the same locations as the two buoys deployed in 2016. Additional buoys and
instruments are being prepared for deployment. Our goal is to complete and maintain five operational buoys in this region in the next 3 years.
AcknowledgmentsThe buoy project is sponsored by NTU under the Aim for the Top University Plan. Taiwan’s Ministry of Science and Technology and Central Weather Bureau partially support this project. The technicians at NTU and the crew of R/V Ocean Researcher I helped deploy, maintain, and recover the buoys. H.- I.C. is supported by MOST 104- 2611- M- 002- 012- MY2. We dedicate this report to Wen- Huei Lee, who was one of the technicians on the NTU buoy team.
ReferencesD’Asaro, E. A., et al. (2013), Impact of typhoons on the ocean in the Pacific, Bull. Am.
Meteorol. Soc., 95(9), 1405–1418, https:// doi . org/ 10. 1175/ BAMS - D - 12 - 00104. 1.Hayes, S. P., et al. (1991), TOGA TAO: A moored array for real- time measurements in the
tropical Pacific Ocean, Bull. Am. Meteorol. Soc., 72, 339–347, https:// doi . org/ 10. 1175/ 1520 - 0477 (1991) 072 < 0339 : TTAMAF > 2 . 0 . CO ; 2.
National Disasters Prevention and Protection Commission (2009), Typhoon Morakot disaster responses reports from Typhoon Morakot Central Emergency Operating Cen-ter, 74th report, Taipei, Taiwan, http:// www . nfa . gov . tw/ uploads/ 2/ 201110130415Typhoon Morakot Disaster Responses Reports _ 74 _ 20090908 _ 1830. pdf.
Shull, P. (2013), Typhoon Haiyan damage summary, Global Agricultural Information Net-work report, Foreign Agric. Serv., U.S. Dep. of Agric., Washington, D. C.
Author InformationSen Jan, Yiing Jang Yang, Hung- I Chang, Ming- Huei Chang, and Ching- Ling Wei (email: [email protected]), Institute of Oceanography, National Taiwan University, Taipei
Fig. 2. This image of Typhoon Nepartak was captured by satellite Himawari- 8 on 7 July 2016 at 02:30
and 12:00 UTC. The typhoon track is shown, along with the locations of the two buoys, NTU1 and
NTU2. The insets show buoy- measured wind velocities (red lines) and seawater temperatures (colored
depth profiles) in the upper 250 meters for (inset a) NTU1 from 21:00 UTC on 6 July 2016 to 09:00 UTC
on 7 July 2016 and (inset b) NTU2 from 06:00 UTC on 7 July 2016 to 18:00 UTC on 7 July 2016.
28 // Eos July 2017
AGU NEWS
In Appreciation of AGU’s Outstanding Reviewers of 2016
W ith this article, AGU Publications again recognizes outstanding reviewers selected by the editors of
each AGU journal for their work in 2016.Peer-reviewed literature plays a critical
role in advancing science. However, peer reviewing has been generally undervalued in terms of its contributions and the collective level of effort involved. Despite the chal-lenges of relying on volunteers, peer review is essential for helping to maintain the integrity of science and its efficient advance-ment (by forcing some quality checks on the official archive of progress). It also plays a vital role in the granting of awards and has value for society in that peer-reviewed liter-ature increasingly has official, codified uses in law, regulations, and advisory input.
Much of the scientific community’s out-reach to the public is through the press and, thanks to quality publications, through our community’s leading journals. Checks to enhance reproducibility and to drive improvements in the science help overall quality. In turn, quality peer review in many ways distinguishes leading journals from the growing threat of so-called predatory jour-nals, which can degrade scientific integrity.
The task of peer reviewing forces researchers to think deeply and broadly about others’ contributions to science in ways that are fundamentally different from simply reading a paper. The process of reviewing helps scientists improve their careers and develop better networks. In the case of peer review, the collective whole is much more than the sum of its very import-ant parts.
Reviewing on a Grand ScaleA large reviewing effort takes place at AGU and in the greater scientific publishing world. In 2016, AGU received more than 13,500 sub-missions and published nearly 6100 papers. Many of those submissions received multiple reviews, amounting to more than 30,000 reviews in all. More than 1100 reviewers com-pleted five or more reviews, and 93 com-pleted 10 or more.
Considering the broad array of journals available plus the evaluation of grant propos-als, reviewing becomes a significant burden to the scientific community. A common say-ing is that in return for the valuable feedback they receive from reviews of their work, researchers should give back at least twice as many reviews as the number of papers and grants they submit. AGU journals continue to work to maintain their efficient times from submission to first decision and publication, and reviewers represent a key part of this achievement.
Reviewer Recognition and RewardsAlthough we formally recognize but a few of the reviewers of AGU journals here, we also acknowledge the broad efforts by the many reviewers who help ensure their quality, timeliness, and reputation. AGU is working to provide individual recognition in ways beyond the citations given below. We are extending subscription benefits to those reviewers who repeatedly provide quality reviews. Each reviewer also receives a dis-count on AGU and Wiley books. We will con-tinue to work with the Open Researcher and Contributor Identification network (ORCID)
to provide official recognition of reviewers’ efforts so that reviewers receive formal credit in that way. To date, we have more than 26,000 ORCID records linked to GEMS user accounts. Last year, 1844 individuals received credit for 2355 peer reviews on their ORCID records.
Although individual recognition is import-ant and needs to expand, we here provide a collective thank-you to participants in the larger process and integrated effort that is helping to expand integrity across the scien-tific enterprise. Peer review can be improved
in many ways, and experiments are being carried out across leading publishers (AGU among them), but the overall importance of peer review is growing, not declining, and needs broader support and recognition.
The photographs and listings below of the 2016 outstanding reviewers chosen by AGU’s journal editors begin with four individuals who were each selected by two different edi-tors for this recognition.
By Brooks Hanson (email: [email protected]), Director, Publications, AGU; and Lisa Tauxe, Chair, AGU Publications Committee
William FrankCited by Uri ten Brink
JGR: Solid EarthCited by Jeroen Ritsema
Geophysical Research Letters
John Bosco HabarulemaCited by JGR: Space Physics editors
JGR: Space PhysicsCited by Phil Wilkinson and Sana Salous
Radio Science
Patrick A. RafterCited by Kim Cobb
Geophysical Research LettersCited by Global Biogeochemical Cycles editors
Global Biogeochemical Cycles
Earle WilliamsCited by Zhanqing Li
JGR: AtmospheresCited by William Peterson
Geophysical Research Letters
The process of reviewing helps scientists improve their careers and develop better networks.
Earth & Space Science News Eos.org // 29
AGU NEWS
Rachel AbercrombieCited by Uri ten Brink
JGR: Solid Earth
Amir AghaKouchakCited by M. Bayani CardenasGeophysical Research Letters
Vassilis AngelopoulosCited by William Peterson
Geophysical Research Letters
Wayne AngevineCited by Ruby Leung
JGR: Atmospheres
Feza ArikanCited by Phil Wilkinson and Sana Salous
Radio Science
Gary AxenCited by Nathan Niemi
Tectonics
Sarah BadmanCited by Benoit Lavraud
Geophysical Research Letters
Boris BaeumerCited by Alberto MontanariWater Resources Research
Karthik BalaguruCited by Meghan Cronin
Geophysical Research Letters
Hannah C. BarnesCited by Chidong Zhang
JGR: Atmospheres
Peter BlosseyCited by Eelco RohlingReviews of Geophysics
Ben Bond-LambertyCited by JGR: Biogeosciences editors
JGR: Biogeosciences
William BosworthCited by John Geissman
Tectonics
Aaron BrenemanCited by Benoit Lavraud
Geophysical Research Letters
Laura BristowCited by Tatiana Ilyina
Geophysical Research Letters
Lori BruhwilerCited by Alan RobockReviews of Geophysics
30 // Eos July 2017
AGU NEWS
Frank O. BryanCited by Leo Oey
JGR: Oceans
Holly BuckCited by Earth’s Future editors
Earth’s Future
Alan BurnsCited by William Peterson
Geophysical Research Letters
Brett CarterCited by Space Weather editors
Space Weather
Leila M. V. CarvalhoCited by Paul Williams
Geophysical Research Letters
Don ChambersCited by Lisa Beal
Geophysical Research Letters
Yu-Lin Eda ChangCited by Leo Oey
JGR: Oceans
Nicolas ColticeCited by Thorsten Becker
Geochemistry, Geophysics, Geosystems
Larry CornmanCited by Paul Williams
Geophysical Research Letters
Hanna DahlgrenCited by JGR: Space Physics editors
JGR: Space Physics
Hugh DaigleCited by Uri ten Brink
JGR: Solid Earth
Seth L. DanielsonCited by Carol Stein
Eos
Felipe P. J. de BarrosCited by Alberto MontanariWater Resources Research
Sylvia DeeCited by Kim Cobb
Geophysical Research Letters
Erwin DehouckCited by JGR: Planets editors
JGR: Planets
Gabrielle De LannoyCited by Alberto MontanariWater Resources Research

Earth & Space Science News Eos.org // 31
AGU NEWS
Marine DenolleCited by Jeroen Ritsema
Geophysical Research Letters
Andrew DesslerCited by Jonathan JiangEarth and Space Science
Owen DohertyCited by Minghua Zhang
JGR: Atmospheres
Jennifer DruhanCited by Alberto MontanariWater Resources Research
Mathieu DumberryCited by JGR: Planets editors
JGR: Planets
Andrea DuttonCited by Ellen Thomas
Paleoceanography
André EhrlichCited by Steven Ghan
JGR: Atmospheres
Shane ElipotCited by Lisa Beal
Geophysical Research Letters
Jerry P. FairleyCited by Alberto MontanariWater Resources Research
Kathryn FallowsCited by JGR: Space Physics editors
JGR: Space Physics
Simone FatichiCited by M. Bayani CardenasGeophysical Research Letters
Zhe FengCited by Ruby Leung
JGR: Atmospheres
Melanie FewingsCited by Meghan Cronin
Geophysical Research Letters
Christine GabrielseCited by JGR: Space Physics editors
JGR: Space Physics
Matei GeorgescuCited by Noah Diffenbaugh
Geophysical Research Letters
Sarah GilleCited by Don Chambers and Robert Hetland
JGR: Oceans
32 // Eos July 2017
AGU NEWS
Timothy GinnCited by Alberto MontanariWater Resources Research
Jie GongCited by Minghua Zhang
JGR: Atmospheres
Rebecca GreenbergerCited by Andrea Donnellan
Earth and Space Science
Roger GrimshawCited by Leo Oey
JGR: Oceans
Chuanhui GuCited by Alberto MontanariWater Resources Research
Jianping GuoCited by Zhanqing Li
JGR: Atmospheres
Aditya GusmanCited by Uri ten Brink
JGR: Solid Earth
Meredith HastingsCited by Allison Steiner
JGR: Atmospheres
Colette L. HealdCited by Joel Thorsten
Geophysical Research Letters
Stephanie A. HensonCited by Tatiana Ilyina
Geophysical Research Letters
Rebecca HodgeCited by JGR: Earth Surface editors
JGR: Earth Surface
Cameron HomeyerCited by Ulrike Langematz
JGR: Atmospheres
Daniel HortonCited by Allison Steiner
JGR: Atmospheres
Yihe HuangCited by Uri ten Brink
JGR: Solid Earth
Daisuke InazuCited by Lisa Beal
Geophysical Research Letters
Jennifer JacksonCited by Andrey Proshutinsky
JGR: Oceans
Earth & Space Science News Eos.org // 33
AGU NEWS
Matthew G. JacksonCited by Thorsten Becker
Geochemistry, Geophysics, Geosystems
William KeeneCited by Joel Thorsten
Geophysical Research Letters
John F. KnowlesCited by JGR: Biogeosciences editors
JGR: Biogeosciences
Ben KravitzCited by Earth’s Future editors
Earth’s Future
Lester KwiatkowskiCited by Tatiana Ilyina
Geophysical Research Letters
Yves LagabrielleCited by Claudio Faccenna
Tectonics
Laurel LarsenCited by M. Bayani CardenasGeophysical Research Letters
Aaron LevineCited by Meghan Cronin
Geophysical Research Letters
Naomi M. LevineCited by Global Biogeochemical Cycles editors
Global Biogeochemical Cycles
Andrea LlenosCited by Andrew Newman
Geophysical Research Letters
Kathleen LohseCited by JGR: Biogeosciences editors
JGR: Biogeosciences
Daniel P. LoucksCited by Alberto MontanariWater Resources Research
Noé LugazCited by JGR: Space Physics editors
JGR: Space Physics
Ian MannCited by Andrew Yau
Geophysical Research Letters
Stefano ManzoniCited by Alberto MontanariWater Resources Research
Chris MaroneCited by Andrew Newman
Geophysical Research Letters
34 // Eos July 2017
AGU NEWS
Mark McClureCited by Uri ten Brink
JGR: Solid Earth
Art McGarrCited by Uri ten Brink
JGR: Solid Earth
Karen McKinnonCited by Noah Diffenbaugh
Geophysical Research Letters
Michael McPhadenCited by Leo Oey
JGR: Oceans
Ron McTaggart-CowanCited by Paul Williams
Geophysical Research Letters
Xiaofeng MengCited by Andrew Newman
Geophysical Research Letters
Katarina MiljkovicCited by Andrew Dombard
Geophysical Research Letters
Steven MorleyCited by Space Weather editors
Space Weather
Didier MourenasCited by JGR: Space Physics editors
JGR: Space Physics
Paul MyersCited by Andrey Proshutinsky
JGR: Oceans
Andrew NewmanCited by James Crawford
JGR: Atmospheres
Sune NielsenCited by Thorsten Becker
Geochemistry, Geophysics, Geosystems
André NiemeijerCited by Uri ten Brink
JGR: Solid Earth
Euan NisbetCited by Joel Thorsten
Geophysical Research Letters
Toshi NishimuraCited by JGR: Space Physics editors
JGR: Space Physics
Cecilia NorgrenCited by Andrew Yau
Geophysical Research Letters
Earth & Space Science News Eos.org // 35
AGU NEWS
Frank PazzagliaCited by JGR: Earth Surface editors
JGR: Earth Surface
Angeline PendergrassCited by Robert Pincus
Journal of Advances in Modeling Earth Systems (JAMES)
Kerri A. PrattCited by Jose Fuentes
Eos
Geoffrey D. ReevesCited by Andrew Yau
Geophysical Research Letters
Robert RogersCited by Chidong Zhang
JGR: Atmospheres
John RyanCited by Peter Brewer
JGR: Oceans
Mohammad SafeeqCited by Wendy S. Gordon
Eos
Benjamin SanterCited by Noah Diffenbaugh
Geophysical Research Letters
Ted ScambosCited by Julienne Stroeve
Geophysical Research Letters
Madeline SchreiberCited by Alberto MontanariWater Resources Research
Jiwon SeoCited by Phil Wilkinson and Sana Salous
Radio Science
Sarah ShaferCited by Noah Diffenbaugh
Geophysical Research Letters
Robert ShcherbakovCited by Andrew Newman
Geophysical Research Letters
Steven SherwoodCited by Steven Ghan
JGR: Atmospheres
Amelia ShevenellCited by Kim Cobb
Geophysical Research Letters
Kelsi SingerCited by Andrew Dombard
Geophysical Research Letters
36 // Eos July 2017
AGU NEWS
David SiskindCited by Ulrike Langematz
JGR: Atmospheres
Benjamin SmithCited by Julienne Stroeve
Geophysical Research Letters
Rolf E. SonnerupCited by Global Biogeochemical Cycles editors
Global Biogeochemical Cycles
Armin SorooshianCited by Lynn Russell
JGR: Atmospheres
Paolo SossiCited by Thorsten Becker
Geochemistry, Geophysics, Geosystems
Veena SrinivasanCited by Alberto MontanariWater Resources Research
Samantha StevensonCited by Kim Cobb
Geophysical Research Letters
Ryan StewartCited by Gregory OkinReviews of Geophysics
Satoshi TakahamaCited by Lynn Russell
JGR: Atmospheres
Akiko TakeoCited by Thorsten Becker
Geochemistry, Geophysics, Geosystems
Jeremy ThomasCited by JGR: Space Physics editors
JGR: Space Physics
Phil ThompsonCited by Don Chambers
JGR: Oceans
Sally ThompsonCited by Alberto MontanariWater Resources Research
Michael TippettCited by Paul Williams
Geophysical Research Letters
Sinhué Torres-ValdésCited by Tatiana Ilyina
Geophysical Research Letters
Gabor TothCited by JGR: Space Physics editors
JGR: Space Physics
Earth & Space Science News Eos.org // 37
AGU NEWS
Amy Townsend-SmallCited by James Crawford
JGR: Atmospheres
Bruce TsurutaniCited by JGR: Space Physics editors
JGR: Space Physics
Jens TurowskiCited by M. Bayani CardenasGeophysical Research Letters
Hans VerbeeckCited by Paul Dirmeyer
Journal of Advances in Modeling Earth Systems (JAMES)
Antje H. L. VoelkerCited by Ellen Thomas
Paleoceanography
Elena VolpiCited by Alberto MontanariWater Resources Research
Shan WangCited by Benoit Lavraud
Geophysical Research Letters
Quentin WilliamsCited by Jeroen Ritsema
Geophysical Research Letters
Chris WilsonCited by Meghan Cronin
Geophysical Research Letters
Lynn B. Wilson IIICited by JGR: Space Physics editors
JGR: Space Physics
Allison WingCited by Robert Pincus
Journal of Advances in Modeling Earth Systems (JAMES)
Simon WingCited by JGR: Space Physics editors
JGR: Space Physics
Hongfeng YangCited by Andrew Newman
Geophysical Research Letters
Y. C. Ethan YangCited by Alberto MontanariWater Resources Research
Jonathan YoderCited by Alberto MontanariWater Resources Research
Jinsong ZhaoCited by JGR: Space Physics editors
JGR: Space Physics
38 // Eos July 2017
AGU NEWS
2016 Cited Referees Not Pictured
Lauren AndrewsCited by JGR: Earth Surface editors
JGR: Earth Surface
Branko BijeljicCited by Alberto MontanariWater Resources Research
Joerg RennerCited by Uri ten Brink
JGR: Solid Earth
Debra WeisensteinCited by Joel Thorsten
Geophysical Research Letters
Kenia WiedemannCited by JGR: Biogeosciences editors
JGR: Biogeosciences The AGU Board of Directors approved on 13 April a new position statement on the rights and responsibilities of sci-
entists. The position statement, “The Responsibilities and Rights of Scientists,” emphasizes that the public- serving role of scientists charges them with certain ethical duties, and it also affords them the right to conduct science and collaborate freely (see http:// bit . ly/ AGU - responsibilities).
“The scientific profession makes enor-mous contributions to human health, eco-nomic prosperity, and environmental sus-tainability,” said AGU president Eric
Davidson in a press release (see http:// bit . ly/ responsibilities - press - release). “With that public- interest role comes great responsibility. This position statement acknowledges not only the importance of scien-tific excellence and integrity, but also the challenges of cultivating inclusivity, diver-sity, and safety throughout our profession. Finally, it articulates the essential rights of scientists to freely and openly exchange ideas in their pursuits and communi-cations of knowledge.”
The concept for this statement was origi-nally proposed by an AGU member through the position statement proposal process, which is open to all AGU members (see http:// bit . ly/ AGU - position - proposal). The AGU Position Statement Task Force then con-vened a panel of experts charged with devel-oping the statement. A draft version of the statement written by the panel was open for AGU member comment for 1 month, and member comments were reviewed before the statement was finalized. It complements a previous AGU position statement, “AGU Sup-ports Free and Open Communication of Sci-entific Findings” (see http:// bit . ly/ AGU - free - communication), and it will be reinforced by a forthcoming update to AGU’s Ethics Policy.
AGU develops and maintains position statements to provide scientific expertise on significant policy issues related to the under-standing and application of the Earth and space sciences. Members are encouraged to use AGU’s position statements to guide con-versations with students, local communities, policy makers, and other members of the public. AGU’s position statements are main-tained in the AGU Resource Center (see http:// bit . ly/ AGU - resources). They, along with AGU’s Advocacy Policy (see http:// bit . ly/ AGU - advocacy), are valuable resources for those looking to connect with members of the public on issues related to Earth and space sciences.
By Elizabeth Landau (email: elandau@ agu . org), Public Affairs Manager, AGU
Scientists’ Freedom to Work Entails Responsibilities to Society
©al
exsk
opje
– s
tock
.ado
be.c
om
Get Eos highlights
in your inbox every
Friday.To sign up for the Eos Buzz newsletter, go to publications. agu.org, scroll down, and enter
your information in the “SIGN-UP FOR EOS
BUZZ NEWSLETTER” section.
Panelists Who Developed the Statement
Michel Campillo, Institut des Sciences de la Terre
Jasmine Crumsey, Stanford University
Clinton Foster, Geoscience Australia
Linda Gundersen, U.S. Geological Survey
Rob Jackson, Stanford University
Susan Kieffer, University of Illinois
Scott Mandia (chair), Suffolk County Community College
Jerry Miller, Science for Decisions
Michael Oppenheimer, Princeton University
Karen Wayland, U.S. Department of Energy
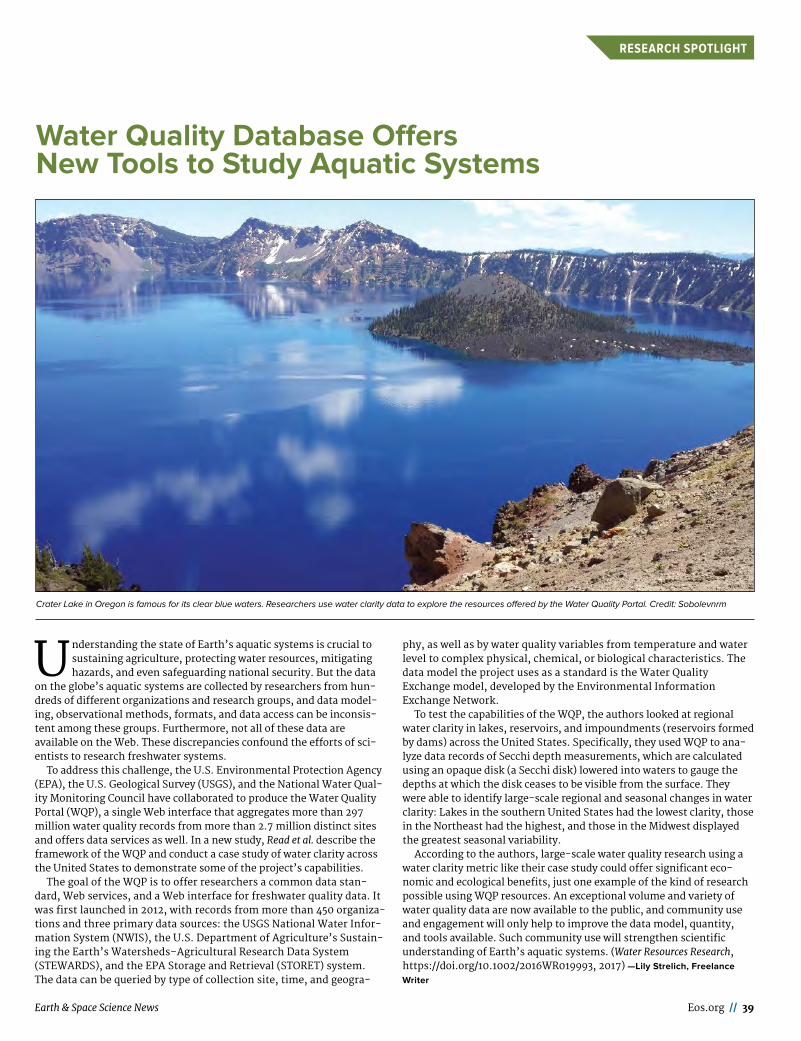
Earth & Space Science News Eos.org // 39
RESEARCH SPOTLIGHT
Water Quality Database Offers New Tools to Study Aquatic Systems
Understanding the state of Earth’s aquatic systems is crucial to sustaining agriculture, protecting water resources, mitigating hazards, and even safeguarding national security. But the data
on the globe’s aquatic systems are collected by researchers from hun-dreds of different organizations and research groups, and data model-ing, observational methods, formats, and data access can be inconsis-tent among these groups. Furthermore, not all of these data are available on the Web. These discrepancies confound the efforts of sci-entists to research freshwater systems.
To address this challenge, the U.S. Environmental Protection Agency (EPA), the U.S. Geological Survey (USGS), and the National Water Qual-ity Monitoring Council have collaborated to produce the Water Quality Portal (WQP), a single Web interface that aggregates more than 297 million water quality records from more than 2.7 million distinct sites and offers data services as well. In a new study, Read et al. describe the framework of the WQP and conduct a case study of water clarity across the United States to demonstrate some of the project’s capabilities.
The goal of the WQP is to offer researchers a common data stan-dard, Web services, and a Web interface for freshwater quality data. It was first launched in 2012, with records from more than 450 organiza-tions and three primary data sources: the USGS National Water Infor-mation System (NWIS), the U.S. Department of Agriculture’s Sustain-ing the Earth’s Watersheds– Agricultural Research Data System (STEWARDS), and the EPA Storage and Retrieval (STORET) system. The data can be queried by type of collection site, time, and geogra-
phy, as well as by water quality variables from temperature and water level to complex physical, chemical, or biological characteristics. The data model the project uses as a standard is the Water Quality Exchange model, developed by the Environmental Information Exchange Network.
To test the capabilities of the WQP, the authors looked at regional water clarity in lakes, reservoirs, and impoundments (reservoirs formed by dams) across the United States. Specifically, they used WQP to ana-lyze data records of Secchi depth measurements, which are calculated using an opaque disk (a Secchi disk) lowered into waters to gauge the depths at which the disk ceases to be visible from the surface. They were able to identify large- scale regional and seasonal changes in water clarity: Lakes in the southern United States had the lowest clarity, those in the Northeast had the highest, and those in the Midwest displayed the greatest seasonal variability.
According to the authors, large- scale water quality research using a water clarity metric like their case study could offer significant eco-nomic and ecological benefits, just one example of the kind of research possible using WQP resources. An exceptional volume and variety of water quality data are now available to the public, and community use and engagement will only help to improve the data model, quantity, and tools available. Such community use will strengthen scientific understanding of Earth’s aquatic systems. (Water Resources Research, https:// doi . org/ 10 . 1002/ 2016WR019993, 2017) —Lily Strelich, Freelance
Writer
Crater Lake in Oregon is famous for its clear blue waters. Researchers use water clarity data to explore the resources offered by the Water Quality Portal. Credit: Sobolevnrm
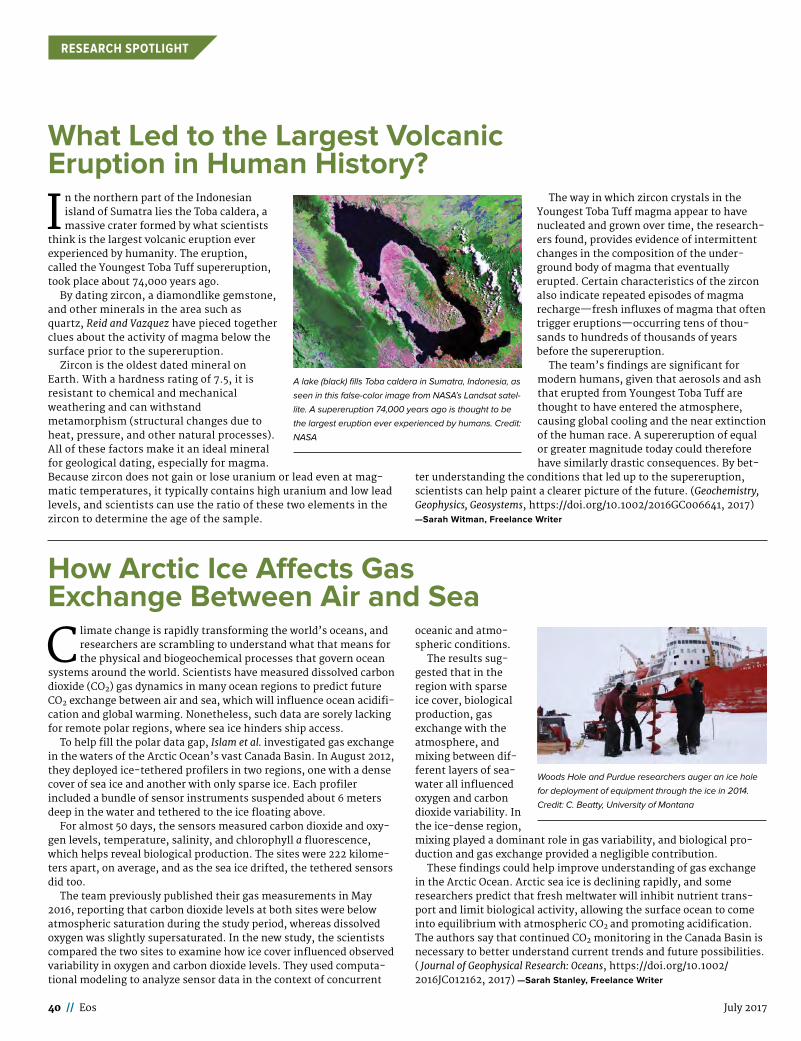
40 // Eos July 2017
RESEARCH SPOTLIGHT
What Led to the Largest Volcanic Eruption in Human History?
In the northern part of the Indonesian island of Sumatra lies the Toba caldera, a massive crater formed by what scientists
think is the largest volcanic eruption ever experienced by humanity. The eruption, called the Youngest Toba Tuff supereruption, took place about 74,000 years ago.
By dating zircon, a diamondlike gemstone, and other minerals in the area such as quartz, Reid and Vazquez have pieced together clues about the activity of magma below the surface prior to the supereruption.
Zircon is the oldest dated mineral on Earth. With a hardness rating of 7.5, it is resistant to chemical and mechanical weathering and can withstand metamorphism (structural changes due to heat, pressure, and other natural processes). All of these factors make it an ideal mineral for geological dating, especially for magma. Because zircon does not gain or lose uranium or lead even at mag-matic temperatures, it typically contains high uranium and low lead levels, and scientists can use the ratio of these two elements in the zircon to determine the age of the sample.
The way in which zircon crystals in the Youngest Toba Tuff magma appear to have nucleated and grown over time, the research-ers found, provides evidence of intermittent changes in the composition of the under-ground body of magma that eventually erupted. Certain characteristics of the zircon also indicate repeated episodes of magma recharge—fresh influxes of magma that often trigger eruptions—occurring tens of thou-sands to hundreds of thousands of years before the supereruption.
The team’s findings are significant for modern humans, given that aerosols and ash that erupted from Youngest Toba Tuff are thought to have entered the atmosphere, causing global cooling and the near extinction of the human race. A supereruption of equal or greater magnitude today could therefore have similarly drastic consequences. By bet-
ter understanding the conditions that led up to the supereruption, scientists can help paint a clearer picture of the future. (Geochemistry, Geophysics, Geosystems, https:// doi . org/ 10 . 1002/ 2016GC006641, 2017) —Sarah Witman, Freelance Writer
A lake (black) fills Toba caldera in Sumatra, Indonesia, as
seen in this false- color image from NASA’s Landsat satel-
lite. A supereruption 74,000 years ago is thought to be
the largest eruption ever experienced by humans. Credit:
NASA
Climate change is rapidly transforming the world’s oceans, and researchers are scrambling to understand what that means for the physical and biogeochemical processes that govern ocean
systems around the world. Scientists have measured dissolved carbon dioxide (CO2) gas dynamics in many ocean regions to predict future CO2 exchange between air and sea, which will influence ocean acidifi-cation and global warming. Nonetheless, such data are sorely lacking for remote polar regions, where sea ice hinders ship access.
To help fill the polar data gap, Islam et al. investigated gas exchange in the waters of the Arctic Ocean’s vast Canada Basin. In August 2012, they deployed ice- tethered profilers in two regions, one with a dense cover of sea ice and another with only sparse ice. Each profiler included a bundle of sensor instruments suspended about 6 meters deep in the water and tethered to the ice floating above.
For almost 50 days, the sensors measured carbon dioxide and oxy-gen levels, temperature, salinity, and chlorophyll a fluorescence, which helps reveal biological production. The sites were 222 kilome-ters apart, on average, and as the sea ice drifted, the tethered sensors did too.
The team previously published their gas measurements in May 2016, reporting that carbon dioxide levels at both sites were below atmospheric saturation during the study period, whereas dissolved oxygen was slightly supersaturated. In the new study, the scientists compared the two sites to examine how ice cover influenced observed variability in oxygen and carbon dioxide levels. They used computa-tional modeling to analyze sensor data in the context of concurrent
oceanic and atmo-spheric conditions.
The results sug-gested that in the region with sparse ice cover, biological production, gas exchange with the atmosphere, and mixing between dif-ferent layers of sea-water all influenced oxygen and carbon dioxide variability. In the ice- dense region, mixing played a dominant role in gas variability, and biological pro-duction and gas exchange provided a negligible contribution.
These findings could help improve understanding of gas exchange in the Arctic Ocean. Arctic sea ice is declining rapidly, and some researchers predict that fresh meltwater will inhibit nutrient trans-port and limit biological activity, allowing the surface ocean to come into equilibrium with atmospheric CO2 and promoting acidification. The authors say that continued CO2 monitoring in the Canada Basin is necessary to better understand current trends and future possibilities. ( Journal of Geophysical Research: Oceans, https:// doi . org/ 10 . 1002/ 2016JC012162, 2017) —Sarah Stanley, Freelance Writer
How Arctic Ice Affects Gas Exchange Between Air and Sea
Woods Hole and Purdue researchers auger an ice hole
for deployment of equipment through the ice in 2014.
Credit: C. Beatty, University of Montana
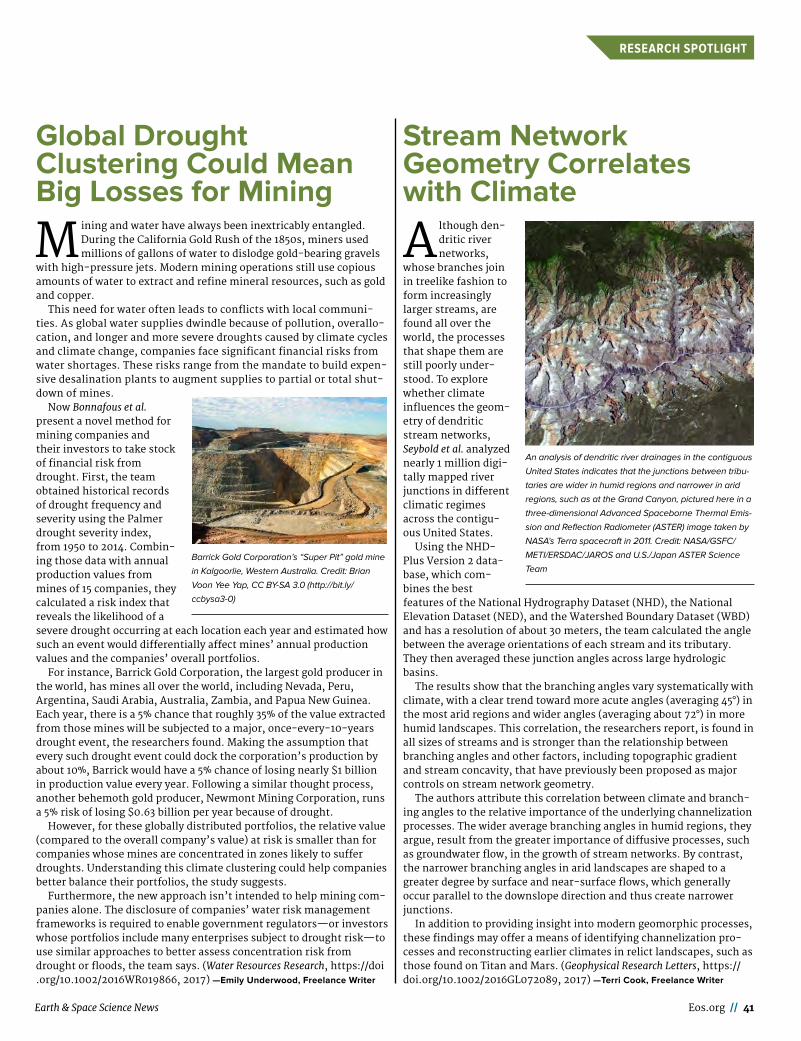
Earth & Space Science News Eos.org // 41
RESEARCH SPOTLIGHT
Mining and water have always been inextricably entangled. During the California Gold Rush of the 1850s, miners used millions of gallons of water to dislodge gold- bearing gravels
with high- pressure jets. Modern mining operations still use copious amounts of water to extract and refine mineral resources, such as gold and copper.
This need for water often leads to conflicts with local communi-ties. As global water supplies dwindle because of pollution, overallo-cation, and longer and more severe droughts caused by climate cycles and climate change, companies face significant financial risks from water shortages. These risks range from the mandate to build expen-sive desalination plants to augment supplies to partial or total shut-down of mines.
Now Bonnafous et al. present a novel method for mining companies and their investors to take stock of financial risk from drought. First, the team obtained historical records of drought frequency and severity using the Palmer drought severity index, from 1950 to 2014. Combin-ing those data with annual production values from mines of 15 companies, they calculated a risk index that reveals the likelihood of a severe drought occurring at each location each year and estimated how such an event would differentially affect mines’ annual production values and the companies’ overall portfolios.
For instance, Barrick Gold Corporation, the largest gold producer in the world, has mines all over the world, including Nevada, Peru, Argentina, Saudi Arabia, Australia, Zambia, and Papua New Guinea. Each year, there is a 5% chance that roughly 35% of the value extracted from those mines will be subjected to a major, once- every-10- years drought event, the researchers found. Making the assumption that every such drought event could dock the corporation’s production by about 10%, Barrick would have a 5% chance of losing nearly $1 billion in production value every year. Following a similar thought process, another behemoth gold producer, Newmont Mining Corporation, runs a 5% risk of losing $0.63 billion per year because of drought.
However, for these globally distributed portfolios, the relative value (compared to the overall company’s value) at risk is smaller than for companies whose mines are concentrated in zones likely to suffer droughts. Understanding this climate clustering could help companies better balance their portfolios, the study suggests.
Furthermore, the new approach isn’t intended to help mining com-panies alone. The disclosure of companies’ water risk management frameworks is required to enable government regulators—or investors whose portfolios include many enterprises subject to drought risk—to use similar approaches to better assess concentration risk from drought or floods, the team says. (Water Resources Research, https:// doi . org/ 10 . 1002/ 2016WR019866, 2017) —Emily Underwood, Freelance Writer
Global Drought Clustering Could Mean Big Losses for Mining
Barrick Gold Corporation’s “Super Pit” gold mine
in Kalgoorlie, Western Australia. Credit: Brian
Voon Yee Yap, CC BY- SA 3.0 ( http:// bit . ly/
ccbysa3 - 0)
Although den-dritic river networks,
whose branches join in treelike fashion to form increasingly larger streams, are found all over the world, the processes that shape them are still poorly under-stood. To explore whether climate influences the geom-etry of dendritic stream networks, Seybold et al. analyzed nearly 1 million digi-tally mapped river junctions in different climatic regimes across the contigu-ous United States.
Using the NHD-Plus Version 2 data-base, which com-bines the best features of the National Hydrography Dataset (NHD), the National Elevation Dataset (NED), and the Watershed Boundary Dataset (WBD) and has a resolution of about 30 meters, the team calculated the angle between the average orientations of each stream and its tributary. They then averaged these junction angles across large hydrologic basins.
The results show that the branching angles vary systematically with climate, with a clear trend toward more acute angles (averaging 45°) in the most arid regions and wider angles (averaging about 72°) in more humid landscapes. This correlation, the researchers report, is found in all sizes of streams and is stronger than the relationship between branching angles and other factors, including topographic gradient and stream concavity, that have previously been proposed as major controls on stream network geometry.
The authors attribute this correlation between climate and branch-ing angles to the relative importance of the underlying channelization processes. The wider average branching angles in humid regions, they argue, result from the greater importance of diffusive processes, such as groundwater flow, in the growth of stream networks. By contrast, the narrower branching angles in arid landscapes are shaped to a greater degree by surface and near- surface flows, which generally occur parallel to the downslope direction and thus create narrower junctions.
In addition to providing insight into modern geomorphic processes, these findings may offer a means of identifying channelization pro-cesses and reconstructing earlier climates in relict landscapes, such as those found on Titan and Mars. (Geophysical Research Letters, https:// doi . org/ 10 . 1002/ 2016GL072089, 2017) —Terri Cook, Freelance Writer
Stream Network Geometry Correlates with Climate
An analysis of dendritic river drainages in the contiguous
United States indicates that the junctions between tribu-
taries are wider in humid regions and narrower in arid
regions, such as at the Grand Canyon, pictured here in a
three- dimensional Advanced Spaceborne Thermal Emis-
sion and Reflection Radiometer (ASTER) image taken by
NASA’s Terra spacecraft in 2011. Credit: NASA/GSFC/
METI/ERSDAC/JAROS and U.S./Japan ASTER Science
Team
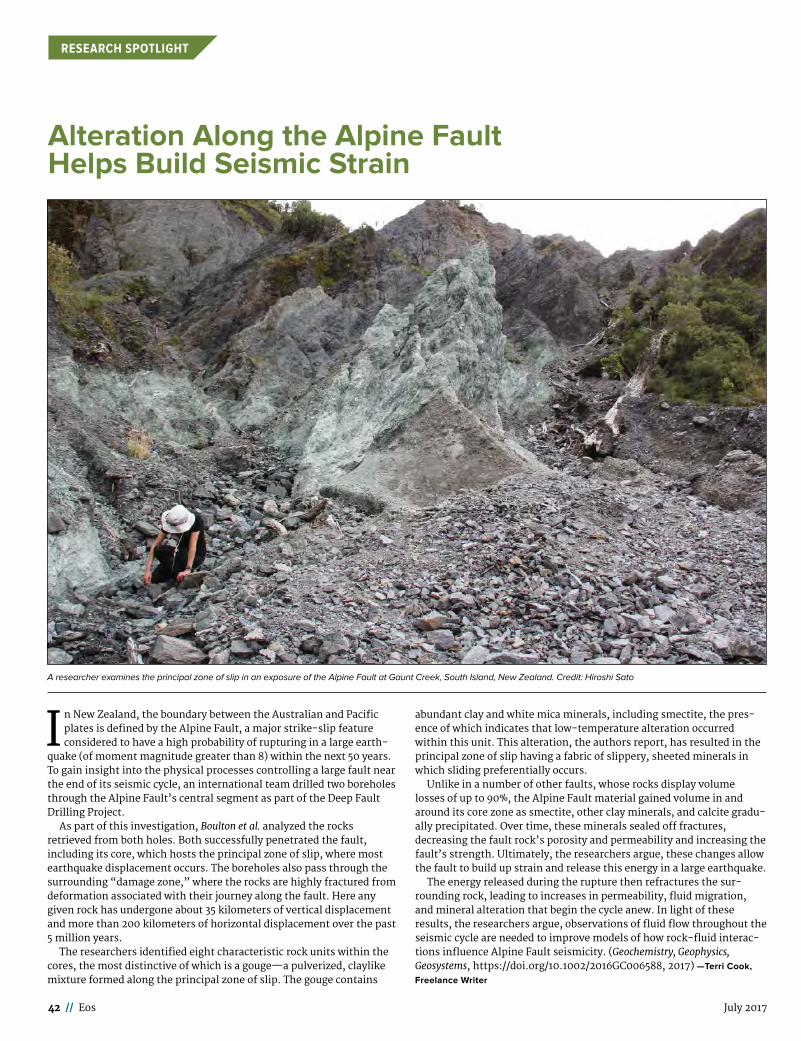
42 // Eos July 2017
RESEARCH SPOTLIGHT
Alteration Along the Alpine Fault Helps Build Seismic Strain
In New Zealand, the boundary between the Australian and Pacific plates is defined by the Alpine Fault, a major strike- slip feature considered to have a high probability of rupturing in a large earth-
quake (of moment magnitude greater than 8) within the next 50 years. To gain insight into the physical processes controlling a large fault near the end of its seismic cycle, an international team drilled two boreholes through the Alpine Fault’s central segment as part of the Deep Fault Drilling Project.
As part of this investigation, Boulton et al. analyzed the rocks retrieved from both holes. Both successfully penetrated the fault, including its core, which hosts the principal zone of slip, where most earthquake displacement occurs. The boreholes also pass through the surrounding “damage zone,” where the rocks are highly fractured from deformation associated with their journey along the fault. Here any given rock has undergone about 35 kilometers of vertical displacement and more than 200 kilometers of horizontal displacement over the past 5 million years.
The researchers identified eight characteristic rock units within the cores, the most distinctive of which is a gouge—a pulverized, claylike mixture formed along the principal zone of slip. The gouge contains
abundant clay and white mica minerals, including smectite, the pres-ence of which indicates that low- temperature alteration occurred within this unit. This alteration, the authors report, has resulted in the principal zone of slip having a fabric of slippery, sheeted minerals in which sliding preferentially occurs.
Unlike in a number of other faults, whose rocks display volume losses of up to 90%, the Alpine Fault material gained volume in and around its core zone as smectite, other clay minerals, and calcite gradu-ally precipitated. Over time, these minerals sealed off fractures, decreasing the fault rock’s porosity and permeability and increasing the fault’s strength. Ultimately, the researchers argue, these changes allow the fault to build up strain and release this energy in a large earthquake.
The energy released during the rupture then refractures the sur-rounding rock, leading to increases in permeability, fluid migration, and mineral alteration that begin the cycle anew. In light of these results, the researchers argue, observations of fluid flow throughout the seismic cycle are needed to improve models of how rock- fluid interac-tions influence Alpine Fault seismicity. (Geochemistry, Geophysics, Geosystems, https:// doi . org/ 10 . 1002/ 2016GC006588, 2017) —Terri Cook,
Freelance Writer
A researcher examines the principal zone of slip in an exposure of the Alpine Fault at Gaunt Creek, South Island, New Zealand. Credit: Hiroshi Sato
Earth & Space Science News Eos.org // 43
POSITIONS AVAILABLE
ATMOSPHERIC SCIENCES
Assistant Professor (Probationary Tenure- Track)– Atmospheric Science, Department of Physics and Atmo-spheric Science, Dalhousie Univer-sity
Dalhousie University invites appli-cations from outstanding candidates for a faculty position in atmospheric science. This is a probationary tenure track position with the rank of assis-tant professor. Candidates will have a PhD in a related discipline, proven teaching ability or potential at the uni-versity level, and must demonstrate the ability or potential to establish a successful research program. The suc-cessful candidate will be expected to enhance and complement the existing activities of the atmospheric science group in both teaching and research.
The atmospheric science group (www . atm . dal . ca) and the broader department have an active research program with connections to many major national and international pro-grams. Dalhousie is one of the top uni-versities in Canada. For example, three of the last four recipients of the NSERC Herzberg Gold Medal, Canada’s highest prize in science and engineering, have been Dalhousie faculty. Halifax offers an outstanding quality of life.
Applications should be submitted by September 4, 2017 and consist of a cur-riculum vitae, a research proposal (max 3 pages), a statement of teaching inter-ests and experience, contact informa-tion for at least three referees, and a completed Self- Identification Ques-tionnaire (available at: http://www .dal . ca/becounted/selfid). Please send application materials to:
Chair, Atmospheric Science Searchc/o Jennifer.Currie@Dal . CaDepartment of Physics and Atmo-
spheric ScienceDalhousie University6310 Coburg Street, Room 218Halifax, Nova Scotia, B3H 4R2CanadaConsideration of candidates will
begin in September 2017 and continue until the position is filled. While it is intended for the position to commence on July 1, 2018, the start date can be negotiated at the time of offer.
Dalhousie University is committed to fostering a collegial culture grounded in diversity and inclusive-ness. The University encourages appli-cations from Aboriginal people, per-sons with a disability, racially visible persons, women, persons of minority sexual orientations and gender identi-ties, and all candidates who would con-tribute to the diversity of our commu-nity. All qualified candidates are encouraged to apply; however, Canadi-ans and permanent residents will be given priority.
Postdoctoral research position on constraining desert dust– climate interactions, University of Califor-nia, Los Angeles
UCLA’s department of Atmospheric and Oceanic Sciences seeks a postdoc-toral scholar for a project to constrain the global cycle of desert dust aero-sols, and its interactions with radia-tion, clouds, and climate. Anticipated duties include analyzing climate model output, conducting climate model simulations, developing simple analytical theories, and supervising graduate and undergraduate students.
Desired qualifications include a Ph.D. in atmospheric science, physics, engineering, or a related field, strong quantitative and programming skills, knowledge of the global dust cycle and/or radiative transfer, experience running atmospheric models and ana-lyzing their output, and strong scien-tific writing skills.
Applicants should send a CV with a cover letter, three references, and a one page summary of recent work and interests as a single PDF document to Prof. Jasper Kok ([email protected]). This appointment is for one year, renewable for up to three years pend-ing satisfactory performance and con-tinued funding. The start date is flexi-ble, but would preferably be between July and October of 2017. Review of applications will continue until the position is filled.
For more information about Prof. Jasper Kok’s research and the Earth, Wind & Particles group at UCLA, please visit http://jasperfkok.com.
The University of California is an Equal Opportunity/Affirmative Action Employer. All qualified applicants will receive consideration for employment without regard to race, color, religion, sex, sexual orientation, gender iden-tity, national origin, disability, age or protected veteran status. For the com-plete University of California nondis-crimination and affirmative action pol-icy please follow this link: <http://policy . ucop . edu/doc/4000376/ NondiscrimAffirmAct>.
CRYOSPHERE SCIENCES
Assistant / Associate Professor of Physical Glaciology Climate Change Institute and School of Earth and Climate Sciences, University of Maine
Climate Change Institute and School of Earth and Climate Sciences
The University of Maine Climate Change Institute (CCI) and School of Earth and Climate Sciences (SECS) invite applicants for a full- time tenure- track Assistant/Associate Pro-fessor position in Physical Glaciology. The successful applicant will have a joint appointment salaried through the two units (55% CCI/45% SECS) with tenure home in SECS, and position responsibilities distributed as 60% research and 40% teaching. We seek an individual who integrates observations from field study and remote sensing of critical cryosphere phenomena into a physical framework that joins glacier dynamics to Earth’s climate on short
and long periods. The individual will be expected to develop and carry out gla-ciological field investigations with an emphasis on ice sheet dynamics, and to establish and maintain collabora-tions with UMaine, national, and inter-national research programs. Potential research collaboration areas include those related but not restricted to: ice- ocean interactions and sea- level rise; understanding the tempo and causes of global climate change through geologi-cal observations; interpretation of ice core records with the larger Earth/cli-mate system; ice sheets and mountain glaciers as indicators of past and future climate change; ice rheology; and cou-pled ice mechanics and geochemical evolution of glaciers. We do not expect one individual to lead research in all of these subdisciplines, but rather to have the expertise, flexibility, and creativity to communicate with UMaine researchers across the spatial and tem-poral boundaries that separate these subdisciplines. For more information, visit http://climatechange . umaine . edu and https://umaine . edu/earthclimate/.
A PhD in glaciology or closely related field is required. A documented ability to conduct high- quality scientific research, as evidenced by publications in peer- reviewed journals, is essential. Other measures of potential for suc-cess, such as postdoctoral experience, prior success in obtaining funding, stu-dent teaching and research mentoring, interdisciplinary research experience, collaboration capacity, polar field experience, international reputation and engagement, and excellent written and oral communication skills, are desirable.
Materials must be submitted at https://umaine.hiretouch . com/ job -details?jobID = 40766&job= assistant - associate - professor - of - physical - glaciology. Applicants will need to create a profile and application; upload a cover letter, a CV which fully describes their experience with specific reference to the required and desirable qualifications, statement of teaching philosophy and interests, statement of research vision, and contact informa-tion for three professional references. Review of applications will begin July 17, 2017 and will continue until the position is filled. Anticipated start date is January 2018. For questions about the position, please contact um . glaciologysearch@maine . edu.
The University of Maine is an EEO/AA Employer. All qualified applicants will receive consideration for employ-ment without regard to race, color, religion, sex, national origin, sexual orientation, age, disability, protected veteran status, or any other character-istic protected by law.
EARTH AND SPACE SCIENCE INFORMATICS
Environmental Sensing, Data Ana-lytics, and Computational Ecology Opportunities, US Army Engineer
AGU’s Career Center is the main resource for recruitment advertising.
All Positions Available and additional job postings can be viewed at https://eos.org/jobs-support. AGU offers printed recruitment advertising in Eos to reinforce your online job visibility and your brand.
Visit employers.agu.org to view all of the packages available for recruitment advertising.
SIMPLE TO RECRUIT• online packages to access our Career Center audience • 30-day and 60-day options available • prices range $475–$1,215
CHALLENGING TO RECRUIT • online and print packages to access the wider AGU community • 30-day and 60-day options available • prices range $795–$2,691 DIFFICULT TO RECRUIT • our most powerful packages for maximum multimedia exposure to the AGU community • 30-day and 60-day options available
• prices range $2,245–$5,841 FREE TO RECRUIT • these packages apply only to student and graduate student roles and all bookings are subject to AGU approval • eligible roles include: student fellowships, internships, assistantships, and scholarships
• Eos is published monthly. Deadlines for ads in each issue are published at http://sites. agu.org/media-kits/eos- advertising-deadlines/. • Eos accepts employment and open position advertisements from governments, individuals, organizations, and academic
institutions. We reserve the right to accept or reject ads at our discretion.
• Eos is not responsible for typographical errors.
* Print-only recruitment ads will only be allowed for those whose requirements include that positions must be advertised in a printed/paper medium.
44 // Eos July 2017
POSITIONS AVAILABLE
Research and Development Center (ERDC)
The Environmental Systems Branch in the Environmental Laboratory (EL) of the US Army Engineer Research and Development Center (ERDC) are lead-ers in the areas of environmental characterization and change detec-tion, application of geospatial and sensor technologies, and field collec-tion and modeling of environmental data. This branch is composed of motivated and innovative people working in physical geography, biol-ogy, ecology, civil and electrical engi-neering, computer science, and phys-ics who are involved in a wide range of civil and military research projects. We are currently expanding our capa-bilities in the areas of environmental sensor and instrumentation technolo-gies, data analytics, and computa-tional ecology. These research areas require significant expertise in com-puting, electrical engineering, mathe-matics, as well as spatial modeling and network science.
The ERDC is a world class research organization composed of seven labo-ratories and over 2,000 employees, which execute more than $1B per year in support of the US Army Corps of Engineers, Department of Defense, and a variety of other sponsors. The EL’s 200+ scientists and engineers seek to “provide solutions to tomor-row’s environmental challenges” through a broad array of basic and applied research. To obtain more information, please send a cover letter and curriculum vitae to: Mr. Mark Graves (mark . r . graves@usace . army . mil).
GEOCHEMISTRY
Hydrogeochemist – Geohydrology Section – Kansas Geological Survey – The University of Kansas, Law-rence. Full- time position to lead KGS hydrogeochemical investigations. Faculty- equivalent, sabbatical- eligible position at Assistant or entry- level Associate Scientist rank. Requires Ph.D. with emphasis on aqueous geo-chemistry related to groundwater resources, and scientific leadership potential. Background in hydrogeo-chemistry applied to regional- scale groundwater investigations is desired. The Geohydrology Section has 6 full- time professionals with additional support personnel. Emphasis on state- of- the- science field studies and complementary theoretical research. Complete announcement/application information at www.kgs.ku.edu/ General/jobs.html. Review of applica-tions will begin Sept. 30, 2017.
For further information contact Geoff Bohling (geoff@kgs . ku . edu) or Don Whittemore (donwhitt@kgs . ku . edu). For other questions contact Annette Delaney, KGS Human Resources, adelaney@ku . edu.
KU is an EO/AAE, http://policy . ku . edu/IOA/nondiscrimination.
GEODESY
Planetary Geophysicist/Geodesist, NASA, Goddard Space Flight Center
Position available at the National Aeronautics and Space Administration, Goddard Space Flight Center, Green-belt, Maryland, Planetary Geophysicist/Geodesist.
The Solar System Exploration Divi-sion, Planetary Geology, Geophysics and Geochemistry Laboratory, is seek-ing a research scientist with expertise in analysis of planetary spacecraft radiometric tracking data and geo-physical applications. We are especially interested in demonstrated capabilities using radio signals for precision orbit determination and planetary gravity field determination, specifically with expertise in measurement modeling and development of innovative inver-sion techniques. Experience in the use of altimetry data and complex radio data (e.g., VLBI) for orbit determina-tion is desirable. Candidates must have demonstrated experience in spacecraft instrument modeling, data reduction and analysis, and applications to develop value- added products (e.g., crustal thickness, crustal density, internal structure, and localized gravity representations). Experience on recent lunar and/or planetary mission science teams (e.g., GRAIL, MESSENGER) and analysis of recent planetary spacecraft mission data for gravitational field determination are required. The incumbent is expected to participate in development of new flight mission concepts and proposals that improve knowledge of planetary topography and gravity fields.
A PhD in a relevant field of Physics, Geophysics, Geodetic Sciences or Plan-etary Sciences is desired. U.S. citizen-ship required. Salary will be commen-surate with experience and qualifications. To view the full vacancy announcement, which contains further information, including how to apply, go to https://www . usajobs . gov/. For information about the research pro-gram and the Planetary Geology, Geo-physics, and Geochemistry Lab, please contact Lori Glaze at 301- 614- 6466 or Lori . S . Glaze@nasa . gov.
NASA, GSFC is an Equal Opportunity Employer.
GLOBAL ENVIRONMENTAL CHANGE
Post- doctoral Fellowship at the Uni-versity of Alberta in Integrated Assessment Modelling
Applications are invited for a two- year post- doctoral fellowship in the area of integrated assessment of global change, with a focus on energy sys-tems, climate change, and the water- energy nexus. Based at the Department of Civil and Environmental Engineer-ing at the University of Alberta in Edmonton, Canada, the successful can-didate will also interact with research-ers and modellers in Environment and
Assistant Professor (Tenure Track) of Mineral Resources→ The Department of Earth Sciences (www.erdw.ethz.ch) at ETH Zurich invites applica-tions for the above-mentioned position. The pro-fessorship offers long-term funding to establish new laboratories and a dynamic research team that should be created at the core of an innovative research program. Research fields may comprise physical and chemical processes as well as time scales of ore formation, mineral precipitation from fluids and melts, the processing of man-made resources or aspects of resource evaluation. The program is in part field based but may also include experimental aspects.
→ The successful candidate has a strong ana-lytical background, and will combine analytical and theoretical investigations of ore and related resources. He or she is a leading scientist connec-ted to the industry of ore exploration as well as companies or government agencies dealing with man-made deposits. The new professorship will contribute to introductory and advanced courses on ore formation and related fields, and teach field and laboratory methods relevant to ore explora-tion. Generally, undergraduate level courses are taught in German or English and graduate level courses are taught in English.
→ Assistant professorships have been established to promote the careers of younger scientists. ETH Zurich implements a tenure track system equiva-lent to other top international universities.
→ Please apply online at: www.facultyaffairs.ethz.ch
→ Applications include a curriculum vitae, a list of publications, a statement of future research and teaching interests, and a description of the three most important achievements. The letter of application should be addressed to the President of ETH Zurich, Prof. Dr. Lino Guzzella. The closing date for applications is 31 July 2017. ETH Zurich is an equal opportunity and family friendly employer and is responsive to the needs of dual career cou-ples. We specifically encourage women to apply.
Earth & Space Science News Eos.org // 45
POSITIONS AVAILABLE
Climate Change Canada, Government of Canada, Ottawa, Canada, and at the Joint Global Change Research Institute (JGCRI), Pacific Northwest National Laboratory, Washington, DC, through short research stays. He/she will use and contribute to the development of JGCRI’s Global Change Assessment Model (GCAM; see http://www . globalchange . umd . edu/gcam/).
Qualifications
• PhD in engineering, operations research, management science, com-puter science, economics, environ-mental science/policy or related field; preference will be given to candidates with expertise in modelling and model development, energy- economic mod-elling, integrated assessment model-ling, systems thinking and analysis, and the water- energy nexus.
• Demonstrated scientific ability through publications in peer- reviewed journals, model developments, leader-ship, and successful grant applications.
• Computer programming skills in C++ and Python, R, and high perfor-mance technical computing.
• Demonstrated ability to organize and coordinate research projects involving multiple researchers.
• Excellent communication skills, ability to work in a group environment, and a demonstrated interest and ability in successful collaboration across dis-ciplinary boundaries.
Anticipated Remuneration: Approx-imately $55,000 CAD/year
Anticipated Start Date: July 15, 2017Please send your CV and a cover let-
ter that describes your relevant qualifi-cations and experience to,
Dr. Evan Davies, Associate ProfessorDept. of Civil and Environmental
Engineering, University of Alberta9211 – 116 St NW, Edmonton, AB,
Canada, T6G 1H9or email the above to evan.davies@
ualberta . ca
Assistant Professor in Climate Change and Remote Sensing, Uni-versity of Richmond
The Department of Geography and the Environment invites applications for a tenure- track position at the assis-tant professor level to begin August 2018. We seek a candidate with a strong commitment to high quality research and undergraduate education and pri-mary expertise in climate change sci-ence with specialization in remote sensing. Applicants with an African focus are especially encouraged to apply; however, we welcome applica-tions from any national and/or interna-tional areas of focus. Candidates must hold a Ph.D. in Geography or a related field, must be academically qualified to teach, and must meet all other position requirements at the time of selection. The position involves teaching courses in remote sensing and climate change and contributing to the department’s core curriculum in physical geography. The department’s spatial analysis labo-ratory includes a full suite of geographic
information systems and remote sens-ing hardware and software. In joining the department, the applicant would contribute to an active, student- centered learning environment with ongoing collaborations throughout campus and the community. Excellent opportunities exist for interdisciplinary research and to work with faculty, staff, and students from diverse back-grounds. The position would be joint- appointed in the Environmental Stud-ies Program.
Applicants should apply online at University of Richmond Online Employment website using the Faculty (Instructional/Research) link. Appli-cants will be asked to submit a cover letter, a statement of teaching interests and philosophy, evidence of teaching effectiveness (if available), a descrip-tion of current and planned research programs, and a current curriculum vita. Applicants will also be asked to submit electronically the names of three references who will receive an automated email asking them to sub-mit their reference letter. At least one of the three letters of recommendation should address teaching effectiveness or potential. Review of applications will begin on August 31, 2017 and will con-tinue until the position is filled.
The University of Richmond is a pri-vate, highly selective, predominantly liberal arts institution. The University is committed to developing a diverse workforce and student body, and to modeling an inclusive campus commu-nity which values the expression of dif-ference in ways that promote excel-lence in teaching, learning, personal development, and institutional success. Our academic community strongly encourages applications that are in keeping with this commitment. For more information on the Department of Geography and the Environment, see the department website. Please direct all inquiries about this position to Todd Lookingbill, Chair of the Search Com-mittee, Department of Geography and the Environment, University of Rich-mond, VA 23173 ( tlooking@ richmond . edu).
INTERDISCIPLINARY
Assistant/Associate/Full Professors- Physical and biological Oceanogra-phy, marine geophysics/geology, The Southern University of Science and Technology
The department of oceanography at the Southern University of Science and Technology of China (SUSTech) invites applications for tenure- track (or ten-ured) faculty positions at the ranks of Assistant, Associate, and Full Profes-sors. Applicants must have earned doc-toral degrees in marine geophysics/geology, physical oceanography, bio-logical oceanography and ocean engi-neering or closely related fields. Suc-cessful applicants will be expected to establish a robust, externally funded research program and demonstrate
strong commitment to undergraduate and graduate teaching, student mento-ring, and professional services. These positions will remain open until filled.
SUSTech is a young university at Shenzhen, China (next to Hong Kong) since 2010 which is set to become a world- leading research university, to lead the higher education reform in China, to serve the needs of innovation- oriented national develop-ment and the needs of building Shen-zhen into a modern, international and innovative metropolitan. These posi-tions are created with a significant development to establish a vigorous research program in oceanography at SUSTech to serve the national call for China’s important role in deep sea research and resource- oriented explo-ration in the world oceans.
To apply send a cover letter, com-plete vitae with list of publications, and three names of references to hiring@ sustc . edu . cn, or to Dr. Y. John Chen, Chair Professor at Department of Oceanography, Southern University of Science and Technology, No 1088, Xueyuan Rd., Xili, Nanshan District, Shenzhen, Guangdong, China 518055.
Cluster Hiring in Geo- Bioinformatics/Environmental Genomics and Organic Biogeochem-istry, The Southern University of Science and Technology
The Southern University of Science and Technology (known as SUSTech or
SUSTC) (http:// www . sustc . edu . cn/ en) was founded in 2011 with public fund-ing from Shenzhen, a dynamic city that has been viewed as the vanguard of China’s development in science and technology. The goal of SUSTech is to become a top- tier international uni-versity that excels in interdisciplinary research, talent development and knowledge discovery.
Siting at the mouth of the Pearl River flowing to the South China Sea, the newly born (2015) Department of Ocean Science and Engineering at SUS-Tech aims to become a major player in education and research in ocean sci-ences in China. It will be housed in a brand new building on the beautiful SUSTech campus, with ample labora-tory space that is equipped with the latest technology for conducting cut-ting edge research. The 5000 ton R/V Shenzhen is in the planning stage of construction, which is expected to be built by 2022.
The Institute for Geo- Omics Research (TIGOR) at SUSTech aims to become an open platform for world class research in microbial oceanogra-phy and geomicrobiology, and an invit-ing home for domestic and overseas scientists to exchange ideas and together advance the field of ocean sci-ences. In the early stage of TIGOR’s growth, the priority will be to build two research strengths: Geo- Bioinformatics/Environmental Genomics and Organic Biogeochemistry. The integration of
46 // Eos July 2017
POSITIONS AVAILABLE
these strengths will allow us to study systematically the evolution of life on early Earth, microbial ecology impacted by human activity, mechanisms of bio- organic interactions in the deep ocean, and fundamentals of biogeochemistry (e.g. lipid biosynthesis and bio- fractionation of isotopes of life- essential elements).
In Geo- Bioinformatics/Environ-mental Genomics hiring, we seek highly qualified candidates (at the assistant or associate professor levels) who are able to apply bioinformatics techniques (metagenomics, multi- omic integrative analysis, in silico lead discovery from microbial metabolites and computational biology algorithm/server development) to analyze data from the next- generation sequencing and other high- throughput sequence profiling to address fundamental ques-tions mentioned above. Candidates with strong ecological backgrounds are particularly encouraged to apply.
In Organic Biogeochemistry hiring, we seek highly qualified candidates (at the assistant, associate or full profes-sor levels) with strong skills in mass spectrometry and isotope geochemis-try. The candidates are expected to apply GC- MS, LC- MS (Orbitrap or ion mobility Q- TOF), FT- ICR MS, or AMS to address questions mentioned above.
Highly competitive salaries and benefit packages will be provided to the hired candidates, who may also be eli-gible for additional government sup-port such as the Shenzhen City’s Pea-cock Program and the Chinese Government’s One Thousand Talents Program ( http:// www . sustc . edu . cn/ en/ faculty _ en).
Applicants are required to have a Ph.D. degree in earth sciences, biology, chemistry, computer science, or related disciplines. Post- doctoral experiences are preferred but not required. Candi-dates must have a proven and consis-tent track record of high- quality scien-tific publications and good communication skills. Chinese and English are required languages for teaching. To apply, please submit the following material electronically to wangy9@ sustc . edu . cn: 1) Cover letter; 2) Curriculum vitae (with a complete list of publications); 3) Statement of research and teaching interests; 4) Reprints of three recent papers; and 5) Names and contact information for three references. All positions remain open until filled.
Faculty Positions available in the School of Environmental Science and Engineering, The Southern Univer-sity of Science and Technology
The Southern University of Science and Technology (known as SUSTech or SUSTC) ( http:// www . sustc . edu . cn/ en) was founded in 2011 with public fund-ing from Shenzhen City. A thriving metropolis of 20 million people bor-dering Hong Kong, Shenzhen has often been referred to as the “Silicon Valley of China‚” with strong telecommuni-
cation, biotechnology and pharmaceu-tical sectors. The goal of SUSTech is to become a top- tier international uni-versity that excels in interdisciplinary research, talent development and knowledge discovery. English is the language of instruction.
The School of Environmental Sci-ence and Engineering at SUSTech was established in May 2015 to provide a new platform for performing cutting- edge research and for training a new generation of environmental scientists, engineers and managers who are inter-disciplinary, innovative and global- thinking. Currently the school has 18 full time faculty members (http:// ese . sustc . edu . cn/ en/) with 30 or more tenure- track/tenured positions to be filled. In addition to a generous startup package to each tenured or tenure track faculty position, the school was recently awarded a 3- year grant of 50 million RMB (~7 million USD) to strengthen its 5 core areas of research. Moreover, the school is in line to receive 120 million RMB (~18 million USD) for research instrument capabil-ity development.
Applications are invited for faculty positions at all ranks. Areas of interest include, but are not limited to, water pollution and treatment, environmen-tal (soil, groundwater, ecosystem) remediation and restoration, hydrology and water resources engineering, bio-geochemistry, environmental microbi-ology, atmospheric chemistry, air pol-lution control, air quality engineering, solid waste treatment and utilization, environmental health risk assessment, environmental health interventions, remote sensing of the environment, global change, and environmental management. Highly competitive sala-ries and benefit packages will be pro-vided to tenure- track/tenured faculty. New hires may be eligible for additional government support such as the Shen-zhen City’s Peacock Program and the Chinese Government’s One Thousand Talents Program ( http:// www . sustc . edu . cn/ en/ faculty _ en).
Applicants are required to have a Ph.D. degree in environmental sci-ence and engineering, earth and atmospheric sciences, or related dis-ciplines. Post- doctoral experiences are preferred but not required. Candi-dates must have a proven and consis-tent track record of high- quality sci-entific publications and good communication skills. Chinese lan-guage skill is a plus but not required. To apply, submit the following mate-rials electronically to iese@ sustc . edu . cn: 1) Cover Letter; 2) Curriculum Vitae (with a complete list of publica-tions); 3) Statement of research and teaching interest; 4) Selected reprints of three recent papers; and 5) Names and contact information for five ref-erences. All positions remain open until filled. For additional informa-tion, contact Xiaoli Wang, Email: wangxl@ sustc . edu . cn, phone: + 86- 755- 8801- 0821.
Earth & Space Science News Eos.org // 47
POSITIONS AVAILABLE
Petroleum Geoscientist (2 positions) – Kansas Geological Survey, The University of Kansas, Lawrence. Full- time, faculty- equivalent, sabbatical- eligible positions at Assis-tant or entry- level Associate Scientist rank. Requires Ph.D. in geoscience or related field with experience in petro-leum related research. Positions are expected to conduct, publish, and present the results of fundamental and applied research in petroleum geology and related areas that is of national stature and relevant to Kan-sas. The Energy Research at KGS has six full- time professionals with addi-tional graduate student support. Com-plete announcements/application information at www . kgs . ku . edu/ General/ jobs . html Review of applica-tions will begin Sept. 1, 2017.
For further information contact Eugene Holubnyak ( eugene@ kgs . ku . edu) or Tandis Bidgoli ( tbidgoli@ ku . edu). For other questions contact Annette Delaney, KGS Human Resources, adelaney@ ku . edu.
KU is an EO/AAE, http:// policy . ku . edu/ IOA/ nondiscrimination.
JOB TITLE: Sr. Geophysical Consul-tant (345456)
COMPANY: Aramco Services Com-pany
LINK TO APPLY: http:// aramcoservices . applytojob . com/ apply/ mhngZN/ Sr - Geophysical - Consultant - 345456 ? source= GSA
Basic FunctionServe as a senior technical consul-
tant to Aramco Services Company (ASC) and to the Saudi Aramco Overseas (SAO) Exploration Organization in the geophysical field. Handle assignments that require the highest level of Profes-sional expertise. Candidate capable of originating new concepts and approaches to problems and critically evaluating any aspect of the geophysi-cal operation from data acquisition to
final interpretation depending on their particular geophysical specialty.
Duties & Responsibilities
• Conduct research and geophysical technology development for industry scale applications
• Lead the development of advanced seismic depth image using frontier techniques such as RTM and FWI; this includes all stages of development from conceptual level to a complete indus-trial solutions
• Evaluate geophysical data in an area and either presents results that represent an satisfactory conclusions or recommends procedures to be inaugu-rated that would have a high probability of improving results
Education and Experience
• Bachelor’s degree required in Geo-physics or related field (e.g. Geology, Physics, Mathematics, Electrical Engi-neering). Graduate study or extensive formal training in specialty field is desirable
• Twenty (20) years of professional experience, at least five (5) years of which should be as a specialist in their discipline working in a research envi-ronment
• Must have a thorough knowledge of geophysical practices including sci-entific and economic principles, calcu-lation methods, design details, and codes, standards and specifications
• Ability to design, implement and evaluate seismic processing algorithms on a high end workstation preferred
NO THIRD PARTY CANDIDATES ACCEPTED
OCEAN SCIENCES
Applied Physics Laboratory – Research Associate, University of Washington
The Applied Physics Laboratory at the University of Washington ( APL- UW) is seeking Post- doctoral Research Associates with research interests in
Oceanography, Polar Science, Remote Sensing, Environmental Acoustics and Ocean Engineering. This is a full- time appointment, with expected terms of two years subject to satisfactory perfor-mance and availability of funding.
Positions are not project- specific; a specific applicant is expected to define his/her research goals within the broad program areas of the participating APL departments: Air- Sea Interaction & Remote Sensing (AIRS), Acoustics Department (AD), Ocean Engineering (OE), Ocean Physics Department (OPD), Polar Science Center (PSC). Successful applicants must hold a recent (no more than 4- years) PhD or foreign equivalent in order to assume a post- doctoral position.
More information can be found http:// ap . washington . edu/ ahr/ academic - jobs/ position/ nn23792/
Applicants are asked to submit elec-tronically:
(1) A curriculum vitae,(2) A publication list,(3) A brief research proposal (no
more than 5 pages, double- spaced, excluding bibliography and figures) describing research to be pursued during a two- year tenure at the Univer-sity of Washington, and
(4) The names of four individuals who can provide a letter of reference.
In addition, a letter of support from a mentor in one of the participating departments (AIRS, AD, OE, OPD, PSC) is strongly encouraged. Further infor-mation on current research at APL, by department and principal investigator, can be found at: http:// www . apl . washington . edu/ departments/ departments . php
Applications should be submitted via email:
Dr. Kevin WilliamsSr. Principal Physicist, Acoustics
Department Chair, Liaison of Science and Engineering Group
williams@ apl . washington . edu
VOLCANOLOGY GEOCHEMISTRY AND PETROLOGY
Faculty Position in Geological Sci-ences, Yonsei University
The Department of Earth System Sciences at Yonsei University, Korea, invites applications for a tenure- track faculty position in sedimentology, petrology- geochemistry, resource geology, and other related fields. All (assistant, associate and full) professor levels are considered. The Department of Earth System Sciences supports undergraduate, M.S. and Ph.D. pro-grams in Geological and Environmental Sciences. Yonsei University is one of the premier universities in Korea, located in Seoul. The University may offer reasonable moving expenditure and initial housing for foreign nation-als.
Qualifications Required: A success-ful candidate is expected to build his/her original independent research programs and to seek interdisciplin-ary collaborations with the Depart-ment faculty members and/or other researchers worldwide. The applicant should also have strong passion for teaching and advising students and must have a Ph.D. degree in geologi-cal sciences and related fields with postdoctoral research experience.
Application Procedure: Candidates should submit a CV with a list of pub-lications, a statement of research and teaching plans, and the names and contact addresses for two references. Applications that arrive by 7/7/2017, will receive full consideration. Appli-cations should be submitted to Yonsei University following the guideline outlined at the homepage ( http:// www . yonsei . ac . kr/ en _ sc/). Other inquiries can be E- mailed to: Tae- Kyung Hong, Chair, Department of Earth System Sciences, Yonsei Uni-versity, Seoul 120- 749, Korea, tkhong@ yonsei . ac . kr.
PLACE YOUR AD HERE
Visit Careers.agu.org to learn more about employment advertising with AGU
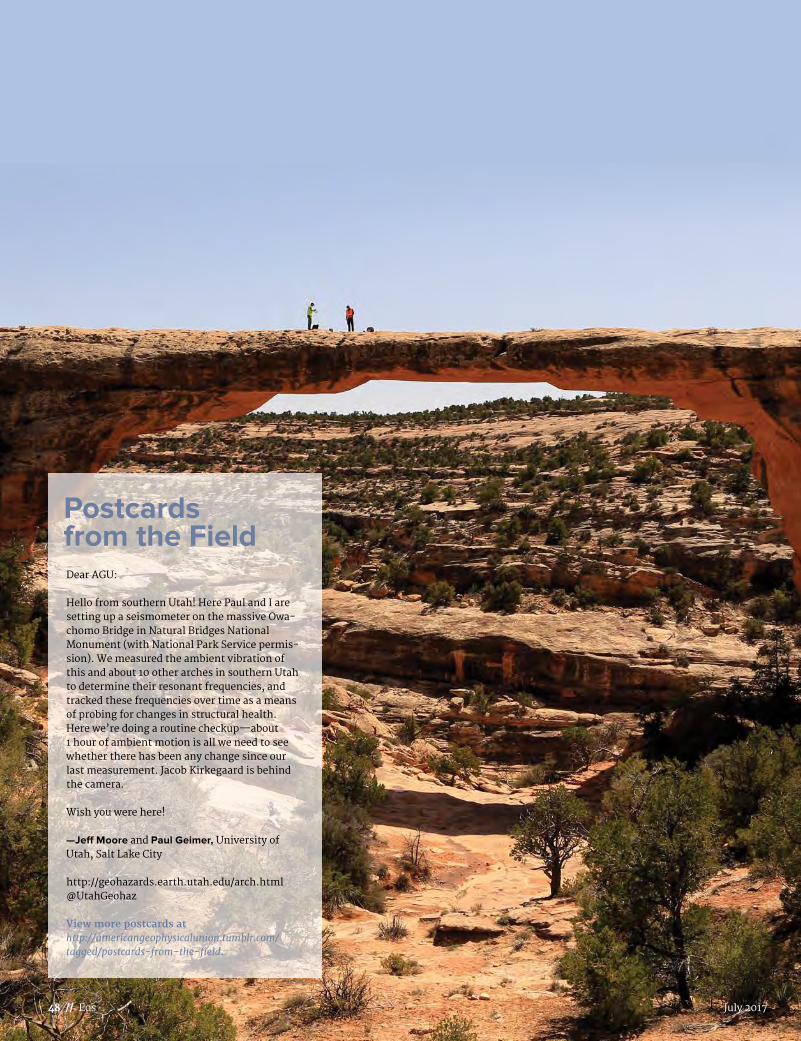
Dear AGU:
Hello from southern Utah! Here Paul and I are setting up a seismometer on the massive Owa-chomo Bridge in Natural Bridges National Monument (with National Park Service permis-sion). We measured the ambient vibration of this and about 10 other arches in southern Utah to determine their resonant frequencies, and tracked these frequencies over time as a means of probing for changes in structural health. Here we’re doing a routine checkup—about 1 hour of ambient motion is all we need to see whether there has been any change since our last measurement. Jacob Kirkegaard is behind the camera.
Wish you were here!
—Jeff Moore and Paul Geimer, University of Utah, Salt Lake City
http://geohazards.earth.utah.edu/arch.html@UtahGeohaz
View more postcards athttp://americangeophysicalunion.tumblr . com/tagged/postcards-from-the-fi eld.
Postcards from the Field
48 // Eos July 2017

CONNECTAn experimental community where you can collaborate, network, and communicate with others about important and timely issues in Earth and space science and beyond.
Be a Beta Tester. Email [email protected] for your invitation.