Embed Size (px)
Citation preview
Earth ScienceEarth Science
Chapter 2Chapter 2
Measuring EarthMeasuring Earth

Shape of EarthShape of Earth
• Evidence the Earth is spherical:– Photographs from space– Setting sunlight lingers on treetops, then
hilltops, then clouds– Large objects appear/disappear over horizon– Eclipses
• True shape of Earth is an oblate spheroid– (Flattened at poles - bulging at equator)
Size of EarthSize of Earth
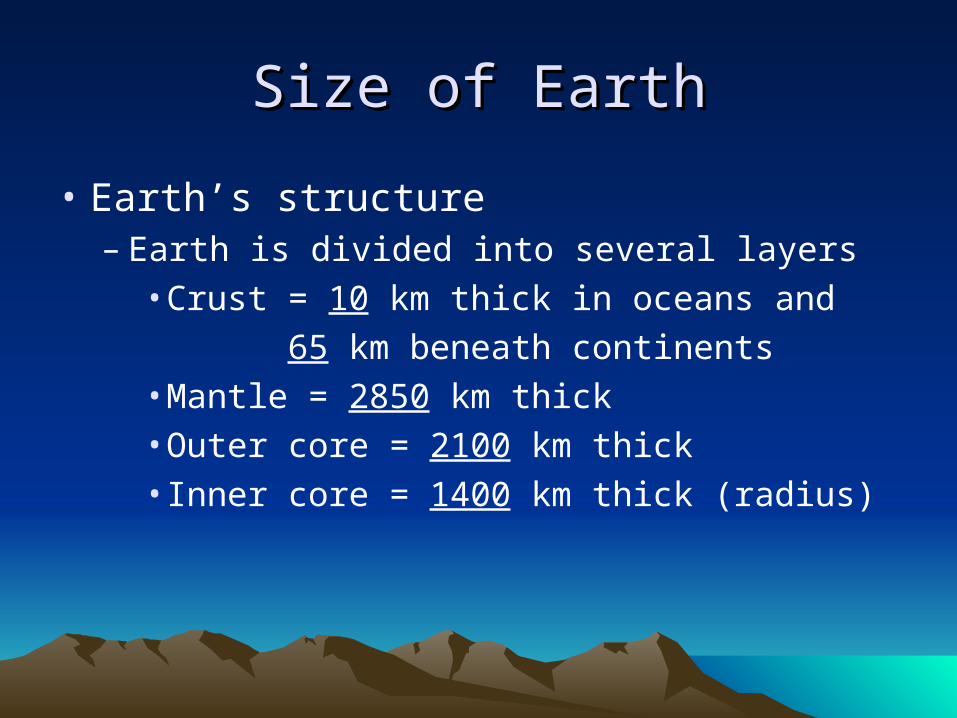
• Earth’s structure– Earth is divided into several layers
• Crust = 10 km thick in oceans and
65 km beneath continents• Mantle = 2850 km thick• Outer core = 2100 km thick• Inner core = 1400 km thick (radius)

Size of EarthSize of Earth
Size of EarthSize of Earth
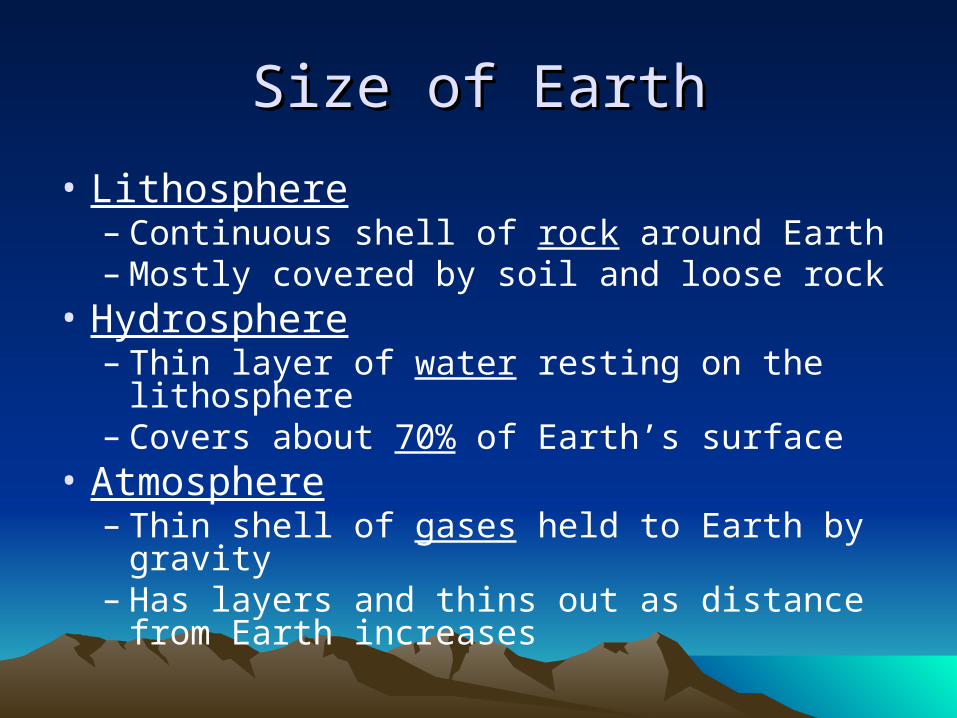
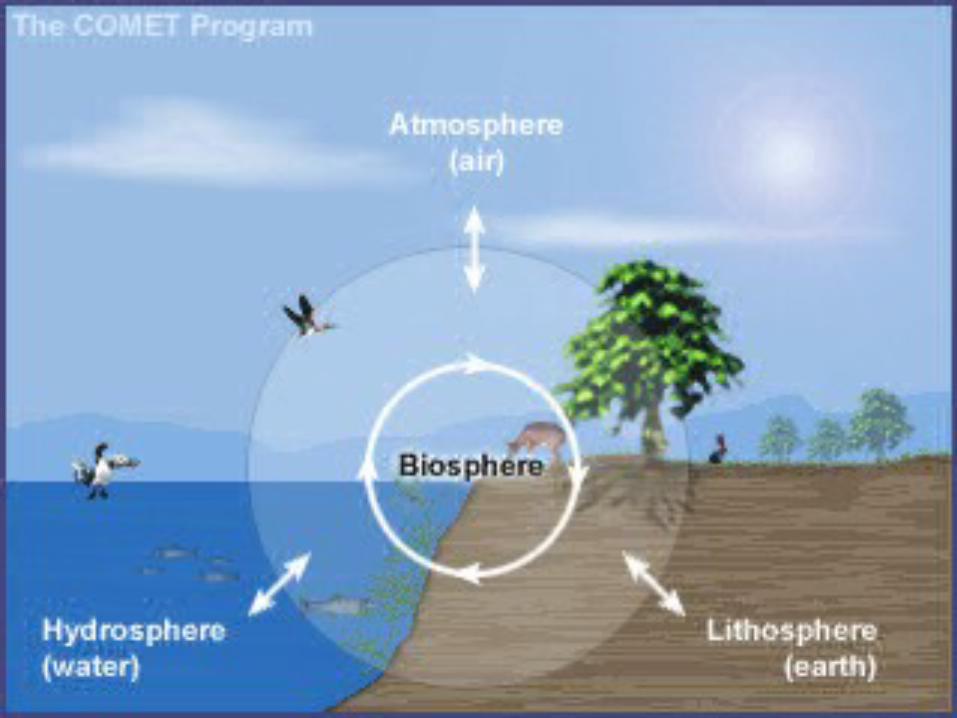
• Lithosphere– Continuous shell of rock around Earth– Mostly covered by soil and loose rock
• Hydrosphere– Thin layer of water resting on the lithosphere– Covers about 70% of Earth’s surface
• Atmosphere– Thin shell of gases held to Earth by gravity– Has layers and thins out as distance from
Earth increases
Size of EarthSize of Earth
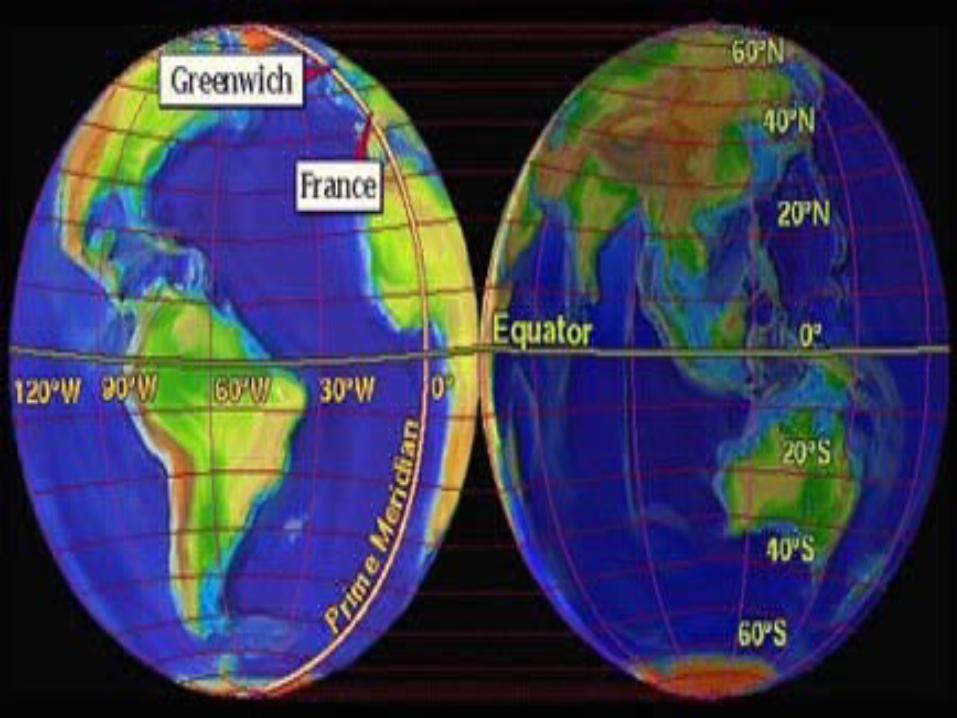
Determining Positions on EarthDetermining Positions on Earth
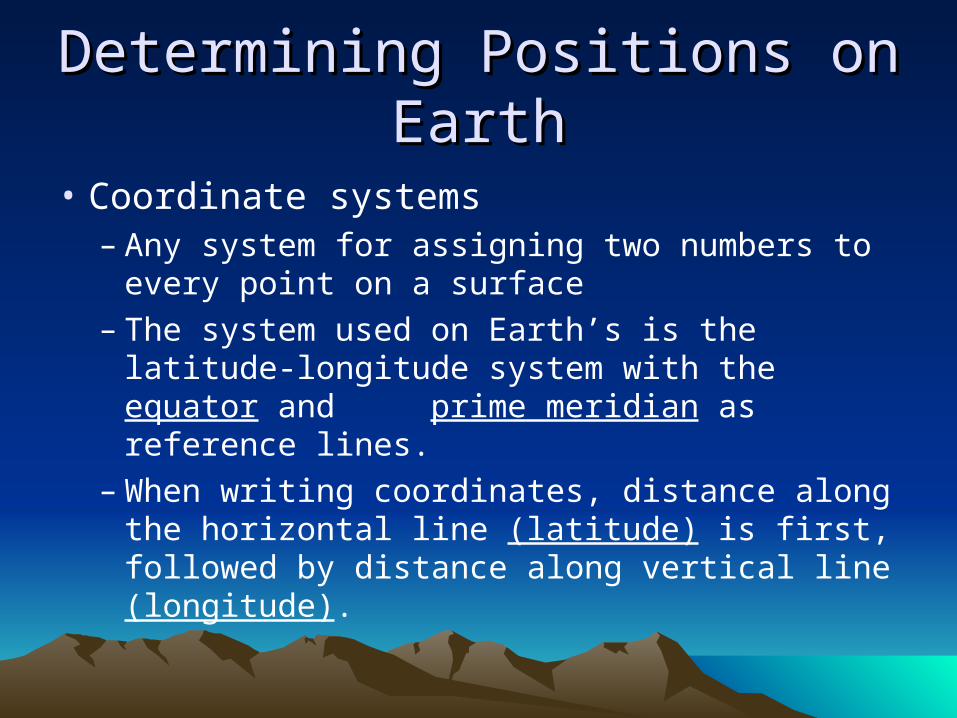
• Coordinate systems– Any system for assigning two numbers to
every point on a surface– The system used on Earth’s is the latitude-
longitude system with the equator and prime meridian as reference lines.
– When writing coordinates, distance along the horizontal line (latitude) is first, followed by distance along vertical line (longitude).
Determining Positions on EarthDetermining Positions on Earth
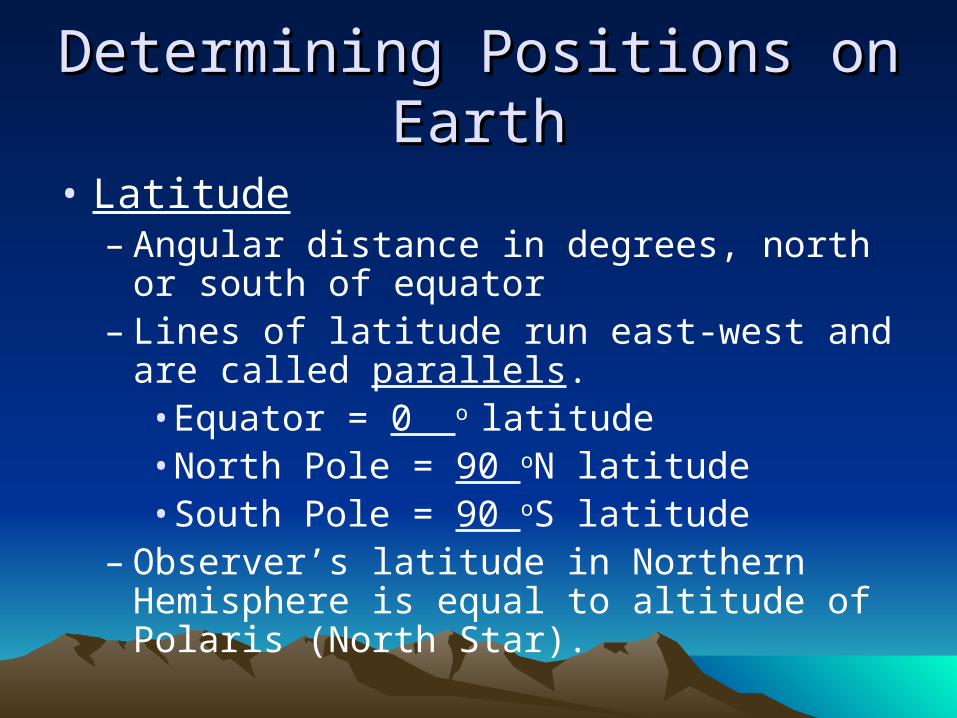
• Latitude – Angular distance in degrees, north or south of
equator– Lines of latitude run east-west and are called
parallels.• Equator = 0 o latitude• North Pole = 90 oN latitude• South Pole = 90 oS latitude
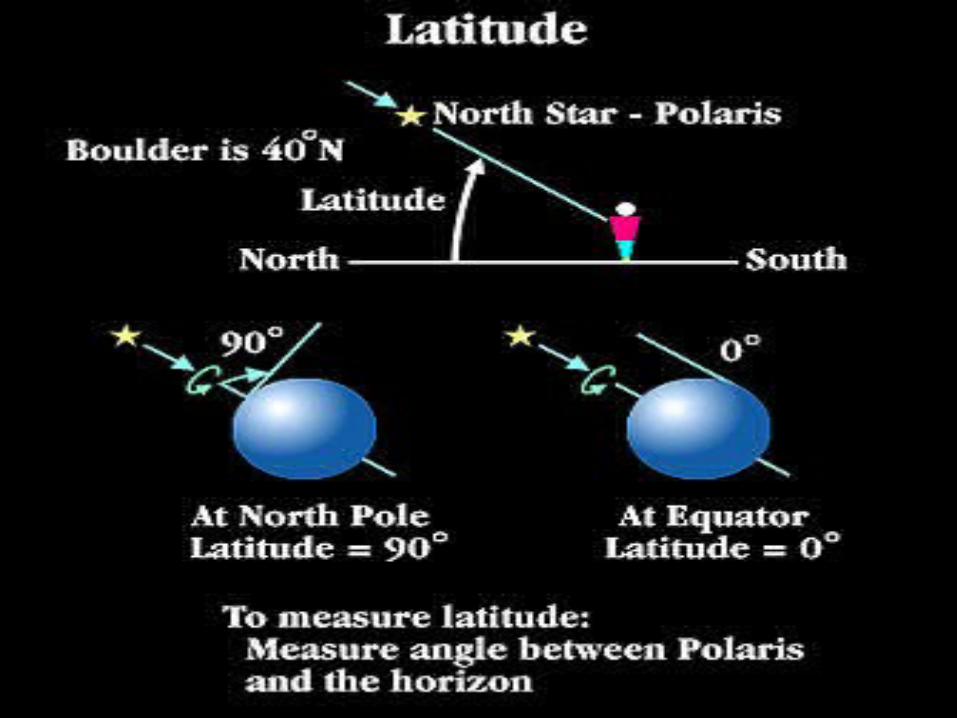
– Observer’s latitude in Northern Hemisphere is equal to altitude of Polaris (North Star).
Determining Positions on EarthDetermining Positions on Earth
• Measuring Latitude
Determining Positions on EarthDetermining Positions on Earth
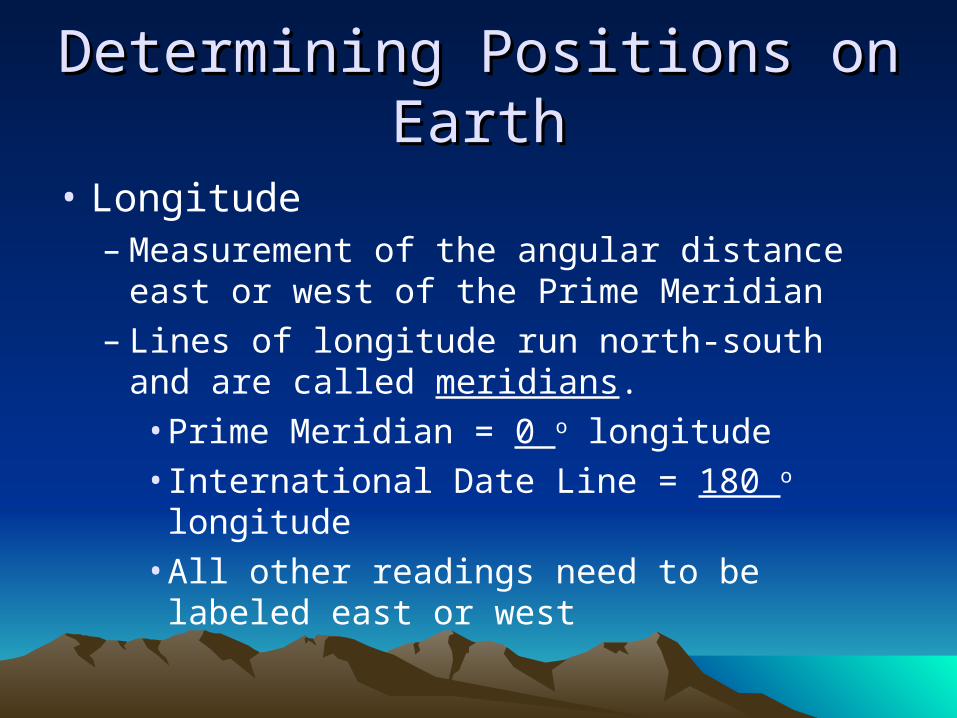
• Longitude– Measurement of the angular distance east or
west of the Prime Meridian– Lines of longitude run north-south and are
called meridians.• Prime Meridian = 0 o longitude• International Date Line = 180 o longitude• All other readings need to be labeled east
or west
Determining Positions on EarthDetermining Positions on Earth
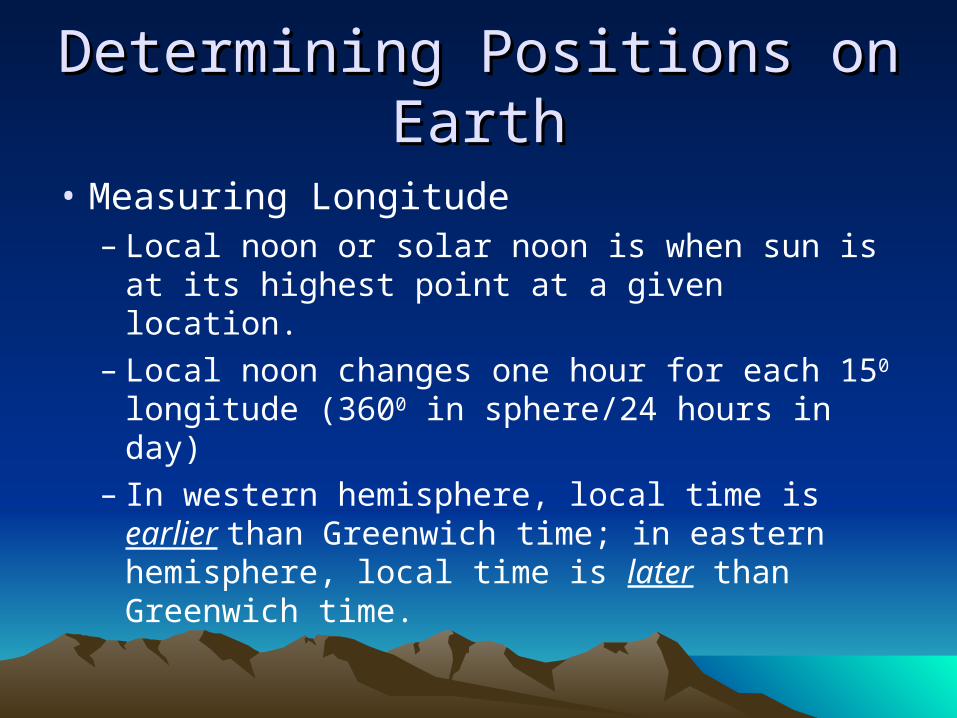
• Measuring Longitude– Local noon or solar noon is when sun is at its
highest point at a given location.– Local noon changes one hour for each 150
longitude (3600 in sphere/24 hours in day)– In western hemisphere, local time is earlier
than Greenwich time; in eastern hemisphere, local time is later than Greenwich time.
Determining Positions on EarthDetermining Positions on Earth
Mapping FieldsMapping Fields
• Isolines– Lines connecting points of equal values– Isolines connecting points of equal barometric
pressure are called isobars.– Isolines connecting points of equal
temperature are called isotherms.– On a topographic field (map), lines joining
points of equal elevation are called contour lines.
Mapping FieldsMapping Fields
• Gradient– The rate of change of a field quantity between
two places– Gradient = change in field value
distance– Example: If a map shows a stream drops
200m between two points 5km apart. What is the gradient?
• 40 m/km
Using Topographic MapsUsing Topographic Maps
• Contour Maps (topographic maps)– A two-dimensional model, which shows the
elevations of various points on the earth surface.
– Contour lines pass through points with equal elevations.
– The zero contour line is at sea level.– The difference between contour lines is the
contour interval.
Using Topographic MapsUsing Topographic Maps
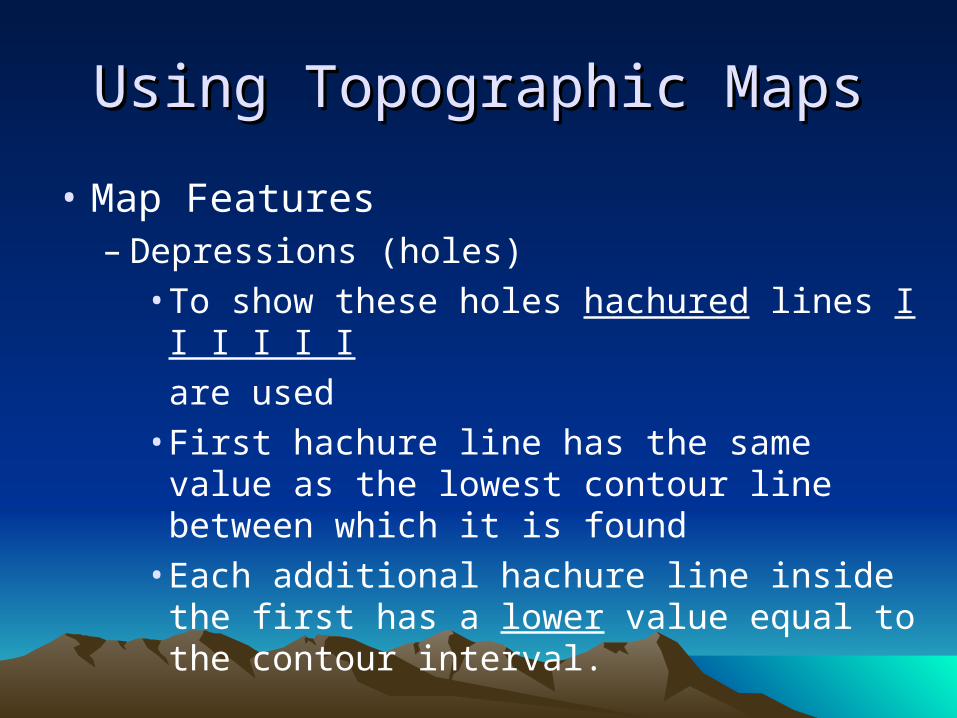
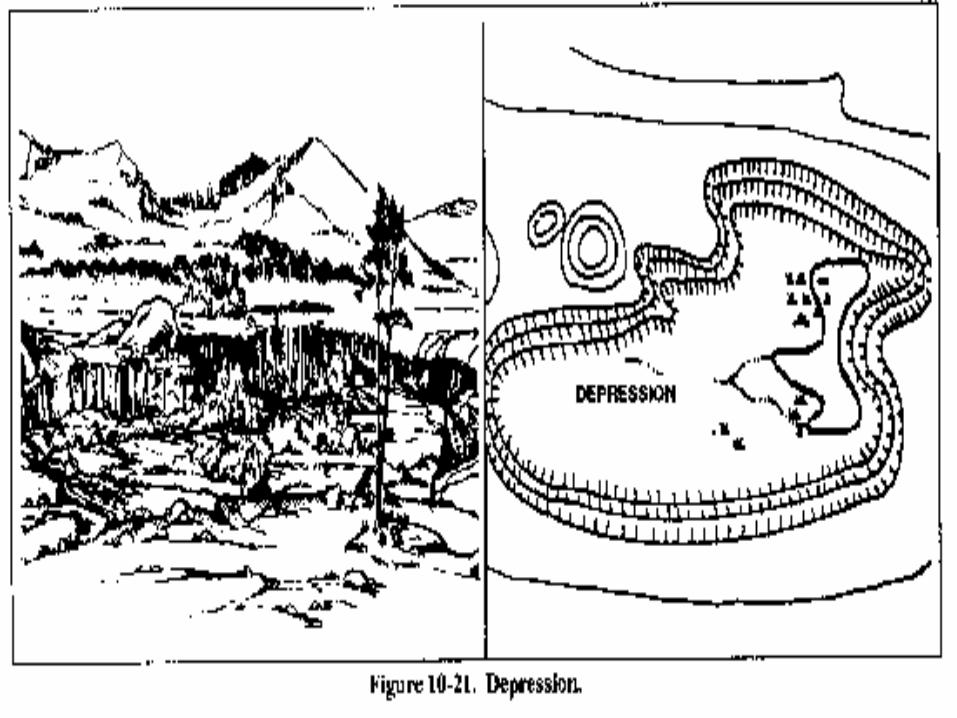
• Map Features– Depressions (holes)
• To show these holes hachured lines I I I I I I
are used• First hachure line has the same value as the
lowest contour line between which it is found• Each additional hachure line inside the first
has a lower value equal to the contour interval.
Using Topographic MapsUsing Topographic Maps
Using Topographic MapsUsing Topographic Maps
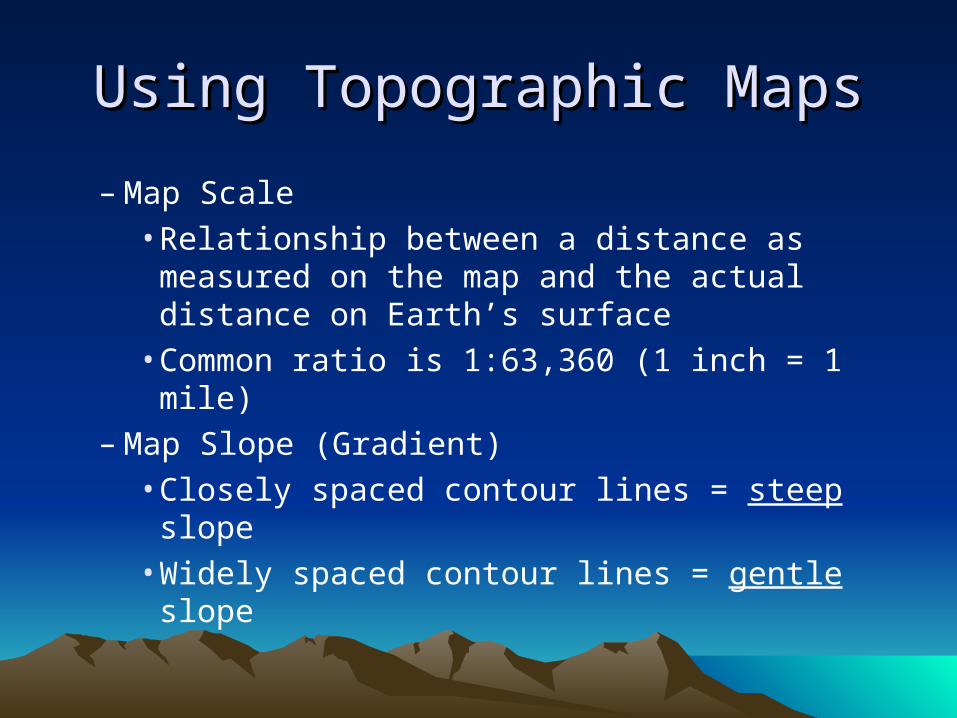
– Map Scale• Relationship between a distance as
measured on the map and the actual distance on Earth’s surface
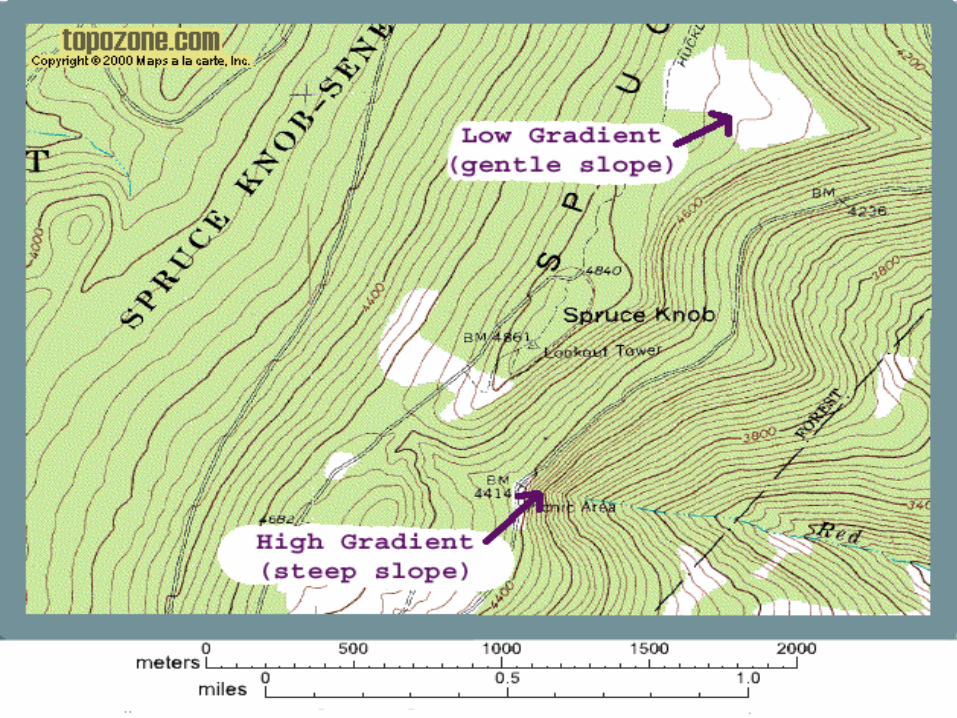
• Common ratio is 1:63,360 (1 inch = 1 mile)– Map Slope (Gradient)
• Closely spaced contour lines = steep slope• Widely spaced contour lines = gentle slope
Using Topographic MapsUsing Topographic Maps
Using Topographic MapsUsing Topographic Maps
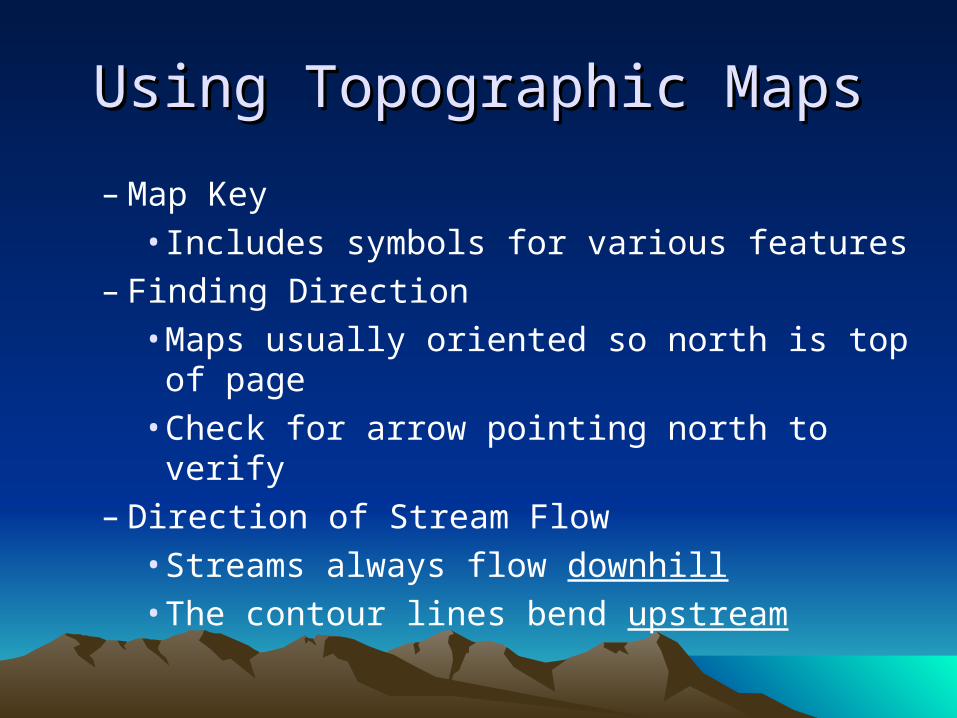
– Map Key• Includes symbols for various features
– Finding Direction• Maps usually oriented so north is top of page• Check for arrow pointing north to verify
– Direction of Stream Flow• Streams always flow downhill• The contour lines bend upstream
Using Topographic MapsUsing Topographic Maps
Using Topographic MapsUsing Topographic Maps
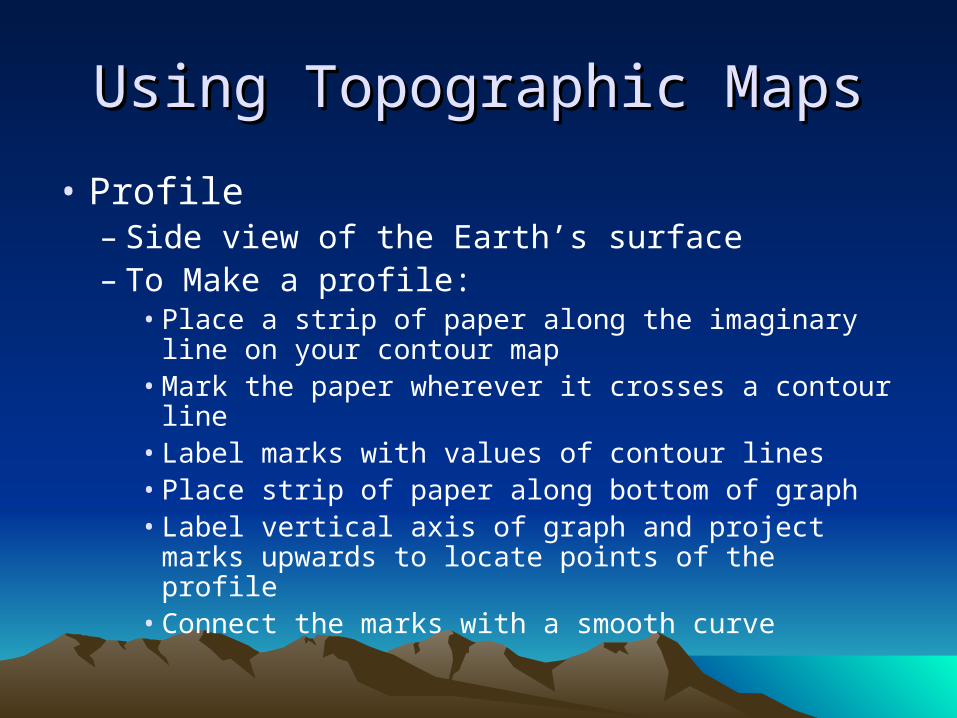
• Profile– Side view of the Earth’s surface – To Make a profile:
• Place a strip of paper along the imaginary line on your contour map
• Mark the paper wherever it crosses a contour line• Label marks with values of contour lines• Place strip of paper along bottom of graph• Label vertical axis of graph and project marks
upwards to locate points of the profile• Connect the marks with a smooth curve
Using Topographic MapsUsing Topographic Maps
• http://www.uwsp.edu/geo/faculty/ritter/geog101/textbook/how_to/topographic_profile.html