Embed Size (px)
Citation preview

Euroconsult proprietary13 May 2008 1
Earth ObservationRemote Sensing Trends
Adam Keith Senior Analyst
Euroconsult North America
Advisory Committee on Commercial Remote Sensing, Washington D.C., 7th October 2008
Euroconsult71-79 Bld. Richard Lenoir
Paris 75011France
Euroconsult North America485 Rue McGillMontreal H2Y 2H4Canada

Euroconsult proprietary 2
Key Themes:
-
Overview: Earth observation investment- EO program focus-
The commercial data market-
Challenges and conclusions

Euroconsult proprietary 3
Overview: EO Investment

Euroconsult proprietary 4
Government Space Program Investment … The Past…

Euroconsult proprietary 5
World Government Expenditures for Civil Space Programs in 2007 Total: US$ 29.42 billion
…and today
Budget Authority for the United States and Payment Appropriations for ESA; Non-government user contributions (CNES, JAXA) excluded; (1) Excludes funding from Third Parties; (e) estimate.
USA 17,297 USA 17,297
Others
650
NASA 16,263 (excluding
aeronautical
R&D)
NOAA
1,034
2006 figures for Austria, Belgium, Denmark, Finland,Netherlands, Norway, Sweden
JapanJapan
2,1262,126
Portugal 17Portugal 17(ESA (ESA onlyonly))
ESAESA
France 1,798France 1,798
ItalyItaly
969969
UKUK
438438Germany 1,017Germany 1,017
Ireland 16Ireland 16
BelgiumBelgium
213213
NetherlandsNetherlands126126
SpainSpain373373
3,9743,974(1)(1)
SwitzerlandSwitzerland
125125AustriaAustria
5555
DenmarkDenmark
3636
NorwayNorway
4848 SwedenSweden
106106
FinlandFinland
5757
EumetsatEumetsat
276276
EU 311EU 311
GreeceGreece
1515
Canada 338Canada 338(Incl. ESA 37)
Ukraine 63Ukraine 63
IndiaIndia
926926
RussiaRussia
1,2801,280
China 1,300 (e)China 1,300 (e)
BrazilBrazil
118118
Argentina 35 (e)Argentina 35 (e)((CONAECONAE))
Taiwan 45Taiwan 45
Malaysia Malaysia 25 (e)25 (e)
South South KoreaKorea317317
AustraliaAustralia
77
AlgeriaAlgeria EgyptEgypt
NigeriaNigeria
South South AfricaAfrica
TurkeyTurkey
IranIran
RomaniaRomania
UzbekistanUzbekistan
PakistanPakistan
ThailandThailand
SingaporeSingapore
IndonesiaIndonesia
VietnamVietnam
KazakhstanKazakhstanPolandPoland
HungaryHungary
CzechCzech
RepublicRepublic
ChileChileVenezuelaVenezuela
MexicoMexico
MoroccoMorocco
AngolaAngola
LybieLybie
IsraelIsrael
1 (e)1 (e)(ISA (ISA onlyonly))
UEAUEA
AzerbaijanAzerbaijan
Source: World Prospects for Government Space Markets, Euroconsult 2007

Euroconsult proprietary 6
Earth Observation is the largest satellite-based investment
Government EO Programs (1)
Government Investment in Space Activities: Breakdown by application 2006
Meteorology$ 1,701
Technology$ 367Navigation
$ 1,340Telecom$ 3,907
Earth Observation $ 4,635
Space Science $ 4,613
Human spaceflight$ 10,145
Microgravity$ 777
Launcher$ 1,754
Source: World Prospects for Government Space Markets, Euroconsult 2007
Human spaceflight is very specific to the US representing 90% of overall investment
EO is a primary area of investment for the majority of government space programs
In 2006 $6.3 billion was invested into EO and meteo programs reaching $7 billion in 2007
Representing 24% of all space sector investment (38% excl. human spaceflight)in 2007

Euroconsult proprietary 7
Civil Government Satellites to be launched 2007-2012Total: 237 satellites
Technology9%
Navigation 12%
Meteorology10% Telecommunicati
ons 5%
Earth Observation 32%
Space Science 32%
1st application for satellite to be launched over the next 5 years
Earth observation to remain a priority area
Over 2007-2012 42% of all civil-government satellites launched will be for Earth observation purposes
In terms of satellite capacity the key however will be emerging programs
Source: World Prospects for Government Space Markets, Euroconsult 2007
Government EO Programs (2)

Euroconsult proprietary 8
EO program focus

Euroconsult proprietary 9
Increasing number of satellites from emergent national programs, with countries looking for autonomous satellite capacity
By 2017 : About 29 national agencies to launch EO satellitesWill represent 1/3rd of EOsatellites worldwide
EO actors are diversifying
Source: “Satellite-Based Earth Observation, Market Prospects to 2017”, Euroconsult 2008
© 2008 Euroconsult
Established Government (53)
Emergent Government (52)
Commercial (29)
Dual Use (16)
Total Satellites: 69* Total Satellites: 151
Note: China institutional programs might include military missions
1997-2006 2007-2016
Total Earth Observation Satellites to be Launched by Operator Typology1997-2006, planned/forecast to 2016
Total Country/Agency Participation: 21 (17 as Operator)
Total Country/Agency Participation: 29
Established Government (54)
Emergent Government (10)
Dual Use (1)Commercial (5)
*6 launch failures in this period are not taken into account. Not including Meteorology specific satellites
Estimated 151 LEO EO satellites to be launched 2007-2016

Euroconsult proprietary 10
1A. Established government program
ISRO develop a series of thematic EO satellites; aimed at self-sustainability
KARI quickly building on early missions
Rapidly developing capacity for self-sufficiency and commercial gain(ISRO, KARI …)
1997 2010 20172000 2005
ISRO
OceanSat 1999
TES 2001
Resourcesat-1 2003
CartoSat-1 2005
Cartosat-2 2007
Risat 1 2008
Carto-2A 2008
Oceansat 2 2008
Resourcesat 2 2008
CartoSat 3 2012
Risat 2 2012
OceanSat 3 2013
Resourcesat 3 2013
KARI
KITSAT 1999 Kompsat-2 2006
Kompsat-5 2008
Kompsat-6 2010
Kompsat-7 2010
Kompsat-3 2013
Kompsat-9 (COMS)2014
Kompsat-10 (COMS)2015
Kompsat-8 2015
Source: World Prospects for Government Space Markets, Euroconsult 2007

Euroconsult proprietary 11
1B. Established government program
© 2008 Euroconsult
1997-2006 2007-2016
Satellites Launched
Manufacturing Market Value
$million
23 29
More expensive missions, satellites with multiple
sensors on-board
More missions with single instruments reducing costs
$5,171 $3,071
Satellites Launched
Environment Monitoring Satellites Launched v. Manufacturing Market Value
Manufacturing Market Value
$million
Established government programs have climate change at the top of the agenda, however programs prone to cuts
Science missions tend to be one-offs; need for greater continuity
Single-instrument specific missions are preferred over multi-instrument arrays.
Net result in the medium-term is a loss in instrumentation. Source: “Satellite-Based Earth Observation, Market Prospects to 2017”,
Euroconsult 2008
Preference towards smaller, lighter, faster missions for env. mon.(NASA, ESA, JAXA…)

Euroconsult proprietary 12
2. Emerging government program
Most emerging nations launch generic (medium resolution optical sensors) to meet local/regional requirement
Nations look to gain technology know-how and build on experiences: Algeria, Turkey, Thailand…
2nd Generation launched have been/will be more capable than the first: DMC, Alsat…
Programs will look to commercialize data – initially data low cost / free
© 2008 Euroconsult
Main Medium Resolution Satellites* Launched to 2007, Planned/Anticipated: 2007-2016
NASA
1997 2012 20172002 2007
Landsat 5 1984
ESA/CNES
ISRO
1999Landsat 7 LDCM
2016
1998SPOT 4 SPOT 5
Other
Brazil
ResourceSat-1
2002
LDCM 22011
2003
ResourceSat-2 2008
ResourceSat-3 2013
Under development or
launched
In planning / anticipated
Extension of life expectancy
*Excluding launch failures
5-50m ground resolution optical
Rapideye x 5 2008
Rapideye B x 52013
2012Sentinel-2 – ESA
FormoSat-2 (TWN) 2004
FormoSat-2b (TWN) 2010
CBERS-1 1999
ALSAT 1 (Algeria)
Bilsat 1 (Turkey)BNSCSat 1 (UK)
NigeriaSat 1
Beijing 1 (China)
2003
2003
2003
2002
CBERS-2A 2003
2005
Monitor E1 (Russia) 2005
ALOS – AVNIR-2 (JAXA)
THEOS 1 (Thailand)
CBERS-2B 2007
2007
ThaiPaht 2 (Thailand)UK-DMC2 (UK)
NigeriaSat 2
2008
2008
2008
ALSAT-2A (Algeria) 2009
VN-Sat 1 (Vietnam) 2008
Deimos (Spain) 2008
IRS-1D 1997
ARGO - Rapideye 6 (Taiwan) 2010
CBERS-3 2010
ALSAT-2A (Algeria) 2011
EnMAP (Germany) 2011
CBERS-4 2011
THEOS 2 (Thailand)
2016ALSAT-2B (Algeria)
3rd Generation DMC
Rasat (Turkey) 2009
2006
DMC and follow-ons (ALSAT-2)
Source: “Satellite-Based Earth Observation, Market Prospects to 2017”, Euroconsult 2008
Looking to develop satellite technology
Euroconsult proprietary 13
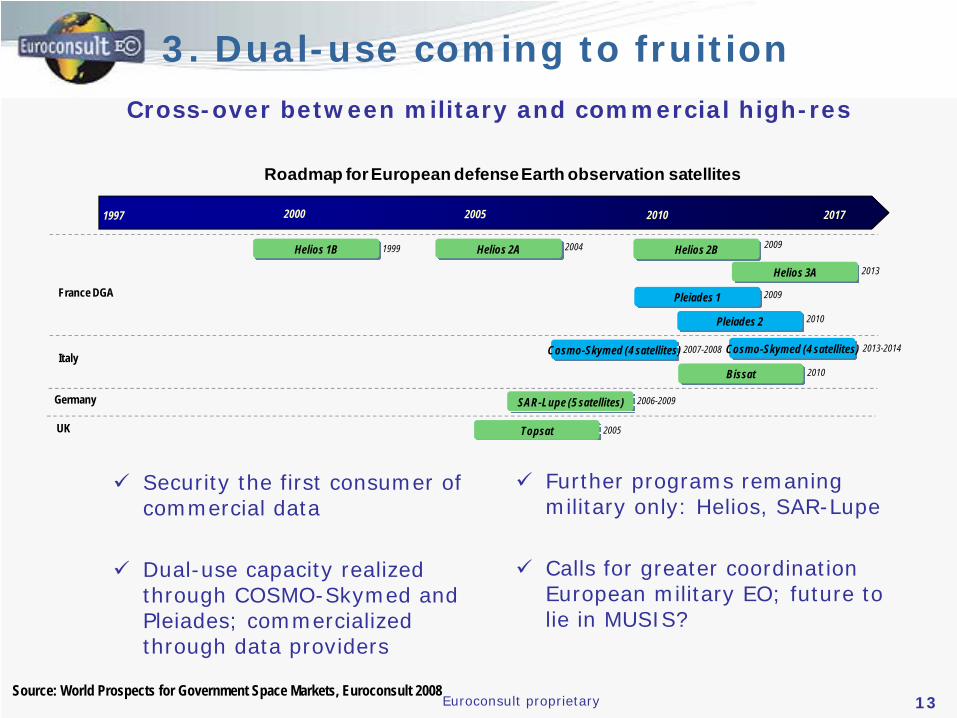
3. Dual-use coming to fruition
Security the first consumer of commercial data
Dual-use capacity realized through COSMO-Skymed and Pleiades; commercialized through data providers
Cross-over between military and commercial high-res
Roadmap for European defenseEarth observation satellites
1997 2010 20172000 2005
UK
Italy
France DGA
Helios 1B Helios 2A1999 2004 Helios 2B 2009
Pleiades 1 2009
Pleiades 2 2010
Helios 3A 2013
Cosmo-Skymed (4 satellites) 2007-2008
Bissat 2010
Cosmo-Skymed (4 satellites) 2013-2014
Germany SAR-Lupe (5 satellites) 2006-2009
Topsat 2005
Further programs remaningmilitary only: Helios, SAR-Lupe
Calls for greater coordination European military EO; future to lie in MUSIS?
Source: World Prospects for Government Space Markets, Euroconsult 2008

Euroconsult proprietary 14
The commercialdata market

Euroconsult proprietary 15
4. The commercial actor
Source: “Satellite-Based Earth Observation, Market Prospects to 2017”, Euroconsult 2008
© 2008 Euroconsult
Commercially Operated Satellites Launched to 2007, Planned/Anticipated: 2007-2016
GeoEye
1997 2012 2017
Under development or
launched In planning / anticipated Excluding launch failures
2002 2007
IKONOS 1999 GeoEye-2
DigitalGlobe
ImageSat
MDA
Infoterra
2003Orbview-3GeoEye-1 2008
2012
GeoEye-3 2013
2001QuickBird
WorldView-I
WorldView-II 2008
2007
2014
WorldView-III 2013
WorldView-IV
2000EROS AEROS B 2006
EROS C 2009
EROS D 2012
Deimos 2008Deimos
RapidEye AG
Rapideye x 5 2008
ARGO (Rapideye 6) 2009
Rapideye B x 5 2013
Radarsat 2 2008
TerraSAR-X 2007
TerraDEM-X 2008
TerraSAR-X 2 2012
TerraDEM-X 2 2013
Optic
alRa
dar
Extension of life expectancy
Commercial data focuses on optical high-res. timely data delivery and high geometric accuracy
Increasing commercial radar
8 commercially operated satellites + 1 constellation in operation
In 2007 Public-Private-Partnerships realized with the launch of TerraSAR-X, Radarsat-2 and RapidEye in 2008
Targets geometric accuracy, high-res. and data delivery

Euroconsult proprietary 16
07’ commercial data market $735M; to reach $2.5 - $3.4 billion in 2017
Strong growth in the commercial data market
© 2008 Euroconsult
Earth Observation Commercial Data Sales 2000-2007 v. Number of Operational Commercial High Resolution Satellites
Rev
enue
($m
illio
n)
Satellies
0
100
200
300
400
500
600
700
800
2000 2001 2002 2003 2004 2005 2006 2007
0
2
4
6
8
10
12
14
More capable systems have boosted the commercial data market: +15% CAGR (02-07)
Government the primary user for commercial data: over 80%, security first application
Increasing data supply: commercial actor + dual-use + government…
More commercial data to come through government-sponsored programs: India, Korea, Taiwan
Source: “Satellite-Based Earth Observation, Market Prospects to 2017”, Euroconsult 2008

Euroconsult proprietary 17
EO commercial sector diversifying (1)
29+ commercially operated satellites will be launched 2007-2016
Commercial operators will look to develop constellations
Emergence of new entrantsGazprom - 4 satellite constellation Iridium NEXT - 66 satellites for environment monitoring4C Control - 2 high-res SAR satellitesE-Corce - high-res optical 13 satellite constellation…
Increasing number of government satellites to look towards commercialization
maximize return on investment
Develop downstream services through free dataLandsatCBERS

Euroconsult proprietary
EO commercial sector diversifying (2)
Increase in operational radar capacity;
1997 2012 20172002 2007
L-Band
X-Band
C-Band
COSMO-Skymed 2 - ASI 2007
COSMO-Skymed 4 - ASI 2008
COSMO-Skymed 3 - ASI 2008
COSMO-Skymed 1 - ASI 2007
COSMO-Skymed 2b - ASI 2013
COSMO-Skymed 4b 2014
COSMO-Skymed 3b 2014
COSMO-Skymed 1b - ASI 2013
1995Radarsat - CSA
Radarsat 2 - MDA 2008
Radarsat 3 x 3 - MDA 2011
TerraSAR-X - Infoterra 2007
TerraDEM-X - Infoterra 2008
TerraSAR-X 2 - Infoterra 2012
TerraDEM-X 2 - Infoterra 2013
2011Sentinel-1 - ESARISAT - ISRO 2008
Kompsat 5 - KARI 2008
SAOCOM-1A CONAESAOCOM-1B - CONAE
2010
2011
SMOS - ESA 2008
SSR-2 - INPE 2011
MAPSAR – DLR 2011
PALSAR- JAXA (ALOS) 2006
ASAR – ESA (Envisat) 2002
ERS-2 - ESA 1995
Source: “Satellite-Based Earth Observation, Market Prospects to 2017”, Euroconsult 2008

Euroconsult proprietary 19
Challenges and Conclusions

Euroconsult proprietary
© 2008 Euroconsult
Mar
ket S
ize
Price: Data + Value-Adding
2 Concepts for Earth Observation Commercial Value-Adding
The traditional EO value-adding market high costs and low take-up of services
New
EO
Mas
s-M
arke
t with
lo
wer
ass
ocia
ted
cost
s
Industry consolidation and standardisation will see real services develop with increasing consumer
Spin-off services following take up of “Pro” business software from virtual globes will see increasing revenue
20
The same growth witnessed in the data market is not experienced in EO services
Value-added services valued at $1.5 billion in 2007; 5% CAGR
Services will be aided by more dedicated systems and timely delivery of data
Service industry given a boost with the advent of web-based virtual-globes
Low-cost data reduces barriers of entry increases usage
Services showing slower uptake
Real take-up of commercial data relies on services

Euroconsult proprietary 21
Services showing slower uptake (2)Low-cost data increases user uptake of services
22%
20%
9%8%
5%2%1%
33%
Cart. / Land use
Environment
Energy
Agriculture
Forestry
Disaster Monitoring
Oceanography
Other
51%
26%
23%
Industry
Government
EducationCBERS data usage by
end-user, 2007
CBERS data usage by application, 2007

Euroconsult proprietary 22
Global environment issues require constant supply of geo-information
CEOS calls for a coordinated response to global collection of geo-informationEmerging space nations first look to regional needs rather than global concernsIncreased cost and access to 3rd party data remains an issue
Increasing high-resolution systems from numerous sources make tools for data restriction unworkable
Buy-to-Deny and Shutter control difficult to implement with multitude of satellitesTo be addressed to counter friction in the market place and allay national security concerns
Emerging programs require greater coordination
Benefits for Environment and Security call for greater cooperation

Euroconsult proprietary 23
Commercial operators look to diversify data usage away from security
Commercial data competition will increase but will help develop downstream services: success of various methods of commercialization will encourage further systems
Which method of commercialization will be preferred?
Commercialization creates vertically integrated actorsThales / TelespazioEADS Astrium / InfoterraMDA / MDA Geospatial
Further consolidation and integration within the value-chain as companies look to tap into the large but fragmented service sector
MDA Geospatial acquire Vexcel CanadaEADS Astrium Services acquires SPOT ImageFugro GEOS acquire NPA Group
The EO industry takes shape

Euroconsult proprietary 25
About EuroconsultEstablished in 1983, Euroconsult has become a world reference for analysis and consulting in high-technology industries with a core expertise in satellite-related applications, ranging from technical supply to final services. Focused on supporting strategic decision making, the company is independent owned and operated.
Euroconsult records 500 customers in 40 countries, of which 300 active each year
2 offices worldwide: in Paris, France and Montreal, Canada
Three main lines of services:
Research reports: A permanent team of experts continuously analyse key trends for both satellite applications and the satellite industry, notably through the publication of recurring Research reportsConsulting: Euroconsult has conducted over 450 consulting missions in the satellite sector over the last 20 years for clients located in more than 40 countries. Missions include independent assessment & due diligence for public & private sector projects; Assist private and public organizations in their decision-making process; Market analysis for satellite products and services World Summits & customized training: the World Satellite Business Week has become the annual meeting place for senior executives from the international satellite industry and financial community to benchmark, do business and network with their partners, existing and prospective clients. The event gathers each year in Paris 450 senior executives from over 175 companies Over 70% CEOs, CFOs, GMs, SVPs, VPs…