Embed Size (px)
Citation preview
Earth Observation for Disaster Management International trends & developments
Earth observation applications
Business development
Capacity building
Mark Noort, consultant, project manager HCP international: consulting, marketing of earth observation Project director EOPOWER: project for promotion & capacity building of earth observation applications
2
0. Introduction
3
Sequence:
• General assessment of the state-of-the-art of earth observation
• Major trends and developments in the application field
• Description of earth observation solutions
• Assessment of market potential for earth observation solutions and marketing instruments
• Capacity building for successful application of earth observation solutions
Earth Observation helps you: save money save lives save the environment
4
5
Earth observation applications
• On the verge of reaching new user communities
• These new user communities need to be involved
• Weakest link / last mile aspects are important
• Marketing needed: promotion & capacity building
Life cycle of products & services
Initialization
System analysis & design
Rapid prototyping
System development
Implementation
Post-implementation
6
A disaster can be described as: a serious disruption of the functioning of a community or a society involving widespread human, material, economic or environmental losses and impacts, which exceeds the ability of the affected community or society to cope using its own resources
Disaster management is: the organization and management of resources and responsibilities for dealing with all humanitarian aspects of emergencies, in particular preparedness, response and recovery in order to lessen the impact of disasters
For harmful algal blooms and oil spills-> see marine environment and resources toolkit For drought -> see water management toolkit
7
Scope
Disaster types
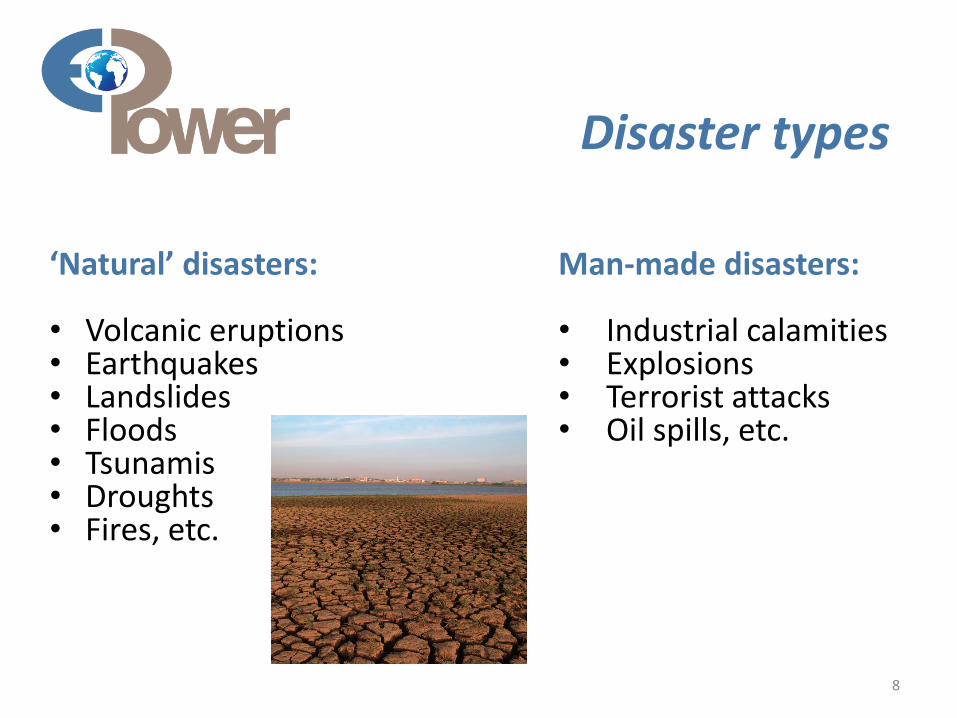
‘Natural’ disasters: • Volcanic eruptions • Earthquakes • Landslides • Floods • Tsunamis • Droughts • Fires, etc.
8
Man-made disasters: • Industrial calamities • Explosions • Terrorist attacks • Oil spills, etc.
Assessment of business & funding opportunities
• Categories of disaster management products & services
• Life cycle phase of product or service
• Regional context, level of technological & economic development
• Optimum marketing mix
9
1. International trends & developments in disaster management
10
11
Issues & trends in disaster management
• Increased (natural) disaster risk is one of the main anticipated consequences of climate change
• Attention is shifting from post-disaster intervention to prevention
• Emphasis on empowerment of local communities
• Increased interest in application of new technologies and open data and software
12
Drivers
• Climate change can lead to an increase in extreme events, such as storms, floods and droughts
• Population growth, increase in economic wealth and investment in infrastructure leads to a greater disaster risk (for people and economic assets)
• Increasing urbanization, in particular in coastal areas, leads to vulnerability to disasters
• Increased pressure on available land and investment in agriculture result in greater disaster risk
• Security threats by extremist groups
13
Climate change
• A small change in mean temperature can lead to a considerable increase of extreme events (heavy precipitation, more intense droughts, more fluvial floods, increase in extreme coastal high-water levels, increase in landslides);
• Integration of disaster risk management and climate change adaptation is needed to obtain maximum benefit;
• Disaster risk management should focus on high-impact, low regret measures, such as early warning systems, risk communication between decision-makers and local citizens, sustainable land management, ecosystem management;
• An integrated, multi-hazard risk management approach works best.
14
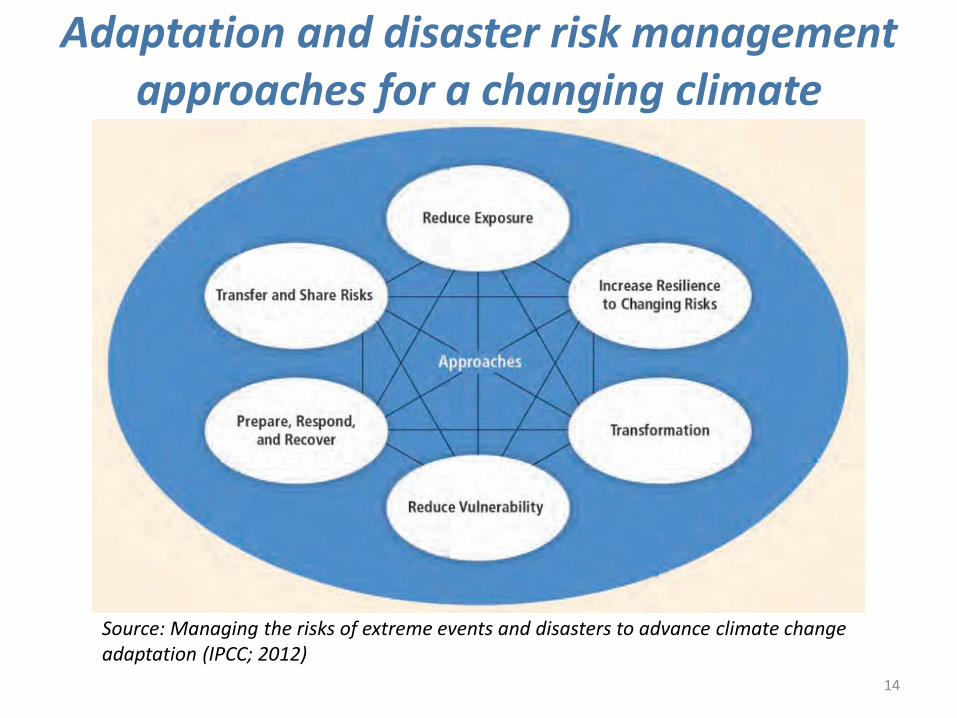
Adaptation and disaster risk management approaches for a changing climate
Source: Managing the risks of extreme events and disasters to advance climate change adaptation (IPCC; 2012)

Managing the risks of extreme events and disasters to advance climate change adaptation (IPCC; 2012) extensive description of possible effects of climate change and possible adaptation measures + summary for policy makers
Global risks 2014 – Insight report (WEC; 2014) analysis of high-impact, high likelihood economic, environmental, geopolitical, societal and technologic risks + management strategies
Natural hazards and climate change in European Regions – territorial dynamics in Europe (ESPON; 2013) study analysing vulnerability to different hazards + adaptive and response capacity
15
More information:
16
From post-disaster intervention to prevention
• Investing in disaster prevention saves lives and avoids losses;
• Economic return on investment is higher for prevention than for an approach based exclusively on response;
• Shift from sector and specialist approach (military, civil defence) to a more integrated approach (general policy and planning, coordination of preparedness and interventions);
• Looking at the whole disaster risk portfolio instead of focusing on a single hazard;
• The temporal and spatial dynamics of hazard, vulnerability and risk are particularly important for disaster management.
Natural hazards, UnNatural disasters: The economics of effective prevention (World Bank, UN; 2010) rationale and plea for increased focus on disaster prevention
Tools for mainstreaming disaster risk reduction - guidance notes for development organizations (Provention; 2007) series of 14 guidance notes describing ways to integrate disaster risk reduction in general policy and all stages of the development project cycle
Natural catastrophes and reinsurance (Swiss Re; 2010) analysis of potential losses caused by natural hazards and how to minimise risk from a (re)insurer’s point of view
17
More information:
Early warning systems - A state of the art analysis and future directions (UNEP; 2012) overview of the state of the art of early warning systems, including the use of earth observation
18
More information (2):
19
Empowerment of local communities
• Community-driven development is crucial for (local) disaster risk management;
• Community-driven programmes directed at poverty reduction are particularly important to build the capacity and experience to deal with disaster risk management;
• External information flows (scientific, engineering) on disaster risk management should be combined with local knowledge;
• High impact, low-regret interventions serve as entry points.
From social vulnerability to resilience: measuring progress toward disaster risk reduction (UNU-EHS; 2013) study into and recommendations on community resilience with respect to disasters
Climate and disaster resilience – The role for community-driven development (World Bank; 2014) rationale for integration of community-driven development into climate and disaster resilience activities and overview of successful practice
20
More information:
21
New technologies and open data and software
• New technologies and open data and software are becoming increasingly available and often easy to apply;
• A collective effort is needed to make optimum use of existing and new data resources for disaster risk management (e.g. Group on Earth Observations);
• Open data means legally open (no intellectual property restrictions) and technically open (any software can be used);
• The data must be accessible, interoperable and reusable;
• New (communication) technologies open up new possibilities for interaction with and involvement of communities.
Open-source software
Look for: GEO, GEOSS, OGC, Terralook, Google Earth, etc. at • www.earthobservations.org (GEO website) • http://geonode.org
An open readiness data toolkit is available at: • http://data.worldbank.org/about/open-government-
data-toolkit/readiness-assessment-tool
Open data for resilience website: • http://gfdrr.org/opendri
22
Open data for resilience initiative - field guide (World Bank; 2014) description of open data methods and applications + how they fit in integrated disaster risk management
World disasters report – focus on technology and the future of human interaction (IFRC; 2013) description of new technologies for disaster risk management with a focus on communication for people –centred humanitarian action
Automated integration of geosensors with the sensor web to facilitate flood management (52o North; 2012) success story on the use of a sensor web to reduce flood risk in Germany
23
More information:
2. Earth observation applications
24
25
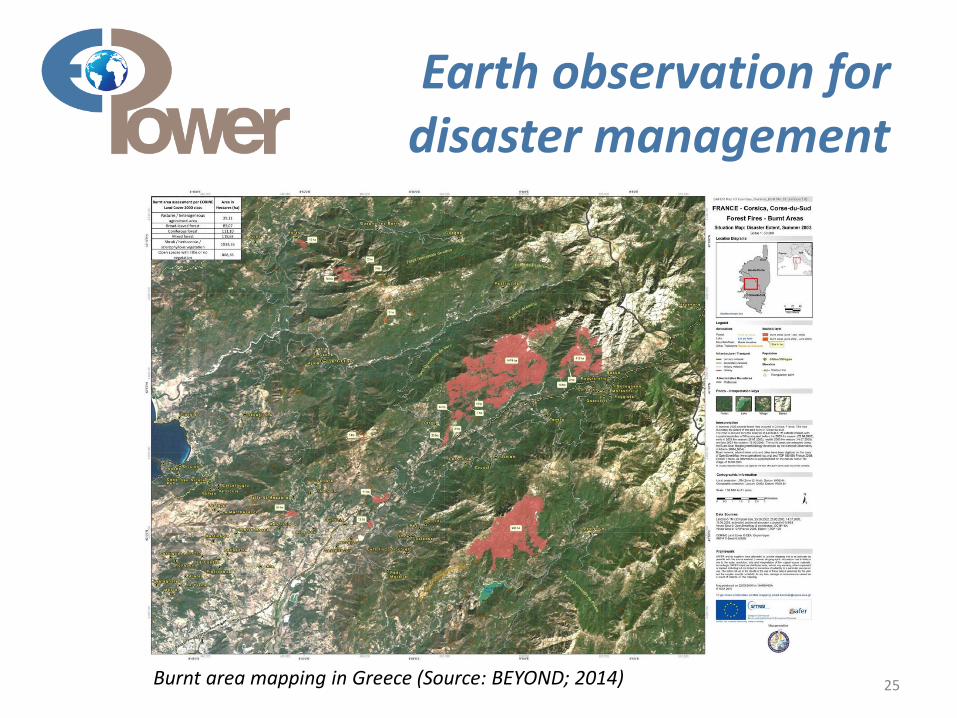
Earth observation for disaster management
Burnt area mapping in Greece (Source: BEYOND; 2014)
26
Earth observation contribution
• Risk assessment / simulation models
• Forecasting / early warning
• Monitoring and damage assessment
• Prevention / planning
• General
27
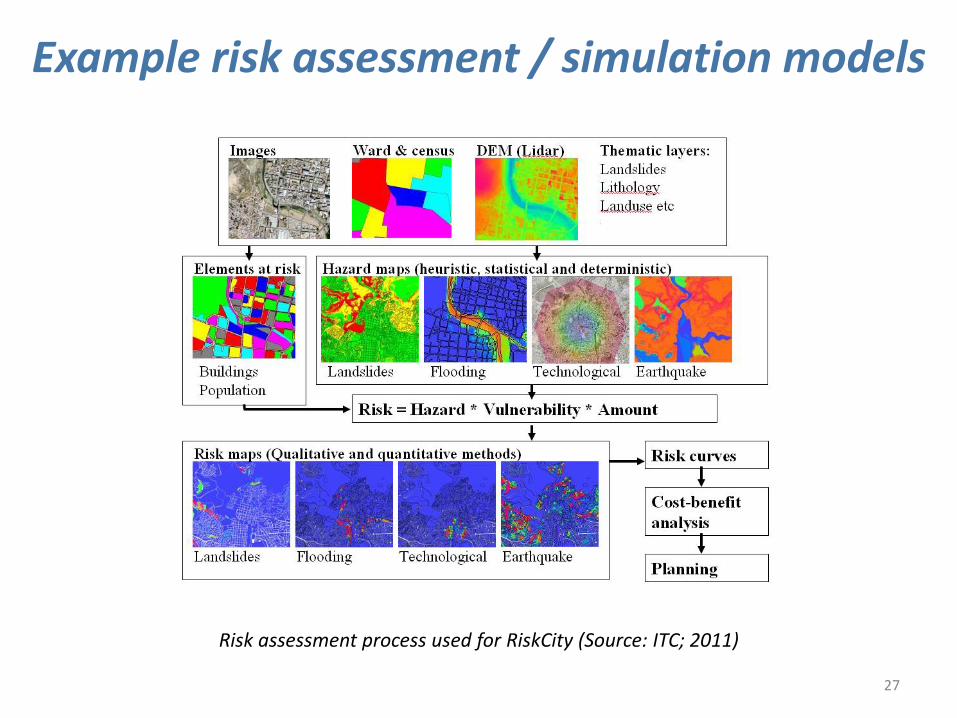
Example risk assessment / simulation models
Risk assessment process used for RiskCity (Source: ITC; 2011)
28
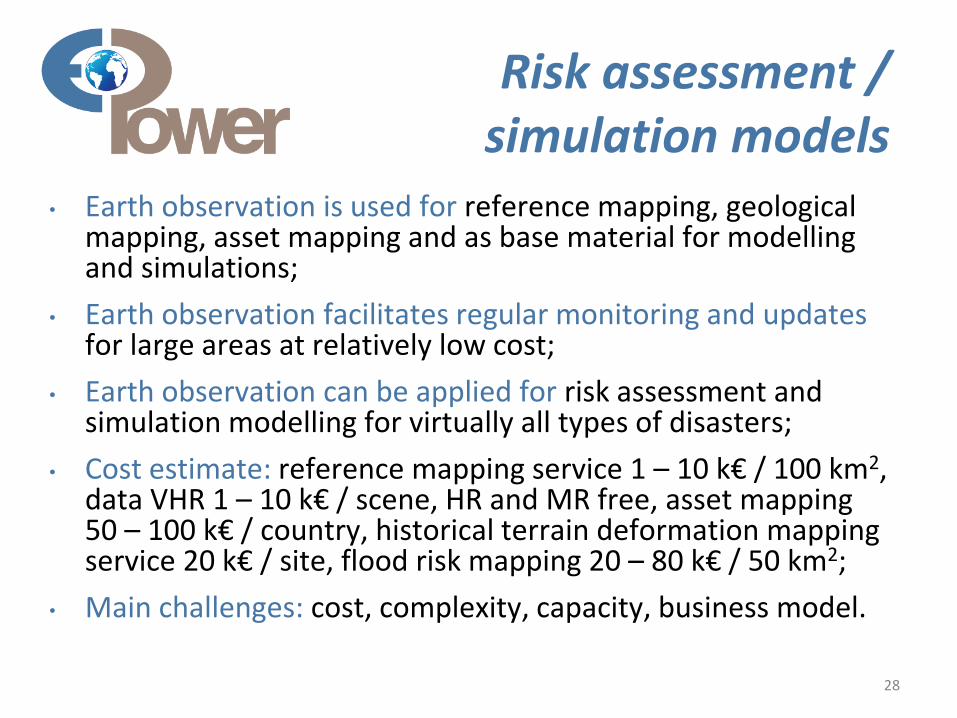
Risk assessment / simulation models
• Earth observation is used for reference mapping, geological mapping, asset mapping and as base material for modelling and simulations;
• Earth observation facilitates regular monitoring and updates for large areas at relatively low cost;
• Earth observation can be applied for risk assessment and simulation modelling for virtually all types of disasters;
• Cost estimate: reference mapping service 1 – 10 k€ / 100 km2, data VHR 1 – 10 k€ / scene, HR and MR free, asset mapping 50 – 100 k€ / country, historical terrain deformation mapping service 20 k€ / site, flood risk mapping 20 – 80 k€ / 50 km2;
• Main challenges: cost, complexity, capacity, business model.
North African coastal cities address natural disasters and climate change (World Bank, ESA; 2011) studies on adaptation to climate change with respect to natural disasters for Alexandria, Tunis, Casablanca and the Bouregreg area
Participatory approach for integrated basin planning with focus on disaster risk reduction: the case of the Limpopo river (UN-HABITAT, ITC; 2011) article on living with floods in Africa, shows community approach, includes a to-do list for participatory GIS (PGIS)
Coping strategies and risk manageability: using participatory geographical information systems to represent local knowledge (ITC; 2010) article on the use of geographical information, including earth observation, to empower communities in the Philippines in coping with floods
29
Examples:
SERVIR (USAID): www.servir.net (Central America) www.servirglobal.net (global)
UN-SPIDER: www.un-spider.org disaster reduction resources and strategies, including earth observation
CAPRA (World Bank, IDB): probabilistic risk assessment in Latin America & the Caribbean www.ecapra.org
DEWETRA: operational risk management methods and resources for many types of disasters, prediction models, weather observations, risk assessment and emergency management, describing the integrated approach of the Italian civil protection department http://dewetra.cimafoundation.org
30
More examples:
The value of geo-information for disaster risk reduction – benefit analysis and stakeholder assessment (ICSU, JB-GIS, UNOOSA; 2013) assessment of benefits for floods, earthquakes, droughts, fires and landslides, based on questionnaires from stakeholders and expert opinions, covering all stages of disaster management
Atlas of natural hazards and risks in Georgia (CENN; 2012) atlas integrating risk, vulnerability and hazard information on earthquakes, landslides, mudflows, rockfalls, floods, snow avalanches, wild fires, drought and hail storms
31
Even more examples:
32
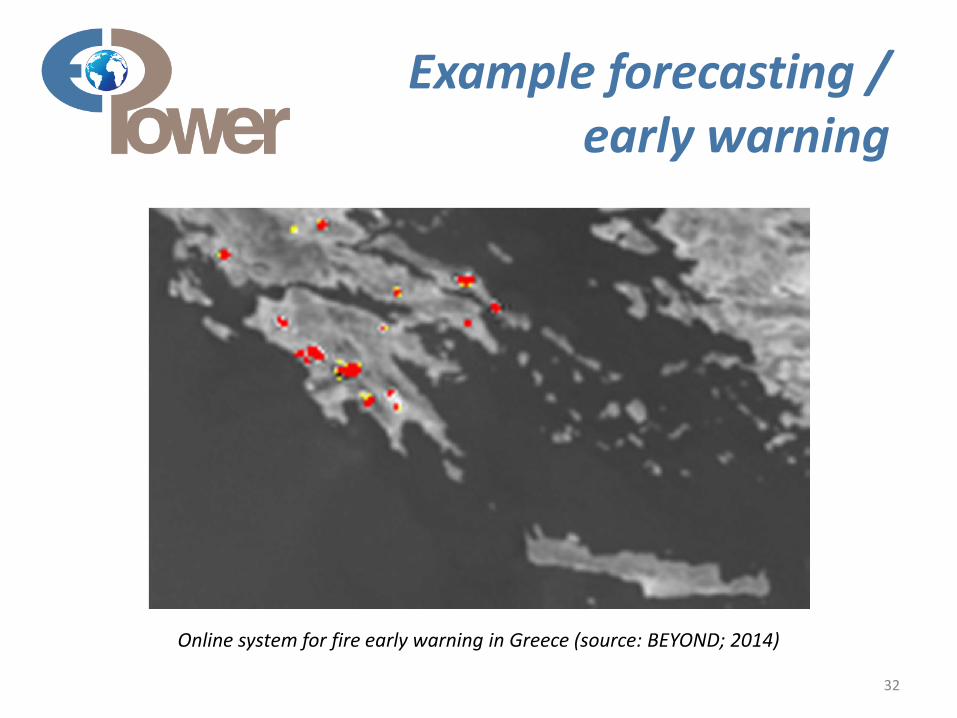
Example forecasting / early warning
Online system for fire early warning in Greece (source: BEYOND; 2014)
33
Forecasting / early warning
• Earth observation supports forecasting and early warning for many types of disasters: flooding (hydrological modelling, upstream monitoring), earthquakes (surface deformation), landslides (terrain deformation, early detection), volcanic eruptions (atmospheric composition, terrain deformation), tsunamis (wave height), wild fires (moisture conditions, early detection), desert locusts (breeding conditions, early detection), desertification (monitoring of sand encroachment), dust storms (early detection, monitoring), hurricanes (early detection, monitoring);
• Cost estimate: on case-by-case basis;
• Main challenges: cost, complexity, capacity, business model.
Local flood early warning based on low-tech geoinformatics approaches and community involvement - a solution for rural areas in The Philippines (GIZ; 2010) article on cooperation with local communities on early warning for floods in the Philippines
Nice ‹‹smart city›› serving resilience (Kandel; 2013) presentation on risk management, forecasting and early warning strategy of Nice
Alert and warning frameworks in the context of early warning systems – a comparative review (UNU-EHS; 2013) description of stages and systems of early warning for hydro-meteorological, geological and biological hazards, comparing between different countries
34
Examples:
Monitoring restless super-volcanoes (Copernicus; 2015) brochure on earth observation for deformation mapping, detection of thermal anomalies and volcanic gas and ash detection to predict and monitor volcanic eruptions
Landslide warnings from satellites save lives (Copernicus; 2013) brochure on earth observation for forecasting and early warning of landslides (interferometry and geological information)
Flood-PROOFS (DEWETRA) flood probabilistic forecasting system for small and medium catchments
RISICO (DEWETRA) a comprehensive system for nationwide and local wildfire risk assessment, forecasting, early warning and response
35
More examples:
36
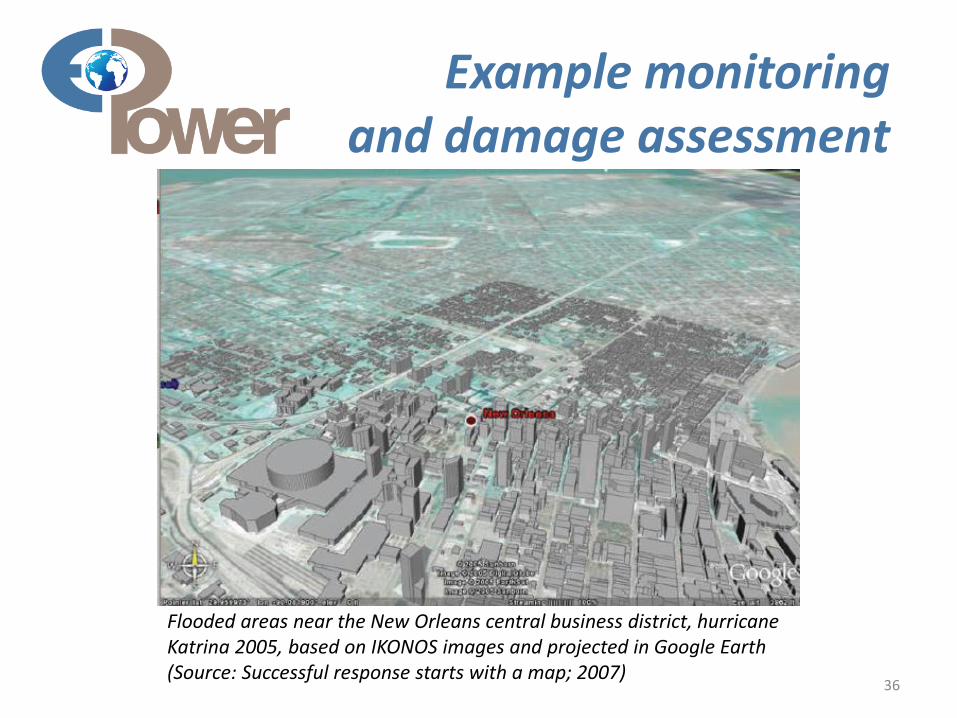
Example monitoring and damage assessment
Flooded areas near the New Orleans central business district, hurricane Katrina 2005, based on IKONOS images and projected in Google Earth (Source: Successful response starts with a map; 2007)
37
Monitoring and damage assessment
• Earth observation provides the background information and synoptic overview for monitoring in general;
• Earth observation is used to map and monitor flood extent, mudflows, landslides, effects of volcanic eruptions, damaged assets, burned area, refugee movements, etc.;
• Earth observation supports (planning and decision-making for) rescue, recovery, rehabilitation and reconstruction operations;
• Cost estimate: on case-by-case basis;
• Main challenges: cost, capacity.
International charter ‘Space and major disasters’ consortium of space agencies and satellite data providers aiming at providing a unified system of rapid space data acquisition and delivery in case of natural or man-made disasters
Geoinformation for disaster and risk management – examples and best practices (UNOOSA; 2010) examples of the use of earth observation for monitoring and damage assessment related to different types of disasters (also covers risk assessment, forecasting and early warning)
Successful response starts with a map: Improving geospatial support for disaster management (National Research Council; 2007) analysis of the use of geo-information, including earth observation, for disaster response in the US with case studies on hurricanes, earthquakes and terrorist attacks 38
Examples:
Reacting to disasters with space data (Copernicus; 2013) brochure on earth observation for damage assessment (RapidEye & Sentinels)
How satellites can help manage humanitarian crises (Copernicus; 2013) brochure on earth observation for improving the understanding of a situation and supporting logistical response (Pleiades & Sentinels)
Tracking a burning issue from space (Copernicus; 2013) brochure on earth observation for responding to wildfires and in the recovery period following an event (DMC & Sentinels)
Tracking flood waters from space (Copernicus; 2013) brochure on earth observation for flood extent and damage assessment (SPOT-5 & Sentinels)
Fires – A hot topic in the Mediterranean region (Copernicus; 2015) brochure on earth observation for fire danger mapping and monitoring of fire extent and activity
39
More examples:

How satellites can measure terrain displacements after earthquakes (Copernicus; 2013) brochure on earth observation for mapping of deformation and rapid reference maps
Remote sensing in support of oil spill response – Planning guidance (API; 2013) guide on how to use remote sensing for oil spill detection and response
40
More examples (2):
41
Growth potential for earth observation
• Risk assessment / simulation models: integrated in disaster management chain. Main clients: all levels of government, insurance companies.
• Forecasting / early warning: for all types of disasters, using near real-time, high resolution imagery. Main clients: all levels of government.
• Monitoring / damage assessment: for all types of disasters, using near real-time, high resolution imagery and integrated in disaster response workflow. Main clients: all levels of government, insurance companies.
3. Business development
42
43
Why is marketing / promotion of earth observation needed? • Public sector information (PSI)
• Externalities (environmental accounting & payment for ecosystem services)
• Global datasets, open access, data sharing, compatibility (GEO)
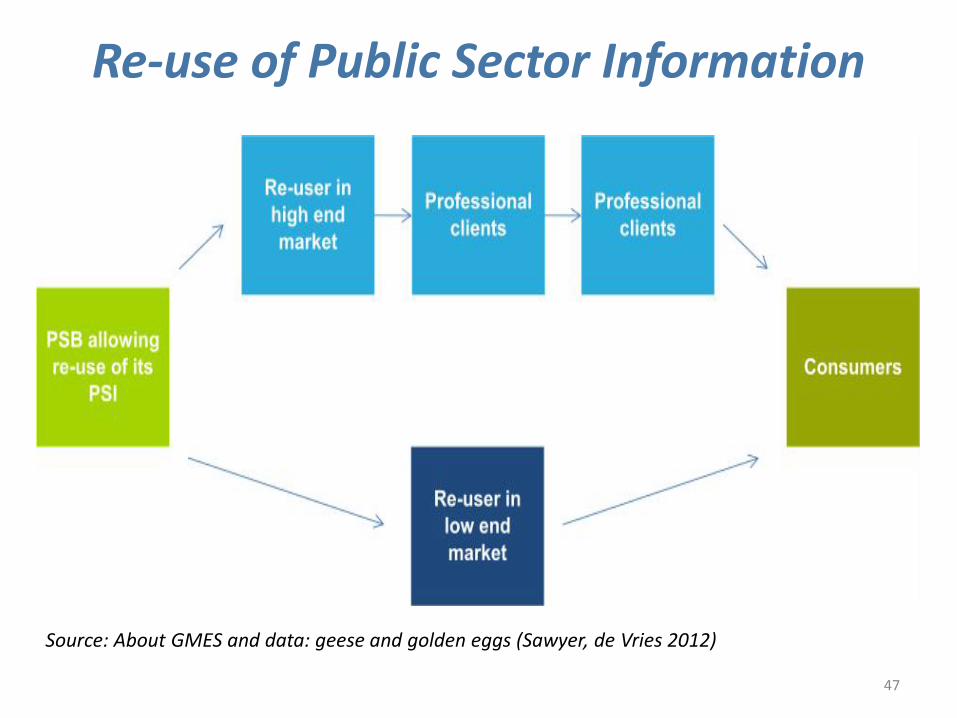
If public sector information is made available free-of-charge, demand will increase and, in the end, government revenue also, as companies will derive income from value-added products and services, and consequently pay more taxes (see figures in following slides).
44
45
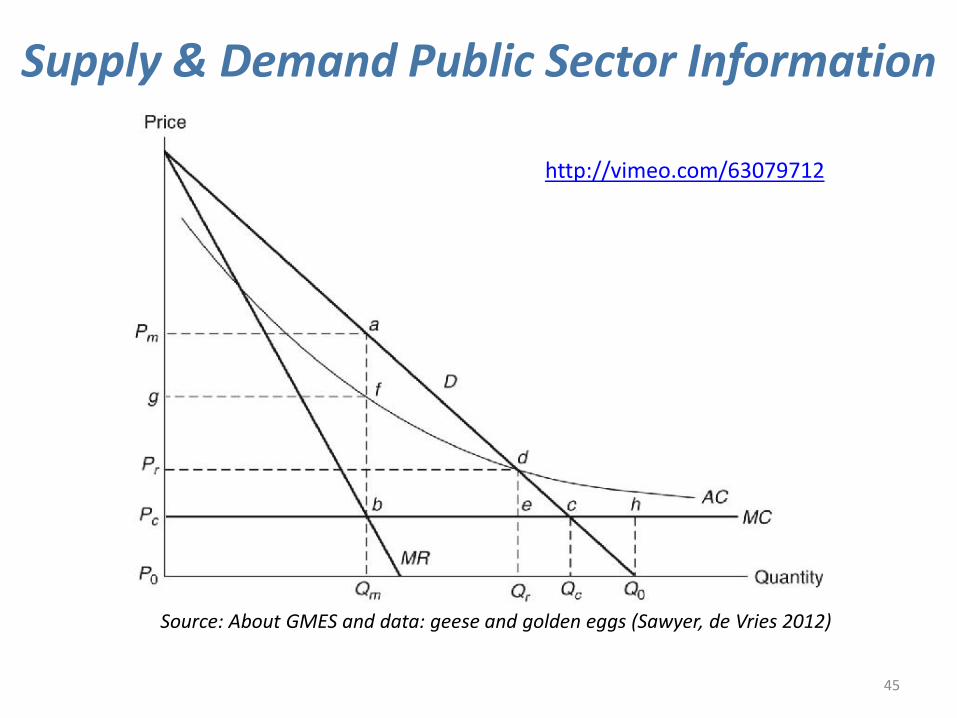
Supply & Demand Public Sector Information
Source: About GMES and data: geese and golden eggs (Sawyer, de Vries 2012)
http://vimeo.com/63079712
46
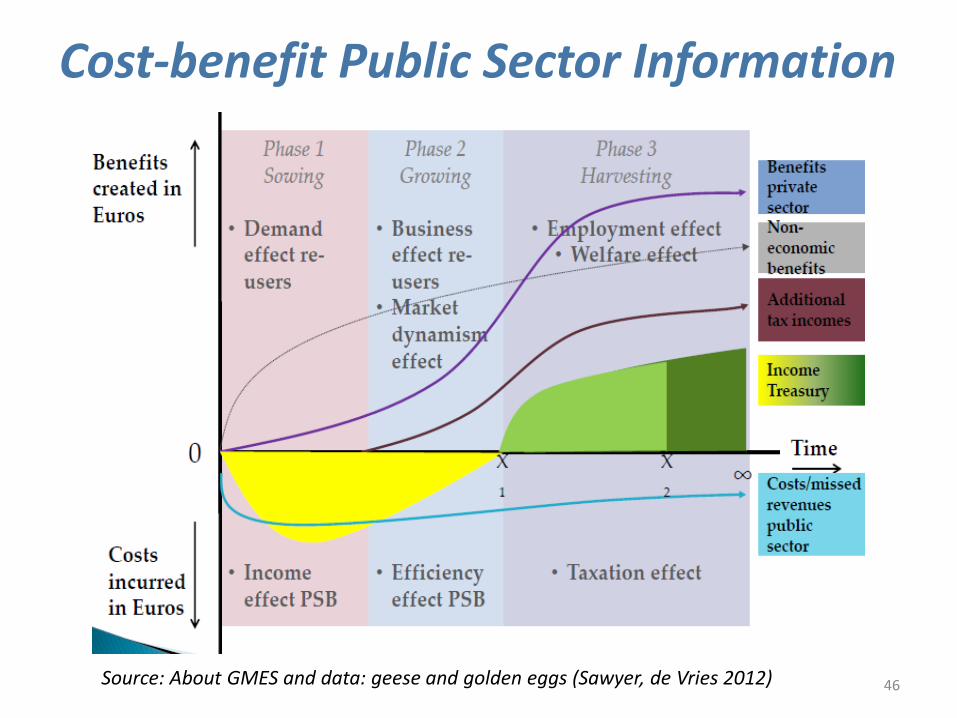
Cost-benefit Public Sector Information
Source: About GMES and data: geese and golden eggs (Sawyer, de Vries 2012)
47
Re-use of Public Sector Information
Source: About GMES and data: geese and golden eggs (Sawyer, de Vries 2012)
Most earth observation applications deal with so-called externalities, such as impact on the environment. It is difficult to capture these in terms of conventional cost-benefit models. To tackle this, the following framework for analysis of earth observation applications is developed:
48
49
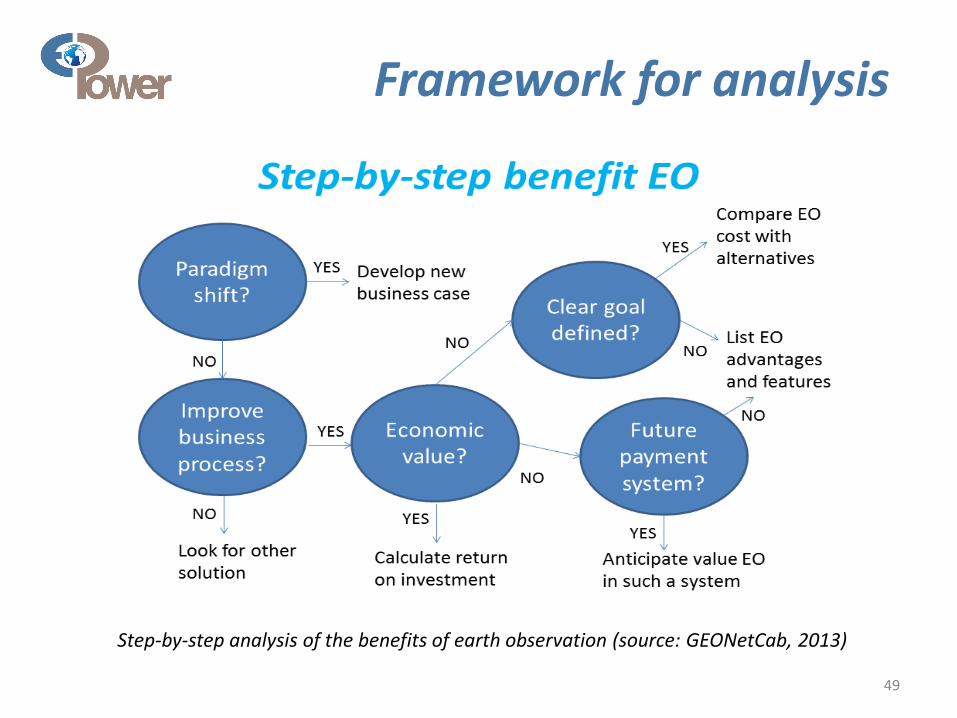
Framework for analysis
Step-by-step analysis of the benefits of earth observation (source: GEONetCab, 2013)
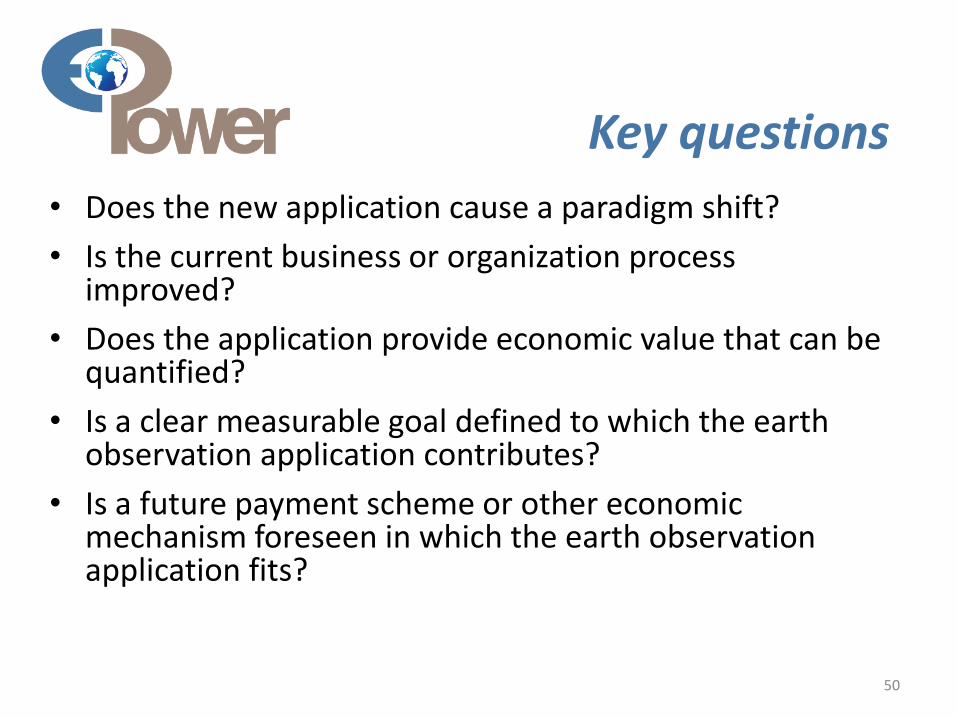
• Does the new application cause a paradigm shift?
• Is the current business or organization process improved?
• Does the application provide economic value that can be quantified?
• Is a clear measurable goal defined to which the earth observation application contributes?
• Is a future payment scheme or other economic mechanism foreseen in which the earth observation application fits?
50
Key questions
51
Assessment of geospatial solutions
Rating of characteristics of geospatial solutions: • fit-for-purpose • comparative advantage • complexity to user / ease- of-use • elegance • cost-benefit, • sustainability • resilience • reproduction capacity / flexibility • acceptance • level of knowledge transfer required • ethics, transparency, public accountability, objectivity & impartiality
Rating of business environment: • Willingness to pay (by clients) • Embedding (in organizational processes) • Openness (transparency and ease of doing business, access to markets) • Institutions (is the institutional environment conducive to doing business,
acceptance of new solutions?)
52
Fit-for-purpose
An important, but often forgotten requirement: Does the product or service do what it is supposed to do to solve a certain problem? In other words: is it really a solution or just an attempt towards a solution? • Quantitative: not applicable
• Qualitative (on scale of 1 to 5): based on description of what the EO solution actually does
53
Comparative advantage
What it does significantly better than other solutions to the same problem. For earth observation usually the comparative advantages of greater accuracy, better resolution in time and space, comprehensive overview of large areas and near real-time information provision are mentioned as comparative advantages. • Quantitative: calculation of degree in which the EO
solution is better than alternatives
• Qualitative (on scale of 1 to 5): based on listing of comparative advantages
54
Complexity (to user) / ease-of-use
At all levels in the value chain the users (professionals and end-users) are able to work with the product or service. • Quantitative: not applicable
• Qualitative (on scale of 1 to 5): based on user testimonials and user surveys
55
Elegance
Once you get the idea behind this product or service, you want to be part of the community that uses it. This sense of belonging facilitates the formation of user groups that provide valuable feedback. • Quantitative: none, or it should be the size of the user
community
• Qualitative (on scale of 1 to 5): based on user testimonials and user surveys
56
Cost-benefit
The cost-benefit of the product or service is quantified and sufficiently attractive, also in the long-term. • Quantitative: cost-benefit calculation
• Qualitative (on scale of 1 to 5): based on quantitative assessment
57
Sustainability
The product or service can be delivered when it is needed. There is a long-term perspective that guarantees delivery.
Sustainability concerns the following aspects: Long-term data availability
Availability of finance/funds to provide the solution continuously for present and future use
Long-term institutional / governmental interest and support
Long-term user interest for a solution that addresses real needs
• Quantitative: not applicable
• Qualitative (on scale of 1 to 5): based on sensitivity analysis of the EO solution
58
Resilience
In case of extremes or breakdown in the value chain, the product or service can still be delivered at an acceptable level. Alternatives (plan B) are available (and developed). • Quantitative: cost-benefit calculation of plan B
• Qualitative (on scale of 1 to 5): based on risk analysis of the EO solution
59
Reproduction capacity / flexibility
The product or service can be easily applied or adapted for use in another region or another situation, while still providing the solution without (too much) extra cost. • Quantitative: calculation of reproduction costs for
application in other regions or situations; measurement of spreading of actual use
• Qualitative (on scale of 1 to 5): based on quantitative assessment and description of EO solution
60
Acceptance
The users intuitively get what the product or service is about and are interested. They accept it as a solution to their problem. • Quantitative: none, or survey results about acceptance.
After introduction of the solution: number of clients and/or users
• Qualitative (on scale of 1 to 5): based on user testimonials and user surveys
61
Level of knowledge transfer required
The training requirements for professionals and other users along the value chain are clear and associated costs and efforts are acceptable. • Quantitative: cost and time required to get the users at
the desired knowledge and skill level
• Qualitative (on scale of 1 to 5): based on knowledge transfer plans and evaluation of training activities

62
Ethics, transparency, public accountability,
objectivity & impartiality Application of Earth observation increases the level of objectivity and impartiality in decision-making processes, including conflict resolution. The application improves transparency and public accountability. It raises no ethical issues or if it does, as in the case of privacy concerns, these are resolved in a satisfactory way for all parties concerned. • Quantitative: not applicable
• Qualitative (on scale of 1 to 5): based on user testimonials and user surveys
Several attempts have been made to introduce environmental accounting and to enlarge the sphere of the conventional economy to include and quantify impact on ecosystems. The following slides give some examples:
63
64
Environmental accounting & payment for ecosystem services • SEEA:
System of Environmental-Economic Accounts (EC, FAO, IMF, OECD, UN, WB )
• WAVES: Wealth Accounting and the Valuation of Ecosystem Services (global partnership, led by World Bank)
• TEEB: The Economics of Ecosystems and Biodiversity (group led by UNEP)
65
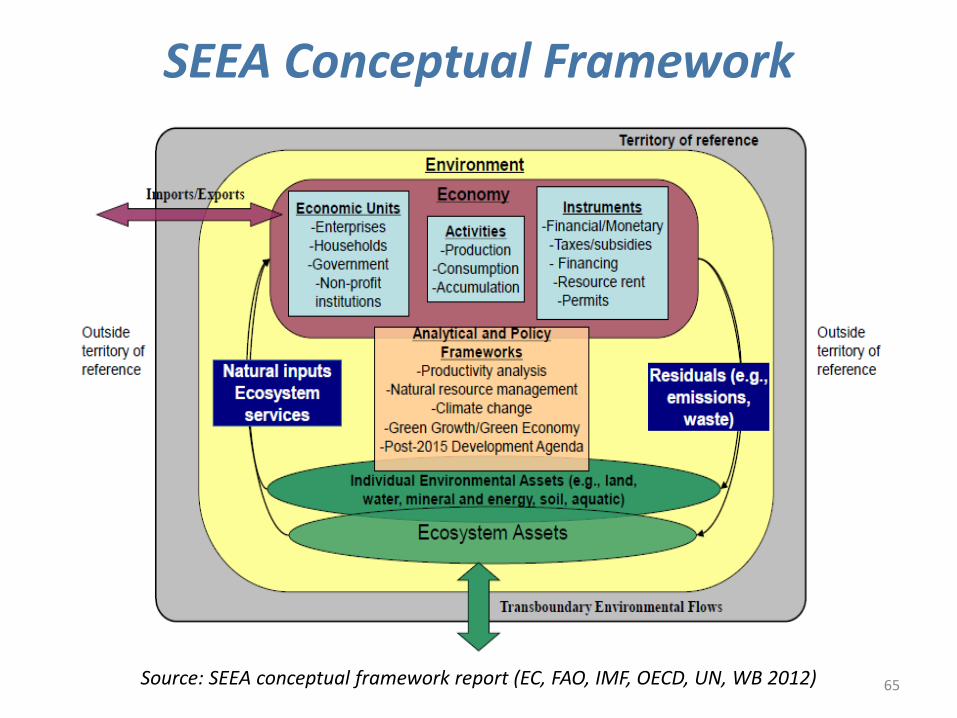
SEEA Conceptual Framework
Source: SEEA conceptual framework report (EC, FAO, IMF, OECD, UN, WB 2012)
For earth observation the work of the Group on Earth Observations (GEO) is essential to achieve the goal of a Global Earth Observations System of Systems (GEOSS), resulting in the shared GEO common infrastructure (GCI):
66

67
Group on Earth Observations
68
Marketing elements
• Customer value propositions
• Crossing the technology chasm
• Creating shared value
• Promotion tools
Customer value propositions capture the unique value of a product or services as perceived and appreciated by the customer. Interestingly, they can differ completely from the features that the provider considers most important:
69
70
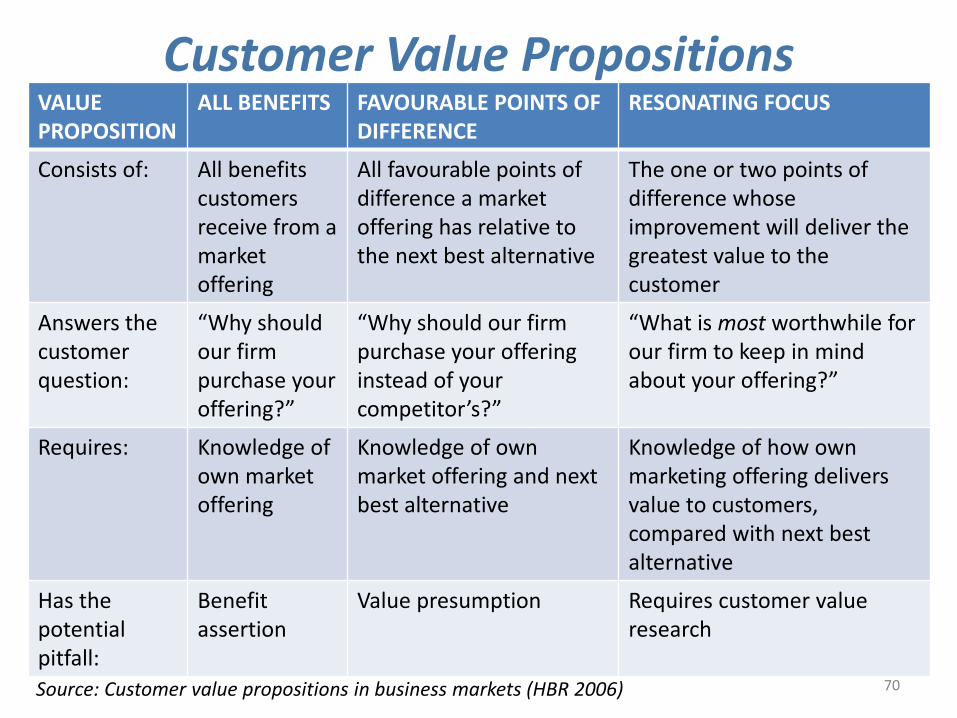
Customer Value Propositions
Source: Customer value propositions in business markets (HBR 2006)
VALUE PROPOSITION
ALL BENEFITS FAVOURABLE POINTS OF DIFFERENCE
RESONATING FOCUS
Consists of: All benefits customers receive from a market offering
All favourable points of difference a market offering has relative to the next best alternative
The one or two points of difference whose improvement will deliver the greatest value to the customer
Answers the customer question:
“Why should our firm purchase your offering?”
“Why should our firm purchase your offering instead of your competitor’s?”
“What is most worthwhile for our firm to keep in mind about your offering?”
Requires: Knowledge of own market offering
Knowledge of own market offering and next best alternative
Knowledge of how own marketing offering delivers value to customers, compared with next best alternative
Has the potential pitfall:
Benefit assertion
Value presumption Requires customer value research
71
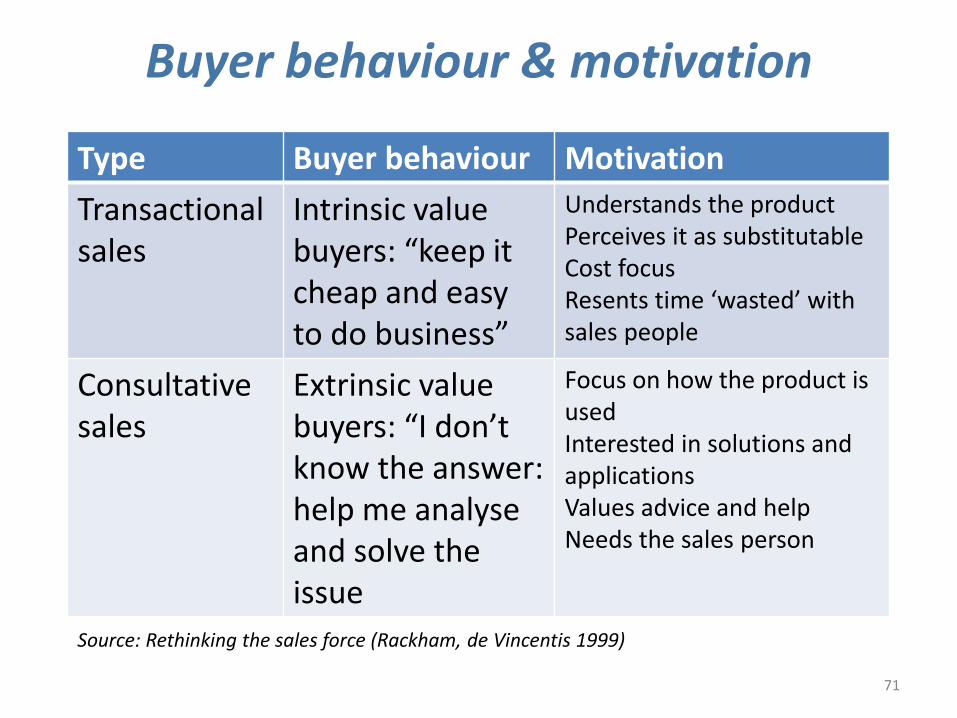
Buyer behaviour & motivation
Source: Rethinking the sales force (Rackham, de Vincentis 1999)
Type Buyer behaviour Motivation
Transactional sales
Intrinsic value buyers: “keep it cheap and easy to do business”
Understands the product Perceives it as substitutable Cost focus Resents time ‘wasted’ with sales people
Consultative sales
Extrinsic value buyers: “I don’t know the answer: help me analyse and solve the issue
Focus on how the product is used Interested in solutions and applications Values advice and help Needs the sales person
Even when customer value propositions are well captured and formulated, introduction of solutions that involve new technology will have to overcome some hurdles. This is called “crossing the technology chasm”:
72
73
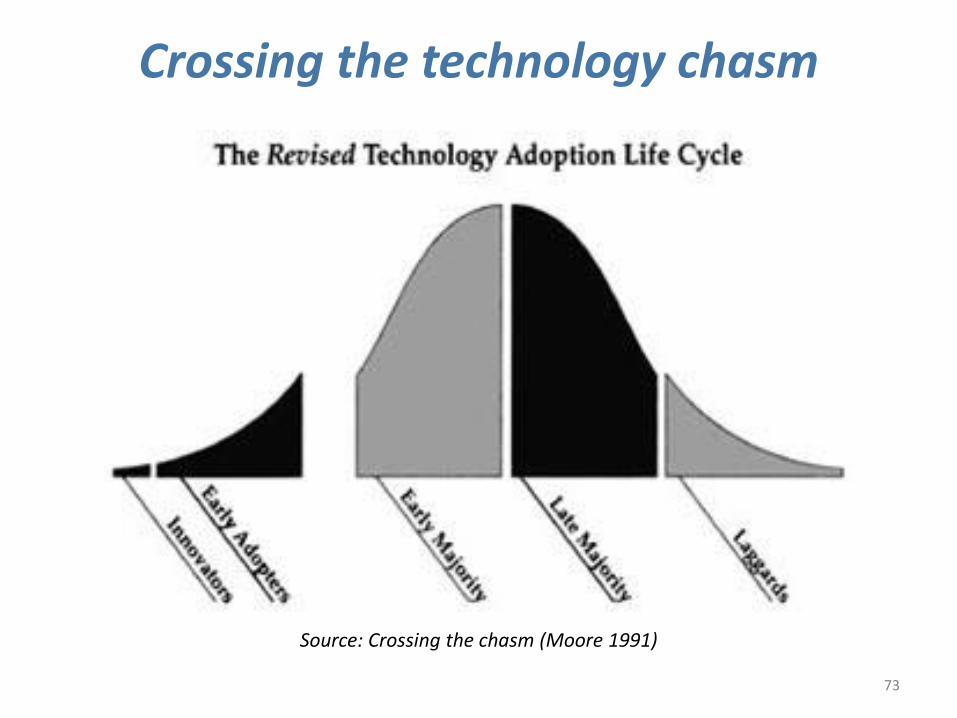
Crossing the technology chasm
Source: Crossing the chasm (Moore 1991)
74
Crossing the technology chasm
• Most clients of EO products and services belong to the early and late majority,
• They are pragmatists and are not prepared or willing to take substantial risk: the solution should work and be reliable.
• Once convinced, the pragmatists will be long-term clients.
Source: Crossing the chasm (Moore 1991)
75
More information:
Creating & delivering your value proposition – managing customer experience for profit (Barnes, Blake, Pinder; 2009)
Customer value propositions in business markets (Anderson, Narus, van Rossum [Harvard Business Review]; 2006)
Rethinking the sales force: refining selling to create and capture customer value (Rackham, de Vicentis; 1999)
Crossing the chasm – marketing and selling high-tech products to mainstream customers (Moore; 1991)
Creating shared value is a key element of successful implementation of earth observation solutions. To achieve this, in most cases earth observation applications have to be integrated into more general (business or organizational) processes:
76
77
Create shared value
Involves cooperation between:
• Public sector
• Private sector
• Social sector
Opportunity for earth observation (integrated) solutions:
• Integrate EO in general business / organizational process
• Integrate different EO (and GIS and navigation) functionalities
Based on all considerations dealt with in the previous slides, there are some practical approaches that can be applied in combination to promote earth observation applications:
78
79
Tools for earth observation marketing:
Source: Marketing earth observation products and services (Noort 2013)
• Success stories (in non-technical language, feasible, replication capacity, sustainable)
• Marketing toolkits (international trends, earth observation examples, references)
• Pilot projects, innovation funds, quick-wins (demonstration that EO actually works)
• Promotion outside EO community (fairs, seminars, lunch-bag meetings, magazines)
• Resource facilities for reference and capacity building (distributed, but connected, in different languages)

80
Business elements
Business elements:
• Proposal writing
• Business procedures
Proposal writing is an art in itself. During the GEONetCab and EOPOWER projects templates have been developed for writing successful proposals:
81
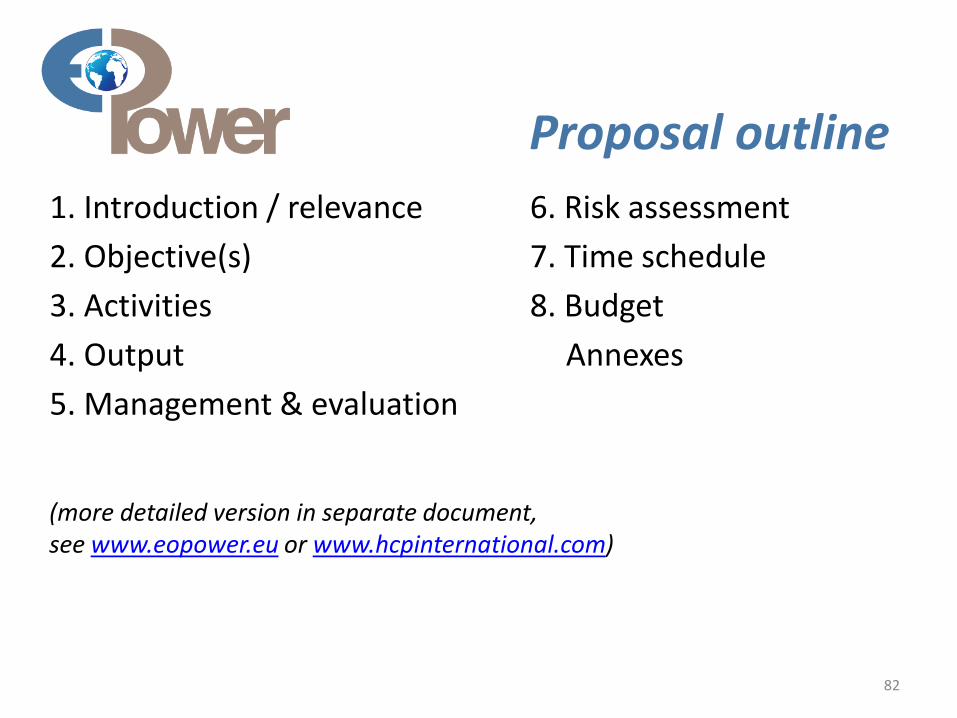
Proposal outline
82
(more detailed version in separate document, see www.eopower.eu or www.hcpinternational.com)
1. Introduction / relevance
2. Objective(s)
3. Activities
4. Output
5. Management & evaluation
6. Risk assessment
7. Time schedule
8. Budget
Annexes
Other guides that may be useful:
83
• Civicus: writing a funding proposal
• Michigan State University: guide for writing a funding proposal
• ESRI: writing a competitive GRANT application
• REC: project proposal writing
If you run a company, compete for assignments and manage projects, a structured approach towards responsibilities, tasks, implementation and documentation is needed. The following business procedures may be helpful:
84
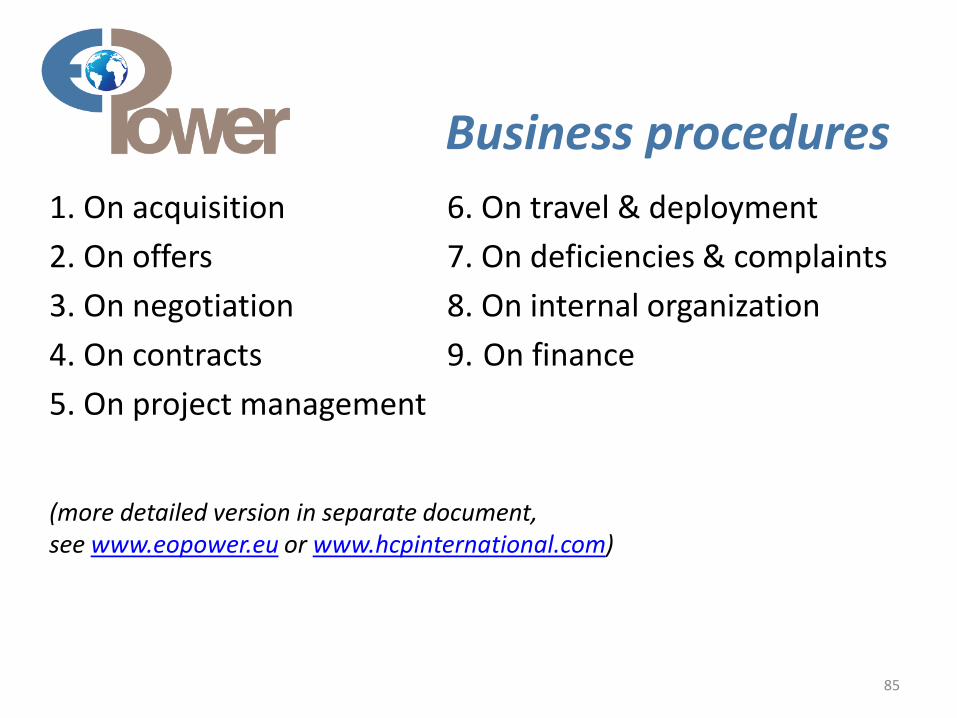
Business procedures
85
(more detailed version in separate document, see www.eopower.eu or www.hcpinternational.com)
1. On acquisition
2. On offers
3. On negotiation
4. On contracts
5. On project management
6. On travel & deployment
7. On deficiencies & complaints
8. On internal organization
9. On finance
Again:
• SHARED PROBLEM • SHARED LANGUAGE • SHARED SOLUTION
86

4. Capacity Building
87
General
Marketing is promotion + capacity building.
Especially for the introduction of new technologies capacity building is important at all levels.
Capacity building is the instrument to increase self-sufficiency and make solutions work.
88
General references for capacity building, open data and success stories
89
GEO Portal: www.earthobservations.org
Capacity building resource facility www.geocab.org
compilation of tutorials, references, open-source software, etc.
Satellites going local: share good practice (Eurisy handbooks) www.eurisy.org
Earth observation for green growth (ESA; 2013)
General references for capacity building, open data (2)
90
Bringing GEOSS services into practice: how to use data from the GEO portal and how to provide input www.envirogrids.net
Science education through earth observation for high schools: basic tutorials on all kind of subjects www.seos-project.eu
Copernicus briefs: information on satellite applications for different topics www.copernicus.eu/pages-secondaires/publications/copernicus-briefs/
MetEd tutorials and courses on meteorology and related subjects https://www.meted.ucar.edu/training_detail.php
General references for capacity building, open data (3)
91
Bringing GEOSS services into practice: how to use data from the GEO portal and how to provide input www.envirogrids.net
Science education through earth observation for high schools: basic tutorials on all kind of subjects www.seos-project.eu
Copernicus briefs: information on satellite applications for different topics http://www.copernicus.eu/main/copernicus-briefs
MetEd tutorials and courses on meteorology and related subjects https://www.meted.ucar.edu/training_detail.php
More references open data Open data for sustainable development (World Bank; 2015) description of the benefits of open data for a wide range of development goals, including the SDGs http://pubdocs.worldbank.org/pubdocs/publicdoc/2015/8/904051440717425994/Open-Data-for-Sustainable-development-Final-New.pdf
Terms and conditions for the use and distribution of Sentinel data (European Parliament and European Commission; 2014) standard stipulations related to free and open access to Sentinel data http://www.demarine.de/lr/c/document_library/get_file?uuid=c5067655-b7ad-4d71-b07b-6111808f4abd&groupId=13521
Towards a thriving data-driven economy (European Commission; 2014) policy document on the use of (open) data for a knowledge economy and society http://ec.europa.eu/information_society/newsroom/cf/dae/document.cfm?doc_id=6210
92
Capacity building resources for disaster management: CAPRA probabilistic risk assessment programme for Latin America and the Caribbean www.ecapra.org
DEWETRA reference material and data on many types of disasters, prediction models, weather observations, risk assessment and emergency management, describing the integrated approach of the Italian civil protection department http://dewetra.cimafoundation.org
Relief Web tutorials and database with search engine to make your own risk management portfolio or case study http://reliefweb.int/briefingkit
Understanding Risk Forum platform for discussion and knowledge exchange www.understandingrisk.org
93
Capacity building resources for disaster management (2): Multi-hazard risk assessment distance education course guide book and Risk City exercise book (ITC; 2011) training for the assessment of risks related to multiple hazards, including floods, landslides, earthquakes and technological hazards in an RS and GIS environment, using open source software (ILWIS)
Desastre zero: mapa de risco em sala de aula – manual do professor (INPE; 2013) manual for educators on risk mapping (English translation expected)
Remote sensing applications – chapter 11: Cyclone, chapter 12: Flood, chapter 13: Drought , chapter 14: Landslide, chapter 15: Earthquake, chapter 16: Forest fire (NRSC, 2010)
94
Capacity building resources for disaster management (3): Handbook of research on developments and trends in wireless sensor networks: from principle to practice (HUST; 2010) description of sensor webs, sensor web architecture and services
Field Guide to Humanitarian Mapping (MapAction) creating maps for field work, using GPS, Google Earth and open-source GIS software
Toolbox & manual - mapping the vulnerability of communities, example from Buzi, Mozambique (Z-GIS; 2008) mapping toolkit to provide the community members with appropriate decision support and awareness tools to identify and reduce their own vulnerabilities
MEASURE Evaluation global positioning system toolkit (USAID) toolkit for geographical data collection for development projects
95
Capacity building resources for disaster management (4): Quick guide to free geoinformatics for disaster management (University of Portsmouth; 2012) overview of free geospatial data sources, software and training materials
INFORM user guide tool for risk assessment and risk management http://www.inform-index.org/
96
Capacity building resources for disaster management (5): Use of active earth observation systems for flood hazard assessment Examples of flood extent mapping using space-borne RADAR and air-borne LIDAR (ITC; 2015) 3-day EOPOWER (self-study) course for professionals http://menhir.itc.utwente.nl:5000/fbsharing/KGKOZXKU/
Visual interpretation of landslides using earth observation Case study: Nehoiu area, Buzau County, Romania (ITC; 2015) 3-day EOPOWER (self-study) course for professionals http://menhir.itc.utwente.nl:5000/fbsharing/KGKOZXKU/
97