Embed Size (px)
Citation preview
REVIEW SUMMARY
EARTH HISTORY
The Anthropocene is functionallyand stratigraphically distinct fromthe HoloceneColin N Waters Jan Zalasiewicz Colin Summerhayes Anthony D BarnoskyCleacutement Poirier Agnieszka Gałuszka Alejandro Cearreta Matt EdgeworthErle C Ellis Michael Ellis Catherine Jeandel Reinhold Leinfelder J R McNeillDaniel deB Richter Will Steffen James Syvitski Davor Vidas Michael WagreichMark Williams An Zhisheng Jacques Grinevald Eric OdadaNaomi Oreskes Alexander P Wolfe
BACKGROUNDHumans are altering the pla-net including long-term global geologic pro-cesses at an increasing rate Any formalrecognition of an Anthropocene epoch in thegeological time scale hinges onwhether humanshave changed the Earth system sufficiently toproduce a stratigraphic signaturein sediments and ice that is distinctfrom that of the Holocene epochProposals for marking the start ofthe Anthropocene include an ldquoearlyAnthropocenerdquo beginning with thespread of agriculture and de-forestation theColumbianExchangeof Old World and NewWorld spe-cies the Industrial Revolution at~1800 CE and the mid-20th cen-tury ldquoGreat Accelerationrdquo of popula-tion growth and industrialization
ADVANCESRecent anthropogenicdeposits contain newminerals androck types reflecting rapid global dis-seminationofnovelmaterials includ-ing elemental aluminum concreteandplastics that formabundant rap-idly evolving ldquotechnofossilsrdquo Fossilfuel combustion has disseminatedblack carbon inorganic ash spheresand spherical carbonaceousparticlesworldwidewith anear-synchronousglobal increase around 1950 Anthro-pogenic sedimentary fluxes haveintensified including enhancederosion caused by deforestationand road construction Widespreadsediment retention behind damshas amplified delta subsidenceGeochemical signatures include
elevated levels of polyaromatic hy-drocarbons polychlorinated bi-phenyls and pesticide residues aswell as increased 207206Pb ratios fromleaded gasoline starting between
~1945 and 1950 Soil nitrogen and phosphorusinventories have doubled in the past centurybecause of increased fertilizer use generatingwidespread signatures in lake strata andnitratelevels in Greenland ice that are higher than atany time during the previous 100000 years
Detonation of the Trinity atomic device atAlamogordo New Mexico on 16 July 1945initiated local nuclear fallout from 1945 to 1951whereas thermonuclear weapons tests gen-erated a clear global signal from 1952 to 1980the so-called ldquobomb spikerdquo of excess 14C 239Puand other artificial radionuclides that peaksin 1964Atmospheric CO2 and CH4 concentrations
depart from Holocene and even Quaternarypatterns starting at ~1850 andmoremarkedlyat ~1950 with an associated steep fall in d13C
that is captured by treerings and calcareous fos-sils Anaverage global tem-perature increase of 06o
to 09oC from 1900 to thepresent occurring pre-dominantly in the past
50 years is now rising beyond the Holocenevariation of the past 1400 years accompaniedby a modest enrichment of d18O in Greenlandice starting at ~1900 Global sea levels in-creased at 32 plusmn 04 mmyear from 1993 to2010 and are now rising above Late Holocenerates Depending on the trajectory of future
anthropogenic forcing these trendsmay reach or exceed the envelope ofQuaternary interglacial conditionsBiologic changes also have been
pronounced Extinction rates havebeen far above background ratessince 1500 and increased further inthe 19th century and later in addi-tion species assemblages have beenaltered worldwide by geologicallyunprecedented transglobal speciesinvasions and changes associatedwith farming and fishing perma-nently reconfiguring Earthrsquos bio-logical trajectory
OUTLOOK These novel stratigraph-ic signatures support the formaliza-tion of the Anthropocene at theepoch level with a lower boundary(still to be formally identified) suit-ably placed in the mid-20th centuryFormalization is a complex questionbecause unlike with prior subdivi-sions of geological time the poten-tial utility of a formal Anthropocenereaches well beyond the geologicalcommunity It also expresses theextent to which humanity is drivingrapid andwidespread changes to theEarth system that will variously per-sist and potentially intensify into thefuture
RESEARCH
SCIENCE sciencemagorg 8 JANUARY 2016 bull VOL 351 ISSUE 6269 137
The list of author affiliations is available in the fullarticle onlineCorresponding author E-mail cnwbgsacukCite this article as C NWaters et al Science 351aad2622 (2016) DOI 101126scienceaad2622
Indicators of the Anthropocene in recent lake sediments differmarkedly from Holocene signatures These include unprecedentedcombinations of plastics fly ash radionuclides metals pesticidesreactive nitrogen and consequences of increasing greenhouse gasconcentrations In this sediment core from west Greenland (69deg03N49deg54W) glacier retreat due to climate warming has resulted in anabrupt stratigraphic transition from proglacial sediments to nonglacialorganic matter effectively demarcating the onset of the Anthropocene[Photo credit J P Briner]
ON OUR WEB SITE
Read the full articleat httpdxdoiorg101126scienceaad2622
Corrected 8 February 2016 see full text
on F
ebru
ary
17 2
016
Dow
nloa
ded
from
on
Feb
ruar
y 17
201
6D
ownl
oade
d fr
om o
n F
ebru
ary
17 2
016
Dow
nloa
ded
from
on
Feb
ruar
y 17
201
6D
ownl
oade
d fr
om o
n F
ebru
ary
17 2
016
Dow
nloa
ded
from
on
Feb
ruar
y 17
201
6D
ownl
oade
d fr
om o
n F
ebru
ary
17 2
016
Dow
nloa
ded
from
on
Feb
ruar
y 17
201
6D
ownl
oade
d fr
om o
n F
ebru
ary
17 2
016
Dow
nloa
ded
from
on
Feb
ruar
y 17
201
6D
ownl
oade
d fr
om o
n F
ebru
ary
17 2
016
Dow
nloa
ded
from
REVIEW
EARTH HISTORY
The Anthropocene is functionallyand stratigraphically distinct fromthe HoloceneColin N Waters1 Jan Zalasiewicz2 Colin Summerhayes3 Anthony D Barnosky4
Cleacutement Poirier5 Agnieszka Gałuszka6 Alejandro Cearreta7 Matt Edgeworth8
Erle C Ellis9 Michael Ellis1 Catherine Jeandel10 Reinhold Leinfelder11
J R McNeill12 Daniel deB Richter13 Will Steffen14 James Syvitski15 Davor Vidas16
Michael Wagreich17 Mark Williams2 An Zhisheng18 Jacques Grinevald19
Eric Odada20 Naomi Oreskes21 Alexander P Wolfe22
Human activity is leaving a pervasive and persistent signature on Earth Vigorous debatecontinues about whether this warrants recognition as a new geologic time unit known asthe Anthropocene We review anthropogenic markers of functional changes in the Earthsystem through the stratigraphic record The appearance of manufactured materials insediments including aluminum plastics and concrete coincides with global spikes infallout radionuclides and particulates from fossil fuel combustion Carbon nitrogen andphosphorus cycles have been substantially modified over the past century Rates ofsea-level rise and the extent of human perturbation of the climate system exceed LateHolocene changes Biotic changes include species invasions worldwide and acceleratingrates of extinction These combined signals render the Anthropocene stratigraphicallydistinct from the Holocene and earlier epochs
The term ldquoAnthropocenerdquo is currently usedinformally to encompass different geologi-cal ecological sociological and anthropo-logical changes in recent Earth history Theorigins of the concept of the Anthropocene
its terminology and its sociopolitical implica-tions arewidely discussed (1 2)When consideringthe stratigraphic definition of the Anthropocenethere are two basic questions Have humanschanged the Earth system to such an extent thatrecent and currently forming geological depositsinclude a signature that is distinct from those ofthe Holocene and earlier epochs which will re-main in the geological record If so when didthis stratigraphic signal (not necessarily the firstdetectable anthropogenic change) become recog-nizable worldwide These questions are consid-ered here in the context of how stratigraphicunits have been formally recognized earlier in theQuaternary periodProposals for marking the start of the Anthro-
pocene have included (i) an ldquoearly Anthropocenerdquoassociated with the advent of agriculture animaldomestication extensive deforestation and grad-ual increases in atmospheric carbon dioxide (CO2)andmethane (CH4) levels thousands of years ago(3 4) (ii) the Columbian Exchange of OldWorldand New World species associated with coloni-zation of the Americas (5) (iii) the beginning ofthe Industrial Revolution at ~1800 CE (6 7) and(iv) the mid-20th century ldquoGreat Accelerationrdquo ofpopulation growth industrialization and min-eral and energy use (8ndash10)
Here we review several lines of evidence sug-gesting that the Anthropocenersquos stratigraphic sig-natures distinguish it from theHolocene (Fig 1)We find that criteria available to recognize theAnthropocene are consistent with those used todefine other Quaternary stratigraphic units Ear-lierQuaternary time-unit subdivisions are definedby signals fromcyclical forcings of climate changesuch as variation in Earthrsquos orbit or solar ir-radiance and irregular events such as volcaniceruptions Although these forcings continue theAnthropocene markers reflect an additional keydriver that of human modification of globalenvironments at unprecedented rates Thisdriver has produced a wide range of anthropo-genic stratigraphic signals (Fig 1) includingexamples that are novel in Earth history that areglobal in extent and that offer fine temporalresolution The signals vary in their develop-ment Some are already advanced and othersare at early stages We describe these signals andsuggest how theymay be used in the stratigraphiccharacterization and correlation of a formalizedAnthropocene epochwith a lower boundary (stillto be identified) potentially placed in the mid-20th century
How are Quaternary stratigraphicunits defined
The Quaternary period which began 26 millionyears ago (Ma) is subdivided into geochronologicaltime units (epochs and ages) with boundaries thatare linked at least in part to climate change events
(expressed asmarine isotope stages) in associationwith paleomagnetic reversals (11) This contrastswith the subdivision of most of the Phanerozoiceon (the past ~541 plusmn 1 Ma) for which the first orlast appearance of key fossil taxa is typically usedtodefine timeunits Fossil-basedboundaries repre-sent changeat rates too slowand time-transgressivefor the geologically recent past in which the timeunits are of comparatively short duration (about12000 years for the Holocene versus 2 millionyears or more for earlier epochs) These time in-tervals are recognizable in the geologic recordas chronostratigraphic units (series and stages)which in contrast to the time units are physicalentities including rocks sediments and glacierice Ideally a chronostratigraphic unit is exempli-fied and its lower boundary defined at a singlelocality termed the Global Boundary StratotypeSection and Point (GSSP) which is typically inmarine strata for pre-Holocene series (12)The start of the Holocene epoch (or series) is
based on the termination of the transition fromthe last glacial phase into an interval of warmingaccompanied by ~120mof sea-level rise Thewarm-ing took place over about 1600 years and isrecorded by a variety of stratigraphic signals thatare not all globally synchronous In the NorthernHemisphere the signal for theHolocenersquosbeginning
RESEARCH
SCIENCE sciencemagorg 8 JANUARY 2016 bull VOL 351 ISSUE 6269 aad2622-1
1British Geological Survey Keyworth Nottingham NG12 5GGUK 2Department of Geology University of LeicesterUniversity Road Leicester LE1 7RH UK 3Scott PolarResearch Institute Cambridge University Lensfield RoadCambridge CB2 1ER UK 4Department of Integrative BiologyMuseum of Paleontology and Museum of VertebrateZoology University of CaliforniandashBerkeley Berkeley CA94720 USA 5Morphodynamique Continentale et CocirctiegravereUniversiteacute de Caen Normandie Centre National de laRecherche Scientifique (CNRS) 24 Rue des Tilleuls F-14000Caen France 6Geochemistry and the Environment DivisionInstitute of Chemistry Jan Kochanowski University 15GŚwiętokrzyska Street 25-406 Kielce Poland 7Departamentode Estratigrafiacutea y Paleontologiacutea Facultad de Ciencia yTecnologiacutea Universidad del Paiacutes VascoEuskal HerrikoUnibertsitatea Apartado 644 48080 Bilbao Spain 8Schoolof Archaeology and Ancient History University of LeicesterUniversity Road Leicester LE1 7RH UK 9Department ofGeography and Environmental Systems University ofMarylandndashBaltimore County Baltimore MD 21250 USA10Laboratoire drsquoEtudes en Geacuteophysique et OceacuteanographieSpatiales (CNRS Centre National dEacutetudes Spatiales Institutde Recherche pour le Deacuteveloppement Universiteacute PaulSabatier) 14 Avenue Edouard Belin 31400 Toulouse France11Department of Geological Sciences Freie Universitaumlt BerlinMalteserstraszlige 74-100D 12249 Berlin Germany12Georgetown University Washington DC USA 13NicholasSchool of the Environment Duke University Box 90233Durham NC 27516 USA 14The Australian NationalUniversity Canberra Australian Capital Territory 0200Australia 15Department of Geological Sciences University ofColoradondashBoulder Box 545 Boulder CO 80309-0545 USA16Marine Affairs and Law of the Sea Programme The FridtjofNansen Institute Lysaker Norway 17Department ofGeodynamics and Sedimentology University of Vienna A-1090 Vienna Austria 18State Key Laboratory of Loess andQuaternary Geology Institute of Earth Environment ChineseAcademy of Sciences Xian 710061 Beijing NormalUniversity Beijing 100875 China 19Institut de Hautes EacutetudesInternationales et du Deacuteveloppement Chemin Eugegravene Rigot2 1211 Genegraveve 11 Switzerland 20Department of GeologyUniversity of Nairobi Nairobi Kenya 21Department of theHistory of Science Harvard University Cambridge MA02138 USA 22Department of Biological Sciences Universityof Alberta Edmonton Alberta T6G 2E9 CanadaCorresponding author E-mail cnwbgsacuk
Corrected 8 February 2016 see full text
was taken as the abrupt end of the Younger Dryascooling event TheGSSP chosen to define the baseof the Holocene was agreed to lie within theNGRIP2 ice core from central Greenland (NGRIPNorth Greenland Ice Core Project) (13) The corecontains a detailed archive of environmentalchange preserved in the composition of air bub-bles trapped in the ice and in the chemical andphysical characteristics of the ice The GSSP lieswithin amultidecade warming andmoisteningtrend which is inferred from oxygen isotopesshowing rising d18O associated with a reductionin dust content Aboutmidway through this trendthe sharpest change is a decrease in excess deu-terium which is interpreted as representing a re-organization of North Atlantic ocean-atmospherecirculation at 11700 years before the year 2000 CEplusmn 99 years at 2s (13) This distinctive change isused to define the base of the Holocene series(the material chronostratigraphic unit) Thus
by definition the Holocene epoch (the abstracttime unit) began ~11700 years agoTheHolocene epoch (and corresponding series)
is being considered for subdivision into threecomponent sub-epochs (subseries) again usingclimatic signatures to guide the positioning oftheir bases The base of the Lower Holocene bydefault would be the base of theHolocene seriesas described above The base of the Middle Hol-ocene has been proposed to lie within a short-lived (150 plusmn 30 years) cooling event at 8200 yearsbefore the present (yr BP) where there is amarked shift to lower 18O16O values (more neg-ative d18O values) within the NGRIP1 ice core inthe Greenland Ice Sheet (13) Within the samenarrow interval of timeGreenland ice cores showlow deuteriumhydrogen (DH) ratios a declinein annual layer thickness an atmospheric CH4
minimum and a volcanic marker characterizedby high fluoride content Such signals have led
to the proposal that a Greenland ice core shouldbe used to define theMiddle Holocene GSSP (13)Although such signals are most strongly evidentat localities adjacent to the North Atlantic theyprobably make up part of a global signaturebecause correlative signals are evident in lakesediments as changes in pollen assemblages andoxygen isotopes in cave speleothems as isotopicsignals reflecting changes in the intensity of theSouth American monsoon in marine foraminif-eral assemblages (species compositions) and inincreased aridification around theMediterraneanthat broadly coincideswith theMesolithic-Neolithictransition (13)The base of the Upper Holocene has been
proposed to lie at amid- and low-latitude aridifi-cation event at 4200 yr BP (13) This event ap-pears to have coincided with cooling of the NorthAtlantic and tropical Pacific the arrival of coolerand wetter conditions in Europe and a weaken-ing of the Asian monsoon (13) The proposedstratotype is in a speleothem record from Mawm-luh Cave in northeast India at the midpoint of atwo-stage shift of d18O values in calcite from morepositive starting at 4300 yr BP to more nega-tive starting at 4100 yr BP (13) Although thereis no doubt that marked environmental per-turbations occurred at both 8200 and 4200 yrBP most proxies indicate subsequent recov-ery in a matter of centuries implying that thesewere temporally discrete paleoclimatic events asopposed to truly novel states within the Earthsystem
Human drivers ofstratigraphic signatures
The driving human forces responsible for manyof the anthropogenic signatures are a product ofthe three linked force multipliers acceleratedtechnological development rapid growth of thehuman population and increased consumptionof resources These have combined to result inincreased use ofmetals andminerals fossil fuelsand agricultural fertilizers and increased trans-formation of land and nearshore marine ecosys-tems for human use The net effect has been aloss of natural biomes to agriculture cities roadsand other human constructs and the replacementof wild animals and plants by domesticated spe-cies to meet growing demands for food Thisincrease in consumption of natural resources isclosely linked to the growth of the human popula-tion AnatomicallymodernHomo sapiens emerged~200000 years ago (14) By 12000 yr BP aroundthe start of the Holocene humans had colonizedall of the continents except Antarctica and theSouth Pacific islands and had reached a totalpopulation estimated at 2million (15 16) Up tothis point human influence on the Earth systemwas small relative to what has happened sincethe mid-20th century even so human impactscontributed to the extinction of Pleistocene me-gafauna (17) However the key signals used torecognize the start of the Holocene epoch werenot directly influenced by human forcing whichis a major distinction from the proposed Anthro-pocene epoch
aad2622-2 8 JANUARY 2016 bull VOL 351 ISSUE 6269 sciencemagorg SCIENCE
-1
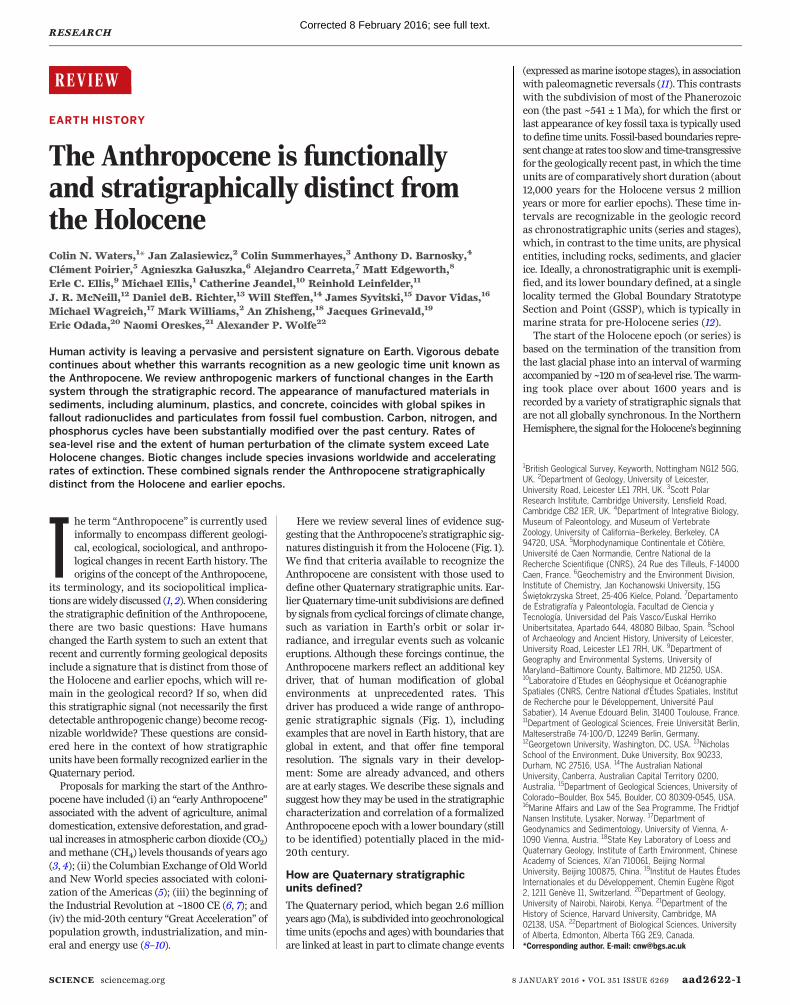
Fig 1 Summary of the magnitude of key markers of anthropogenic change that are indicative ofthe Anthropocene (A) Novel markers such as concrete plastics global black carbon and plutonium(Pu) fallout shown with radiocarbon (14C) concentration (B) Long-ranging signals such as nitrates(NO3
ndash) CO2 CH4 and global temperatures which remain at relatively low values before 1950 rapidlyrise during the mid-20th century and by the late 20th century exceed Holocene ranges
RESEARCH | REVIEWCorrected 8 February 2016 see full text
Humans had a growing stratigraphic influencethroughout the Holocene epoch as the global pop-ulation gradually increased It has been arguedthat ~8000 years ago with a global populationestimated at less than 18 million (15 16) the ini-tiation of agricultural practices and forest clear-ances began to gradually increase atmosphericCO2 levels (3) But it was not until ~1800 CE thatthe global population first reached 1 billion (16)Increased mechanization and the drive to urban-ization during the Industrial Revolution initiallyinWestern Europe and eventuallyworldwide (18)then facilitated amore rapid population increaseAlthough this population growth is commonlythought to have increased exponentially throughthe 19th and 20th centuries (8 9) recent analy-ses (15 16) suggest that it can be differentiatedinto a period of relatively slower growth from1750 to 1940 CE and one of more rapid growthfrom 1950 to 2010 CE The inflection point at~1950 CE coincides with the Great Accelera-tion (8 9) a prominent rise in economic activityand resource consumption that accounts forthe marked mid-20th century upturns in orinceptions of the anthropogenic signals detailedbelow
New anthropogenic materials
Recent anthropogenic deposits which are theproducts ofmining waste disposal (landfill) con-struction andurbanization (19) contain thegreatestexpansion of newminerals since theGreatOxygen-ation Event at 2400Ma (20) and are accompaniedbymany new forms of ldquorockrdquo in the broad senseof geological materials with the potential for long-term persistence Overmanymillennia humanshave manufactured materials previously unknownonEarth such as pottery glass bricks and copperalloys Remains of thesematerials are present asa persistent andwidespread geological signal thatis markedly time-transgressive reflecting themi-gration of peoples (21) In contrast elemental alu-minum which was almost unknown in nativeform before the 19th century has seen 98 of itscumulative global production of ~500 Tg since1950 CE (Fig 2A) (20 22) Concrete which wasinvented by the Romans became the primarybuilding material fromWorld War II (1939ndash1945CE) onward The past 20 years (1995ndash2015) ac-count for more than half of the 500000 Tg ofconcrete ever produced (22 23) (Fig 2A) equiv-alent to ~1 kg mminus2 of the planet surface Concreteand aluminum are widely disseminated acrossterrestrial particularly urban settingsSimilarly themanufacture of new organic poly-
mers (plastics) which were initially developed inthe early 1900s rapidly grew from the 1950s toan annual production of about ~300 Tg in 2013(24) (Fig 2A) comparable to the present humanbiomass Plastics spread rapidly via rivers intolakes and they are now also widespread in bothshallow- and deep-water marine sediments asmacroscopic fragments and as virtually ubiqui-tous microplastic particles (microbeads ldquonurdlesrdquoand fibers) (Fig 2A) (25ndash27) which are dispersedby both physical and biological processes Thedecay resistance and chemistry of most plastics
suggest that they will leave identifiable fossil andgeochemical recordsThese and other new materials are commonly
shaped into abundant artifacts with the capacityto be preserved in and to help date future geo-logical deposits Analogous to biotic fossil re-mains these so-called technofossils (28) provideannual to decadal stratigraphic resolution (19 22)mdashfar greater than what can be obtained from thefirst and last appearances of fossil taxa whichhave traditionally been the most common meansof correlating stratal sections (29)Fossil fuel combustion disseminates unburned
particles as black carbon inorganic ash spheres(IASs) and spherical carbonaceous particles (SCPs)Black carbon increasedmarkedly toward the endof the 19th century and especially after ~1970CE with a peak at 67 Tg yearminus1 in ~1990 CE (Fig2B) (30) IASs which are locally detectable in thestratigraphic record starting in the 16th centuryincreased across Britain Scandinavia and NorthAmerica from ~1835 to 1960 CE (31) SCPs which
were first recorded at various sites in the UK from1830 to 1860 CE show a near-synchronous globalincrease around 1950 CE with peak signaturesfrom the 1960s to the 1990s (Fig 2B) (32 33)Black carbon IASs and SCPs being airborne par-ticulates leave a permanentmarker within bothsediments and glacial ice An ancient analog is themarker horizon of carbon impact spherules at theCretaceous-Paleogeneboundarywhichwas createdby the Chicxulub bolide impact (34) These low-temperature natural spherules which are readilydistinguishable from high-temperature industrialSCPs demonstrate the likely persistence of SCPsas a stratigraphic marker (32)
Modification of sedimentary processes
The transformation of more than 50 of Earthrsquosland surface for human use (35) has generatedanthropogenically modified materials that extendacrossmultiple terrestrial settings They aremostubiquitous in anthropogenic (artificial) depositssuchas landfills urbanstructures andmine tailings
SCIENCE sciencemagorg 8 JANUARY 2016 bull VOL 351 ISSUE 6269 aad2622-3
Fig 2 The production of selected new anthropogenic materials (A) Cumulative growth of manu-factured aluminum in the surface environment [adapted from data in (23) assuming a recycling rate of50] cumulative growth of production of concrete assuming that most cement goes into concrete andthat ~15 of average concrete mass is cement [from (22) derived from US Geological Survey globalcement production statistics] annual growth of plastics production [from (24)] and synthetic fibersproduction [from (26)] (B) Global midndash20th century rise and latendash20th century spike in SPCs normalizedto the peak value in each lake core [modified from (32)] and global black carbon from available annualfossil fuel consumption data for 1875ndash1999 CE (30) Numbers of lake cores for each region are indicated
RESEARCH | REVIEWCorrected 8 February 2016 see full text
in addition to soils associated with cultivation Thisinfluence is increasingly extending into theoceans both directly through coastal reclamationworks sediment reworking by trawler fishingand the extraction of sand and gravel and in-directly through changes in coastal sedimentaryfacies in response to rising sea levels the eutrophi-cationof coastal environments and coral bleachingevents (36) Human land alteration also increas-ingly extends into the subsurface via drilling intoEarthrsquos crust to extractminerals to store wastesor to host utilities (37) Mineral extraction aloneaccounts for the displacement of ~57000 Tgyearndash1 of sediments exceeding the current rate ofriverborne sediment transport by almost a factorof 3 (38)Human activities have also modified sedimen-
tary processes sufficiently to leave clear expres-sions in river lake windblown and glacial depositsthat areoften far removed fromdirect point sources(36) Sediment fluxes in many fluvial systemsincreased historically because of greater defores-
tation livestock grazing and cropland develop-ment Clearing of primary forests for agricultureusually by burning began in Early toMid-Holocenetimes especially in temperate woodland bio-mes this shifted diverse primary forest commun-ities toward domesticates and early successionalspecies and left widespread time-transgressivegeological traces that include profound shiftsin plant and animal remains charcoal and sedi-ment deposits from soil erosion (39 40) In recentdecades secondary forests have recovered acrossmuch of the temperate zone and forest clearinghas shifted toward tropical regions for exampleperiods of rapid deforestation have occurred inAmazonia Indonesia and other regions in Asiaand Africa in response to economic and govern-ance dynamics (41) The construction of moun-tain roads in these tropical regions is resulting insubstantial surface erosion and landslides (42)Extensive sediment retention behind dams
constructed acrossmajor river systems has creat-ed a global signal more rapidly Most dams were
built in the past 60 years at an average rate ofmore than one large damper day (8 9) and eachwill last 50 to 200 years interrupting sedimenttransport to the oceans The reduced sedimentflux to major deltas combined with increasingextraction of groundwater hydrocarbons andsediments (for aggregates) has caused manylarge deltas to subside more quickly a processbeginning in the 1930s (43) at rates faster thanmodern eustatic sea-level rise Coastal retreat isan inevitable result These various signals whichare abrupt on geological time scales are diach-ronous at the decadal scale
Changed geochemical signatures inrecent sediments and ice
Anthropogenic materials and the human influ-ence on sedimentary environments have a near-global expression but geochemical signaturesparticularly those with airborne transport path-ways reach all global environments includingthe ~12 of Earthrsquos surface that is permanentlycovered by ice Among the many distinct geo-chemical signatures that human activitieshave introduced into the sedimentary recordare elevated concentrations of polyaromatichydrocarbons polychlorinated biphenyls anddiverse pesticide residues each beginning at~1945 to 1950 CE (44ndash47) Lead smelting duringRoman times resulted in a distinctive localmarkerof increased 207206Pb ratios a signal that changedglobally in the early 20th century as a result ofvehicles powered by leaded gasoline (47) Thisillustrates that some anthropogenic geochemicalsignatures may vary geographically in their firstappearance but nevertheless become useful as glo-balmarkers when they rapidly spread as the resultof new technologies in the mid-20th centuryNitrogen (N) and phosphorus (P) in soils have
doubled in the past century because of increasedfertilizer use (8 9 48) Production of P byminingnow at ~235 Tg yearminus1 is twice the backgroundweathering rate of P released during the Holo-cene (49) Human processes are argued to havehad the largest impact on the nitrogen cycle forsome 25 billion years (48) The use of the Haber-Bosch process from 1913 CE onward has increasedthe amount of reactive N in the Earth system by120 relative to theHolocene baseline (50) accom-panied by an increased flux of nitrogen oxides(NOx) from the combustion of fossil fuels (Fig 3) (51)These changes have stratigraphic consequences
The influx of excess reactive N and P to lakes andseas has led to seasonal oxygen deficiency af-fecting local microbiota and in extreme casesincreasingmortality in macrobiota (52) NorthernHemisphere lakes show increasingly depleted d15Nvalues (53 54) beginning at ~1895CE (Fig 3B) andaccelerating over the past 60 years In Greenlandice d15N values during the Late Pleistocene glaci-ation show a gradual marked decline to a pre-industrial Holocene norm [mean 97 per mil (permil)in the GISP2 (Greenland Ice Sheet Project 2) icecore (55)] they decline again andmore rapidlystarting at ~1850 CE with the greatest declineoccurring between 1950 and 1980 CE (Fig 3A)(47 56) Themain phase of the increase in nitrate
aad2622-4 8 JANUARY 2016 bull VOL 351 ISSUE 6269 sciencemagorg SCIENCE
Fig 3 Perturbations of the nitrogen cycle since the start of the Late Pleistocene (A) Coevolutionof ice core NO3
ndash (blue) and d15N for NO3ndash (green) from the Late Pleistocene to the present obtained by
splicing data from two cores from Summit Greenland (725degN 384degW 3200 m above sea level) (55ndash57)(B) Power functions fitted to d15N data from lake sediments (gray lines representing 25 remote NorthernHemisphere sites) and ice cores (green line) expressed as departures (Dd15N) from preindustrial baselinevalues (53 54) These isotopic trends are shown alongside annual rates of reactive N production fromagricultural fertilizer (solid red line) and NOx emissions from fossil fuel combustion (dashed red line) (51)
RESEARCH | REVIEWCorrected 8 February 2016 see full text
levels also occurred between 1950 and 1980 CE(Fig 3 A and B) culminating in values higherthan any recorded for the previous 100000 years(57) These markers are distinct from Holoceneand Late Pleistocene background levelsIndustrialmetals such as cadmium chromium
copper mercury nickel lead and zinc have beenwidely and rapidly dispersed since the mid-20thcentury although many show much earlier andmarkedly diachronous signals associated withthe expansion of mineral extraction and process-ing (47 58) An acceleration in the use of tracemetals and rare earth elements (REEs) beganafter World War II resulting in an increase inthe amountsmined a global pattern of dispersionin the environment and novel stoichiometricratios Metals and their derivatives are spreadthrough inadequate processing a lack of recy-cling and reuse or loss during everyday use Forexample platinum rhodium and palladium lostfrom automotive catalytic converters accumulatepreferentially in soils adjacent to highways (59)
Radiogenic signatures andradionuclides in sediments and ice
Potentially the most widespread and globallysynchronous anthropogenic signal is the falloutfrom nuclear weapons testing The start of theAnthropocene may thus be defined by a GlobalStandard Stratigraphic Age (GSSA) coincidingwith detonation of the Trinity atomic device atAlamogordo New Mexico on 16 July 1945 CE(10) However fallout from 1945 to 1951 CE camefrom fission devices and resulted in only localizeddeposition of radionuclides Aggregate yieldsfrom thermonuclear weapon tests that began in1952CEandpeaked in 1961minus1962CE left a clear andglobal signature concentrated in the mid-latitudesand highest in the Northern Hemisphere wheremost of the testing occurred (Fig 4B) (47 60 61)Useful potential markers include excess 14C anisotope common in nature and 239Pu a naturallyrare isotope TheHolocene segment of the IntCal13D14C curve corrected for radiogenic decay (F14C)shows past natural fluctuations and a linearnormalized decrease from 12 to ~10 during theHolocene related to changes in the 14C produc-tion rate and global carbon cycling (62) (Fig 4A)An excess of 14C forms a sharp bomb spike start-ing in 1954 (10) and peaking in 1964 CE (5) bothof which years have been suggested as potentialmarkers for the start of the Anthropocene How-ever the peak is diachronous between hemi-spheres (Fig 4B) (63) 239Pu with its long half-life(24110 years) low solubility and high particlereactivity particularly in marine sediments maybe the most suitable radioisotope for markingthe start of theAnthropocene (61 64) The appear-ance of a 239Pu fallout signature in 1951 CE peak-ing in 1963ndash1964 CE (Fig 4B) will be identifiablein sediments and ice for the next 100000 years(61 64) it will decay to a layer enriched in 235Uand ultimately stable 207Pb
Carbon cycle evidence from ice cores
Atmospheric CO2 now above 400 parts permillion (ppm) was emitted into the atmosphere
from 1999 to 2010 CE ~100 times as fast as themost rapid emission during the last glacial ter-mination (65) and concentrations have exceededHolocene levels since at least 1850 CE (Fig 5)During the Late Pleistocene to Early Holoceneatmospheric CO2 preserved in air bubbles inAntarctic glacial ice underwent a stepped 70-ppmrise over 6000 years (66 67) or an average rise of1 ppm per ~85 years Subsequent Holocene CO2
concentrations remained approximately stable(Fig 5A) CO2 concentrations showed a slightlydecreasing trend from ~11000 to 8000 yr BPThis changed to a slightly rising trend with avery slow rise of 260 to 285 ppm from ~7000 yrBP to the start of the Industrial Revolution (Fig5A) a change which has been ascribed to earlyhuman agriculture by some (3) albeit controver-sially (66) Thus theputative anthropogenic impacton atmospheric CO2 at this timewas both gradualandmuch less than subsequent changes over thepast 200 years The events at 8200 and 4200 yrBP that mark the proposed Mid- and LateHolocene sub-epochs respectively (13) are notassociated with any major change in CO2 concen-trations In sharp contrast modern rates of atmo-spheric C emission (~9Pg yearminus1) are probably thehighest of the Cenozoic era (the past 65 Ma)likely surpassing even those of the Paleocene-Eocene Thermal Maximum (68)The Antarctic ice core record shows steady
enrichment in d13C values from the Late Pleisto-cene to the Mid-Holocene time (66 67) reflectingcarbon uptake by the terrestrial biosphere andcarbon release from oceans (Fig 5A) (66) but itshows no changes at the proposedMid- and LateHolocene sub-epoch boundaries The Antarcticice record shows approximately constant CO2 and
d13C values continuing from 1200 to 1600CE (Fig5B) (69) A short-lived dip at ~1610 CE of about10ppmin theCO2 curvewith a synchronousminorenrichment in d13C has been proposed as amarkerfor the start of the Anthropocene (5) althoughthese fluctuations do not exceed natural Holocenevariability (Fig 5A) (70) The most pronouncedchange in atmospheric CO2 concentrations is the~120-ppm increase since ~1850 CE (Fig 5 B andC) (69) including a rise of ~2 ppm yearminus1 overthe past 50 years This coincides with a steep fall(gt2permil) in d13C atmospheric CO2 to ~ndash85permil (Fig5C) (69) due to an increase in 12C from burningfossil hydrocarbons This isotopic signature alsoforms part of the permanent record because it isinscribed in archives such as tree rings lime-stones and calcareous fossilsIce core records show atmospheric methane
(CH4) concentrations ranging from590 to 760partsper billion (ppb) through much of the Holocene(71ndash75) up to 1700 CE This is followed by an un-precedented increase to 1700 ppb by 2004 CE(72) some 900 ppb higher than what has beenrecorded in Antarctic ice cores at any time in thepast 800000 years (76) with levels rising aboveMid- to Late Pleistocene andHolocene maximaby ~1875 CE (Fig 5D) The d13C curve for CH4
shows a marked decrease of ~15permil from ~1500to 1700 CE perhaps in response to reduced bio-mass burning (72) and a subsequent abrupt risefrom ~1875 CE to the present of ~25permil re-flecting increasing pyrogenic emissions
Climate change and rates of sea-levelchange since the end of the last Ice Age
The proposed subdivision of the Holocene epochinto sub-epochs is based on proxy signals for
SCIENCE sciencemagorg 8 JANUARY 2016 bull VOL 351 ISSUE 6269 aad2622-5
Fig 4 Radiogenic fallout signals as a marker of the Anthropocene (A) Age-corrected atmospheric14C concentration (F14C) based on the IntCal13 curve before nuclear testing (62) (B) The atmosphericconcentration of 14C (F14C) (63) and 239+240Pu (64) radiogenic fallout from nuclear weapons testing(PBq petabecquerel) plotted against annual aggregate atmospheric weapons test yields (60)
RESEARCH | REVIEWCorrected 8 February 2016 see full text
climate change (13) Greenland ice cores showabrupt brief cooling events expressed as de-creases in d18O values at 11400 9300 and 8200 yrBP (Fig 6A) (77) the lattermost of which woulddefine the start of the proposedMiddleHolocene(13) These events are less apparent in equivalentAntarctic ice cores (Fig 6A) (78) A 4200ndashyr BPclimate shift which would mark the start of theproposed Upper Holocene (13) is not expressedin these curves The overall trend during theMid-to Late Holocene was of gradual cooling (Fig 6B)which culminated in the Little Ice Age from 1250to 1800 CE (Fig 6C) The cooling followed anorbitally related insolation decline with smallfluctuations representing changes in solar inten-sity which are controlled by modulators such asthe 208-year Suess cycle (79) Given that theorbital trend is continuing Earth should stillbe cooling However increased anthropogenicemissions of greenhouse gases have instead
caused the planet to warm abnormally fast over-riding the orbitally induced climate cycleThe shift to climate warming (Fig 6C) (80 81)
is first indicated by a slight change toward lessnegative d18O inGreenland ice starting at ~1900CE(Fig 6A) This shift is well outside the naturalenvelope of declining temperature change for thepast 1400 years (Fig 6C) mainly due to green-house gases released from burning of fossil fuelsand deforestation (79 81 82) An average globaltemperature increase of 06deg to 09degC between1906 and 2005 CE with a doubling of the rate ofwarming over the past 50 years (83) is beginningto exceed Holocene natural variability (Figs 6 BandC) in theNorthernHemisphere and is alreadyaboveHolocenemaxima in the tropics and South-ernHemisphere The change in d18O since 1900 CEin Greenland ice cores (Fig 6A) is of a smallermagnitude than that of the 8200ndashyr BP coolingevent marking the base of the proposed Middle
Holocene but it is larger than that at the base ofthe proposed Upper HoloceneAverage global sea levels are currently higher
than at any point within the past ~115000 years(84) since the termination of the last interglacialof the Pleistocene epoch The physical expressionof sea-level change in the geological record is thedisplacement of sedimentary facies for which therate of change of sea level relative to rates of sed-iment accumulation and subsidence due to com-paction is crucial For example rapid sea-level risecan cause delta tops to flood producing sharptransitions into overlying relatively deep marineand anoxic muds marking a flooding surface Bythe time of peak sea level the rate of rise is slowerand fluvial systems can resupply sediment to re-establish deltas as progradational successionsbuilding up and out from the coastVery high rates of sea-level change (gt40 mm
yearminus1) occurred at about 14000 to 14300 yr BP
aad2622-6 8 JANUARY 2016 bull VOL 351 ISSUE 6269 sciencemagorg SCIENCE
Fig 5 Perturbations of the carbon cycle evidenced by glaciochemicalCO2 and CH4 concentrations and carbon isotopic ratios (A) AtmosphericCO2 from the Antarctic Law Dome and EPICA (European Project for IceCoring in Antarctica) Dome C ice cores with observational data [from (69)and references therein] and d13C from atmospheric CO2 (66 67) (B) CO2
concentration and d13C from atmospheric CO2 from the Law Dome icecores (69) for the time interval indicated by the green rectangle in (A)
showing a 10-ppm dip in CO2 recognized as the Orbis event (5) (C) CO2
concentration and d13C from atmospheric CO2 from the Law Dome icecore firn data and air samples (69) for the time period indicated by thegreen rectangle in (B) showing inflections at ~1965 CE (D) Antarctic(squares) and Greenland (circles) ice core and firn records for CH4 con-centration and d13C for atmospheric CH4 for the past two millennia (72ndash75)(top) with Greenland ice core CH4 data for the Holocene (bottom) (71)
RESEARCH | REVIEWCorrected 8 February 2016 see full text
during the Boslashlling warming event associatedwith rapid ice sheet disintegration during thetransition between the last glacial phase and thecurrent interglacial phase (85) The high rateof rise caused widespread inundation of coastalareas and sedimentary facies back-stepped (ret-rograded landward)The past 7000 years of the Holocene epoch
when ice volumes stabilized near present-dayvalues provide the baseline for discussion of an-thropogenic contributions Relative sea-level re-cords indicate that from ~7000 to 3000 yr BPglobal mean sea level rose ~2 to 3 m to nearlypresent-day levels (84) Based on local sea-levelrecords spanning the past 2000 years there ismedium confidence that fluctuations in globalmean sea level during this interval have not ex-ceeded ~025 m on time scales of a few hundredyears As a consequence coastlines have beenmore or less fixed and sediment accumulationwithin beaches tidal flats and deltas has beenprogradationalThemost robust signal captured in saltmarsh
records from both the Northern and SouthernHemispheres supports a transition from relativelylow rates of change during the Late Holocene(lt1 mm yearminus1) to modern rates of 32 plusmn 04 mmyearminus1 from 1993 to 2010 CE (84) By combiningpaleondashsea-level records with tide gauge recordsat the same localities it is clear that sea levelbegan to rise above the LateHolocene backgroundrate between 1905 and 1945 CE (86) if continuedthis trend will lead to a return to dominantlyretrogradational shifts in sedimentary facies alongcoastal zones However reconstructions from theUS Atlantic coast suggest that the rate of sea-level rise is not linear (87) A rate of 006 to 039mmyearminus1 during the 18th century shows a changebetween 1827 and 1860 CE to a latendash19th centuryrate of 122 to 153 mm yearminus1 and a secondaryand less pronounced change from 1924 to 1943CEto a subsequent late 20th century rate of 19 to222 mm yearminus1 (87) The timing of the inflectionsin this rising sea-level curvematches with a delayof about a decade the stepped changes in CO2
concentrations (Fig 5C)Compared with other stratigraphic changes
described above the climate and sea-level signalsof theAnthropocene are not yet as strongly expres-sed in part because they reflect the combinedeffects of fast and slow climate feedback mech-anismsHowever given that anthropogenic forcingis driving these changes they are likely to exceedthe envelope of not only Holocene but Quaternarybaseline conditions (79) Projections of continuedwarming due to greenhouse gases (82) evenwith reductions below current emissions levelssuggest that by 2070 Earth will be at its hottestsince the last interglacial period ~125000 yearsago [Figure 53 in (82)]mdashand hence hotter than ithas been for most if not all of the time sincemodern humans emerged as a species 200000years agoChanges in global average surface temperature
and increases in sea level are manifestations ofchanges in the surface energy balance Perhaps amore fundamental measure of human perturba-
tion of the climate system is the human-drivenchange to the planetary energy balance at Earthrsquossurface as measured by changes in radiativeforcing Human activities primarily the burningof fossil hydrocarbons have increased the ra-diative forcing by 229 (113 to 333) W mminus2 rel-ative to 1750 CE with amore rapid increase since1970 CE than during prior decades Overwhelm-ing the natural changes in radiative forcingduring the Late Holocene (solar irradiance andvolcanic aerosols) which are estimated to be 005(000 to 010) W mminus2 (82) the anthropogenicenergy imbalance is poised to amplify strati-
graphic signals associated with warming andsea-level rise
Biotic change as an indicator ofthe Anthropocene
Most Phanerozoic time intervals are definedusingeither the first or last appearance of key fossils(29) Evolution and extinction rates are mostlytoo slow and diachronous to provide an obviousbiological marker for the start of the Anthro-pocene but important biotic change has takenplace recently (88) Although Earth still retainsmost of the species that were present at the start
SCIENCE sciencemagorg 8 JANUARY 2016 bull VOL 351 ISSUE 6269 aad2622-7
Fig 6 Climate variations during the Holocene indicated by oxygen isotopic ratios and modeledtemperature variations (A) Holocene profiles of d18O from three Greenland ice cores with threeshort-duration cooling events indicated by shading (77) shown with an Antarctic ice core profile forcomparison (EDML EPICA Dronning Maud Land Ice Core) (78) (B) Temperature reconstructions for theHolocene and global temperatures for the past 2000 years [B2K before 2000CE (81)] (C) Standardizedglobal mean temperature for the past 2000 years represented by 30-year means (80 81) showing thenatural temperature envelope for the past 2000 years [based on (79)] The Little Ice Age (LIA) and theMedieval Warm Period (MWP also known as the Medieval Climatic Anomaly) of the Northern Hemisphereare indicated
RESEARCH | REVIEWCorrected 8 February 2016 see full text
of the Holocene even conservative estimates ofextinction rates since 1500 CE are far above meanper-million-year background rates (Fig 7A) witha notable increase from the 19th century onward(89) (Fig 7B) Current trends of habitat loss andoverexploitation if maintained would push Earthinto the sixthmass extinction event (with ~75 ofspecies extinct) in the next few centuries (90) aprocess that is probably already underway (89)Irrespective of the number of extinctions spe-
cies assemblages and relative abundances havebeen altered worldwide This is especially truein recent decades because of geologically un-precedented transglobal species invasions andbiological assemblage changes associated withagriculture on land and fishing in the sea (91)The terrestrial biosphere has undergone a dra-matic modification from 1700 CE when almost50 of the global ice-free land area was wild and
only ~5 was intensively used by humans to2000 CE when the respective percentages were25 and 55 (92) The paleontological expres-sion of these assemblages will markedly differfrom the typical Holocene fossil record as recog-nizable novel biostratigraphic zones (93) andthe new assemblages of species have already per-manently reconfiguredEarthrsquosbiological trajectoryThese biotic changes are not synchronous butthey accelerated after 1500 CE on land (94) and inthe seas affecting bothmicro- andmacrobiota (52)
The case for a new epoch
The stratigraphic signatures described above(Fig 1) are either entirely novel with respect tothose found in the Holocene and preexistingepochs or quantitatively outside the range of var-iation of the proposed Holocene subdivisionsFurthermore most proximate forcings of these
signatures are currently accelerating These dis-tinctive attributes of the recent geological recordsupport the formalization of the Anthropoceneas a stratigraphic entity equivalent to otherformally defined geological epochs The bound-ary should therefore be placed following theprocedures of the International Commission onStratigraphyIf such formalization is to be achieved how-
ever further work is required First it needs tobe determined how the Anthropocene is to bedefined whether by GSSA (calendar age) GSSP[reference point in a stratal section (10)] or a com-bination of both Whichever is ultimately chosenthe location and comparative analyses of candi-date stratotype sections are necessary not leastto explore how effectively any chosen levelsmaybe traced and correlated within stratal archivesThis is linked to the question of when exactly theAnthropocenemay be determined to begin Ouranalysis is more consistent with a beginning inthemid-20th century and a number of optionshave already been suggested within that inter-val ranging from 1945 to 1964 CE (5 10) Thereis also the question which is still under debateof whether it is helpful to formalize the Anthro-pocene or better to leave it as an informal albeitsolidly founded geological time term as the Pre-cambrian and Tertiary currently are (95) This is acomplex question in part because quite unlikeother subdivisions of geological time the impli-cations of formalizing the Anthropocene reachwell beyond the geological community Not onlywould this represent the first instance of a newepoch having been witnessed firsthand by ad-vanced human societies it would be one stem-ming from the consequences of their own doing
REFERENCES AND NOTES
1 W Steffen J Grinevald P Crutzen J McNeill TheAnthropocene Conceptual and historical perspectives PhilosTrans R Soc London Ser A 369 842ndash867 (2011)doi 101098rsta20100327 pmid 21282150
2 A Malm A Hornborg The geology of mankind A critique ofthe Anthropocene narrative Anthropocene Rev 1 62ndash69(2014) doi 1011772053019613516291
3 W F Ruddiman The anthropogenic greenhouse era beganthousands of years ago Clim Change 61 261ndash293 (2003)doi 101023BCLIM000000457717928fa
4 W F Ruddiman The Anthropocene Annu Rev Earth Planet Sci41 45ndash68 (2013) doi 101146annurev-earth-050212-123944
5 S L Lewis M A Maslin Defining the Anthropocene Nature 519171ndash180 (2015) doi 101038nature14258 pmid 25762280
6 P J Crutzen Geology of mankind Nature 415 23 (2002)doi 101038415023a pmid 11780095
7 J Zalasiewicz et al Are we now living in the AnthropoceneGSA Today 18 4ndash8 (2008) doi 101130GSAT01802A1
8 W Steffen J Crutzen J R McNeill The Anthropocene Arehumans now overwhelming the great forces of nature Ambio 36614ndash621 (2007) doi 1015790044-7447(2007)36[614TAAHNO]20CO2 pmid 18240674
9 W Steffen W Broadgate L Deutsch O GaffneyC Ludwig The trajectory of the Anthropocene The GreatAcceleration Anthropocene Rev 2 81ndash98 (2015)doi 1011772053019614564785
10 J Zalasiewicz et al When did the Anthropocene begin A mid-twentieth century boundary level is stratigraphically optimalQuat Int 383 196ndash203 (2015) doi 101016jquaint201411045
11 B Pillans P Gibbard ldquoThe Quaternary Periodrdquo in The GeologicTime Scale F M Gradstein J Ogg M Schmitz G Ogg Eds(Elsevier BV 2012) pp 979ndash1010
12 J Remane et al Guidelines for the establishment of globalchronostratigraphic standards by the InternationalCommission on Stratigraphy (ICS) Episodes 19 77ndash81 (1996)
aad2622-8 8 JANUARY 2016 bull VOL 351 ISSUE 6269 sciencemagorg SCIENCE
Fig 7 Increased rates of vertebrate extinctions (A) The approximate rise in mammal extinction ratescalculated over varying time intervals as extended backward from 2010 CE (Ma millions of years ago)Lines indicate the amount by which extinction rates exceed 18 extinctions per million species years(EMSY) [see (89) sourced from (22)] (B) Cumulative vertebrate species extinctions as a percentageof total species with ranges (shaded) between conservative rates (including extinctions extinctions inthe wild and possible extinctions) and lower highly conservative rates (verified extinctions only) A back-ground rate of 20 EMSY is shown for comparison [after (89)]
RESEARCH | REVIEWCorrected 8 February 2016 see full text
13 M J C Walker et al Formal subdivision of the Holocene SeriesEpoch A discussion paper by a Working Group of INTIMATE(Integration of ice-core marine and terrestrial records) and theSubcommission on Quaternary Stratigraphy (InternationalCommission on Stratigraphy) J Quat Sci 27 649ndash659 (2012)
14 I McDougall F H Brown J G Fleagle Stratigraphicplacement and age of modern humans from Kibish EthiopiaNature 433 733ndash736 (2005) doi 101038nature03258pmid 15716951
15 ldquoPopulationrdquo History Database of the Global Environment(Netherlands Environmental Assessment Agency BilthovenNetherlands 2013) httpthemasitespblnltridionenthemasiteshydebasicdrivingfactorspopulationindex-2html
16 K Klein Goldewijk A Beusen P Janssen Long-term dynamicmodeling of global population and built-up area in a spatiallyexplicit way HYDE 31 Holocene 20 565ndash573 (2010)doi 1011770959683609356587
17 A D Barnosky et al Prelude to the Anthropocene Two newNorth American Land Mammal Ages (NALMAs) AnthropoceneRev 1 225ndash242 (2014) doi 1011772053019614547433
18 C N Waters J A Zalasiewicz M Williams M A EllisA M Snelling ldquoA stratigraphical basis for the Anthropocenerdquoin A Stratigraphical Basis for the Anthropocene C N WatersJ A Zalasiewicz M Williams M A Ellis A M Snelling Eds(Geological Society London 2014) pp 1ndash21
19 J R Ford S J Price A H Cooper C N Waters ldquoAnassessment of lithostratigraphy for anthropogenic depositsrdquo inA Stratigraphical Basis for the Anthropocene C N WatersJ A Zalasiewicz M Williams M A Ellis A M Snelling Eds(Geological Society London 2014) pp 55ndash89
20 J Zalasiewicz R Kryza M Williams ldquoThe mineral signature of theAnthropocenerdquo in A Stratigraphical Basis for the AnthropoceneC N Waters J A Zalasiewicz M Williams M A Ellis A M SnellingEds (Geological Society London 2014) pp 109ndash117
21 M Edgeworth et al Diachronous beginnings of theAnthropocene The lower bounding surface of anthropogenicdeposits Anthropocene Rev 2 33ndash58 (2015)doi 1011772053019614565394
22 J Zalasiewicz M Williams C N Waters A D Barnosky P HaffldquoAnthropocenerdquo in Origins O Seberg D A Harper Eds(Cambridge Univ Press in press)
23 US Geological Survey in Historical Statistics for Mineral andMaterial Commodities in the United States T D KellyG R Matos Eds (US Geological Survey Data Series 140US Geological Survey 2010) httpmineralsusgsgovmineralspubshistorical-statisticscement-usepdf
24 Plastics ndash the Facts 2013 An Analysis of European LatestPlastics Production Demand and Waste Data (PlasticsEurope2013) wwwplasticseuropeorgdocumentsdocument20131014095824-final_plastics_the_facts_2013_published_october2013pdf
25 P L Corcoran Benthic plastic debris in marine and fresh waterenvironments Environ Sci Processes Impacts 17 1363ndash1369(2015) doi 101039C5EM00188A pmid 26129903
26 R C Thompson et al Lost at sea Where is all the plasticScience 304 838 (2004) doi 101126science1094559pmid 15131299
27 J R Jambeck et al Plastic waste inputs from land into theocean Science 347 768ndash771 (2015)doi 101126science1260352 pmid 25678662
28 J Zalasiewicz M Williams C N Waters A D BarnoskyP Haff The technofossil record of humans Anthropocene Rev1 34ndash43 (2014) doi 1011772053019613514953
29 A G Smith T Barry P Bown J Cope A Gale P L GibbardJ Gregory M Hounslow D Kemp R Knox J MarshallM Oates P Rawson J Powell C Waters ldquoGSSPs globalstratigraphy and correlationrdquo in Strata and Time Probing theGaps in Our Understanding D G Smith R J BaileyP M Burgess A J Fraser Eds (Special Publication 404Geological Society London 2014) pp 37ndash67
30 T Novakov et al Large historical changes of fossil-fuel blackcarbon aerosols Geophys Res Lett 30 1324 (2003)doi 1010292002GL016345
31 F Oldfield Can the magnetic signatures from inorganic fly ashbe used to mark the onset of the Anthropocene AnthropoceneRev 2 3ndash13 (2015) doi 1011772053019614534402
32 N L Rose Spheroidal carbonaceous fly ash particles provide aglobally synchronous stratigraphic marker for theAnthropocene Environ Sci Technol 49 4155ndash4162 (2015)doi 101021acsest5b00543 pmid 25790111
33 G T Swindles et al Spheroidal carbonaceous particles are adefining stratigraphic marker for the Anthropocene Sci Rep5 10264 (2015) doi 101038srep10264 pmid 26020614
34 M C Harvey S C Brassell C M Belcher A MontanariCombustion of fossil organic matter at the Cretaceous-Paleogene (K-P) boundary Geology 36 355ndash358 (2008)doi 101130G24646A1
35 R LeB Hooke J F Martiacuten-Duque Land transformation byhumans A review GSA Today 22 4ndash10 (2012)
36 J Zalasiewicz M Williams C N Waters ldquoCan an AnthropoceneSeries be defined and recognizedrdquo in A Stratigraphical Basisfor the Anthropocene C N Waters J A ZalasiewiczM Williams M A Ellis A M Snelling Eds (Geological SocietyLondon 2014) pp 39ndash53
37 J Zalasiewicz C N Waters M Williams Human bioturbation andthe subterranean landscape of the Anthropocene Anthropocene6 3ndash9 (2014) doi 101016jancene201407002
38 I Douglas N Lawson The human dimensions ofgeomorphological work in Britain J Ind Ecol 4 9ndash33 (2000)doi 101162108819800569771
39 E C Ellis Anthropogenic transformation of the terrestrialbiosphere Philos Trans R Soc London Ser A 369 1010ndash1035(2011) doi 101098rsta20100331 pmid 21282158
40 A Brown P Toms C Carey E Rhodes Geomorphology of theAnthropocene Time-transgressive discontinuities of human-induced alluviation Anthropocene 1 3ndash13 (2013)doi 101016jancene201306002
41 P Meyfroidt E F Lambin Global forest transition Prospectsfor an end to deforestation Annu Rev Environ Resour 36343ndash371 (2011) doi 101146annurev-environ-090710-143732
42 R C Sidle A D Ziegler The dilemma of mountain roads NatGeosci 5 437ndash438 (2012) doi 101038ngeo1512
43 J P M Syvitski A Kettner Sediment flux and theAnthropocene Philos Trans R Soc London Ser A 369957ndash975 (2011) doi 101098rsta20100329 pmid 21282156
44 C K Paull W Ussler III P J Mitts D W Caress G J WestDiscordant 14C-stratigraphies in upper Monterey Canyon Asignal of anthropogenic disturbance Mar Geol 233 21ndash36(2006) doi 101016jmargeo200607008
45 C H Vane et al Chemical signatures of the Anthropocene inthe Clyde estuary UK Sediment-hosted Pb 207206Pb totalpetroleum hydrocarbon polyaromatic hydrocarbon andpolychlorinated biphenyl pollution records Philos Trans RSoc London Ser A 369 1085ndash1111 (2011)doi 101098rsta20100298 pmid 21282161
46 D C G Muir N L Rose ldquoPersistent organic pollutants in thesediments of Lochnagarrdquo in Lochnagar The Natural History of aMountain Lake N L Rose Ed (Springer Dordrecht Germany2007) pp 375ndash402
47 J R Dean M J Leng A W Mackay Is there an isotopicsignature of the Anthropocene Anthropocene Rev 1 276ndash287(2014) doi 1011772053019614541631
48 D E Canfield A N Glazer P G Falkowski The evolution andfuture of Earthrsquos nitrogen cycle Science 330 192ndash196 (2010)doi 101126science1186120 pmid 20929768
49 S R Carpenter E M Bennett Reconsideration of theplanetary boundary for phosphorus Environ Res Lett 6014009 (2011) doi 1010881748-932661014009
50 J N Galloway et al Transformation of the nitrogen cycle Recenttrends questions and potential solutions Science 320 889ndash892(2008) doi 101126science1136674 pmid 18487183
51 E A Holland J Lee-Taylor C Nevison J Sulzman Global NCycle Fluxes and N2O Mixing Ratios Originating from HumanActivity Data Set (Oak Ridge National Laboratory DistributedActive Archive Center Oak Ridge TN 2005) httpdaacornlgovcgi-bindsviewerplds_id=797
52 I P Wilkinson C Poirier M J Head C D Sayer J TibbyldquoMicrobiotic signatures of the Anthropocene in marginalmarine and freshwater palaeoenvironmentsrdquo in AStratigraphical Basis for the Anthropocene C N WatersJ A Zalasiewicz M Williams M A Ellis A M Snelling Eds(Geological Society London 2014) pp 185ndash219
53 G W Holtgrieve et al A coherent signature of anthropogenicnitrogen deposition to remote watersheds of the NorthernHemisphere Science 334 1545ndash1548 (2011) doi 101126science1212267 pmid 22174250
54 A P Wolfe et al Stratigraphic expressions of the HolocenendashAnthropocene transition revealed in sediments from remotelakes Earth Sci Rev 116 17ndash34 (2013)doi 101016jearscirev201211001
55 M G Hastings D M Sigman E J Steig Glacialinterglacialchanges in the isotopes of nitrate from the Greenland IceSheet Project 2 (GISP2) ice core Global Biogeochem Cycles19 GB4024 (2005) doi 1010292005GB002502
56 M G Hastings J C Jarvis E J Steig Anthropogenic impactson nitrogen isotopes of ice-core nitrate Science 324 1288(2009) doi 101126science1170510 pmid 19498161
57 E W Wolff ldquoIce sheets and the Anthropocenerdquo in AStratigraphical Basis for the Anthropocene C N WatersJ A Zalasiewicz M Williams M A Ellis A M Snelling Eds(Geological Society London 2014) pp 255ndash263
58 A Gałuszka Z M Migaszewski J Zalasiewicz ldquoAssessing theAnthropocene with geochemical methodsrdquo in A StratigraphicalBasis for the Anthropocene C N Waters J A ZalasiewiczM Williams M A Ellis A M Snelling Eds (Geological SocietyLondon 2014) pp 221ndash238
59 K E Jarvis S J Parry J M Piper Temporal and spatialstudies of autocatalyst-derived platinum rhodium andpalladium and selected vehicle-derived trace elements in theenvironment Environ Sci Technol 35 1031ndash1036 (2001)doi 101021es0001512 pmid 11347910
60 UNSCEAR-United Nations Scientific Committee on the Effectsof Atomic Radiation Sources and Effects of Ionizing Radiation(United Nations New York 2000)
61 C N Waters et al Can nuclear weapons fallout mark thebeginning of the Anthropocene Epoch Bull Atom Sci 7146ndash57 (2015) doi 1011770096340215581357
62 P J Reimer et al IntCal13 and Marine13 radiocarbon agecalibration curves 0ndash50000 years cal BP Radiocarbon 551869ndash1887 (2013) doi 102458azu_js_rc5516947
63 Q Hua M Barbetti A Z Rakowski Atmospheric radiocarbonfor the period 1950minus2010 Radiocarbon 55 2059ndash2072 (2013)doi 102458azu_js_rcv55i216177
64 G J Hancock S G Tims L K Fifield I T Webster ldquoTherelease and persistence of radioactive anthropogenic nuclidesrdquoin A Stratigraphical Basis for the Anthropocene C N WatersJ A Zalasiewicz M Williams M A Ellis A M Snelling Eds(Geological Society London 2014) pp 265ndash281
65 E W Wolff Greenhouse gases in the Earth system Apalaeoclimate perspective Philos Trans R Soc London Ser A369 2133ndash2147 (2011) doi 101098rsta20100225pmid 21502180
66 J Elsig et al Stable isotope constraints on Holocene carboncycle changes from an Antarctic ice core Nature 461 507ndash510(2009) doi 101038nature08393 pmid 19779448
67 J Schmitt et al Carbon isotope constraints on the deglacialCO₂ rise from ice cores Science 336 711ndash714 (2012)doi 101126science1217161 pmid 22461496
68 Y Cui et al Slow release of fossil carbon during thePalaeocenendashEocene Thermal Maximum Nat Geosci 4481ndash485 (2011) doi 101038ngeo1179
69 M Rubino et al A revised 1000 year atmospheric d13C-CO2
record from Law Dome and South Pole Antarctica J GeophysRes 118 8482ndash8499 (2013)
70 J Zalasiewicz et al Colonization of the Americas lsquoLittle IceAgersquo climate and bomb-produced carbon Their role in definingthe Anthropocene Anthropocene Rev 2 117ndash127 (2015)doi 1011772053019615587056
71 T Blunier J Chappellaz J Schwander B Stauffer D RaynaudVariations in atmospheric methane concentration during theHolocene epoch Nature 374 46ndash49 (1995) doi 101038374046a0
72 D F Ferretti et al Unexpected changes to the global methanebudget over the past 2000 years Science 309 1714ndash1717(2005) doi 101126science1115193 pmid 16151008
73 C MacFarling Meure et al Law Dome CO2 CH4 and N2O icecore records extended to 2000 years BP Geophys Res Lett33 L14810 (2006) doi 1010292006GL026152
74 C J Sapart et al Natural and anthropogenic variations inmethane sources during the past two millennia Nature 49085ndash88 (2012) doi 101038nature11461 pmid 23038470
75 L Mitchell E Brook J E Lee C Buizert T SowersConstraints on the late Holocene anthropogenic contribution tothe atmospheric methane budget Science 342 964ndash966(2013) doi 101126science1238920 pmid 24264988
76 L Loulergue et al EPICA Dome C Ice Core 800 KYyr MethaneData IGBP PAGES World Data Center for PaleoclimatologyData Contribution Series 2008-054 (National Oceanic andAtmospheric AdministrationNational Climatic Data CenterPaleoclimatology Program Boulder CO 2008) httpcdiacornlgovtrendsatm_methice_core_methanehtml
77 B M Vinther et al A synchronized dating of three Greenlandice cores throughout the Holocene J Geophys Res 111D13102 (2006) doi 1010292005JD006921
78 T Felis et al Pronounced interannual variability in tropicalSouth Pacific temperatures during Heinrich Stadial 1 NatCommun 3 965 (2012) pmid 22828625
79 C P Summerhayes Earths Climate Evolution (Wiley-Blackwell2015)
SCIENCE sciencemagorg 8 JANUARY 2016 bull VOL 351 ISSUE 6269 aad2622-9
RESEARCH | REVIEWCorrected 8 February 2016 see full text
80 M Ahmed et al Continental-scale temperature variabilityduring the past two millennia Nat Geosci 6 339ndash346 (2013)doi 101038ngeo1797
81 H Wanner L Mercolli M Grosjean S P Ritz Holoceneclimate variability and change a data-based review J GeolSoc London 172 254ndash263 (2015) doi 101144jgs2013-101
82 IPCC Climate Change 2013 The Physical Science BasisContribution of Working Group I to the Fifth Assessment Reportof the Intergovernmental Panel on Climate Change T F Stockeret al Eds (Cambridge Univ Press 2013)
83 J R Hansen R Ruedy M Sato K Lo Global surfacetemperature change Rev Geophys 48 RG4004 (2010)doi 1010292010RG000345
84 J A Church P U Clark A Cazenave J M Gregory S JevrejevaA Levermann M A Merrifield G A Milne R S Nerem P D NunnA J Payne W T Pfeffer D Stammer A S Unnikrishnan ldquoSea levelchangerdquo in Climate Change 2013 The Physical Science BasisContribution of Working Group I to the Fifth Assessment Report ofthe Intergovernmental Panel on Climate Change T F Stocker et alEds (Cambridge Univ Press 2013) pp 1137ndash1216
85 P Deschamps et al Ice-sheet collapse and sea-level rise at theBoslashlling warming 14600 years ago Nature 483 559ndash564(2012) doi 101038nature10902 pmid 22460900
86 R Gehrels P L Woodworth When did modern rates of sea-level rise start Global Planet Change 100 263ndash277 (2013)doi 101016jgloplacha201210020
87 A C Kemp et al Relative sea-level change in Connecticut(USA) during the last 2200 yrs Earth Planet Sci Lett 428217ndash229 (2015) doi 101016jepsl201507034
88 A D Barnosky ldquoPalaeontological evidence for defining theAnthropocenerdquo in A Stratigraphical Basis for the AnthropoceneC N Waters J A Zalasiewicz M Williams M A Ellis A M SnellingEds (Geological Society London 2014) pp 149ndash165
89 G Ceballos et al Accelerated modern human-induced specieslosses Entering the sixth mass extinction Sci Adv 1e1400253 (2015) doi 101126sciadv1400253 pmid 26601195
90 A D Barnosky N Matzke S Tomiya G O U Wogan B SwartzT B Quental C Marshall J L McGuire E L LindseyK C Maguire B Mersey E A Ferrer Has the Earthrsquos sixth massextinction already arrived Nature 471 51ndash57 (2011) doi 101038nature09678
91 M Williams et al The Anthropocene biosphere AnthropoceneRev 2 196ndash219 (2015) doi 1011772053019615591020
92 E C Ellis K K Goldewijk S Siebert D LightmanN Ramankutty Anthropogenic transformation of the biomes1700 to 2000 Glob Ecol Biogeogr 19 589ndash606 (2010)
93 S M Kidwell Biology in the Anthropocene Challenges andinsights from young fossil records Proc Natl Acad Sci USA112 4922ndash4929 (2015) doi 101073pnas1403660112pmid 25901315
94 J R McNeill ldquoBiological exchanges in world historyrdquo in TheOxford Handbook of World History J Bentley Ed (Oxford UnivPress 2011) pp 325ndash342
95 W F Ruddiman E C Ellis J O Kaplan D Q Fuller Definingthe epoch we live in Science 348 38ndash39 (2015) doi 101126scienceaaa7297 pmid 25838365
ACKNOWLEDGMENTS
CW and ME publish with the permission of the Executive DirectorBritish Geological Survey Natural Environment Research Councilthe former is funded by the British Geological Surveyrsquos EngineeringGeology program We thank three referees along with I FairchildI Hajdas and S Price for their comments This paper is a contributionof the AnthropoceneWorking Group (AWG) part of the Subcommissionon Quaternary Stratigraphy of the International Commission onStratigraphy The AWG receives no direct funding to carry out itsresearch and the authors declare no competing financial interests
101126scienceaad2622
aad2622-10 8 JANUARY 2016 bull VOL 351 ISSUE 6269 sciencemagorg SCIENCE
RESEARCH | REVIEWCorrected 8 February 2016 see full text
DOI 101126scienceaad2622 (2016)351 Science
et alColin N Watersthe HoloceneThe Anthropocene is functionally and stratigraphically distinct from
This copy is for your personal non-commercial use only
clicking herecolleagues clients or customers by you can order high-quality copies for yourIf you wish to distribute this article to others
herefollowing the guidelines
can be obtained byPermission to republish or repurpose articles or portions of articles
) February 17 2016 wwwsciencemagorg (this information is current as of
The following resources related to this article are available online at
content3516269aad2622fullhtmlversion of this article at
including high-resolution figures can be found in the onlineUpdated information and services
content3516269aad2622fullhtmlref-list-1 29 of which can be accessed freecites 72 articlesThis article
cgicollectiongeochem_physGeochemistry Geophysics
subject collectionsThis article appears in the following
registered trademark of AAAS is aScience2016 by the American Association for the Advancement of Science all rights reserved The title
CopyrightAmerican Association for the Advancement of Science 1200 New York Avenue NW Washington DC 20005 (print ISSN 0036-8075 online ISSN 1095-9203) is published weekly except the last week in December by theScience
on F
ebru
ary
17 2
016
Dow
nloa
ded
from
REVIEW
EARTH HISTORY
The Anthropocene is functionallyand stratigraphically distinct fromthe HoloceneColin N Waters1 Jan Zalasiewicz2 Colin Summerhayes3 Anthony D Barnosky4
Cleacutement Poirier5 Agnieszka Gałuszka6 Alejandro Cearreta7 Matt Edgeworth8
Erle C Ellis9 Michael Ellis1 Catherine Jeandel10 Reinhold Leinfelder11
J R McNeill12 Daniel deB Richter13 Will Steffen14 James Syvitski15 Davor Vidas16
Michael Wagreich17 Mark Williams2 An Zhisheng18 Jacques Grinevald19
Eric Odada20 Naomi Oreskes21 Alexander P Wolfe22
Human activity is leaving a pervasive and persistent signature on Earth Vigorous debatecontinues about whether this warrants recognition as a new geologic time unit known asthe Anthropocene We review anthropogenic markers of functional changes in the Earthsystem through the stratigraphic record The appearance of manufactured materials insediments including aluminum plastics and concrete coincides with global spikes infallout radionuclides and particulates from fossil fuel combustion Carbon nitrogen andphosphorus cycles have been substantially modified over the past century Rates ofsea-level rise and the extent of human perturbation of the climate system exceed LateHolocene changes Biotic changes include species invasions worldwide and acceleratingrates of extinction These combined signals render the Anthropocene stratigraphicallydistinct from the Holocene and earlier epochs
The term ldquoAnthropocenerdquo is currently usedinformally to encompass different geologi-cal ecological sociological and anthropo-logical changes in recent Earth history Theorigins of the concept of the Anthropocene
its terminology and its sociopolitical implica-tions arewidely discussed (1 2)When consideringthe stratigraphic definition of the Anthropocenethere are two basic questions Have humanschanged the Earth system to such an extent thatrecent and currently forming geological depositsinclude a signature that is distinct from those ofthe Holocene and earlier epochs which will re-main in the geological record If so when didthis stratigraphic signal (not necessarily the firstdetectable anthropogenic change) become recog-nizable worldwide These questions are consid-ered here in the context of how stratigraphicunits have been formally recognized earlier in theQuaternary periodProposals for marking the start of the Anthro-
pocene have included (i) an ldquoearly Anthropocenerdquoassociated with the advent of agriculture animaldomestication extensive deforestation and grad-ual increases in atmospheric carbon dioxide (CO2)andmethane (CH4) levels thousands of years ago(3 4) (ii) the Columbian Exchange of OldWorldand New World species associated with coloni-zation of the Americas (5) (iii) the beginning ofthe Industrial Revolution at ~1800 CE (6 7) and(iv) the mid-20th century ldquoGreat Accelerationrdquo ofpopulation growth industrialization and min-eral and energy use (8ndash10)
Here we review several lines of evidence sug-gesting that the Anthropocenersquos stratigraphic sig-natures distinguish it from theHolocene (Fig 1)We find that criteria available to recognize theAnthropocene are consistent with those used todefine other Quaternary stratigraphic units Ear-lierQuaternary time-unit subdivisions are definedby signals fromcyclical forcings of climate changesuch as variation in Earthrsquos orbit or solar ir-radiance and irregular events such as volcaniceruptions Although these forcings continue theAnthropocene markers reflect an additional keydriver that of human modification of globalenvironments at unprecedented rates Thisdriver has produced a wide range of anthropo-genic stratigraphic signals (Fig 1) includingexamples that are novel in Earth history that areglobal in extent and that offer fine temporalresolution The signals vary in their develop-ment Some are already advanced and othersare at early stages We describe these signals andsuggest how theymay be used in the stratigraphiccharacterization and correlation of a formalizedAnthropocene epochwith a lower boundary (stillto be identified) potentially placed in the mid-20th century
How are Quaternary stratigraphicunits defined
The Quaternary period which began 26 millionyears ago (Ma) is subdivided into geochronologicaltime units (epochs and ages) with boundaries thatare linked at least in part to climate change events
(expressed asmarine isotope stages) in associationwith paleomagnetic reversals (11) This contrastswith the subdivision of most of the Phanerozoiceon (the past ~541 plusmn 1 Ma) for which the first orlast appearance of key fossil taxa is typically usedtodefine timeunits Fossil-basedboundaries repre-sent changeat rates too slowand time-transgressivefor the geologically recent past in which the timeunits are of comparatively short duration (about12000 years for the Holocene versus 2 millionyears or more for earlier epochs) These time in-tervals are recognizable in the geologic recordas chronostratigraphic units (series and stages)which in contrast to the time units are physicalentities including rocks sediments and glacierice Ideally a chronostratigraphic unit is exempli-fied and its lower boundary defined at a singlelocality termed the Global Boundary StratotypeSection and Point (GSSP) which is typically inmarine strata for pre-Holocene series (12)The start of the Holocene epoch (or series) is
based on the termination of the transition fromthe last glacial phase into an interval of warmingaccompanied by ~120mof sea-level rise Thewarm-ing took place over about 1600 years and isrecorded by a variety of stratigraphic signals thatare not all globally synchronous In the NorthernHemisphere the signal for theHolocenersquosbeginning
RESEARCH
SCIENCE sciencemagorg 8 JANUARY 2016 bull VOL 351 ISSUE 6269 aad2622-1
1British Geological Survey Keyworth Nottingham NG12 5GGUK 2Department of Geology University of LeicesterUniversity Road Leicester LE1 7RH UK 3Scott PolarResearch Institute Cambridge University Lensfield RoadCambridge CB2 1ER UK 4Department of Integrative BiologyMuseum of Paleontology and Museum of VertebrateZoology University of CaliforniandashBerkeley Berkeley CA94720 USA 5Morphodynamique Continentale et CocirctiegravereUniversiteacute de Caen Normandie Centre National de laRecherche Scientifique (CNRS) 24 Rue des Tilleuls F-14000Caen France 6Geochemistry and the Environment DivisionInstitute of Chemistry Jan Kochanowski University 15GŚwiętokrzyska Street 25-406 Kielce Poland 7Departamentode Estratigrafiacutea y Paleontologiacutea Facultad de Ciencia yTecnologiacutea Universidad del Paiacutes VascoEuskal HerrikoUnibertsitatea Apartado 644 48080 Bilbao Spain 8Schoolof Archaeology and Ancient History University of LeicesterUniversity Road Leicester LE1 7RH UK 9Department ofGeography and Environmental Systems University ofMarylandndashBaltimore County Baltimore MD 21250 USA10Laboratoire drsquoEtudes en Geacuteophysique et OceacuteanographieSpatiales (CNRS Centre National dEacutetudes Spatiales Institutde Recherche pour le Deacuteveloppement Universiteacute PaulSabatier) 14 Avenue Edouard Belin 31400 Toulouse France11Department of Geological Sciences Freie Universitaumlt BerlinMalteserstraszlige 74-100D 12249 Berlin Germany12Georgetown University Washington DC USA 13NicholasSchool of the Environment Duke University Box 90233Durham NC 27516 USA 14The Australian NationalUniversity Canberra Australian Capital Territory 0200Australia 15Department of Geological Sciences University ofColoradondashBoulder Box 545 Boulder CO 80309-0545 USA16Marine Affairs and Law of the Sea Programme The FridtjofNansen Institute Lysaker Norway 17Department ofGeodynamics and Sedimentology University of Vienna A-1090 Vienna Austria 18State Key Laboratory of Loess andQuaternary Geology Institute of Earth Environment ChineseAcademy of Sciences Xian 710061 Beijing NormalUniversity Beijing 100875 China 19Institut de Hautes EacutetudesInternationales et du Deacuteveloppement Chemin Eugegravene Rigot2 1211 Genegraveve 11 Switzerland 20Department of GeologyUniversity of Nairobi Nairobi Kenya 21Department of theHistory of Science Harvard University Cambridge MA02138 USA 22Department of Biological Sciences Universityof Alberta Edmonton Alberta T6G 2E9 CanadaCorresponding author E-mail cnwbgsacuk
Corrected 8 February 2016 see full text
was taken as the abrupt end of the Younger Dryascooling event TheGSSP chosen to define the baseof the Holocene was agreed to lie within theNGRIP2 ice core from central Greenland (NGRIPNorth Greenland Ice Core Project) (13) The corecontains a detailed archive of environmentalchange preserved in the composition of air bub-bles trapped in the ice and in the chemical andphysical characteristics of the ice The GSSP lieswithin amultidecade warming andmoisteningtrend which is inferred from oxygen isotopesshowing rising d18O associated with a reductionin dust content Aboutmidway through this trendthe sharpest change is a decrease in excess deu-terium which is interpreted as representing a re-organization of North Atlantic ocean-atmospherecirculation at 11700 years before the year 2000 CEplusmn 99 years at 2s (13) This distinctive change isused to define the base of the Holocene series(the material chronostratigraphic unit) Thus
by definition the Holocene epoch (the abstracttime unit) began ~11700 years agoTheHolocene epoch (and corresponding series)
is being considered for subdivision into threecomponent sub-epochs (subseries) again usingclimatic signatures to guide the positioning oftheir bases The base of the Lower Holocene bydefault would be the base of theHolocene seriesas described above The base of the Middle Hol-ocene has been proposed to lie within a short-lived (150 plusmn 30 years) cooling event at 8200 yearsbefore the present (yr BP) where there is amarked shift to lower 18O16O values (more neg-ative d18O values) within the NGRIP1 ice core inthe Greenland Ice Sheet (13) Within the samenarrow interval of timeGreenland ice cores showlow deuteriumhydrogen (DH) ratios a declinein annual layer thickness an atmospheric CH4
minimum and a volcanic marker characterizedby high fluoride content Such signals have led
to the proposal that a Greenland ice core shouldbe used to define theMiddle Holocene GSSP (13)Although such signals are most strongly evidentat localities adjacent to the North Atlantic theyprobably make up part of a global signaturebecause correlative signals are evident in lakesediments as changes in pollen assemblages andoxygen isotopes in cave speleothems as isotopicsignals reflecting changes in the intensity of theSouth American monsoon in marine foraminif-eral assemblages (species compositions) and inincreased aridification around theMediterraneanthat broadly coincideswith theMesolithic-Neolithictransition (13)The base of the Upper Holocene has been
proposed to lie at amid- and low-latitude aridifi-cation event at 4200 yr BP (13) This event ap-pears to have coincided with cooling of the NorthAtlantic and tropical Pacific the arrival of coolerand wetter conditions in Europe and a weaken-ing of the Asian monsoon (13) The proposedstratotype is in a speleothem record from Mawm-luh Cave in northeast India at the midpoint of atwo-stage shift of d18O values in calcite from morepositive starting at 4300 yr BP to more nega-tive starting at 4100 yr BP (13) Although thereis no doubt that marked environmental per-turbations occurred at both 8200 and 4200 yrBP most proxies indicate subsequent recov-ery in a matter of centuries implying that thesewere temporally discrete paleoclimatic events asopposed to truly novel states within the Earthsystem
Human drivers ofstratigraphic signatures
The driving human forces responsible for manyof the anthropogenic signatures are a product ofthe three linked force multipliers acceleratedtechnological development rapid growth of thehuman population and increased consumptionof resources These have combined to result inincreased use ofmetals andminerals fossil fuelsand agricultural fertilizers and increased trans-formation of land and nearshore marine ecosys-tems for human use The net effect has been aloss of natural biomes to agriculture cities roadsand other human constructs and the replacementof wild animals and plants by domesticated spe-cies to meet growing demands for food Thisincrease in consumption of natural resources isclosely linked to the growth of the human popula-tion AnatomicallymodernHomo sapiens emerged~200000 years ago (14) By 12000 yr BP aroundthe start of the Holocene humans had colonizedall of the continents except Antarctica and theSouth Pacific islands and had reached a totalpopulation estimated at 2million (15 16) Up tothis point human influence on the Earth systemwas small relative to what has happened sincethe mid-20th century even so human impactscontributed to the extinction of Pleistocene me-gafauna (17) However the key signals used torecognize the start of the Holocene epoch werenot directly influenced by human forcing whichis a major distinction from the proposed Anthro-pocene epoch
aad2622-2 8 JANUARY 2016 bull VOL 351 ISSUE 6269 sciencemagorg SCIENCE
-1
Fig 1 Summary of the magnitude of key markers of anthropogenic change that are indicative ofthe Anthropocene (A) Novel markers such as concrete plastics global black carbon and plutonium(Pu) fallout shown with radiocarbon (14C) concentration (B) Long-ranging signals such as nitrates(NO3
ndash) CO2 CH4 and global temperatures which remain at relatively low values before 1950 rapidlyrise during the mid-20th century and by the late 20th century exceed Holocene ranges
RESEARCH | REVIEWCorrected 8 February 2016 see full text
Humans had a growing stratigraphic influencethroughout the Holocene epoch as the global pop-ulation gradually increased It has been arguedthat ~8000 years ago with a global populationestimated at less than 18 million (15 16) the ini-tiation of agricultural practices and forest clear-ances began to gradually increase atmosphericCO2 levels (3) But it was not until ~1800 CE thatthe global population first reached 1 billion (16)Increased mechanization and the drive to urban-ization during the Industrial Revolution initiallyinWestern Europe and eventuallyworldwide (18)then facilitated amore rapid population increaseAlthough this population growth is commonlythought to have increased exponentially throughthe 19th and 20th centuries (8 9) recent analy-ses (15 16) suggest that it can be differentiatedinto a period of relatively slower growth from1750 to 1940 CE and one of more rapid growthfrom 1950 to 2010 CE The inflection point at~1950 CE coincides with the Great Accelera-tion (8 9) a prominent rise in economic activityand resource consumption that accounts forthe marked mid-20th century upturns in orinceptions of the anthropogenic signals detailedbelow
New anthropogenic materials
Recent anthropogenic deposits which are theproducts ofmining waste disposal (landfill) con-struction andurbanization (19) contain thegreatestexpansion of newminerals since theGreatOxygen-ation Event at 2400Ma (20) and are accompaniedbymany new forms of ldquorockrdquo in the broad senseof geological materials with the potential for long-term persistence Overmanymillennia humanshave manufactured materials previously unknownonEarth such as pottery glass bricks and copperalloys Remains of thesematerials are present asa persistent andwidespread geological signal thatis markedly time-transgressive reflecting themi-gration of peoples (21) In contrast elemental alu-minum which was almost unknown in nativeform before the 19th century has seen 98 of itscumulative global production of ~500 Tg since1950 CE (Fig 2A) (20 22) Concrete which wasinvented by the Romans became the primarybuilding material fromWorld War II (1939ndash1945CE) onward The past 20 years (1995ndash2015) ac-count for more than half of the 500000 Tg ofconcrete ever produced (22 23) (Fig 2A) equiv-alent to ~1 kg mminus2 of the planet surface Concreteand aluminum are widely disseminated acrossterrestrial particularly urban settingsSimilarly themanufacture of new organic poly-
mers (plastics) which were initially developed inthe early 1900s rapidly grew from the 1950s toan annual production of about ~300 Tg in 2013(24) (Fig 2A) comparable to the present humanbiomass Plastics spread rapidly via rivers intolakes and they are now also widespread in bothshallow- and deep-water marine sediments asmacroscopic fragments and as virtually ubiqui-tous microplastic particles (microbeads ldquonurdlesrdquoand fibers) (Fig 2A) (25ndash27) which are dispersedby both physical and biological processes Thedecay resistance and chemistry of most plastics
suggest that they will leave identifiable fossil andgeochemical recordsThese and other new materials are commonly
shaped into abundant artifacts with the capacityto be preserved in and to help date future geo-logical deposits Analogous to biotic fossil re-mains these so-called technofossils (28) provideannual to decadal stratigraphic resolution (19 22)mdashfar greater than what can be obtained from thefirst and last appearances of fossil taxa whichhave traditionally been the most common meansof correlating stratal sections (29)Fossil fuel combustion disseminates unburned
particles as black carbon inorganic ash spheres(IASs) and spherical carbonaceous particles (SCPs)Black carbon increasedmarkedly toward the endof the 19th century and especially after ~1970CE with a peak at 67 Tg yearminus1 in ~1990 CE (Fig2B) (30) IASs which are locally detectable in thestratigraphic record starting in the 16th centuryincreased across Britain Scandinavia and NorthAmerica from ~1835 to 1960 CE (31) SCPs which
were first recorded at various sites in the UK from1830 to 1860 CE show a near-synchronous globalincrease around 1950 CE with peak signaturesfrom the 1960s to the 1990s (Fig 2B) (32 33)Black carbon IASs and SCPs being airborne par-ticulates leave a permanentmarker within bothsediments and glacial ice An ancient analog is themarker horizon of carbon impact spherules at theCretaceous-Paleogeneboundarywhichwas createdby the Chicxulub bolide impact (34) These low-temperature natural spherules which are readilydistinguishable from high-temperature industrialSCPs demonstrate the likely persistence of SCPsas a stratigraphic marker (32)
Modification of sedimentary processes
The transformation of more than 50 of Earthrsquosland surface for human use (35) has generatedanthropogenically modified materials that extendacrossmultiple terrestrial settings They aremostubiquitous in anthropogenic (artificial) depositssuchas landfills urbanstructures andmine tailings
SCIENCE sciencemagorg 8 JANUARY 2016 bull VOL 351 ISSUE 6269 aad2622-3
Fig 2 The production of selected new anthropogenic materials (A) Cumulative growth of manu-factured aluminum in the surface environment [adapted from data in (23) assuming a recycling rate of50] cumulative growth of production of concrete assuming that most cement goes into concrete andthat ~15 of average concrete mass is cement [from (22) derived from US Geological Survey globalcement production statistics] annual growth of plastics production [from (24)] and synthetic fibersproduction [from (26)] (B) Global midndash20th century rise and latendash20th century spike in SPCs normalizedto the peak value in each lake core [modified from (32)] and global black carbon from available annualfossil fuel consumption data for 1875ndash1999 CE (30) Numbers of lake cores for each region are indicated
RESEARCH | REVIEWCorrected 8 February 2016 see full text
in addition to soils associated with cultivation Thisinfluence is increasingly extending into theoceans both directly through coastal reclamationworks sediment reworking by trawler fishingand the extraction of sand and gravel and in-directly through changes in coastal sedimentaryfacies in response to rising sea levels the eutrophi-cationof coastal environments and coral bleachingevents (36) Human land alteration also increas-ingly extends into the subsurface via drilling intoEarthrsquos crust to extractminerals to store wastesor to host utilities (37) Mineral extraction aloneaccounts for the displacement of ~57000 Tgyearndash1 of sediments exceeding the current rate ofriverborne sediment transport by almost a factorof 3 (38)Human activities have also modified sedimen-
tary processes sufficiently to leave clear expres-sions in river lake windblown and glacial depositsthat areoften far removed fromdirect point sources(36) Sediment fluxes in many fluvial systemsincreased historically because of greater defores-
tation livestock grazing and cropland develop-ment Clearing of primary forests for agricultureusually by burning began in Early toMid-Holocenetimes especially in temperate woodland bio-mes this shifted diverse primary forest commun-ities toward domesticates and early successionalspecies and left widespread time-transgressivegeological traces that include profound shiftsin plant and animal remains charcoal and sedi-ment deposits from soil erosion (39 40) In recentdecades secondary forests have recovered acrossmuch of the temperate zone and forest clearinghas shifted toward tropical regions for exampleperiods of rapid deforestation have occurred inAmazonia Indonesia and other regions in Asiaand Africa in response to economic and govern-ance dynamics (41) The construction of moun-tain roads in these tropical regions is resulting insubstantial surface erosion and landslides (42)Extensive sediment retention behind dams
constructed acrossmajor river systems has creat-ed a global signal more rapidly Most dams were
built in the past 60 years at an average rate ofmore than one large damper day (8 9) and eachwill last 50 to 200 years interrupting sedimenttransport to the oceans The reduced sedimentflux to major deltas combined with increasingextraction of groundwater hydrocarbons andsediments (for aggregates) has caused manylarge deltas to subside more quickly a processbeginning in the 1930s (43) at rates faster thanmodern eustatic sea-level rise Coastal retreat isan inevitable result These various signals whichare abrupt on geological time scales are diach-ronous at the decadal scale
Changed geochemical signatures inrecent sediments and ice
Anthropogenic materials and the human influ-ence on sedimentary environments have a near-global expression but geochemical signaturesparticularly those with airborne transport path-ways reach all global environments includingthe ~12 of Earthrsquos surface that is permanentlycovered by ice Among the many distinct geo-chemical signatures that human activitieshave introduced into the sedimentary recordare elevated concentrations of polyaromatichydrocarbons polychlorinated biphenyls anddiverse pesticide residues each beginning at~1945 to 1950 CE (44ndash47) Lead smelting duringRoman times resulted in a distinctive localmarkerof increased 207206Pb ratios a signal that changedglobally in the early 20th century as a result ofvehicles powered by leaded gasoline (47) Thisillustrates that some anthropogenic geochemicalsignatures may vary geographically in their firstappearance but nevertheless become useful as glo-balmarkers when they rapidly spread as the resultof new technologies in the mid-20th centuryNitrogen (N) and phosphorus (P) in soils have
doubled in the past century because of increasedfertilizer use (8 9 48) Production of P byminingnow at ~235 Tg yearminus1 is twice the backgroundweathering rate of P released during the Holo-cene (49) Human processes are argued to havehad the largest impact on the nitrogen cycle forsome 25 billion years (48) The use of the Haber-Bosch process from 1913 CE onward has increasedthe amount of reactive N in the Earth system by120 relative to theHolocene baseline (50) accom-panied by an increased flux of nitrogen oxides(NOx) from the combustion of fossil fuels (Fig 3) (51)These changes have stratigraphic consequences
The influx of excess reactive N and P to lakes andseas has led to seasonal oxygen deficiency af-fecting local microbiota and in extreme casesincreasingmortality in macrobiota (52) NorthernHemisphere lakes show increasingly depleted d15Nvalues (53 54) beginning at ~1895CE (Fig 3B) andaccelerating over the past 60 years In Greenlandice d15N values during the Late Pleistocene glaci-ation show a gradual marked decline to a pre-industrial Holocene norm [mean 97 per mil (permil)in the GISP2 (Greenland Ice Sheet Project 2) icecore (55)] they decline again andmore rapidlystarting at ~1850 CE with the greatest declineoccurring between 1950 and 1980 CE (Fig 3A)(47 56) Themain phase of the increase in nitrate
aad2622-4 8 JANUARY 2016 bull VOL 351 ISSUE 6269 sciencemagorg SCIENCE
Fig 3 Perturbations of the nitrogen cycle since the start of the Late Pleistocene (A) Coevolutionof ice core NO3
ndash (blue) and d15N for NO3ndash (green) from the Late Pleistocene to the present obtained by
splicing data from two cores from Summit Greenland (725degN 384degW 3200 m above sea level) (55ndash57)(B) Power functions fitted to d15N data from lake sediments (gray lines representing 25 remote NorthernHemisphere sites) and ice cores (green line) expressed as departures (Dd15N) from preindustrial baselinevalues (53 54) These isotopic trends are shown alongside annual rates of reactive N production fromagricultural fertilizer (solid red line) and NOx emissions from fossil fuel combustion (dashed red line) (51)
RESEARCH | REVIEWCorrected 8 February 2016 see full text
levels also occurred between 1950 and 1980 CE(Fig 3 A and B) culminating in values higherthan any recorded for the previous 100000 years(57) These markers are distinct from Holoceneand Late Pleistocene background levelsIndustrialmetals such as cadmium chromium
copper mercury nickel lead and zinc have beenwidely and rapidly dispersed since the mid-20thcentury although many show much earlier andmarkedly diachronous signals associated withthe expansion of mineral extraction and process-ing (47 58) An acceleration in the use of tracemetals and rare earth elements (REEs) beganafter World War II resulting in an increase inthe amountsmined a global pattern of dispersionin the environment and novel stoichiometricratios Metals and their derivatives are spreadthrough inadequate processing a lack of recy-cling and reuse or loss during everyday use Forexample platinum rhodium and palladium lostfrom automotive catalytic converters accumulatepreferentially in soils adjacent to highways (59)
Radiogenic signatures andradionuclides in sediments and ice
Potentially the most widespread and globallysynchronous anthropogenic signal is the falloutfrom nuclear weapons testing The start of theAnthropocene may thus be defined by a GlobalStandard Stratigraphic Age (GSSA) coincidingwith detonation of the Trinity atomic device atAlamogordo New Mexico on 16 July 1945 CE(10) However fallout from 1945 to 1951 CE camefrom fission devices and resulted in only localizeddeposition of radionuclides Aggregate yieldsfrom thermonuclear weapon tests that began in1952CEandpeaked in 1961minus1962CE left a clear andglobal signature concentrated in the mid-latitudesand highest in the Northern Hemisphere wheremost of the testing occurred (Fig 4B) (47 60 61)Useful potential markers include excess 14C anisotope common in nature and 239Pu a naturallyrare isotope TheHolocene segment of the IntCal13D14C curve corrected for radiogenic decay (F14C)shows past natural fluctuations and a linearnormalized decrease from 12 to ~10 during theHolocene related to changes in the 14C produc-tion rate and global carbon cycling (62) (Fig 4A)An excess of 14C forms a sharp bomb spike start-ing in 1954 (10) and peaking in 1964 CE (5) bothof which years have been suggested as potentialmarkers for the start of the Anthropocene How-ever the peak is diachronous between hemi-spheres (Fig 4B) (63) 239Pu with its long half-life(24110 years) low solubility and high particlereactivity particularly in marine sediments maybe the most suitable radioisotope for markingthe start of theAnthropocene (61 64) The appear-ance of a 239Pu fallout signature in 1951 CE peak-ing in 1963ndash1964 CE (Fig 4B) will be identifiablein sediments and ice for the next 100000 years(61 64) it will decay to a layer enriched in 235Uand ultimately stable 207Pb
Carbon cycle evidence from ice cores
Atmospheric CO2 now above 400 parts permillion (ppm) was emitted into the atmosphere
from 1999 to 2010 CE ~100 times as fast as themost rapid emission during the last glacial ter-mination (65) and concentrations have exceededHolocene levels since at least 1850 CE (Fig 5)During the Late Pleistocene to Early Holoceneatmospheric CO2 preserved in air bubbles inAntarctic glacial ice underwent a stepped 70-ppmrise over 6000 years (66 67) or an average rise of1 ppm per ~85 years Subsequent Holocene CO2
concentrations remained approximately stable(Fig 5A) CO2 concentrations showed a slightlydecreasing trend from ~11000 to 8000 yr BPThis changed to a slightly rising trend with avery slow rise of 260 to 285 ppm from ~7000 yrBP to the start of the Industrial Revolution (Fig5A) a change which has been ascribed to earlyhuman agriculture by some (3) albeit controver-sially (66) Thus theputative anthropogenic impacton atmospheric CO2 at this timewas both gradualandmuch less than subsequent changes over thepast 200 years The events at 8200 and 4200 yrBP that mark the proposed Mid- and LateHolocene sub-epochs respectively (13) are notassociated with any major change in CO2 concen-trations In sharp contrast modern rates of atmo-spheric C emission (~9Pg yearminus1) are probably thehighest of the Cenozoic era (the past 65 Ma)likely surpassing even those of the Paleocene-Eocene Thermal Maximum (68)The Antarctic ice core record shows steady
enrichment in d13C values from the Late Pleisto-cene to the Mid-Holocene time (66 67) reflectingcarbon uptake by the terrestrial biosphere andcarbon release from oceans (Fig 5A) (66) but itshows no changes at the proposedMid- and LateHolocene sub-epoch boundaries The Antarcticice record shows approximately constant CO2 and
d13C values continuing from 1200 to 1600CE (Fig5B) (69) A short-lived dip at ~1610 CE of about10ppmin theCO2 curvewith a synchronousminorenrichment in d13C has been proposed as amarkerfor the start of the Anthropocene (5) althoughthese fluctuations do not exceed natural Holocenevariability (Fig 5A) (70) The most pronouncedchange in atmospheric CO2 concentrations is the~120-ppm increase since ~1850 CE (Fig 5 B andC) (69) including a rise of ~2 ppm yearminus1 overthe past 50 years This coincides with a steep fall(gt2permil) in d13C atmospheric CO2 to ~ndash85permil (Fig5C) (69) due to an increase in 12C from burningfossil hydrocarbons This isotopic signature alsoforms part of the permanent record because it isinscribed in archives such as tree rings lime-stones and calcareous fossilsIce core records show atmospheric methane
(CH4) concentrations ranging from590 to 760partsper billion (ppb) through much of the Holocene(71ndash75) up to 1700 CE This is followed by an un-precedented increase to 1700 ppb by 2004 CE(72) some 900 ppb higher than what has beenrecorded in Antarctic ice cores at any time in thepast 800000 years (76) with levels rising aboveMid- to Late Pleistocene andHolocene maximaby ~1875 CE (Fig 5D) The d13C curve for CH4
shows a marked decrease of ~15permil from ~1500to 1700 CE perhaps in response to reduced bio-mass burning (72) and a subsequent abrupt risefrom ~1875 CE to the present of ~25permil re-flecting increasing pyrogenic emissions
Climate change and rates of sea-levelchange since the end of the last Ice Age
The proposed subdivision of the Holocene epochinto sub-epochs is based on proxy signals for
SCIENCE sciencemagorg 8 JANUARY 2016 bull VOL 351 ISSUE 6269 aad2622-5
Fig 4 Radiogenic fallout signals as a marker of the Anthropocene (A) Age-corrected atmospheric14C concentration (F14C) based on the IntCal13 curve before nuclear testing (62) (B) The atmosphericconcentration of 14C (F14C) (63) and 239+240Pu (64) radiogenic fallout from nuclear weapons testing(PBq petabecquerel) plotted against annual aggregate atmospheric weapons test yields (60)
RESEARCH | REVIEWCorrected 8 February 2016 see full text
climate change (13) Greenland ice cores showabrupt brief cooling events expressed as de-creases in d18O values at 11400 9300 and 8200 yrBP (Fig 6A) (77) the lattermost of which woulddefine the start of the proposedMiddleHolocene(13) These events are less apparent in equivalentAntarctic ice cores (Fig 6A) (78) A 4200ndashyr BPclimate shift which would mark the start of theproposed Upper Holocene (13) is not expressedin these curves The overall trend during theMid-to Late Holocene was of gradual cooling (Fig 6B)which culminated in the Little Ice Age from 1250to 1800 CE (Fig 6C) The cooling followed anorbitally related insolation decline with smallfluctuations representing changes in solar inten-sity which are controlled by modulators such asthe 208-year Suess cycle (79) Given that theorbital trend is continuing Earth should stillbe cooling However increased anthropogenicemissions of greenhouse gases have instead
caused the planet to warm abnormally fast over-riding the orbitally induced climate cycleThe shift to climate warming (Fig 6C) (80 81)
is first indicated by a slight change toward lessnegative d18O inGreenland ice starting at ~1900CE(Fig 6A) This shift is well outside the naturalenvelope of declining temperature change for thepast 1400 years (Fig 6C) mainly due to green-house gases released from burning of fossil fuelsand deforestation (79 81 82) An average globaltemperature increase of 06deg to 09degC between1906 and 2005 CE with a doubling of the rate ofwarming over the past 50 years (83) is beginningto exceed Holocene natural variability (Figs 6 BandC) in theNorthernHemisphere and is alreadyaboveHolocenemaxima in the tropics and South-ernHemisphere The change in d18O since 1900 CEin Greenland ice cores (Fig 6A) is of a smallermagnitude than that of the 8200ndashyr BP coolingevent marking the base of the proposed Middle
Holocene but it is larger than that at the base ofthe proposed Upper HoloceneAverage global sea levels are currently higher
than at any point within the past ~115000 years(84) since the termination of the last interglacialof the Pleistocene epoch The physical expressionof sea-level change in the geological record is thedisplacement of sedimentary facies for which therate of change of sea level relative to rates of sed-iment accumulation and subsidence due to com-paction is crucial For example rapid sea-level risecan cause delta tops to flood producing sharptransitions into overlying relatively deep marineand anoxic muds marking a flooding surface Bythe time of peak sea level the rate of rise is slowerand fluvial systems can resupply sediment to re-establish deltas as progradational successionsbuilding up and out from the coastVery high rates of sea-level change (gt40 mm
yearminus1) occurred at about 14000 to 14300 yr BP
aad2622-6 8 JANUARY 2016 bull VOL 351 ISSUE 6269 sciencemagorg SCIENCE
Fig 5 Perturbations of the carbon cycle evidenced by glaciochemicalCO2 and CH4 concentrations and carbon isotopic ratios (A) AtmosphericCO2 from the Antarctic Law Dome and EPICA (European Project for IceCoring in Antarctica) Dome C ice cores with observational data [from (69)and references therein] and d13C from atmospheric CO2 (66 67) (B) CO2
concentration and d13C from atmospheric CO2 from the Law Dome icecores (69) for the time interval indicated by the green rectangle in (A)
showing a 10-ppm dip in CO2 recognized as the Orbis event (5) (C) CO2
concentration and d13C from atmospheric CO2 from the Law Dome icecore firn data and air samples (69) for the time period indicated by thegreen rectangle in (B) showing inflections at ~1965 CE (D) Antarctic(squares) and Greenland (circles) ice core and firn records for CH4 con-centration and d13C for atmospheric CH4 for the past two millennia (72ndash75)(top) with Greenland ice core CH4 data for the Holocene (bottom) (71)
RESEARCH | REVIEWCorrected 8 February 2016 see full text
during the Boslashlling warming event associatedwith rapid ice sheet disintegration during thetransition between the last glacial phase and thecurrent interglacial phase (85) The high rateof rise caused widespread inundation of coastalareas and sedimentary facies back-stepped (ret-rograded landward)The past 7000 years of the Holocene epoch
when ice volumes stabilized near present-dayvalues provide the baseline for discussion of an-thropogenic contributions Relative sea-level re-cords indicate that from ~7000 to 3000 yr BPglobal mean sea level rose ~2 to 3 m to nearlypresent-day levels (84) Based on local sea-levelrecords spanning the past 2000 years there ismedium confidence that fluctuations in globalmean sea level during this interval have not ex-ceeded ~025 m on time scales of a few hundredyears As a consequence coastlines have beenmore or less fixed and sediment accumulationwithin beaches tidal flats and deltas has beenprogradationalThemost robust signal captured in saltmarsh
records from both the Northern and SouthernHemispheres supports a transition from relativelylow rates of change during the Late Holocene(lt1 mm yearminus1) to modern rates of 32 plusmn 04 mmyearminus1 from 1993 to 2010 CE (84) By combiningpaleondashsea-level records with tide gauge recordsat the same localities it is clear that sea levelbegan to rise above the LateHolocene backgroundrate between 1905 and 1945 CE (86) if continuedthis trend will lead to a return to dominantlyretrogradational shifts in sedimentary facies alongcoastal zones However reconstructions from theUS Atlantic coast suggest that the rate of sea-level rise is not linear (87) A rate of 006 to 039mmyearminus1 during the 18th century shows a changebetween 1827 and 1860 CE to a latendash19th centuryrate of 122 to 153 mm yearminus1 and a secondaryand less pronounced change from 1924 to 1943CEto a subsequent late 20th century rate of 19 to222 mm yearminus1 (87) The timing of the inflectionsin this rising sea-level curvematches with a delayof about a decade the stepped changes in CO2
concentrations (Fig 5C)Compared with other stratigraphic changes
described above the climate and sea-level signalsof theAnthropocene are not yet as strongly expres-sed in part because they reflect the combinedeffects of fast and slow climate feedback mech-anismsHowever given that anthropogenic forcingis driving these changes they are likely to exceedthe envelope of not only Holocene but Quaternarybaseline conditions (79) Projections of continuedwarming due to greenhouse gases (82) evenwith reductions below current emissions levelssuggest that by 2070 Earth will be at its hottestsince the last interglacial period ~125000 yearsago [Figure 53 in (82)]mdashand hence hotter than ithas been for most if not all of the time sincemodern humans emerged as a species 200000years agoChanges in global average surface temperature
and increases in sea level are manifestations ofchanges in the surface energy balance Perhaps amore fundamental measure of human perturba-
tion of the climate system is the human-drivenchange to the planetary energy balance at Earthrsquossurface as measured by changes in radiativeforcing Human activities primarily the burningof fossil hydrocarbons have increased the ra-diative forcing by 229 (113 to 333) W mminus2 rel-ative to 1750 CE with amore rapid increase since1970 CE than during prior decades Overwhelm-ing the natural changes in radiative forcingduring the Late Holocene (solar irradiance andvolcanic aerosols) which are estimated to be 005(000 to 010) W mminus2 (82) the anthropogenicenergy imbalance is poised to amplify strati-
graphic signals associated with warming andsea-level rise
Biotic change as an indicator ofthe Anthropocene
Most Phanerozoic time intervals are definedusingeither the first or last appearance of key fossils(29) Evolution and extinction rates are mostlytoo slow and diachronous to provide an obviousbiological marker for the start of the Anthro-pocene but important biotic change has takenplace recently (88) Although Earth still retainsmost of the species that were present at the start
SCIENCE sciencemagorg 8 JANUARY 2016 bull VOL 351 ISSUE 6269 aad2622-7
Fig 6 Climate variations during the Holocene indicated by oxygen isotopic ratios and modeledtemperature variations (A) Holocene profiles of d18O from three Greenland ice cores with threeshort-duration cooling events indicated by shading (77) shown with an Antarctic ice core profile forcomparison (EDML EPICA Dronning Maud Land Ice Core) (78) (B) Temperature reconstructions for theHolocene and global temperatures for the past 2000 years [B2K before 2000CE (81)] (C) Standardizedglobal mean temperature for the past 2000 years represented by 30-year means (80 81) showing thenatural temperature envelope for the past 2000 years [based on (79)] The Little Ice Age (LIA) and theMedieval Warm Period (MWP also known as the Medieval Climatic Anomaly) of the Northern Hemisphereare indicated
RESEARCH | REVIEWCorrected 8 February 2016 see full text
of the Holocene even conservative estimates ofextinction rates since 1500 CE are far above meanper-million-year background rates (Fig 7A) witha notable increase from the 19th century onward(89) (Fig 7B) Current trends of habitat loss andoverexploitation if maintained would push Earthinto the sixthmass extinction event (with ~75 ofspecies extinct) in the next few centuries (90) aprocess that is probably already underway (89)Irrespective of the number of extinctions spe-
cies assemblages and relative abundances havebeen altered worldwide This is especially truein recent decades because of geologically un-precedented transglobal species invasions andbiological assemblage changes associated withagriculture on land and fishing in the sea (91)The terrestrial biosphere has undergone a dra-matic modification from 1700 CE when almost50 of the global ice-free land area was wild and
only ~5 was intensively used by humans to2000 CE when the respective percentages were25 and 55 (92) The paleontological expres-sion of these assemblages will markedly differfrom the typical Holocene fossil record as recog-nizable novel biostratigraphic zones (93) andthe new assemblages of species have already per-manently reconfiguredEarthrsquosbiological trajectoryThese biotic changes are not synchronous butthey accelerated after 1500 CE on land (94) and inthe seas affecting bothmicro- andmacrobiota (52)
The case for a new epoch
The stratigraphic signatures described above(Fig 1) are either entirely novel with respect tothose found in the Holocene and preexistingepochs or quantitatively outside the range of var-iation of the proposed Holocene subdivisionsFurthermore most proximate forcings of these
signatures are currently accelerating These dis-tinctive attributes of the recent geological recordsupport the formalization of the Anthropoceneas a stratigraphic entity equivalent to otherformally defined geological epochs The bound-ary should therefore be placed following theprocedures of the International Commission onStratigraphyIf such formalization is to be achieved how-
ever further work is required First it needs tobe determined how the Anthropocene is to bedefined whether by GSSA (calendar age) GSSP[reference point in a stratal section (10)] or a com-bination of both Whichever is ultimately chosenthe location and comparative analyses of candi-date stratotype sections are necessary not leastto explore how effectively any chosen levelsmaybe traced and correlated within stratal archivesThis is linked to the question of when exactly theAnthropocenemay be determined to begin Ouranalysis is more consistent with a beginning inthemid-20th century and a number of optionshave already been suggested within that inter-val ranging from 1945 to 1964 CE (5 10) Thereis also the question which is still under debateof whether it is helpful to formalize the Anthro-pocene or better to leave it as an informal albeitsolidly founded geological time term as the Pre-cambrian and Tertiary currently are (95) This is acomplex question in part because quite unlikeother subdivisions of geological time the impli-cations of formalizing the Anthropocene reachwell beyond the geological community Not onlywould this represent the first instance of a newepoch having been witnessed firsthand by ad-vanced human societies it would be one stem-ming from the consequences of their own doing
REFERENCES AND NOTES
1 W Steffen J Grinevald P Crutzen J McNeill TheAnthropocene Conceptual and historical perspectives PhilosTrans R Soc London Ser A 369 842ndash867 (2011)doi 101098rsta20100327 pmid 21282150
2 A Malm A Hornborg The geology of mankind A critique ofthe Anthropocene narrative Anthropocene Rev 1 62ndash69(2014) doi 1011772053019613516291
3 W F Ruddiman The anthropogenic greenhouse era beganthousands of years ago Clim Change 61 261ndash293 (2003)doi 101023BCLIM000000457717928fa
4 W F Ruddiman The Anthropocene Annu Rev Earth Planet Sci41 45ndash68 (2013) doi 101146annurev-earth-050212-123944
5 S L Lewis M A Maslin Defining the Anthropocene Nature 519171ndash180 (2015) doi 101038nature14258 pmid 25762280
6 P J Crutzen Geology of mankind Nature 415 23 (2002)doi 101038415023a pmid 11780095
7 J Zalasiewicz et al Are we now living in the AnthropoceneGSA Today 18 4ndash8 (2008) doi 101130GSAT01802A1
8 W Steffen J Crutzen J R McNeill The Anthropocene Arehumans now overwhelming the great forces of nature Ambio 36614ndash621 (2007) doi 1015790044-7447(2007)36[614TAAHNO]20CO2 pmid 18240674
9 W Steffen W Broadgate L Deutsch O GaffneyC Ludwig The trajectory of the Anthropocene The GreatAcceleration Anthropocene Rev 2 81ndash98 (2015)doi 1011772053019614564785
10 J Zalasiewicz et al When did the Anthropocene begin A mid-twentieth century boundary level is stratigraphically optimalQuat Int 383 196ndash203 (2015) doi 101016jquaint201411045
11 B Pillans P Gibbard ldquoThe Quaternary Periodrdquo in The GeologicTime Scale F M Gradstein J Ogg M Schmitz G Ogg Eds(Elsevier BV 2012) pp 979ndash1010
12 J Remane et al Guidelines for the establishment of globalchronostratigraphic standards by the InternationalCommission on Stratigraphy (ICS) Episodes 19 77ndash81 (1996)
aad2622-8 8 JANUARY 2016 bull VOL 351 ISSUE 6269 sciencemagorg SCIENCE
Fig 7 Increased rates of vertebrate extinctions (A) The approximate rise in mammal extinction ratescalculated over varying time intervals as extended backward from 2010 CE (Ma millions of years ago)Lines indicate the amount by which extinction rates exceed 18 extinctions per million species years(EMSY) [see (89) sourced from (22)] (B) Cumulative vertebrate species extinctions as a percentageof total species with ranges (shaded) between conservative rates (including extinctions extinctions inthe wild and possible extinctions) and lower highly conservative rates (verified extinctions only) A back-ground rate of 20 EMSY is shown for comparison [after (89)]
RESEARCH | REVIEWCorrected 8 February 2016 see full text
13 M J C Walker et al Formal subdivision of the Holocene SeriesEpoch A discussion paper by a Working Group of INTIMATE(Integration of ice-core marine and terrestrial records) and theSubcommission on Quaternary Stratigraphy (InternationalCommission on Stratigraphy) J Quat Sci 27 649ndash659 (2012)
14 I McDougall F H Brown J G Fleagle Stratigraphicplacement and age of modern humans from Kibish EthiopiaNature 433 733ndash736 (2005) doi 101038nature03258pmid 15716951
15 ldquoPopulationrdquo History Database of the Global Environment(Netherlands Environmental Assessment Agency BilthovenNetherlands 2013) httpthemasitespblnltridionenthemasiteshydebasicdrivingfactorspopulationindex-2html
16 K Klein Goldewijk A Beusen P Janssen Long-term dynamicmodeling of global population and built-up area in a spatiallyexplicit way HYDE 31 Holocene 20 565ndash573 (2010)doi 1011770959683609356587
17 A D Barnosky et al Prelude to the Anthropocene Two newNorth American Land Mammal Ages (NALMAs) AnthropoceneRev 1 225ndash242 (2014) doi 1011772053019614547433
18 C N Waters J A Zalasiewicz M Williams M A EllisA M Snelling ldquoA stratigraphical basis for the Anthropocenerdquoin A Stratigraphical Basis for the Anthropocene C N WatersJ A Zalasiewicz M Williams M A Ellis A M Snelling Eds(Geological Society London 2014) pp 1ndash21
19 J R Ford S J Price A H Cooper C N Waters ldquoAnassessment of lithostratigraphy for anthropogenic depositsrdquo inA Stratigraphical Basis for the Anthropocene C N WatersJ A Zalasiewicz M Williams M A Ellis A M Snelling Eds(Geological Society London 2014) pp 55ndash89
20 J Zalasiewicz R Kryza M Williams ldquoThe mineral signature of theAnthropocenerdquo in A Stratigraphical Basis for the AnthropoceneC N Waters J A Zalasiewicz M Williams M A Ellis A M SnellingEds (Geological Society London 2014) pp 109ndash117
21 M Edgeworth et al Diachronous beginnings of theAnthropocene The lower bounding surface of anthropogenicdeposits Anthropocene Rev 2 33ndash58 (2015)doi 1011772053019614565394
22 J Zalasiewicz M Williams C N Waters A D Barnosky P HaffldquoAnthropocenerdquo in Origins O Seberg D A Harper Eds(Cambridge Univ Press in press)
23 US Geological Survey in Historical Statistics for Mineral andMaterial Commodities in the United States T D KellyG R Matos Eds (US Geological Survey Data Series 140US Geological Survey 2010) httpmineralsusgsgovmineralspubshistorical-statisticscement-usepdf
24 Plastics ndash the Facts 2013 An Analysis of European LatestPlastics Production Demand and Waste Data (PlasticsEurope2013) wwwplasticseuropeorgdocumentsdocument20131014095824-final_plastics_the_facts_2013_published_october2013pdf
25 P L Corcoran Benthic plastic debris in marine and fresh waterenvironments Environ Sci Processes Impacts 17 1363ndash1369(2015) doi 101039C5EM00188A pmid 26129903
26 R C Thompson et al Lost at sea Where is all the plasticScience 304 838 (2004) doi 101126science1094559pmid 15131299
27 J R Jambeck et al Plastic waste inputs from land into theocean Science 347 768ndash771 (2015)doi 101126science1260352 pmid 25678662
28 J Zalasiewicz M Williams C N Waters A D BarnoskyP Haff The technofossil record of humans Anthropocene Rev1 34ndash43 (2014) doi 1011772053019613514953
29 A G Smith T Barry P Bown J Cope A Gale P L GibbardJ Gregory M Hounslow D Kemp R Knox J MarshallM Oates P Rawson J Powell C Waters ldquoGSSPs globalstratigraphy and correlationrdquo in Strata and Time Probing theGaps in Our Understanding D G Smith R J BaileyP M Burgess A J Fraser Eds (Special Publication 404Geological Society London 2014) pp 37ndash67
30 T Novakov et al Large historical changes of fossil-fuel blackcarbon aerosols Geophys Res Lett 30 1324 (2003)doi 1010292002GL016345
31 F Oldfield Can the magnetic signatures from inorganic fly ashbe used to mark the onset of the Anthropocene AnthropoceneRev 2 3ndash13 (2015) doi 1011772053019614534402
32 N L Rose Spheroidal carbonaceous fly ash particles provide aglobally synchronous stratigraphic marker for theAnthropocene Environ Sci Technol 49 4155ndash4162 (2015)doi 101021acsest5b00543 pmid 25790111
33 G T Swindles et al Spheroidal carbonaceous particles are adefining stratigraphic marker for the Anthropocene Sci Rep5 10264 (2015) doi 101038srep10264 pmid 26020614
34 M C Harvey S C Brassell C M Belcher A MontanariCombustion of fossil organic matter at the Cretaceous-Paleogene (K-P) boundary Geology 36 355ndash358 (2008)doi 101130G24646A1
35 R LeB Hooke J F Martiacuten-Duque Land transformation byhumans A review GSA Today 22 4ndash10 (2012)
36 J Zalasiewicz M Williams C N Waters ldquoCan an AnthropoceneSeries be defined and recognizedrdquo in A Stratigraphical Basisfor the Anthropocene C N Waters J A ZalasiewiczM Williams M A Ellis A M Snelling Eds (Geological SocietyLondon 2014) pp 39ndash53
37 J Zalasiewicz C N Waters M Williams Human bioturbation andthe subterranean landscape of the Anthropocene Anthropocene6 3ndash9 (2014) doi 101016jancene201407002
38 I Douglas N Lawson The human dimensions ofgeomorphological work in Britain J Ind Ecol 4 9ndash33 (2000)doi 101162108819800569771
39 E C Ellis Anthropogenic transformation of the terrestrialbiosphere Philos Trans R Soc London Ser A 369 1010ndash1035(2011) doi 101098rsta20100331 pmid 21282158
40 A Brown P Toms C Carey E Rhodes Geomorphology of theAnthropocene Time-transgressive discontinuities of human-induced alluviation Anthropocene 1 3ndash13 (2013)doi 101016jancene201306002
41 P Meyfroidt E F Lambin Global forest transition Prospectsfor an end to deforestation Annu Rev Environ Resour 36343ndash371 (2011) doi 101146annurev-environ-090710-143732
42 R C Sidle A D Ziegler The dilemma of mountain roads NatGeosci 5 437ndash438 (2012) doi 101038ngeo1512
43 J P M Syvitski A Kettner Sediment flux and theAnthropocene Philos Trans R Soc London Ser A 369957ndash975 (2011) doi 101098rsta20100329 pmid 21282156
44 C K Paull W Ussler III P J Mitts D W Caress G J WestDiscordant 14C-stratigraphies in upper Monterey Canyon Asignal of anthropogenic disturbance Mar Geol 233 21ndash36(2006) doi 101016jmargeo200607008
45 C H Vane et al Chemical signatures of the Anthropocene inthe Clyde estuary UK Sediment-hosted Pb 207206Pb totalpetroleum hydrocarbon polyaromatic hydrocarbon andpolychlorinated biphenyl pollution records Philos Trans RSoc London Ser A 369 1085ndash1111 (2011)doi 101098rsta20100298 pmid 21282161
46 D C G Muir N L Rose ldquoPersistent organic pollutants in thesediments of Lochnagarrdquo in Lochnagar The Natural History of aMountain Lake N L Rose Ed (Springer Dordrecht Germany2007) pp 375ndash402
47 J R Dean M J Leng A W Mackay Is there an isotopicsignature of the Anthropocene Anthropocene Rev 1 276ndash287(2014) doi 1011772053019614541631
48 D E Canfield A N Glazer P G Falkowski The evolution andfuture of Earthrsquos nitrogen cycle Science 330 192ndash196 (2010)doi 101126science1186120 pmid 20929768
49 S R Carpenter E M Bennett Reconsideration of theplanetary boundary for phosphorus Environ Res Lett 6014009 (2011) doi 1010881748-932661014009
50 J N Galloway et al Transformation of the nitrogen cycle Recenttrends questions and potential solutions Science 320 889ndash892(2008) doi 101126science1136674 pmid 18487183
51 E A Holland J Lee-Taylor C Nevison J Sulzman Global NCycle Fluxes and N2O Mixing Ratios Originating from HumanActivity Data Set (Oak Ridge National Laboratory DistributedActive Archive Center Oak Ridge TN 2005) httpdaacornlgovcgi-bindsviewerplds_id=797
52 I P Wilkinson C Poirier M J Head C D Sayer J TibbyldquoMicrobiotic signatures of the Anthropocene in marginalmarine and freshwater palaeoenvironmentsrdquo in AStratigraphical Basis for the Anthropocene C N WatersJ A Zalasiewicz M Williams M A Ellis A M Snelling Eds(Geological Society London 2014) pp 185ndash219
53 G W Holtgrieve et al A coherent signature of anthropogenicnitrogen deposition to remote watersheds of the NorthernHemisphere Science 334 1545ndash1548 (2011) doi 101126science1212267 pmid 22174250
54 A P Wolfe et al Stratigraphic expressions of the HolocenendashAnthropocene transition revealed in sediments from remotelakes Earth Sci Rev 116 17ndash34 (2013)doi 101016jearscirev201211001
55 M G Hastings D M Sigman E J Steig Glacialinterglacialchanges in the isotopes of nitrate from the Greenland IceSheet Project 2 (GISP2) ice core Global Biogeochem Cycles19 GB4024 (2005) doi 1010292005GB002502
56 M G Hastings J C Jarvis E J Steig Anthropogenic impactson nitrogen isotopes of ice-core nitrate Science 324 1288(2009) doi 101126science1170510 pmid 19498161
57 E W Wolff ldquoIce sheets and the Anthropocenerdquo in AStratigraphical Basis for the Anthropocene C N WatersJ A Zalasiewicz M Williams M A Ellis A M Snelling Eds(Geological Society London 2014) pp 255ndash263
58 A Gałuszka Z M Migaszewski J Zalasiewicz ldquoAssessing theAnthropocene with geochemical methodsrdquo in A StratigraphicalBasis for the Anthropocene C N Waters J A ZalasiewiczM Williams M A Ellis A M Snelling Eds (Geological SocietyLondon 2014) pp 221ndash238
59 K E Jarvis S J Parry J M Piper Temporal and spatialstudies of autocatalyst-derived platinum rhodium andpalladium and selected vehicle-derived trace elements in theenvironment Environ Sci Technol 35 1031ndash1036 (2001)doi 101021es0001512 pmid 11347910
60 UNSCEAR-United Nations Scientific Committee on the Effectsof Atomic Radiation Sources and Effects of Ionizing Radiation(United Nations New York 2000)
61 C N Waters et al Can nuclear weapons fallout mark thebeginning of the Anthropocene Epoch Bull Atom Sci 7146ndash57 (2015) doi 1011770096340215581357
62 P J Reimer et al IntCal13 and Marine13 radiocarbon agecalibration curves 0ndash50000 years cal BP Radiocarbon 551869ndash1887 (2013) doi 102458azu_js_rc5516947
63 Q Hua M Barbetti A Z Rakowski Atmospheric radiocarbonfor the period 1950minus2010 Radiocarbon 55 2059ndash2072 (2013)doi 102458azu_js_rcv55i216177
64 G J Hancock S G Tims L K Fifield I T Webster ldquoTherelease and persistence of radioactive anthropogenic nuclidesrdquoin A Stratigraphical Basis for the Anthropocene C N WatersJ A Zalasiewicz M Williams M A Ellis A M Snelling Eds(Geological Society London 2014) pp 265ndash281
65 E W Wolff Greenhouse gases in the Earth system Apalaeoclimate perspective Philos Trans R Soc London Ser A369 2133ndash2147 (2011) doi 101098rsta20100225pmid 21502180
66 J Elsig et al Stable isotope constraints on Holocene carboncycle changes from an Antarctic ice core Nature 461 507ndash510(2009) doi 101038nature08393 pmid 19779448
67 J Schmitt et al Carbon isotope constraints on the deglacialCO₂ rise from ice cores Science 336 711ndash714 (2012)doi 101126science1217161 pmid 22461496
68 Y Cui et al Slow release of fossil carbon during thePalaeocenendashEocene Thermal Maximum Nat Geosci 4481ndash485 (2011) doi 101038ngeo1179
69 M Rubino et al A revised 1000 year atmospheric d13C-CO2
record from Law Dome and South Pole Antarctica J GeophysRes 118 8482ndash8499 (2013)
70 J Zalasiewicz et al Colonization of the Americas lsquoLittle IceAgersquo climate and bomb-produced carbon Their role in definingthe Anthropocene Anthropocene Rev 2 117ndash127 (2015)doi 1011772053019615587056
71 T Blunier J Chappellaz J Schwander B Stauffer D RaynaudVariations in atmospheric methane concentration during theHolocene epoch Nature 374 46ndash49 (1995) doi 101038374046a0
72 D F Ferretti et al Unexpected changes to the global methanebudget over the past 2000 years Science 309 1714ndash1717(2005) doi 101126science1115193 pmid 16151008
73 C MacFarling Meure et al Law Dome CO2 CH4 and N2O icecore records extended to 2000 years BP Geophys Res Lett33 L14810 (2006) doi 1010292006GL026152
74 C J Sapart et al Natural and anthropogenic variations inmethane sources during the past two millennia Nature 49085ndash88 (2012) doi 101038nature11461 pmid 23038470
75 L Mitchell E Brook J E Lee C Buizert T SowersConstraints on the late Holocene anthropogenic contribution tothe atmospheric methane budget Science 342 964ndash966(2013) doi 101126science1238920 pmid 24264988
76 L Loulergue et al EPICA Dome C Ice Core 800 KYyr MethaneData IGBP PAGES World Data Center for PaleoclimatologyData Contribution Series 2008-054 (National Oceanic andAtmospheric AdministrationNational Climatic Data CenterPaleoclimatology Program Boulder CO 2008) httpcdiacornlgovtrendsatm_methice_core_methanehtml
77 B M Vinther et al A synchronized dating of three Greenlandice cores throughout the Holocene J Geophys Res 111D13102 (2006) doi 1010292005JD006921
78 T Felis et al Pronounced interannual variability in tropicalSouth Pacific temperatures during Heinrich Stadial 1 NatCommun 3 965 (2012) pmid 22828625
79 C P Summerhayes Earths Climate Evolution (Wiley-Blackwell2015)
SCIENCE sciencemagorg 8 JANUARY 2016 bull VOL 351 ISSUE 6269 aad2622-9
RESEARCH | REVIEWCorrected 8 February 2016 see full text
80 M Ahmed et al Continental-scale temperature variabilityduring the past two millennia Nat Geosci 6 339ndash346 (2013)doi 101038ngeo1797
81 H Wanner L Mercolli M Grosjean S P Ritz Holoceneclimate variability and change a data-based review J GeolSoc London 172 254ndash263 (2015) doi 101144jgs2013-101
82 IPCC Climate Change 2013 The Physical Science BasisContribution of Working Group I to the Fifth Assessment Reportof the Intergovernmental Panel on Climate Change T F Stockeret al Eds (Cambridge Univ Press 2013)
83 J R Hansen R Ruedy M Sato K Lo Global surfacetemperature change Rev Geophys 48 RG4004 (2010)doi 1010292010RG000345
84 J A Church P U Clark A Cazenave J M Gregory S JevrejevaA Levermann M A Merrifield G A Milne R S Nerem P D NunnA J Payne W T Pfeffer D Stammer A S Unnikrishnan ldquoSea levelchangerdquo in Climate Change 2013 The Physical Science BasisContribution of Working Group I to the Fifth Assessment Report ofthe Intergovernmental Panel on Climate Change T F Stocker et alEds (Cambridge Univ Press 2013) pp 1137ndash1216
85 P Deschamps et al Ice-sheet collapse and sea-level rise at theBoslashlling warming 14600 years ago Nature 483 559ndash564(2012) doi 101038nature10902 pmid 22460900
86 R Gehrels P L Woodworth When did modern rates of sea-level rise start Global Planet Change 100 263ndash277 (2013)doi 101016jgloplacha201210020
87 A C Kemp et al Relative sea-level change in Connecticut(USA) during the last 2200 yrs Earth Planet Sci Lett 428217ndash229 (2015) doi 101016jepsl201507034
88 A D Barnosky ldquoPalaeontological evidence for defining theAnthropocenerdquo in A Stratigraphical Basis for the AnthropoceneC N Waters J A Zalasiewicz M Williams M A Ellis A M SnellingEds (Geological Society London 2014) pp 149ndash165
89 G Ceballos et al Accelerated modern human-induced specieslosses Entering the sixth mass extinction Sci Adv 1e1400253 (2015) doi 101126sciadv1400253 pmid 26601195
90 A D Barnosky N Matzke S Tomiya G O U Wogan B SwartzT B Quental C Marshall J L McGuire E L LindseyK C Maguire B Mersey E A Ferrer Has the Earthrsquos sixth massextinction already arrived Nature 471 51ndash57 (2011) doi 101038nature09678
91 M Williams et al The Anthropocene biosphere AnthropoceneRev 2 196ndash219 (2015) doi 1011772053019615591020
92 E C Ellis K K Goldewijk S Siebert D LightmanN Ramankutty Anthropogenic transformation of the biomes1700 to 2000 Glob Ecol Biogeogr 19 589ndash606 (2010)
93 S M Kidwell Biology in the Anthropocene Challenges andinsights from young fossil records Proc Natl Acad Sci USA112 4922ndash4929 (2015) doi 101073pnas1403660112pmid 25901315
94 J R McNeill ldquoBiological exchanges in world historyrdquo in TheOxford Handbook of World History J Bentley Ed (Oxford UnivPress 2011) pp 325ndash342
95 W F Ruddiman E C Ellis J O Kaplan D Q Fuller Definingthe epoch we live in Science 348 38ndash39 (2015) doi 101126scienceaaa7297 pmid 25838365
ACKNOWLEDGMENTS
CW and ME publish with the permission of the Executive DirectorBritish Geological Survey Natural Environment Research Councilthe former is funded by the British Geological Surveyrsquos EngineeringGeology program We thank three referees along with I FairchildI Hajdas and S Price for their comments This paper is a contributionof the AnthropoceneWorking Group (AWG) part of the Subcommissionon Quaternary Stratigraphy of the International Commission onStratigraphy The AWG receives no direct funding to carry out itsresearch and the authors declare no competing financial interests
101126scienceaad2622
aad2622-10 8 JANUARY 2016 bull VOL 351 ISSUE 6269 sciencemagorg SCIENCE
RESEARCH | REVIEWCorrected 8 February 2016 see full text
DOI 101126scienceaad2622 (2016)351 Science
et alColin N Watersthe HoloceneThe Anthropocene is functionally and stratigraphically distinct from
This copy is for your personal non-commercial use only
clicking herecolleagues clients or customers by you can order high-quality copies for yourIf you wish to distribute this article to others
herefollowing the guidelines
can be obtained byPermission to republish or repurpose articles or portions of articles
) February 17 2016 wwwsciencemagorg (this information is current as of
The following resources related to this article are available online at
content3516269aad2622fullhtmlversion of this article at
including high-resolution figures can be found in the onlineUpdated information and services
content3516269aad2622fullhtmlref-list-1 29 of which can be accessed freecites 72 articlesThis article
cgicollectiongeochem_physGeochemistry Geophysics
subject collectionsThis article appears in the following
registered trademark of AAAS is aScience2016 by the American Association for the Advancement of Science all rights reserved The title
CopyrightAmerican Association for the Advancement of Science 1200 New York Avenue NW Washington DC 20005 (print ISSN 0036-8075 online ISSN 1095-9203) is published weekly except the last week in December by theScience
on F
ebru
ary
17 2
016
Dow
nloa
ded
from
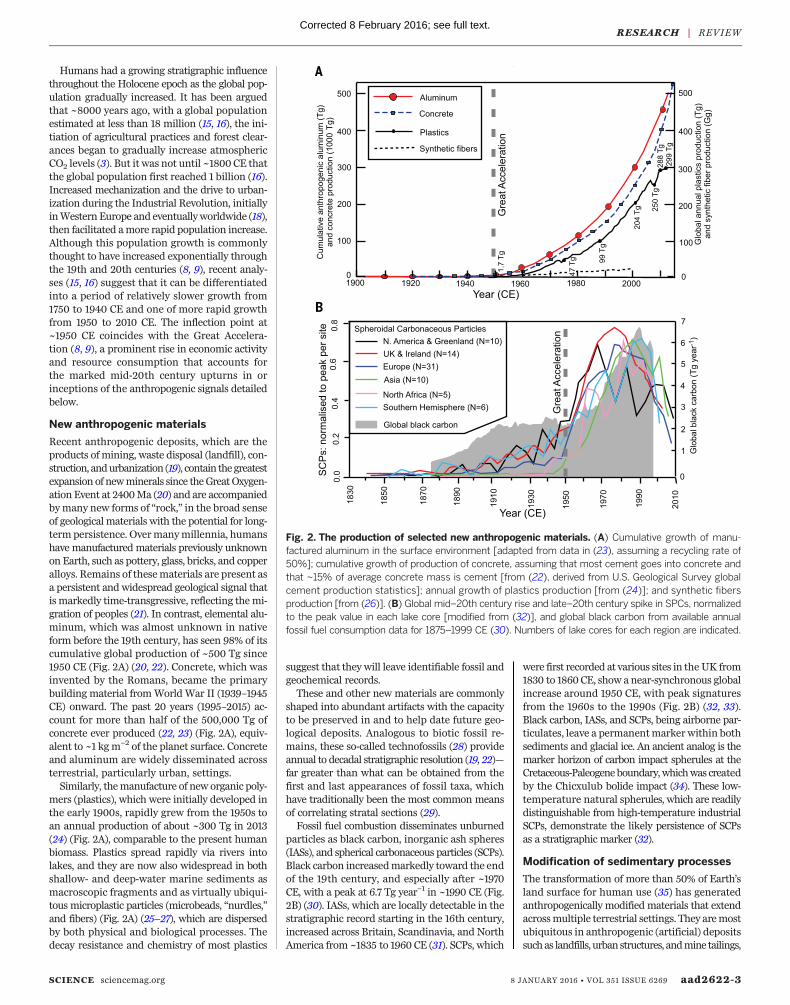
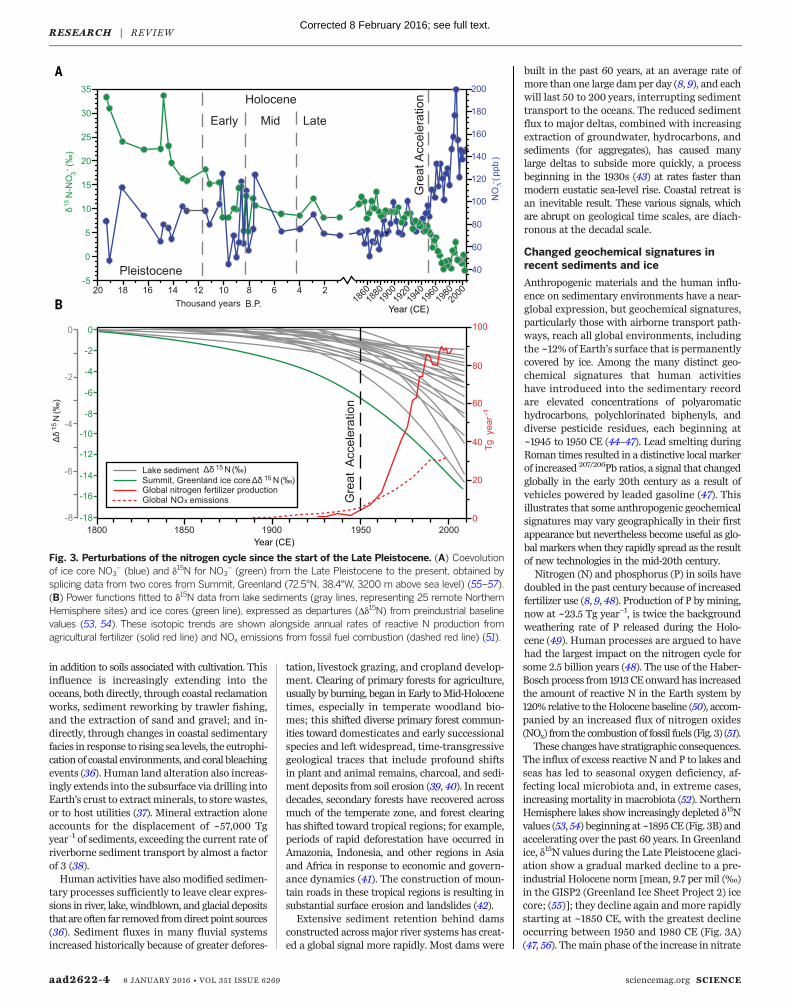
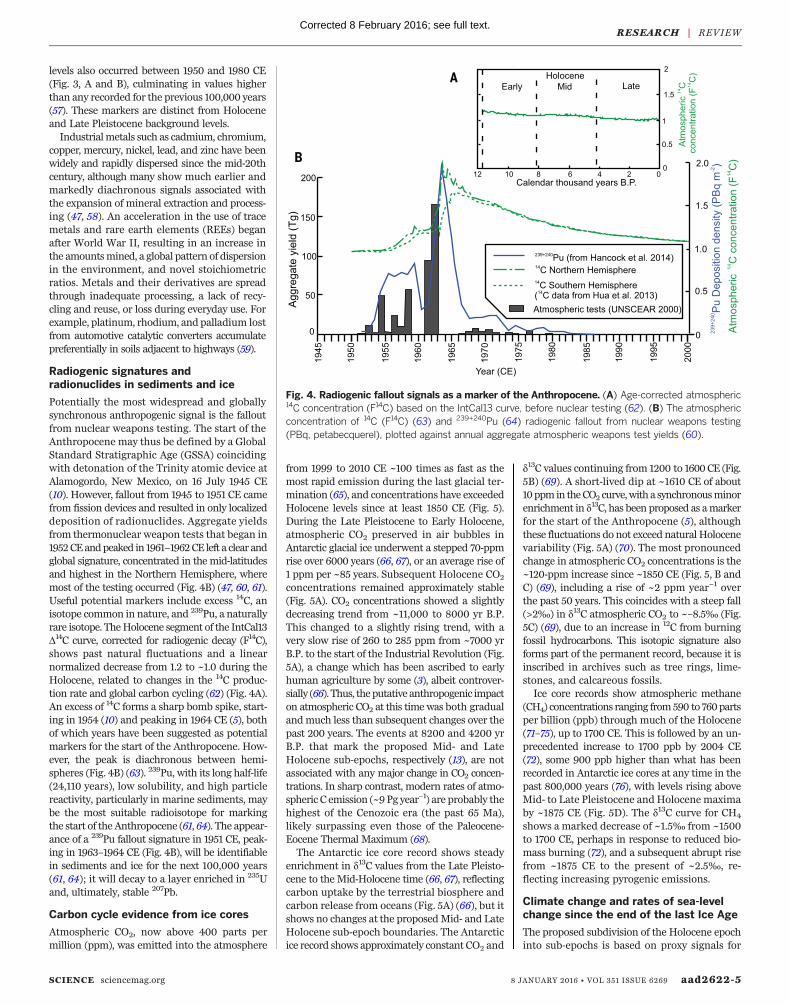
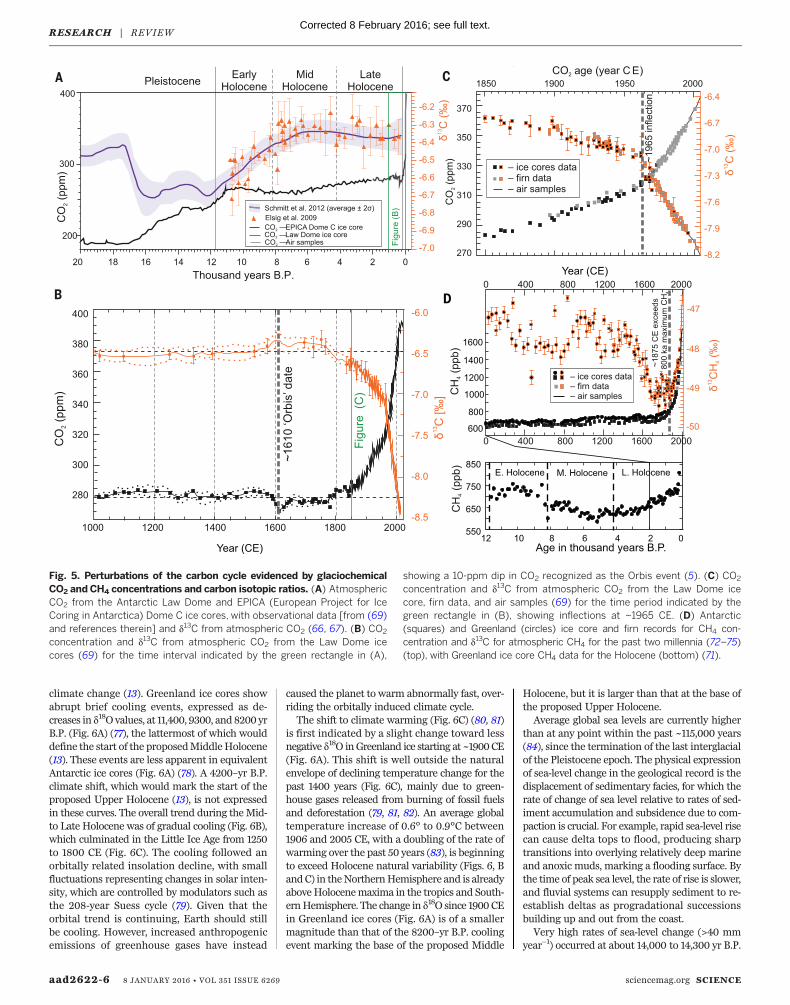
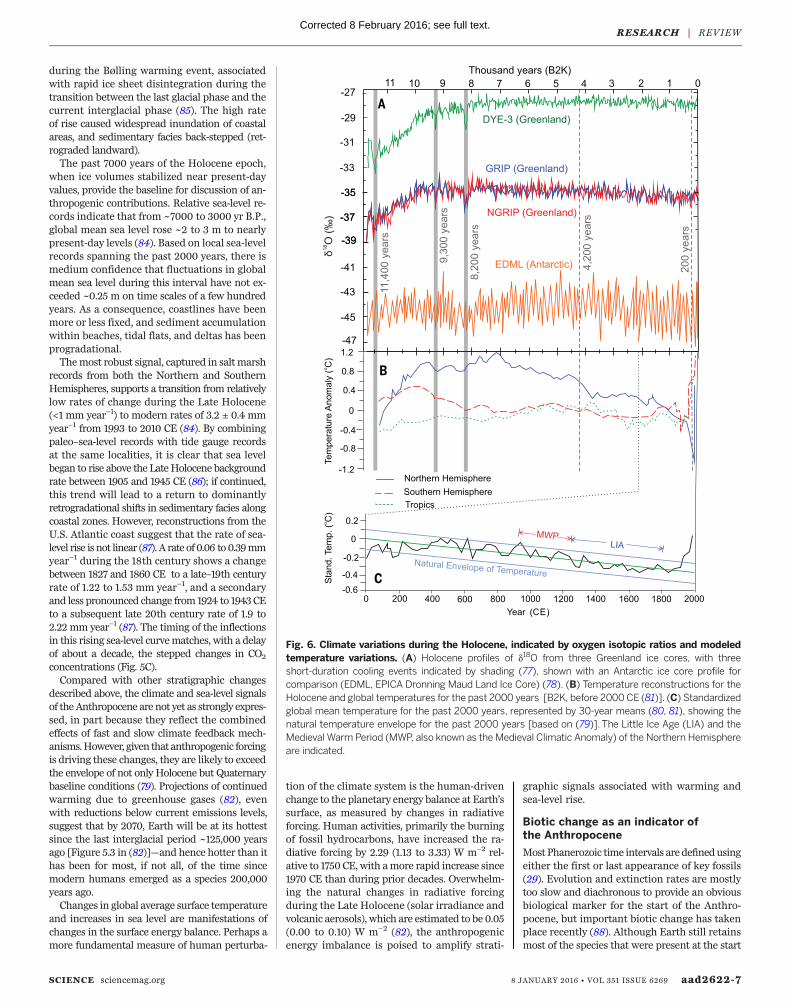
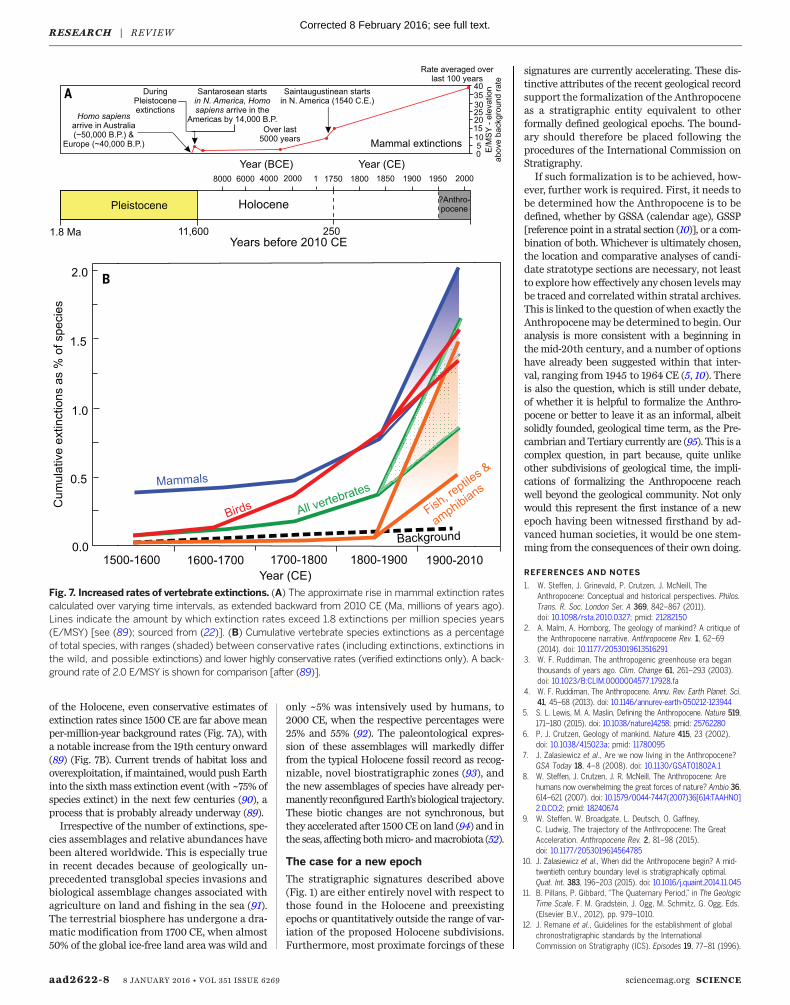