Embed Size (px)
Citation preview
AustAAustralir an & New ZeaZeaalandlandla MentMental HHal H ltealtealth Ah Ash As isocisoci tiatioation n
In association with
Australian & New Zealand Disaster andEmergency Management Conference
EARTH: FIRE AND RAIN
16 - 18 April 2012 | Brisbane Exhibition & Convention Centre
www.anzdmc.com.au
Disaster and Emergency Management Conference
Conference Proceedings ISBN: 978-0-9808147-4-3 Publisher Details Publisher AST Management Pty Ltd Contact Cathryn Gertzos Address PO Box 29, Nerang QLD 4211 Telephone +61 7 5502 2068 Fax +61 7 5527 3298 Email: [email protected]
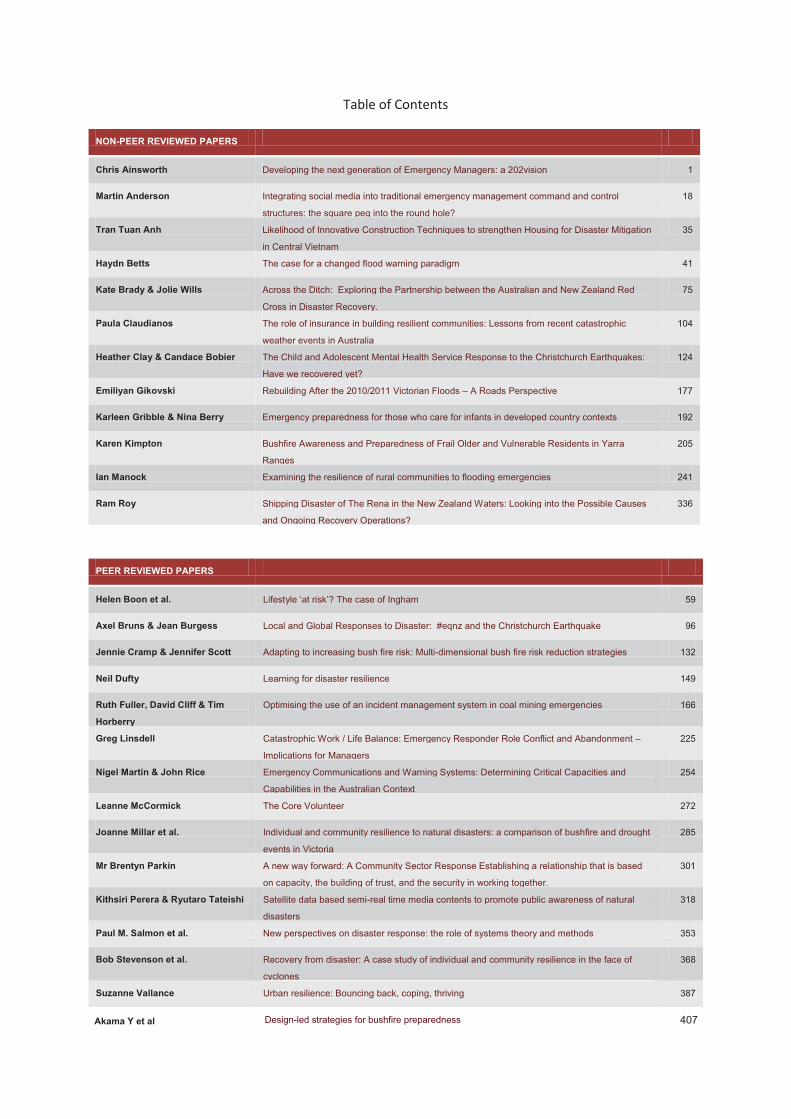
Table of Contents
NON-PEER REVIEWED PAPERS
Chris Ainsworth Developing the next generation of Emergency Managers: a 202vision 1
Martin Anderson Integrating social media into traditional emergency management command and control
structures: the square peg into the round hole?
18
Tran Tuan Anh Likelihood of Innovative Construction Techniques to strengthen Housing for Disaster Mitigation
in Central Vietnam
35
Haydn Betts The case for a changed flood warning paradigm 41
Kate Brady & Jolie Wills Across the Ditch: Exploring the Partnership between the Australian and New Zealand Red
Cross in Disaster Recovery.
75
Paula Claudianos The role of insurance in building resilient communities: Lessons from recent catastrophic
weather events in Australia
104
Heather Clay & Candace Bobier The Child and Adolescent Mental Health Service Response to the Christchurch Earthquakes:
Have we recovered yet?
124
Emiliyan Gikovski Rebuilding After the 2010/2011 Victorian Floods – A Roads Perspective 177
Karleen Gribble & Nina Berry Emergency preparedness for those who care for infants in developed country contexts 192
Karen Kimpton Bushfire Awareness and Preparedness of Frail Older and Vulnerable Residents in Yarra
Ranges
205
Ian Manock Examining the resilience of rural communities to flooding emergencies 241
Ram Roy Shipping Disaster of The Rena in the New Zealand Waters: Looking into the Possible Causes
and Ongoing Recovery Operations?
336
PEER REVIEWED PAPERS
Helen Boon et al. Lifestyle ‘at risk’? The case of Ingham 59
Axel Bruns & Jean Burgess Local and Global Responses to Disaster: #eqnz and the Christchurch Earthquake 96
Jennie Cramp & Jennifer Scott Adapting to increasing bush fire risk: Multi-dimensional bush fire risk reduction strategies 132
Neil Dufty Learning for disaster resilience 149
Ruth Fuller, David Cliff & Tim
Horberry Optimising the use of an incident management system in coal mining emergencies 166
Greg Linsdell Catastrophic Work / Life Balance: Emergency Responder Role Conflict and Abandonment –
Implications for Managers 225
Nigel Martin & John Rice Emergency Communications and Warning Systems: Determining Critical Capacities and
Capabilities in the Australian Context 254
Leanne McCormick The Core Volunteer 272
Joanne Millar et al. Individual and community resilience to natural disasters: a comparison of bushfire and drought
events in Victoria 285
Mr Brentyn Parkin A new way forward: A Community Sector Response Establishing a relationship that is based
on capacity, the building of trust, and the security in working together. 301
Kithsiri Perera & Ryutaro Tateishi Satellite data based semi-real time media contents to promote public awareness of natural
disasters 318
Paul M. Salmon et al. New perspectives on disaster response: the role of systems theory and methods 353
Bob Stevenson et al. Recovery from disaster: A case study of individual and community resilience in the face of
cyclones 368
Suzanne Vallance Urban resilience: Bouncing back, coping, thriving 387
Akama Y et al Design-led strategies for bushfire preparedness 407
Developing the next generation of Emergency Managers:
a 202vision
Mr Chris Ainsworth MBS CEM Fulbright Alumnus
Program Manager, Public Safety Leadership Development Program
Australian College of Community Safety RTO 1093
Principal: ‘raemec’ australia
International Association of Emergency Managers
Oceania Council
Vice President
Australian National Representative
Chair – Professional Development Committee
Paper presented at EARTH: FIRE AND RAIN Australian & New Zealand Disaster and Emergency Management Conference Brisbane – 16 – 18, April 2012
© Chris Ainsworth, 2012
Do not cite or reference without the express written consent of the author.
1
Developing the next generation of Emergency Managers:
a 202vision
Abstract:
Emergency Management has traditionally been implemented and managed ad hoc. Professionalism within the sector is increasing, forced by past events, with formal recognition of Emergency Management moving towards professional status, remaining obscure. For the sector to grow and mature, we all need to look to the future and determine how current practioners see the next generation of emergency managers evolving, and the next generation’s expectations of the current practioners? How do we design and develop and maintain a "cultural environment" which promotes development in capability and capacity to deal with disasters, maintain functionality and return to pre-impact conditions for our next generation of Emergency Managers. Using personal experiences, and examples from Hurricanes Katrina and Ike, Queensland floods. and Christchurch earthquakes, will demonstrate the role networks play in building "safe environments" which can lead to enhanced capabilities. A “Sand Box” provides an environment where we can develop greater capability within teams and increase group capacity during events and incidents. Critical and honest review of “after actions” of events and incidents assist us to build and expand trusted networks. The “Sand Box” provides the medium for us to play, investigate and develop new skills, capability and capacity safely. Emergency Management will evolve into a profession over the next decade, however: Will the next generation of Emergency Managers push the drive for change? Will the current Emergency Manages reflect on the past and identify the need for change? Will events of the past force change?
Keywords: emergency management, knowledge management, incident management, emergency managers, Incident Command Systems
2
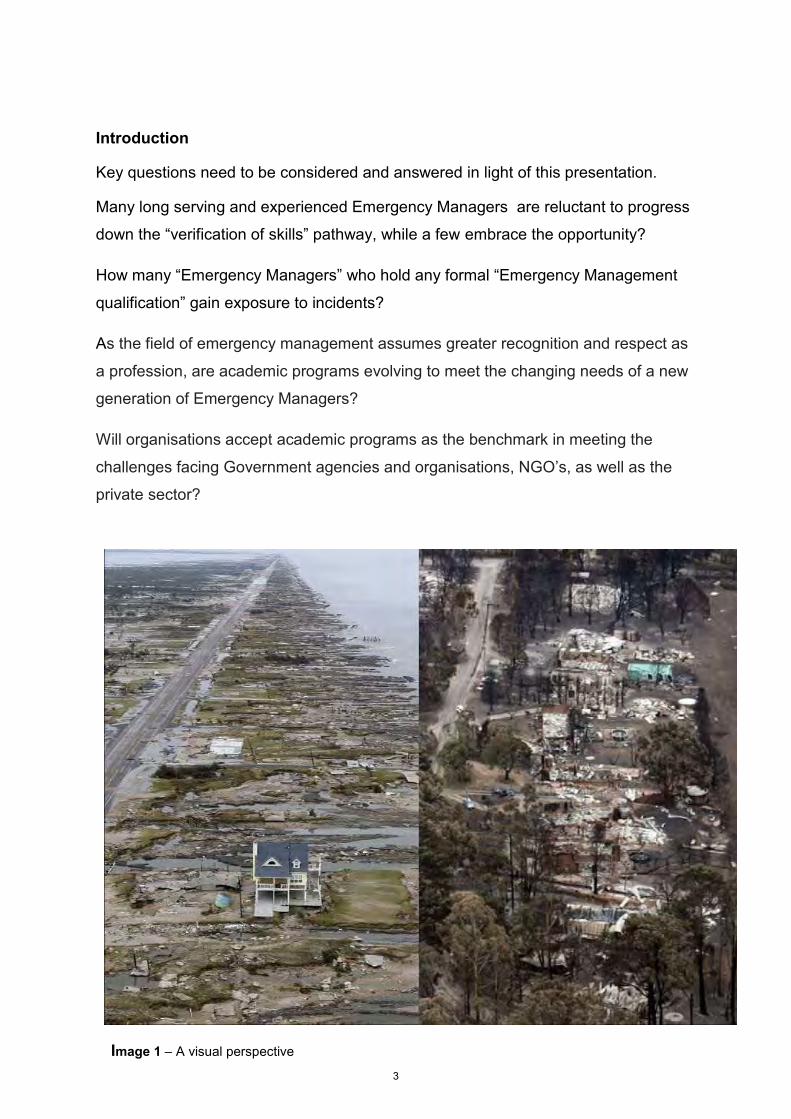
Introduction
Key questions need to be considered and answered in light of this presentation.
Many long serving and experienced Emergency Managers are reluctant to progress
down the “verification of skills” pathway, while a few embrace the opportunity?
How many “Emergency Managers” who hold any formal “Emergency Management
qualification” gain exposure to incidents?
As the field of emergency management assumes greater recognition and respect as
a profession, are academic programs evolving to meet the changing needs of a new
generation of Emergency Managers?
Will organisations accept academic programs as the benchmark in meeting the
challenges facing Government agencies and organisations, NGO’s, as well as the
private sector?
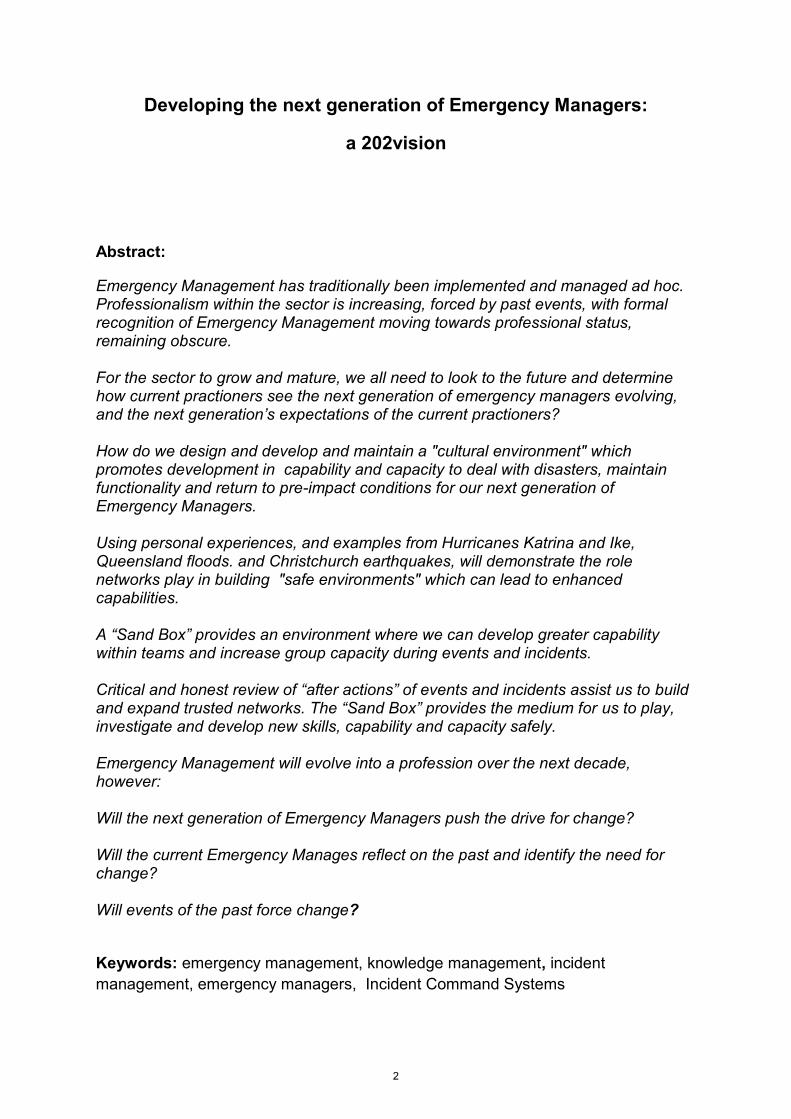
Image 1 – A visual perspective
3
Question –
As we progress through the presentation, can you identify the relationships between
these two images and your organisation?
Experiences within Disasters
Hurricanes Gustav and Ike (USA)
Victorian Bushfires
Queensland Floods and Cyclone Yasi
Christchurch earthquake
Japan earthquake
LESSONS LEARNED
4
Organisational Leadership Sustainability
As the field of emergency management assumes greater recognition and respect as a profession, are Leadership opportunities emerging to meet the changing needs of
a the next generation Emergency Managers?
Will organisations accept academic programs as the benchmark in meeting the challenges facing government agencies, NGO’s, as well as the private sector?
To increase professional respect between full time and volunteer
emergency management staff through equitable access to sustainable leadership opportunities
Project 2008
5
Ike ……. in a snapshot
Image 2 – Ike viewed from the International Space Station
Hurricane Ike was the third most destructive hurricane to ever make landfall in the United States. It was the ninth named storm, fifth hurricane and third major hurricane of the 2008 Atlantic hurricane season
Ike Statistically
Formed:
Texas mobilised:
Crossed Texas coast:
September 1, 2008
September 8, 2008
September 13, 2008
Dissipated: September 14, 2008 (Iceland)
Impacted the United States for 56 hrs
Highest Winds: 230 km/h (145 mph) Cat 4
Fatalities: 103 direct, 92 indirect, 34 missing
Damage: $28.7 billion (2008 USD) Sept 2008
Areas Affected: Turks and Caicos, Bahamas, Haiti, Dominican Republic, Cuba
Florida Keys, Mississippi, Louisiana, Texas (24 hrs) Mississippi Valley, Ohio Valley, Great Lakes region
Eastern Canada
6
What Dallas Mega Shelter Operations achieved in 48 hours?
A dormitory with a capacity of 1500 guests had been set up mainly by volunteer groups including:
American Red Cross, Tzu Chi Foundation (a Buddhist Compassion Relief organisation), Salvation Army, Scouts, Dallas CERT to name a few;
Fully manned American Red Cross registration centre
Full established meals distribution area managed by the Salvation Army
Dining area capable of seating 1000 people at a single sitting
Portable purpose built showering facilities provided by the Baptist Men
Grey water storage by the City of Dallas Sanitation
Portable toilets – contractor supplied
Waste disposal bins (several hundred) by the City of Dallas Sanitation
A 20 bed Medical Centre staffed by rotating shifts of volunteers from Parkland Hospital and other hospitals and medical agencies
Pharmacy services provided by Walmart located inside the Medical Centre
10 Bed Psychological Services Unit – Professional practioners and support groups from the City of Dallas area
Dallas Fire and Rescue
Dallas Police Department
Animal shelter operated by the City of Dallas Animal Control Services
Texas National Guard
Texas Medical Reserve
Texas National Food Bank
Dallas Community Emergency Response Teams (CERT)
Victim Relief Ministries (Yellow Shirts)
to name just a few.
This was a City of Dallas team effort in which everyone who was asked, willingly contributed to the success of the establishment of the shelter. An important aspect of the shelter management was partnering with the media in keeping the community informed. Each of the OEM staff provided the face of the Shelter Operations supported by the City of Dallas public relations / media team The journey home – every guest who came to Dallas were returned to their homes, or the place where they chose to resettle.
7
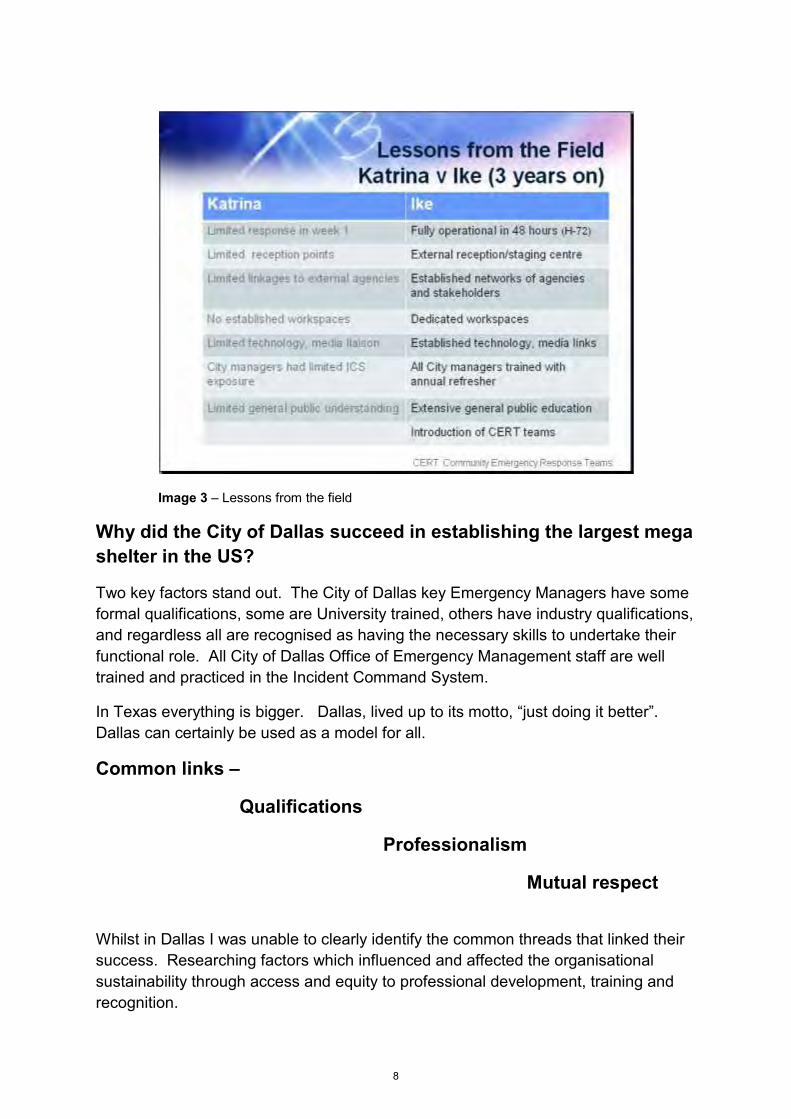
Image 3 – Lessons from the field
Why did the City of Dallas succeed in establishing the largest mega shelter in the US?
Two key factors stand out. The City of Dallas key Emergency Managers have some formal qualifications, some are University trained, others have industry qualifications, and regardless all are recognised as having the necessary skills to undertake their functional role. All City of Dallas Office of Emergency Management staff are well trained and practiced in the Incident Command System.
In Texas everything is bigger. Dallas, lived up to its motto, “just doing it better”. Dallas can certainly be used as a model for all.
Common links –
Qualifications
Professionalism
Mutual respect
Whilst in Dallas I was unable to clearly identify the common threads that linked their success. Researching factors which influenced and affected the organisational sustainability through access and equity to professional development, training and recognition.
8
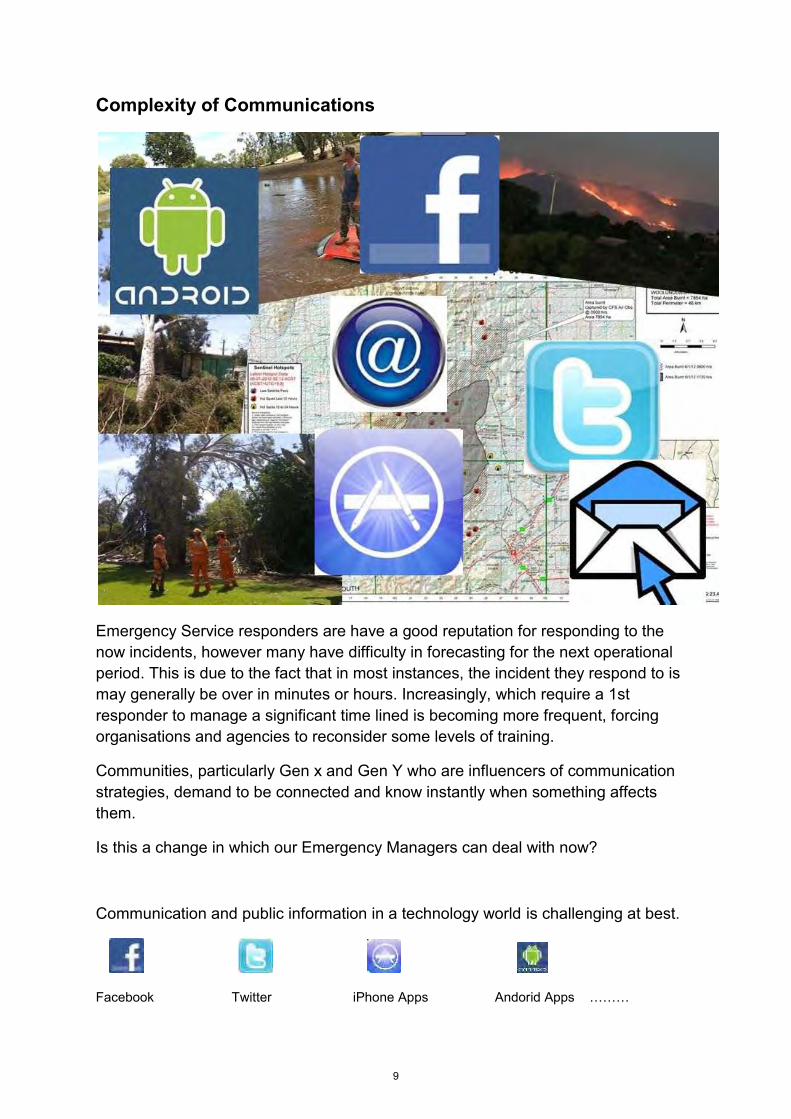
Complexity of Communications
Emergency Service responders are have a good reputation for responding to the now incidents, however many have difficulty in forecasting for the next operational period. This is due to the fact that in most instances, the incident they respond to is may generally be over in minutes or hours. Increasingly, which require a 1st responder to manage a significant time lined is becoming more frequent, forcing organisations and agencies to reconsider some levels of training.
Communities, particularly Gen x and Gen Y who are influencers of communication strategies, demand to be connected and know instantly when something affects them.
Is this a change in which our Emergency Managers can deal with now?
Communication and public information in a technology world is challenging at best.
Facebook Twitter iPhone Apps Andorid Apps ………
9
Communities are beginning to demand information, and in many cases, information often that has not been brought to the attention of the Emergency Manager or Incident Controller / Coordinator.
Such is the speed in which information flows throughout the community, it is difficult to disseminate the difference from legitimate information and background noise. Such information overload makes it difficult to determine appropriate actions for any given incident.
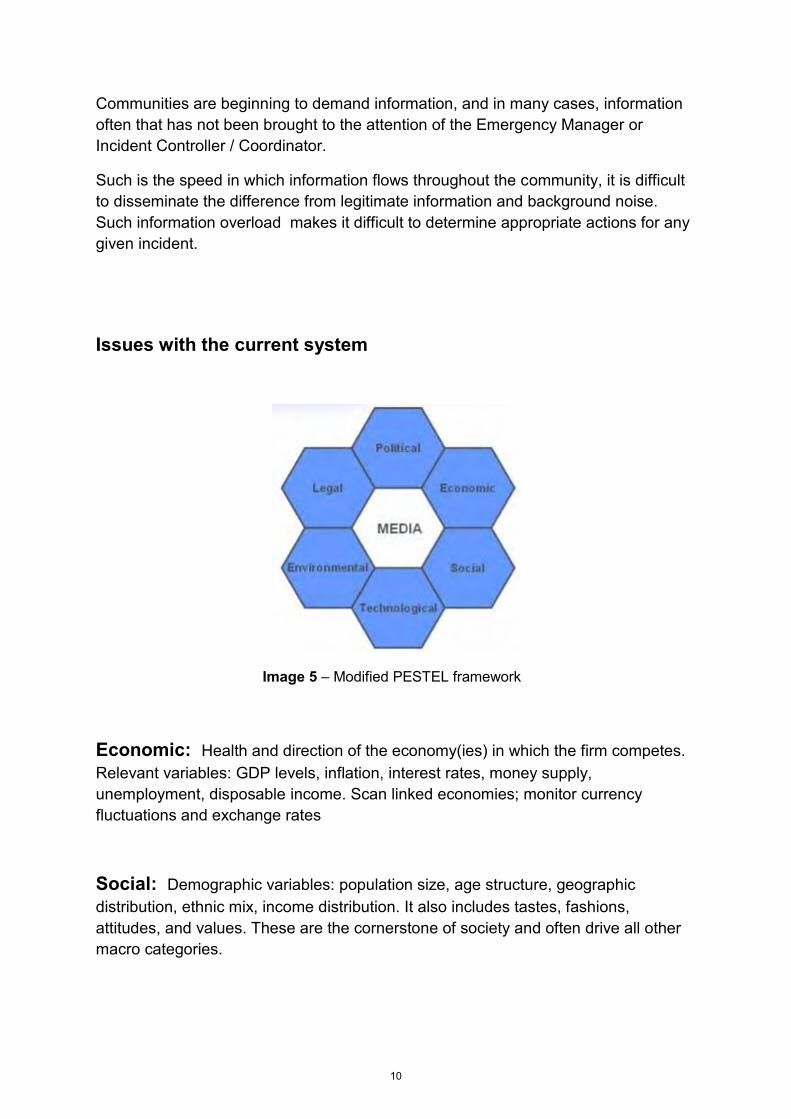
Issues with the current system
Image 5 – Modified PESTEL framework
Economic: Health and direction of the economy(ies) in which the firm competes. Relevant variables: GDP levels, inflation, interest rates, money supply, unemployment, disposable income. Scan linked economies; monitor currency fluctuations and exchange rates
Social: Demographic variables: population size, age structure, geographic distribution, ethnic mix, income distribution. It also includes tastes, fashions, attitudes, and values. These are the cornerstone of society and often drive all other macro categories.
10
Technological: Primary new products, processes, and materials. Includes the institutions and activities involved in creating new knowledge and translating it into new outputs, products, processes and materials. Government support and initiatives can be very influential.
Environmental: Reflects concern for the sustainability of the physical environment. Issues include; greenhouse effect, CO2 emissions, genetic engineering, Factors for consideration include environmental policies, waste disposal, and energy consumption.
Legal: Factors include employment law, health and safety, product safety, monopolies, and mergers legislation.
Political: Issues: government stability, alignments at the international level, taxation and fiscal policies, foreign trade regulation, social welfare policies, attitudes towards competition and state ownership,. All governments’ policies are to further their own countries interests.
Media: An increasing important influence on business, politics and society as opinion former and shaper. The media is affecting outcomes in ways unascribable to other macro-drivers.
(Angwin, 2008)
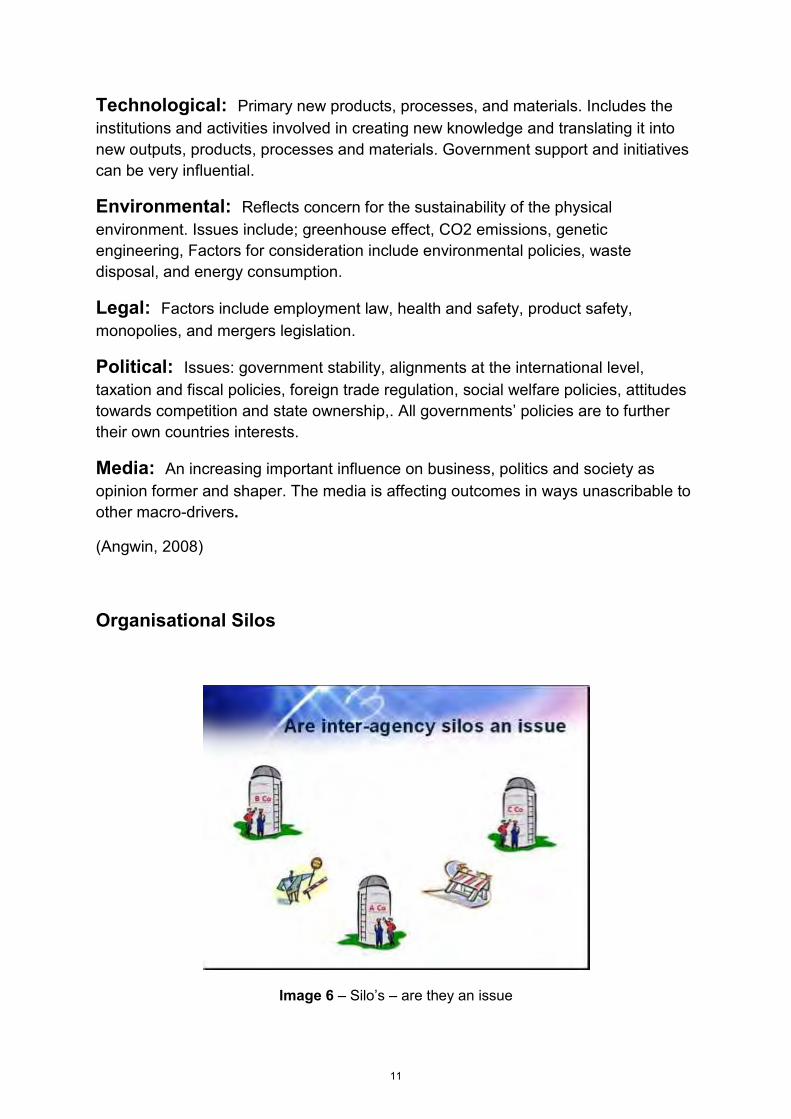
Organisational Silos
Image 6 – Silo’s – are they an issue
11
The questions need to be asked “do we operate in silos’s?” and “do we support separate cultures and structure?”
These questions are posed, not in answering them, but in promoting discussion within an open forum.
Are we in an era where guardians of entry. Are these the road blocks preventing the integration and sharing of knowledge. How do we break down these barriers?
The forum will be a component of the presentation and post conference follow up which will endeavor to address these complex questions.
Key Leadership Issues
What are the key leadership issues we have to address to improve our ability to respond to emergencies?
Has any of the Royal Commission / Coronial reports sporned real change within the sector?
Has it improved the decision making process?
When was the last time you stood back and looked at the “big picture” during an incident, or were you engulfed in the “issues of the moment”.
How often do you allow your team to stand back and look at the strategic picture?
Do you have the resources and skill to look from above?
How do we transition from the role of 1st responder to Emergency Manager?
Can we actually quickly transition from one role to another?
Are there any barriers preventing this?
12
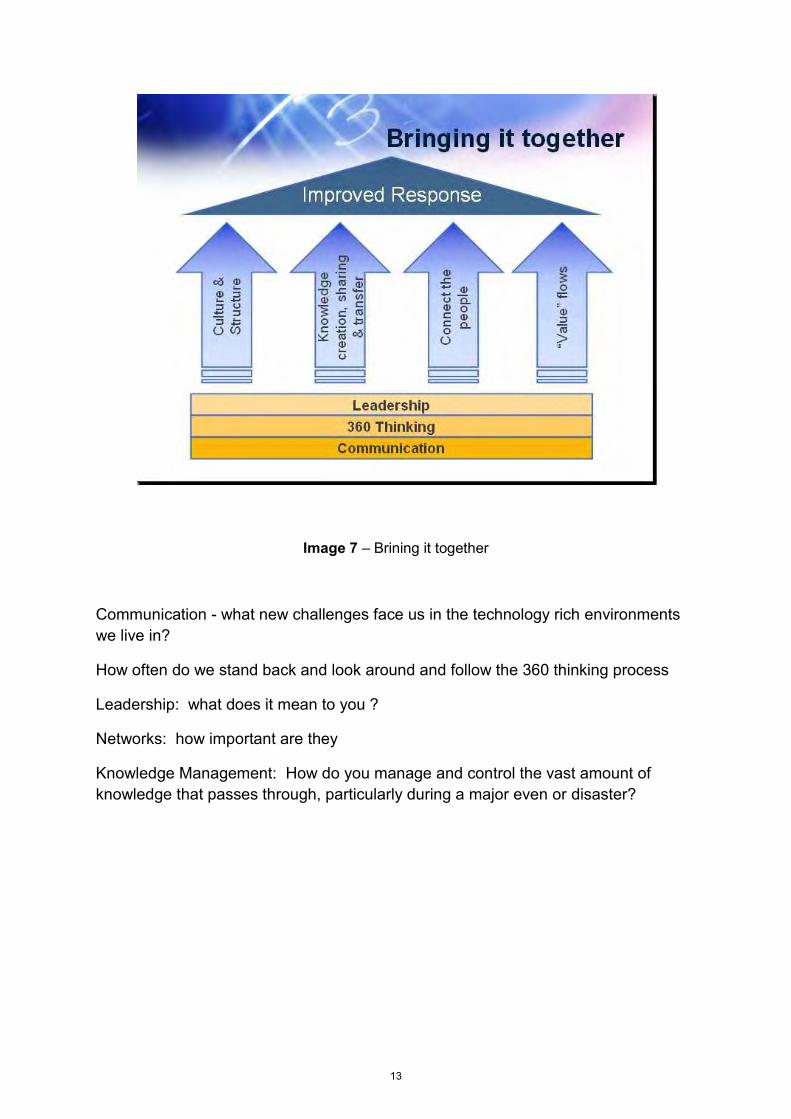
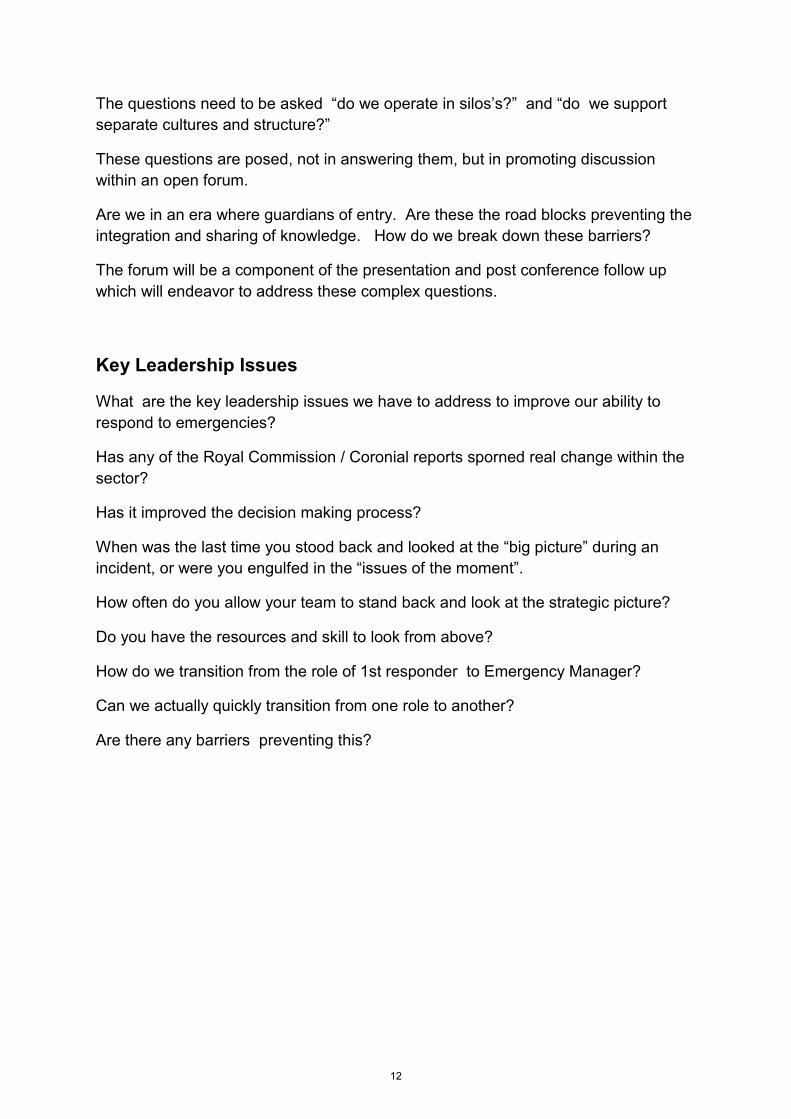
Image 7 – Brining it together
Communication - what new challenges face us in the technology rich environments we live in?
How often do we stand back and look around and follow the 360 thinking process
Leadership: what does it mean to you ?
Networks: how important are they
Knowledge Management: How do you manage and control the vast amount of knowledge that passes through, particularly during a major even or disaster?
13
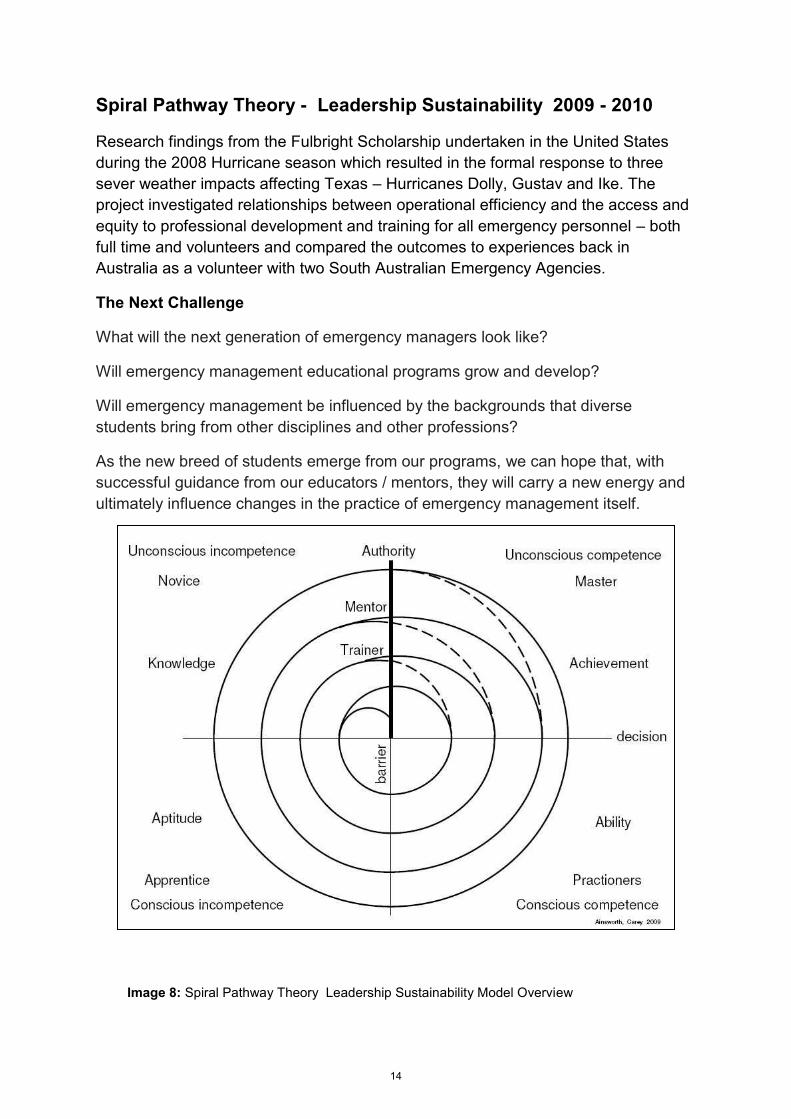
Spiral Pathway Theory - Leadership Sustainability 2009 - 2010
Research findings from the Fulbright Scholarship undertaken in the United States during the 2008 Hurricane season which resulted in the formal response to three sever weather impacts affecting Texas – Hurricanes Dolly, Gustav and Ike. The project investigated relationships between operational efficiency and the access and equity to professional development and training for all emergency personnel – both full time and volunteers and compared the outcomes to experiences back in Australia as a volunteer with two South Australian Emergency Agencies.
The Next Challenge
What will the next generation of emergency managers look like?
Will emergency management educational programs grow and develop?
Will emergency management be influenced by the backgrounds that diverse students bring from other disciplines and other professions?
As the new breed of students emerge from our programs, we can hope that, with successful guidance from our educators / mentors, they will carry a new energy and ultimately influence changes in the practice of emergency management itself.
Image 8: Spiral Pathway Theory Leadership Sustainability Model Overview
14
Emerging Players
Leadership professional development and training opportunities are extremely limited in Australia, with very few emergency services organisations committing to sustainable leadership development programs. Most organisations are relying on the current Productivity Places program or the Australian Emergency Management Institute for the delivery of Professional Development Programs.
The Australian College of Community (ACCS) is a leading Registered Training Organisation (RTO) delivering Leadership Programs for Certificate IV through to the Advanced Diploma Public Safety level Australian Quality Training Framework (AQTF) qualifications.
ACCS identified gaps within the current training programs and has collaborated with the New South Wales (NSW) Department of Primary Industries RTO TOCAL College and TAFE NSW Riverina Institute to establish a Public Safety Training Network. The Network offers Agencies, Organisations and individuals, both paid and volunteer emergency services operatives, a single career training development pathway for those requiring Public Safety qualifications within their career advancement. Currently no other RTO in Australia can offer career pathways in Leadership, Community Safety, Emergency Management and Fire Fighting streams.
The philosophy behind the initiative is to integrate training into organisational programs and operational demands, realizing that no two organisations operate in the same manner. Through recognising the strengths of each organisations, the programs bring together a diverse range of students who are learning the skills for their role and the roles of other emergency service organisations and private industry.
This philosophy has proven effective in the recent multi state / country disasters in which the region has experiences over the past few months. Interstate and overseas deployments mean that emergency service operatives require a diverse range of skills when operating in foreign environments.
.
15
Increasingly, operatives are also looking for peer recognition through professional organisations and associations. The International Association of Emergency Managers is the only Emergency Management professional body in the world which recognises professional skills and credentials individuals through a comprehensive peer review process
The Associate Emergency Manager (AEM) for non degreed operatives and the Certified Emergency Manager® (CEM®) for degreed operatives.
The future is bright for Australian Emergency Service operatives in paid and volunteer roles to achieve their personal and professional goals through a lifelong supported career pathway.
16
References
Angwin D, Cummings S, Smith C, 2008 The Strategy Pathfinder: core cases and macro cases, Blackwell Publishing, pp 1 - 29 Lea, A, 2008, ‘Enhancing Tasmania SES Volunteer Recruitment and Retention’, Research Report, Andrew Lea Director State Emergency Service Tasmania, Hobart September 2008
Guest, D (1986), “What’s new in…Motivation”, in Landy, F.J. Readings in Industrial and Organisational Psychology, The Dorsey Press, Chicago, pp.177-183.
Henning, K , 2008, ‘What will the Next Generation of Emergency managers Look Like?’, IAEM Bulletin, vol. 25, no.102, October 2008, p.8 continued p14.
Pearce, T, 2009, ‘Education and Leadership Support the Effort to Have Emergency Management Seen as a Profession’, IAEM Bulletin, vol. 26, no. 2, February 2009, pp.3-4.
Scholtes, P. (1987), An Elaboration of Deming’s Teachings on Performance Appraisal, Joiner Associates Inc, Madison WI.
Wood, J., Zeffane, R., Fromholz, M., and Fitgerald, J. (2006), Organisational Behaviour: Core Concepts and Applications, Brisbane: Wiley.
http://en.wikipedia.org/wiki/Mentor, viewed September 2009
http://www.disaster-resource.com/articles/08p_062.shtml ‘Public/Private Partnerships Help Iowa Respond and Recover’, Alison Dunn viewed July 2009
http://www.innovateonline.info/index.php?view=article&id=690 ‘Preparing Graduate Students for Virtual World Simulations: Exploring the potential of an Emerging Technology, Anne M Hweitt, Susan Spencer, Danielle Mirliss, Riad Twal, viewed August 2009
http://www.stopdisastersgame.org/en/home.html UN/International Strategy for Disaster Reduction, viewed June 2009
17
Integrating social media into traditional emergency management command and control structures: the square peg into the round hole?
Martin Anderson
Digital Media Manager, Strategic Communications
CFA (Country Fire Authority), Victoria, Australia
Paper Presented at
EARTH: FIRE AND RAIN
Australian & New Zealand Disaster and Emergency Management Conference
Brisbane 16-18 April 2012
18
Integrating social media into traditional emergency management command and control structures: the square peg into the round hole?
Abstract How can emergency services adapt to a world where ordinary members of the
community can exchange information more quickly and effectively with each
other than seems possible within traditional emergency management
command and control structures?
Can a system that traditionally relies on linear information flow and strict
authorisation processes adapt and stay relevant in a world where photos of
disasters can be circulating around the world before emergency service
personnel have even left the station?
Victoria's emergency services have been grappling with this problem since
Black Saturday and for the first time this bushfire season began the process
of formally integrating social media into their incident management structures
both at agency level and in Victoria’s State Control Centre.
This paper will give a first hand account of the competing viewpoints on how
social media should fit into the emergency management process and explores
the cultural implications, opportunities and risks of the move to embrace the
open, transparent, and honest nature of social media.
It will also look at the practical steps that have been taken in Victoria to try to
bridge the gap between those competing viewpoints including the hosting of a
multi-agency training exercise using a social media crisis simulator called
FireBell.
Keywords: social media, communication, technology, mobile
19
Introduction The 2009 Victorian Bushfires Royal Commission established the critical need
for improved information flow between emergency services and the
community during major emergencies, calling on agencies to place as much
value on warnings as they do on fire suppression.
The 2010/11 Victorian Flood Warnings and Response Review called on
agencies to actively pursue the use of social media as part of their emergency
warning and public information system and undertake further trials to explore
the opportunity for greater use of social media as a credible source of
information to and from the public during an emergency.
While some members of the community, including individual emergency
service members, used social media to communicate and share information
on Black Saturday, it was not used in any official emergency capacity.
(CFA had established a Facebook page in November 2008 but by February
2009 it was only being used to share general news and community education
content, not emergency warnings or other incident information.)
Subsequent disasters around the world, in particular the Haiti earthquake in
2010 demonstrated how effective social media combined with mobile
communication devices can be during emergencies.
“Haiti allowed us to glimpse into a future of what disaster
response might look like in a hyper-connected world.” Paul Conneally, International Federation of the Red Cross and Red Crescent
Societies (TED Talk, Feb 2012)
Adapting to the speed and perceived loss of control that social media seems
to involve has proved a difficult cultural challenge for emergency service
organisations (ESOs) around the world.
20
How can ESOs adapt to this new mobile world where ordinary community
members can exchange emergency information with each other more quickly
than seems possible within traditional emergency management
communication structures?
Can a system that traditionally relies on linear information flow and strict
authorisation processes adapt and stay relevant in a world were photos of
disasters are circulating around the world before emergency services have
even responded?
This paper will argue that social media has an important role to play in
creating resilient communities by helping to transform the relationship
between ESOs and the community from one of command and control to one
of collaboration and joint responsibility.
Accepting reality
“If you can’t get the skeleton out of the closet, you might as
well make it dance.” George Bernard Shaw
There now seems to be a general acceptance within ESOs that social media
is a reality that isn’t going away. It has to be accepted and ‘dealt with’ but the
debate over what exactly that will mean for traditional emergency
management culture has still to be resolved.
Some see the ‘social media revolution’ as something to fear and believe the
only way to manage the risk is to try to constrain it within official command
and control structures.
Others see it as an opportunity to move away from command and control
structures and generate a more open, transparent, honest and collaborative
approach to emergency management.
21
The debate has raised many questions.
Can, or even should, emergency service organisations try to compete or
engage with the various unofficial sources of community information on social
media channels?
If official emergency service channels are not always the best source of
information for the community what does that mean for agencies’ relevance /
credibility?
How do agencies provide quality emergency warnings and information without
creating a passive community incapable of making decisions for itself?
Can the tools of social media and the growth of mobile technologies provide
an opportunity to develop effective emergency communications and warnings
systems without disempowering the community?
Test and learn – Victoria’s experience
“The grassroots has been strengthened through the
social power of sharing and they are challenging the old
models, the old analog models of control and
command.” Paul Conneally, TED Talk, Feb 2012
For those used to working within linear command and control structures the
shift in mindset required to make effective use of networked communication
platforms like social media can be difficult.
There is a tendency to apply traditional static website (Web 1.0) principles to
the dynamic information streams of social media (Web 2.0).
One-way social media?
22
A common argument is that emergency agencies should use social media to
push official information out to the community but not respond or engage as
this could lead to the release of incorrect, inconsistent, or unauthorised
information.
In traditional communication terms this would be the equivalent of phoning
someone to tell them an important piece of information and then hanging up
as soon as they asked a question.
In a paper for this conference Dr Yoko Akama highlights how simply pushing
out official information “reinforces the power-dynamics of control, making
audiences passive.”
“This perpetuates the disempowerment felt by communities
who are not engaged in a dialogic process, further broadening
the gap between ‘expert’ fire authorities with knowledge and
experience of bushfires and the community as ‘non-experts’.” Dr Yoko Akama, Design-led strategies for Bushfire Preparedness, 2012
By using social media effectively, emergency managers have the ability to
break this power dynamic by creating a more collaborative approach to
emergency management.
By engaging with the community in real-time via social media, agencies can
help foster an understanding that both the community and emergency
services have an important role to play in all four phases of emergencies
(Planning, Preparation, Response and Recovery).
“You got to go with the hypothesis that the public’s not a
liability, they are a resource... if information is coming from the
public, we need to see it.” Craig Fugate, Federal Emergency Management Agency Administrator,
USA, Jan 2011.
23
The ‘one-way social media’ argument also fails to understand the significance
of the changes that this new form of networked communication entails.
“While almost everyone in crisis communications understands
that these changes are big, I’d like to suggest that they are
much bigger than most realise. Crisis communication in the
social media era is not even the same game as it was before”
Gerald Baron (2011), Social Media & Crisis Communications
The potential of social media as a tool for gathering community intelligence
that could inform operational decision-making is developing rapidly thanks to
academic research and the development of various crowdsourcing tools.
The potential for intelligence gathering has been recognised in Victoria by the
establishment of a Social Media Monitor role within the State Control Centre
structure.
Authorisation processes
One of the key recommendations by Queensland Police after their widely
praised use of social media during the floods and cyclone of 2010/11 was to
rethink clearance processes – “trust your staff to release information”. (QPS
Social Media Case Study 2011)
This is difficult for organisations that traditionally require information to be fed
up through the chain of command, verified, authorised and then fed back
down again for dissemination to the community.
This linear information flow does not encourage the timely dissemination of
critical information but the risks of releasing inaccurate information are often
seen as more significant.
It has been identified that emergency service culture often resulted in
personnel waiting until they have all the information they feel the community
24
might need and are 100% sure of its accuracy before any information was
released.
Victoria’s Fire Services Commissioner specifically addressed this issue when
he introduced new requirements for “timely, relevant, and tailored” emergency
warnings and advice.
The choice of words, and their order, emphasised that timeliness is now
considered the most important factor when it comes emergency information.
A 100% perfect warning (if such a thing exists) after the threat has passed is
useless.
In Queensland the police media director sat in on briefings to Premier Anna
Bligh and tweeted new information directly from those meetings. This ensured
the latest information was being provided to the media and community.
Victorian fire services have attempted to address the “authorisation dilemma”
in social media by developing a close relationship between the Social Media
Officer and the State Duty Officer (who can authorise the release of
information).
The Social Media Officer has also been physically seated next to the Public
Information Section Leader to ensure the latest information can be released
via social media as soon as it is available. This also allows community
intelligence from social media to be fed back into the system as efficiently as
possible.
Templates, templates, and more templates
The need to post potentially large numbers of emergency warnings as quickly
as possible has been addressed in Victoria by integrating social media into
the One Source, One Message (OSOM) tool.
25

OSOM was created after Black Saturday to enable information officers around
the state to publish warnings simultaneously to multiple mediums – agency
websites, emergency broadcasters, Victorian Bushfire Information Line etc.
The integration of social media into the OSOM system means that all
warnings are automatically posted to agency Twitter and Facebook accounts
as soon as they are issued.
Sample warning tweets from OSOM:
Sample warning post to Facebook from OSOM:
26
However, while this ensures warnings are posted in a timely fashion, it also
means information can be repetitive and users have said this makes the
warnings less effective.
The format of the message is being reviewed to consider including more
useful information on social media channels rather than directing readers to
agency website links. It’s worth noting that many mobile users can’t access
the web if they don’t have credit on their phone but have free access to
Facebook and Twitter.
In the meantime, the issue is being addressed by posting additional
information manually and by monitoring and responding to any questions
posted to official social media platforms.
There has also been a desire to generate standard templates / statements for
common questions that are asked on social media to ensure consistency and
accuracy.
Once again this has led to repetitive messages and, on occasions, a lack of
the personal, conversational style that is more effective on social media.
One way of addressing that would be to allow experienced social media
officers to be more personal in their engagement and not require them to ‘cut
and paste’ pre-prepared responses.
Removing old social media posts
When the decision was taken to post official emergency warnings on Twitter it
was argued that old tweets should be removed once a warning expires, just
as old warnings are removed on the static agency website.
When this was implemented it quickly became clear that removing old tweets
caused serious confusion and anger among Twitter followers.
27
Users clearly understood Twitter as a chronological stream of information and
were confused when agencies tried to ‘whitewash’ old tweets from history.
Taking a traditional media example, the deleting of old tweets is the
equivalent of trying to gather up all the old copies of yesterday’s newspaper
and burning them to stop anyone getting out of date information.
It also became clear that users look at an accounts history as a way of
establishing its veracity and to identify the sort of information they can expect
to receive if they follow the account.
The two-way nature of social media allowed agencies to quickly identify this
issue and the deleting of tweets was stopped.
The language of open, honest and transparent engagement vs command and
control
In order to take best advantage of the benefits of social media and break
down the “us and them” mentality, emergency services need to be open about
their limitations and honest about their mistakes.
For those from the command and control tradition, who believe it is important
to preserve the ‘authority’ status of their emergency agency, this can be
difficult to accept.
This fire season, in Victoria, official social media spokespeople have
welcomed community reports of issues, inconsistencies, and inaccuracies
with official warning information and acted quickly to correct issues.
This has led to a much more collaborative approach that has allowed
agencies to improve their communications and gain credibility with the online
community.
28
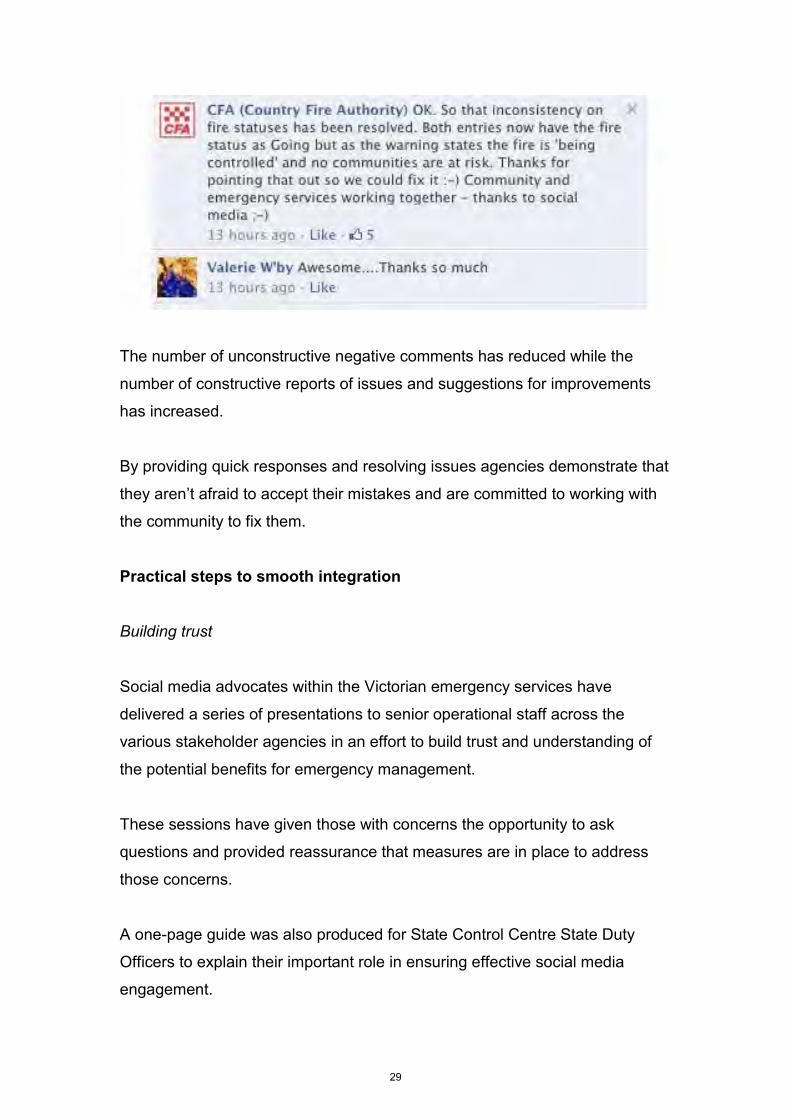
The number of unconstructive negative comments has reduced while the
number of constructive reports of issues and suggestions for improvements
has increased.
By providing quick responses and resolving issues agencies demonstrate that
they aren’t afraid to accept their mistakes and are committed to working with
the community to fix them.
Practical steps to smooth integration Building trust
Social media advocates within the Victorian emergency services have
delivered a series of presentations to senior operational staff across the
various stakeholder agencies in an effort to build trust and understanding of
the potential benefits for emergency management.
These sessions have given those with concerns the opportunity to ask
questions and provided reassurance that measures are in place to address
those concerns.
A one-page guide was also produced for State Control Centre State Duty
Officers to explain their important role in ensuring effective social media
engagement.
29
Policies and procedures
Social media and emergencies are both unpredictable and dynamic
environments that can change rapidly. As such, it is difficult to develop
detailed policies and procedures to cover every eventuality.
But producing policy, guidelines and procedures has proved useful in
providing reassurance to those from a command and control background.
The development of social media procedures and a social media manual has
also provided useful guidance to the less experienced social media officers
who have filled the role during extended emergencies this fire season.
Training - FireBell social media crisis simulation
The FireBell exercise was the first of its kind in Australia, with three primary
overarching objectives of informing, identifying and improving capacity and
capability in the use of social media for emergency situations.
The exercise provided a series of key learnings for the State Control Centre
and the emergency service organisations involved.
The exercise was an invaluable tool for training staff in the use of social media
during an emergency, allowing participants to develop an understanding of
the threats and opportunities without the risk of using live social media
accounts.
It also allowed those unfamiliar with social media the opportunity to see it ‘in
action’ in realistic emergency scenarios.
The exercise evaluation report by the Victorian Emergency Services
Commissioner said its success was a result of a combination of the following
factors:
30
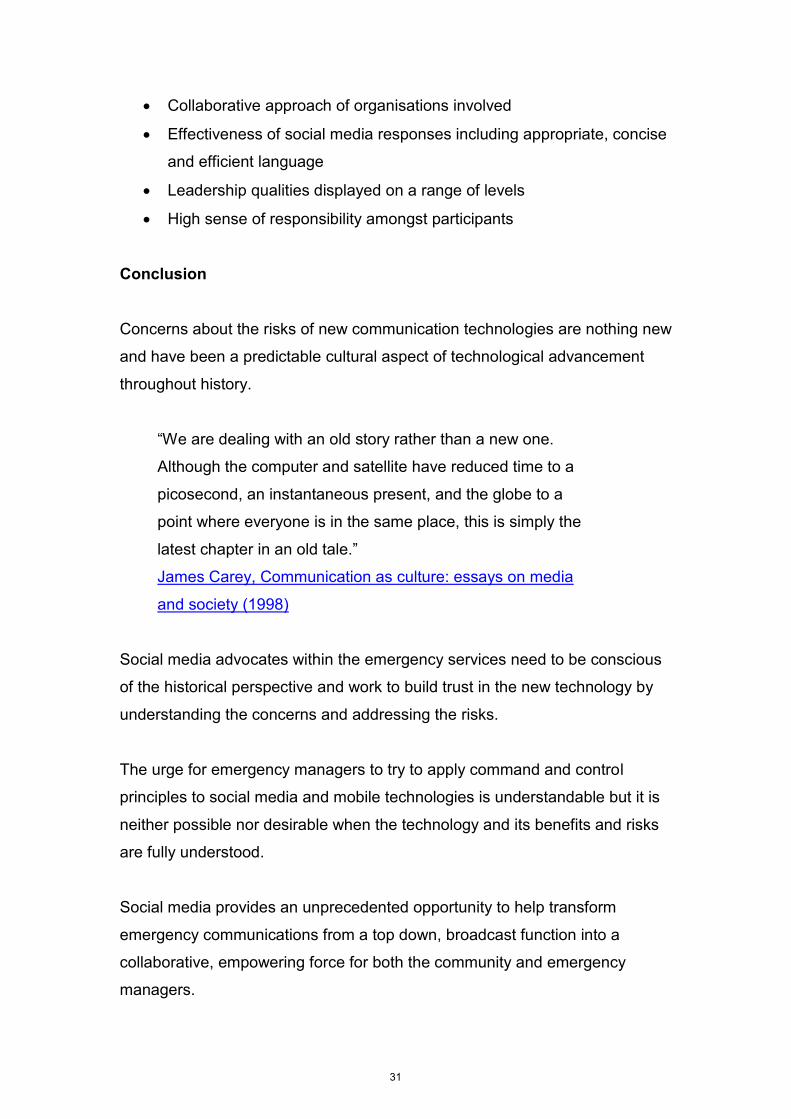
Collaborative approach of organisations involved
Effectiveness of social media responses including appropriate, concise
and efficient language
Leadership qualities displayed on a range of levels
High sense of responsibility amongst participants
Conclusion
Concerns about the risks of new communication technologies are nothing new
and have been a predictable cultural aspect of technological advancement
throughout history.
“We are dealing with an old story rather than a new one.
Although the computer and satellite have reduced time to a
picosecond, an instantaneous present, and the globe to a
point where everyone is in the same place, this is simply the
latest chapter in an old tale.”
James Carey, Communication as culture: essays on media
and society (1998)
Social media advocates within the emergency services need to be conscious
of the historical perspective and work to build trust in the new technology by
understanding the concerns and addressing the risks.
The urge for emergency managers to try to apply command and control
principles to social media and mobile technologies is understandable but it is
neither possible nor desirable when the technology and its benefits and risks
are fully understood.
Social media provides an unprecedented opportunity to help transform
emergency communications from a top down, broadcast function into a
collaborative, empowering force for both the community and emergency
managers.
31
The “planning myth” that any crisis management operation is best organised
in a military-styled command and control mode is being challenged on a
number of fronts.
“Effective responses in such extreme circumstances are
necessarily improvised, flexible and networked (rather than
planned, standardised and centrally led)… the internet and its
social networking sites have added a whole new layer of
opportunities as well as complications in organising
communication and ‘meaning making’ in times of crisis, which
needs to be addressed and not willed away in crisis planning
processes.” (Boin and ‘t Hart, The Australian Journal of Public Administration, vol. 69,
no.4 2010)
The biggest challenge of all may be for emergency service organisations to
accept that in a hyper-connected world they are no longer the only source of
‘authority’ when it comes to emergency information.
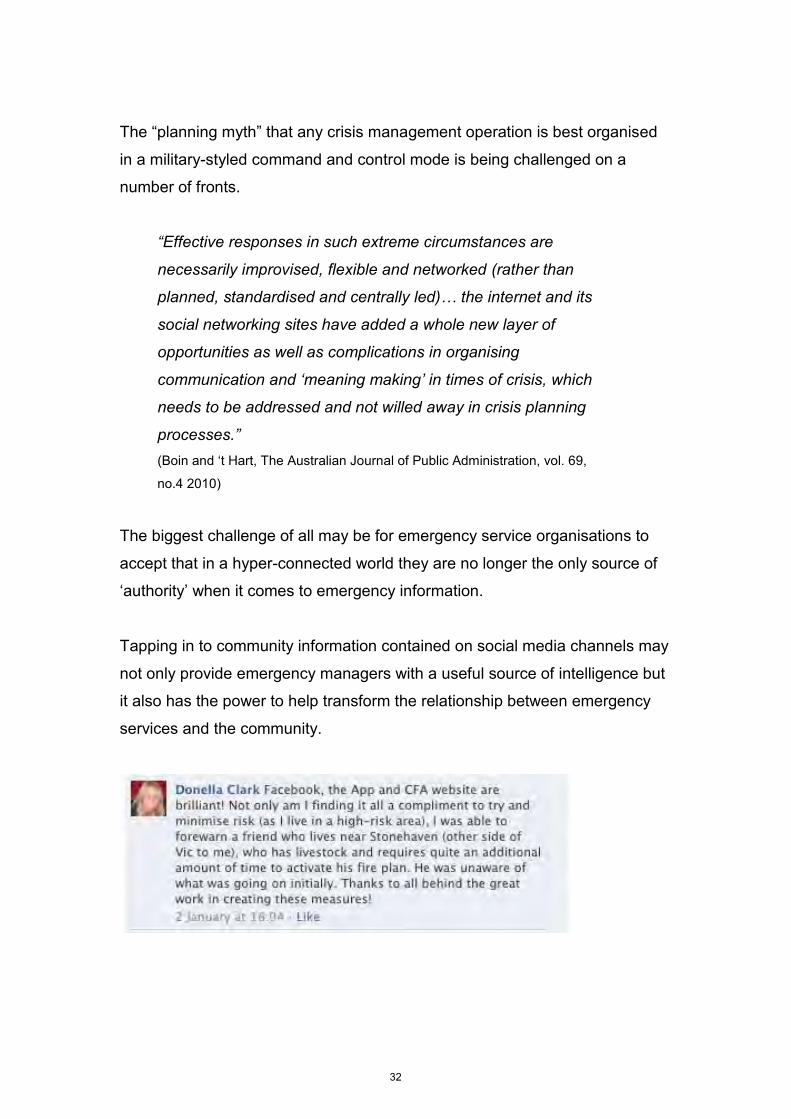
Tapping in to community information contained on social media channels may
not only provide emergency managers with a useful source of intelligence but
it also has the power to help transform the relationship between emergency
services and the community.
32
References: Akama, Dr Yoko, Design-led strategies for bushfire preparedness, 2012 Australian &
New Zealand Disaster and Emergency Management Conference paper.
http://anzdmc.com.au/abstractsaccepted/Abstracts_view.php?editid1=244
Baron, Gerald. Senior Advisor, O’Brien’s Response Management, Author of “Now is
Too Late 2: Survival in an Era of Instant News”
Social Media & Crisis Communicaions - “It’s a Whole New Game”
http://youtu.be/MFt7NXDhcmE
Boin, Arjen and ‘t Hart, Paul. Organising for Effective Emergency Management:
Lessons from Research, The Australian Journal of Public Administration, vol. 69,
no.4, pp. 357-371
Carey, J. (1998) Communication as culture: essays on media and society - Google
Books http://bit.ly/y2lGWA
Conneally, Paul. Public communications manager for the International Federation of
the Red Cross and Red Crescent Societies. (TED Talk Feb 2012)
http://www.ted.com/talks/paul_conneally_digital_humanitarianism.html
Firebell Training Exercise Evaluation Report, Emergency Services Commissioner,
February 2012. (to be published March 2012).
Fugate, Craig. Administrator of the Federal Emergency Management Agency
(FEMA), USA
Haiti: the importance of Social Media Use During a Disaster
http://video.esri.com/watch/163/haiti-the-importance-of-social-media-use-during-a-
disaster
Using the Mobile Platform to Push Critical Information to Disaster Victims
http://video.esri.com/watch/164/free-the-data-using-the-mobile-platform-to-push-
critical-information-to-disaster-victims
33

Queensland Police Service Social Media Case Study (2011)
http://www.police.qld.gov.au/services/reportsPublications/other/socialmedia.htm
34
[Type text]
Likelihood of Innovative Construction Techniques to strengthen Housing for Disaster Mitigation in Central Vietnam
Mr Tran Tuan Anh
PhD candidate, RMIT University
Australia
Email: [email protected] ; [email protected]
Phone: 0423609054
Paper presented at EARTH: FIRE AND RAIN Australia & New Zealand Disaster and Emergency Management Conference Brisbane, 16-18, April 2012
35
Likelihood of Innovative Construction Techniques to strengthen Housing for Disaster Mitigation in Central Vietnam
Abstract: Disaster mitigation for marginal communities has become one of the most significant development goals of the 21st century. Vietnam has been reported one of the five most vulnerable nations in the world to climate change and so serves as a useful case study in developing appropriate housing solutions after disasters. In addition, some local communities in rural areas of Vietnam still keep strong vernacular traditions in their housing which need intense consideration before employing any new techniques of disaster mitigation on them. Perceptions on how to develop a sustainable housing solution for such communities, therefore, is still controversial with very few useful options developed to date.
The paper investigates the existing unsafe conditions of traditional houses of a local community in central Vietnam, exposed to disasters, together with an identification of traditional features of this housing that would be needed to preserve in future construction. Some important gaps of these traditional houses in terms of disaster risk reduction are then displayed to show opportunities where new construction techniques have a high possibility to perform against extreme climate events.
Keywords: disaster, housing, construction Introduction
Reconstruction often reproduces vulnerability to future disasters (Wisner et al., 2004). The complex relationship between human interactions and climate crisis require aid agencies to re-consider their ways or approaches to disaster mitigation in the future (Suarez et al., 2008). Inappropriate design solutions and badly constructed houses have been known as one of the root causes of increased disaster risks (Davis, 1978). It is noticed that addressing local patterns and responsive characteristics in housing reconsolidation or rebuilding is necessary to provide a so-called ‘normal house’ for a given community (Davis, 1978). Solutions of housing, both technical and non-technical, are seen as ‘responsive’ or ‘appropriate’ once they not only meet shelter needs but also bring about non-housing outcomes for inhabitants (such as family stability, better homework and educational performances, healthy living practices etc.) (Fien et al., 2008).
However, one of the most common failures in recent post-disaster housing reconstruction is the exclusive concentration on physical and visual aspects of
36
buildings with little or no attention to people’s normal activities (farming, crafting, fishing, etc.) and community’s meanings, symbols, or traditions (Audefroy, 2010). These defects may create conflicts or rejections from inhabitants towards proposed mitigation measures (Audefroy, 2010) and subsequently lead to unsuccessfulness of housing programs. In most of housing reconstruction projects in central Vietnam, their excessive focuses on technical issues to provide robust buildings has led to inadequate responses to local contexts and potentially created unacceptance of people. One of main causes originates from evaluation of successfulness of housing reconstructions mostly based on physical outcomes (visible buildings or facilities), whereas the key criteria of assessment absolutely come from people’s acceptance and adoption towards their proposed measures (Gharaati, 2009). In addition, the common approach to post-disaster reconstruction by applying one-size-fits-all solutions for geographically and culturally different locations may create greater severity of post-disaster built environment (Esther, 2011).
Sustainable housing reconstruction comes into existence as a result with the central focus on achieving the best long-term results of post-disaster reconstruction (UNEP and SKAT, 2007). It will not only ensures technical stability of buildings, better construction quality, but also offer a plenty of social, economic, and environmental benefits for disaster prone regions in the future (UNEP and SKAT, 2007). Climate change and complicated occurrences of climate events in recent years have highly supported the promotion of sustainable design solutions for vulnerable regions all over the world (Suarez et al., 2008).
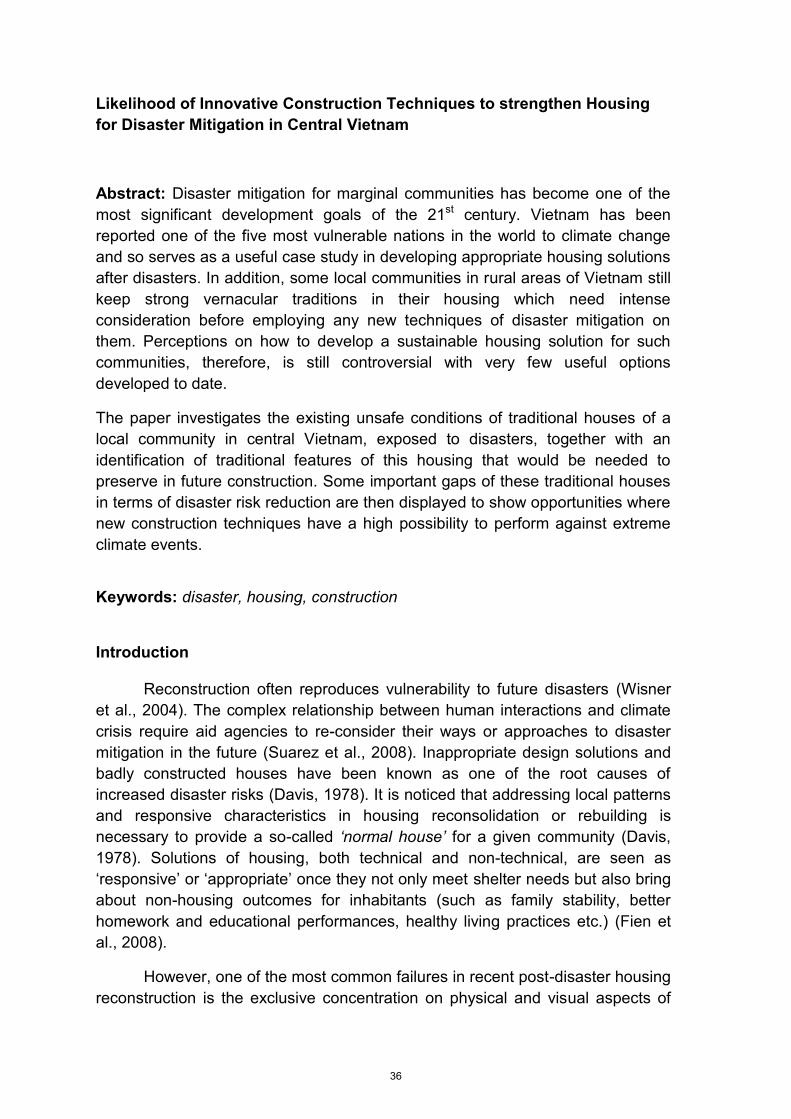
Vietnam has been known as one of the most vulnerable countries to global climate crisis with different types of climate extremes. Flood and typhoon expose the most frequent and awful occurrences, affecting approximately 80-90% of Vietnam’s population (VIetnamese Government, 2007) and causing enormous losses of human life, livelihood, and property (Nhu et al., 2011). In central Vietnam, the most disaster prone region of the country (Tinh et al., 2010), the provision of appropriate housing is more important and urgent, especially when most past and current programs of housing face similar problems regarding cultural appropriateness and local adaptation.
Existing traditional houses on stilts (2010) Inappropriate (unfamiliar) new houses nearby
(taken by author in 2010)
37
Methodological Approach
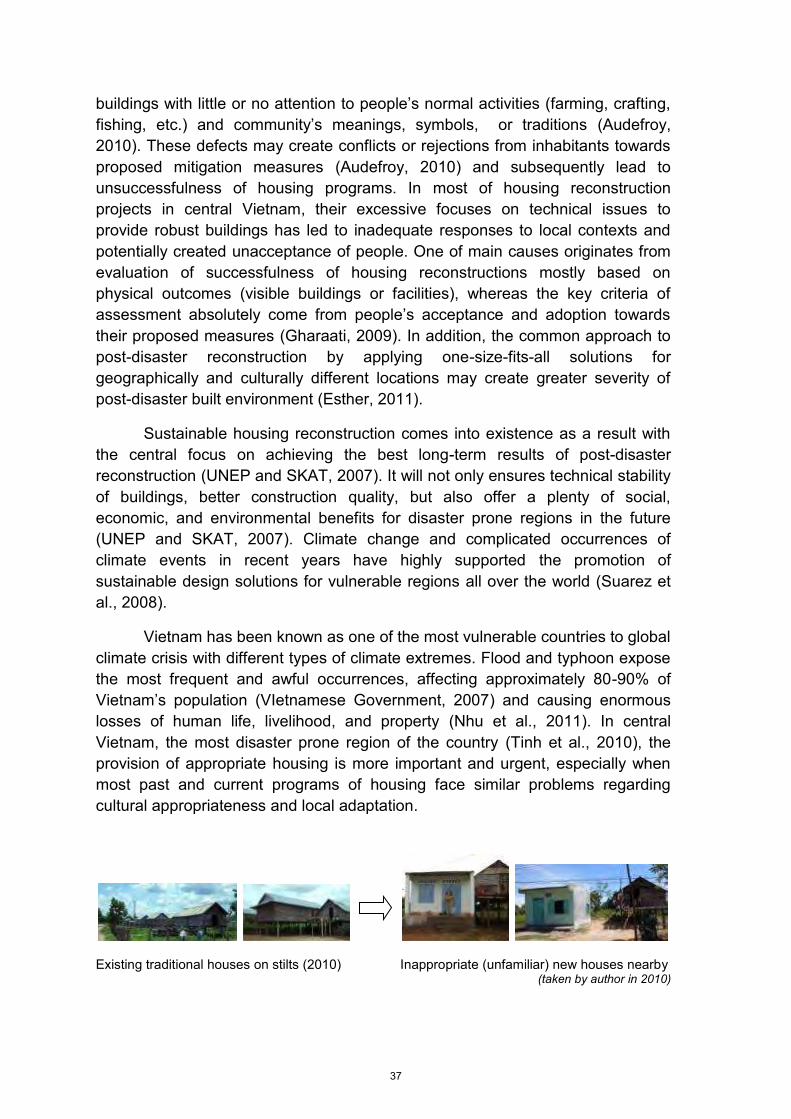
Sustainability in housing strengthening or shelter rebuilding is the key aspect of this study. It is a long-term strategy dealing with many different but interrelated factors. It will not only include technical aspects of housing but also address unseen important factors in terms of social, economic and institutional issues. The consultation with target groups in community at certain stages is critically important in line with an adequate understanding of local contexts to effectively apply new construction methods or techniques for disaster mitigation.
By 2010, a reconstruction project funded by IFRC to provide 650 shelters for affected populations in central Vietnam after typhoon Ketsana (2009) was initiated with the participation of DWF organisation as the professional consultant. The author was employed by DWF as an architect to propose housing design options for two in seven beneficiary provinces of central Vienam. The focus on a case study community in Gia Lai province of central Vietnam based on the above approach has come up with certain achievements in practice.
38
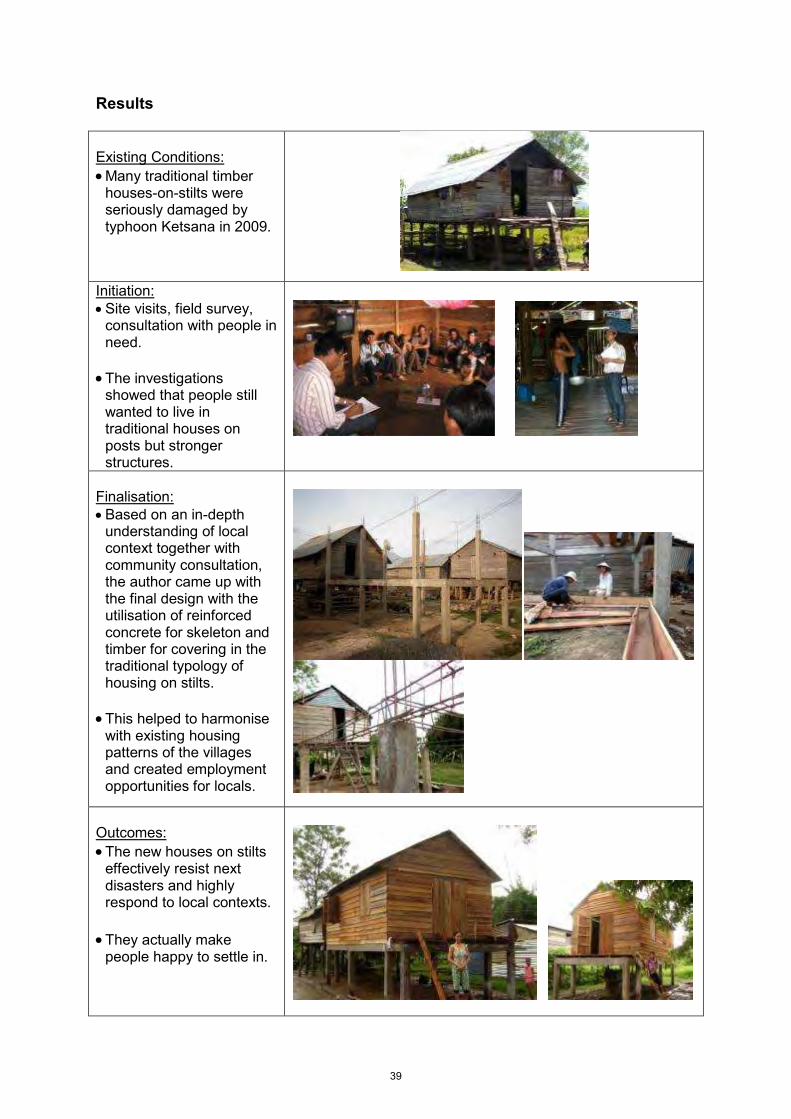
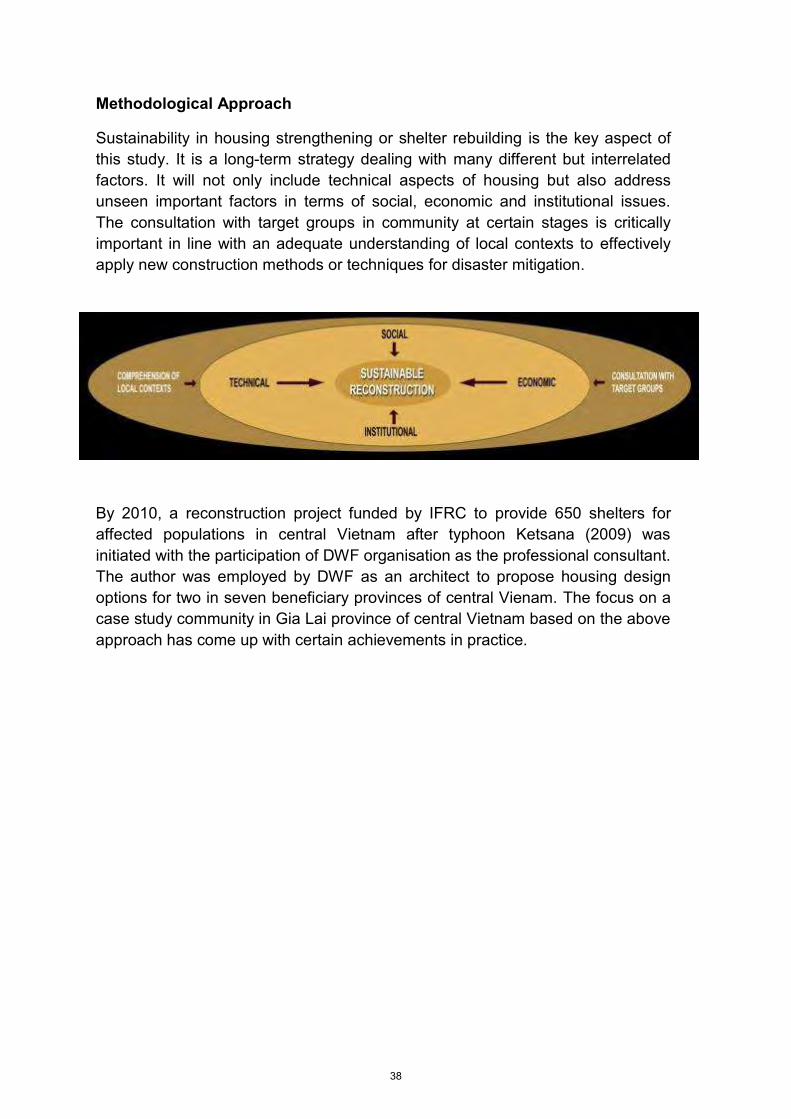
Results Existing Conditions: Many traditional timber
houses-on-stilts were seriously damaged by typhoon Ketsana in 2009.
Initiation: Site visits, field survey,
consultation with people in need.
The investigations showed that people still wanted to live in traditional houses on posts but stronger structures.
Finalisation: Based on an in-depth
understanding of local context together with community consultation, the author came up with the final design with the utilisation of reinforced concrete for skeleton and timber for covering in the traditional typology of housing on stilts.
This helped to harmonise with existing housing patterns of the villages and created employment opportunities for locals.
Outcomes: The new houses on stilts
effectively resist next disasters and highly respond to local contexts.
They actually make people happy to settle in.
39
Conclusion
The re-utilisation of traditional form of house-on-stilts did familiarise local people with their new houses. The replacement of timber structures by reinforced concrete (RC) skeletons provides safer houses in future disasters. It also contributes to the reduction of deforestation for the need of construction materials as previously in the region. The employment of local craftsmen in installing wooden surrounding walls onto RC structures offer local people plenty of jobs and help them better understand the importance of applying new construction technology to promote valuable local characteristics in disaster risk reduction. This significantly improves current construction practices and perceptions on housing construction in terms of disaster mitigation in the region.
These outcomes may be used as a useful case study to develop housing solutions for other vulnerable minority groups who are living in wooden houses on stilts in central Vietnam or in other countries. However, community consultation with target groups (home owners, local builders, local representatives, etc.) before initiating design solutions is required for development of appropriate and sustainable housing for a certain community.
Refercences
1. AUDEFROY, J. F. 2010. Post-disaster emergency and reconstruction experiences in Asia and Latin America: an assessment. Development in Practice, 20, 664-677.
2. DAVIS, I. 1978. Shelter after Disaster, Oxford, Oxford Polytechnic Press.
3. FIEN, J., CHARLESWORTH, E., LEE, G., MORRIS, D., BAKER, D. & GRICE, T. 2008. Towards a design framework for remote Indigenous housing. Australian Housing and Urban Research Institute.
4. GHARAATI, K., M. 2009. Knowledge transfer in post-disaster reconstruction: The problem of post-post-disaster reconstruction. Ph.D, McGill University.
5. NHU, O. L., THUY, N. T. T., WILDERSPIN, I. & COULIER, M. 2011. A preliminary analysis of flood and storm disaster data in Vietnam. Ha Noi
6. SUAREZ, P., SUANDERS, G., MENDLER, S., LEMAIRE, I., KAROL, J. & CURTIS, L. 2008. Climate-related Disasters: Humanitarian Challenges and Reconstruction Opportunities. Climate Change and Place, 20, 62-67.
7. TINH, B. D., TUAN, T. H., PHONG, T., THE, B. D. & TAM, B. T. 2010. Local Vulnerability and Adaptation to extreme climate events along the central coast of Vietnam. Climate Change Adaptation and Disaster Risk Reduction: An Asian Perspective Emerald.
8. UNEP, U. N. E. P. & SKAT, S. R. C. A. C. F. D. 2007. After the Tsunami: Sustainable building guidelines for South East Asia [Online]. UNEP and SKAT. Available: http://www.skat.ch/.
9. VIETNAMESE GOVERNMENT, V. 2007. National Strategy for Natural Disaster Prevention, Response and Mitigation to 2020. Ha Noi: Vietnamese Government.
10. WISNER, B., BLAIKIE, P., CANNON, T. & DAVIS, I. 2004. At Risk: Natural Hazards, People's Vulnerability and Disasters, London and New York, Routledge.
40
The case for a changed flood warning paradigm
Dr Haydn Betts
Industry Lead, Flood and Emergency Management, Asia Pacific
Kellogg Brown & Root Pty Ltd
Paper presented at EARTH: FIRE AND RAIN Australian & New Zealand Disaster and Emergency Management Conference Brisbane – 16 – 18, April 2012 The case for a changed flood warning paradigm
41
Abstract (no more than 150 words please):
Counter disaster plans often incorporate a series of prepared warning messages that are released during various stages of an impending crisis. The paper proposes improvements to the way such messages are structured and there is a need for engineers and disaster managers to engage with other professions.
It is postulated that how these are received, translated, understood and acted upon depends on the psychological “place” of both the sender and receiver and their mental preparedness and pre-conditioning prior to an impending disaster. These reactions depend on trust and confidence in those within the communication processes and the community’s participation in the preparedness process.
The paper recommends that the chain of communication pathways need to be developed by technologists, adult educators and psychologists having regard for language’s phonological and gestural characteristics and an understanding of how the brain processes information.
Research of consumer need is required at the ‘consumer’ level.
Keywords: warning messages, language, trust, psychologists,
Introduction
An essential and probably the most important element of floodplain management is communications; not only within the disaster management group, but at all phases of the information flow. This paper examines some of the elements of communication but pays particular attention to the communication needs of the community.
Counter disaster plans often incorporate a series of prepared warning messages that are released during various stages of an impending crisis. The paper proposes improvements to the way such messages are structured and there is a need for engineers and disaster managers to engage with other professions.
Preparing for a flood emergency does not commence with the onset of heavy rain, but involving the community at risk in their own communication and decision making processes. For a community to gain maximum benefit, it will need to be informed of the issues by a respected and knowledgeable team, and by continued reinforcement and updating with new information.
It is postulated that how new information and data are received, translated, understood and acted upon depends on the psychological “place” of both the sender
42
and receiver and their mental preparedness and pre-conditioning prior to an impending disaster. These reactions depend on trust and confidence in those within the communication processes and the community’s participation in the preparedness process.
The paper recommends that the chain of communication pathways need to be developed by technologists, adult educators and psychologists having regard for language’s phonological and gestural characteristics and an understanding of how the brain processes information, sets memory and how memories can be strengthened. This implies a need for psychologists and professional adult educators to be part of community awareness programs.
Background
A local authority is required to establish a Disaster Management Group (DMG) having members with technical, logistic, emergency and community expertise. The DMG is usually lead by the Mayor or his delegate. It is required to follow a Local Disaster Management Plan and manage a Disaster Management Centre containing operational and support staff. The DMG might be fortunate enough to be supplied information by its own technical flood group as well as receiving information from the Commonwealth Bureau of Meteorology (BOM). The BOM is authorized to publish official weather and flood forecasts1 (Section 6, Meteorology Act, COA, 1955) and these take precedence over any other group’s meteorological and hydrologic predictions.
The role of the technical flood group is to interpret the Bureau’s forecasts and advise the DMG of the forecast’s implications at a local level. Keys and Cawood (2009) strongly emphasize the importance of this role as it adds meaning to a Bureau forecast to inform both the DMG and local residents of local impacts. This advice must include information on the nature of the threat, current and forecast flood levels at locations meaningful to the community, warnings as to when escape routes might become impassable, evacuation arrangements, and sources of more information.
For the initial purpose of identifying the problem, consider the emergency response organization that might be set up in a medium sized or large local authority in Queensland, such as displayed in Figure 1. This figure highlights the writer’s perception of a communication process during a flood emergency based on his observations of flood emergency exercises. It not only displays the organizational aspects, but the communication flow paths and also depicts to some extent the value-adding to raw information. The green box suggests a scope for a decision support system.
1 These are water level forecasts for a defined location but do not indicate the extent, depth and impact at a local level.
Defining the latter is the responsibility of the local authority.
43
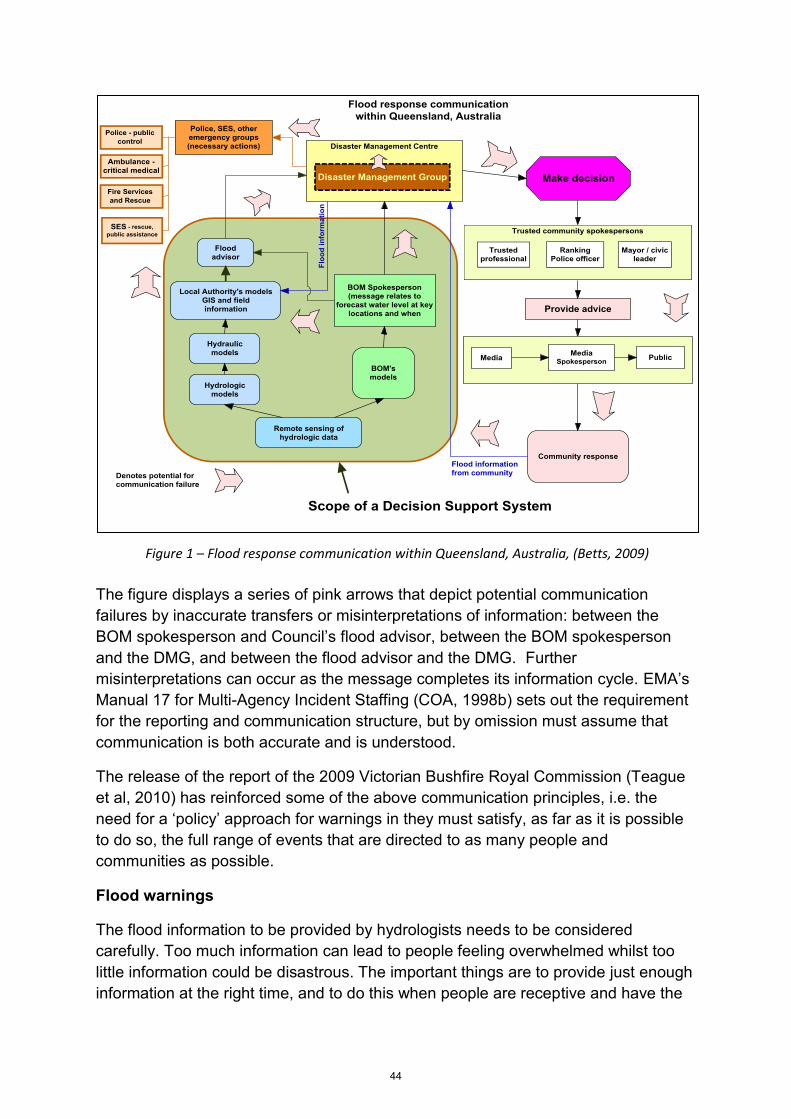
The figure displays a series of pink arrows that depict potential communication failures by inaccurate transfers or misinterpretations of information: between the BOM spokesperson and Council’s flood advisor, between the BOM spokesperson and the DMG, and between the flood advisor and the DMG. Further misinterpretations can occur as the message completes its information cycle. EMA’s Manual 17 for Multi-Agency Incident Staffing (COA, 1998b) sets out the requirement for the reporting and communication structure, but by omission must assume that communication is both accurate and is understood.
The release of the report of the 2009 Victorian Bushfire Royal Commission (Teague et al, 2010) has reinforced some of the above communication principles, i.e. the need for a ‘policy’ approach for warnings in they must satisfy, as far as it is possible to do so, the full range of events that are directed to as many people and communities as possible.
Flood warnings
The flood information to be provided by hydrologists needs to be considered carefully. Too much information can lead to people feeling overwhelmed whilst too little information could be disastrous. The important things are to provide just enough information at the right time, and to do this when people are receptive and have the
Figure 1 – Flood response communication within Queensland, Australia, (Betts, 2009)
44
capacity to receive, understand and take appropriate action. So advisors need to ask themselves:
how can the presentation of rainfall and flooding information be made more efficient and effective to improve lead-time and the advice to the community?
how should flood information be structured to encourage evacuation? what tests should be applied when faced with flood information that is outside
their expectation?
The key indicators are: the spatial extents of flooding, current water levels, rate of rise of floodwaters, critical water levels, flood velocities, critical durations and flood volumes.
The advice should be accompanied by maps, pictures, key indicators that have meaning for residents and descriptions of areas under threat (COA 2009, Keys and Cawood 2009). If authorities are fortunate, the community will respond in an appropriate manner.
The purpose of generating flood warnings and providing advice is to seek a reaction from those being warned to take defensive measures to protect their loved ones and property, and to assist others where possible. How people react to warnings depends on a number of factors and the reaction may not be what is intended by the authorities.
Flood warnings need to be developed that match the community’s needs from the
community perspective of what it thinks is necessary from the emergency experts, and
the experts’ perspective of what they think the community needs.
These expectations may not coincide, and are probably unlikely to coincide unless a dialogue is developed between the community and the flood management authority.
The difficulties facing effective communication between flood forecasters and emergency managers and then to the community, are the differing vocabularies, and quite often the community’s inexperience of flooding (COA, 1998a). This leads to misunderstandings or lack of comprehension of warning messages, only receiving messages second or third hand, and delaying responses until it is too late or unsafe to take meaningful action. If individuals are flood aware, or have had first-hand experience, people react to warning messages in a competent manner.
Generally, without first-hand experience to generate Gestalt2 type reactions, members of the community do not understand or readily accept warning messages (Ariely and Carmon, 2000). For example, advice of a future flood peak without an explanation of what is might mean, may result in action. In such circumstances, 2 “perceived organised whole that is perceived as more than the sum of its parts” (COD, 1982).
45
flood warning officials and emergency managers need to rely on public awareness programs or vicarious experiences of other disasters gained through the media. Further research is required to determine how the effectiveness of official advice can be improved, and to determine how the disruptions to effective communications can be diminished.
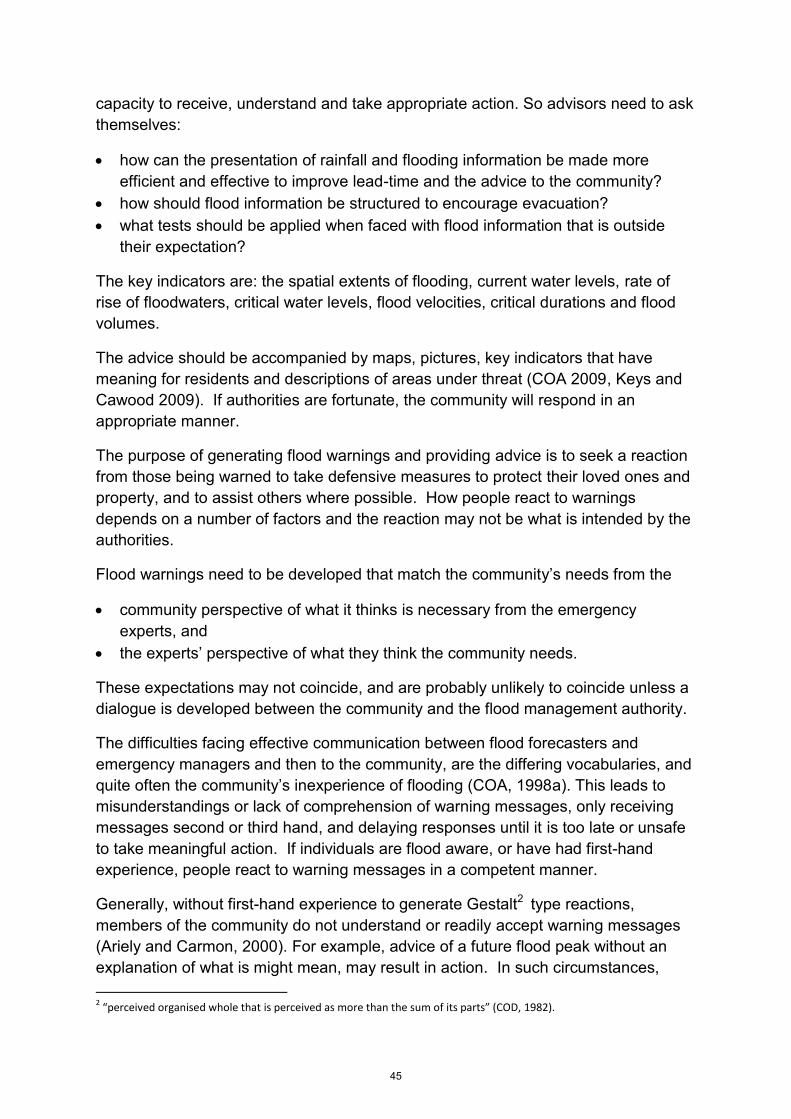
Figure 2 indicates the flow of information from a flood warning through a media centre, its interpretation of the message, the message provided which leads to a community’s reaction to the message, and the actions the received message might engender. It’s the author’s contention that the messages’ effectiveness can be disrupted through community dissemination and the community’s expectations of the emergency management system. The challenge then arises for emergency managers to improve the effectiveness of the warnings through awareness programs that are directed to improving community understanding and responses.
There is a need to understand the process by which people receive warnings so warnings can be prepared, issued and understood in a manner that will effectively minimise reaction time, thereby increasing the time available for damage mitigation measures.
Mileti (1995) makes the case that effective public warnings must provide for public interaction and foster searches for additional information as well as to receive warnings. He points out that low-probability/high consequences disasters, of
Figure 2 – Factors contributing to community actions (Betts, 2009)
46
whatever type, cause similar social psychological processes that direct public response. Mileti believes that public warning response is a social process and that public reactions to warnings are typically not characterised by stimulus response models. People go through a common process before they take protective action:
hearing a warning forming a personal understanding of what was meant by the warning developing a level of belief in the risk information conveyed in the warning personalising the risk or perceiving it to be someone else’s problem and deciding what if anything to do, responding in ways thought to be appropriate for
the risk personally faced.
There is a need to understand how people make decisions under stress, including assessments of group psychological abilities (such as cognitive, personality, or attitudes); and pre warning perceptions).
Public involvement
Public involvement in risk management occurs when an entity, usually government or other organisation (separately or together), is engaged with the community at risk to achieve a reduction in vulnerability to a hazard. It is a fundamental part of the risk management process. This engagement allows participation and input with the goal of producing a plan that represents the collective will and consensus of the community.
For a community to fully participate, it must not only understand the context of the area into which it is drawn, but be able to meaningfully contribute to the engagement. This implies a willingness to be engaged in something it may or not may understand. That understanding will only come with awareness programs, education and mentoring.
Among the many components of safety is a requirement that individuals and their communities become aware of the risks to which they are exposed and can take actions or are prepared for those emergencies (Enders 2001, Cottrell 2005)). The objective of preparedness is to reduce the adverse impacts if risks become dangerous and an emergency arises. Enders claims there is comparatively little information on awareness and preparedness of communities for emergencies and suggests three research questions:
How aware is the community of emergency risks? What steps have members of the community taken to maximise their safety? How confident do they feel about emergency actions?
Flood awareness and public education programs are required to enhance the ability of a community to reduce flood damage during the continuum from the onset of severe weather to the evacuation of affected residents. The single most important
47
aspect in reducing overall flood damage and impact is considered to be an informed and educated community.
Communication cannot occur until there is a shared experience or a shared point of reference between the community and disaster managers. The community will not react unless they understand the language in which warnings are couched and paradigms are available or have been created through interaction between the community and disaster managers. It is postulated that flood damage and the adverse impacts of flooding can be minimized if both the givers of flood warnings and recipients of those warnings are aware of the risks faced, and each understands the socio-psychological processes faced by the community as a flood emergency develops.
Public reactions to warnings are typically not characterised by stimulus–response models, but reactions can be modified and accelerated through a series of steps in a public awareness and education program. As people perceive and understand risk in different ways, education programs need to present flood risk issues appropriate to the different perceptions. It is vital that further research is undertaken that will link different perceptions of risk with effective flood risk education and empowerment programs.
Sociologic examinations of potentially affected communities are required to determine the levels of experience and understanding of flooding that will inform future engagement processes. The transfer of information from government to communities has generally been undertaken by the engineering and emergency services fraternity and most likely without the benefit of advice from psychologists. The writer believes such advice is needed to enhance not only community awareness programs but the nature of warning systems and the building of resilience. Similar comments are applicable to advice from sociologists.
Community expectations
The expectations of community members can vary in a number of ways: participation in government (Arnstein, 1969); involvement in floodplain development planning (Betts 2001); expectation of self destiny in the hazard mitigation planning (Burby 2001), expectations of risk communication (prior to a flood) and crisis communication (during a flood) (Reynolds and Seeger, 2005), which are underpinned by the emergency management precept that people have a right to know (COA, 2004).
In researching this section, the writer found great difficulty finding non-government directed literature regarding community expectations of flooding. In fact most of the government literature takes a ‘top-down’ approach advising what it thought the community needed, rather than reporting what the community said it needed.
This is a major research gap and should be investigated. Much of the non-government literature is more than 15 years old and from other readings, it is
48
apparent that the expectations of communities have changed. Communities do expect more from their governments and the government literature reinforced that view. So is the government literature self fulfilling, or do communities expect something else? Unless they become involved in the decision making process and become aware of the nature of flood risks, how can communities advise governments on what they (the communities) need or expect?
There are two sources of community disaster information needs which are important as much data was unsolicited and not prompted at the time it was gathered. Two major disasters in Australia: the Victorian Bushfires of 2009 and the Queensland floods of 2011 both resulted in the establishment of a Royal Commission in Victoria and a Commission of Inquiry in Queensland. The public were invited to make submissions to both investigations and initial readings of some of these submissions indicate that they will partially satisfy that research gap. The findings of the two Commissions should be compared to determine whether there are different responses for flood and bushfire that will inform updates of Emergency Management Australia’s manuals and guidelines.
There is a plethora of literature on why flood warnings are ignored and not understood, but it seems very few seem to have addressed the sciences of education and psychology. We engineers have our own peculiar views of the world, generally dealing in numbers and logic, and unfortunately many of us do not understand the needs of the majority of the community.
Psychological processes
A person’s psychological processes ascribe ‘meaning’ to information, whether it is good, bad, safe, unsafe, healthy, etc., and influence the way people react to flood warnings or unpleasant advice or direction and making decisions. Much of this is done subconsciously. If these processes are understood, then it may be possible to deliver messages in such a way that the adverse aspects of the psychological processes might be avoided, and lead to greater efficiency when evacuation is required. Meanings are founded on our memories: our ability to store, retain and recall information.
Simon (1996) believes that with age, we accumulated a number of cognitive templates, or patterns that provide a powerful mechanism for “successful cognition”. Damasio et al (1996) argued that thought is made largely from “images broadly construed to include perceptual and symbolic representations”, while Finucane et al (2002) suggested the application of markers that would react to stimuli and influence the decision making process. These ideas are supported by Goldberg (2006) who postulated that memory of facts, figures, events and solutions are in the form of patterns.
Goldberg considers that when confronted with an apparent new problem or information, an older person seems to search for similar situations or patterns, rather
49
than undertake the difficult analysis processing activities in the front of the brain. As the brain ages, it moves from problem solving to pattern recognition and changes the way the different parts of the brain contribute to the process. The cortex is used less while there is increasing dependence on “sub-cortical machinery”.
This also affects the working memory and somatic memory, our ability to learn new facts, our brain’s ability to switch from one mental process to another, and attention can be selective. Each unique memory could be seen as being accompanied by metadata that provides a key for pattern searching, in much the same way as primary and secondary keys are used in database navigation. Goldberg describes these cognitive templates that enable pattern recognition as attractors, each with a unique property so that a broad range of inputs would enact the same “neural constellation” automatically.
Conscious processes occur during the short term memory phase when several things are held in memory and the prefrontal cortex seeks to define relationships or ascribe meaning to the information. Problems need to be fragmented in bite size pieces and presented in such an order they can be processed and lead the reader to the desired decision.
Upon receipt of information, people classify it according to paradigms, schema or heuristics as “sensemaking” as used by Sellnow & Seeger (2001). Let us then assume that in this sensemaking process, the brain develops relationships between its existing memories and the new information, sorting it by what might be needed and for what. This basic pattern then needs an attractor (database table key equivalent), or develops a mental metaphor that might simplify the information for later personal decision-making scenarios. This has significant implications for individual decision making during a flood emergency. Individual community members need to be ‘primed’, by providing them with information beforehand when the brain is not under stress and when it can process the information, classify and store it along with its database keys or perhaps its heuristic metaphors.
Damasio et al’s (1996) ‘somatic marker hypothesis’ suggests the marker stimulates responses at several operational levels that might be done consciously or unconsciously. Damasio argues that thought is made largely from “images broadly construed to include perceptual and symbolic representations”. Johnson (2004) describes a somatic marker “as some bodily state which is generated as a consequence of some mental process. This state is then re-perceived by the mind and as a consequence, the mental state is changed”. Finucane et al (2002) postulate that over time, these images become marked by positive or negative feelings that “increase the accuracy and efficiently of decision processes.”
Another aspect to be considered is whether it is possible to modify the way subliminal markers are attached to warning messages so influencing the way people react. It has been stated (Finucane et al, 2000) that the sub-conscious application of
50
“affect”3 acts as a marker to assist reaction and influence the decision making process. They observed “an inverse relationship between perceived risk and perceived benefit” and postulated that observers subconsciously included an adjective before viewing an object.
Epstein (1994) raised these concepts in his work on cognitive-experiential self-theory, which suggested two levels of information processing, where conscious processing functions differently than at the subconscious level. These serve to mitigate extreme behaviour generated by one processing function or the other. Epstein further reasons that resulting actions are subliminally dependent on personality and a person’s belief system. If a conclusion seems unpleasant at the subconscious level, the brain forces analytical thought at the conscious level.
The introduction of a subliminal marker in a warning message would introduce a bias in the warnings which in some circumstances could have unfortunate consequences, such as if a person acted on a warning later found to be unnecessary and suffered an unfortunate incident. An emergency manager’s defence that the warning was issued in the context of the ‘greater good’ may not yet have been tested in court.
Effective decision making is also built on knowledge of the manuals and guidelines published by EMA and state government authorities, which emergency managers and planners are expected to and should base their contingency planning upon. Many of these manuals were first written over ten years ago and whilst they are being progressively updated there is an opportunity to modify the messages within.
Emergency managers need to understand the implications of recent research that has been demonstrated through modern brain imaging techniques. Many of these techniques were not developed, nor had their research capabilities and implications been understood, until after the publication of many of Australia’s emergency management manuals. The implication is that the manuals have not been tested for their effectiveness through neurological methods. It may be possible that memory markers or memory ‘joggers’ can be included in the manuals that will trigger a response or reinforce memory.
Neurological research in combination with psychological research could assist emergency managers to ‘fine tune’ their warning messages and how, as individuals, they interact with others within the emergency management centre. Unfortunately, emergency managers and decision makers are rarely exposed to their specialist field until brain development has passed into its mature stage. It would be useful if risk analysis, risk management and emergency planning were available for study in tertiary institutions.
3 The authors use the word “affect” to mean a feeling state that people experience, such as happiness or
sadness. It may also be viewed as a quality (e.g. goodness or badness) associated with a stimulus. These two
concepts tend to be related.
51
Language
Language is essential for transferring information and can add value or detract from message content. In its most basic form, language has grammar (word forms and endings), syntax (arrangements of words) and phonology (sounds) and each of these affect message reception and understanding. The use of language must also consider cultural differences and the impact of gesticulation when delivering messages.
For clarity there must be a fundamental relationship in the way words are put together and the words themselves must have meaning. Language allows us to generate true/false statements. Our brain has inbuilt ‘truth filters’ with an ability to categorise things, events and impressions. Statements such as “there will be a flood yesterday” are obviously wrong. By learning vocabulary and the conceptual nature of language, we can develop an understanding of complex hierarchical relationships.
Although speech is a prime method for conveying information and facial expressions can enhance the transmittal of message. If speech is accompanied by hand and arm movements the comprehension process can be unclear and confused (Skipper et al, 2009). If those hand and arm gestures are not meaningful, messages may be confused. D’Ausillio et al (2009) had a slightly different focus but concluded a nexus existed between speech and motor circuits not directly concerned with speech. This has severe implications for the delivery of warning messages if the speaker in an interview situation does not have effective control of face or limb movements.
Metaphors are widely used in language and are a valuable tool to explain: adding meaning to situations and tapping into the creative sources within the brain. They may also facilitate copying mechanisms at a sub-conscious level to achieve the pattern recognition proposed by Goldberg. A metaphor is defined as “an application of name or descriptive term or phrase to an object or action to which it is imaginatively but not literally applicable” (Pearsall et al, 1982). It could be said that a metaphor is a language allegory to a somatic marker.
Hyman (1974) considers metaphors are “deliberate and useful”, they “enrich our language”, and develop new ways of viewing situations. Are “raging floodwaters” the result of “torrential downpours”? Do “rivers run”? Rivers do not “run” in the literal sense, but “run” is a shortened way of saying that a river has water that flows. Metaphors and adjectives add to the colour of language, and probably aid memory through the attachment of somatic markers.
However, there is a risk that metaphors and adjectives can unconsciously introduce bias or be pejorative by applying incorrect roles or categorising participants, such as describing an emergency decision maker as “an unnamed government official”, or to the public as “isolated”, or as “unfortunate” evacuees, or as “long-standing” residents. “Positive” metaphors can facilitate action, such as “residents can seize an
52
opportunity to rebuild above the flood line”, or “take positive action to regroup their families”.
It is essential that all members of the DMG are good communicators to explain and discuss problems with each other, and to engage with the community to convey the meaning of complex situations in simple language. This is a skill that needs to be learned, but is not yet considered a major part of an engineer’s professional continuing development program.
When we engineers learn to write our reports, we tend to avoid hyperbole, metaphors, similes and adjectives but we know that in verbal language, vocal expression and gestures add to the message and are key parts of oratory and explanation. If messages are to be more readily accepted, then the tone of the language must accord with the gravitas of the flood situation. When converted from written word to speech, it must be done so in a form that will be accepted by the listening public. It is those listeners who will discuss and seek validation from others, and/or be in a position to interpret or pass on warnings to those who do not hear or do not understand the ‘official’ message.
The translation of written word (often prepared by engineers) to a formal ‘official’ announcement should be made by a person, such as a trained television newsreader or journalist who translates ‘official’ advice into digestible and useful information. Hand and arm gestures can reinforce messages or confuse or distract from the message. This is not usually a problem for television presenters, but it could be an issue for ‘door-step’ explanations given by emergency managers or politicians commenting on a worsening flood situation.
Learning principles
Learning is the opposite of teaching, where the transmission of ideas and information is received and understood by the student. Hyman (1974) identifies four concepts for teaching:
the student believes that what he/she needs to know is held by someone else teaching is “the activity that brings about the accumulation of knowledge” the teacher “has the knowledge” or “can guide the student” the teacher “can transmit the knowledge”.
Connell et al (1962) outlined a series of learning principles that can be applied to community education programs:
a. Motivation: There is a greater likelihood of learning taking place when an individual is motivated, or when the learner is subject to some pressure or has a need for information.
b. Practice: Repetition facilitates learning. Different relationships may be perceived when information is re-presented. This reorganisation of ideas can provide different views or perceptions.
53
c. Past experiences: Past experiences contribute to efficiency in learning. A differentiation has to be made between meaningful and meaningless material. The former, will enhance memory connections within the brain, and have to potential for connections to be made with new experiences.
d. Level of maturation: Learning is accomplished more readily and tends to be more enduring when the activity involved is appropriately geared to the learner’s physical and intellectual level of development.
e. Activity: Learning is an active process. Learning has to be accomplished by the learner, who has to internalise the information.
f. Reinforcement: The possibility that learning will occur is greater when different ways of responding or behaving are followed by different conditions. The different conditions are effectively different stimuli on earlier subject matter. These provide different neural connections within the brain, thereby strengthening existing memory and either developing Gestalt type reactions or subliminal markers.
g. Transfer of Learning: Behaviour or responses learned in one situation may transfer to, that is, be available for use in other situations. Connell et al (1962) also consider it important to demonstrate the underlying principles and “provide opportunities to recognise and/or apply the principle in varied and increasingly complex situations.”
In learning or encountering a new situation, people will try and make sense of the situation and create a harmony among the ideas formed. Learning ‘emergency’ might be effective if biased to Gestalt type paradigms because they seem to be more closely aligned to sensemaking and somatic marker thinking, as described earlier.
Implications for emergency planning
The forgoing seven learning principles can be applied to disaster management training for those involved in the preparation for disasters, and then be applied to community education programs. Training has to be directed at two levels: facilitating the work of emergency planners and managers, and ensuring the community is prepared to react to warnings.
A pre-condition for effective disaster management is a willingness of the population at risk to accept the advice. This requires a community to trust the information provided, have an understanding of emergency management policies and know the appropriate sequence of actions when the events leading to a warning are triggered.
In formulating public policy, information flow should be reciprocal, where both the public and the authorities are teachers and students. For emergency planning, the local authority has to explain the flood risk, possible flood scenarios and then glean from the public its need for the public’s pre-flood planning and the information to be provided to it by the DMG during the emergency.
During emerging disasters, the public generally has no choice but consider that the local authority has the expertise and knowledge and implicitly accepts a subordinate
54
role for the knowledge transfer. When time is available, community members will challenge government supplied information if that information is deemed unacceptable.
Gestalt psychologists believe that the “whole is different from the sum of its parts” and developed a set of principles to explain how parts could be organised into a whole. They consider that perception is an individual’s “own restructuring of the sensory field” (Connell et al, 1962) and learning occurs when all relationships are formed into an organised pattern. One of the Gestalt laws is that of “pragnanz” where a group of objects is organised in the simplest form possible.
In learning or encountering a new situation, people will try and make sense of the situation and create a harmony among the ideas formed. When this understanding or harmony is reached, learning is said to have occurred.
Conclusions
1. Sociologic examinations of potentially affected communities are required to determine the levels of experience and understanding of flooding that will inform future engagement processes.
2. The transfer of information from government to communities has generally been undertaken by the engineering and emergency services fraternity and most likely without the benefit of advice from psychologists. The writer believes such advice is needed to enhance not only community awareness programs but the nature of warning systems and the building of resilience. Similar comments are applicable to advice from sociologists.
3. Further investigation is required into examination of what information the community believes it should be provided rather than what government thinks it needs. The community submissions into the Victorian Royal Commission inquiry of its 2009 bushfires and the Queensland Commission of Inquiry into the 2010-2011 floods should be examined by both disaster managers and psychologists to better inform communities in the future
4. There is an opportunity to modify the education and warning messages by the inclusion of memory markers or memory ‘joggers’ in EMA manuals and information that is released to the public. The advancement of neurological imaging provides an opportunity to link neurological psychology to emergency management. Research is needed to determine how this can be best effected.
5. Research is required to determine how knowledge of both psychological and neurological processes can lead to accelerated learning processes, improved concentration, avoidance of brain overload and hopefully lead to greater effectiveness in stressful situations.
6. The effectiveness of training will depend upon the application of the psychology of education, and an understanding of how the brain receives and processes information.
55
7. Education and awareness programs should be developed by a team comprising technologists (who have hydraulic knowledge), specialists in adult education, and psychologists who can advise on how best to present the information for maximum impact.
8. Preparing and delivering flood warning messages is a complex process that is not well understood. Barriers to warning effectiveness include language, gestures, phonology, the message giver and the mode of delivery.
9. Language has grammar (word forms and endings), syntax (arrangements of words) and phonology (sounds) and each of these will affect message reception and understanding. The nature of the words used to convey messages is fundamental to the success of warning messages.
10. Metaphors are an essential part of language and can add value to warnings by imprinting markers to the information set within memory. However they must be used with care, as they can attach unfortunate meanings which are not only inappropriate but can be misleading and confuse the message being delivered.
References
Ariely, D. and Carmon, Z. (2000) "Gestalt Characteristics of Experiences: The Defining Features of Summarised Events", Journal of Behavioural Decision Making, 2000 (13) 191-201.
Arnstein, S. (1969) "A ladder of citizen participation", Journal of the American Institute of Planners, 35 (4) 216-224.
Betts, H.W. (2009), “Floodplain Management, An examination of factors that affect decision makers prior to and during a flood emergency”, thesis submitted in fulfilment of the requirements of the degree of Doctor or Philosophy, 2009.
Betts, H.W. (2001), “An Outline of Gold Coast City Council’s Nerang River Flood Mitigation Project”, NSW Floodplain Management Authorities Conference, Wentworth 8-11th May 2001.
Burby, R. J. (2001) "Involving citizens in hazard mitigation planning: making the right choices", The Australian Journal of Emergency Management, (Spring) 45-51.
Commonwealth of Australia (COA, 2009) “Flood Warning”, Manual 21, Emergency Management Australia.
Commonwealth of Australia (COA, 2004), “Emergency Management in Australia Concepts and Principles”, Manual 1, Emergency Management Australia, 2004.
Commonwealth of Australia (COA 1998a) “Manual 4 Australian Emergency Management Terms Thesaurus”, Emergency Management Australia.
Commonwealth of Australia (COA, 1998b), “Multi-Agency Incident Management”, Manual 17, Emergency Management Australia (1998).
Commonwealth of Australia (COA 1955) Meteorology Act.
56
Connell, W.F., Campbell, W.J., Debus, R.L., Howie, G., Miller, T.W.G., MacLaine, A.G., Neale, M.D., Spearitt, D., Wylie, J.F., Members and Staff of the Department of Education, University of Sydney and Verco, D.J.A., (1962), “The Foundations of Education”, Ian Novak Publishing Company, Sydney, (1962).
Cottrell, Alison (2005) “Sometimes it is a big ask, but sometimes it's a big outcome: community participation in flood mitigation”, Australian Journal of Emergency Management, 20 (3). pp. 27-32. ISSN 1324-1540.
D’Ausilio, A., Pulvermuller, F., Salmas, P., Bufalari, I., Begliomini, C., & Fadiga, L., (2009), “The Motor Somatotopy of Speech Perception”, Current Biology, Volume 19, Issue 5, 381-385, 12 February 2009.
Damasio, A.R., Everitt, B.J., Bishop, D. (1996), "The Somatic Marker Hypothesis and the Possible Functions of the Prefrontal Cortex", Phil. Trans. R. Soc. Lond. (1996): 1413-20.
Enders, J., (2001), “Measuring Community Awareness and Preparedness for Emergencies”, Australian Journal of Emergency Management, Spring 2001.
Epstein, S., (1994) `Integration of the cognitive and psychodynamic unconscious', American Psychologist, 49 (1994), 709±724.
Finucane, M. L., Alhakami, A., Slovic, P. and Johnson, S. M. (2000) "The Affect Heuristic In Judgements or Risks and Benefits", Journal of Behavioural Decision Making, 2000 (13) 1-17.
Goldberg, E., (2006), “The Wisdom Paradox – How the Mind Can Grow Stronger As Your Brain Grows Older”, Gotham Books, © 2005, ISBN 1-592-40187-2, February 2006.
Hyman, R.T., (1974) “Ways of Teaching”, second edition, Harper & Row, pubs, ISBN 0-397-47301-X, 1974.
Keys, C., and Cawood, M., (2009), “Identifying and reducing inadequacies in flood warning processes: an Australian perspective”, Journal of Flood Risk Management 2 (2009) p190-197.
Mileti, D. S. (1995) “Factors related to flood warning response”, U.S. - Italy Research Workshop on the Hydrometeorology, Impacts, and management of Extreme Floods, Perugia (Italy), November 1995.
Pearsall, J. & Trumble, W. (Eds.), (OERD, 1996), “The Oxford English Reference Dictionary”, 2nd edition, Oxford University Press, 1996.
Reynolds, B. and Seeger, M.W. (2005), “Crisis and Emergency Risk Communication as an Integrative Model”, Journal of Health Communication, 10:43-55, 2005, ISSN: 1081-0730 print online DOI: 10.1080/10810730590904571.
Sellnow, T. L. and Seeger, M. (2001) In Communication Studies. West Lafayette, Vol. Summer 2001, 52, pp. 153.
57

Simon, H.A., (1996), “The Science of the Artificial”, third edition, Cambridge, Mass., MIT Press, 1996.
Skipper, J., Goldin-Meadow, S, Nusbaum, H.C. & Small, S., (2009), “Guestures Orchestrate Brain Networks for Language Understanding”, Current Biology, Volume 19, Issue 8, 661-667, 26 March 2009.
Teague, B., McLeod, R. & Pascoe, S., (2010), “2009 Victorian Bushfires Royal Commission Final Report Summary”, Parliament of Victoria, ISBN 978-0-9807408-1-3, July 2010.
58
Lifestyl e ‘at risk’ ? The case of Ingham Dr Helen Boon, PhD, BSc (Hons), PGCE, Senior Lecturer, James Cook University, Australia Brenton Clark, BA (Hons), James Cook University, Australia Dr Alison Cottrell, PhD, MSPD, BA, GCTT, Senior Lecturer, James Cook University, Australia Professor Bob Stevenson, PhD, M.S., BA, Dip Nat Res, Dip Ed, James Cook University, Australia Dr Joanne Millar, PhD, BAgrSci, Senior Lecturer, Charles Sturt University, Australia Associate Professor David King, PhD, BA (Hons), PGCE, James Cook University, Australia
Australian & New Zealand Disaster and Emergency Management Conference Brisbane, April 16 – 18, 2012
This work was funded through the National Climate Change Adaptation Research Facility, which is an initiative of, and funded by the Australian Government Department of Climate Change and Energy Efficiency, with additional funding from the Queensland Government, Griffith University, Macquarie University, Queensland University of Technology, James Cook University, The University of Newcastle, Murdoch University, University of Southern Queensland and University of the Sunshine Coast. The role of NCCARF is to lead the research community in a national interdisciplinary effort to generate the information needed by decision-makers in government and in vulnerable sectors and communities to manage the risk of climate change impacts. The views and opinions expressed in this publication not necessarily the views of the Commonwealth, and the Commonwealth does not accept responsibility for any information or advice contained herein.
59
Lifest yle ‘at risk’? The case of Ingham
Abstract
This report presents findings about community responses to the 2009 floods experienced in Ingham, North Queensland. Two consecutive floods occurred in Ingham in 2009 which were both predominantly riverine and exacerbated by prolonged rainfall. Emergency Management Queensland estimated that 65% of the Hinchinbrook Shire or around 2,900 residences and businesses were affected by the February 2009 floodwaters with fifty homes experiencing inundation. The Queensland Premier estimated infrastructure damage at $120 million and the Insurance Council of Australia recorded a total cost of $19 million in insurance claims following the event.
The aim of the case study was to explore factors which sustained the community and helped community members adapt after the floods. Data was collected through a series of interviews conducted during 2010. A total of 77 participants representing a range of organisations, interest groups and demographics were interviewed in a series of focus group and individual interviews. Interviewees were asked about their experiences of the flood, including who and what helped them, who was most or least affected and why they chose to continue to live in the community. Bronfenbrenner’s conceptual framework of influences was used as the theoretical lens with which to analyse participant responses.
Results suggest that residents and organisational units such as the hospital and local council quickly responded with strong, effective leadership to ensure appropriate help was available to community members. Strong cohesive social networks, prior experiences with floods, a sense of place and commitment to the community underpinned the response phase of the disaster and maintained the community efforts during the recovery period. Although the economic fabric of the community was severely impacted by the floods and subsequent mismanagement of some relief efforts, locals were adamant that the desirable lifestyle offered by the community was a strong motivating force to sustain their recovery and support their adaptation.
Implications of the findings for disaster management and recovery highlight the need to ensure that local organisations and the council have clear and up to date emergency plans in place, including a range of local individuals able to lead the response and recovery phase in consultation with state emergency services and federal government organisations. Community networks need to be developed and existing ones need to be maintained and strengthened since they play a key role in community cohesion, which in turn is critical for the effective communication and response to all phases of a disaster, including preparedness and recovery. Effective community disaster response takes place when all agencies, government and private, all individuals and households are engaged in awareness education and preparedness, and respond collaboratively.
Keywords: disaster, community, flood, adaptation, risk perceptions
60
Introduc tion and background
The world’s climate is experiencing marked changes. For Australia, climate change has a wide range of projected impacts. At minimum, a ‘wetter and warmer’ to ‘drier and warmer’ Australia is foreseen, with an increased frequency and severity of droughts, heat waves and natural disasters such as cyclones and floods (IPCC 2007). With predictions of hightened climatic uncertainty brought about by global climate change, there is an urgent need to examine disaster impacted communities to find out what has supported their sustainability and adaptation to living in natural hazard prone areas. When a natural hazard overwhelms a community, the consequent disaster shuts down many services and impacts upon the capacity of local institutions to function. An unprepared community might be pushed into crisis. It is during the immediate period before a natural hazard impact, during the passage of the hazard, and in the days immediately following, that communities must rely on their own knowledge and adaptive capacity to prepare, survive, cope and recover. Community surveys in Australia underscore a lack of preparation for a range of gradual onset hazards such as floods (ABS 2008; GNS 2007), bushfire (Bushnell, Balcombe and Cottrell 2007), and cyclones (Anderson-Berry and King 2005). Emergency management responses and strategies within this context face many challenges. Data on disasters and disaster risk reduction are often lacking at the local Australian level, which can constrain improvements in local vulnerability reduction (IPCC 2012). In an effort to design effective adaptation and risk management strategies it is critical that government, especially local government and emergency management examine best practice: what strategies increase effective responses to natural hazards, reduce vulnerability to hazard impact and enhance community recovery in specific contexts? Post-disaster recovery and reconstruction processes do not only provide an opportunity for reducing weather- and climate-related disaster risk and for improving adaptive capacity locally, they also provide valuable knowledge and lessons for application more broadly, increasing the capacity for longer-term planning and policy changes for sustainable development nationally and internationally.
The Ingham case study
The town of Ingham is located on the Herbert River floodplain and there are a number of natural watercourses that distribute floodwaters through the town during major flood events (Bureau of Meteorology (BOM), 2009). Two consecutive floods occurred in Ingham in 2009 which were both predominantly riverine, exacerbated by prolonged rainfall periods (Bureau of Meteorology (BOM), 2009). The initial flood occurred between the 12th and 13th of January 2009 and the second between the 29th of January and the 8th of February 2009 (Bureau of Meteorology (BOM), 2009). The Herbert River reached 12.25m at the Gairloch Bridge on the 3rd of February 2009. This was classified as a major flood by the Bureau of Meteorology, and the river remained at this height until the 7th February 2009 (Bureau of Meteorology (BOM), 2009).
61
Impact on the Community
Forty people were evacuated from their homes to an emergency centre established at the Ingham High School (Department of Emergency Services, 2009). Many residents were isolated by floodwaters causing them to be trapped in their homes for a week. Emergency Management Queensland estimated that 65% of the Hinchinbrook Shire or around 2,900 residences and businesses were affected by the February 2009 floodwaters with fifty homes experiencing inundation specifically in living areas (Bureau of Meteorology (BOM), 2009). The Queensland Premier placed initial estimates of infrastructure damage at $120 million (ABC News, 2010). Furthermore the Insurance Council of Australia recorded a total cost of $19 million in insurance claims following the event (Ratz, 2010, email 10 September).
The Community Recovery Centres housed up to 108 people and operated for ten days with an average of 54 people per night (Australian Red Cross, 2009). The Australian Red Cross was active for a month and its operations involved one hundred and ten staff and volunteers (Australian Red Cross, 2009).
The flooding had a deleterious impact on Ingham’s primary industry sector, and to businesses associated with this major industry. Ingham relies heavily on the sugar cane industry. The flooding destroyed the sugar cane crop, and affected crop yields in the following years, which has had a massive impact to the whole community. This has placed significant pressure on the people of the Hinchinbrook Shire both financially and emotionally, pressures which continue to be felt to the present time. It is of interest therefore to explore the community of Ingham to find out what has supported the community through the disaster.
Disaster community
‘Community’ has been defined in many different ways from diverse disciplinary perspectives (Kumar 2005). A community can be a group of people coming together in physical, environmental, economic, relational, political or social ways (Kumar 2005). For the purposes of this research ‘community’ is defined in three ways: those who live in a similar region; those who relate to each other as a community; and those who come together in response to an issue such as a disaster. Focusing on disasters, many researchers tend to identify the physical location where a disaster took place along with its name as synonymous with a disaster community. The assumption is that a common set of disaster behaviours might exist which supersede local cultural differences. In other words, one expects a common set of community level patterns of disaster behaviours. With specific reference to communities impacted by a disaster therefore, Allen (2006) defines community as the ‘‘population living within the territorial bounds of a town or village administrative unit, which is considered to be exposed to a relatively high degree of environmental hazard risk’’ (p. 84).
Disasters are also significant social constructs, formed within a particular social context (Kirschenbaum 2004; Quarantelli 1998). From this, it follows that any individual or family who has links through diverse social networks to others involved in a disaster becomes part of the disaster community. Geographic physical destruction remains important because the extent of physical damage, by creating economic, environmental and human losses, also has an impact on the social networks of interactions in such communities (Kirschenbaum 2004). A disaster
62
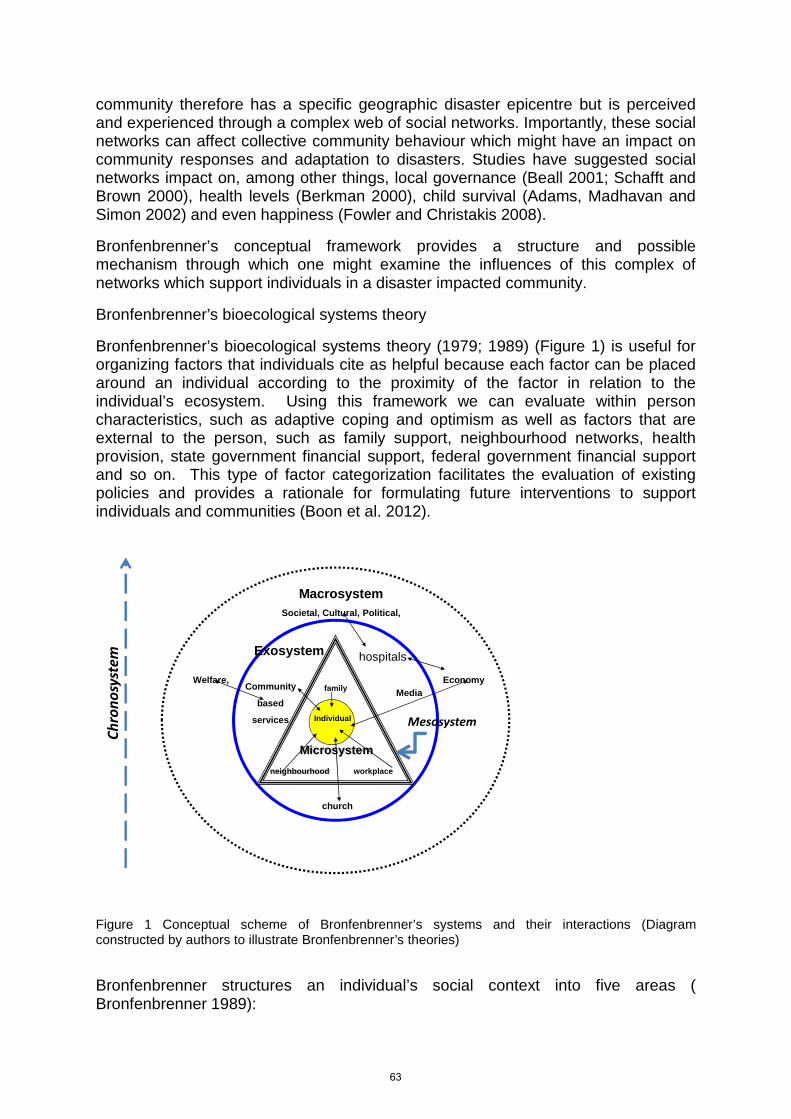
community therefore has a specific geographic disaster epicentre but is perceived and experienced through a complex web of social networks. Importantly, these social networks can affect collective community behaviour which might have an impact on community responses and adaptation to disasters. Studies have suggested social networks impact on, among other things, local governance (Beall 2001; Schafft and Brown 2000), health levels (Berkman 2000), child survival (Adams, Madhavan and Simon 2002) and even happiness (Fowler and Christakis 2008).
Bronfenbrenner’s conceptual framework provides a structure and possible mechanism through which one might examine the influences of this complex of networks which support individuals in a disaster impacted community.
Bronfenbrenner’s bioecological systems theory
Bronfenbrenner’s bioecological systems theory (1979; 1989) (Figure 1) is useful for organizing factors that individuals cite as helpful because each factor can be placed around an individual according to the proximity of the factor in relation to the individual’s ecosystem. Using this framework we can evaluate within person characteristics, such as adaptive coping and optimism as well as factors that are external to the person, such as family support, neighbourhood networks, health provision, state government financial support, federal government financial support and so on. This type of factor categorization facilitates the evaluation of existing policies and provides a rationale for formulating future interventions to support individuals and communities (Boon et al. 2012).
MacrosystemSocietal, Cultural, Political,
Welfare, Economy
Individual
Exosystem
Community
based
services
Microsystem
family
neighbourhood workplace
Media
church
hospitals
Chronosystem
Mesosystem
Figure 1 Conceptual scheme of Bronfenbrenner’s systems and their interactions (Diagram constructed by authors to illustrate Bronfenbrenner’s theories)
Bronfenbrenner structures an individual’s social context into five areas ( Bronfenbrenner 1989):
63
a. Microsystem – where the individual participates directly. b. Mesosystem – microsystem member interactions independent of the central
individual c. Exosystem – entities and organisations that might be accessed by the individual or
their family d. Macrosystem – the politics, views and customs that represent the cultural fabric of
the individuals’ society. e. Chronosystem – the elements of time as they relate to events in the individual’s
environment. The processes and experiences that the individual is exposed to either directly or through proximal interactions with the various systems above are thought to interact with their predispositions to structure their perceptions and responses, their behaviours, their adaptation and their acquisition of knowledge and skills (Bronfenbrenner and Ceci 1994).
Prior research
Communities in flood prone areas fare best when there is strong community cohesion, a perceptions of a sense of place and community involvement by the community members (Chang 2010). Collective efficacy, a construct defined as the shared belief that a group can effectively meet environmental demands and improve their lives through concerted effort, has also been found to be beneficial (Benight 2004). Benight noted that people responded successfully to a variety of problems after the floods by creating an organised crisis committee to speak, decide, and act on behalf of their small rural community, demonstrating collective efficacy by way of community cohesion and a high level of involvement.
Mitchell et al. (2010) explains that the flood prone community in Kaitaia, NZ, was supported by several factors and processes. A key issue is early communication to community members about the potential disaster risks and the levels of risks inherent in their response strategies. City council planning for a coordinated response to flooding, involving active participation of community members and organisations and leadership, helps to respond to a disaster, and promotes community resilience to the disaster. Smith (2010) concurred, showing that a disaster prone community is helped by pro-active planning and quick execution of a city council community recovery plan. In Australia, Gissing, Keys and Opper, (2010) examined flood research and argued that flood prone communities must be prepared. This includes taking note of flood warnings, emphasising that preparedness for flooding can save up to 80% of potential flood damages.
In relation to the factors that influence people to reside in flood prone localities, a number of studies show that while the experience of flooding has a deleterious effect upon people’s physical and emotional health and attachment to a place (Tapsell and Tunstall 2008), a sense of place connecting individuals with communities transcends the negative impacts that a disaster can impose (Chamlee-Wright and Storr 2009; Manning 2005). Others argue that despite apparent known flood risk, which Masuda and Garvin (2006) view as socially constructed, influenced by cultural factors and perceptions of the world, people make conscious decisions to reside and/or remain in areas that are flood prone, because they meet their lifestyle needs (Vogt, Willis and Vince 2008).
64
Research aims
The aim of this research was to gather community perceptions about what assisted in the response to and recovery from the 2009 floods in Ingham. Of interest is also the issue of sustainability, the continuing adaptive functioning of a community. Hallegatte, Henriet and Corfee-Morlot (2011) conceptualise this in terms of economic adaptive capacity. While many definitions exist for a sustainable community, Geis (2000) proposes that a sustainable community not only aims for improved quality of life for all its residents by applying ecologically defensible strategies, but also supports local resources to sustain and promote the local economy. We were, therefore, also interested in the factors which influenced Ingham’s economic recovery. Methods
In the case study two different groups of participants were recruited to be interviewed. The first group included key informants, comprising various categories of disaster emergency (e.g., state emergency management services, emergency medical services) and recovery respondents (e.g., community welfare agencies, mental health professionals) who were involved in assisting the community during and after the event. The second group comprised a cross-section of community residents (e.g. business owners, farmers, women’s groups) determined from a demographic profile of Ingham, and conversations with key informants and community representatives of various organisations. Members of these groups were not mutually exclusive as many of those engaged in disaster response were also members of the affected community.
A semi-structured interview of open questions was developed for common use with both key informants and community residents. Questions to informants and the community addressed the kinds of assistance that helped both during the event and after the event and the impact on the community. Although the original intent was to mainly conduct focus group interviews with community members, the difficulty of scheduling people at the same time led to some paired interviews, with the result that the number of focus groups varied from two to nine and the length varied from around 30 minutes to two hours. Interviews were conducted between August, 2010 and February 2011. A total of 77 participants were interviewed from a range of organisations and demographics (Tables 1 and 2 below); interviews were taped and transcribed and notes were taken and later expanded.
A team of researchers participated in the process for triangulation of researcher coding and debriefings (Ezzy, 2002; Hay, 2005). Transcribed tapes from interviews were open coded in which the main issues that emerged were first identified and coded. These codes were then categorised into themes or recurrent patterns. Common themes were identified within each of the Bronfenbrenner categories of scale: microsystem, exosystem (local, regional, state, national) and macro system.
Interview questions used were:
• Tell me what helped you during the event? • What sort of things helped you recover after the event? • What keeps you living in the community? Have you ever thought of moving
from this community?
65
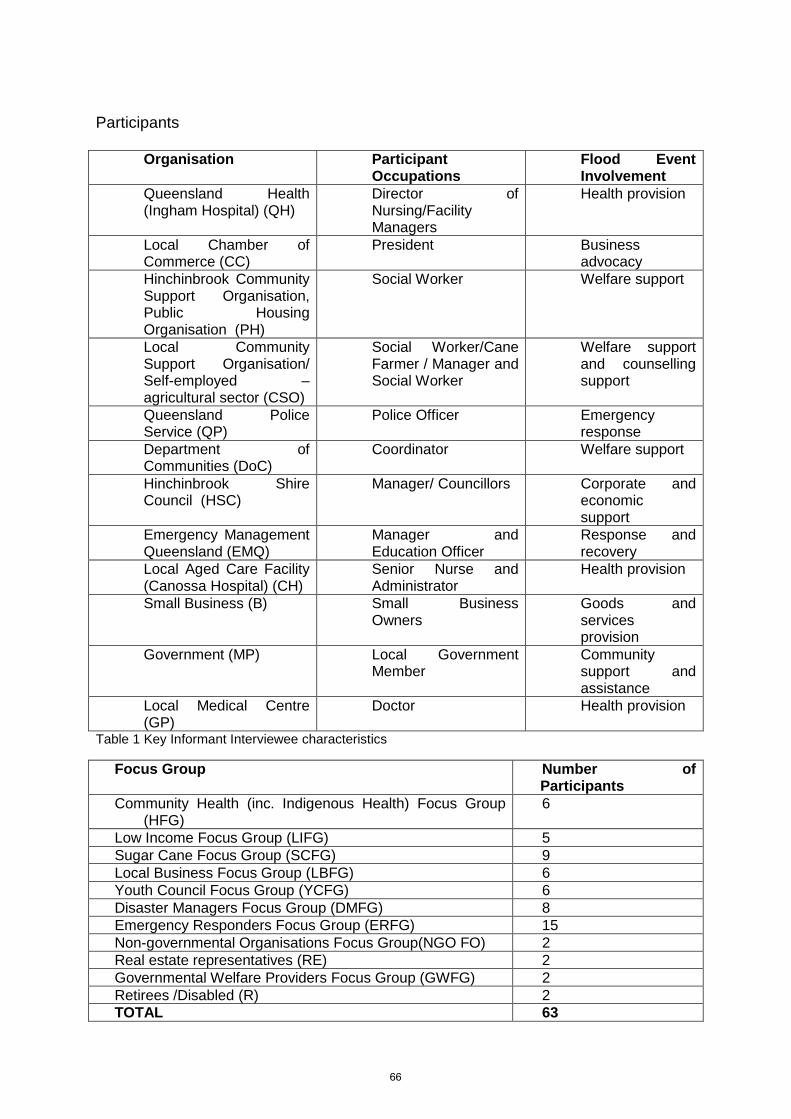
Participants
Organisation Parti cipant Occupations
Flood Event Involvement
Queensland Health (Ingham Hospital) (QH)
Director of Nursing/Facility Managers
Health provision
Local Chamber of Commerce (CC)
President Business advocacy
Hinchinbrook Community Support Organisation, Public Housing Organisation (PH)
Social Worker Welfare support
Local Community Support Organisation/ Self-employed – agricultural sector (CSO)
Social Worker/Cane Farmer / Manager and Social Worker
Welfare support and counselling support
Queensland Police Service (QP)
Police Officer Emergency response
Department of Communities (DoC)
Coordinator Welfare support
Hinchinbrook Shire Council (HSC)
Manager/ Councillors Corporate and economic support
Emergency Management Queensland (EMQ)
Manager and Education Officer
Response and recovery
Local Aged Care Facility (Canossa Hospital) (CH)
Senior Nurse and Administrator
Health provision
Small Business (B) Small Business Owners
Goods and services provision
Government (MP) Local Government Member
Community support and assistance
Local Medical Centre (GP)
Doctor Health provision
Table 1 Key Informant Interviewee characteristics
Focus Group Number of Parti cipants
Community Health (inc. Indigenous Health) Focus Group (HFG)
6
Low Income Focus Group (LIFG) 5 Sugar Cane Focus Group (SCFG) 9 Local Business Focus Group (LBFG) 6 Youth Council Focus Group (YCFG) 6 Disaster Managers Focus Group (DMFG) 8 Emergency Responders Focus Group (ERFG) 15 Non-governmental Organisations Focus Group(NGO FO) 2 Real estate representatives (RE) 2 Governmental Welfare Providers Focus Group (GWFG) 2 Retirees /Disabled (R) 2 TOTAL 63
66
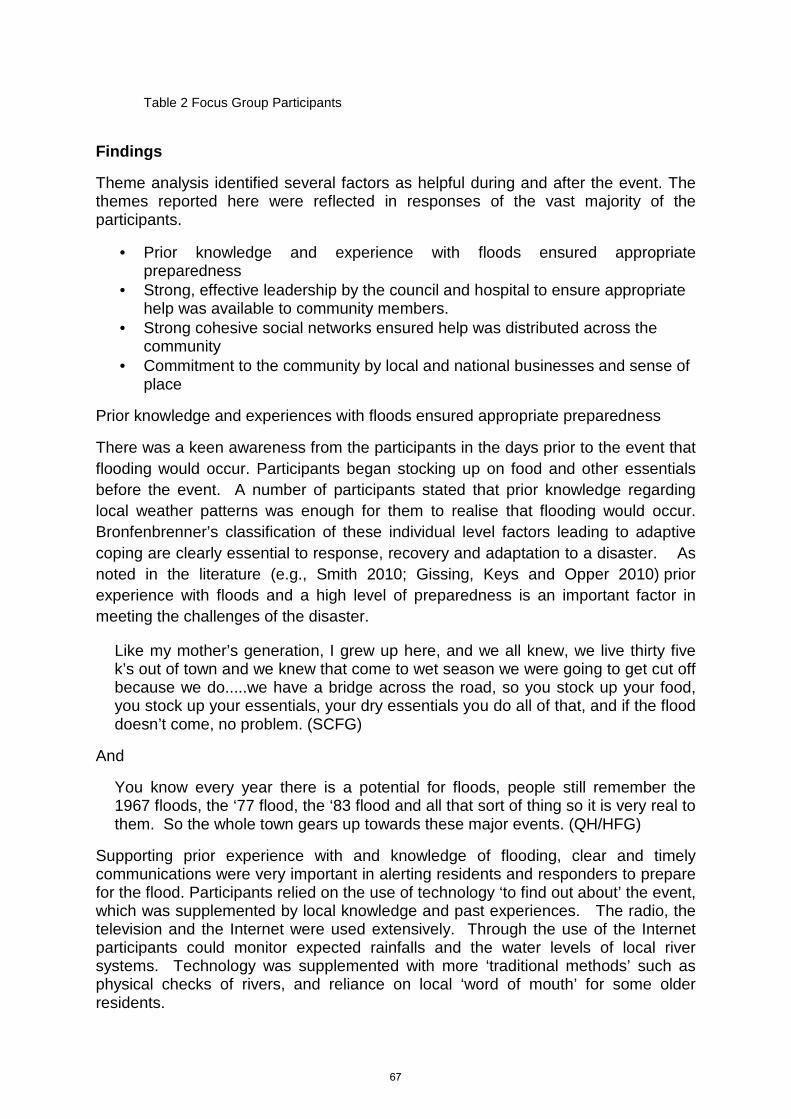
Table 2 Focus Group Participants
Findings
Theme analysis identified several factors as helpful during and after the event. The themes reported here were reflected in responses of the vast majority of the participants.
• Prior knowledge and experience with floods ensured appropriate preparedness
• Strong, effective leadership by the council and hospital to ensure appropriate help was available to community members.
• Strong cohesive social networks ensured help was distributed across the community
• Commitment to the community by local and national businesses and sense of place
Prior knowledge and experiences with floods ensured appropriate preparedness
There was a keen awareness from the participants in the days prior to the event that flooding would occur. Participants began stocking up on food and other essentials before the event. A number of participants stated that prior knowledge regarding local weather patterns was enough for them to realise that flooding would occur. Bronfenbrenner’s classification of these individual level factors leading to adaptive coping are clearly essential to response, recovery and adaptation to a disaster. As noted in the literature (e.g., Smith 2010; Gissing, Keys and Opper 2010) prior experience with floods and a high level of preparedness is an important factor in meeting the challenges of the disaster.
Like my mother’s generation, I grew up here, and we all knew, we live thirty five k’s out of town and we knew that come to wet season we were going to get cut off because we do.....we have a bridge across the road, so you stock up your food, you stock up your essentials, your dry essentials you do all of that, and if the flood doesn’t come, no problem. (SCFG)
And
You know every year there is a potential for floods, people still remember the 1967 floods, the ‘77 flood, the ‘83 flood and all that sort of thing so it is very real to them. So the whole town gears up towards these major events. (QH/HFG)
Supporting prior experience with and knowledge of flooding, clear and timely communications were very important in alerting residents and responders to prepare for the flood. Participants relied on the use of technology ‘to find out about’ the event, which was supplemented by local knowledge and past experiences. The radio, the television and the Internet were used extensively. Through the use of the Internet participants could monitor expected rainfalls and the water levels of local river systems. Technology was supplemented with more ‘traditional methods’ such as physical checks of rivers, and reliance on local ‘word of mouth’ for some older residents.
67
Strong, effective leadership by the council and hospital to ensure appropriate help was available to community members.
The hospital, Mayor, council and essential services such as electricity and water were reported as exemplary in their leadership and dedication to support the community, endorsing prior findings (Smith 2010). Their efforts resulted in there being no reports of undue hardship experienced by community members. These exosystem functions, amenable to intervention and future policy amendments, were essential for the wellbeing of the individuals in the community.
A lot of the nursing staff stayed here (in the hospital) for ten days....it was very humbling really because they had families at home under water quite often but they were here with us. It was really strong community commitment (QH)
The council here done a mighty job to give a hand in the clean up, to get rid of all the stuff, they did that as hard as they could to repair the roads. (R)
...even the Mayor like he always kept us informed about what was happening and even with the water to make sure we were OK so to fill up all our containers so we got that …any spare…because you know we may lose water. So everybody was aware of what to expect. (HFG)
After the floods we (the Council) set up particular recovery sub groups to engage with the community. They covered a range of social and infrastructure issues...and they wound up by September last year after the flood which was in February and there was a lot of work done...trying to get financial assistance for schools ...especially farmers I suppose, but business generally, and that was a bit of a struggle and it took till about June to get that happening. (LDMG)
...(what helped our recovery was ) the Hinchinbrook Shire officers in charge of the water treatment plant and the sewerage treatment plant in Ingham. We didn’t lose water... it was extraordinary, they were extraordinary circumstances and they kept those services for the district. Can you imagine if you had widespread power, water and sewerage shut downs during that long ten-day period when we were flooded and isolated? The efforts of the local council staff that were able to keep water and sewerage going and the efforts of those Ergon Energy operators who were able to keep the power on for the district most of the time... was just extraordinary. (MP)
Strong cohesive social networks ensured help was distributed across the community
The community is viewed by respondents as very tightly knit through family and friend networks and through the Lions Club and other local associations involving many of the residents. These social networks would be termed mesosystem connections using Bronfenbrenner’s conceptual framework. They support the perceptions and comments of participants of strong loyalty to the community and a sense of connectedness, echoing findings in prior research (Benight 2004). Non-Governmental Organisations and charity groups provided significant counselling and financial support to the community. Special mention by key informants was given to groups such as Lifeline, the Red Cross, the Lions Club, St Vincent De Pauls, and the local community organisation, the Hinchinbrook Community Support Centre.
...flood time is a really good time for me, it is a very social time, everyone goes
68
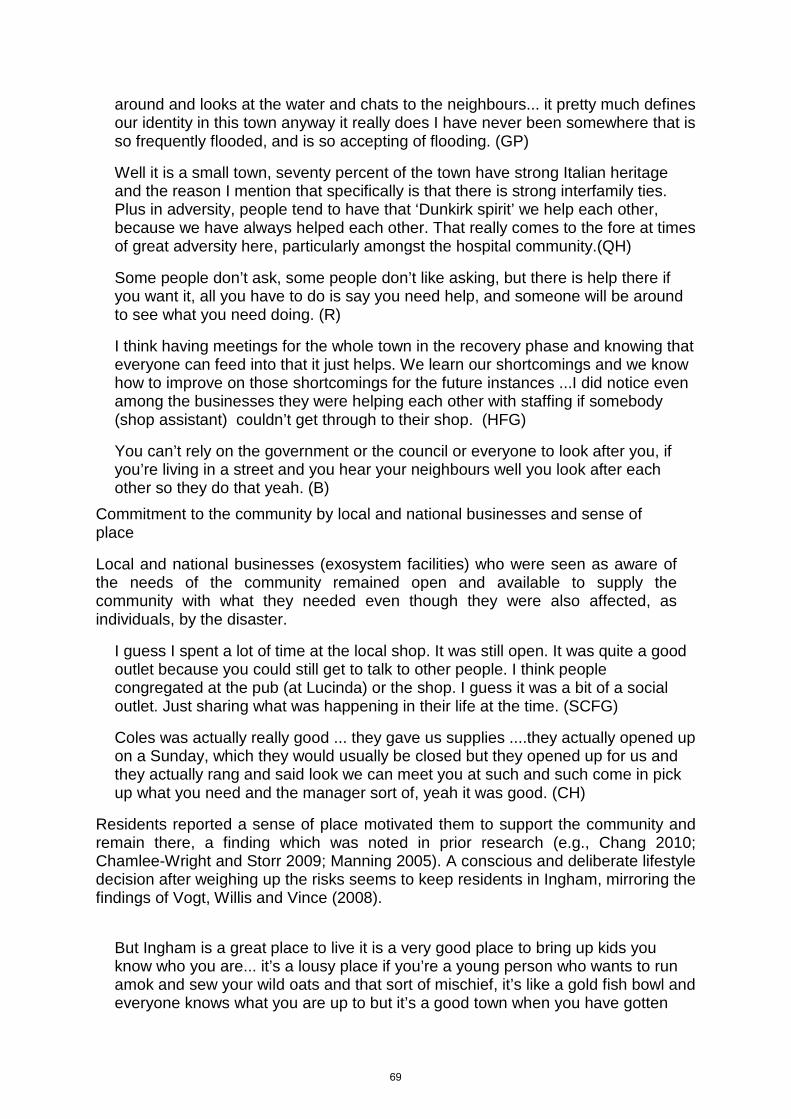
around and looks at the water and chats to the neighbours... it pretty much defines our identity in this town anyway it really does I have never been somewhere that is so frequently flooded, and is so accepting of flooding. (GP)
Well it is a small town, seventy percent of the town have strong Italian heritage and the reason I mention that specifically is that there is strong interfamily ties. Plus in adversity, people tend to have that ‘Dunkirk spirit’ we help each other, because we have always helped each other. That really comes to the fore at times of great adversity here, particularly amongst the hospital community.(QH)
Some people don’t ask, some people don’t like asking, but there is help there if you want it, all you have to do is say you need help, and someone will be around to see what you need doing. (R)
I think having meetings for the whole town in the recovery phase and knowing that everyone can feed into that it just helps. We learn our shortcomings and we know how to improve on those shortcomings for the future instances ...I did notice even among the businesses they were helping each other with staffing if somebody (shop assistant) couldn’t get through to their shop. (HFG)
You can’t rely on the government or the council or everyone to look after you, if you’re living in a street and you hear your neighbours well you look after each other so they do that yeah. (B)
Commitment to the community by local and national businesses and sense of place
Local and national businesses (exosystem facilities) who were seen as aware of the needs of the community remained open and available to supply the community with what they needed even though they were also affected, as individuals, by the disaster.
I guess I spent a lot of time at the local shop. It was still open. It was quite a good outlet because you could still get to talk to other people. I think people congregated at the pub (at Lucinda) or the shop. I guess it was a bit of a social outlet. Just sharing what was happening in their life at the time. (SCFG)
Coles was actually really good ... they gave us supplies ....they actually opened up on a Sunday, which they would usually be closed but they opened up for us and they actually rang and said look we can meet you at such and such come in pick up what you need and the manager sort of, yeah it was good. (CH)
Residents reported a sense of place motivated them to support the community and remain there, a finding which was noted in prior research (e.g., Chang 2010; Chamlee-Wright and Storr 2009; Manning 2005). A conscious and deliberate lifestyle decision after weighing up the risks seems to keep residents in Ingham, mirroring the findings of Vogt, Willis and Vince (2008).
But Ingham is a great place to live it is a very good place to bring up kids you know who you are... it’s a lousy place if you’re a young person who wants to run amok and sew your wild oats and that sort of mischief, it’s like a gold fish bowl and everyone knows what you are up to but it’s a good town when you have gotten
69
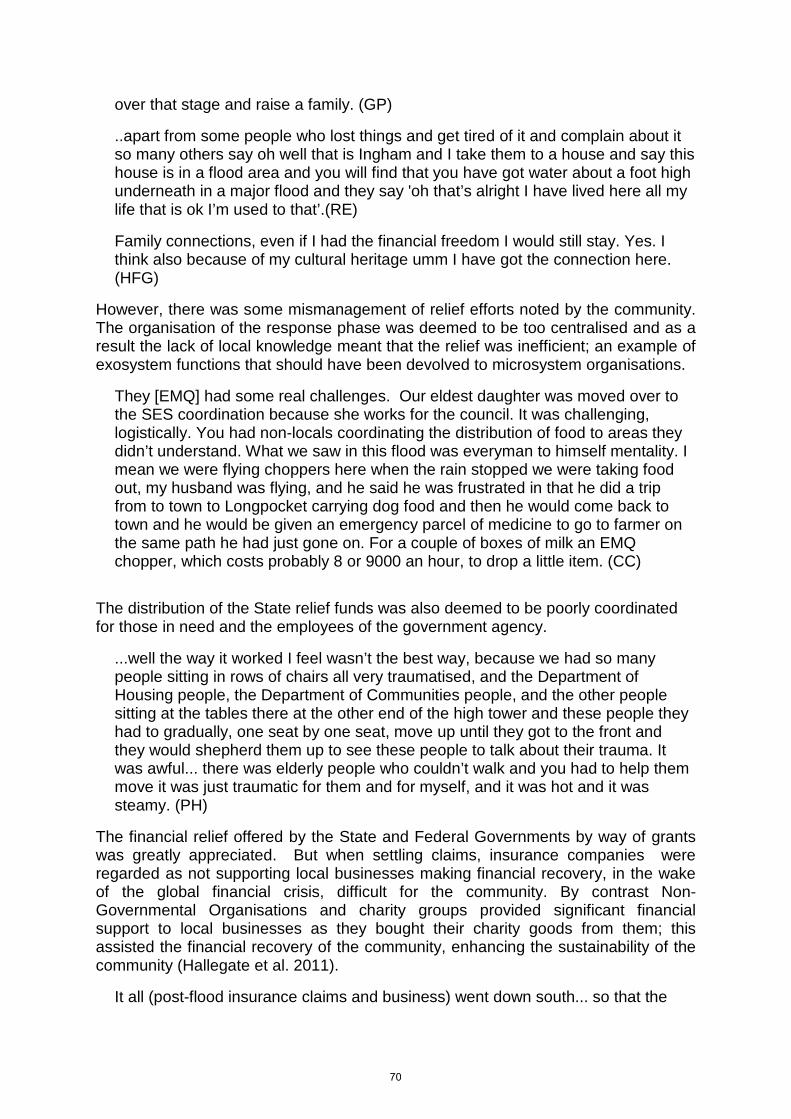
over that stage and raise a family. (GP)
..apart from some people who lost things and get tired of it and complain about it so many others say oh well that is Ingham and I take them to a house and say this house is in a flood area and you will find that you have got water about a foot high underneath in a major flood and they say 'oh that’s alright I have lived here all my life that is ok I’m used to that’.(RE)
Family connections, even if I had the financial freedom I would still stay. Yes. I think also because of my cultural heritage umm I have got the connection here. (HFG)
However, there was some mismanagement of relief efforts noted by the community. The organisation of the response phase was deemed to be too centralised and as a result the lack of local knowledge meant that the relief was inefficient; an example of exosystem functions that should have been devolved to microsystem organisations.
They [EMQ] had some real challenges. Our eldest daughter was moved over to the SES coordination because she works for the council. It was challenging, logistically. You had non-locals coordinating the distribution of food to areas they didn’t understand. What we saw in this flood was everyman to himself mentality. I mean we were flying choppers here when the rain stopped we were taking food out, my husband was flying, and he said he was frustrated in that he did a trip from to town to Longpocket carrying dog food and then he would come back to town and he would be given an emergency parcel of medicine to go to farmer on the same path he had just gone on. For a couple of boxes of milk an EMQ chopper, which costs probably 8 or 9000 an hour, to drop a little item. (CC)
The distribution of the State relief funds was also deemed to be poorly coordinated for those in need and the employees of the government agency.
...well the way it worked I feel wasn’t the best way, because we had so many people sitting in rows of chairs all very traumatised, and the Department of Housing people, the Department of Communities people, and the other people sitting at the tables there at the other end of the high tower and these people they had to gradually, one seat by one seat, move up until they got to the front and they would shepherd them up to see these people to talk about their trauma. It was awful... there was elderly people who couldn’t walk and you had to help them move it was just traumatic for them and for myself, and it was hot and it was steamy. (PH)
The financial relief offered by the State and Federal Governments by way of grants was greatly appreciated. But when settling claims, insurance companies were regarded as not supporting local businesses making financial recovery, in the wake of the global financial crisis, difficult for the community. By contrast Non-Governmental Organisations and charity groups provided significant financial support to local businesses as they bought their charity goods from them; this assisted the financial recovery of the community, enhancing the sustainability of the community (Hallegate et al. 2011).
It all (post-flood insurance claims and business) went down south... so that the
70
loss of those twenty days ...nothing made that up so there was no bounce back no recovery. You don’t only lose that ...there’s the replacement of stuff that gets replaced by insurance companies that goes for about a period of six months...we are not getting that business, that business was going out of town. ...for me and my business when we replaced the fridge we know that fridge was in the house for 16 years so we can’t make that again so that’s taken a whole slab of business from my business for the next 12 to 18 to 24 months because all this stuff that people get new here it was never supplied through our business it was supplied through Sydney outlets and Brisbane outlets. That will now affect my business for the next ten years until we get on that rotation again. (LBFG)
I still honestly think we are seeing the combined effect of the floods and the GFC still here today and businesses are just hanging on by their finger tips. I have had businesses say to me that they have been in town for thirty years and it has never been tougher then these past two years. Even the more successful people like the ----- family, who did the massive redevelopment and put the Woolworths complex in and updated the Mitre 10... they are locals and they are telling me, “we have never had it this tough”. (CC)
Conclusion
Ingham floods regularly but the 2009 event was unusual because two floods occurred in succession. Residents had just cleaned up only to have to do it again, causing more distress than in past floods. Despite the differences between the 2009 flood and previous floods, Ingham residents appear to have been well prepared. Local knowledge, communication technology and social networks were all reported as being instrumental in assisting residents for a timely preparation for the flood event. Those historically more vulnerable, the elderly, the socially disadvantaged, single mothers and newcomers were less likely to be prepared and more likely not to take heed of locals’ advice to prepare; they remained complacent in the face of the unfolding event. This was also remarked in relation to some younger groups who were perceived to share a culture of “help me”. The lifestyle that the residents of Ingham have chosen, a lifestyle noted for being close-knit, family centred and highly networked, is precisely what seems to have helped the community recover and adapt. The conscious choices made prior to the disaster, weighing up potential risks and the lifestyle offered by the community, were upheld post-disaster. Strong microsystem connections have been the glue sustaining the community. Microsystem level factors such as family, friends and neighbours banded together to help during the event, adding to the perception that there is community cohesion and cooperation in the community. Highly instrumental to the recovery efforts were exosystem factors, the community leadership, with the Mayor, Lions Club President, and other local businessmen taking up active roles. The council committee structure was established quickly in response to the event and provided leadership to help the recovery process and establish responsibilities for future events. Local volunteers groups helped to organize response for coordination of goods, services and support.
71
Charity organisations as well as a government-established recovery centre were very active and aided the recovery process. Financial assistance by way of grants to individuals, and business groups, a macrosystem factor, was deemed to be helpful, though some mismanagement issues were also reported by key informants and respondents. Overall, it is unclear whether recovery is complete two years post the event. Various reasons are proposed for this, including the global financial crisis and the tendency for insurance claims to be contracted out of the community, leaving local businesses out of the rebuilding effort. In addition, the reliance on the sugar industry as the primary local industry placed some additional financial burdens on the community, especially if those who 'forward sold' were unable to meet contracts. Nonetheless, the community deemed themselves to be in a better position than the community of Victoria which was affected by fires a little after the flood events; Ingham passed on relief money to fire affected Victoria. Mitigation efforts for future events include renewed building codes and regulation to prevent new housing from being built in flood prone areas, and also the building of levee banks. An issue of great concern was the sense of powerlessness that locals reported during the response phase of Emergency Management Queensland (EMQ). EMQ were deemed inefficient because of a lack of local knowledge, and because they did not consult with locals to improve their performance, refusing to devolve power. Participants reported a belief that if local knowledge and expertise had been utilised, EMQ’s efforts would have been both more effective and efficient. These criticisms were noted by the local council, who in collaboration with EMQ has now implemented a flood warden scheme, which will see power devolved to local community members. They will disseminate information and act as a key point of contact in the case of future flooding events. There is considerable enthusiasm within the community regarding these efforts, showing the strong social cohesion and commitment and sense of place the community has. In all there are enormous social networks operating in the community, illustrating the mesosystem links between microsystems. Respondents interviewed continue to live in Ingham in the face of recognised future risk of weather disasters because, while financial and economic factors shape their lifestyle choices, a sense of place and belonging binds them to Ingham, showing the importance of microsystem factors in shaping individuals’ decision making. References
ABC News. 2010, Ingham floods recede but more rain on way [Online]. Available: http://www.abc.net.au/news/stories/2009/02/06/2484393.htm [Accessed 7 September 2010]. Australian Bureau of Statistics .2008, Social Trends 2008. Available online www.abs.gov.au Adams, A.M., Madhavan, S. and Simon, D. 2002, ‘Women’s social networks and child survival in Mali’, Social Science and Medicine, vol. 54, pp.165-178.
72
Allen KM. 2006, ‘Community-based disaster preparedness and climate adaptation: Local capacity-building in the Philippines’, Disasters, vol.30, no.1, pp.81-101. Australian Red Cross. 2009, North Queensland Floods [Online]. Available: http://www.redcross.org.au/QLD/services_disresp_nqfloods2009.htm [Accessed 7 September 2010]. Anderson-Berry, L. and King, D. 2005, Mitigation of the Impact of Tropical Cyclones in Northern Australia through Community Capacity Enhancement. Mitigation and Adaptation Strategies for Global Change , vol. 10, pp. 367-392. Springer Beall , J. 2001, ‘ From social networks to public action in urban governance: where does benefit accrue?’, Journal of International Development, vol.13, pp.1015–1021 Benight, C.C. 2004, ‘ Collective efficacy following a series of natural disasters’, Anxiety Stress Coping, vol.17, no.4, pp.401–420 Berkman, L.F. 2000, ‘ Social support, social networks, social cohesion and health’, Social Work and Health Care, vol.31, pp.3–14 Boon,H.J., Cottrell,A., King, D.,Stevenson, R.B. and Millar, J. 2012,‘Bronfenbrenner’s bioecological theory for modelling community resilience to natural disasters’, Natural Hazards, vol.60, no1, pp.381–408.
Bronfenbrenner, U. 1979, The Ecology of Human Development: Experiments by Nature and Design, Harvard University Press, Cambridge, MA Bronfenbrenner, U. 1989, ‘Ecological systems theory’, Annals of Child Development, vol.6, pp187–249. Bronfenbrenner, U. and Ceci, S. J. 1994, ‘Nature Nurture reconceptualised in developmental perspective: a bioecological model’, Psychological review, vol.101, no.4, pp.568-586. Bureau of Meteorology (BOM). 2009, Herbert River Floods: January and February 2009. Australian Government. Bushnell, S., Balcombe, L. and Cottrell. A. 2007, ‘Community and fire service perceptions of bushfire issues in Tamborine Mountain: what’s the difference?’ Australian Journal of Emergency Management, vol. 22, no.3, pp.3-9. Chamlee-Wright, E. and Storr, VH., 2009, ‘There’s No Place Like New Orleans’: Sense Of Place And Community Recovery In The Ninth Ward After Hurricane Katrina’, Journal of Urban Affairs, vol.31, no.5, pp.615-634. Chang, K. 2010, ‘Community cohesion after a natural disaster: insights from a Carlisle flood’, Disasters, vol. 34, no.2, pp. 289−302. Department of Emergency Services, 2009, Emergency: The official publication of the Department of Emergency Services. Queensland Government. Ezzy, D. 2002, Qualitative Analysis: Practice and Innovation. Allen and Unwin. Fowler, J.H. and Christakis, N.A. 2008, ‘Dynamic spread of happiness in a large social network: longitudinal analysis over 20 years in the Framingham Heart Study’, British Medical Journal, vol.337, :a2338. doi:10.1136/bmj.a2338 Geis, DE. 2000, ‘By Design: The Disaster Resistant and Quality-Of-Life Community’, Natural Hazards Review, vol.1, no.3, pp.151-160. Gissing, A., Keys, C. , and Opper, S. 2010, ‘Towards resilience against flood risks’, Australian Journal of Emergency Management, vol.25, no.2, pp.39-45. GNS. 2007, Flood risk perceptions, education and warning in four communities in New South Wales, Australia – results of a questionnaire survey, 2005. GNS Scientific Report 2007/30. Hallegatte, S., Henriet, F. and Corfee-Morlot, J. 2011, ‘The economics of climate change impacts and policy benefits at city scale: a conceptual framework’, Climate Change, vol.104, pp.51–87.
73
Hay, I.(ed ) 2005, Qualitative Research Methods in Human Geography(2nd Edition), Oxford University Press. IPCC. 2007, Climate Change 2007: Impacts, Adaptation and Vulnerability. Contribution of Working Group II to the Fourth Assessment Report of the Intergovernmental Panel on Climate Change. Parry, M.L., Canziani, O.F., Palutikof, J.P., van der Linden P.J. & Hanson, C.E. (Eds.). Cambridge, UK: Cambridge University Press. IPCC, 2012, Summary for Policymakers. In: Managing the Risks of Extreme Events and Disasters to Advance Climate Change Adaptation [Field, C.B., V. Barros, T.F. Stocker, D. Qin, D.J. Dokken, K.L. Ebi, M.D. Mastrandrea, K.J. Mach, G.-K. Plattner, S.K. Allen, M. Tignor, and P.M. Midgley (eds.)]. A Special Report of Working Groups I and II of the Intergovernmental Panel on Climate Change. Cambridge University Press, Cambridge, UK, and New York, NY, USA, pp. 1-19. Kirschenbaum, A. 2004, ‘Generic sources of disaster communities: a social network approach’, International Journal of Sociological and Social Policy, vol. 24, no.10/11, pp.94–129 Kumar C. 2005, ‘Revisiting 'community' in community-based natural resource management’, Community Development Journal, vol.40, pp.275-85. Manning, SC. 2005, ‘Riding Out The Risks: An Ethnographic Study Of Risk Perceptions In A South Louisiana Bayou Community’, MS thesis, Louisiana State University, Louisiana. Mitchell, A., Glavovic, B.C. , Hutchinson, B. , MacDonald, G., Roberts, M. and Goodland, J. 2010, ‘Community-based civil defence emergency management planning in Northland, New Zealand’, Australasian Journal of Disaster and Trauma Studies, vol.2010-1.ISSN:1174-4707, viewed Nov 1 2010, <http://www.massey.ac.nz/~trauma/issues/2010-1/mitchell.htm Quarantelli, E.L. (ed).1998, What is a disaster? Perspectives on the question. Routledge, London Schafft, K.A. and Brown, D.L. 2000, ‘Social capital and grassroots development: the case of Roma self-governance in Hungary’, Social Problems, vol.47, no.2, pp.201-219. Smith, G. 2010, ‘Lessons from the United States: Planning for post-disaster recovery and deconstruction’, Australasian Journal of Disaster and Trauma Studies, vol.2010-11, ISSN:1174-4707, viewed Nov 10, 2010, http://www.massey.ac.nz/~trauma/issues/2010-1/smith.htm. Tapsell, SM. and Tunstall, SM. 2008, ‘’I wish I’d never heard of Banbury’’: The relationship between ‘place’ and the health impacts from flooding’, Health and Place, vol.14, no.2, pp.133-154. Vogt, M., Willis, K., and Vince, J. 2008, ‘Weighing up the risks — the decision to purchase housing on a flood plain’, The Australian Journal of Emergency Management, vol. 23 no. 1, pp.49-53.
74
Across the Ditch
Exploring the Partnership between the Australian and New Zealand
Red Cross in Disaster Recovery.
Kate Brady (National Recovery Coordinator, Australian Red Cross)
Jolie Wills (Community Recovery Advisor, New Zealand Red Cross)
Paper presented at EARTH: FIRE AND RAIN Australian & New Zealand Disaster and Emergency Management Conference Brisbane – 16 – 18, April 2012
75
Across the Ditch
Exploring the Partnership between the Australian and New Zealand Red Cross in Disaster Recovery.
Authors: Kate Brady (National Recovery Coordinator, Australian Red Cross) and Jolie Wills (Community Recovery Advisor, New Zealand Red Cross)
This paper has been written to complement the ANZDMC conference presentation in April 2012.
Risk is a dominant cultural theme of our age – be it climate change, increased urbanization, population growth, environmental degradation or terrorism. We live in an increasingly risk-prone, uncertain and interconnected world. While the Australian and New Zealand Red Cross societies have worked together in a number of ways historically, this new age of risk demands new approaches. Foremost is the scaling up our partnership in order to leverage off each other’s capacities and resources so we can do more and reach further as a Red Cross movement. Collaboration must be stepped up - the global challenges we are facing demand it, as do the natural disasters occurring in our own countries. The focus of this paper will be looking at how the two organisations have worked collaboratively in recent emergency events, following the 2011 Queensland Cyclone Yasi and the February 2011 Christchurch Earthquake.
Background
Australian Red Cross was formed in 1914, nine days after the start of World War I. Red Cross activities began in New Zealand during the same period. In 1915 New Zealand activities were consolidated within a single branch of British Red Cross before forming the New Zealand society in 1931. Both organisations are members of the International Federation of the Red Cross, and share the movement’s seven fundamental principles:
Humanity Neutrality Independence Impartiality Universality Unity Voluntary service
The Australian and New Zealand Red Cross societies have had a long standing relationship and have worked closely together in many emergency events, other than facilitating public appeals for the others emergency events until 2011 this relationship has almost exclusively focused on assisting a third party, for example sending personnel to countries in the Asia-Pacific region that have needed emergency assistance, or working on development projects within the region.
76

Within both organisations, this falls into the scope of the international programs department. Rarely has this partnership extended to the domestic services program work.
In January 2011, following nearly two months of solid activation as a result of the Queensland and Victorian floods, WA bushfires and tropical cyclone Yasi, Australian Red Cross accepted an offer from the New Zealand team to send 12 personnel to assist incident management teams. From the Australian side, this was a welcome offer – resources had started to become stretched as a result of such a prolonged activation around the country. Andrew Coghlan, National Manager Emergency Services for Australian Red Cross commented on the offer of assistance.
“When we got the call from the Kiwis, it was welcome. We knew they’d be prepared and trained, and as they were coming from another national society, we knew they would understand where we were coming from without having to explain the organisational context. Having fresh people to help at that time was fantastic. It worked well, and we would definitely look at using their teams in a response again if the situation called for it.”
From a New Zealand perspective, it offered an opportunity for personnel to gain international experience they might not otherwise have had access to. Stephen Manson, Emergency Management Officer, South Island recalls being a somewhat apprehensive about the amount of system information the New Zealand crew would be required to learn before they could be of assistance to the Australian team.
“We expected the systems, structures and guiding legislation to be foreign and pretty different from the New Zealand context, but in reality the structure was about 95% the same, which was helpful. Their AIIMS structure is very similar to the New Zealand CIMS structure, and the workplace standards are shared between Australia and New Zealand.”
The kiwi crew stayed to assist for 34 days before returning home. Unfortunately, Australia was given the opportunity to repay the favour sooner than anyone would have liked when the February 22 6.3 magnitude earthquake struck the Canterbury region of New Zealand, resulting in 185 deaths, and widespread impact on people, property and infrastructure. The Australian Red Cross sent 12 personnel with experience in Operations, Media and Communications to support.
In remarkably similar circumstances to the Australian experience following the 2009 Victorian Bushfires, New Zealand Red Cross recognised the need to deliver longer term recovery programmes as part of their domestic emergency management work in response to the Canterbury earthquakes. Elizabeth McNaughton was appointed to the role of Recovery Manager in April 2011, and soon after came to Australia to gather information and lessons learned about the recovery work that had been undertaken there, including the work following the 2006 East Coast Tasmanian fires, the 2008 Mackay floods and the 2009 Victorian bushfires. This information fed into initial planning for the New Zealand programme, and three Australian Emergency Services personnel were sent to Christchurch in the second half of 2011 to support the start of the Canterbury recovery program while the team was being recruited.
Loren Hackett, one of the Australian Red Cross personnel sent to New Zealand talked about her experience.
“Our main purpose there was to support the New Zealand crew to develop a personal support program that went beyond their normal response. We were able to offer the systems and training that we had in place, and to help the New Zealand team modify our tools to fit their context. We helped pilot the training there and supported Elizabeth with the planning work that
77

she was doing. It was also a good opportunity for us to tell them about some of the challenges we had faced when we set up the Victorian bushfire recovery team. It can be overwhelming if you feel like you’re on your own. I think one of the main jobs we had when I was over there was to make sure their team felt like they had support they could call on if they needed it.”
In December 2011 and again in February 2012, Australian Red Cross sent recovery personnel to first support the induction of the appointed New Zealand recovery team, and then to provide support to staff around the anniversary of the February earthquake. While the intention was for the Australians to provide support, the information flow was two way and the Australian Red Cross is currently looking at how they can implement a number of pieces of work being undertaken by the New Zealand team.
Working together in both response and recovery builds internal capacity, strengthens the resilience of both organisations and enhances services to affected people.
Principles of a good alliance
There has been a lot of research undertaken regarding partnerships between not for profit organisations, and may help to explain the success of the relationship between the two organisations. Ashman (2001) describes effective collaboration as involving:
- equitable and genuine partnerships that grow out of mutual respect and trust - compatible purposes, strategies and values - a two way exchange of information, ideas and experience.1
In their 2005 working paper for the Overseas Development Institute, Blagescu and Young state that “Partnerships are neither rigid nor static, but fluid dynamic relationships which develop with time. In practice, there are two main barriers to effective partnerships (i) inequality / power imbalances, and (ii) the partner’s internal management systems.”2
Unwin (2005) examined the components of successful partnership within the practical context of ICT4D (information and communication technology for development) project partnerships. Key practical elements identified as critical for successful partnerships included:
- trust - a clear focus - enthusiastic leaders within both parties - sustainability, derived from ensuring a long term focus - communication - transparency and a sound ethical basis3
Such research helps to explain why the partnership between New Zealand and Australian Red Cross in emergency management has been successful to date. The collaboration is based upon the same end purpose, vision, principles, temperament and values. 1 Ashman, D. (2001). Strengthening North-South partnerships for sustainable development. Non-profit and
Voluntary Sector Quarterly, 30 (1), 74-98 2 Blagescu, M. & Young, J. “Partnerships and Accountability: Current thinking and approaches among agencies
supporting Civil Society organisations” Overseas Development Institute, Working Paper 255: August 2005 3 Unwin, T (2005) Partnerships in development practice: evidence from multi-stakeholder ICT4D partnership
practice in Africa, Paris: UNESCO (UNESCO Publications for the World Summit on the Information Society)
78
One of the main contributing factors to the success of the partnership is the equal relationship between the two organisations, meaning that there has not been a power imbalance to overcome.
Relationships have been built between both teams which embody trust, communication and transparency, and this model of working collaboratively has been embraced enthusiastically by the leadership on both sides of the Tasman. The power in the relationship has been balanced as both of us have needed help from the other at different points, and have been able to take lessons learned and apply them to our own context. The systems that we work within, while different in some ways, are generally very similar and translation between the two contexts is relatively straight forward.
Benefits of working together
There have been numerous benefits of working together.
As a movement we have joint policies, standards, guidelines and disaster preparedness and response tools. Working in partnership allows us to expand on these commonalities. We have been able to share tools, such as planning guidelines, saving time and resources thereby making us more nimble in responding to domestic response and recovery needs.
Working in emergency management is stimulating and rewarding, but can also be emotionally and physically taxing. Robust self-care strategies are required to recognise and manage stress. Self-care is extremely important in order to be able to best support, as an individual, team and organisation, affected individuals and communities. Having colleagues from across the Tasman who are sufficiently removed from the situation, but who have been there themselves and understand how the team members might be feeling at different stages, is invaluable. Reminders of the importance of caring for ourselves in order to stay the distance, recognising that recovery is an endurance feat, have been greatly appreciated.
79
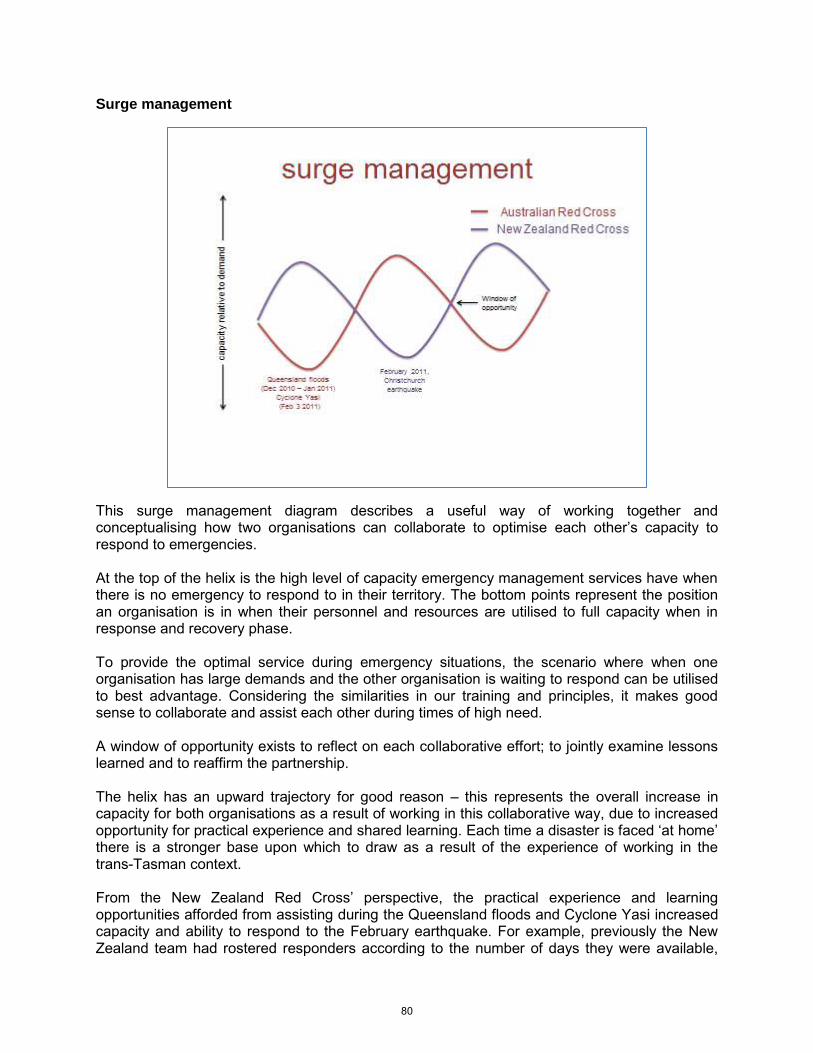
Surge management
This surge management diagram describes a useful way of working together and conceptualising how two organisations can collaborate to optimise each other’s capacity to respond to emergencies. At the top of the helix is the high level of capacity emergency management services have when there is no emergency to respond to in their territory. The bottom points represent the position an organisation is in when their personnel and resources are utilised to full capacity when in response and recovery phase. To provide the optimal service during emergency situations, the scenario where when one organisation has large demands and the other organisation is waiting to respond can be utilised to best advantage. Considering the similarities in our training and principles, it makes good sense to collaborate and assist each other during times of high need. A window of opportunity exists to reflect on each collaborative effort; to jointly examine lessons learned and to reaffirm the partnership. The helix has an upward trajectory for good reason – this represents the overall increase in capacity for both organisations as a result of working in this collaborative way, due to increased opportunity for practical experience and shared learning. Each time a disaster is faced ‘at home’ there is a stronger base upon which to draw as a result of the experience of working in the trans-Tasman context. From the New Zealand Red Cross’ perspective, the practical experience and learning opportunities afforded from assisting during the Queensland floods and Cyclone Yasi increased capacity and ability to respond to the February earthquake. For example, previously the New Zealand team had rostered responders according to the number of days they were available,
80
which varied and made rostering difficult. The Australian experience highlighted how efficiency could be gained by rostering in set five day slots (five on, two off), reducing stress and freeing up time and resources. This concept was applied with great benefit after the February earthquake. This model of working assists both organisations to most effectively respond to emergencies as well as continuing to build emergency management knowledge and capacity on both sides of the Tasman.
Exchange of information
With regard to the benefits of knowledge sharing, the old adage two minds are better than one applies. We can learn and build capacity quickly if we can pool knowledge, skill bases and experience – taking each from the pool what will work best for our own situations.
By both organisations sharing and exchanging knowledge and information openly, we each improve capacity resulting in an ultimate improvement in the quality of our respective services. We can review each other’s guidelines and query how similar situations have been handled across the Tasman, thereby adding value and improving all we do. Through collaboration, both organisations can better meet their visions to best serve the populations we support. Ultimately we both have the same goal in our recovery work – to support people who have been affected by emergencies to cope with the disruption it has caused. Five examples of where Australian and New Zealand Red Cross recovery teams have exchanged or are exchanging information are below:
1. Anniversaries In the lead up to the first anniversary of the February earthquake, the New Zealand Red Cross was able to add to the information and feedback they were providing to Christchurch City Council with research from the United Stated States, United Kingdom and Australia by inviting Kate Brady to the meeting they were having with the council. By providing a neutral, outsider’s perspective, Brady was able to relate stories and experiences from her research internationally and the experiences she had witnessed in Australia. This input assisted New Zealand Red Cross to verify the information they were presenting, and allowed New Zealand Red Cross to easily promote themselves as an access point to international experience and best practice. Additionally, Brady supported the New Zealand staff and volunteers by providing a briefing about what they might experience during the anniversary based on her personal experience of working on anniversaries in Australia.
2. Impacts on personnel who are directly affected in large scale events As a result of the Canterbury earthquakes, New Zealand Red Cross have experience supporting their own personnel who have been personally and professionally impacted by an emergency. While this has happened on a smaller scale in Australia, it has not happened to the extent that it has in Christchurch and the lessons that staff and management are identifying are invaluable for Australian Red Cross in planning for this. Should a similar event occur in Australia, we will be relying heavily on the New Zealand experience.
81
3. Methods of needs assessments
Both New Zealand and Australian Red Cross acknowledge the need for continuous needs assessments in recovery work, and both understand the challenges that this presents. New Zealand Red Cross are currently trialing a way of gathering information through their first aid teams, which is a method that could have direct applicability for the Australian Red Cross in a similar event. The New Zealand Red Cross First Aid training team train between 900 – 1200 people in Christchurch per month in first aid, and since the earthquake have identified that the course often raises issues and memories for participants relating to the immediate impacts of the earthquakes including being injured, seeing people with injuries or assisting people who were injured. In the first instance, the recovery team provided the first aid team with personal support training. The aim was to better equip the First Aid trainers for the scenarios where people wanted to tell their stories. The recovery team is now planning to partner with the first aid team to gather information on the views of the Christchurch population about ongoing recovery needs. The Australian Red Cross recovery team has not used this approach before and could have direct applicability for their future work.
4. Youth digital projects Following the 2009 Victorian Bushfires, Australian Red Cross developed a series of recovery resources targeting young people, including a set of audio files recoded in a radio show format, made available on pre-loaded MP3 players. New Zealand Red Cross is adapting the Australian project framework and delivery mechanism to the Canterbury context. The Australian Red Cross’ creative initiative has been further extended by the New Zealand team who are developing an additional smart phone application, with Australia’s support and input. All further ideas and gained knowledge will then be available to Australian Red Cross for future scenarios.
5. Bereaved support New Zealand Red Cross has recently been asked by the Royal Commission to continue the support of those who lost a loved one in the Christchurch earthquake. To best explore the possible options to support the bereaved, New Zealand Red Cross will be seeking and exploring reflections and lessons learned by both Australian Red Cross who were involved in the organization of support groups following the Victorian bush fires and directly from an advisory group of the bereaved themselves. These are only five examples of many – for example we are looking to share evaluation guidelines, lessons from the different funding models we both use, and developing similar training. With the freely flowing information comes the flow of ideas. This translates to the ability of both organisations to be increasingly creative and innovative in our strategies and services.
82
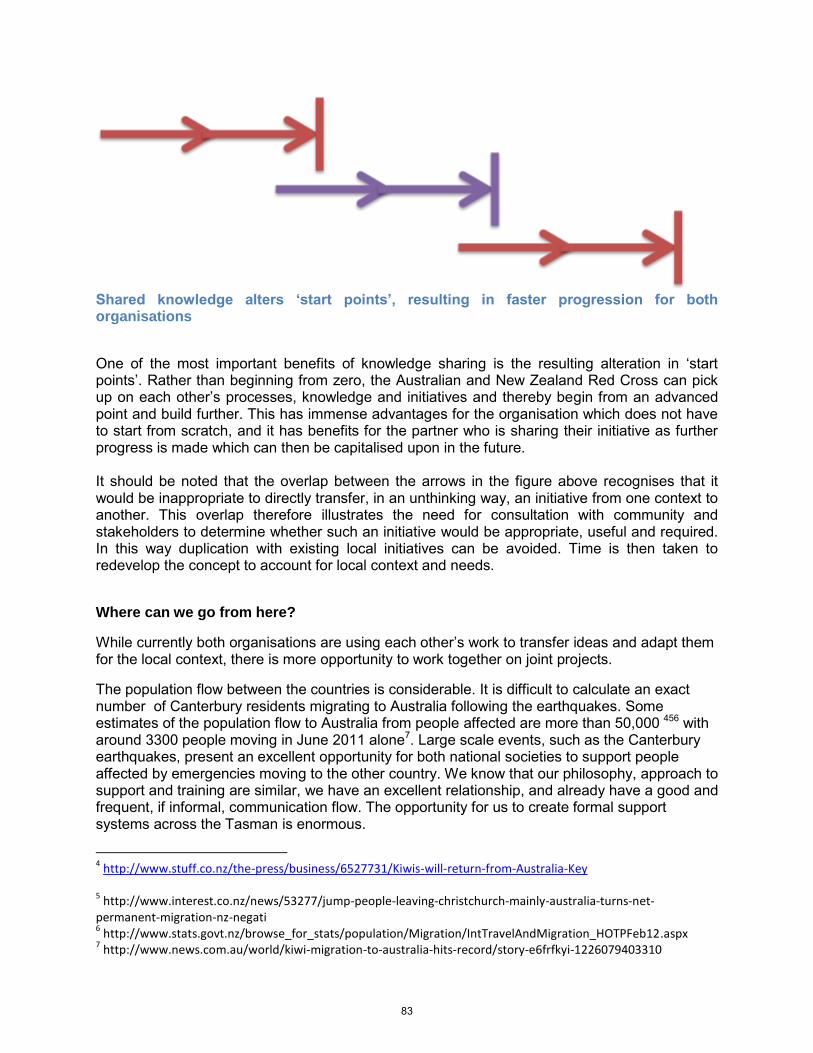
Shared knowledge alters ‘start points’, resulting in faster progression for both organisations
One of the most important benefits of knowledge sharing is the resulting alteration in ‘start points’. Rather than beginning from zero, the Australian and New Zealand Red Cross can pick up on each other’s processes, knowledge and initiatives and thereby begin from an advanced point and build further. This has immense advantages for the organisation which does not have to start from scratch, and it has benefits for the partner who is sharing their initiative as further progress is made which can then be capitalised upon in the future. It should be noted that the overlap between the arrows in the figure above recognises that it would be inappropriate to directly transfer, in an unthinking way, an initiative from one context to another. This overlap therefore illustrates the need for consultation with community and stakeholders to determine whether such an initiative would be appropriate, useful and required. In this way duplication with existing local initiatives can be avoided. Time is then taken to redevelop the concept to account for local context and needs.
Where can we go from here?
While currently both organisations are using each other’s work to transfer ideas and adapt them for the local context, there is more opportunity to work together on joint projects.
The population flow between the countries is considerable. It is difficult to calculate an exact number of Canterbury residents migrating to Australia following the earthquakes. Some estimates of the population flow to Australia from people affected are more than 50,000 456 with around 3300 people moving in June 2011 alone7. Large scale events, such as the Canterbury earthquakes, present an excellent opportunity for both national societies to support people affected by emergencies moving to the other country. We know that our philosophy, approach to support and training are similar, we have an excellent relationship, and already have a good and frequent, if informal, communication flow. The opportunity for us to create formal support systems across the Tasman is enormous.
4 http://www.stuff.co.nz/the-press/business/6527731/Kiwis-will-return-from-Australia-Key
5 http://www.interest.co.nz/news/53277/jump-people-leaving-christchurch-mainly-australia-turns-net-
permanent-migration-nz-negati 6 http://www.stats.govt.nz/browse_for_stats/population/Migration/IntTravelAndMigration_HOTPFeb12.aspx
7 http://www.news.com.au/world/kiwi-migration-to-australia-hits-record/story-e6frfkyi-1226079403310
83
Another area where partnership provides added strength is advocacy. “The frequency of disasters is increasing. These challenges require a clear direction combined with new ways of working, new skills, reflection and learning. We need to work together to make disaster risk reduction a global, national and local priority and to build a culture of safety across the region.” (McNaughton, 2009)8
It is essential to work together to advocate in order to ensure that today’s hazards don’t turn into tomorrow’s disasters. New Zealand and Australia are key players in advocating for disaster risk reduction and our partnership demonstrates an example of finding new way of working to respond to this era of risk and the increased frequency of disasters.
Another example of where our partnership could have direct relevance is in promoting partnerships in developed countries through the International Federation of the Red Cross. Traditionally many partnerships have formed between developed and developing countries, or between developed countries who are jointly seeking to support a developing country. In this instance, the partnership consists of two developed countries supporting each other’s domestic recovery operations of comparable size. While this is certainly not an exclusive example of this type of partnership, the way in which we are working together could have relevance for other national societies in developed countries.
Conclusion
Given that both organisations are national societies of the Red Cross movement, we share the same fundamental principles and ultimate goals of our work. The similarity in governance and organisational structure, common language, similar government arrangements and (while in many ways different) comparable national cultures, have been helpful. While these factors have undoubtedly contributed to the success of the partnership, it has taken more than that.
The openness and willingness of both organisations to communicate honestly and to give the other open offer to ideas, feedback and free access to documentation and intellectual property has contributed directly to our successful relationship. The need for transparency, trust and the assumption that both parties have something to offer to the other cannot be understated and is the foundation to the success of this partnership.
There is genuine respect and trust between the two organisations – from the senior leadership to the on the ground level. We celebrate each other’s wins, commiserate and dissect the challenges, use each other to bounce ideas off without fear of looking stupid or un-strategic, ask for help on big and small things, keep in touch regularly both formally and informally, learn each other’s systems and figure out what we can replicate and adapt, offer to review the documents
8
McNaughton, E. G. (2009). A practical guide to advocacy for disaster risk reduction. Geneva:
International Federation of Red Cross and Red Crescent Societies.
84
that no one else will and provide professional and personal support in a line of work that can often be draining or overwhelming if you feel isolated.
In the truest sense of the often misused line, we are in this together. To date we have shared personnel, equipment, uniforms, ideas, feedback, contacts, research, resources, meals and accommodation. If either organisation identifies something that works well, or trials a way to navigate a common problem, it’s mutually beneficial to people impacted by emergencies. In this way we literally become more than the sum of our parts.
For more information, please contact:
Elizabeth McNaughton
Recovery Manager, New Zealand Red Cross
Jolie Wills
Community Recovery Advisor, New Zealand Red Cross
Kate Brady
National Recovery Coordinator, Australian Red Cross
85
Local and Global Responses to Disaster: #eqnz and the Christchurch Earthquake
Associate Professor Axel Bruns
ARC Centre of Excellence for Creative Industries & Innovation
Queensland University of Technology, Brisbane, Australia
Dr Jean Burgess
ARC Centre of Excellence for Creative Industries & Innovation
Queensland University of Technology, Brisbane, Australia
Paper presented at EARTH: FIRE AND RAIN Australian & New Zealand Disaster and Emergency Management Conference Brisbane – 16 – 18, April 2012
86
Local and Global Responses to Disaster:
#eqnz and the Christchurch Earthquake
Axel Bruns and Jean Burgess
ARC Centre of Excellence for Creative Industries & Innovation
http://mappingonlinepublics.net/
Abstract Building on innovative frameworks for analysing and visualising the tweet data available from Twitter, developed by the authors, this paper examines the patterns of tweeting activity that occurred during and after the Feb, 2011 Christchurch earthquake. Local and global responses to the disaster were organised around the pre-existing hashtag #eqnz, which averaged some 100 tweets per minute in the hours following the earthquake. The paper identifies the key contributors to the #eqnz network and shows the key themes of their messages. Emerging from this analysis is a more detailed understanding of Twitter and other social media as key elements in the overall ecology of the media forms used for crisis communication. Such uses point both to the importance of social media as a tool for affected communities to self-organise their disaster response and recovery activities, and as a tool for emergency management services to disseminate key information and receive updates from local communities.
Keywords: Twitter, Christchurch, earthquake, crisis communication, social media
87
Background
The first months of 2011 were marked by a series of devastating natural disasters, from widespread flooding in the Australian state of Queensland during January to the earthquake and tsunami which hit the eastern coastline of Japan in March. The role of social media in disseminating news of these events, supporting the immediate disaster response, and tracking efforts at relief and rebuilding, has already been highlighted by a number of researchers (see e.g. Hughes & Palen, 2009; Mendoza & Poblete, 2010; Palen et al., 2010; Starbird & Palen, 2010); and in Bruns et al. (2012), we examine the use of social media by emergency authorities in the Queensland floods. This paper examines the use of social media, especially Twitter, in another major crisis: the earthquake which destroyed significant parts of the New Zealand city of Christchurch on 22 February 2011.
The February earthquake in Christchurch turned out to be particularly destructive. While it may have been, technically, only a major aftershock (magnitude 6.3) of the magnitude 7.1 earthquake that had occurred on 4 September 2010, which had already substantially weakened building structures in the area, the February earthquake and its aftershocks exacerbated that damage and caused a large number of Christchurch buildings to collapse. Additionally, the February tremor occurred at a relatively shallow depth of only 5 km, magnifying its effect on surface structures. The quake caused nearly 200 fatalities, affected a substantial percentage of the local population, and has been estimated to have generated some NZ$15 billion in reconstruction costs (Rotherham, 2011).
The earthquake occurred at 12:51 local time, and in keeping with patterns observed in other recent disasters and other breaking news stories, social media played a significant role in disseminating early reports and information, including first-hand reports from affected local residents and journalists. In this paper, we specifically examine the use of Twitter in this process; here, we focus first on the central Twitter hashtag ‘#eqnz’ (Earthquake New Zealand – hashtags are brief keywords or abbreviations, prefixed with the hash symbol ‘#’, which users can include in their tweets to make these messages immediately visible to others following the hashtag) which fast emerged as the main mechanism for coordinating messages related to the event.
The rapid emergence of this hashtag, and the relatively limited use of other, alternative hashtags, is due not least to the fact that the February earthquake followed on so closely from the September tremor. In the September quake, there was confusion early on about which of several competing hashtags to choose (with #christchurchquake, #chch, #christchurch, #nzquake all making an appearance; and different hashtags being used by different authorities – see Seitzinger, 2011 for an account of the rapid progress of this “hashtag war”, which saw rapid-fire lobbying of the emergency authorities by Twitter-savvy locals and observers). Once consensus had been achieved and adoption by leading accounts had occurred, however, #eqnz
88
became the dominant, quasi-official hashtag for the September 2010 and all subsequent earthquakes to occur in New Zealand; and further iterations (e.g. #eqnzcontact, #eqnzaccom) were built on this convention.
In 2011, the conventions (especially the hashtag #eqnz) established in that earlier crisis remained accessible to local residents and authorities as part of their available repertoires for crisis communication, and could now be activated again. There was no need for lengthy discussions over which hashtag to use, and a sense of what major Twitter accounts were likely to provide important information about the event – and indeed, that Twitter would be a useful communications tool at all – was also already established.
Methods
Our analysis in this paper builds on a dataset of #eqnz tweets which we began gathering at 13:28 local time (some 37 minutes after the earthquake itself). The tweets were captured using a customised version of the open source tool yourTwapperkeeper, which accesses the Twitter Application Programming Interface (API) to retrieve all publicly available tweets containing specific hashtags and keywords, as well as capturing various ancillary forms of metadata about these tweets.
yourTwapperkeeper and similar tools are especially useful for the study of Twitter discussions which use a consistent hashtag (as is the case with #eqnz), or reliably contain specific keywords. At its most basic, the study of an individual hashtag enables researchers to examine the activities of an ad hoc issue public which has formed around that particular hashtag (cf. Bruns & Burgess, 2011a); individual studies can later be combined to explore the overlaps and interactions which occur between these specific publics if bridging tweets contain multiple hashtags. It should be noted that many other Twitter users may also discuss issues relevant to the hashtag, but (deliberately, or because they are unaware of it) refrain from including the appropriate hashtag; in the following discussion, therefore, we make no claims that what we observe is all the discussion of the Christchurch earthquake that occurred on Twitter; but it is the most visible part of that discussion.
We processed the dataset using the tool Gawk, with a range of custom-made scripts that extract key patterns of activity from the overall data (a detailed discussion of these scripts, and the scripts themselves, are available on our project website at http://mappingonlinepublics.net/; see esp. Bruns & Burgess, 2011b).
Key Patterns of Twitter Use in #eqnz
First, we established the overall volume of tweets using the #eqnz hashtag (fig. 1):
89
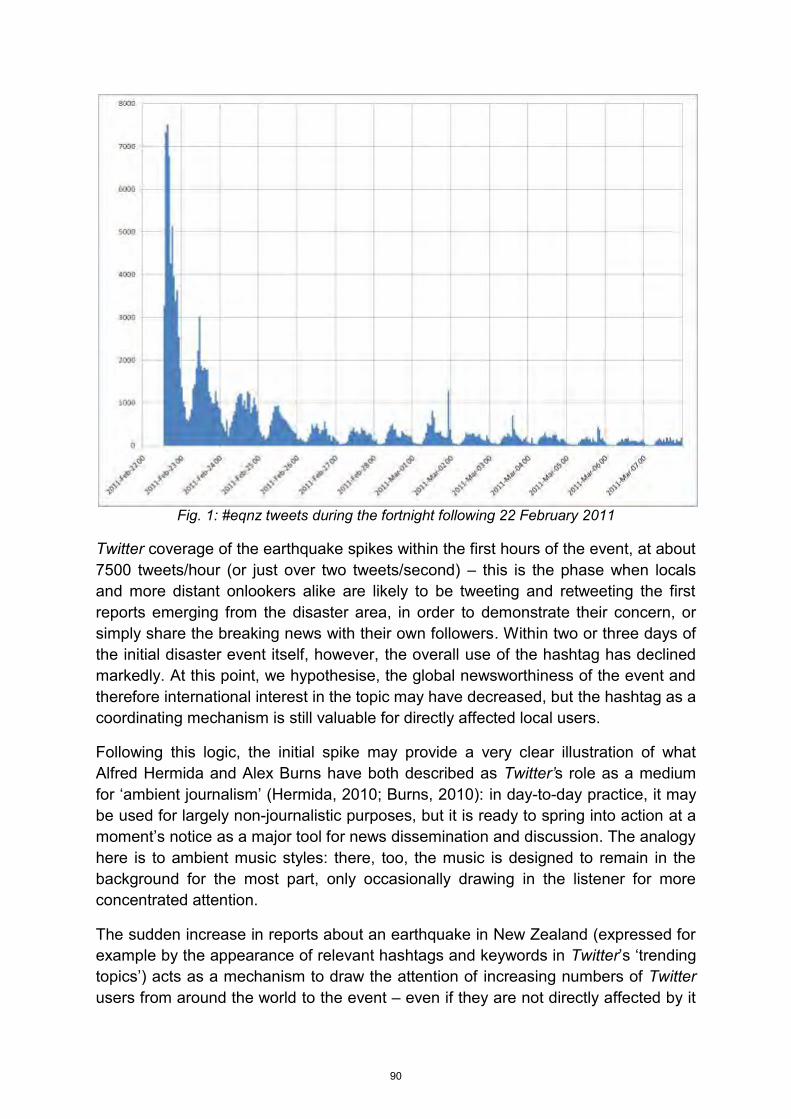
Fig. 1: #eqnz tweets during the fortnight following 22 February 2011
Twitter coverage of the earthquake spikes within the first hours of the event, at about 7500 tweets/hour (or just over two tweets/second) – this is the phase when locals and more distant onlookers alike are likely to be tweeting and retweeting the first reports emerging from the disaster area, in order to demonstrate their concern, or simply share the breaking news with their own followers. Within two or three days of the initial disaster event itself, however, the overall use of the hashtag has declined markedly. At this point, we hypothesise, the global newsworthiness of the event and therefore international interest in the topic may have decreased, but the hashtag as a coordinating mechanism is still valuable for directly affected local users.
Following this logic, the initial spike may provide a very clear illustration of what Alfred Hermida and Alex Burns have both described as Twitter’s role as a medium for ‘ambient journalism’ (Hermida, 2010; Burns, 2010): in day-to-day practice, it may be used for largely non-journalistic purposes, but it is ready to spring into action at a moment’s notice as a major tool for news dissemination and discussion. The analogy here is to ambient music styles: there, too, the music is designed to remain in the background for the most part, only occasionally drawing in the listener for more concentrated attention.
The sudden increase in reports about an earthquake in New Zealand (expressed for example by the appearance of relevant hashtags and keywords in Twitter’s ‘trending topics’) acts as a mechanism to draw the attention of increasing numbers of Twitter users from around the world to the event – even if they are not directly affected by it
90
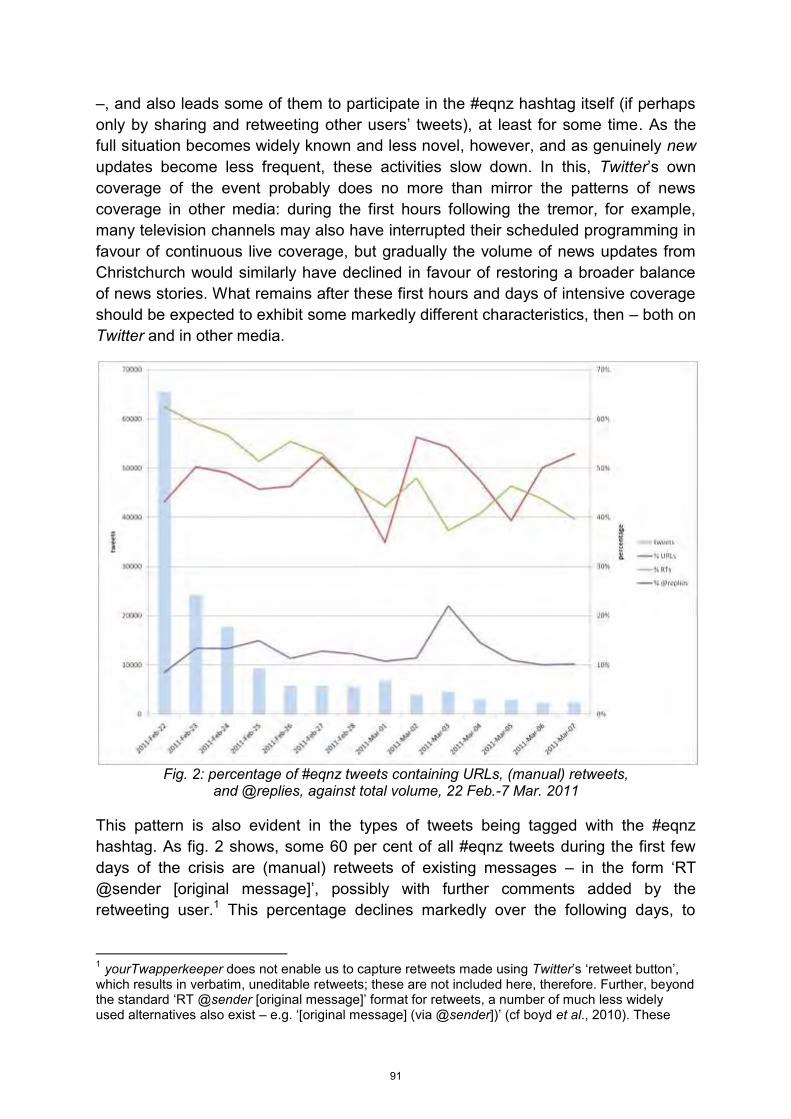
–, and also leads some of them to participate in the #eqnz hashtag itself (if perhaps only by sharing and retweeting other users’ tweets), at least for some time. As the full situation becomes widely known and less novel, however, and as genuinely new updates become less frequent, these activities slow down. In this, Twitter’s own coverage of the event probably does no more than mirror the patterns of news coverage in other media: during the first hours following the tremor, for example, many television channels may also have interrupted their scheduled programming in favour of continuous live coverage, but gradually the volume of news updates from Christchurch would similarly have declined in favour of restoring a broader balance of news stories. What remains after these first hours and days of intensive coverage should be expected to exhibit some markedly different characteristics, then – both on Twitter and in other media.
Fig. 2: percentage of #eqnz tweets containing URLs, (manual) retweets,
and @replies, against total volume, 22 Feb.-7 Mar. 2011 This pattern is also evident in the types of tweets being tagged with the #eqnz hashtag. As fig. 2 shows, some 60 per cent of all #eqnz tweets during the first few days of the crisis are (manual) retweets of existing messages – in the form ‘RT @sender [original message]’, possibly with further comments added by the retweeting user.1 This percentage declines markedly over the following days, to
1 yourTwapperkeeper does not enable us to capture retweets made using Twitter’s ‘retweet button’, which results in verbatim, uneditable retweets; these are not included here, therefore. Further, beyond the standard ‘RT @sender [original message]’ format for retweets, a number of much less widely used alternatives also exist – e.g. ‘[original message] (via @sender])’ (cf boyd et al., 2010). These
91
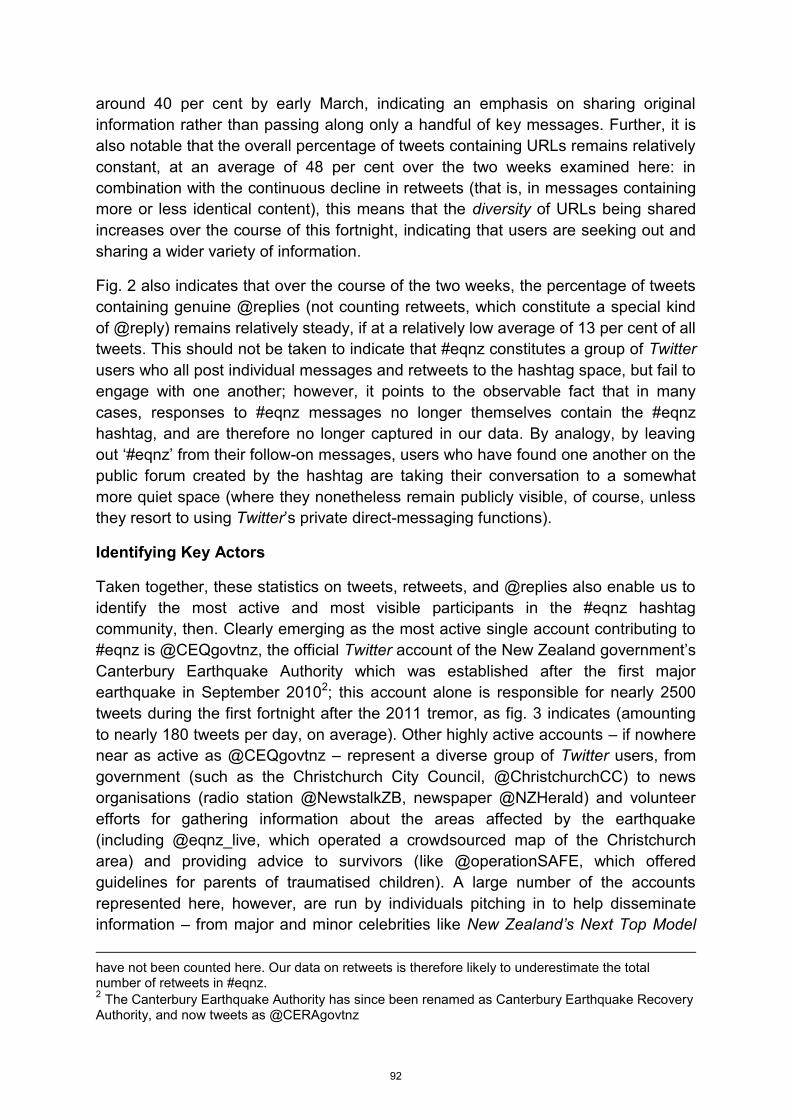
around 40 per cent by early March, indicating an emphasis on sharing original information rather than passing along only a handful of key messages. Further, it is also notable that the overall percentage of tweets containing URLs remains relatively constant, at an average of 48 per cent over the two weeks examined here: in combination with the continuous decline in retweets (that is, in messages containing more or less identical content), this means that the diversity of URLs being shared increases over the course of this fortnight, indicating that users are seeking out and sharing a wider variety of information.
Fig. 2 also indicates that over the course of the two weeks, the percentage of tweets containing genuine @replies (not counting retweets, which constitute a special kind of @reply) remains relatively steady, if at a relatively low average of 13 per cent of all tweets. This should not be taken to indicate that #eqnz constitutes a group of Twitter users who all post individual messages and retweets to the hashtag space, but fail to engage with one another; however, it points to the observable fact that in many cases, responses to #eqnz messages no longer themselves contain the #eqnz hashtag, and are therefore no longer captured in our data. By analogy, by leaving out ‘#eqnz’ from their follow-on messages, users who have found one another on the public forum created by the hashtag are taking their conversation to a somewhat more quiet space (where they nonetheless remain publicly visible, of course, unless they resort to using Twitter’s private direct-messaging functions).
Identifying Key Actors
Taken together, these statistics on tweets, retweets, and @replies also enable us to identify the most active and most visible participants in the #eqnz hashtag community, then. Clearly emerging as the most active single account contributing to #eqnz is @CEQgovtnz, the official Twitter account of the New Zealand government’s Canterbury Earthquake Authority which was established after the first major earthquake in September 20102; this account alone is responsible for nearly 2500 tweets during the first fortnight after the 2011 tremor, as fig. 3 indicates (amounting to nearly 180 tweets per day, on average). Other highly active accounts – if nowhere near as active as @CEQgovtnz – represent a diverse group of Twitter users, from government (such as the Christchurch City Council, @ChristchurchCC) to news organisations (radio station @NewstalkZB, newspaper @NZHerald) and volunteer efforts for gathering information about the areas affected by the earthquake (including @eqnz_live, which operated a crowdsourced map of the Christchurch area) and providing advice to survivors (like @operationSAFE, which offered guidelines for parents of traumatised children). A large number of the accounts represented here, however, are run by individuals pitching in to help disseminate information – from major and minor celebrities like New Zealand’s Next Top Model have not been counted here. Our data on retweets is therefore likely to underestimate the total number of retweets in #eqnz. 2 The Canterbury Earthquake Authority has since been renamed as Canterbury Earthquake Recovery Authority, and now tweets as @CERAgovtnz
92
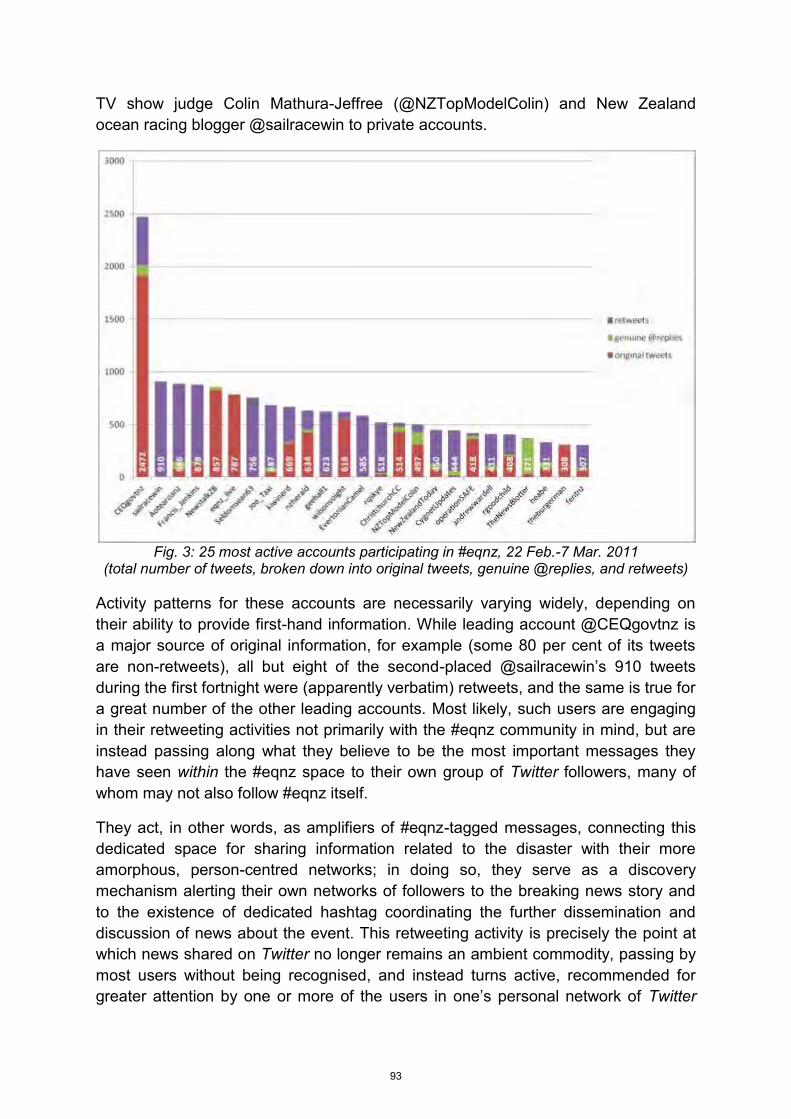
TV show judge Colin Mathura-Jeffree (@NZTopModelColin) and New Zealand ocean racing blogger @sailracewin to private accounts.
Fig. 3: 25 most active accounts participating in #eqnz, 22 Feb.-7 Mar. 2011
(total number of tweets, broken down into original tweets, genuine @replies, and retweets) Activity patterns for these accounts are necessarily varying widely, depending on their ability to provide first-hand information. While leading account @CEQgovtnz is a major source of original information, for example (some 80 per cent of its tweets are non-retweets), all but eight of the second-placed @sailracewin’s 910 tweets during the first fortnight were (apparently verbatim) retweets, and the same is true for a great number of the other leading accounts. Most likely, such users are engaging in their retweeting activities not primarily with the #eqnz community in mind, but are instead passing along what they believe to be the most important messages they have seen within the #eqnz space to their own group of Twitter followers, many of whom may not also follow #eqnz itself.
They act, in other words, as amplifiers of #eqnz-tagged messages, connecting this dedicated space for sharing information related to the disaster with their more amorphous, person-centred networks; in doing so, they serve as a discovery mechanism alerting their own networks of followers to the breaking news story and to the existence of dedicated hashtag coordinating the further dissemination and discussion of news about the event. This retweeting activity is precisely the point at which news shared on Twitter no longer remains an ambient commodity, passing by most users without being recognised, and instead turns active, recommended for greater attention by one or more of the users in one’s personal network of Twitter
93
connections. While the retweeting activities by @sailracewin and other similar users add little new information, they substantially boost the visibility of existing news items, and the potential for the events covered in those news items to become major points of attention.
What follows is that the question of whose tweets are shared (as well as responded to) is important for understanding the information flows of major events on Twitter. This can be measured by examining the originating users mentioned in retweets and @replies in #eqnz (fig. 4). Here, news accounts (@NZHerald, Fairfax subsidiary @NZStuff, @TVNZNews, as well as the Australian @abcnews) and government accounts (@CEQgovtnz, @ChristchurchCC, as well as @NZcivildefence and @NZRedCross) clearly dominate the field; @NZHerald’s 634 tweets during this fortnight received over 9100 retweets and @replies, for example (an average of 14 per message).
Fig. 4: retweets of and @replies to the 25 most visible accounts
participating in #eqnz, 22 Feb.-7 Mar. 2011 Mobile telecommunications operators @TelecomNZ and @vodafonenz are also featured prominently here; both posted widely retweeted advisories on how to minimise the strain on their compromised networks shortly after the initial earthquake. Both accounts also received a comparatively high number of @replies (as distinct from simple retweets), containing both praise and criticism for their efforts at restoring normal services.
94
Such patterns are broadly comparable with what we have observed in the context of the January 2011 Queensland floods (Bruns et al., 2012), with the exception of the predominance of the @NZHerald account. In Queensland, the Twitter account of the Queensland Police Service (@QPSmedia), rather than a media organisation, led the field. The prominence of the New Zealand Herald account in this case may point to a greater level of interest and concern by Twitter users further afield – for example, by the large New Zealander diaspora in Australia –, who may be expected to search for (and retweet) media reports more than advisories from local authorities; additionally, the online coverage by the New Zealand Herald (and its own use of Twitter to disseminate this information) also lent itself well to generating such further amplification. Of the Herald’s ten most retweeted messages containing links, four pointed to pages containing blog-style news update feeds for 23-26 February, two presented image galleries, and one linked to a special earthquake section on the paper’s Website. The most-retweeted @NZHerald messages with links, however, pointed to external resources: Google’s ‘people finder’ Web application, a YouTube eyewitness video of the quake’s immediate aftermath, and the New Zealand Prime Minister’s appeal for donations. Retweets of the messages mentioning Google’s Web application, in fact, accounted for nearly 2,400 of all tweets mentioning @NZHerald.
Various personal accounts are prominent for more idiosyncratic reasons:
RT @georgedarroch: Incredible image of Christchurch, from the hills, moments after the quake. http://i.imgur.com/0vZbD.jpg #eqnz
was frequently retweeted, as were:
RT @anthonybaxter: Google has people finder up for #eqnz #christchurch http://bit.ly/i0aAle please RT widely
and comedian Stephen Fry’s message of support:
RT @stephenfry: Oh dear, poor Christchurch. Another horrific earthquake. http://t.co/S5nL3lq #chch #eqnz http://t.co/plUcmcP
Additionally, while in fig. 4 @operationSAFE appears to have received an unusually large number of @replies, in comparison to retweets of its messages, this is largely because one of its messages was widely shared without using the customary retweet format:
#eqnz The world is with you! Help your family cope with quake stress with these tips. http://bit.ly/bGneSz #opsafe #DT @operationSAFE
From News to Recovery: #eqnz’s Changing Nature
The overall patterns outlined so far only describe the uses of the #eqnz hashtag in an aggregate form. Fig. 1 shows substantial spikes in Twitter use during the first few
95
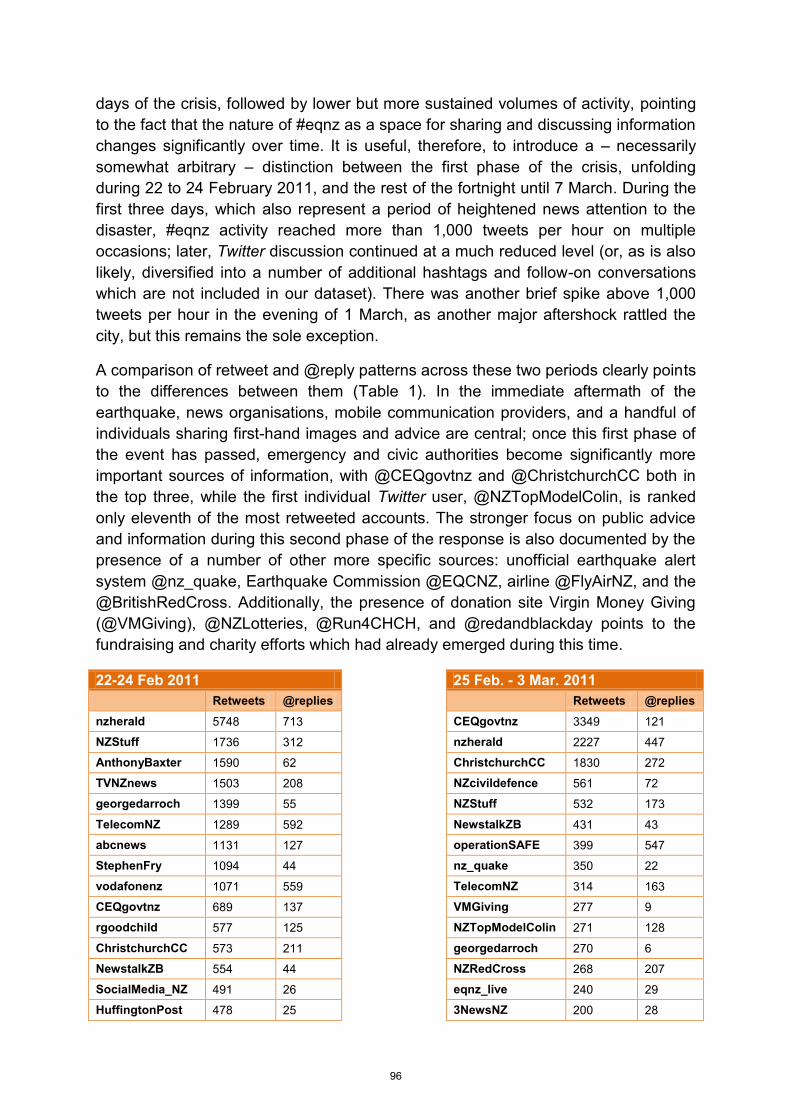
days of the crisis, followed by lower but more sustained volumes of activity, pointing to the fact that the nature of #eqnz as a space for sharing and discussing information changes significantly over time. It is useful, therefore, to introduce a – necessarily somewhat arbitrary – distinction between the first phase of the crisis, unfolding during 22 to 24 February 2011, and the rest of the fortnight until 7 March. During the first three days, which also represent a period of heightened news attention to the disaster, #eqnz activity reached more than 1,000 tweets per hour on multiple occasions; later, Twitter discussion continued at a much reduced level (or, as is also likely, diversified into a number of additional hashtags and follow-on conversations which are not included in our dataset). There was another brief spike above 1,000 tweets per hour in the evening of 1 March, as another major aftershock rattled the city, but this remains the sole exception.
A comparison of retweet and @reply patterns across these two periods clearly points to the differences between them (Table 1). In the immediate aftermath of the earthquake, news organisations, mobile communication providers, and a handful of individuals sharing first-hand images and advice are central; once this first phase of the event has passed, emergency and civic authorities become significantly more important sources of information, with @CEQgovtnz and @ChristchurchCC both in the top three, while the first individual Twitter user, @NZTopModelColin, is ranked only eleventh of the most retweeted accounts. The stronger focus on public advice and information during this second phase of the response is also documented by the presence of a number of other more specific sources: unofficial earthquake alert system @nz_quake, Earthquake Commission @EQCNZ, airline @FlyAirNZ, and the @BritishRedCross. Additionally, the presence of donation site Virgin Money Giving (@VMGiving), @NZLotteries, @Run4CHCH, and @redandblackday points to the fundraising and charity efforts which had already emerged during this time.
22-24 Feb 2011 25 Feb. - 3 Mar. 2011
Retweets @replies Retweets @replies
nzherald 5748 713 CEQgovtnz 3349 121
NZStuff 1736 312 nzherald 2227 447
AnthonyBaxter 1590 62 ChristchurchCC 1830 272
TVNZnews 1503 208 NZcivildefence 561 72
georgedarroch 1399 55 NZStuff 532 173
TelecomNZ 1289 592 NewstalkZB 431 43
abcnews 1131 127 operationSAFE 399 547
StephenFry 1094 44 nz_quake 350 22
vodafonenz 1071 559 TelecomNZ 314 163
CEQgovtnz 689 137 VMGiving 277 9
rgoodchild 577 125 NZTopModelColin 271 128
ChristchurchCC 573 211 georgedarroch 270 6
NewstalkZB 554 44 NZRedCross 268 207
SocialMedia_NZ 491 26 eqnz_live 240 29
HuffingtonPost 478 25 3NewsNZ 200 28
96
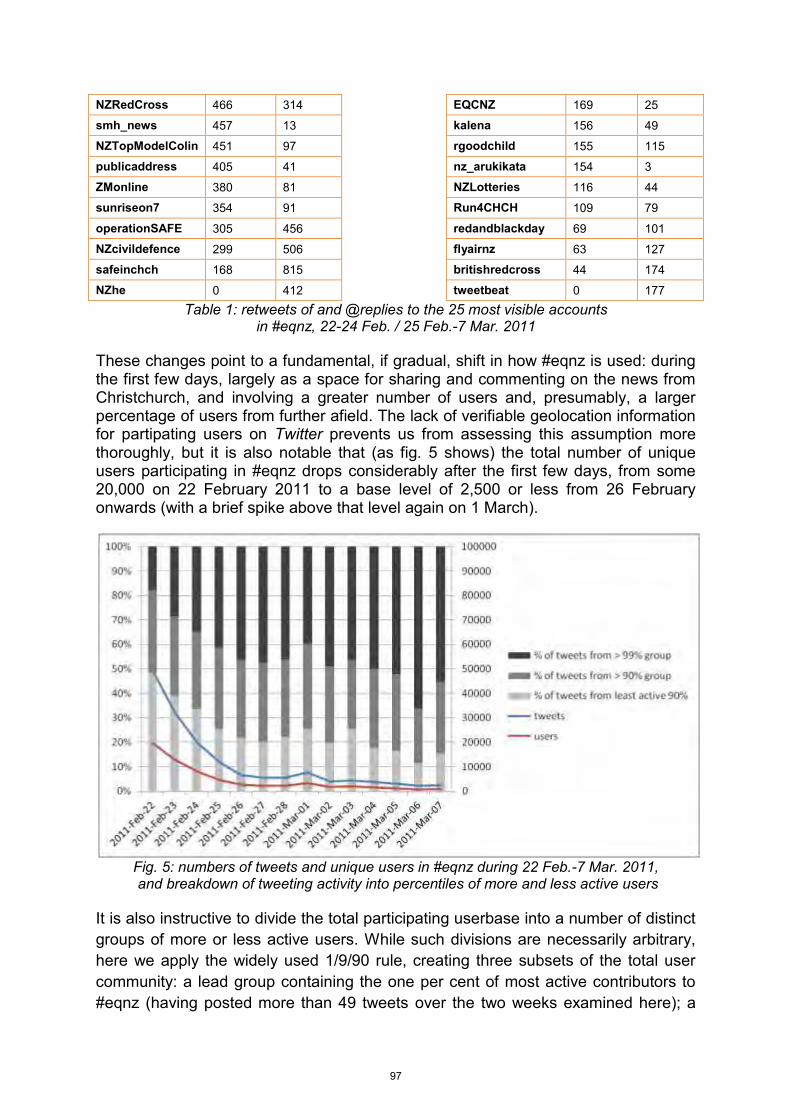
NZRedCross 466 314 EQCNZ 169 25
smh_news 457 13 kalena 156 49
NZTopModelColin 451 97 rgoodchild 155 115
publicaddress 405 41 nz_arukikata 154 3
ZMonline 380 81 NZLotteries 116 44
sunriseon7 354 91 Run4CHCH 109 79
operationSAFE 305 456 redandblackday 69 101
NZcivildefence 299 506 flyairnz 63 127
safeinchch 168 815 britishredcross 44 174
NZhe 0 412 tweetbeat 0 177
Table 1: retweets of and @replies to the 25 most visible accounts in #eqnz, 22-24 Feb. / 25 Feb.-7 Mar. 2011
These changes point to a fundamental, if gradual, shift in how #eqnz is used: during the first few days, largely as a space for sharing and commenting on the news from Christchurch, and involving a greater number of users and, presumably, a larger percentage of users from further afield. The lack of verifiable geolocation information for partipating users on Twitter prevents us from assessing this assumption more thoroughly, but it is also notable that (as fig. 5 shows) the total number of unique users participating in #eqnz drops considerably after the first few days, from some 20,000 on 22 February 2011 to a base level of 2,500 or less from 26 February onwards (with a brief spike above that level again on 1 March).
Fig. 5: numbers of tweets and unique users in #eqnz during 22 Feb.-7 Mar. 2011, and breakdown of tweeting activity into percentiles of more and less active users
It is also instructive to divide the total participating userbase into a number of distinct groups of more or less active users. While such divisions are necessarily arbitrary, here we apply the widely used 1/9/90 rule, creating three subsets of the total user community: a lead group containing the one per cent of most active contributors to #eqnz (having posted more than 49 tweets over the two weeks examined here); a
97
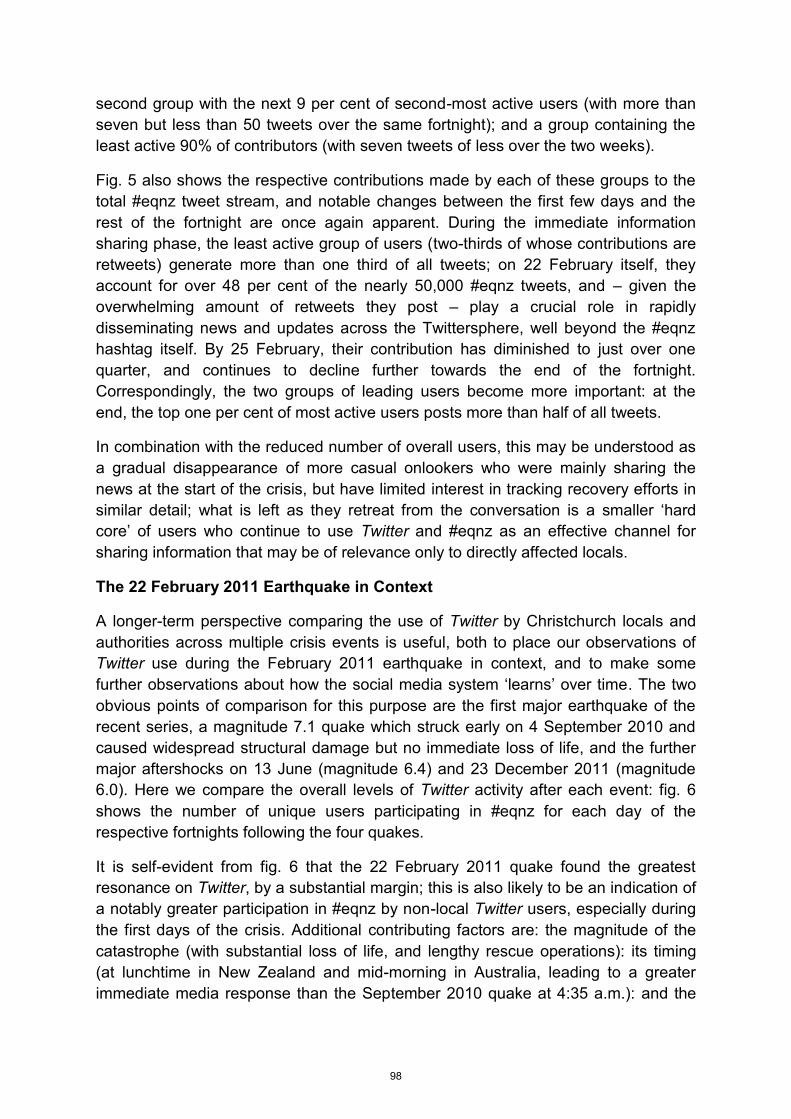
second group with the next 9 per cent of second-most active users (with more than seven but less than 50 tweets over the same fortnight); and a group containing the least active 90% of contributors (with seven tweets of less over the two weeks).
Fig. 5 also shows the respective contributions made by each of these groups to the total #eqnz tweet stream, and notable changes between the first few days and the rest of the fortnight are once again apparent. During the immediate information sharing phase, the least active group of users (two-thirds of whose contributions are retweets) generate more than one third of all tweets; on 22 February itself, they account for over 48 per cent of the nearly 50,000 #eqnz tweets, and – given the overwhelming amount of retweets they post – play a crucial role in rapidly disseminating news and updates across the Twittersphere, well beyond the #eqnz hashtag itself. By 25 February, their contribution has diminished to just over one quarter, and continues to decline further towards the end of the fortnight. Correspondingly, the two groups of leading users become more important: at the end, the top one per cent of most active users posts more than half of all tweets.
In combination with the reduced number of overall users, this may be understood as a gradual disappearance of more casual onlookers who were mainly sharing the news at the start of the crisis, but have limited interest in tracking recovery efforts in similar detail; what is left as they retreat from the conversation is a smaller ‘hard core’ of users who continue to use Twitter and #eqnz as an effective channel for sharing information that may be of relevance only to directly affected locals.
The 22 February 2011 Earthquake in Context
A longer-term perspective comparing the use of Twitter by Christchurch locals and authorities across multiple crisis events is useful, both to place our observations of Twitter use during the February 2011 earthquake in context, and to make some further observations about how the social media system ‘learns’ over time. The two obvious points of comparison for this purpose are the first major earthquake of the recent series, a magnitude 7.1 quake which struck early on 4 September 2010 and caused widespread structural damage but no immediate loss of life, and the further major aftershocks on 13 June (magnitude 6.4) and 23 December 2011 (magnitude 6.0). Here we compare the overall levels of Twitter activity after each event: fig. 6 shows the number of unique users participating in #eqnz for each day of the respective fortnights following the four quakes.
It is self-evident from fig. 6 that the 22 February 2011 quake found the greatest resonance on Twitter, by a substantial margin; this is also likely to be an indication of a notably greater participation in #eqnz by non-local Twitter users, especially during the first days of the crisis. Additional contributing factors are: the magnitude of the catastrophe (with substantial loss of life, and lengthy rescue operations): its timing (at lunchtime in New Zealand and mid-morning in Australia, leading to a greater immediate media response than the September 2010 quake at 4:35 a.m.): and the
98
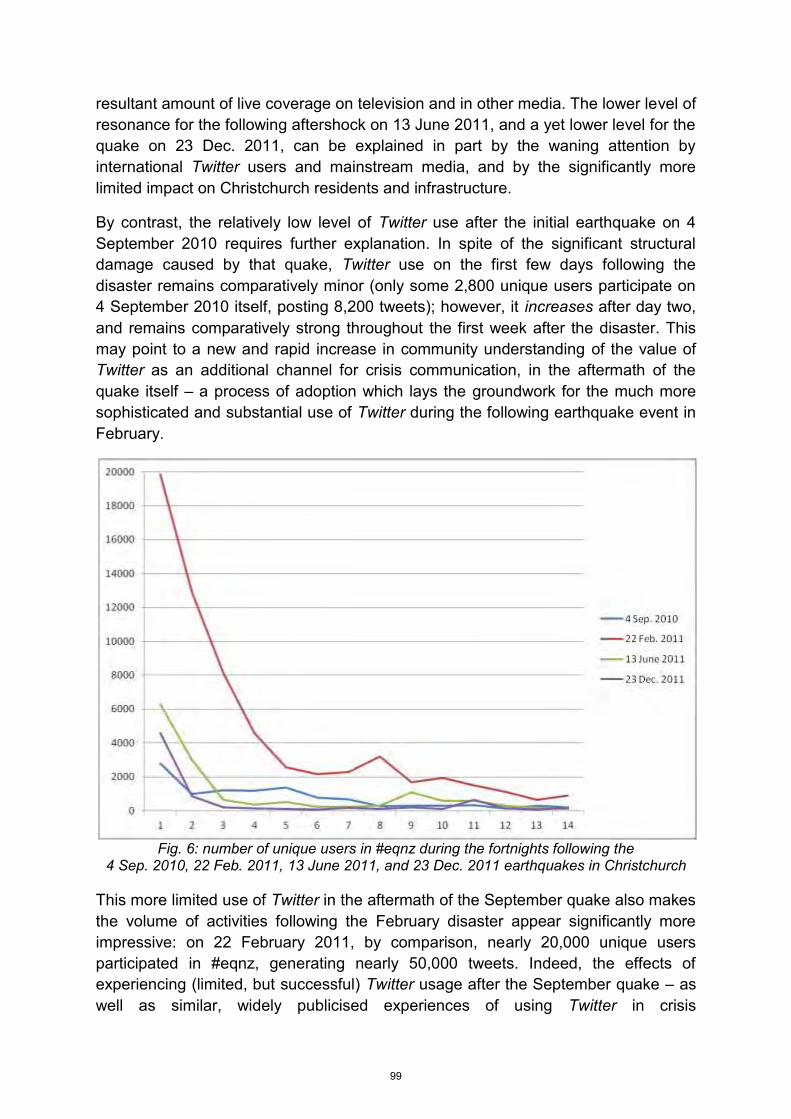
resultant amount of live coverage on television and in other media. The lower level of resonance for the following aftershock on 13 June 2011, and a yet lower level for the quake on 23 Dec. 2011, can be explained in part by the waning attention by international Twitter users and mainstream media, and by the significantly more limited impact on Christchurch residents and infrastructure.
By contrast, the relatively low level of Twitter use after the initial earthquake on 4 September 2010 requires further explanation. In spite of the significant structural damage caused by that quake, Twitter use on the first few days following the disaster remains comparatively minor (only some 2,800 unique users participate on 4 September 2010 itself, posting 8,200 tweets); however, it increases after day two, and remains comparatively strong throughout the first week after the disaster. This may point to a new and rapid increase in community understanding of the value of Twitter as an additional channel for crisis communication, in the aftermath of the quake itself – a process of adoption which lays the groundwork for the much more sophisticated and substantial use of Twitter during the following earthquake event in February.
Fig. 6: number of unique users in #eqnz during the fortnights following the
4 Sep. 2010, 22 Feb. 2011, 13 June 2011, and 23 Dec. 2011 earthquakes in Christchurch This more limited use of Twitter in the aftermath of the September quake also makes the volume of activities following the February disaster appear significantly more impressive: on 22 February 2011, by comparison, nearly 20,000 unique users participated in #eqnz, generating nearly 50,000 tweets. Indeed, the effects of experiencing (limited, but successful) Twitter usage after the September quake – as well as similar, widely publicised experiences of using Twitter in crisis
99
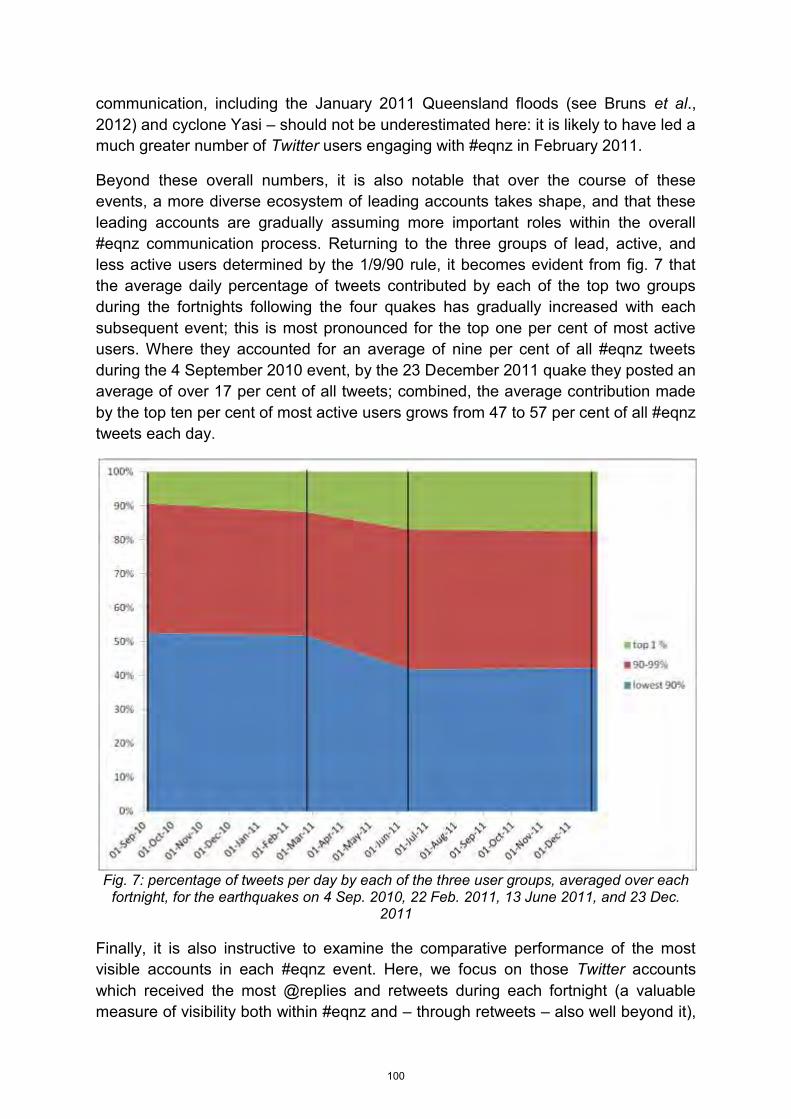
communication, including the January 2011 Queensland floods (see Bruns et al., 2012) and cyclone Yasi – should not be underestimated here: it is likely to have led a much greater number of Twitter users engaging with #eqnz in February 2011.
Beyond these overall numbers, it is also notable that over the course of these events, a more diverse ecosystem of leading accounts takes shape, and that these leading accounts are gradually assuming more important roles within the overall #eqnz communication process. Returning to the three groups of lead, active, and less active users determined by the 1/9/90 rule, it becomes evident from fig. 7 that the average daily percentage of tweets contributed by each of the top two groups during the fortnights following the four quakes has gradually increased with each subsequent event; this is most pronounced for the top one per cent of most active users. Where they accounted for an average of nine per cent of all #eqnz tweets during the 4 September 2010 event, by the 23 December 2011 quake they posted an average of over 17 per cent of all tweets; combined, the average contribution made by the top ten per cent of most active users grows from 47 to 57 per cent of all #eqnz tweets each day.
Fig. 7: percentage of tweets per day by each of the three user groups, averaged over each
fortnight, for the earthquakes on 4 Sep. 2010, 22 Feb. 2011, 13 June 2011, and 23 Dec. 2011
Finally, it is also instructive to examine the comparative performance of the most visible accounts in each #eqnz event. Here, we focus on those Twitter accounts which received the most @replies and retweets during each fortnight (a valuable measure of visibility both within #eqnz and – through retweets – also well beyond it),
100
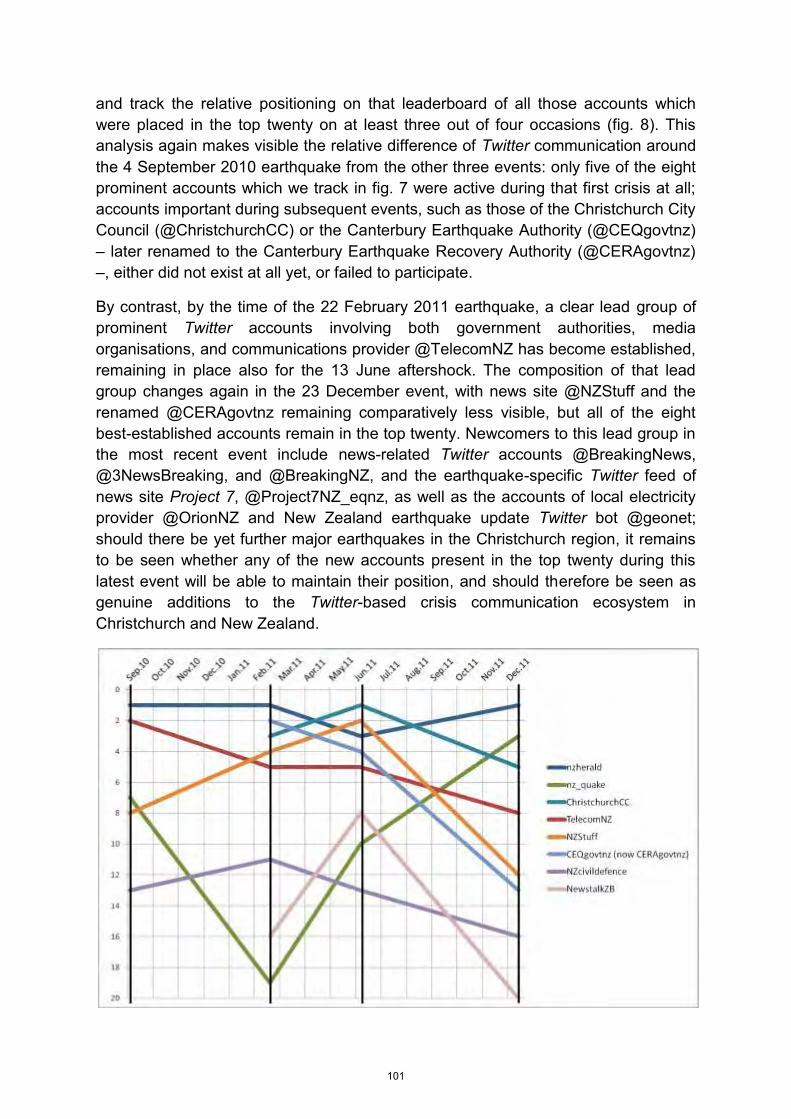
and track the relative positioning on that leaderboard of all those accounts which were placed in the top twenty on at least three out of four occasions (fig. 8). This analysis again makes visible the relative difference of Twitter communication around the 4 September 2010 earthquake from the other three events: only five of the eight prominent accounts which we track in fig. 7 were active during that first crisis at all; accounts important during subsequent events, such as those of the Christchurch City Council (@ChristchurchCC) or the Canterbury Earthquake Authority (@CEQgovtnz) – later renamed to the Canterbury Earthquake Recovery Authority (@CERAgovtnz) –, either did not exist at all yet, or failed to participate.
By contrast, by the time of the 22 February 2011 earthquake, a clear lead group of prominent Twitter accounts involving both government authorities, media organisations, and communications provider @TelecomNZ has become established, remaining in place also for the 13 June aftershock. The composition of that lead group changes again in the 23 December event, with news site @NZStuff and the renamed @CERAgovtnz remaining comparatively less visible, but all of the eight best-established accounts remain in the top twenty. Newcomers to this lead group in the most recent event include news-related Twitter accounts @BreakingNews, @3NewsBreaking, and @BreakingNZ, and the earthquake-specific Twitter feed of news site Project 7, @Project7NZ_eqnz, as well as the accounts of local electricity provider @OrionNZ and New Zealand earthquake update Twitter bot @geonet; should there be yet further major earthquakes in the Christchurch region, it remains to be seen whether any of the new accounts present in the top twenty during this latest event will be able to maintain their position, and should therefore be seen as genuine additions to the Twitter-based crisis communication ecosystem in Christchurch and New Zealand.
101
Fig. 8: ranking of leading Twitter users by visibility in #eqnz (counting @replies and retweets received), for the earthquakes on 4 Sep. 2010, 22 Feb. 2011, 13 June 2011, and 23 Dec.
Overall, what has emerged since the September 2010 disaster is a persistent group of Twitter accounts which will continue the process of sharing and discussing information in #eqnz even after more casual users cease to contribute to a significant extent: these leading accounts have become part of the overall emergency communication infrastructure, and their contributions are made widely visible, beyond #eqnz itself, especially through retweets of their messages by other users. It is likely that many users – including both directly affected local residents as well as others elsewhere in New Zealand or overseas with a continuing interest in news from Christchurch – are now directly following a selection of these accounts, or continue to track the #eqnz feed. Beyond this, the greater awareness of these tools for crisis communication also means that even users who may have temporarily unfollowed #eqnz or its key contributors are able to quickly re-follow them in the event of a further disaster.
102
References
boyd, danah, Scott Golder, and Gilad Lotan. (2010) “Tweet, Tweet, Retweet: Conversational Aspects of Retweeting on Twitter.” Paper presented at HICSS-43, Kauai, Hawai’i, 6 Jan. 2010. Available at: http://www.danah.org/papers/TweetTweetRetweet.pdf (accessed 8 Jan. 2012).
Bruns, Axel, Jean Burgess, Kate Crawford, and Frances Shaw. (2012) “#qldfloods and @QPSMedia: Crisis Communication on Twitter.” Brisbane: ARC Centre of Excellence for Creative Industries and Innovation, 2012.
———, and Jean Burgess, (2011a) “The Use of Twitter Hashtags in the Formation of Ad Hoc Publics.” Paper presented at the European Consortium for Political Research conference, Reykjavik, 25-27 Aug. 2011.
———, and Jean Burgess. (2011b) “Gawk Scripts for Twitter Processing.” v1.0. Mapping Online Publics, 22 June 2011. Available at: http://mappingonlinepublics.net/resources/ (accessed 8 Jan. 2012).
Burns, Alex. (2010, May) “Oblique Strategies for Ambient Journalism.” M/C Journal, 13(2). Available at: http://journal.media-culture.org.au/index.php/mcjournal/article/view/230 (accessed 8 Jan. 2012).
Hermida, Alfred. (2010, May) “From TV to Twitter: How Ambient News Became Ambient Journalism.” M/C Journal, 13(2). Available at: http://journal.media-culture.org.au/index.php/mcjournal/article/view/220 (accessed 8 Jan. 2012).
Hughes, A.L., and L. Palen. (2009) “Twitter Adoption and Use in Mass Convergence and Emergency Events.” International Journal of Emergency Management, 6(3-4), pp. 248-260.
Mendoza, M., B. Poblete, and C. Castillo. (2010) “Twitter under Crisis: Can We Trust What We RT?” Paper presented at the 1st Workshop on Social Media Analytics (SOMA ’10). Washington, DC: ACM.
Palen, L., et al. (2010) “Twitter-Based Information Distribution during the 2009 Red River Valley Flood Threat.” Bulletin of the American Society for Information Science and Technology, 36(5), pp. 13-17.
Rotherham, Fiona. (2011) “Quake Rebuild Will Eat into GDP.” NZ Stuff, 10 May 2011. Available at: http://www.stuff.co.nz/business/rebuilding-christchurch/4984173/Quake-rebuild-will-eat-into-GDP (accessed 8 Jan. 2012).
Seitzinger, Joyce. (2010) “Social media use in a crisis – #eqnz – which hashtag prevails?” Cats Pyjamas, 4 Sep. Available at: http://www.cats-pyjamas.net/2010/09/social-media-use-in-a-crisis-eqnz-which-hashtag-prevails/ (accessed 28 Jan. 2012).
Starbird, K., and L. Palen, 2010. “Pass It On?: Retweeting in Mass Emergency.” Proceedings of the 7th International ISCRAM Conference. Seattle: ISCRAM.
103
Charles Sturt University Masters of Emergency Management
The role of insurance in building resilient communities: Lessons from recent catastrophic weather events in Australia
Paula Claudianos
Charles Sturt University, Australia
104
The role of insurance in building resilient communities: Lessons from recent catastrophic weather events in Australia
Abstract
Following the 2010/11 flood and cyclone events, many Australian householders found themselves uninsured or underinsured. The various definitions of “flood” between insurers meant that some claimants were successful in obtaining insurance payments, while their neighbours were not. Combined with publicised cases of poor claims handling and a lack of communication with policy holders, the implications amounted to a broad market failure. This paper highlights the conflict that has developed between the aims of the National Disaster Resilience Strategy and recent recommendations by the National Disasters Insurance Review (NDIR) for Federal Government intervention in the insurance market. This paper explains the appropriate roles of the public and private sector and role of charitable funds, and accordingly cautions against the NDIR recommendations to force insurers to offer flood cover, to establish Government funded premium and reinsurance discounts and to provide a reinsurance scheme also guaranteed by the Federal Government. International experience in flood insurance from developed countries similar to Australia is highlighted in order to communicate lessons for Australian policy makers. Those lessons are the importance of enhancing resilience through mitigation action and avoiding the moral hazard that arises through risk transfer to the Government. Where the national policy objective is the promotion of resilience, it is not appropriate to distort the risk mitigating effects of actuarially sound premiums. Accepting those recommendations made by the NDIR will impede the building of communities resilient to the risk of flood and increase public exposure to flood losses.
105
Charles Sturt University Masters of Emergency Management
Introduction
Whilst insurance plays an important role in enabling rapid physical recovery following a disaster event, it should be viewed as a risk management tool of last resort behind mitigation efforts. Wherever possible, policy makers should endeavour to reduce the exposure of Australians to flood risk, before transferring it on to a third party as risk transfer does not deal with the problem itself, nor does it prevent losses from occurring, or increasing, in the future. Prioritising mitigation makes sense because it looks at preventing similar events from causing damages in the future and allows communities to learn from the past. Despite the logic in the desire to try to avoid losses before insuring against them, a greater role for the public sector in providing catastrophe financing is often widely debated following disaster events (ABC, 2012)
This paper reviews this debate following the flooding that occurred throughout Australia from November 2010 to February 2011 (‘2010/11 events’). While the Natural Disasters Insurance Review (NDIR) recommended that insurers offer flood cover, the Federal Government fund premium and reinsurance discounts, and establish and guarantee reinsurance scheme, this paper considers that combined with current amendments to the regulation of the Insurance industry and improvements to flood mapping, a focus on mitigation efforts, strengthened land use planning and concerted public private partnership to raise awareness of flood risk, would be more appropriate measures in responding to flood risk. The reason for this is that it will not encourage resilience, but will reduce incentives on voluntary mitigation action. An examination of the many reviews and inquiries1 that followed the 2010/11 events will highlight the existence of gaps and inconsistencies in claims handling regulations, the problems with the definition of flood, and both the availability of quality of flood mapping. This paper further argues there is no evidence of a broad market failure to provide insurance that would justify government intervention in the market. Beyond identifying the lack of justification for mandatory cover, a perusal of relevant international experience provides a stark warning to policy makers seeking a greater role for Government in the flood insurance market. Where the national policy objective is the promotion of resilience, it is not appropriate to distort the risk mitigating effects of actuarially sound premiums. Accepting those recommendations made by the NDIR will impede the building of communities resilient to the risk of flood.
Summer of Disasters
The amount of natural disasters to hit Australia and the wider Pacific region over the period November 2010 to February 2011 was unprecedented. The numerous events 1 Treasury Consultation Paper, Reforming Flood Insurance: Clearing the Waters
http://www.treasury.gov.au/contentitem.asp?ContentID=2039&NavID=; Queensland Floods Commission of Inquiry http://www.floodcommission.qld.gov.au ; Natural Disasters Insurance Review www.ndir.gov.au ; House of Representatives Standing Committee on Social Policy and Legal Affairs Inquiry into the operation of the Insurance Industry during disaster events http://www.aph.gov.au/house/committee/spla/insurance/index.htm
106
Charles Sturt University Masters of Emergency Management
overwhelmed not only communities and governments at all levels, but significantly stretched the capacity of some insurers to respond efficiently and effectively. A particularly strong La Niña event led to widespread flooding across much of Eastern Australia. In Queensland all 73 Local Government Areas (LGAs) were disaster declared. A large number of Victorian and New South Wales LGAs also experienced long lasting flood events which isolated many communities. Whilst many towns remained submerged, Queensland was impacted by Tropical Cyclone Yasi. Before the end of this ‘summer of disasters’ Western Australia had experienced flood events in Carnarvon and bushfires in the peri-urban areas of Armidale and Kelmscott. A significant 58 463 residential and commercial claims were made across eight of the largest insurers2 in the period up to 24 November 2011 as a result of the flood events alone (QFCoI Final Report, 289).
National Strategy for Disaster Resilience (NSDR)
It is widely acknowledged that continuous development in the urban periphery and on the Australian coastline is placing many homes in locations of increasing exposure to natural disasters (Smith, 2011; Kunreuther 2009; GPDRR, 2011). This was most recently demonstrated in the Victorian bushfire events of 9 February 2009 where many homes had been developed/built in areas of ‘unacceptably high’ bushfire risk (VBRC, 2010). It is estimated that by 2050, 70 per cent of the world’s population will live in coastal zones placing more and more homes at risk of extreme weather events (GPDRR, 2011). Worldwide, the cost of disasters has been increasing dramatically in recent decades stretching both private and public sectors in their capacities to respond (Kunreuther, 2009). On 13 February 2011, the Council of Australian Governments (COAG) released the ‘National Strategy for Disaster Resilience’ (NSDR).3 Developed by the Ministerial Council for Police and Emergency Management (MCPEM), the NSDR is based on the growing understanding that the cost of financing disaster recovery is increasing at a rate beyond which governments can guarantee fast and effective recovery efforts (Arnold, 2008). The NSDR is to be followed in 2012 with an Implementation Plan for moving Australia towards becoming a more resilient nation when faced with natural disasters.
In the context of emergency management, resilience describes the strength and ability of an entity, whether it be an organisation, community or individual, to bounce back from a challenging event or adverse situation. Rogers describes it as “a framework which includes every action undertaken to ensure a swift return to equilibrium that is more stable than that existing prior to perturbation” (Rogers, 2011, p. 54). Resilience involves ‘adaptability,’ the capacity to maintain stability in the face of a natural or anthropogenic disaster (Folke .et al 2005). A prepared community will be able to bounce back from a disaster event more quickly which in turn facilitates
2 Allianz, CGU, RACQ, Suncorp, Comminsure, QBE, AAMI, NRMA.
3 http://www.coag.gov.au/coag_meeting_outcomes/2011-02-
13/docs/national_strategy_disaster_resilience.pdf
107
Charles Sturt University Masters of Emergency Management
faster psychosocial recovery. When considering resilience, actions taken to reduce the consequences of a natural disaster, known as mitigation, allow speedy recovery.
The National Strategy for Disaster Resilience (NSDR) defines a disaster resilient community as “one that works together to understand and manage the risks that it confronts” (NSDR, 2011ar 3). It notes that to achieve disaster resilience “communities, individuals and households need to take greater responsibility for their own safety and act on information, advice and other cues provided before, during and after a disaster” (NSDR, 2011 at 3). A resilient community is one where individuals, businesses and local government levels are risk aware, prepared both psychologically and physically for the impact of a hazard event, and have effective mitigation strategies in place or undertaken mitigation initiatives wherever possible.
‘Shared responsibility’ is integral in the move towards resilience. It is discussed in the NSDR and is based on the understanding that communities must take a more active role in mitigating the disaster risks they face. Whilst further exploration of shared responsibility is warranted, the principle seeks to move governments at all levels towards encouraging pre-disaster mitigation at the individual and community level. In doing so it aims to reduce the vulnerabilities and post-disaster fiscal burdens otherwise and increasingly absorbed by governments.
Public/private partnership
The public and private sector both play important, mutually beneficial roles in flood risk management. The next section outlines the relative roles played by the Government and private insurers in flood risk management across the areas of land use planning, flood mapping, risk communication and risk financing.
The public sector plays a particularly important role in regulating land use planning. The Queensland Flood Commission of Inquiry (‘the Commission’) has made a range of recommendations to strengthen land use planning in Queensland (QFCoI, 2012). Numerous submissions to the NDIR and the Commission noted issues with land use planning that must be rectified in order for insurance to be able to play its role in risk mitigation (Queensland Board for Urban Places, 2011). It is not reasonable to expect insurers to offer flood cover in areas where inappropriate development has occurred. Before resorting to forcing insurers to offer flood cover, Governments must focus on strengthening land use planning on a catchment by catchment basis.
To enhance resilience both public and private sectors must be involved in improving risk awareness. Improving the quality and consistency of flood mapping will benefit both insurers and governments at all levels. With appropriate flood mapping, the private insurance market can accurately price risk and set premiums to signal the level of hazard associated with habitation in certain areas (Crichton, 2008). Greater certainty may reduce premiums or raise them in areas where repetitive losses are likely to occur. Where local governments work in partnership to prevent ongoing
108
Charles Sturt University Masters of Emergency Management
purchases in high risk areas there will be a gradual reduction in community exposure to flood risk.
The NDIR recommended insurers be forced to offer flood cover to enhance the uptake of flood insurance across Australia. Yet a wide range of stakeholders identified a better first step would be to improve flood mapping. The Federal Attorney-Generals’ Department is currently working to identify the problems associated with flood mapping in Australia. The Insurance Council of Australia (ICA) notes flood insurance coverage is already on track to increase across Australia to 84 per cent by 2012 (ICA NDIR Submission 2011, p 8). In line with this projection numerous insurers including CGU and AAMI, have announced that they will voluntarily expand their coverage to include flood insurance. Unlike the situation in Canada where residential flood cover is practically non-existent, the evidence does not suggest a market failure to provide flood cover to Australian homes provided they are not in areas of high risk.
Forcing insurers to increase their exposures to flood is not necessary. Nor is it advisable to provide insurance to what would be likely to be repetitive loss homes, just for the sake of increasing the ‘availability of insurance’. The Commonwealth Government needs to keep in mind its commitment through the NDRS to enhancing resilience. Where there is a clear pathway to improve flood mapping, it cannot be said that mandatory cover is being recommended as a ‘last resort’. Better mapping will ensure premiums continue to reflect risk and provide appropriate signals to those considering mitigation.
Government’s regulatory role
Governments benefit from the role insurance plays in facilitating community recovery and must enable the effective operation of the industry through both prudential and market regulation. To understand the important role government plays in ensuring a fair and efficient market for insurance, it is necessary to outline the regulatory framework within which the Australia insurance industry operates. The Australian Prudential Regulatory Authority (APRA) and the Australian Securities and Investment Commission (ASIC) regulate the Australian insurance market.
APRA monitors insurers to check they have retained sufficient capital to meet their obligations to policy holders. Insurers are responsible for assessing the risk of an event occurring, and use this information to determine their capital requirements and underwrite policies appropriate to the amount of exposure they can carry without affecting the survival of their company (known as the ‘exposure to loss’ ratio). ASIC works within the insurance industry to monitor compliance with relevant legislation including the Insurance Contracts Act 1984 (Cth) and Corporations Act 2001 (Cth) and Australian Securities and Investments Commission Act 2001 (Cth) (‘ASIC Act’). ASIC investigates and acts on systemic issues as they arise.
109
Charles Sturt University Masters of Emergency Management
Within the insurance industry significant players provide disaster insurance under a range of brands. Insurers, brokerage firms and their agents must abide by the Insurance Contracts Act 1984 (Cth). All members of the Insurance Council of Australia must abide by the General Insurance Code of Conduct and must hold an Australian financial service licences (AFSL) in order to sell insurance.4 Under the Corporations Act 2001 (Cth), insurers, as financial service providers, must be members of certified external dispute resolution services. 5 The Financial Ombudsman Service (FOS) is the major provider of these services. It is set up as an independent entity to assist in the resolution of insurance disputes and to report any systemic issues to ASIC. Neither ASIC nor the FOS have noted any systemic issues arising from the 2010/11 events although there may be some issues regarding lack of visibility of these entities in certain communities (HOR, 2012).
Reports and Inquiries following the Floods
On 4 March 2011, the Commonwealth Government established the Natural Disasters Insurance Review (NDIR). The intention of Government was to assess the issues related to current availability and affordability of disaster insurance in Australia with a view to determining whether changes were necessary. On 30 September 2011, the NDIR submitted its final recommendations to the Federal Government. The key recommendations included:
the mandatory inclusion of flood insurance in homes building insurance policies to be subsidised by Government on the basis of on ‘affordability threshold’, and
that the Federal Government offer subsidised reinsurance, set up a reinsurance and premium discounting facility, and guarantee any shortfall as it arises (NDIR, 2012).
It is not automatically clear from its recommendations that the NDIR has had appropriate regard to risk mitigation before resorting to risk transfer.
Having regard to the evidence provided to the NDIR it is disappointing that the Panel did not follow their own Terms of Reference, which required the Panel to be guided by the principle that government intervention is only required where there has been clear market failure, and that mitigation should be a ‘primary objective’. 6 Upon examination of the evidence presented to it, it can only be concluded that this did not occur. It appears only a selection of evidence provided in submissions informed the interventionist position taken the final report. The NDIR final recommendations were based on a market failure that did not actually occur and instead demonstrated a
4 Corporations Act 2001 (Cth), S 912A; ASIC Regulatory Guide 165, Licensing: Internal and external dispute
resolution. 5 Corporations Act 2001 (Cth), S 1017G.
6 http://www.ndir.gov.au/content/Content.aspx?doc=tor.htm
110
Charles Sturt University Masters of Emergency Management
determination by the Panel to affect structural changes beyond those that were justified by the evidence supplied to it.
On August 11, 2011 in response to the Treasury’s consultation paper, ‘Reforming Flood Insurance: Clearing the Waters,’ (‘Treasury Consultation’) the Government announced steps to: remove the exclusion of the General Insurance Code of Practice (‘the Code’) following natural disasters, to implement standard definition of flood, and enhance product disclosure by insurers through a mandatory ‘Key Facts Statement’. A four month time limit has been suggested for a decision on an insurance claim following a disaster event. In response to both the Treasury Consultation and NDIR recommendations, in November 2011 the Federal Government released a further discussion paper seeking comments to be made on proposed changes by 31 March 2012.
On 28 February, 2012 the release of the report by the House of Representatives Standing Committee on Social Policy and Legal Affairs ‘Inquiry into the Operation of Insurance Industry during Disaster Events’ also identified problems associated with claims handling as a significant cause of consumer discontent following the 2010/11 Flood events. A series of recommendations have been made and steps underway to remove the exclusion of the Code of Conduct following natural disasters. Further, a lack of adequate communication has been identified and accepted by the insurance industry as requiring improvement.
The evidence provided to the Queensland Floods Commission of Inquiry (‘the Commission’) does not demonstrate a market failure to provide insurance but further confirms HOR Inquiry findings that the 2010/11 events highlighted issues in claims handling, flood definition, flood mapping and land use planning. When the Commission released its final report on 16 March 2012, it acknowledged it did not receive sufficient evidence from claimants to make broad conclusions on the performance of the industry. However it acquired statistics from insurers and was able to reflect the reality relating to timeframes for claims processing. Testimony provided to the Commission demonstrated instances of poor communication with policyholders (QFCoI, 2011, p. 4559). Despite these issues, the Commission noted that evidence provided by insurers was contradicted media representations of significant delays (QFCoI, 2012 at 296). The majority of claims were efficiently dealt with within 2-3 months. The Commission acknowledged current steps to remove the exclusion of the Code of Conduct following disasters will enhance communication and other claims handling issues.
Convincing the public that it is unnecessary to intervene in the market will be difficult with the media portraying a situation of market failure. It cannot be said that the media has provided balance to the debate surrounding the performance of the insurance industry following the 2010/11 events (Roberts, 2011). Given the role of governments in regulation of this industry, it has become yet another political issue to be debated in advance of elections in a number of Australian jurisdictions. Yet
111
Charles Sturt University Masters of Emergency Management
neither ASIC nor the FOS have been inundated with complaints raising systemic issues. 7 The key message of the FOS is not of broad market failure requiring government intervention, but that early and ongoing communication by insurers with their policyholders would significantly reduce the level of complaints (FOS, 2011).
Definition of flood
Variations in the definition of flood between insurers encouraged public perceptions of market failure following the 2010/11 events. Whilst it is comparatively easy to identify where a bushfire has destroyed a home, it is more difficult to identify whether damage has been caused by flood or storm waters. Decisions are often time consuming, may require expert advice and may take many months to be challenged in internal and external dispute resolution processes. The Federal Government proposed standard definition when implemented, should eliminate variation in claims decisions where policyholders have flood cover with different insurers. As noted by the FOS, there will continue to be disagreements between whether an event itself is a flood or a storm (HoR, 2011). A measure of media understanding is necessary to identify that this is not a reflection of a broader systemic issue or market failure requiring a Government role in providing subsidised insurance, but a result of the similar nature of flood and storm events.
The evidence provided to the many reviews and inquiries established over the past year have not proven a market failure occurred. They have demonstrated issues with claims handling and the definition of flood. Work is underway to resolve these issues and policymakers must give the changes time to have an effect before considering last resort market intervention.
Rationale for avoiding intervention
The proposal that the Federal Government should finance reinsurance and offer wide premium subsidies would involve it taking on an unacceptable level of moral hazard. Moral hazard occurs where one party insulates another to some extent for the negative consequences associated with a particular risk. In this case the consequences of living in high risk areas are insurance premiums or disaster losses. By reducing the negative consequences of habitation in these areas, the Federal Government would be diminishing incentives on mitigation action.
Although the Federal Government could provide the financial backing to enable speedy recovery, this would do nothing to prevent a growing dependency on post-disaster assistance. This position, which the head of the NDIR, John Trowbridge, is advocating widely in the media, is not in the long-term interests of Australia (Thompson and Solomons, 2012). It is also in contrast to international moves towards more equitable catastrophe risk sharing by governments and communities.
7 According to information received by the FOS on 25 January 2012, until November 2011 there had been a
total of 900 natural disasters related disputes.
112
Charles Sturt University Masters of Emergency Management
The NDIR founded their position that all insurers should offer flood cover, on the basis of what they termed as a “consumer’s disaster insurance paradox.” That is, that if other perils are currently covered, floods should also be covered (NDIR, 2011, p 2). Insurers must set their premiums on the basis of annual average loss expectancy (AAL) for each exposure therefore this argument is not persuasive. Instead it demonstrates a simplistic view of how insurance works. As Clark notes, ‘the insurance industry needs to be able to achieve a reasonable management of the environmental risks that it covers by controlling the number and size of flood claims to which it is subject’ (Clark, 1998 p. 336). There are strong reasons why floods are not treated as other risks. Globally between 1970-1994 storms and floods were responsible for over 90 per cent of total economic costs of extreme events (Kunreuther et al, 2009). By 2001, flood amounted to approximately 29 per cent of all natural hazard damage making it the most costly Australian hazard (Bureau of Transport Economics, 2001).
Kunreuther and Pauly have argued that bundling exposures into insurance contracts may raise the perceived probability of loss threshold sufficiently to encourage greater uptake of insurance. They argued for this solution by demonstrating that unbundled premiums for certain events are often perceived to be at ‘rip-off’ levels and are avoided by consumers (Kunreuther and Pauly, 2004, p. 18). However, the negative implications of mandatory bundling of flood cover would outweigh any potential increase in consumer incentive to insure. Forcing insurers to offer flood cover may have negative long-term implications for policyholders. Where insurers have not already exited the market an event may lead to insolvency due to overexposure. Additionally the costs of obtaining sufficient capital where insurers may be overexposed are likely to be passed on to consumers. Where the Government provides discounted and guaranteed reinsurance, it will be taxpayers who suffer the financial risk of these increasing exposures.
According to Kunreuther, the effect of mandatory offering of flood cover is likely to be a reduction in the overall supply of insurance (Kunreuther et al. 2009). This would be likely to reduce competition in the market (Kunreuther et. al, 2009). Where the supply of insurance is low, it is more difficult to classify a community as resilient as there will be less liquidity available for accelerated recovery (Smith, 2011). It might not be a problem for larger insurers to be forced to offer flood cover, but for the smaller entities, the risk of remaining in the market may be too high. When the Florida legislature intervened to force insurers to continue to offer Hurricane insurance following Hurricane Andrew in 1992, the result was a mass exodus from the market (McTigue, 2007). Even for larger insurers the likely concentration of policies in hazard prone geographical areas combined with the known difficulty of calculating probability of loss for flood risk would lead to increased prudential concerns.
Government subsidies
113
Charles Sturt University Masters of Emergency Management
Subsidies should be avoided as they prevent price signals from operating effectively ad for habitation in high risk zones (Midelmann, 2008). The NDIR proposed a system of flood subsidies based on an ‘affordability threshold’ that would be phased out over time. However, Australia is likely to struggle similarly to how the United States has when it comes time to encourage politicians to remove them. The eventual reduction of subsidies will inevitably be highly unpopular and well publicised. The NDIR has been unable to put forward any firm timeline of when these subsidies would be phased out apart from stating that they would be reviewed from ‘time to time.’ Although the Australian Institutes of Actuaries (AIA) conceded a set of premium subsidies may be necessary as a temporary measure, international experience provides some insight as to the difficulties associated with their removal.
Research has already shown that homeowners largely fail to mitigate losses due to a general inability to justify the upfront costs relative to the perceived benefits (Kunreuther et al, 2009). Lowering the price of insurance further reduces the incentives for voluntary mitigation action as the perceived cost of inaction will be even lower. When it comes to premiums, there are sound reasons why they may be are unaffordable in some areas. The appropriate role of insurance in enhancing resilience comes down to a question of policy objectives. As there has not been a persuasive case for market failure, Policymakers aware of the need to enhance resilience, should avoid subsidies in favour of mitigation efforts.
International Experience
Although NDIR representatives have noted ‘most’ developed countries have some form of government insurance mechanism, international experience is actually more mixed. Rather than moving towards greater government adoption of catastrophe risk many countries have been working in recent years to reduce their involvement and growing exposures in favour of moves towards mitigation and self reliance (Klein, 2009). States such as Germany, Austria, the United Kingdom and Italy, have significant flood risk, but retain a private market model.
When the Association of British Insurers (ABI) entered into a “Statement of Principles” agreement with the British Government, it was to provide standard flood cover in exchange for effective public floodplain management (Niels, 2011). The United Kingdom faces a policy crossroad where in 2013 this Agreement expires. Since 2000 the Agreement has ensured flood insurance has been widely affordable and available for houses that do not face significant (1 in 75 year) flood risk. However, it is highly unlikely to be renewed. Recently the ABI announced the Agreement massively distorted the system of flood insurance resulting in problems such as overexposure by certain insurers and inequitable levels of cross subsidisation (ABI, 2012). Noting that the Government had not taken adequate action to address flood risk or maintain flood protection infrastructure, the ABI have declared they will not renew the agreement when it expires.
114
Charles Sturt University Masters of Emergency Management
Although the Canadian Government provides post disaster relief similarly to the Australian Natural Disaster Relief and Recovery Arrangements (NDRRA), there is no provision of insurance for overland flooding for households (Sandink et al, 2010), . Canada has in recent years experienced increases in the cost of natural disasters and is moving to reduce post-disaster reliance on government financing (Hwacha, 2005). Swiss Re has called for a public-private partnership approach where the Government improves public flood risk awareness and mitigation efforts whilst the private sector insures against all but the highest risk homes. Swiss Re has acknowledged however, there will be some cross subsidisation. The success of the scheme would be dependent on the Government acting to fulfil its role in raising awareness in a way the British Government was unable or unwilling to (Sandink et al. 2010).
The United States experience is particularly relevant for Australia as it demonstrates the challenges associated with national subsidies and forcing insurers to offer flood cover. Long running issues surrounding the United States National Flood Insurance Programme (NFIP) should provide caution to those advocating for greater government intervention in the insurance industry. The United States had the greatest worldwide proportion of disaster losses over the 1970-2004 period and faces significant annual flood risk (Kunreuther, 2009). In 1968 the United States legislated to provide for the NFIP as it perceived a market failure in the provision of affordable flood cover. Although a key aim of the NFIP is to reduce the overall cost on the taxpayer and encourage mitigation action, the program has had to borrow heavily from the Federal treasury. There is some evidence that it has reduced annual rebuilding costs by $1 billion per year through building code reforms etc, however the level of successful mitigation is contested and uptake of flood insurance remains extremely low (McTigue, 2007). Since its inception the United States Congress has struggled to lift premiums to a level that would encourage voluntary mitigation action or discourage inappropriate habitation of high risk areas (Smith, 2011).
Following Hurricane Katrina in 2005, the United States Government Accountability Office (GAO) published a report acknowledging the extensive problems with the NFIP (GAO-06-174T, 2005). The Fund is not self-sufficient, is not actuarially sound and pays significant amounts out to repetitive loss homes. The United States Congress passed the Bunning-Bereuter Blumenauer Flood Insurance Reform Act (2004) in an attempt to build greater resilience into the NFIP.8 It mandated that severe repetitive loss homes should be elevated, relocated or demolished or face higher premiums. These homes account for 1% of all insured homes under the program yet amount to 25-30% of total costs (GAO-06-174T, 2005). Incredibly some of the original homes that received initial subsidies following the implementation of the NFIP in 1968 were still in 2005, draining federal resources as repetitive loss properties (GAO-06-174T, 2005). Over the past 40 years it is clear that United States
8 PL 108-264.
115
Charles Sturt University Masters of Emergency Management
policymakers have learned that key to successful flood risk management is a strong primary commitment to mitigation.
At a state level the anti-competitive Government intervention in the Florida market for Hurricane insurance demonstrates the negative effects of over-regulation. Following Hurricane Andrew the Florida State Government enacted a law to prevent insurers from exiting the market (McTigue, 2007). A pro-intervention culture developed which has allowed the issue of insurance to become crucial to political candidates during recent elections. In recent years Florida regulators have increasingly intervened in the market to deny requests by insurers for premium increases. They have also sought to prevent insurers from isolating their Florida business from the national market (Kunreuther, 2006). This is clearly a pathway Australian policymakers should avoid.
The differences in international approaches may be explained as a matter of policy objective or dominant national philosophy. Klein has noted the link between philosophies underpinning regulatory systems and their treatment of risk financing (Klein, 2009). In countries such as the United States, governments play a large role in providing flood insurance. It appears that the dominant philosophy prioritises short-term solutions to flood in widely available and affordable protection for homes and businesses above the implementation of less popular mitigation strategies towards the creation of resilient communities. As Kunreuther notes, “This combination of underinvestment in protection prior to the event and liberal use of taxpayer’s funds after a disaster does not augur well for the future” (Kunreuther, 2009). There may be scope for greater regulation of the insurance market in Australia however if the nation is committed to advancing flood resilience, reforms must not diminish incentives on mitigation action. Instead policy makers must push towards greater shared responsibility for risk mitigation and better land use planning by local governments, businesses and individuals.
International experience with increased government risk transfer for catastrophe financing begs the question as to why the NDIR has failed to adequately emphasise the importance of mitigation. While the United States tries to turn back the clock on its highly distorted system of public flood insurance and the United Kingdom faces the dissolution of its public-private partnership with its domestic insurance industry, Australia has the opportunity to avoid such mistakes. Even one of the largest global reinsurers, Lloyd’s of London, has cautioned Australian policymakers to keep market intervention to a minimum (Hartge-Hazelman, 2011).
Instead the Federal Government must identify those properties in the most high risk areas and target local, state and federal resources into reducing exposure through elevation or relocation programs. Risk Frontiers has recently estimated that there are approximately 59,439 residential properties in high risk areas throughout
116
Charles Sturt University Masters of Emergency Management
Queensland (Risk Frontiers, 2011).9 With the NSDR firmly focusing public policy in the direction of reducing exposures, it is critical that governments demonstrate a genuine commitment to actions that will reduce the risk of loss associated with these homes. The benefit of mitigation actions is well demonstrated by a 2009 UK study which found building back better/more resilient (resilient reinstatement) flood affected homes in Cockermouth region cost an average of 34% more. Yet it also found that upfront investment would be recouped following a single flood event (Rotimi, 2009)
Alternative risk transfer mechanisms
When in 2004, some authors for the OECD advocated for national catastrophe programs, it was claimed that Governments have deep credit capacities and are the most logical entity to bear the risk of disaster losses. Since that time a Global Financial Crisis (GFC) has reduced the availability and increased the cost of capital. Further, the credit rating of many sovereign nations has been downgraded and in this economic climate it cannot be so easily assumed that Governments should be the logical entity to bear the financial risk of natural catastrophes. Particularly in relation to the recommendation by the NDIR for the Federal Government to act as a reinsurance facility there are many reasons why it is not appropriate for it to take on endless financial risk. Blanchard noted in 1917;
“Each reinsurer limits the risk which it will assume in order that its own stability may not be threatened, and requires the original insurer to retain a certain part of the risk to promote careful selection. The amount ceded to any other single company depends on the judgment of the reinsurer and the reinsured as to the risk which can be carried safely” (Blanchard, 1917).
The Federal Government is not a bank and it is not prudent to consider resolving the challenge of catastrophe risk financing through risk transfer to it via reinsurance. Just as a private reinsurer must limit its risk, so should the Federal Government, so as not to threaten its own stability.
In this context the role of catastrophe bonds should be explored as a means of assisting the private insurance market without distorting it, and without threatening fiscal stability. The rising cost of capital caused by recent natural disasters may open the door for a catastrophe bond market to flourish in Australia. Catastrophe bonds were created after Hurricane Andrew where 11 insurers found themselves overexposed and insolvent (Lewis, 2007). Catastrophe bonds “transfer the risk of natural disasters to investors, who receive a yield in return for agreeing to cover damages they consider unlikely.” (Perry, 2011) ‘Cat bonds’ as they are known, allow reinsurers to diversify their risk in broader capital markets and have increased the capacity of insurers to operate in highly disaster prone areas such as the United States Gulf Coast (Ward, 2011).
9 High risk is defined as those with ARI (average recurrence interval) under 100 years.
117
Charles Sturt University Masters of Emergency Management
Following the 2010/11 events reinsurance prices have increased significantly. These prices may return to reasonable levels however if they do not, they may create the necessary demand for a cat bond market. Cat bond expert John Seo has noted reinsurance in Australia and New Zealand has until recently been available at ‘bargain’ rates (Ward, 2011). Although prices for reinsurance have increased, whether this indicates a lack of capacity sufficient to trigger the development of a cat bond market in Australia is yet to be seen. The extent to which risk-linked securities can alleviate problems of capital requirements on insurers following catastrophic events is subject to finding willing investors and, being able to price the probability of default. The Australian Institute of Actuaries (AIA) has noted that the Federal Government should consider investing in catastrophe bonds (AIA, 2011). Global reinsurers have called for Australia to turn to catastrophe bonds instead of one off flood levies (Perry, 2011). The potential benefits to be gained from the development of a cat bond market suggest further investigation by public and private sectors of alternative risk transfer mechanisms is warranted.
The impact of charitable relief on resilience
Any discussion of public and private roles in catastrophe financing must include the role charitable funds play in the promotion of resilience. Whilst in the short term these funds have enabled a form of resilience in assisting rapid community recovery, they do not encourage the uptake of insurance or individual responsibility in the long term (McTigue, 2007). Following the 2010/11 floods approximately $276 million was raised to assist those most in need including $22 million from State and Federal Governments10. A sliding scale of need was created by Price Waterhouse Coopers which identified that those without insurance were most in need. As a result of the method of determining need there were occasions where those who had not paid any flood insurance were provided, without any excess payable, with greater assistance than those who were insured, yet who may not have had an adequate ‘sum insured’.
The Federal Government also provided a range of personal hardship grants, and other forms of assistance to flood affected individuals. Although Governments must play a role in protecting the most vulnerable in society, this must be done in a way that does not embed dependence by rewarding the failure to take up flood insurance or undertake mitigation actions. Where homeowners know that regardless of whether they take out insurance they will be compensated, charity assistance presents a danger of creating a culture of dependence as opposed to resilience.
Creating a risk aware society
Both insurers and Governments have a role to play in creating a resilient risk aware society. Homeowners are known to have difficulty in opting for even the most
10
In addition to the $7 billion cost of infrastructure recovery to be provided by State and Federal Governments through the Natural Disasters Relief and Recovery Arrangements (NDRRA)
118
Charles Sturt University Masters of Emergency Management
affordable cover for low-probability high-risk events. Kunreuther hypothesised that this was due to the transaction costs associated with finding out the true probability of an event occurring (Kunreuther, 2004). Evidence provided to the Commission demonstrated even where some homeowners had sought Floodwise reports before purchasing their homes, their ability to appreciate the real level of hazard was not guaranteed (QFCoI, 22 September, 2011). The Key Facts Statement and establishment of a flood risk information portal are likely to reduce the amount of claims based on inadequate disclosure and improve the uptake of flood insurance. However to enhance resilience information on flood risk must be clear and in plain English.
The capacity of insurers to provide relief following disasters is dependent on consumers accurately understanding the risks they face. The reality is the perceived risk of a hazard capable of encouraging mitigation action is not well correlated to actual risk (Clark, 1998). Evidence also demonstrates homeowners commonly opt for the cheapest premium without properly considering the exclusions (Kunreuther, 2006) and without seeking information on the risks associated with living in a particular area (Huber and Wider 1997). Encouraging preparedness depends upon lowering the transaction costs associated with acquisition of information and ensuring that information is unambiguous. To enhance resilience governments at all levels must invest in communicating to individuals that they have a shared responsibility to be informed of relevant hazards in their areas and take out appropriate insurance.
The role of local government in enhancing resilience
As discussed above issues with land use planning must be addressed before resort it made to forcing insurers to offer flood cover, or the Federal Government to provide a set of premium subsidies. It is inequitable for local governments to be able to approve developments without proper consideration of flood risk, and then to blame insurers when a disaster event occurs. Local councils have a significant role to play in ensuring the buildings have been built in appropriate locations to minimise flood losses. Submissions to the NDIR in addition to submissions and testimony provided to the Commission outlined examples of the failure of certain councils to adequately plan land use or, properly consider the impacts of development on flood risk levels for those in downstream areas (QFCoI, p 4567). The Queensland Board for Urban Places called for more ‘place appropriate’ building in order to enhance preparedness and resilience (QBUP, 2011 p. 1). It is not appropriate for the Federal Government to subsidise risks created by local councils through inappropriate development of the floodplain.
Internationally New Orleans is an example of a city that has worked hard to create green corridors where human habitation in high risk areas is prevented thereby reducing its exposure to loss of life. In 1990 Sweden tied liability for flood losses was to the local Councils who had approved development applications. As a result in the
119
Charles Sturt University Masters of Emergency Management
flood events of 2000 no damage occurred to buildings erected with permits allocated post the 1990 amendments. Similarly in Scotland, councils work together on a catchment basis and may be held responsible for poor land use planning decisions.
In order for there to be greater equity in the sharing of risk and appropriate incentives on mitigation, legislative amendments need to put a greater legal obligation on local councils to better assess the potential current and future flood risk associated with development. Where there has been a clear failure to consider aspects of flood plain risk management such as zoning, minimum floor levels, levees and other infrastructure, there should be an avenue for the local council or developer, to be liable as in Sweden. This would ensure a greater responsibility is undertaken by those creating the risk by tying the negative consequences of disaster recovery financing to the action creating the vulnerability.
Conclusion
As individual disaster events such as Hurricane Katrina have exceeded $100 billion in costs, the challenge of deciding who should bear the risk of catastrophe financing is not faced by Australia alone. Insurance is one of many risk management strategies that allow communities to rebuild following a disaster event and premiums can deter inappropriate habitation. However it should never be seen as a panacea to the risk of natural disasters. If Australia is committed to enhancing resilience as a priority through the NSDR, the Federal Government should not take on the risk of financing catastrophe risk as advocated by the NDIR. Certainly both the United Kingdom and United States experiences intervening in the market have not led to the development of resilient communities.
The Australian policy agenda now appears set to split in two opposing directions, one leading towards and the other against enhanced resilience to extreme weather events. An examination of some of the recommendations made by the recent NDIR demonstrates the crossroads at which Australia currently stands. Proposing the compulsory offering of flood cover by insurers, the implementation of a system of premium subsidies and calls on Government to act as a reinsurer will discourage competition within the insurance market and prevent premiums from accurately reflecting risk.
The appropriate role of the Federal Government in insurance is not to provide subsidies to most medium and high risk homes or to force insurers to offer flood cover. To enhance resilience the Federal Government must work with insurers to provide better mapping, enhance the regulatory framework within which insurance is provided, and to commit appropriate funding towards mitigation. Strengthened land use planning and a re-evaluation of how charity assistance is provided will also enhance resilience by ensuring that those creating flood risk or failing to reduce flood risk are not rewarded.
120
Charles Sturt University Masters of Emergency Management
Bibliography
ABC News, Bligh Open to Insurance Rethink, http://www.abc.net.au/news/2011-01-15/bligh-open-to-insurance-rethink/1905950, 15 January 2011 (Retrieved 9 April 2012).
Arnold, M., 2008, The Role of Risk Transfer in Disaster Risk Reduction and Climate Change Adaptation. Provention Consortium.
Association of British Insurers, 2012, From Aberconwy to York, Boston to Widnsor – ABI Highlights the Serious Flood Risk Facing Communities in England and Wales, Media Release, 31 January 2012 http://www.abi.org.uk (Retrieved 8 February, 2012).
Blaikie, P., Cannon, T., Davis, I., and Wisner, B., 1994, At Risk - Natural Hazards, People's Vulnerability, and Disasters, Routledge, London.
Blanchard, R. H., 1917, Insurance of the Catastrophe Hazard, ‘Annals of the American Academy of Political and Social Science, Vol. 70, pp. 220-226.
Clark, M. J., 1998, Flood Insurance as a Management Strategy for UK Coastal Resilience, The Geographical Journal, Vol. 164, No. 3, pp. 333-343.
Consumer Action Law Service and Insurance Law Service, 2011, A Fair Go in Insurance, Media Release 11 February, 2011. www.consumeraction.org.au/downloads/2011-MR-AFAIRGOININSURANCE-010211.pdf, (Retrieved 12 May 2011).
Financial Ombudsman Service, 2011, 2010-11 Annual Review, http://fos.org.au/annualreview/2010-2011/PDF/FOS-AR2010-2011.pdf, (Retrieved 24 January 2012).
Floodplain Management Association, 2011, Submission to Natural Disasters Insurance Review, http://www.ndir.gov.au/content/submissions/issues_paper_submissions/Floodplain_Management_Association.pdf (Retrieved 2 September 2011).
Global Platform for Disaster Risk Reduction, 2011, Chair’s Summary, Global Platform for Disaster Risk Reduction and World Reconstruction Conference, 3rd Sess. Geneva, 8-13 May 2011. http://www.preventionweb.net/globalplatform/2011/, (Retrieved 10 December 2011).
Grace, M.F., 2004, Homeowner's Insurance with Bundled Catastrophe Insurance. The Journal of Risk and Insurance, Vol. 71, No. 3, pp. 351-379.
Hartge-Hazelman, B., 2011, Australia's Insurance Risk Reassessed, Australian Financial Review, 25 July 2011.
Hwacha, V., 2005, Canada’s Experience in Developing a Natural Disaster Mitigation Strategy: A Deliberative Dialogue Approach, Mitigation and Adaptation Strategies for Global Change, Vol. 10, pp. 507-523.
121
Charles Sturt University Masters of Emergency Management
Insurance Council of Australia, 2011, Submission to Natural Disasters Insurance Review, http://www.ndir.gov.au/content/submissions/issues_paper_submissions/Insurance_Council_of_Australia.pdf (Retrieved 10 August 2011).
Ikeda, S., Sato, T., Fukuzono., T., 2008, Towards an Integrated Management Framework for Emerging Disaster Risks in Japan, Vol. 44, pp. 267-280.
Klein, R.W., 2009. Catastrophe Financing in the United States, The Journal of Risk and Insurance, Vol. 76, No. 3, pp. 607-637.
Kunreuther, H.S., Pauly, M., 2004, Neglecting Disaster: Why People Don’t Insure Against Large Losses? The Journal of Risk and Uncertainty, Vol. 28, No. 1, pp. 5-21.
Kunreuther, H.S., 2006, Disaster Mitigation and Insurance: Learning from Katrina, Annals of the American Academy of Political and Social Science, Vol. 604, pp.208-227.
Lewis, M., 2007, In Nature’s Casino, New York Times, http://www.nytimes.com/2007/08/26/magazine/26neworleans-t.html?pagewanted=print (Retrieved 21January 2012).
McTigue, C., 2007, The Insurance Dilemma: How to Increase the Availability and Use of Catastrophe Insurance After Katrina, pp. 1-26.
Niels, G., 2011 Why does it always rain on me? A Proposed Framework for Flood Insurance, Agenda, September, pp. 1-5.
Perry, M., 2011, Australia Urged to Use Catastrophe Bonds as Disaster Risk Rises. Reuters, 10 February 2011, http://www.reuters.com/article/2011/02/10/us-australia-disaster-insurance-idUSTRE7193AV20110210, (Retrieved 20 January, 2012).
Roberts, G., 2011, Insurance Refusal Hits Home for Young Burpengary Family. Courier Mail, 2 August, 2011, http://www.couriermail.com.au/questnews/moreton/insurance-refusal-hits-home-for-young-burpengary-family/story-fn8m0yu3-1226106164924 (Retrieved, 2 August 2011).
Rogers, P., 2011 Development of a Resilient Australia; Enhancing the PPPR Approach with Anticipation, Assessment and Registration of Risks, The Australian Journal of Emergency Management Vol. 26, No. 1, pp. 54-58.
Rotimi, J., Proverbs, D., Lamond, J., Wassell, P., 2011 An Analysis of the Costs of Resilient Reinstatement of Flood Affected Properties: A Case Study of the 2009 Flood Event in Cockermouth, Structural Survey, Vol. 29, No. 4, pp.279 – 293.
Smith, G., 2011, Planning for Post-Disaster Recovery: A Review of the United States Disaster Assistance Framework. Public Entity Risk Institute.
Sandink, D., Kovacs, P., Oulahen,G., & McGillivray, G., 2010, Making Flood Insurable for Canadian Homeowners: A Discussion Paper, Institute for Catastrophic Loss Reduction & Swiss Reinsurance Company Ltd, Toronto.
122
Charles Sturt University Masters of Emergency Management
Thompson, T., and Solomons, M., Queensland Homes Exposed to Flood Losses, Courier Mail, 11 January 2012, http://www.couriermail.com.au/news/queensland/homes-still-exposed-to-losses/story-e6freoof-1226241297118, (Retrieved 14 January, 2012).
Thompson and McKenna, 2011, Flood victims with belated RACQ payouts won't be forced to repay Premier's Relief Appeal funds, Courier Mail, 4 August 2011, http://www.couriermail.com.au/news/queensland/flood-victims-with-belated-racq-payouts-may-be-forced-to-repay-premiers-relief-appeal-funds/story-e6freoof-1226107745344 (Retrieved 4 August, 2011).
Trowbridge, J., Minto, J., Berril, J., 2011, Natural Disasters Insurance Review; Inquiry into Flood Insurance and Related Matters, http://www.ndir.gov.au/content/report/downloads/NDIR_final.pdf (Retrieved 14 November, 2011).
United States Government Accountability Office, 2005, Challenges Facing the National Flood Mitigation Program, http://www.gao.gov/new.items/d03606t.pdf (Retrieved 27 December 2011).
Victorian Bushfires Royal Commission, 2010, 2009 Victorian Bushfires Royal Commission Final Report, http://www.royalcommission.vic.gov.au/Commission-Reports/Final-Report (Retrieved 10 December 2011).
Ward, M., 2011 Australia’s Catastrophe Crossroads, Investment Magazine, April, pp. 41-44.
123
The Child and Adolescent Mental Health Service Response to the Christchurch Earthquakes: Have we recovered yet?
Heather Clay Social Worker Canterbury District Health Board
Christchurch, New Zealand
Candace Bobier Research Associate
Canterbury District Health Board
Christchurch, New Zealand Paper presented at EARTH: FIRE AND RAIN Australian & New Zealand Disaster and Emergency Management Conference Brisbane – 16 – 18, April 2012
124
The Child and Adolescent Mental Health Service Response to the Christchurch Earthquakes: Have we recovered yet?
Abstract: Canterbury, New Zealand was woken up literally and figuratively on September 4th, 2010 at 4:35 am with a magnitude 7.1 earthquake. Rattled, but largely unscathed, we rode out the aftershocks and congratulated ourselves on our resilience, utterly mentally unprepared for the devastation about to be faced on February 22nd 2011. Further large events (June and December 2011) and over 10,000 aftershocks have impacted on psychological recovery. We offer a description of the child and adolescent population referred to a publically funded mental health services earthquake pathway since July 2011. Delivered alongside existing services, the earthquake response pathway has been designed to enable targeted as needed intervention to young people struggling to cope as a result of the Canterbury earthquakes. We consider how our service wide response has met the anticipated psychological need and how our experience can inform mental health preparedness, response and recovery in future natural disasters.
Key words: Earthquakes, disasters, children, adolescents, mental health services, psychological response Acknowledgements: We wish to thank Dr Stephanie Moor, Dr Matt Eggleston and Dr. Caroline Bell alongside Dr. Harith Swadi and Kay Johnston of the SMHS CDHB for initiating this timely response to the Canterbury earthquakes, Professor Brett McDermott and Dr Vanessa Cobham of Queensland University for their experience, training and ongoing support and John Beveridge, SMHS CDHB for his IT and auditing assistance.
125
Background
There is a 100% change of an earthquake today. In fact, on average, worldwide there are four earthquakes magnitude 5 or greater every 24 hours (U.S. Geological Survey, www.usgs.gov). New Zealand sits, along with Japan, California and Chile, on ‘The Pacific Ring of Fire’, an area well known for heightened seismic and volcanic activity. Large historical events have given New Zealand beautiful mountains, thermal springs, deep volcanic ports and acceptance of the possibility of future earthquakes. New Zealand’s position abreast the colliding Australian and Pacific plates, has resulted in four major fault systems including the Macquarie Fault to the south, the South Island Alpine Fault, the Marlborough Fault system and the North Island Fault system). In addition, the country contains a great number of smaller fault lines including the newly-revealed Greendale Fault in the South Island province of Canterbury. The Canterbury Earthquakes On September 4th, the people of Christchurch and Canterbury were woken quite literally and figuratively by a magnitude 7.1 earthquake along the Greendale Fault. The shaking was felt across much of the South Island and some of the lower North Island. Since then, Canterbury has experienced three further large earthquake events (Feb 2011, June 2011 and December 2011) and over 10,000 aftershocks. The September earthquake occurred in the very early hours (4:35 am NZ time) on Saturday morning and was centred about 45 kilometres from Christchurch near the rural town of Darfield. There were no deaths, but there was much damage to brick buildings and chimneys, bridges, and significant liquefaction in some areas. Rattled, but largely unscathed, we rode out the aftershocks and congratulated ourselves on our resilience, wearing t-shirts that read “tested to 7.1.” Our experience on February 22 was dramatically different. February’s earthquake was centred much closer to Christchurch near the port of Lyttelton at a distance of 10 km from the Christchurch Central Business District and even closer too many of the city’s eastern Suburbs. It was incredibly shallow at 5 km deep and the reverse thrust of the fault resulted in vertical ground accelerations beneath the central city at a rate twice the speed of gravity (GNS Science, www.geonet.org.nz). In stark contrast to September, the magnitude 6.3 earthquake occurred during lunchtime on a busy work day resulting in 185 deaths and many more casualties predominantly due to building collapse. There was considerable damage to the city’s infrastructure, significant displacement of people and permanent damage to residential and industrial land. On February 22nd, our shaky city crumbled, we fell apart, and many of us, approximately 15,000, left Canterbury as our central Christchurch city was cordoned off with military patrol of the newly created ‘The Red Zone’. In the suburbs, we welcomed friends and family who lost homes and we pulled together. Some of us met many of our neighbours for the first time. We mucked in and helped out. Areas such Bromley required ‘heavy artillery’ including support from the Volunteer Student Army and NZ Federated Farmers to clear liquefaction. Soon liquefaction and designer long drops became the subjects of everyday conversation. We were getting on with it. But by May, aggravation was setting is as we emptied our
126
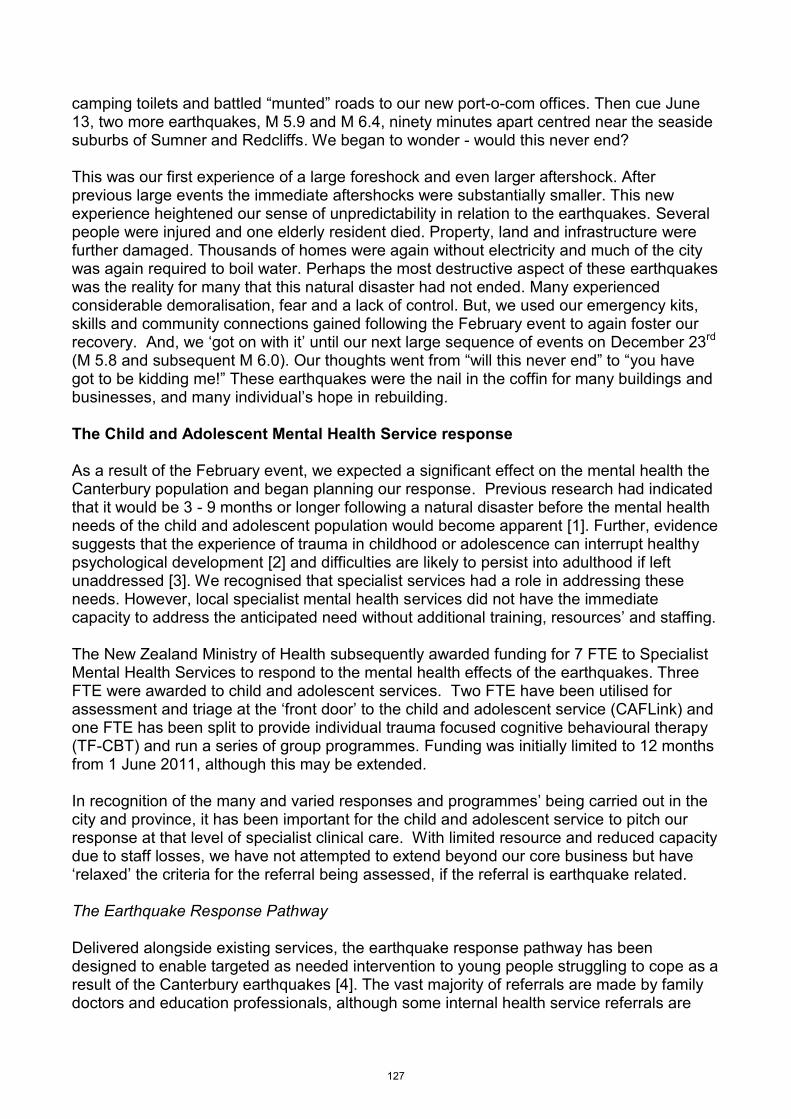
camping toilets and battled “munted” roads to our new port-o-com offices. Then cue June 13, two more earthquakes, M 5.9 and M 6.4, ninety minutes apart centred near the seaside suburbs of Sumner and Redcliffs. We began to wonder - would this never end? This was our first experience of a large foreshock and even larger aftershock. After previous large events the immediate aftershocks were substantially smaller. This new experience heightened our sense of unpredictability in relation to the earthquakes. Several people were injured and one elderly resident died. Property, land and infrastructure were further damaged. Thousands of homes were again without electricity and much of the city was again required to boil water. Perhaps the most destructive aspect of these earthquakes was the reality for many that this natural disaster had not ended. Many experienced considerable demoralisation, fear and a lack of control. But, we used our emergency kits, skills and community connections gained following the February event to again foster our recovery. And, we ‘got on with it’ until our next large sequence of events on December 23rd (M 5.8 and subsequent M 6.0). Our thoughts went from “will this never end” to “you have got to be kidding me!” These earthquakes were the nail in the coffin for many buildings and businesses, and many individual’s hope in rebuilding. The Child and Adolescent Mental Health Service response As a result of the February event, we expected a significant effect on the mental health the Canterbury population and began planning our response. Previous research had indicated that it would be 3 - 9 months or longer following a natural disaster before the mental health needs of the child and adolescent population would become apparent [1]. Further, evidence suggests that the experience of trauma in childhood or adolescence can interrupt healthy psychological development [2] and difficulties are likely to persist into adulthood if left unaddressed [3]. We recognised that specialist services had a role in addressing these needs. However, local specialist mental health services did not have the immediate capacity to address the anticipated need without additional training, resources’ and staffing. The New Zealand Ministry of Health subsequently awarded funding for 7 FTE to Specialist Mental Health Services to respond to the mental health effects of the earthquakes. Three FTE were awarded to child and adolescent services. Two FTE have been utilised for assessment and triage at the ‘front door’ to the child and adolescent service (CAFLink) and one FTE has been split to provide individual trauma focused cognitive behavioural therapy (TF-CBT) and run a series of group programmes. Funding was initially limited to 12 months from 1 June 2011, although this may be extended. In recognition of the many and varied responses and programmes’ being carried out in the city and province, it has been important for the child and adolescent service to pitch our response at that level of specialist clinical care. With limited resource and reduced capacity due to staff losses, we have not attempted to extend beyond our core business but have ‘relaxed’ the criteria for the referral being assessed, if the referral is earthquake related. The Earthquake Response Pathway Delivered alongside existing services, the earthquake response pathway has been designed to enable targeted as needed intervention to young people struggling to cope as a result of the Canterbury earthquakes [4]. The vast majority of referrals are made by family doctors and education professionals, although some internal health service referrals are
127
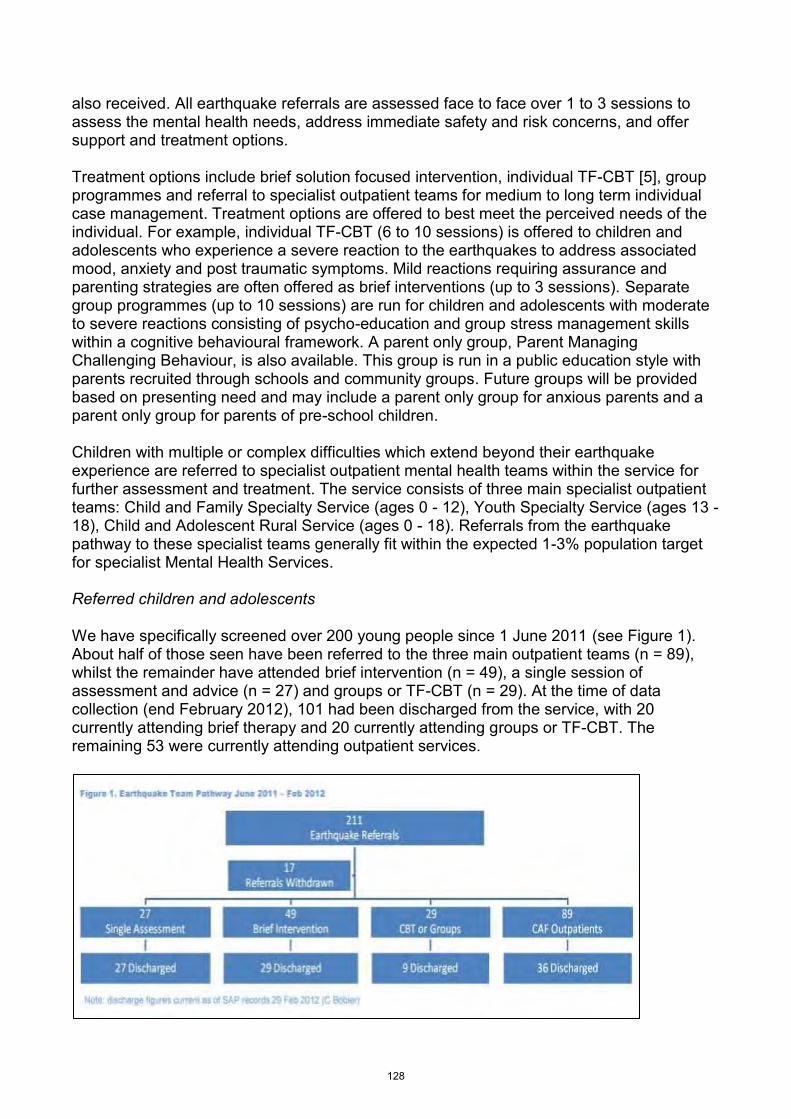
also received. All earthquake referrals are assessed face to face over 1 to 3 sessions to assess the mental health needs, address immediate safety and risk concerns, and offer support and treatment options. Treatment options include brief solution focused intervention, individual TF-CBT [5], group programmes and referral to specialist outpatient teams for medium to long term individual case management. Treatment options are offered to best meet the perceived needs of the individual. For example, individual TF-CBT (6 to 10 sessions) is offered to children and adolescents who experience a severe reaction to the earthquakes to address associated mood, anxiety and post traumatic symptoms. Mild reactions requiring assurance and parenting strategies are often offered as brief interventions (up to 3 sessions). Separate group programmes (up to 10 sessions) are run for children and adolescents with moderate to severe reactions consisting of psycho-education and group stress management skills within a cognitive behavioural framework. A parent only group, Parent Managing Challenging Behaviour, is also available. This group is run in a public education style with parents recruited through schools and community groups. Future groups will be provided based on presenting need and may include a parent only group for anxious parents and a parent only group for parents of pre-school children. Children with multiple or complex difficulties which extend beyond their earthquake experience are referred to specialist outpatient mental health teams within the service for further assessment and treatment. The service consists of three main specialist outpatient teams: Child and Family Specialty Service (ages 0 - 12), Youth Specialty Service (ages 13 - 18), Child and Adolescent Rural Service (ages 0 - 18). Referrals from the earthquake pathway to these specialist teams generally fit within the expected 1-3% population target for specialist Mental Health Services. Referred children and adolescents We have specifically screened over 200 young people since 1 June 2011 (see Figure 1). About half of those seen have been referred to the three main outpatient teams (n = 89), whilst the remainder have attended brief intervention (n = 49), a single session of assessment and advice (n = 27) and groups or TF-CBT (n = 29). At the time of data collection (end February 2012), 101 had been discharged from the service, with 20 currently attending brief therapy and 20 currently attending groups or TF-CBT. The remaining 53 were currently attending outpatient services.
128
Demographic information has generally been consistent with the overall trends for referrals to the Child and Adolescent Mental Health Service. More children (65%) have been referred than adolescents (35%) and more females (58%) have been referred than males (42%). Initial trends for referrals were those of 9 year old boys and 15-16 year old girls. Following the December 2011 earthquakes, there have been more referrals of younger children (aged 3 – 6) with a preponderance of 5 year old girls. Consistent with Christchurch population estimates, the ethnicities of referrals have been predominantly New Zealand born European (Pakeha, 80%) or non New Zealand born European (9%); followed by Maori (Indigenous New Zealander, 10%) and other (1%). Most of the non New Zealand born Europeans are recent immigrants to Canterbury. The socio-economic situation and domiciliary location of referrals has been diverse. Questionnaires A package of questionnaires is utilised at assessment for diagnostic screening and as a baseline for possible follow up. The Strengths and Difficulties Questionnaire (SDQ) is a behavioural screening measure of child and adolescent emotional health, conduct problems, hyperactivity, peer relationship problems and pro social behaviour [6] completed by parents and by children aged 8 and over [7]. To date, we have seen an overall reporting trend of high to very high emotional distress with high impact on the child’s life, but close to average overall stress on the family. A smaller number reports high emotional distress and high behavioural difficulties with high to very high overall stress on the family. To assess self reported symptoms of Post Traumatic Stress Disorder as rated by the older child or adolescent, the Post Traumatic Stress Disorder – Reaction Index, PTSD-RI [8] was adapted with permission from the National Center for Child Traumatic Stress UCLA to word earthquake as the potentially traumatic event (Finley, H. P. pers. Comm.., 2011). Additional measures of post traumatic stress reactions include the parent completed Pediatric Emotional Distress Scale, PEDS [9], utilised for children aged less than 8 years and the self report Children’s Revised Impact of Events, CRIES [10]. All completed PEDS questionnaires met criteria for Traumatic Event Exposure and the majority of the PTSD-RI and CRIES questionnaires suggest moderate to severe risk of post traumatic reactions. Although, we have been unable to collect questionnaires for all assessments, available reports taken together advocate strongly for the value of specialist intervention. In addition, parents were asked to complete a global measure of their own mental health, the Kessler-10 [11]. Most parents reported general wellness although some were referred to adult services following their child’s assessment by joint agreement. Parents also completed the Parenting Reactions after Trauma questionnaire adapted from the 2009 Victorian bushfires Parenting Reactions after Trauma to assess common parenting reactions after the earthquake (McDermott, B. pers. comm.., 2011).The most commonly reported reaction was being “more protective of my child”. Reactions and recovery children, adolescents and parents So far most of the primary school aged children have experienced difficulties with sleep, behaviour, separation and anxiety. Many children already had difficulties and were known to services. Most children seen by the earthquake response team have lived with property damage and some degree of disruption since the quakes. The predominantly occurring
129
Post Traumatic Stress Disorder symptom is that of hyper arousal. Reassuringly, many children have and are showing signs of recovery between seismic events. The adolescents seen thus far are anxious, withdrawing from their usual activities, unable or reluctant to attend school and often meet criteria for a mood and or anxiety disorders with varying degrees of intrusive Post Traumatic Stress Disorder symptoms. They may or may not have a traumatic earthquake story and they may or may not have experienced property damage, disruption or displacement. Many are otherwise very high functioning. It is our sense, that many of these adolescents would not have been seen by specialist mental health services unless something as terrible as these earthquakes had happened. A number are not showing signs of recovery and some are deteriorating significantly. Parents of referred children and adolescents have experienced varying levels of personal and financial stressors as a result of the earthquakes and seek reassurance, personal emotional support, and parenting strategies for children’s behaviours. Explanation and normalisation of the child’s reactions to the earthquake along with the earthquake response team’s ‘Fuss Busters’ brief behavioural intervention has been sufficient to met the current needs of many families. General advice concerning media exposure of the earthquakes and other disasters and advice on sensitive future planning with children have also been well received. Conclusions Our service experience is one of many in relation to the Canterbury earthquakes. We continue to learn from the children, adolescents and parents attending the earthquake response pathway to better meet their needs. Overall, we have received positive feedback from families and other health professionals about the timely co-ordinated response provided by the child and adolescent mental health service. We have found that offering brief intervention at the ‘font-door’ of the service appears to be valuable. We have found that group programmes were most utilised by children and adolescents already engaged in attending the service. And, we have found that Trauma Focused CBT has been the least utilised treatment at this early stage of our recovery. Like others post natural disaster, we have seen anxiety in younger patients generalised to weather and noise [12] and increased substance use in adolescents [13]. Additional comparisons may emerge, but are presently difficult to identify due to the ongoing and repetitive nature of the the events. Further, questions remain as to the level of unseen distress present in the community, the yet to be seen psychological reactions and the added value of future community outreach. We hope that our experience may shape future planning of child and adolescent mental health services post natural disaster. One year on from our devastating February Earthquake, projects such as Gap filler, Greening the Rubble, and our CBD shipping container shopping mall have injected colour and vibrancy in our city and suburbs. It is a very exciting time to be in Christchurch as we work toward our rebuild and recovery.
130
References
1. Furr, J.M., Comer, J.S., Edmonds, J.M. & Kendall, P.C. Disasters and youth: A meta-analytic examination of posttraumatic stress. Journal of Consulting and Clinical Psychology 2010; 78: 765-780.
2. Franks, B.A. Moving targets: A developmental framework for understanding children’s
changes following disasters. Journal of Applied Developmental Psychology 2011; 32: 58-69.
3. Goenjian, A.K., Walling, D., Steinberg, A.M, Karayan, I., Najarian, L.M., & Pynoos, R. A prospective study of post traumatic stress and depressive reactions among treated and untreated adolescents 5 years after a catastrophic disaster. American Journal of Psychiatry 2005; 162: 2302-2308.
4. Moor, S. and M. Eggleston, Proposal for psychosocial recovery post Christchurch
Earthquakes of February 2011: Child and adolescent mental health services. Christchurch: Canterbury District Health Board 2011.
5. Australian Centre for Posttraumatic Mental Health (2011). Therapist Resource for Trauma-
focused Therapy – Working with Children and Adolescents, 1st Edition.
6. Goodman, A. and R. Goodman. Strengths and Difficulties Questionnaire as a dimensional measure of child mental health. Journal of the American Academy of Child and Adolescent Psychiatry 2009; 48: 400-403.
7. Mellor, D. Furthering the use of the Strengths and Difficulties Questionnaire: Reliability with
younger child respondents. Psychological Assessment 2004; 16: 396-401.
8. Steinberg, A.M., Brymer, M.J., Decker, K.B., & Pynoos, R.S. The University of California at Los Angeles Post-traumatic Stress Disorder Reaction Index. Current Psychiatry Reports 2004; 6; 96–100.
9. Saylor, C.F, Swenson, C. C., Reynolds, S.S., & Taylor, M. The Pediatric Emotional Distress
Scale: A brief screening measure for young children exposed to traumatic events. Journal of Clinical Child Psychology 1999; 28: 70-81.
10. Perrin, S., Meiser-Stedman, R., & Smith, P. The Children's Revised Impact of Event Scale
(CRIES): Validity as a screening instrument for PTSD. Behavioural and Cognitive Psychotherapy 2005; 33: 487 – 498.
11. Kessler, R.C., Barker, P.R., Colpe, L.J. et al. Screening for serious mental illness in the
general population. Archives of General Psychiatry 2003; 60:184–189.
12. Şalcioğlu, E. and Başoğlu, M. Psychological effects of earthquakes in children: prospects for brief behavioural treatment. World Journal of Pediatrics 2008; 4: 165–172.
13. Rowe, C.L., La Greca, A.M., & Alexandersson, A. Family and individual factors associated
with substance involvement and PTS symptoms among adolescents in greater New Orleans after Hurricane Katrina. Journal of Consulting and Clinical Psychology 2010; 78: 806-817.
131
Adapting to increasing bush fire risk: Multi-dimensional bush fire risk reduction strategies
Ms. Jennie Cramp
Technical Officer Bush fire
Ku-ring-gai Council, Sydney, Australia
Dr. Jennifer Scott
Sustainability Program Leader
Ku-ring-gai Council, Sydney, Australia
Paper presented at EARTH: FIRE AND RAIN Australian & New Zealand Disaster and Emergency Management Conference Brisbane – 16 – 18, April 2012
132
Adapting to increasing bush fire risk: Multi-dimensional bush fire risk reduction strategies
Abstract
Reducing bush fire risk exposure is a complex, multi-dimensional proposition. Research indicates hazard reduction burns remain the single-most widely used tool for managing bush fire risk. However, this method is considered to be a high risk, resource intensive operation with relatively short-term benefits and a heavy dependence on favourable weather conditions. Climate change has the potential to result in longer fire seasons, increased frequency of extreme fire-risk days, and increased fire intensity thereby reducing the opportunities to undertake hazard reduction burning. Given this information, it is essential that risk reduction measures adapt accordingly. Ku-ring-gai Council has strategically reviewed its approach to bush fire risk reduction through collaborative research partnerships. Initial climate change adaptation investigations indicated that the existing climate change adaptation models only went part of the way in addressing risks and did little to assist in determining feasible actions. Through a joint research partnership with Macquarie and Bond Universities, Council staff were able to identify tools to more thoroughly evaluate adaptation options for bush fire. A multi-dimensional adaptive form of cost-benefit analysis was used for potential adaptation measures and highlighted the advantages of a number of community resilience initiatives. This adapted form of cost-benefit analysis took into account social, environmental and financial variables, and highlighted the potential for Council to strengthen community capital through a number of innovative social change programs. These initiatives seek to build on existing communication networks and act as supplementary actions to augment and mitigate the issues associated with hazard reduction burning. Council intends to take a more active and participatory role in reducing local bush fire risk by minimising vulnerability of areas of the urban interface most at risk and enabling the Ku-ring-gai community to increase its resilience to bush fire.
Keywords: resilience; bush fire; climate change risk; cost-benefit; community hardening
Introduction
In light of the information now available to local Councils on the risks associated with climate change there is strong incentive to instigate better informed adaptation strategies. The extreme weather events associated with climate change are not new and many lessons can be learned from the success and failure in responding to past extreme weather related events. Climate scientists are becoming ever more certain
133
of the potential for a continuing rise in frequency and intensity of these events. Traditional responses to extreme weather events have been predominantly reactive, indeed the benchmark for a ‘worst case’ scenario has had to be reconsidered in light of events such as the Black Saturday bush fires in Victoria in 2009 and the Queensland floods of 2011. This paper will focus on modelling undertaken by Ku-ring-gai Council that incorporated local climate change vulnerability and resilience factors to estimate the residual risk in the event of a major bush fire. A suite of potential adaptations was then tested to determine their capacity to manage that residual risk and so reduce the likelihood and consequence of bush fire on the local community. A initial broad consultation process was undertaken to confirm the residual risks and identify possible adaptation options. A key objective for the modelling was to create a method to evaluate adaptations according to their capacity to reduce specific Ku-ring-gai relevant bush fire related risks for the least cost. Costs were not only monetary costs but also non monetary costs. After collaborating with Macquarie and Bond Universities, Council staff completed an analytical model that provides decision makers with a highly robust community referenced data set that clearly sets out the expected performance of each adaptation. Each adaptation has strengths and limitations. Knowing this allows decision makers to better understand the range of costs involved, the equity associated with funding such projects and whether unintended consequences will render the outcome unsustainable. This research has been used to develop a program that is aimed at strengthening community cohesion in order to enable communities to be better prepared for and respond to bush fires. It is intended that this program will assist residents in engaging with risk management strategies and reduce their dependence on emergency services and the need for disaster recovery funding. Traditional fire management methods Fire plays an important role in the Australian landscape. As Gondwana fractured its geological bonds approximately 70 million years ago and drifted northward, the Australian environment became increasingly arid. (Specht and Specht in Dargavel, 2005, Steffen et.al. 2009; Adams and Attiwell, 2011). Since this time, much of Australia’s vegetation has had to adapt to drier conditions and an increase in the incidence of fire. It is difficult to distinguish the effects of climate from the anthropogenic influences on fire in the Australian landscape before the arrival of European settlers. Charcoal deposits provide direct evidence of fire activity that demonstrate a relationship with the climate and indirectly suggests that the arrival of Aboriginal people also had an influence on fire. Post European colonisers though attempted to use fire to ‘tame’ the bush (Kershaw, et.al. in Bradstock, 2002) which was very different to the Aboriginal people’s use of fire. Many modern studies have since attempted to interpret these observations (Flannery, 1994, Ryan et.al. 1995, Benson and Redpath, 1997, Clode, 2010).
134
Once European settlers had cleared the land, fire prevention became common practice in settled areas to protect properties and assets altering the long evolved fire regimes. As a result, when fires did occur they were characteristically more intense. Although the fire frequency may have steadily declined since 1750 (Ward, 2001 cited in Clode, 2010), dendrochronological studies show the frequency of fires intense enough to scar trees has significantly increased in this period (Burrows et. al. 1995 in Jurkis et. al. [no date]). With the growth of settlements into towns and cities, the risk of disaster grew. By the mid 20th century the number of severe fires causing devastation across Australia had increased. Forest managers abandoned the practice of fire exclusion in favour of prescribed burning (Jurkis et. al. [no date]; Dexter, 1975). Hazard reduction burning Hazard reduction burning relies on ‘fighting fire with fire’. This technique uses a controlled application of fire under specific environmental conditions to reduce fuel loads in the understorey and midstorey. The likelihood of flames reaching the canopy is then minimised (Tolhurst, 2003 cited in Adams and Attiwell, 2011; Gould et. al. 2007). The primary purpose of hazard reduction burning is to protect life, infrastructure and forest resources. It can also be used for ecological purposes including site preparation, weed removal and wildlife management particularly where habitat fragmentation has destroyed the possibility of natural fire regimes (Fernandes and Botelho, 2003). The spread and intensity of a bush fire is influenced by a number of factors including fuel loads, weather and topography (O’Bryan, 2005). Variability involved in weather, topography, vegetation structure, composition and fuel moistures means quantifying the contribution of each factor is difficult. Less difficult to demonstrate is the relationship between fuel accumulation and fire activity. McArthur (1962) and Dexter, (1975) demonstrated that a direct proportional relationship exists between fuel load and rate of fire spread in that, halving the fuel load will result in the rate of spread being reduced by half (McArthur, 1962 cited in Adams and Attiwell, 2011 and Dexter, 1975). It is acknowledged that reducing exposure to loss from bush fire is a multi-dimensional proposition (Scott and Weston, 2011, Simmons and Adams, 2004). Regardless, hazard reduction burning remains the single-most widely used tool for reducing fuel and managing fire risk (Fernandes and Bothelho, 2003). An examination of the full suite of impacts arising from hazard reduction burns and the capacity of this tool to reduce specific bush fire related risks raises many questions. Despite some benefits in fuel reduction, the value in terms of a reduction in community vulnerability to bush fire is highly debated. Many experts advocate an increase in the area treated by broad acre hazard reduction burning each year as did the 2009 Victorian Bush fires Royal Commission (VBRC). Recommendations by VBRC included an increase to at least 5% of public reserves burnt per annum. This recommendation was not supported by the NSW Government as it encourages “a burn at all costs attitude” and fails to strategically prioritise burn placement (NSW Government, 2010). A strategic approach is supported by research showing the effectiveness of hazard reduction declines rapidly when extreme weather conditions are experienced (McCarthy and Tolhurst, 2001 cited in Fernandes and Botelho, 2003). Most recently, research undertaken on house loss in the 2009 Victorian bush
135
fires found the proximity of houses to an area that had been treated by hazard reduction burning was more important than the total percentage of the landscape burnt. The research highlights a need to shift the emphasis away from broad acre fuel reduction to intensive treatments within 40m of the house (Gibbons et. al. 2012). While a more targeted regime of hazard reduction burning may assist in addressing some concerns such as ecological impact of broad-scale and frequent low-intensity burning, hazard reduction burning is a very problematic tool. Operational, social and environmental issues including its high dependency on favourable weather conditions, high level risks and resource demands, relatively short-term fuel reduction benefits, health impacts, traffic disruption and creation of a false sense of security all render this risk management option as of marginal benefit. (Fernandes and Botelho, 2003; VBRC, 2010; Brandes, 2003; Cheney 1996 cited in Fernandes and Botelho, 2003). It is for these reasons Ku-ring-gai Council decided to look more closely at the potential adaptations for bush fire, realising the need to go beyond the somewhat simplistic approach of burn more bush. In a local context, the Ku-ring-gai Local Government Area, located on Sydney’s North Shore has a history of destructive fires. Large scale, intense wildfires impact the area on average once every 10 years (HKBFMC, 2010). The physical context including development and demographic characteristics contribute to bush fire vulnerability. As in other fire prone areas, the period between fires varies greatly. Over longer period’s community complacency to the risk of fire increases (Clode, 2010). Continuing community education and engagement is critical to preparedness and reducing the potential for destruction in the event of fire (Paton and Wright, 2008). Extreme fire events such as Canberra in 2003 and Victoria in 2009 reinforced the need for defendable space, more appropriate building and construction design, the need to leave early if not prepared and that places of last resort should be provided should other plans fail (Simmons and Adams, 2004; VBRC, 2010). The ‘wicked’ and complex nature of problems facing fire authorities, land managers, scientists and the community surrounding bush fire management are further exacerbated by the improved level of knowledge regarding the impact of climate change on bush fire risk (Taplin et al, 2010). The information available on climate change is sufficient to indicate that due diligence requires better strategic approaches to reduce risks associate with bush fires (Scott and Preston, 2011). These approaches need to be factored into future decision making and then actively pursued to reduce the vulnerability of local community to a future catastrophic fire event as best as Council is able to. Climate change and its impact on fire The timing of fire seasons and ultimately fire-weather risk is determined on a broad scale by climate. The southeast regions of Australia experience a ‘Mediterranean climate’ (Lucas, et. al. 2007). In these regions, the most severe fire danger occurs during summer and autumn where high temperatures and low rainfall are experienced (Lucas, et. al. 2007). However, this risk is exacerbated by climate variability such as that caused by El Niño and La Niña resulting in periodic droughts and wetter seasons and ultimately by a changing global climate.
136
The evidence for global warming caused by increased greenhouse gas concentrations as a result of human activities has been documented by the Intergovernmental Panel on Climate Change (IPCC) (IPCC, 2007). Climate change scientists predict that the weather patterns will continue to alter as a result of increasing CO2 concentrations in the atmosphere in the coming decades (Hennessy, et. al. 2005). In studies conducted by CSIRO, climate models that combine IPCC emissions scenarios and historical weather observations indicate that fire weather conditions are expected to worsen (Hennessy, et. al. 2005). The number of very high and extreme fire danger days could increase by 4-25% by 2020 and 15-70% by 2050. It is also expected that fire seasons are likely to start earlier and become longer, further reducing the window of opportunity for conducting hazard reduction burning. Regional downscaling of climate change models to provide more detailed and accurate expectations of potential impacts have been produced for NSW regions. Expected increases in temperature, evaporation and extreme fire danger days as a result of climatic changes could increase fire frequency and intensity across the region. (DECC NSW 2008 cited in Taplin, et. al. 2010). Given the awareness of the potential increase in future bush fire risk as a result of climate change, Councils have an obligation to acknowledge and assist to reduce the potential of foreseeable harm from occurring. Why Climate Change adaptation? Actions to address climate change include both adaptation and mitigation measures. However, levels of carbon dioxide in the atmosphere have now reached a point that indicate that ‘substantial climate change is inevitable’ (Stern, 2006) In his Climate Change Review, Garnaut (2008) notes that mitigation efforts aiming to reduce or stabilise atmospheric greenhouse gas concentrations will not be achieved in a timeframe to avoid damage from climate change related events. Therefore, while governments need to continue to implement mitigation measures, adaptation is an essential response that will assist in reducing the impact of climate change particularly to those communities and environments that are most vulnerable (Stern, 2006). Adaptation to climate change focuses on reducing the exposure and vulnerability and increasing the resilience to the adverse impacts. Arrangements for prevention, resilience planning and preparedness are increasingly being recognised as a vital part of disaster risk management in terms of climate change planning (IPCC, 2012). Incorporating these factors into climate change strategies and emergency management plans will assist in building local capacity and understanding the strengths and vulnerability of communities (COAG, 2009). Degrees of uncertainty around climate change make it difficult to precisely predict the magnitude, timing and location of an extreme weather event (Garnaut, 2008). However, from a legal perspective, decision makers may be subject to increasing litigation and legal challenges on the basis of failing to act when the risks are known (Scott and Preston, 2011; Garnaut, 2008; England, 2007).Similarly, mal-adaptation – inefficient and improper adaptation actions could face comparable scrutiny. Climate Change Adaptation Modelling Ku-ring-gai Council climate change adaptation model allows Council to better understand the risks arising from climate change and the capacity of various
137
potential adaptations to reduce those risks. Initial investigations into the creation of this model indicated that existing available models only went part of the way in addressing risks and did little to assist in determining feasible actions (Scott and Weston, 2011; Taplin. et.al. 2010). Yet the importance of the issue clearly calls for research to develop models that consider the in detail the costs and benefits of adaptation. A transparent and well researched model to guide decision making may assist in reducing the risks of future litigation and legal challenges in relation to climate change for (Local Government Act 1993; England, 2007, Scott and Preston, 2011). It is the sector of government that is most vulnerable as it is least well resourced but best placed to cope with climate change impacts (England, 2007, Bainbridge, 2008). Logically local government should strive to achieve early adaptation for key risks as an organisational priority. How to manage risk To plan effective risk management options, a model needs to be able to evaluate the capacity an option may have on reducing specific risks, highlight where an option may result in unintended consequences, trade-off’s or unsustainable impacts, inform whether a response will increase resilience and/or reduce vulnerability across financial, social and environmental sectors and satisfy due diligence in regard to the Ecologically Sustainable Development (ESD) principles (Scott and Weston, 2011). Given the very limited funding available to local government, investment in climate change adaptation should consider the following barriers. Local government may:
have limited resources to devote to issues outside the re-current budget items;
have limitations placed on them to raise funds for non re-current budget items; be reliant on competitive grants to support non-recurrent budget items; be heavily dependent on external revenue for infrastructure costs; experience decision making dominated by financial performance; be restrained in its capacity to enforce legislation; be devolved responsibility for state legislation with no commensurate increase
in budget allocation; be already under resourced; need to mediate disparity between political opinion, strident sceptics and the
expert advice; suffer from slow, unresponsive and guarded political decision making in the
face of scientific uncertainty; be more comfortable with tried and tested methods with quantified results; encounter reporting of unreliable and disingenuous facts on an issue.
With these issues in mind, Ku-ring-gai then investigated what key questions needed to be answered by an adaptation model. Scott and Weston (2011) developed the following criteria which helped to refine the Ku-ring-gai model. These criteria have been used to discuss the Ku-ring-gai climate change adaptation model. Criteria 1 - How does the model identify risks?
138
Ku-ring-gai Council undertook extensive research on the direct and indirect risks arising from climate change supported by credible scientific research, such as the IPCC, CSIRO, Bureau of Meteorology and the NSW Office of Environment and Heritage (OEH) (formally known as DECCW). To improve model predictions of climate change forecasts, Council collaborated with Macquarie and Bond Universities to apply a regional downscaling method that focused on localised changes in weather that affected bush fire behaviour (Taplin et.al. 2010). The statistical downscaling of models depends fundamentally on high quality, high resolution and comprehensive observations to inform statistical approaches and to confirm error reductions in models (KMC, 2010). The downscaling indicates that Ku-ring-gai is likely to experience a warmer climate with fewer extreme cold days and increasing number and duration of extreme heat days. Winters will be drier with spring and summer featuring increased rainfall, mostly in heavy storm events. Bush fire weather is intensified, drought periods and water shortages increase and heat stress will likely impact people during prolonged periods of extreme warm temperatures. Council conducted two community workshops to discuss the climate change weather predictions and the impact of potential consequences on Ku-ring-gai. Participants were selected from local business, government agencies, emergency services and non-government organisations. Those involved ranked risks according to the vulnerability of Ku-ring-gai to a particular change and the magnitude of the consequence of that change. Bush fire frequency and intensity were identified by participants as the highest risk and priority for Ku-ring-gai (KMC, 2010). As mentioned earlier, Ku-ring-gai has experienced numerous fires in the past. Other factors that make Ku-ring-gai particularly vulnerable to fire include 1,100 hectares (ha) of Council owned bushland. This area is divided into multiple reserves across the LGA. Approximately 18,000 ha of additional bushland, the majority of which is National Parks is contiguous with the LGA. Development in Ku-ring-gai is restricted to low density residential which is highly concentrated on the ridge tops. These are divided by steep valleys of dense sandstone dominated forest. There are approximately 13,700 houses in bush fire prone areas spread over 91km of bushland interface. Limited road access to these ‘fingers’ of development is a cause for concern in terms of evacuation capacity. In addition an ageing population and older brick and tile housing stock with large gardens containing flammable vegetation exacerbate the fire risk. Fire agencies located within the LGA include one Rural Fire Service brigade and one NSW Fire and Rescue unit. Criteria 2 - Is the capacity to adapt to the identified risks considered? The workshop participants noted that the risks identified above will have an effect on human health and safety, the environment, especially critically endangered species, the local economy and the administration and operation of Council. Although Council is restrained by its own funding, its community is the least disadvantaged LGA in Australia according to the Index of Relative Socio-Economic Disadvantage (SEIFA) (ABS, 2006). This is one of the major factors that make Ku-ring-gai resilient to the impact of bush fire. Data from the Australian Bureau of Statistics (2006) and stakeholders involved in community consultation have indicated
139
that among many resilience factors, Ku-ring-gai has higher levels of education, greater disposable income per capita, high levels of property insurance cover, and higher volunteer rates in community networks and programs than other LGA’s in NSW. Communication networks and health care systems are also widely accessible throughout Ku-ring-gai (KMC, 2010). Criteria 3 - Is there consistency with current reporting protocols? Local governments are required to maintain an integrated reporting process, recognising that plans like communities do not exist in isolation (DLG, 2009). The aim is to capture community priorities for the future and plan strategies to meet these goals and achieve long-term sustainability objectives. The integrated reporting framework consists of a 20 year community strategic plan linked to a five year delivery program and a one year operational plan. Adaptation planning must ensure that community and organisational objectives and selected adaptations are consistent. It is essential that Council’s recognise that secondary impacts of climate change can impact communities, the environment, infrastructure and utilities to name but a few. Through the community strategic planning process Ku-ring-gai has incorporated its need to mitigate and adapt in response to climate change. Through a climate change policy Council has initiated many greenhouse mitigation projects to reduce greenhouse gas emissions and has identified the risks of climate change and specific actions to reduce the impact through the climate change adaptation model. The aim is to continue to embed prioritised adaptations into core functions and work plans. Criteria 4 - How is uncertainty dealt with? The Local Government Act 1993 sets out a charter for Councils to follow. Within this charter lies the application of the Precautionary Principle: “Where there are threats of serious or irreversible environmental damage, lack of full scientific certainty should not be used as a reason for postponing measures to prevent environmental degradation.’ (Cole, 2005). Given the vulnerability of Council to climate change and its potential ramifications, it makes sense to analyse potential adaptation options for their capacity to achieve their intended purpose; that is to firstly reduce risk and secondly limit unintended effects that occur in every change process. Where potential impacts are sufficiently uncertain (such as is the case with regional Climate Change modeling) it is wise to apply the Precautionary Principle (Cole, 2005). The Ku-ring-gai model required depth to provide a full account of the financial cost benefit over time, and breadth to encapsulate the triple bottom line and the capacity to reduce vulnerability and increase resilience. The tools that proved useful from the collaborative research with Macquarie and Bond Universities were:
- Poisson Distribution modelling to identify future trends based on historical records;
140
- Bayesian Theory application to supplement the paucity of historical data with expert opinion regarding the influence of altered weather patterns on bush fire hazard and impact; and
- Borda Count Method to compare potential adaptation against each other to create a priority ranking according maximum benefit versus monetary and non monetary cost.
The research team re-evaluated the traditional cost benefit method for use in the model and found it inadequate to determine non monetary values. The conceptual basis of cost benefit was applied to different criteria to evaluate the most appropriate responses to climate change. Firstly, costs were deemed to be the triple bottom line outcome with the least negative effect occurring from the implementation of each option. The benefit was the capacity of each option to reduce the risks specific to each severe weather related event. For bush fire risk reduction performance the following criteria were used to assess the benefit of each adaptation option:
i. Capacity to reduce or resist radiant heat ii. Capacity to assist fire fighting ability iii. Capacity to build knowledge and awareness iv. Capacity to reduce or resist ember attack v. Capacity to reduce material flammability vi. Capacity to improve water supply vii. Capacity to reduce fuel load and transference of fire into the urban area viii. Capacity to reduce the destructive effect of fire
Rating each potential adaptation for triple bottom line impact involved the creation of a set of criteria that reflected the financial, social and environmental values specific to Ku-ring-gai. Each adaptation was rated according to their potential positive or negative effect on values cited by the local community as worthy of preservation and enhancement. Those options that exhibited a capacity to reduce risk across more than one type of severe weather event emerged as the leading investment option in many cases. This re-orientation of the traditional cost benefit tools makes it much more relevant to real life and importantly, to sustainability.
Criteria 5 - How effectively does the model enable action by a local government? The Ku-ring-gai Model is guided by the community values and aspirations for the future. A visioning exercise as part of the Community Strategic Plan was inter-generational so the aspirations contained within the Council Vision Report pertain to both current and future generations. Enabling sustainable change to reduce climate change risk to the local community means putting adaptation implementation firmly on Council’s operational plan plus using the information from the model to justify grant submissions to implement targeted adaptations. The limitations of the Ku-ring-gai model itself probably centre of the broad scale of analysis which comes at the expense of ‘in depth’ analysis. While the Macquarie Bond collaboration with Council produced an ‘in depth’ method for financial analysis of investment in climate change, it proved so resource intensive and highly skilled that only very costly adaptations warrant such investigation. The Ku-ring-gai Model allows many options to be
141
compared relatively easily but it must be acknowledged that the results cannot accurately forecast return on financial investment. The Climate Wise Communities Adaptation Option: The cost-benefit analysis by the Ku-ring-gai Model highlighted the potential for Council to strengthen community capital through a number of social change programs. Some of the high priority actions for Council surrounded the need to conduct community and agency education programs, and support vulnerable residents. Community actions that ranked highly included improving the resilience of housing stock with fire resilient products that meet Australian Standards, volunteering in community programs, assisting neighbours and building communication networks to assist with psychological preparedness. One of the leading adaptation options to emerge from the Ku-ring-gai Model is the development a community based resilience program. This adaptation option is designed to work as a ‘house buddy program’ called Climate Wise Communities (CWC) involving Council initiated community capacity building. The program will take advantage of networking opportunities to provide education, resilience and support services to the wider community in areas identified as likely to be more vulnerable risks posed by extreme weather events. The aim will be to reduce risk exposure and improve resilience to three of the four climate change risks in Ku-ring-gai, i.e. storms, extreme heat and bush fire. In its first phase the project seeks to identify the most highly vulnerable residents on the bushland interface, particularly those whose risk exposure is remarkable due to their location, property/ building type, higher risk demographic (e.g. young families, impaired physical ability, non-English speaking background), and by high need for assistance to evacuate. The CWC program seeks to develop neighbourhood response capacity primarily to the threat of bush fire but also where appropriate to heat stress and storms. It will be possible to build resilience to extreme events by:
encouraging neighbourhoods to engage in self assessment and risk management strategies;
improve efficiency in households with preventative measures; enhance neighbourhood cohesion and networks; raise awareness of risks and how to manage these; reduce the severity and duration of impacts when extreme events do occur; reduce dependence on emergency services on days where these services
may be compromised due to the scale and nature of the extreme event; reduce dependence on emergency declaration funding from state and federal
resources. The CWC program will focus on the development of linkages within the community to ensure everyone in an at risk location is engaged in building their own resilience capacity. Resilience capacity will include adopting technology to make their home more fire resilient, understand how their land management practices put not only
142
themselves but their neighbours at risk, getting to know their neighbours and where appropriate participating in neighbourhood training exercises to ensure the whole street is prepared in advance of an event, learn who in the street needs help in keeping their property hazard free and who may need assistance to evacuate in the event of the need occurring. In tandem with this program is a secondary program that seeks to build more resilient, safer and comfortable places of last resort for the community to retreat to in the event of a disaster. For example Council is currently doing urban renewal around neighbourhood shopping centres. Many of these centres are located in bushland interface areas and with some careful design and capacity building could become a neighbourhood safer place. There is evidence that communities with strong networks have an integral role in building resilience to natural disasters (Tompkins, 2005; Paton and Johnston, 2001; Murphy, 2007; Kim, 2010). The concept of social or community capital has been discussed by Murphy (2007) who emphasises the role of community members as ‘active agents’ in emergency management as their social connections, networks and involvement in local activities can decrease their vulnerability to natural hazards. Each year governments invest a significant amount of resources that aim to convince individuals and households to prepare for disasters. Much of this responsibility falls to local governments to protect their residents, properties and community facilities. However, it is up to the individual to make the final decision on their actions during an emergency. It is essential to recognise that there are practical and psychological components to preparedness. Preparing for the possibility of a hazard such as a bush fire initially involves an individual admitting that they could be at risk. Research suggests people who accept the risk and prepare in advance will better cope with the stress of a bush fire (APS, 2009). The psychology surrounding the human response to fire is discussed by Clode (2010). She relates complex neurological processes linked to ancient survival skills of flee, fight or defend that kick in during an emergency and prevent us from thinking through complex problems logically. She concludes that if we don’t have a plan for survival then during a disaster we are less capable of making logical, sensible decisions that could save our lives (Clode, 2010). Fire agencies and other emergency management organisations have generally recognised that reducing the risk from bush fire, or other natural hazards, is greatly aided by community preparedness (Elsworth et. al. 2008). The importance of community preparedness is emphasised by the push from all fire agencies across Australia for vulnerable households to complete a bush fire survival plan. In completing a bush fire survival plan, key messages include acting decisively, understanding the level of risk, and documenting plans for leaving early or being sufficiently prepared to stay and defend. The intention being that people following a well thought out plan will avoid having to rely on making complex and often poor decisions at times of high stress. Research following Black Saturday in Victoria 2009 indicates that there is a large disparity between people’s intentions and their actual response in the event of an emergency, even with a written plan (Whittaker and Handmer, 2010). This emphasises a need for continued education to improve awareness and planning for
143
natural hazards especially for those more vulnerable. It also provides a good opportunity to utilise existing community networks or social capital to improve message transference and reach the wider community. Other successful community programs, that function in a similar way to CWC include Neighbourhood Watch crime prevention and Meals on Wheels for the housebound. Both these programs involve volunteers ‘looking out for each other’ and ‘promoting closer ties’ either to minimise preventable crime or by assisting the aged or disabled to maintain some independence by staying in their homes (Meals on Wheels Australia, 2012; Neighbourhood Watch Victoria, 2011).
Conclusion
Traditional measures applied to reduce the risks associated with bush fire have proved inadequate in the face of past large scale, catastrophic fires. The potential for this type of fire to occur in areas such as Ku-ring-gai is evidenced by a long history of large scale destructive fires in the area. A catastrophic fire on the scale of the Black Saturday fires is increasingly possible given the influence of climate change in future fire seasons. Traditional bush fire risk management strategies require augmenting in order to deal with this increase in catastrophic risk.
A multi-dimensional adaptive form of cost-benefit analysis has proved instructive in evaluating the potential of specific adaptation measures and highlights the advantages of implementing a number of community focused resilience initiatives. This adjusted form of cost-benefit analysis considers social, environmental and financial variables, and examines the potential for Council to strengthen community resilience through a number of innovative social change programs. These initiatives seek to build on existing communication networks and act as supplementary actions to augment actions already in place and mitigate the issues associated with hazard reduction burning. Council intends to take a more active and participatory role in reducing local bush fire, storm and extreme heat risks before they impact the local community.
References
ABS 2006. Socio-Economic Indexes for Areas (SEIFA), Australian Bureau of Statistics, accessed 16 January 2012, <http://profile.id.com.au/Default.aspx?id=236&pg=240&gid=10&type=enum>.
Adams, M. Attiwell, P. 2011. Burning Issues, CSIRO Publishing, Victoria.
Australian Psychological Society 2009. Psychological preparedness can save lives during bush fires, media release, accessed 23 January 2012, <http://www.psychology.org.au/Assets/Files/MR-Psychological-Preparedness-25Feb09.pdf>.
144
Bainbridge, M. 2008. Western Australian Local Government Association Submission to the Standing Committee on Climate Change, Water, Environment and the Arts – an inquiry into climate change and environmental impacts on coastal communities, viewed 24 May 2010 <http://www.aph.gov.au/house/committee/ccwea/coastalzone/subs/sub053.pdf>.
Benson, J. S. Redpath P. A. 1997. The nature of pre-European native vegetation in south-eastern Australia: a critique of Ryan, D.G., Ryan, J.R. and Starr, B.J. (1995) The Australian Landscape – Observations of Explorers and Early Settlers, Cunninghamia, vol. 5, no. 2, pp. 285-328.
Brandes, I. 2003. Burning questions: Australia’s bush fire policy, The Drawing Board: An Australian Review of Public Affairs, The University of Sydney.
Clode, D. 2010. A Future in Flames, Melbourne University Press, Victoria.
COAG 2009. National Strategy for Disaster Resilience. Council of Australian Governments. Cole, D. 2005. The Precautionary Principle - Its Origins and Role in Environmental Law, Environmental Defenders Office of South Australia, viewed 28 May 2010 <http://www.edo.org.au/edosa/research/david%20cole%20on%20precautionary%20principle.doc>. Dexter, B. D. 1975. From Fire Control to Fire Management, Extract from Victoria’s Resources.
DLG 2009. Planning and Reporting Guidelines for local government in NSW, Department of Local Government New South Wales.
Elsworth, G. Anthony-Harvey-Beavis, K. Rhodes, A. 2008. What should community safety initiatives for bush fire achieve?, in J. Handmer & K. Haynes (eds.), Community Bush fire Safety, CSIRO Publishing, Victoria.
England, P. 2007. Climate Change – what are local governments liable for?, Urban Program, Issues Paper 6, Griffith University March 2007, viewed 23 May 2010 <http://www.griffith.edu.au/__data/assets/pdf_file/0011/48566/urp-ip06-england-2007.pdf>. Fernandes, P. M. Botelho, H. S. 2003. A review of prescribed burning effectiveness in fire hazard reduction, International Journal of Wildland Fire, vol. 12, pp. 117-128. Flannery, T. 1994. The Future Eaters, Reed Books, Melbourne. Garnaut, R. 2008. The Garnaut Climate Change Review, Cambridge University Press Melbourne, viewed 23 May 2010 <www.garnautreview.org.au>.
145
Gibbons, P. van Bommel, L. Gill, M. Cary, G. J. Driscoll, D. A. Bradstock, R. A. Knight, E. Moritz M. A. Stephens, S. L. Lindenmayer, D. B. 2012. Land Management Practices Associated with House Loss in Wildfires, PLoS ONE, vol. 7, no. 1 pp. 1-7.
Gould, J. S. 2007. Fire Management – An Integral Part of Forest Management, in: J. Croke, I. Takken, S. Mockler (eds.), Erosion in Forest: Proceedings of the Forest Workshop. Cooperative Research Centre for Catchment Hydrology.
Hennessy, K. Lucas, C. Nicholls, N. Bathols, J. Suppiah, R. Ricketts, J. 2005. Climate change impacts on fire-weather in south-east Australia, CSIRO Australia.
HKBFMC 2010. Hornsby Ku-ring-gai Bush fire Risk Management Plan, Hornsby Ku-ring-gai Bush fire Management Committee.
IPCC 2012. Summary for Policymakers. In: Managing the risks of extreme events and disasters to advance climate change adaptation [Field, C. B. Barros, V. Stocker, T. F. Qin, D. Dokken, D. J. Ebi, K. L. Mastrandrea, M. D. Mach, K. J Plattner, G-K. Allen, S. K. Tignor, M. Midgley, P. M. (eds.)]. A Special Report of Working Groups I and II of the Intergovernmental Panel on Climate Change. Cambridge University Press, Cambridge, UK, and New York, NY, USA, pp. 1-19.
IPCC 2007. Intergovernmental Panel on Climate Change Fourth Assessment Report, viewed 23 May 2010 <www.ipcc.ch>.
Jurskis, J. Bridges, B. de Mar, P. [No date]. State Forests of NSW Refereed paper, Fire management in Australia: the lessons of 200 years.
Kim, Y. C. 2010. Communication, neighbourhood belonging and household hurricane preparedness, Disasters, vol. 34, no. 2, pp. 470-488.
KMC 2010. Climate Change Adaptation Strategy, Ku-ring-gai Council.
Local Government Act 1993
Lucas, C. Hennessy, K. Mills, G. Bathols, J. 2007. Bush fire Weather in Southeast Australia: Recent Trends and Projected Climate Change Impacts, Bush fire Cooperative Research Centre, Victoria.
Meals on Wheels Australia 2012. Australian Meals on Wheels Association, viewed 23 January 2012, <http://www.mealsonwheels.org.au/Home.aspx>.
Murphy, B. L. 2007. Locating social capital in resilient community-level emergency management, Natural Hazards, vol. 41, pp. 297-315. Neighbourhood Watch 2011. Neighbourhood Watch Victoria, viewed 23 January 2012, <http://www.nhw.com.au/Home>.
NSW Government 2010. NSW Government response to the final recommendations of the 2009 Victorian Bush fires Royal Commission, NSW Government.
O’Bryan, D. 2005. The Science of Bush fire Behaviour: The Search for Answers Volume 1, Papyrus Publishing, Australia.
146
Paton, D. & Johnston, D. 2001. Disasters and communities: vulnerability, resilience and preparedness, Disaster Prevention and Management, vol. 10, no. 4, pp. 270-277.
Paton, D. & Wright, L. 2008. Preparing for bush fires: the public education challenges facing fire agencies, in J Handmer & K Haynes (eds.), Community Bush fire Safety, CSIRO Publishing, Victoria.
Ryan, D..G Ryan, J. E. Starr, B. J. 1995. The Australian Landscape – observations of explorers and early settlers, Murrumbidgee Catchment Management Committee, Wagga Wagga NSW.
Scott, J. & Preston, J. 2011. When is a climate change adaptation model good enough to inform public policy? Climate change adaptation risk management in local government, Local Government Law Journal, vol. 16, part 3.
Scott, J. & Weston, C. 2011. The pitfalls and promises of climate adaptation planning, Australasian Journal of Environmental Management, vol. 18, pp. 73-87.
Simmons, D. Adams, R. 2004. On the edge: how well do fire mitigation strategies work on the urban fringe?, The Victorian Naturalist: Fire Symposium Special Issue, vol. 121, no. 3, pp. 131-135.
Specht, A. Specht, R. L. 2005. Historical biogeography of Australian forests, in J. Dargavel (ed.), Australia and New Zealand Forest Histories Short Overviews, Australian Forest History Society Inc.
Steffen, W. Burbidge, A. A. Hughes, L. Kitching, R. Lindenmayer, D. Musgrave, W. Stafford Smith, M. Werner, P. A. 2009. Australia’s Biodiversity and Climate Change, CSIRO Publishing, Victoria.
Stern, N. 2006. What is the Economics of Climate Change?, World Economics, vol. 7, no. 2.
Taplin, R. Henderson-Sellers, A. Trueck, S. Mathew, S. Weng, H. Street, M. Bradford, W. Scott, J. Davies, P. Hayward L. 2010. Economic Evaluation of Climate Change Adaptation Strategies for Local Government: Ku-ring-gai Council Case Study, Macquarie University, Sydney.
Tompkins, E. L. 2005. Planning for climate change in small islands: insights from national hurricane preparedness in the Cayman Islands, Global Environmental Change, vol. 15, no. 2, pp. 139-149.
VBRC 2010. Final Report Summary, 2009 Victorian Bush fires Royal Commission, Government Printer for the State of Victoria.
147
Whittaker, J. & Handmer, J. 2010. Community bush fire safety: a review of post-Black Saturday research, The Australian Journal of Emergency Management, vol. 25, no. 4, pp. 7-13.
148
Learning for disaster resilience
Neil Dufty
Principal
Molino Stewart Pty Ltd, Parramatta, NSW, Australia
Paper presented at EARTH: FIRE AND RAIN Australian & New Zealand Disaster and Emergency Management Conference Brisbane – 16 – 18, April 2012
149
Learning for disaster resilience
Abstract Is emergency management sufficient to build disaster resilient communities? This paper reviews current research and Australia’s National Strategy for Disaster Resilience which indicates that the fields of ‘disaster risk reduction’ and ‘community development’ should be joined with ‘emergency management’ to form a disaster resilience-building triumvirate. Using this strategic alliance, the paper then shows how learning is a critical component of building disaster resilience through ‘communities of practice’. It also investigates how people and communities learn before, during and after disasters. The paper concludes by outlining a new approach - ‘Learning for Disaster Resilience’ - that is designed to develop and activate ‘disaster resilient learning communities’ in line with the strategic triumvirate.
Keywords: resilience, education, engagement, communications, learning, communities
Introduction
I've seen fire and I've seen rain I've seen sunny days that I thought would never end I've seen lonely times when I could not find a friend
But I always thought that I'd see you again
- James Taylor, ‘Fire and Rain’
The above verse from the appropriately named song for this conference provides an entrée to the concept of resilience: although there might be ‘ups and downs’ in life, the resilient are able to return to normal functioning regardless (a liberal interpretation, especially on the last line!). And like the song, this paper is about connections between people - in this case, how communities learn to resist, recover and improve from, the impacts of disasters. The paper investigates whether emergency management by itself is sufficient to build community disaster resilience. As a result, the paper posits that the field of ‘community development’ should be integrated with ‘disaster risk reduction’ and ‘emergency management’ to build disaster resilient communities. Based on this strategic alliance, it argues that ‘disaster resilience learning communities’ should be developed and that education, communications and engagement (ECE) programs run by emergency agencies be re-scoped and further refined to this end.
150
Disaster resilience
The concept of resilience has been in the disaster management literature since the 1980s (Wildavsky, 1988) but has come into vogue as an overriding goal in the past ten years. This has been mainly due to its importance as a factor in achieving sustainability (Dovers, 2004), its role as a strategy in climate change adaptation (Gero, Méheux and Dominey-Howes, 2010), and as a perceived future requirement for communities based on learnings from disasters such as 9/11 and Hurricane Katrina (Boin, Comfort and Demchak, 2010).
Like the term ‘sustainability’, there are a multitude of definitions of ‘disaster resilience’. The original notion of resilience, from the Latin word resilio, means to ‘jump back’ or ‘bounce back’. According to de Bruijne, Boin and van Eeten (2010), “In the past decades, research on resilience has been conducted at various levels of analysis – the individual level, the group level, and the organizational or community level – in a wide variety of disciplines including psychology, ecology, organization and management sciences, group/team literature and safety management”.
Several researchers (e.g. Longstaff, 2005) have made an interdisciplinary effort to further refine the concept of resilience in relation to disaster management. However, a dilemma for researchers and planners has been whether disaster resilience should involve the ability of a community to ‘bounce back’ (i.e. resume its normal functioning) as per the original notion, or to ‘bounce forward’ after a disaster (Manyena et al, 2011). Some researchers such as Paton (2006) opt for the latter notion arguing that the ‘bounce back’ idea neither captures the changed reality after a disaster, nor encapsulates the new possibilities wrought by a disaster.
This paper supports the ‘bounce forward’ notion based on Paton’s reasoning. It defines disaster resilience as the ability of a community to not only resist and recover from a disaster, but also to adapt to the changes that the event may cause. It includes the ability of a community to learn from the disaster and to improve its networks, systems and capabilities for the next event.
Figure 1 shows theoretically what might be the difference between, in this case, a flood-resilient community and a less resilient community. Note that the y-axis is ‘community functioning’ – how well individuals and organisations are performing their normal functions.
As shown in Figure 1, the ‘resilient community’ will often experience less disaster impacts to its normal functioning, while the ‘less resilient community’ will experience greater impacts to the same level of flooding. It is also clear that the less resilient community will take longer to recover i.e. to return to normal functioning. Furthermore, the resilient community will most likely improve its functioning especially through learning from the flood disaster.
151
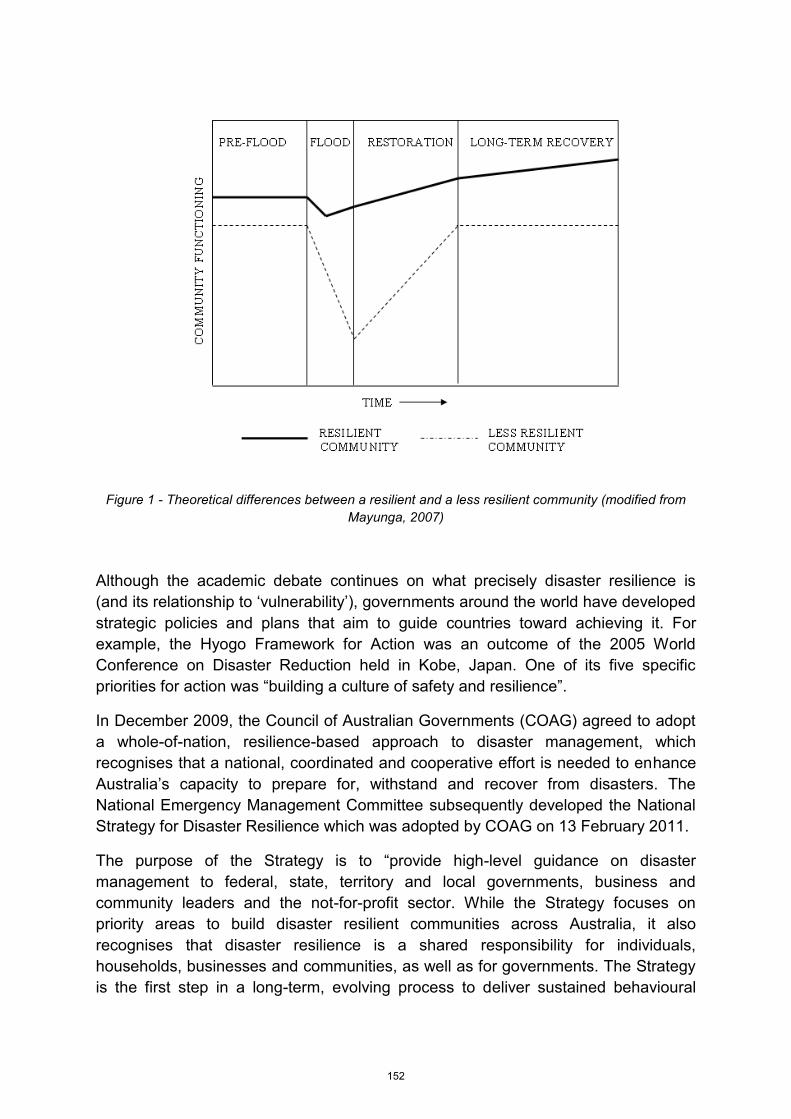
Figure 1 - Theoretical differences between a resilient and a less resilient community (modified from Mayunga, 2007)
Although the academic debate continues on what precisely disaster resilience is (and its relationship to ‘vulnerability’), governments around the world have developed strategic policies and plans that aim to guide countries toward achieving it. For example, the Hyogo Framework for Action was an outcome of the 2005 World Conference on Disaster Reduction held in Kobe, Japan. One of its five specific priorities for action was “building a culture of safety and resilience”.
In December 2009, the Council of Australian Governments (COAG) agreed to adopt a whole-of-nation, resilience-based approach to disaster management, which recognises that a national, coordinated and cooperative effort is needed to enhance Australia’s capacity to prepare for, withstand and recover from disasters. The National Emergency Management Committee subsequently developed the National Strategy for Disaster Resilience which was adopted by COAG on 13 February 2011.
The purpose of the Strategy is to “provide high-level guidance on disaster management to federal, state, territory and local governments, business and community leaders and the not-for-profit sector. While the Strategy focuses on priority areas to build disaster resilient communities across Australia, it also recognises that disaster resilience is a shared responsibility for individuals, households, businesses and communities, as well as for governments. The Strategy is the first step in a long-term, evolving process to deliver sustained behavioural
152
change and enduring partnerships” (Attorney-General’s Department website: www.ag.gov.au).
The Strategy (COAG, 2011) identifies seven groups of actions to build community disaster resilience in Australia.
1. Leading change and coordinating effort 2. Understanding risks 3. Communicating with and educating people about risks 4. Partnering with those who effect change 5. Empowering individuals and communities to exercise choice and take
responsibility 6. Reducing risks in the built environment 7. Supporting capabilities for disaster resilience.
Disaster resilience-building fields
Is disaster and emergency management sufficient to build community disaster resilience in line with the Strategy? There is widespread recognition, particularly after recent disasters around the world, that structural and non-structural modifications related to disaster and emergency management can only provide certain levels of resilience and that the ‘residual risk’ is largely carried by the potentially impacted communities. Analysis of the seven groups of actions identified in the Strategy suggests that a community ‘element’ is required in addition to the fields of disaster risk reduction and emergency management. For example, the actions of “communicating with and educating people about risks” and “empowering individuals and communities to exercise choice and take responsibility” call for individual and community participation. Moreover, the Strategy promotes “shared responsibility for individuals, households, businesses and governments”, thus requiring community participation to build resilience. Recent research also supports the coupling of community-based processes (here called ‘community development’) with disaster risk reduction and emergency management. ‘Community development’ is a broad term that encompasses “the deliberate attempt by community people to work together to guide the future of their communities, and the development of a corresponding set of techniques for assisting community people in such a process” (Bennett, 1973). A more recently coined and similar process is ‘community capacity-building’. According to CCS Strategic Management (2008), community development outcomes can include:
People participating in social activities to overcome social isolation Mutual support Individuals developing self-esteem, confidence and assertiveness
153
Increased participation in political and citizenship activities Heightened community satisfaction Increased safety and security More effective community satisfaction.
Psychological, sociological and education actions are required to achieve community development outcomes specifically related to building disaster resilience. There has been extensive psychological research in the past ten years into individual aspects of disaster resilience. For example, Paton et al (2003) developed and tested a psychological model for individual preparedness that consisted of three developmental stages. Psychologists have also extensively researched and developed models for the post-disaster recovery of individuals (e.g. Whittle et al, 2010). However, according to recent research into disaster resilient communities, not only is appropriate individual participation required, but also collective action. Several researchers (e.g. Aldrich, 2010; Chamlee-Wright, 2010) believe that the formation of ‘social capital’ is a critical factor in the ability of a community to quickly recover and ‘bounce forward’ after a disaster. Social capital has been defined as the “networks, norms, and social trust that facilitate coordination and cooperation for mutual benefit” (Putnam, 1995). It is generally agreed that there are three distinct forms of social capital: bonding, bridging and linking. Bonding social capital grows from organisations and activities connecting similar individuals who often live in close proximity to each other. Bridging activities and organisations, in contrast, bring together individuals from different neighbourhoods, ethnicities and races. According to Szreter and Woolcock (2004) linking social capital is composed of “norms of respect and networks of trusting relationships between people who are interacting across explicit, formal or institutionalized power or authority gradients in society”. Where bridging social capital connects individuals of approximate equal social status, linking social capital connects those of unequal status, providing them with access to power. Research into the recovery after the 2004 Indian Ocean tsunami (e.g. Aldrich, 2011a) and Hurricane Katrina (e.g. Boettke et al, 2007) has shown the benefits of social capital in providing resources for a faster and more efficient recovery. However, there were some minor negative effects found. For example, in villages in Southeast India impacted by the 2004 tsunami, although high levels of social capital reduced barriers to collective action for members of the uur panchayats (hamlet councils) and parish councils speeding up their recovery and connecting them to aid organisations, at the same time social capital reinforced obstacles to recovery for those outside of these organisations such as women, Dalits, migrants, and Muslims (Aldrich, 2011a).
154
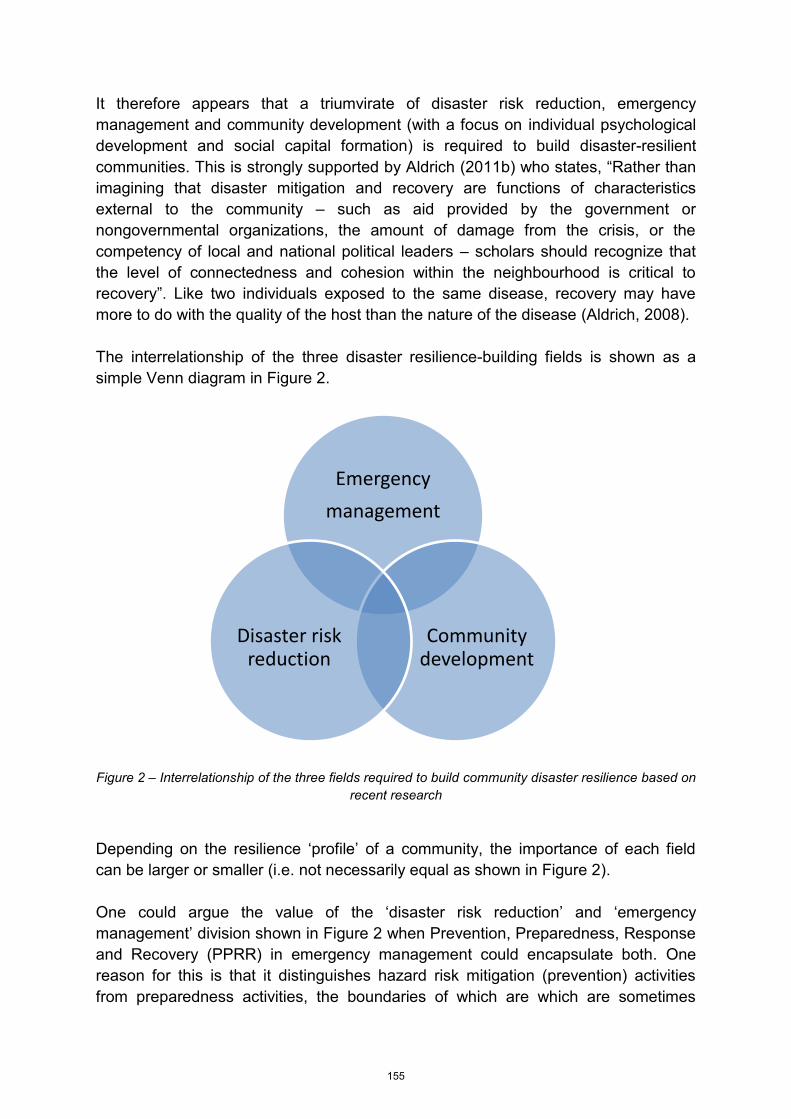
It therefore appears that a triumvirate of disaster risk reduction, emergency management and community development (with a focus on individual psychological development and social capital formation) is required to build disaster-resilient communities. This is strongly supported by Aldrich (2011b) who states, “Rather than imagining that disaster mitigation and recovery are functions of characteristics external to the community – such as aid provided by the government or nongovernmental organizations, the amount of damage from the crisis, or the competency of local and national political leaders – scholars should recognize that the level of connectedness and cohesion within the neighbourhood is critical to recovery”. Like two individuals exposed to the same disease, recovery may have more to do with the quality of the host than the nature of the disease (Aldrich, 2008). The interrelationship of the three disaster resilience-building fields is shown as a simple Venn diagram in Figure 2.
Figure 2 – Interrelationship of the three fields required to build community disaster resilience based on
recent research
Depending on the resilience ‘profile’ of a community, the importance of each field can be larger or smaller (i.e. not necessarily equal as shown in Figure 2). One could argue the value of the ‘disaster risk reduction’ and ‘emergency management’ division shown in Figure 2 when Prevention, Preparedness, Response and Recovery (PPRR) in emergency management could encapsulate both. One reason for this is that it distinguishes hazard risk mitigation (prevention) activities from preparedness activities, the boundaries of which are which are sometimes
Emergency
management
Community development
Disaster risk reduction
155
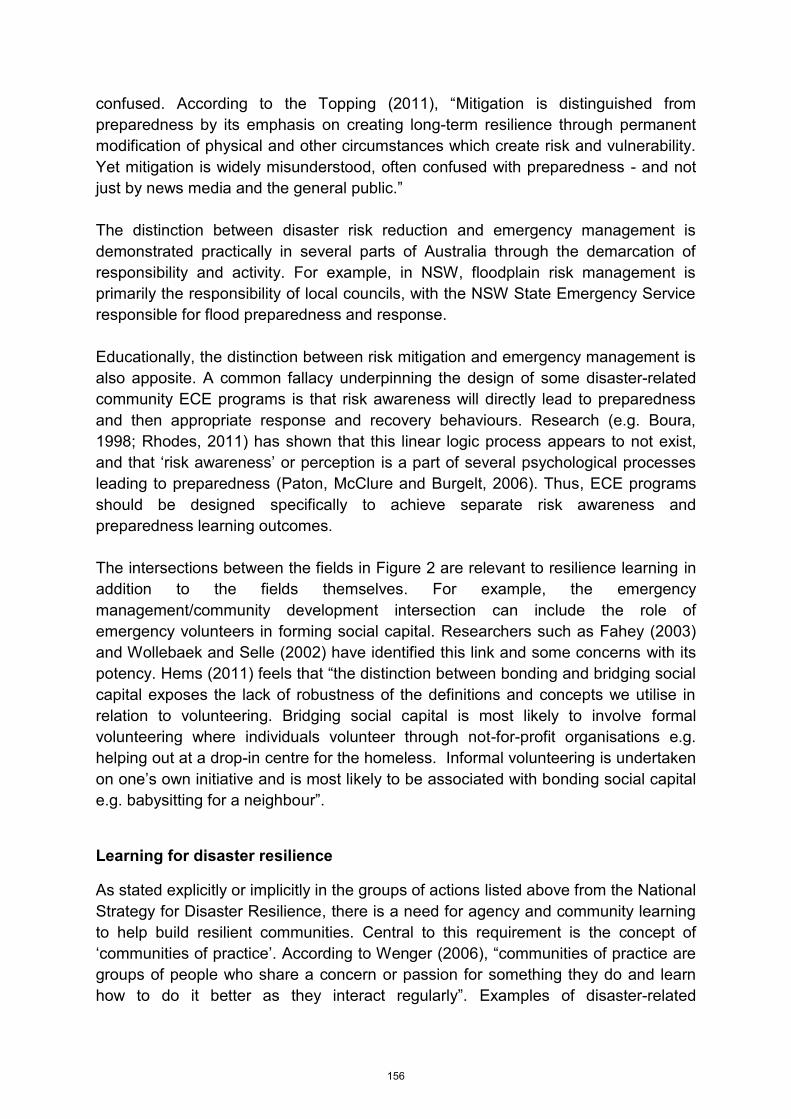
confused. According to the Topping (2011), “Mitigation is distinguished from preparedness by its emphasis on creating long-term resilience through permanent modification of physical and other circumstances which create risk and vulnerability. Yet mitigation is widely misunderstood, often confused with preparedness - and not just by news media and the general public.” The distinction between disaster risk reduction and emergency management is demonstrated practically in several parts of Australia through the demarcation of responsibility and activity. For example, in NSW, floodplain risk management is primarily the responsibility of local councils, with the NSW State Emergency Service responsible for flood preparedness and response. Educationally, the distinction between risk mitigation and emergency management is also apposite. A common fallacy underpinning the design of some disaster-related community ECE programs is that risk awareness will directly lead to preparedness and then appropriate response and recovery behaviours. Research (e.g. Boura, 1998; Rhodes, 2011) has shown that this linear logic process appears to not exist, and that ‘risk awareness’ or perception is a part of several psychological processes leading to preparedness (Paton, McClure and Burgelt, 2006). Thus, ECE programs should be designed specifically to achieve separate risk awareness and preparedness learning outcomes. The intersections between the fields in Figure 2 are relevant to resilience learning in addition to the fields themselves. For example, the emergency management/community development intersection can include the role of emergency volunteers in forming social capital. Researchers such as Fahey (2003) and Wollebaek and Selle (2002) have identified this link and some concerns with its potency. Hems (2011) feels that “the distinction between bonding and bridging social capital exposes the lack of robustness of the definitions and concepts we utilise in relation to volunteering. Bridging social capital is most likely to involve formal volunteering where individuals volunteer through not-for-profit organisations e.g. helping out at a drop-in centre for the homeless. Informal volunteering is undertaken on one’s own initiative and is most likely to be associated with bonding social capital e.g. babysitting for a neighbour”.
Learning for disaster resilience
As stated explicitly or implicitly in the groups of actions listed above from the National Strategy for Disaster Resilience, there is a need for agency and community learning to help build resilient communities. Central to this requirement is the concept of ‘communities of practice’. According to Wenger (2006), “communities of practice are groups of people who share a concern or passion for something they do and learn how to do it better as they interact regularly”. Examples of disaster-related
156
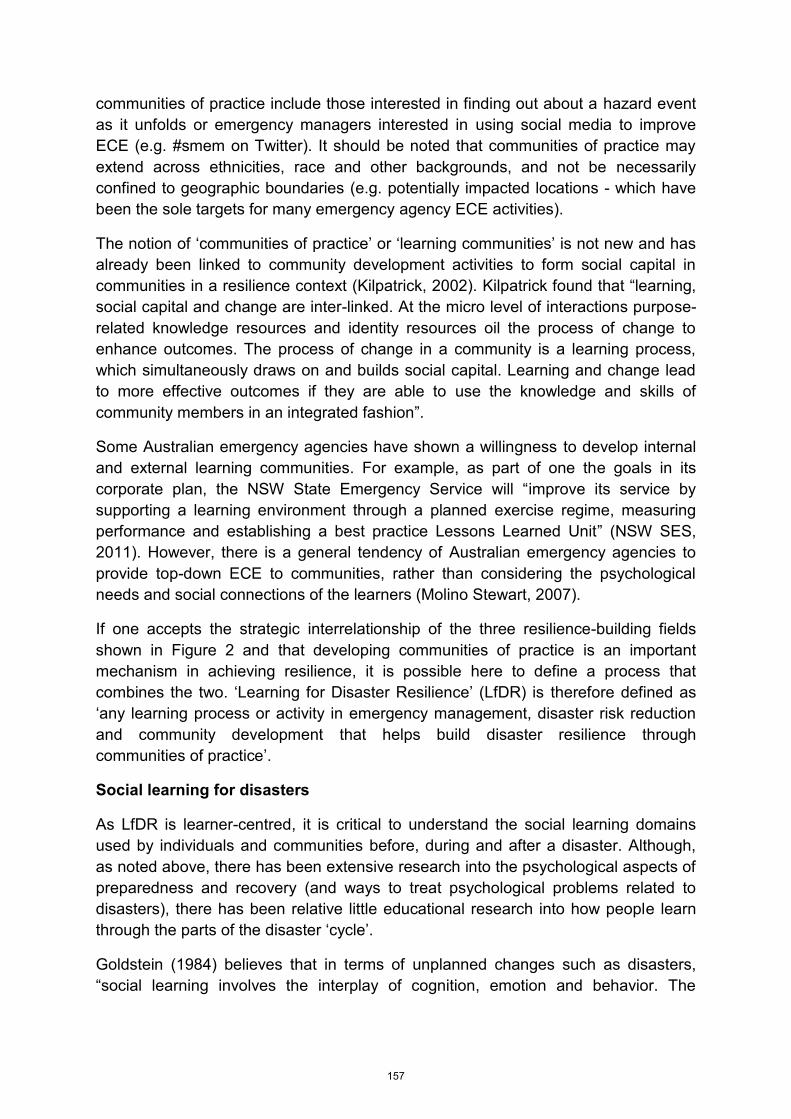
communities of practice include those interested in finding out about a hazard event as it unfolds or emergency managers interested in using social media to improve ECE (e.g. #smem on Twitter). It should be noted that communities of practice may extend across ethnicities, race and other backgrounds, and not be necessarily confined to geographic boundaries (e.g. potentially impacted locations - which have been the sole targets for many emergency agency ECE activities).
The notion of ‘communities of practice’ or ‘learning communities’ is not new and has already been linked to community development activities to form social capital in communities in a resilience context (Kilpatrick, 2002). Kilpatrick found that “learning, social capital and change are inter-linked. At the micro level of interactions purpose-related knowledge resources and identity resources oil the process of change to enhance outcomes. The process of change in a community is a learning process, which simultaneously draws on and builds social capital. Learning and change lead to more effective outcomes if they are able to use the knowledge and skills of community members in an integrated fashion”.
Some Australian emergency agencies have shown a willingness to develop internal and external learning communities. For example, as part of one the goals in its corporate plan, the NSW State Emergency Service will “improve its service by supporting a learning environment through a planned exercise regime, measuring performance and establishing a best practice Lessons Learned Unit” (NSW SES, 2011). However, there is a general tendency of Australian emergency agencies to provide top-down ECE to communities, rather than considering the psychological needs and social connections of the learners (Molino Stewart, 2007).
If one accepts the strategic interrelationship of the three resilience-building fields shown in Figure 2 and that developing communities of practice is an important mechanism in achieving resilience, it is possible here to define a process that combines the two. ‘Learning for Disaster Resilience’ (LfDR) is therefore defined as ‘any learning process or activity in emergency management, disaster risk reduction and community development that helps build disaster resilience through communities of practice’.
Social learning for disasters
As LfDR is learner-centred, it is critical to understand the social learning domains used by individuals and communities before, during and after a disaster. Although, as noted above, there has been extensive research into the psychological aspects of preparedness and recovery (and ways to treat psychological problems related to disasters), there has been relative little educational research into how people learn through the parts of the disaster ‘cycle’.
Goldstein (1984) believes that in terms of unplanned changes such as disasters, “social learning involves the interplay of cognition, emotion and behavior. The
157

importance of personal values and symbols requires attention to the emotional as well as the thinking and acting aspects of learning”.
In a study of Dutch citizens’ flood preparedness, Terpstra (2011) found two parallel learning paths – cognitive and affective – that lead from perceptions to behaviour. Both paths include multiple dependent variables and indicate how people combine affect and reason in order to respond to risk (Finucane and Holup, 2006). LfDR should recognise and assist individual learning within these domains.
Collectively, a participatory approach to learning should be supported by LfDR. According to Paton (2005), “participation in identifying shared problems and collaborating with others to develop and implement solutions to deal them facilitates the development of efficacy, sense of community, and commitment to action. That is, it engenders the development of competencies that enhance community resilience to adversity”. To implement this, Paton suggests that “hazard education could be facilitated by inviting representatives of community groups to review hazard scenarios in regard to potential challenges, opportunities and threats they could pose for the community. They would then propose strategies to capitalise on them, or to manage or contain them”.
In a national review of natural hazard community education, awareness and engagement programs for the Australian Government, Elsworth et al (2009) identified active community participation as part of their model for effective programs. They stress that programs “would be greatly improved if they involved active community participation during their development and implementation. Levels of community participation of this kind that move towards wide consultation, collaborative development of activities and programs and democratic forms of policy-related decision-making require conscious design, considerable effort in implementation and on-going evaluation”.
In the participatory LfDR approach, the emergency management agencies assimilate and support the needs and directions of the community. They thus act as consultants to communities (e.g. facilitators, resource providers, change agents, coordinators) rather than directing the change process in a top-down manner. It should be acknowledged that many Australian emergency agencies are implementing their engagement activities in this manner.
Implications for emergency agencies
Who should be responsible for LfDR in Australia? As stressed in the National Strategy for Disaster Resilience, a basic tenet for building disaster resilience is ‘shared responsibility’. The Victorian Bushfires Royal Commission in its Final Report (2010) uses the expression ‘shared responsibility’ “to mean increased responsibility for all. It recommends that state agencies and municipal councils adopt increased or improved protective, emergency management and advisory roles. In turn, communities, individuals and households need to take greater responsibility for their
158
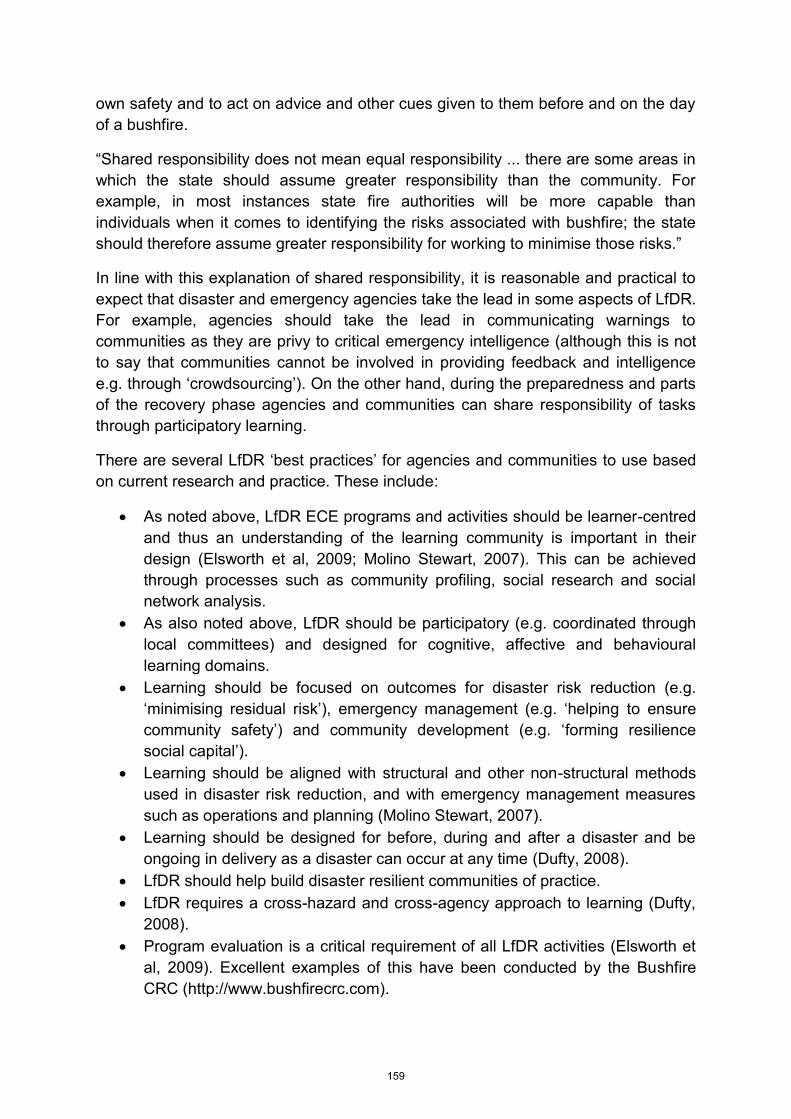
own safety and to act on advice and other cues given to them before and on the day of a bushfire.
“Shared responsibility does not mean equal responsibility ... there are some areas in which the state should assume greater responsibility than the community. For example, in most instances state fire authorities will be more capable than individuals when it comes to identifying the risks associated with bushfire; the state should therefore assume greater responsibility for working to minimise those risks.”
In line with this explanation of shared responsibility, it is reasonable and practical to expect that disaster and emergency agencies take the lead in some aspects of LfDR. For example, agencies should take the lead in communicating warnings to communities as they are privy to critical emergency intelligence (although this is not to say that communities cannot be involved in providing feedback and intelligence e.g. through ‘crowdsourcing’). On the other hand, during the preparedness and parts of the recovery phase agencies and communities can share responsibility of tasks through participatory learning.
There are several LfDR ‘best practices’ for agencies and communities to use based on current research and practice. These include:
As noted above, LfDR ECE programs and activities should be learner-centred and thus an understanding of the learning community is important in their design (Elsworth et al, 2009; Molino Stewart, 2007). This can be achieved through processes such as community profiling, social research and social network analysis.
As also noted above, LfDR should be participatory (e.g. coordinated through local committees) and designed for cognitive, affective and behavioural learning domains.
Learning should be focused on outcomes for disaster risk reduction (e.g. ‘minimising residual risk’), emergency management (e.g. ‘helping to ensure community safety’) and community development (e.g. ‘forming resilience social capital’).
Learning should be aligned with structural and other non-structural methods used in disaster risk reduction, and with emergency management measures such as operations and planning (Molino Stewart, 2007).
Learning should be designed for before, during and after a disaster and be ongoing in delivery as a disaster can occur at any time (Dufty, 2008).
LfDR should help build disaster resilient communities of practice. LfDR requires a cross-hazard and cross-agency approach to learning (Dufty,
2008). Program evaluation is a critical requirement of all LfDR activities (Elsworth et
al, 2009). Excellent examples of this have been conducted by the Bushfire CRC (http://www.bushfirecrc.com).
159
The use of social media should be an important component of LfDR (Dufty, 2012), as well as the more ‘traditional’ ECE activities (e.g. events, media, websites, meetings).
Post-disaster learning is important to help stimulate the ‘bounce forward’ effect (Molino Stewart, 2007; Dufty, 2008). This learning can be derived from ECE activities such as de-brief community meetings, community resilience webinars (used extensively after the 2011 Queensland floods) and social media discussions.
Conclusion
The above argument for a more holistic LfDR approach is consistent not only with the National Strategy for Disaster Resilience and current research, but also with the findings of some major government inquiries into recent disasters. For example, the Victorian Floods Review (2011) in its final report recommended that the State:
Involve local communities in the development and ownership of community resilience plans based on a ‘all hazards’ approach and tailored for the specific needs of each community
Encouraging local communities to form resilience committees to develop and administer community resilience plans (Recommendation 93)
However, there are knowledge gaps in the literature that require further research to validate and refine the LfDR approach. These gaps include:
The practical interrelationships between disaster risk reduction, emergency management and community development e.g. through community case studies
How communities learn before, during and after an event The value of social media in building community disaster resilience Best practice methods to evaluate community disaster ECE activities Design of appropriate and effective community disaster resilience learning
plans and programs.
Hopefully, this paper will encourage agencies and communities to move further down the path to holistic disaster resilience learning. In closing, in the words of Theodore Roosevelt appropriate for any community around the world:
Americans learn only from catastrophe
and not from experience.
References
Aldrich, D.P., 2008, The Crucial Role of Civil Society in Disaster Recovery and Japan’s Emergency Preparedness, Japan aktuell, Vol. 3, pp.81-96.
160
Aldrich, D.P., 2010, Fixing Recovery: Social Capital in Post-Crisis Resilience, Journal of Homeland Security, Vol. 6, June 2010, pp. 1- 10. Aldrich, D.P., 2011a, The Externalities of Social Capital: Post-Tsunami Recovery in Southeast India, Journal of Civil Society, Vol. 8, No. 1, pp. 81-99. Aldrich, D. P., 2011b, Between Market and State: Directions in Social Science Research on Disaster, Perspectives on Politics, Vol. 9, No. 1, March 2011 pp. 61-68. Bennett, A.,1973, Professional staff member’s contributions to community development, Journal of the Community Development Society, Vol. 4, pp.58-68.
Boettke, P., Chamlee-Wright, E., Gordon, P., Ikeda, S., Leeson, P.T., & Sobel, R., 2007, The Political, Economic, and Social Aspects of Katrina, Southern Economic Journal, Vol. 74, No. 2, pp. 363-376.
Boin, A., Comfort, L.K., & Demchak, C.C., 2010, The Rise of Resilience, in Comfort, L.K., Boin, A., & Demchak, C.C. (eds.), Designing Resilience: preparing for extreme events, University of Pittsburgh Press, Pittsburgh.
Boura, J., 1998, Community Fireguard: Creating partnerships with the community to minimise the impact of bushfire, The Australian Journal of Emergency Management, Vol. 13, pp. 59-64.
CCS Strategic Management, 2008, Serpentine Jarrahdale Shire Community Facilities and Services Plan 2020 Report 5, compiled in association with Geografia.
Chamlee-Wright, E., 2010, The Cultural and Political Economy of Recovery: Social Learning in a Post-Disaster Environment, Routledge, New York.
COAG, 2011, National Strategy for Disaster Resilience: Building our nation’s resilience to disasters, Australian Government.
de Bruijne, M., A., Boin, A., & van Eeten, M., 2010, Resilience: Exploring the Concept and its Meanings, in Comfort, L.K., Boin, A., & Demchak, C.C. (eds.), Designing Resilience: preparing for extreme events, University of Pittsburgh Press, Pittsburgh.
Dovers, S., 2004, Sustainability and Disaster Management, The Australian Journal of Emergency Management, Vol. 19, pp. 21-25.
Dufty, N., 2008, A new approach to community flood education, The Australian Journal of Emergency Management, Vol. 23, No. 2, pp. 4-8.
Dufty, N., 2012, Using Social Media to Build Community Disaster Resilience, The Australian Journal of Emergency Management, Vol. 27, No. 1, pp. 40-45.
Elsworth, G., Gilbert, J., Robinson, P., Rowe, C., and Stevens, K., 2009, National Review of Community Education, Awareness and Engagement Programs for Natural
161
Hazards, report by RMIT University commissioned by the National Community Safety Working Group of the Australian Emergency Management Committee.
Fahey, C., 2003, ‘Working with communities’ to ‘build social capital’ Reflecting on old and new thinking about volunteers, The Australian Journal of Emergency Management, Vol. 18, No. 4, pp.12-17.
Finucane, M.L., & Holup, J.L., 2006, Risk as value: combining affect and analysis in risk judgements, Journal of Risk Research, Vol. 9, No. 2, pp. 141-164.
Gero, A., Méheux, K., & Dominey-Howes, D., 2010, Disaster risk reduction and climate change adaptation in the Pacific: The challenge of integration, ATRC-NHRL Miscellaneous Report 4.
Goldstein, H., 1984, Social Learning and Change: A Cognitive Approach to Human Services, Tavistock Publications, USA.
Hems, L., 2011, Building Social Capital – volunteering, participation and pro-social behaviours, blog from the Centre for Social Impact, May 4, 2011 https://secure.csi.edu.au/site/Home/Blog.aspx?defaultblog=http%3a%2f%2fblog.csi.edu.au%2f2011%2f05%2fbuilding-social-capital-%25e2%2580%2593-volunteering-participation-and-pro-social-behaviours%2f
Kilpatrick, S., 2002, Learning and Building Social Capital in a Community of Farm Businesses, Centre for Research and Learning in Regional Australia, Discussion Paper D1/2002.
Longstaff, P.H., 2005, Security, resilience and communication in unpredictable environments such as terrorism, natural disasters and complex technology, Program on Information Resources Policy, Centre for Information Policy Research, Harvard University. Available at http://www.pirp.harvard.edu
Manyena, S.B., O’Brien, G., O’Keefe, P., & Rose, J., 2011, Disaster resilience; a bounce back or a bounce forward ability?, Local Environment, Vol. 16, No. 5, pp.417-424.
Mayunga, J.S, 2007, Understanding and Applying the Concept of Community Disaster Resilience: A capital-based approach, draft paper prepared for the Summer Academy for Social Vulnerability and Resilience Building, 22-28 July 2007, Munich, Germany
Molino Stewart, 2007, Roles and Responsibilities for VICSES in Flood Education, a report commissioned by VICSES. available at:
http://www.ses.vic.gov.au/CA256AEA002EBBF1/Lookup/Emergency-Management-Research/$file/Roles%20and%20Responsibilities%20for%20VICSES%20in%20Flood%20Education%20Dec%202007.pdf
162
NSW SES, 2011, One SES: NSW SES Plan 2011-2015. Available at http://www.ses.nsw.gov.au/content/documents/pdf/47777/plan-11-15
Paton, D., Smith, L., Johnston, D., Johnston, M., & Ronan, K., 2003, Developing a model to predict the adoption of natural hazard risk reduction and preparatory adjustments, (Research Project No. 01-479): EQC Research Report
Paton, D., 2005, Community Resilience: Integrating Hazard Management and Community Engagement, School of Psychology, University of Tasmania. Available at http://www.engagingcommunities2005.org/abstracts/Paton-Douglas-final.pdf
Paton, D., 2006, Disaster resilience: building capacity to co-exist with natural hazards and their consequences, in Paton, D., & Johnston, D., (eds.), Disaster Resilience: An Integrated Approach, Charles C Thomas Publishers Ltd, Springfield.
Paton, D., McClure, J., & Burgelt, P.T., 2006, Natural hazard resilience: the role of individual and household preparedness, in Paton, D., & Johnston, D., (eds.), Disaster Resilience: An Integrated Approach, Charles C Thomas Publishers Ltd, Springfield.
Putnam, R., 1995, Bowling Alone: The Collapse and Revival of American Community, Journal of Democracy, Vol. 6, pp. 65-78.
Rhodes, A., 2011, Opinion: Ready or not? Can community education increase householder preparedness for bushfire?, The Australian Journal of Emergency Management, Volume 26, No. 2, pp. 6-10.
Royal Commission into the 2009 Victorian Bushfires, 2010, Final Report, State Government of Victoria, Australia.
Szreter, S., & Woolcock, M., 2004, Health by association? Social capital, social theory, and the political economy of public health. International Journal of Epidemiology Vol. 33 No. 4 pp.650-667.
Terpstra, T., 2011, Emotions, Trust, and Perceived Risk: Affective and Cognitive Routes to Flood Preparedness Behavior, Risk Analysis, Vol. 31, No. 10, pp.1658-1675.
Topping, K., 2011, Strengthening resilience through mitigation planning, Natural Hazards Observer, Vol. 36, No.2.
Victorian Floods Review, 2011, Review of the 2010-11 Flood Warnings and Response, State of Victoria, Australia.
Wenger, E., 2006, Communities of practice: a brief introduction, available at www.ewenger.com/research.
Whittle, R., Medd, W., Deeming, H., Kashefi, E., Mort, M., Walker, G., & Watson, N., 2010, After the rain - learning the lessons from flood recovery in Hull. Final project
163
report for 'Flood, Vulnerability and Urban Resilience: a real-time study of local recovery following the floods of June 2007 in Hull, Project Report, Lancaster, UK.
Wildavsky, A.B., 1988, Searching for safety, Transaction, New Brunswick.
Wollebaek, D., & Selle, P., 2002, Does Participation in Voluntary Associations Contribute to Social Capital? The impact of intensity, scope and type, Nonprofit and Voluntary Sector Quarterly, Vol. 31, No. 1, pp.32-61.
164
Optimising the use of an incident management system in coal mining emergencies
Ruth Fuller, David Cliff and Tim Horberry
PhD candidate and Supervisors
University of Queensland, Brisbane, Australia
Paper presented at EARTH: FIRE AND RAIN Australian & New Zealand Disaster and Emergency Management Conference Brisbane – 16 – 18, April 2012
165
Optimising the use of an incident management system in coal mining emergencies Abstract This paper presents ongoing research examining the application and performance of the Mining Emergency Management System (MEMS). The MEMS is an industry specific variant of the Australian Inter-service Incident Management System and is used during emergencies at underground coal mines in Queensland (Queensland Mines Rescue Service, 2009). Since its introduction in 2005, its utility has been assessed during annual Queensland mine emergency exercises. These exercises are realistic emergency simulations staged at a host mine and involve input from various state authorities. Each year, independent assessors observe the exercise and make recommendations to improve overall emergency management performance. Despite the introduction of the MEMS, the recommendations have remained largely the same each year, indicating that the MEMS is possibly not sufficient on its own to optimise emergency management performance. This research proposes that focusing on relevant non-technical skills, via the development and application of a mining industry Crew Resource Management (CRM) style program, may improve performance.
Keywords: mining, incident control, Crew Resource Management, CRM, MEMS, emergencies, decision making. Introduction Underground coal mines have the potential to trap, injure or even kill many people in one incident. A methane or coal dust explosion, fire, an inrush of water or toxic gases and structural collapse are all ever-present hazards for those working underground. In November 2010, 29 miners were killed due to explosions at the Pike River Coal Mine in New Zealand, and only 7 months prior (April 2010), 29 men were killed when the Upper Big Branch Coal Mine in the U.S. exploded. Therefore, emergency situations can and do still occur, and Queensland coal mines have a legal responsibility through the Coal Mining Health and Safety Act 1999, to be prepared to handle them. In Queensland, if such a tragedy arises again, it will generally be the mine manager who takes the role of Incident Controller (IC). However, the previous 14 annual “Level 1” mine emergency exercises run throughout Queensland indicate that mine managers and their supporting Incident Control Team (ICT) struggle to perform optimally in unfamiliar, fast-paced, stressful and dynamic emergency situations. In an effort to improve performance, the Mining Emergency Management System (MEMS) was implemented in 2005. However, even with the application of MEMS, a number of recommendations from the Level 1 assessors recur annually indicating that further improvements to emergency response can be made. Recent Emergency Response at Underground Coal Mines Recent coal mining history in the US highlights the dangers of emergency response. At Crandall Canyon Mine (2007), three rescuers attempting to reach six men trapped in the mine, following an outburst, were killed by a subsequent outburst (United States Department of Labor Mine Safety and Health Administration, 2007). From this, some would say they made the wrong decision. However, this is overly
166
simplistic and suffers from hindsight bias (Dekker, 2006). Further, there is more to determining if an emergency response went badly than simply the occurrence of further injuries or fatalities, as evidenced by the response at the SAGO disaster in 2006 (an explosion). In this instance, the ICT was cautious about sending rescuers underground. The resulting delay in activating the crews was blamed, by the subsequent inquiry, for the deaths of 11 out of the 12 miners who sought refuge underground while waiting for help to arrive (McAteer et al, 2006).Therefore, this ICT was also said to have made the wrong decision by some, despite it being the opposite of that made at Crandall Canyon. Again, those making this assessment had the benefit of hindsight. Retrospectively assessing the success or otherwise of an emergency operation is difficult and cannot simply be based on the outcome without consideration of the circumstances and facts available at the time. Therefore, using emergency exercises to analyse emergency response performance are extremely valuable. The Development of ‘Level 1’ Exercises and Introduction to MEMS Queensland’s last deadly coal mining disaster was at Moura in 1994 where an explosion killed 11 men. This was the last in a series of explosions at Moura that claimed a total of 36 lives between 1974-1994. As a direct result of a recommendation from the Wardens Inquiry into the 1994 event, annual Level 1 mine emergency exercises have been conducted in Queensland since 1998 (Wardens Inquiry, 1996). These exercises are realistic emergency simulations staged at a nominated mine. The exercise involves the mine (surface and underground), external agencies, the Queensland Mines Rescue Service (QMRS), external services (usually the ambulance service) and often neighbouring coal mines. The exercises are designed by a confidential exercise management committee in accordance with the Recognised Standard 08: Conduct of mine emergency exercises (Queensland Government, 2009). The exercise management committee which must include at least:
One representative of the mines inspectorate, One representative from SIMTARS (Safety in Mines Testing and Research
Station), Three representatives from other mines including at least one mine manager, One representative from the host mine, One representative from the QMRS, One industry safety and health representative, and Others, such as those designing special effects to ensure it is realistic.
The Level 1 exercise occurs without any warning, but within a disclosed two week timeframe. Each year assessors monitor all aspects of the emergency exercise, above and below ground, and provide recommendations in a report which is provided to the host mine and available to all other mines via a Government website (Queensland Government, 2011). These exercises provide excellent first-hand and real-time data to the mining industry regarding decision making and emergency response performance, whilst also offering the host mine practice in a realistic emergency situation.
167
In early Level 1 exercises, assessors recommended that a formal incident management system be implemented to improve decision making and overall performance. One assessor stated, “There is a further need to establish a clear organisational structure for the management of an emergency, including information gathering techniques, decision making processes and communication mechanisms. These are available within professional emergency services organisations and should be reviewed and considered for adaptation to the mining environment. “(Level 1 report, 2003). The following year the statement was made, “A mine must have an established, structured and comprehensive system for managing an emergency with a trained, disciplined response team”, and a further recommendation in the 2004 Level 1 report was to, “Implement the Incident Control System (ICS) and particularly limit the span of control (five resources under the control of one person) of individuals.” As a result of these observations the first version of the MEMS was rolled out in 2005. The Use of the MEMS Use of the MEMS is not mandatory. However, as the QMRS use it, promote it and offer training in its use, it is well known and respected within the Queensland coal mining community. The MEMS has been designed using the principles of the ICS as its framework. The ICS is the U.S. system mandated by the National Incident Management System (NIMS), and is the system taught and promoted by the Federal Emergency Management Agency (FEMA). The ICS evolved from an incident management system developed for wildfire fighters in the 1970s following the devastating Southern California fires (Buck, Trainor, & Aguirre, 2006). The ICS forms the basis of the Australian Inter-service Incident Management System (AIIMS) and the New Zealand Coordinated Incident Management System (CIMS). These systems are used by Government agencies and the emergency services in the event of a disaster. In New Zealand, CIMS was used in the rescue and recovery stages of the Pike River Coal Mine disaster. The MEMS is directly modelled on AIIMS and ICS. The MEMS structure involves functional groups reporting to an ICT. The leaders of the functional groups form the ICT, along with the IC and any other roles identified as necessary. The functional groups include operations, planning and logistics. The philosophy behind the structure is command and control, with the IC responsible for authorising all decisions. Under the MEMS, the IC is responsible for everything that occurs on the mine site following the declaration of an emergency. The IC is the senior mine official, generally the mine manager, due to his statutory responsibility for the mine and all who enter it (Section 150, Coal Mining Safety and Health Regulation, 2001. The functional group leaders make decisions relating to their functional area, but decision approval is required from the IC during ICT meetings. The principal purpose of implementing an incident management system is to provide coordination when different agencies are working together. During a coal mining emergency in Queensland, other mines and the QMRS work with the mine. Implementation of the MEMS means all “agencies” will use the same system, facilitating effective communication and maintaining the integrity of the command and control structure. As the MEMS is industry specific, it has been customised to provide detailed guidance on its application within the coal mining industry. The course guide includes templates for standard items such as incident action plans, changeover
168
information, and function request forms. It also provides guidance on dealing with the media as, unlike other systems such as AIIMS, the IC at a mine site is more directly responsible for providing this information, either personally or through a liaison officer or spokesperson. However, the application of the MEMS is just as likely to encounter the same general problems as other incident management systems. Research on ICS and AIIMS suggests that without comprehensive training and development of interpersonal and inter-agency relationships these systems are likely to fail. For instance, an analysis of historical search and rescue case studies, where FEMA taskforces were involved, found that there was confusion over roles and responsibilities and time delays in cases where ICS was used but the agencies themselves were not trained and had no training experience with each other (Buck, et al., 2006). A lack of inter-agency familiarity and trust was blamed for the poor use of the ICS because in situations where agencies were well trained in ICS, and had trained together previously, it worked well as a system (Buck, et al., 2006). Similarly, ICS was found to be problematic when used by the police for large incidents despite the assertion that they use ICS on a daily basis. The problem identified was that police incidents rarely require more than a single police officer, or in terms of ICS, only the IC is required (Buck, et al., 2006). Therefore, the police experience with ICS is only at its simplest level, unlike the full version that would be employed in a large-scale emergency utilising functional groups and inter-agency involvement. A more recent study of the emergency operation following Hurricane Rita also concluded that more training would improve the effectiveness of the ICS. However, the goal of the training proposed would be to provide experience in more typical scenarios rather than the traditional theoretical type training already on offer (Lutz & Lindell, 2008). Therefore, without significant practical training, it is likely MEMS may encounter the same problems. The MEMS Training The MEMS training, which is run by experienced QMRS personnel, is a weeklong residential course. The trainers offer guidance on issues relevant to mining incidents, such as family interaction. The first two days are mostly theoretical, with the remainder being more practical, including the use of the MEMS system in simulations. The theory component includes a four hour session with an external consultant who covers basic psychology in an effort to help attendees obtain better control in circumstances involving stress and emotion. Issues such as working memory capacity, how people behave when fatigued, basic neuropsychology, attitudes and perception are covered. However, these topics are not yet integrated with the simulations. During the simulations, attendees are encouraged to take different roles each time to facilitate an understanding of the roles, responsibilities and challenges faced by each functional group. A gas monitoring system is brought in to simulate an incident for the final simulation on the last day of the training. The technical data from the gas monitoring system requires interpretation, as it would in real life. Groups are encouraged to move furniture and set up their functional areas to prevent disturbances and maximise utility. Real telephone calls are received and are also expected to be made. Actors receiving calls are often just as obstructive as in real life, adding to the authenticity of the exercise by introducing some frustration. From this, it can be seen that the
169
QMRS have made a good start at addressing some teamwork and communications issues, however, this may be able to be improved upon. Industry Training As stated previously, the necessity for annual training in emergency procedures was noted in the Moura Inquiry, and is detailed in the Recognised Standard 08: Conduct of mine emergency exercises (Queensland Government, 2009). Within this standard, 4 levels of training are prescribed. The Level 1 exercise is the “state level exercise” and is held only once a year and only at one mine. Therefore, the other mines must undertake a Level 2 exercise, which is a “whole of mine” exercise designed to test emergency response including the ICT. The guidelines state that the exercise scenarios must vary annually and that, in some years, the mine manager should not be involved in the design to ensure that s/he has practice. The QMRS should be involved in the design and post assessment of the Level 2 exercises. Each year, the organising committee is required to submit a report detailing the performance, outcomes and recommendations to the District Inspector and to the Industry Safety and Health Representative. The purpose of Level 3 exercises is to test the evacuation plans and self-escape skills of the underground workers. Level 4 exercises involve supporting exercises such as desk-top or semi-practical exercises intended to meet objectives such as communication, teamwork, troubleshooting and hazard identification. While there is official auditing of the Level 1, 2 and 3 exercises, there is no official auditing of the Level 4 exercises. The outcomes of Level 3 and 4 exercises are to be recorded and held at the mine. Interpersonal and Inter-agency Relationships A critical evaluation of ICS, which is also applicable to the MEMS, claims that it is “a bureaucratic system that requires certain conditions for it to work well"(p15, Buck, et al., 2006). This has been acknowledged by others (Bigley & Roberts, 2001) and seems realistic given that the systems are simply a structure by which to organise the emergency response. As previously mentioned, it should be noted that the ICS was developed for wildfire fighters. These are teams consisting of members who work up through the ranks, learning from their superiors and forming strong interpersonal relationships. They have practiced in many emergency scenarios gaining vital experience in the fundamentals of the working environment and learning tactics helping them to become experts in fighting fires (Klein, 1999). It is therefore likely that these are the “certain conditions” required for ICS to work well, and that the design of ICS and all the variants of it, are based on teams with interpersonal knowledge, trust and experience in the emergency scenario. Therefore, it is not that the system itself fails (Buck, et al., 2006), but that perhaps its design is founded on an underlying assumption that these conditions are always the case when that may not be correct. The importance of interpersonal and inter-agency relationships contributing to the success of an incident management system, and the overall success of an emergency response, became apparent during the “Rescue and Recovery” phase of the Pike River Royal Commission. Poor relationships, between and within agencies, appeared to contribute to the severe criticism expressed during the Royal Commission relating to the interpretation and application of the CIMS structure. The specific CIMS structure that was applied appeared to increase the divide between
170
agencies, negatively impacting on communications and trust, and exacerbating the poor interrelationships. It is a common view that implementing a clear working structure will eliminate some of the ambiguity associated with having human beings involved in a process. Indeed, this was presumably the driver for the Level 1 assessors suggesting the implementation of the MEMS. This opinion was also clearly evident at Pike River, with the resource coordinator highlighting the fact, “So when you put emotion and fatigue into one context you’ve got a real cocktail of challenges. So you try and manage that by either sound structure or process, a combination of both actually.” (p1693, Royal Commission on the Pike River Coal Mine Tragedy - Phase two: Search and Rescue, 2011) While this opinion seems logical, the evidence from Pike River indicates that more than a structure, whether implemented exactly as intended or not, is required for an incident management team to perform optimally. Furthermore, given that the same recommendations are being made annually by Level 1 assessors despite the implementation of the MEMS and its training, it is clear that improvements can be made. As the assessors’ comments primarily relate to poor decision making, despite a defined structure and process, it seems that improvements focussing on the human factors, rather than the technical or systems issues, may be particularly beneficial. Decision Making in Mining Emergencies Decision making is a key process in emergency response and it is mentioned in every Level 1 report. Decision making is a tangible concept and easy to evaluate and comment upon. There may also be an element of hindsight bias leading to the comments or possibly it is because the assessors know more than the decision maker does during the exercise. However, decision making processes, and the factors that underlie them, are complex. As such, the physiological literature on decision making is vast. Initial research into decision making focussed on analytical processes, which typically involves gathering information, comparing alternatives and making the optimum decision (Shanks, Lagnado, & Newell, 2007). Many researchers have deemed this approach irrelevant to the real world (Tversky & Kahneman, 1974), and more recently, Naturalistic Decision Making (NDM) has led the way in describing how expert decision makers make decisions (Klein, 1999, 2008). However, within mining, some decisions require an analytical approach. The most important being whether or not to allow re-entry into the mine following an incident or evacuation. The re-entry decision is one that the Queensland coal mining community take very seriously due to the danger posed to rescue workers and the requirement for a timely response, as highlighted earlier by the U.S. examples. To make the re-entry decision, complete and accurate data is required to show without a doubt that the mine environment is safe. Because of the importance and the analytical nature of this particular decision an Australian Coal Association Research Program (ACARP) project entitled, “Mine Entry Data Management” has been undertaken to develop a system that allows mines to collect and collate critical information about the mine, such as historical gas readings, prior to an emergency. It has been identified that approximately 70% of the technical data required in an emergency is available
171
before the emergency arises (Nugent, Devlin, Grieves, Cliff. D., & Brady, 2011). Having this data identified and stored electronically enables quicker access to the data in the event of an incident, enabling the decision makers to make a more rapid assessment of the situation and ultimately a more timely decision. Some would suggest that all decisions during an emergency response should be made in such a rigorous and analytical manner and, to some extent, the requirement for risk assessments ensures some level of rigour. However, the research indicates that many different types of decision making methods are employed in emergency response (Rhona Flin, O'Connor, & Crichton, 2008). These range from analytical decisions to intuitive decision making, where the person is hardly aware they’ve made a decision. The advent, and subsequent development of NDM over the last 15 years has progressed the understanding of how expert incident commanders make decisions, often using studies of military or fire commanders (Klein, Calderwood, & Clinton-Cirocco, 1988). There are obvious differences between an expert military incident commander and a mine manager suddenly involved in an emergency response, an atypical scenario for him/her. However, research on managers of offshore oil and gas rigs, and to some extent nuclear control room operators, has bridged the gap to the mining industry because those in charge are technical experts, but not necessarily experts in emergency management. From the incident command literature, the Pike River tragedy and an examination of the previous Level 1 reports, it seems that decision making cannot be considered alone in the incident response context. To improve decision making, several other factors need consideration such as communication, situational awareness, leadership, teamwork and stress and fatigue management (Rhona Flin, et al., 2008). These particular skills are the skills identified in the incident management literature as being critical for effective emergency response and are those common amongst many industries including aviation, military, nuclear control, maritime, rail, health, fire services, and offshore oil and gas (see Flin et al, 2007). Increasingly it is these skills, termed “non-technical skills”,that are being addressed in incident management training and may be the key to improving emergency management in the mining industry. Non- technical Skills Non-technical skills have been defined as cognitive and social skills that enhance technical skills (Flin et al, 2007). It seems likely that these non technical skills may be at the core of the interpersonal skills that the literature implies are critical for an incident management system to perform optimally. This is logical because these non-technical skills seem to address many of the attributes that wildfire fighters would be expected to have. To address deficiencies in non-technical skills, the aviation industry developed Cockpit Resource Management (CRM) in the 1980s to make use of all the resources, human and otherwise within the cockpit (Lauber at al., 2008 as cited in Rhona Flin, et al., 2008). Today, most of the major international airlines include CRM as part of their training. It is recommended by both European and American aviation regulators and is a mandatory component of training for UK pilots (Rhona Flin, et al., 2008). Research on improving non-technical skills in other high-reliability industries, such as the health industry (R. Flin et al., 2007), demonstrates the benefits of CRM, which now stands for the more general Crew Resource Management. As a result, CRM training and assessment packages have
172
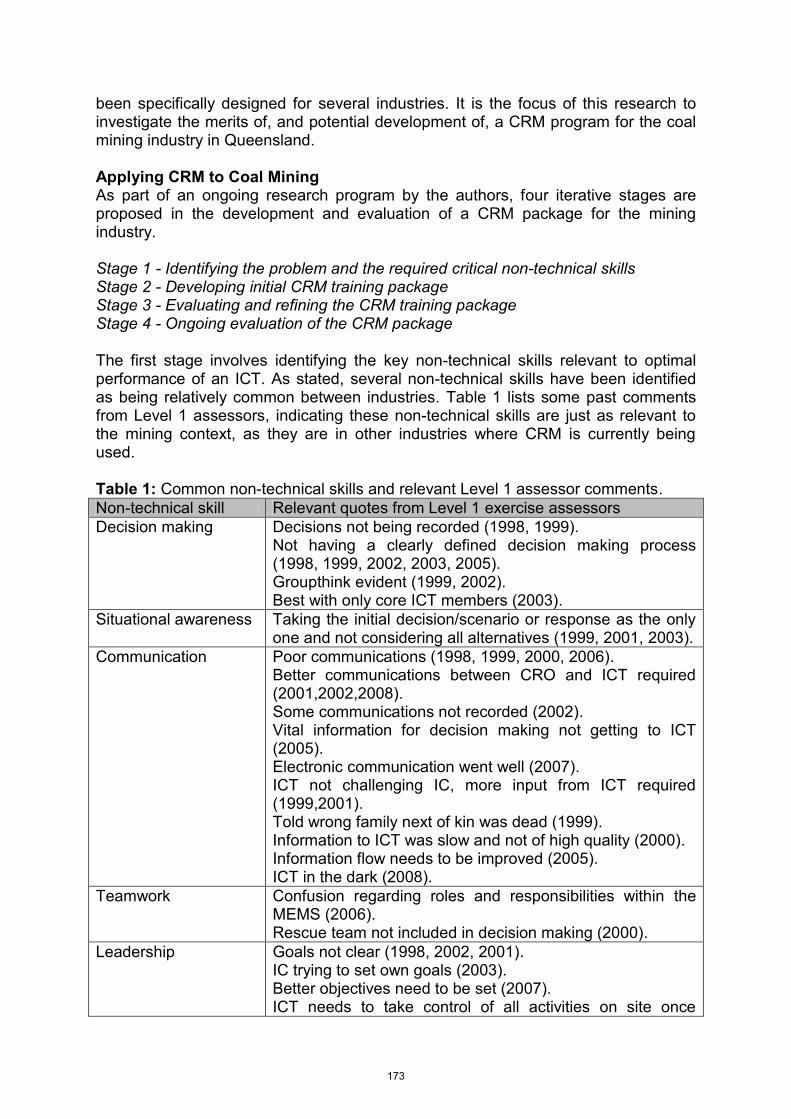
been specifically designed for several industries. It is the focus of this research to investigate the merits of, and potential development of, a CRM program for the coal mining industry in Queensland. Applying CRM to Coal Mining As part of an ongoing research program by the authors, four iterative stages are proposed in the development and evaluation of a CRM package for the mining industry. Stage 1 - Identifying the problem and the required critical non-technical skills Stage 2 - Developing initial CRM training package Stage 3 - Evaluating and refining the CRM training package Stage 4 - Ongoing evaluation of the CRM package The first stage involves identifying the key non-technical skills relevant to optimal performance of an ICT. As stated, several non-technical skills have been identified as being relatively common between industries. Table 1 lists some past comments from Level 1 assessors, indicating these non-technical skills are just as relevant to the mining context, as they are in other industries where CRM is currently being used. Table 1: Common non-technical skills and relevant Level 1 assessor comments. Non-technical skill Relevant quotes from Level 1 exercise assessors Decision making
Decisions not being recorded (1998, 1999). Not having a clearly defined decision making process (1998, 1999, 2002, 2003, 2005). Groupthink evident (1999, 2002). Best with only core ICT members (2003).
Situational awareness Taking the initial decision/scenario or response as the only one and not considering all alternatives (1999, 2001, 2003).
Communication Poor communications (1998, 1999, 2000, 2006). Better communications between CRO and ICT required (2001,2002,2008). Some communications not recorded (2002). Vital information for decision making not getting to ICT (2005). Electronic communication went well (2007). ICT not challenging IC, more input from ICT required (1999,2001). Told wrong family next of kin was dead (1999). Information to ICT was slow and not of high quality (2000). Information flow needs to be improved (2005). ICT in the dark (2008).
Teamwork Confusion regarding roles and responsibilities within the MEMS (2006). Rescue team not included in decision making (2000).
Leadership Goals not clear (1998, 2002, 2001). IC trying to set own goals (2003). Better objectives need to be set (2007). ICT needs to take control of all activities on site once
173
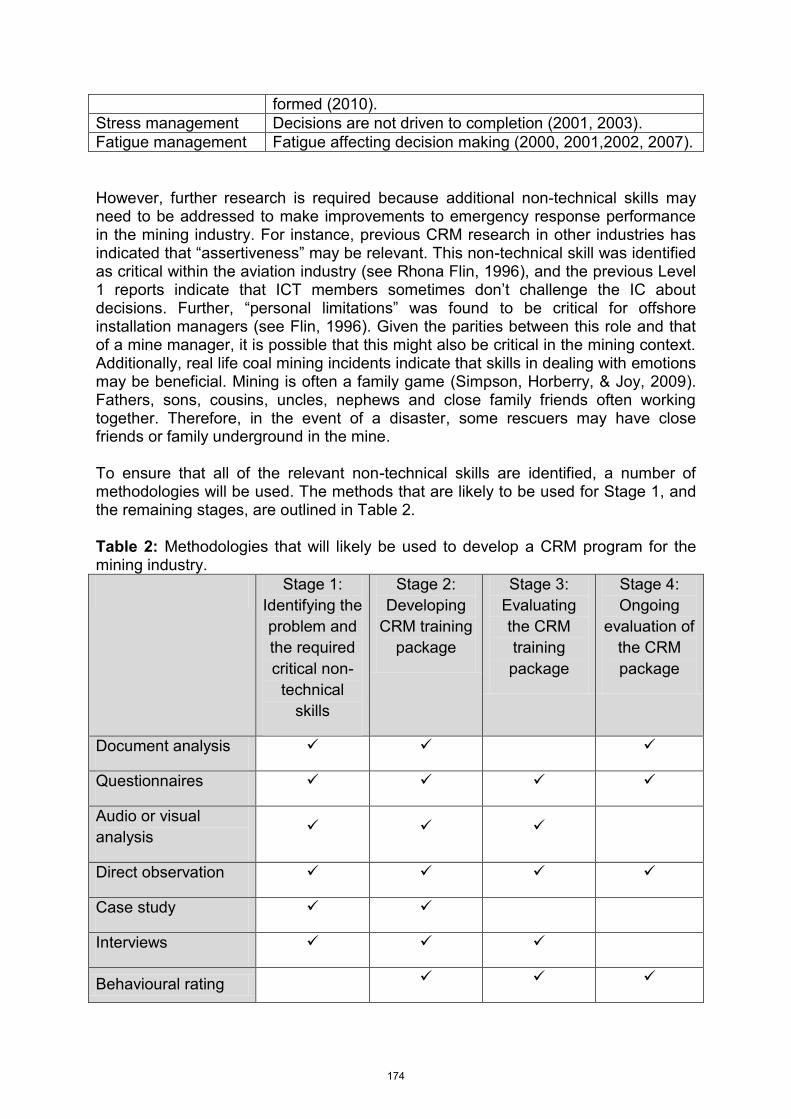
formed (2010). Stress management Decisions are not driven to completion (2001, 2003). Fatigue management Fatigue affecting decision making (2000, 2001,2002, 2007). However, further research is required because additional non-technical skills may need to be addressed to make improvements to emergency response performance in the mining industry. For instance, previous CRM research in other industries has indicated that “assertiveness” may be relevant. This non-technical skill was identified as critical within the aviation industry (see Rhona Flin, 1996), and the previous Level 1 reports indicate that ICT members sometimes don’t challenge the IC about decisions. Further, “personal limitations” was found to be critical for offshore installation managers (see Flin, 1996). Given the parities between this role and that of a mine manager, it is possible that this might also be critical in the mining context. Additionally, real life coal mining incidents indicate that skills in dealing with emotions may be beneficial. Mining is often a family game (Simpson, Horberry, & Joy, 2009). Fathers, sons, cousins, uncles, nephews and close family friends often working together. Therefore, in the event of a disaster, some rescuers may have close friends or family underground in the mine. To ensure that all of the relevant non-technical skills are identified, a number of methodologies will be used. The methods that are likely to be used for Stage 1, and the remaining stages, are outlined in Table 2. Table 2: Methodologies that will likely be used to develop a CRM program for the mining industry. Stage 1:
Identifying the problem and the required critical non-
technical skills
Stage 2: Developing
CRM training package
Stage 3: Evaluating the CRM training package
Stage 4: Ongoing
evaluation of the CRM package
Document analysis
Questionnaires
Audio or visual analysis
Direct observation
Case study
Interviews
Behavioural rating
174
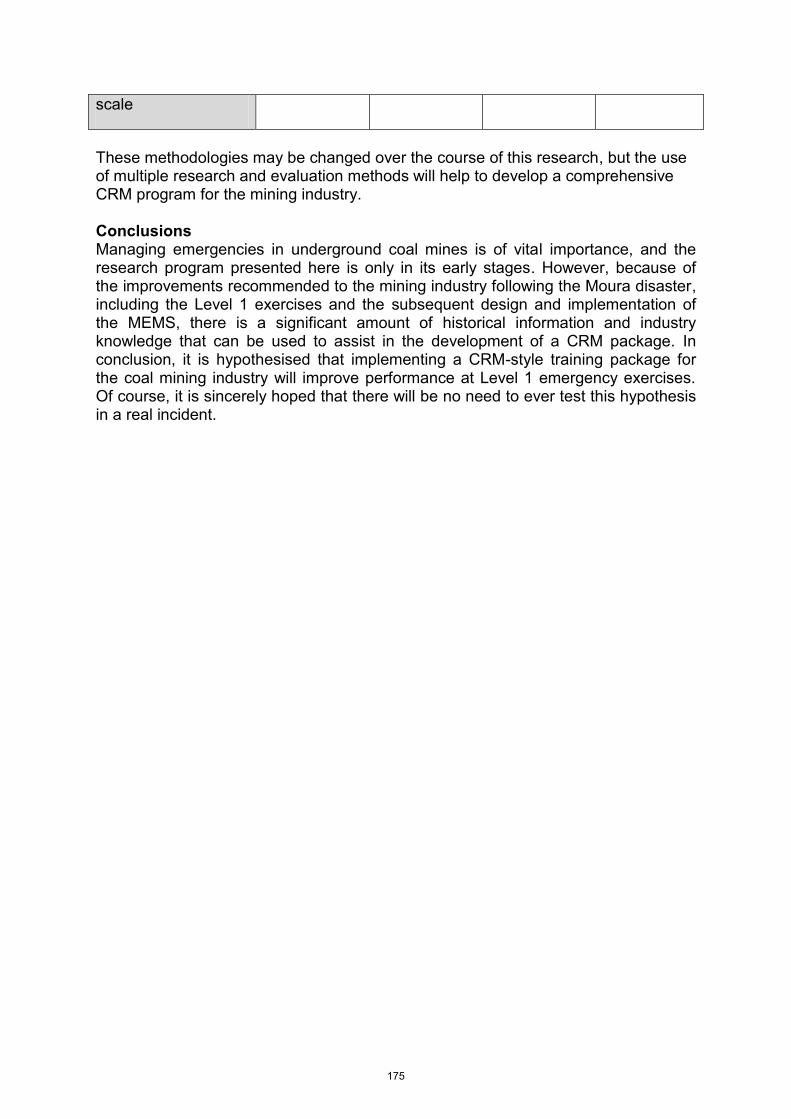
scale
These methodologies may be changed over the course of this research, but the use of multiple research and evaluation methods will help to develop a comprehensive CRM program for the mining industry. Conclusions Managing emergencies in underground coal mines is of vital importance, and the research program presented here is only in its early stages. However, because of the improvements recommended to the mining industry following the Moura disaster, including the Level 1 exercises and the subsequent design and implementation of the MEMS, there is a significant amount of historical information and industry knowledge that can be used to assist in the development of a CRM package. In conclusion, it is hypothesised that implementing a CRM-style training package for the coal mining industry will improve performance at Level 1 emergency exercises. Of course, it is sincerely hoped that there will be no need to ever test this hypothesis in a real incident.
175
References
Bigley, G. A., & Roberts, K. H. (2001). The Incident Command System: High-Reliability Organizing for Complex and Volatile Task Environments. The Academy of Management Journal, 44(6), 1281-1299.
Buck, D., Trainor, J. E., & Aguirre, B. E. (2006). A critical evaluation of the incident command system and NIMS. Journal of homeland security and emergency management, 3(3), 1-27.
Dekker, S. (2006). The field guide to understanding human error. Aldershot, UK: Ashgate. Flin, R. (1996). Sitting in the hot seat: Leaders and teams for critical incident management.
Chichester: Wiley. Flin, R., O'Connor, P., & Crichton, M. (2008). Safety at the sharp end. Aldershot: Ashgate. Flin, R., Yule, S., Paterson-Brown, S., Maran, N., Rowley, D., & Youngson, G. (2007). Teaching
surgeons about non-technical skills. The Surgeon, 5(2), 86-89. Klein, G. (1999). Sources of power : how people make decisions / Gary Klein. Cambridge: MIT Press. Klein, G. (2008). Naturalistic Decision Making. Human Factors. , 50(3), 456-460. Klein, G., Calderwood, R., & Clinton-Cirocco, A. (1988). Rapid decision making on the fire ground (ARI
Technical report 796). Alexandria VA.: U.S. Army Research Institute for the Behavioral and Social Sciences.
Lutz, L. D., & Lindell, M. K. (2008). Incident Command System as a Response Model Within Emergency Operation Centers during Hurricane Rita. Journal of Contingencies and Crisis Management, 16(3), 122-134.
Nugent, G., Devlin, S., Grieves, J., Cliff. D., & Brady, D. (2011). Emergency response: Mine entry data management, Australian Coal Association Research Program Project No. C19010.
Queensland Government. (2009). Recognised Standard 08; Conduct of mine emergency exercises. Queensland Government. (2011, July 2011). Queensland level 1 mine emergency exercise reports.
from http://mines.industry.qld.gov.au/safety-and-health/emergency-excercise-reports.htm Queensland Mines Rescue Service. (2009). MEMS Course Guide. Dysart. Royal Commission on the Pike River Coal Mine Tragedy - Phase two: Search and Rescue, (2011). Shanks, D. R., Lagnado, D. A., & Newell, B. R. (2007). Straight choices: the psychology of decision
making. Hove, East Sussex: Psychology Press. Simpson, G., Horberry, T., & Joy, J. (2009). Understanding Human Error in Mine Safety. Aldershot,
UK: Ashgate Press. Tversky, A., & Kahneman, D. (1974). Judgment under uncertainty: Heuristics and biases. Science,
185, 1124-1131. United States Department of Labor Mine Safety and Health Administration. (2007). Report of
Investigation: Underground Coal Mine. Fatal underground coal burst accidents August 6 and 16, 2007 Crandall Canyon Mine.
Report on an accident at Moura No 2 mine on Sunday, 7 August 1994 (1996).
176
Rebuilding After the 2010/2011 Victorian Floods – A Roads Perspective
Mr Emiliyan Gikovski
Manager Program Liaison
VicRoads, Melbourne, Australia
Paper presented at EARTH: FIRE AND RAIN Australian & New Zealand Disaster and Emergency Management Conference Brisbane 16-18 April 2012
177
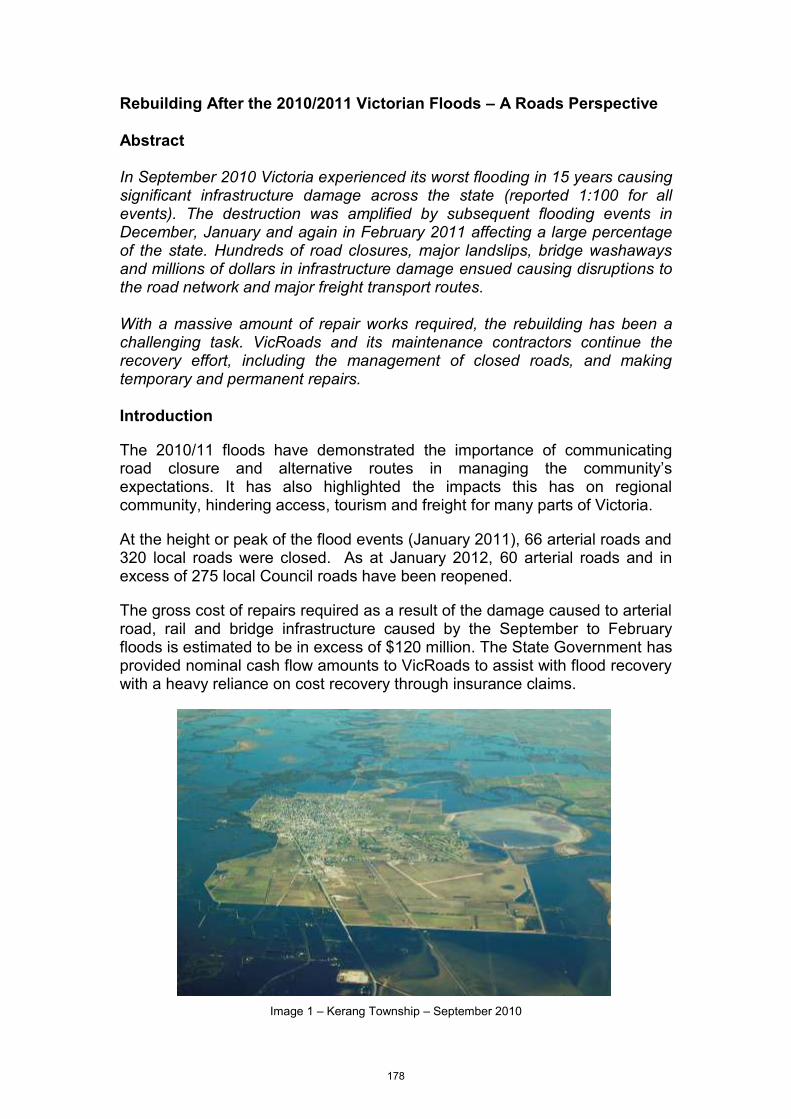
Rebuilding After the 2010/2011 Victorian Floods – A Roads Perspective
Abstract In September 2010 Victoria experienced its worst flooding in 15 years causing significant infrastructure damage across the state (reported 1:100 for all events). The destruction was amplified by subsequent flooding events in December, January and again in February 2011 affecting a large percentage of the state. Hundreds of road closures, major landslips, bridge washaways and millions of dollars in infrastructure damage ensued causing disruptions to the road network and major freight transport routes. With a massive amount of repair works required, the rebuilding has been a challenging task. VicRoads and its maintenance contractors continue the recovery effort, including the management of closed roads, and making temporary and permanent repairs. Introduction
The 2010/11 floods have demonstrated the importance of communicating road closure and alternative routes in managing the community’s expectations. It has also highlighted the impacts this has on regional community, hindering access, tourism and freight for many parts of Victoria.
At the height or peak of the flood events (January 2011), 66 arterial roads and 320 local roads were closed. As at January 2012, 60 arterial roads and in excess of 275 local Council roads have been reopened.
The gross cost of repairs required as a result of the damage caused to arterial road, rail and bridge infrastructure caused by the September to February floods is estimated to be in excess of $120 million. The State Government has provided nominal cash flow amounts to VicRoads to assist with flood recovery with a heavy reliance on cost recovery through insurance claims.
Image 1 – Kerang Township – September 2010
178
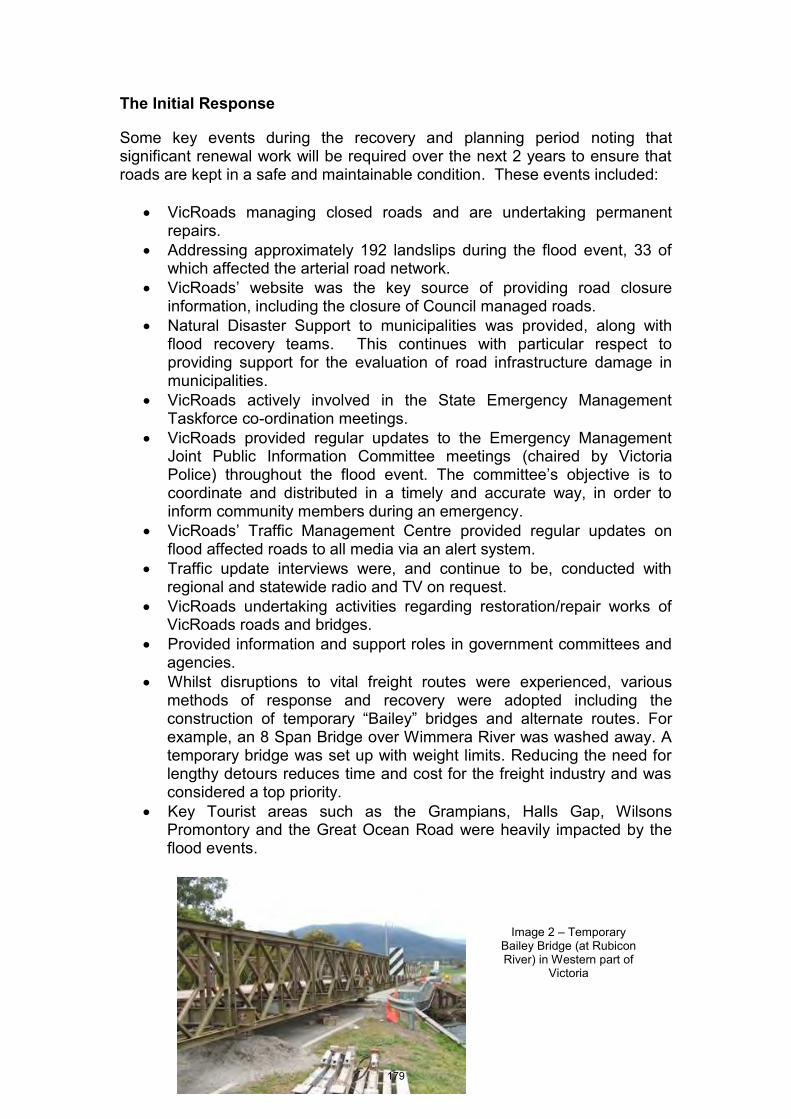
The Initial Response
Some key events during the recovery and planning period noting that significant renewal work will be required over the next 2 years to ensure that roads are kept in a safe and maintainable condition. These events included:
VicRoads managing closed roads and are undertaking permanent repairs.
Addressing approximately 192 landslips during the flood event, 33 of which affected the arterial road network.
VicRoads’ website was the key source of providing road closure information, including the closure of Council managed roads.
Natural Disaster Support to municipalities was provided, along with flood recovery teams. This continues with particular respect to providing support for the evaluation of road infrastructure damage in municipalities.
VicRoads actively involved in the State Emergency Management Taskforce co-ordination meetings.
VicRoads provided regular updates to the Emergency Management Joint Public Information Committee meetings (chaired by Victoria Police) throughout the flood event. The committee’s objective is to coordinate and distributed in a timely and accurate way, in order to inform community members during an emergency.
VicRoads’ Traffic Management Centre provided regular updates on flood affected roads to all media via an alert system.
Traffic update interviews were, and continue to be, conducted with regional and statewide radio and TV on request.
VicRoads undertaking activities regarding restoration/repair works of VicRoads roads and bridges.
Provided information and support roles in government committees and agencies.
Whilst disruptions to vital freight routes were experienced, various methods of response and recovery were adopted including the construction of temporary “Bailey” bridges and alternate routes. For example, an 8 Span Bridge over Wimmera River was washed away. A temporary bridge was set up with weight limits. Reducing the need for lengthy detours reduces time and cost for the freight industry and was considered a top priority.
Key Tourist areas such as the Grampians, Halls Gap, Wilsons Promontory and the Great Ocean Road were heavily impacted by the flood events.
Image 2 – Temporary Bailey Bridge (at Rubicon River) in Western part of
Victoria
179
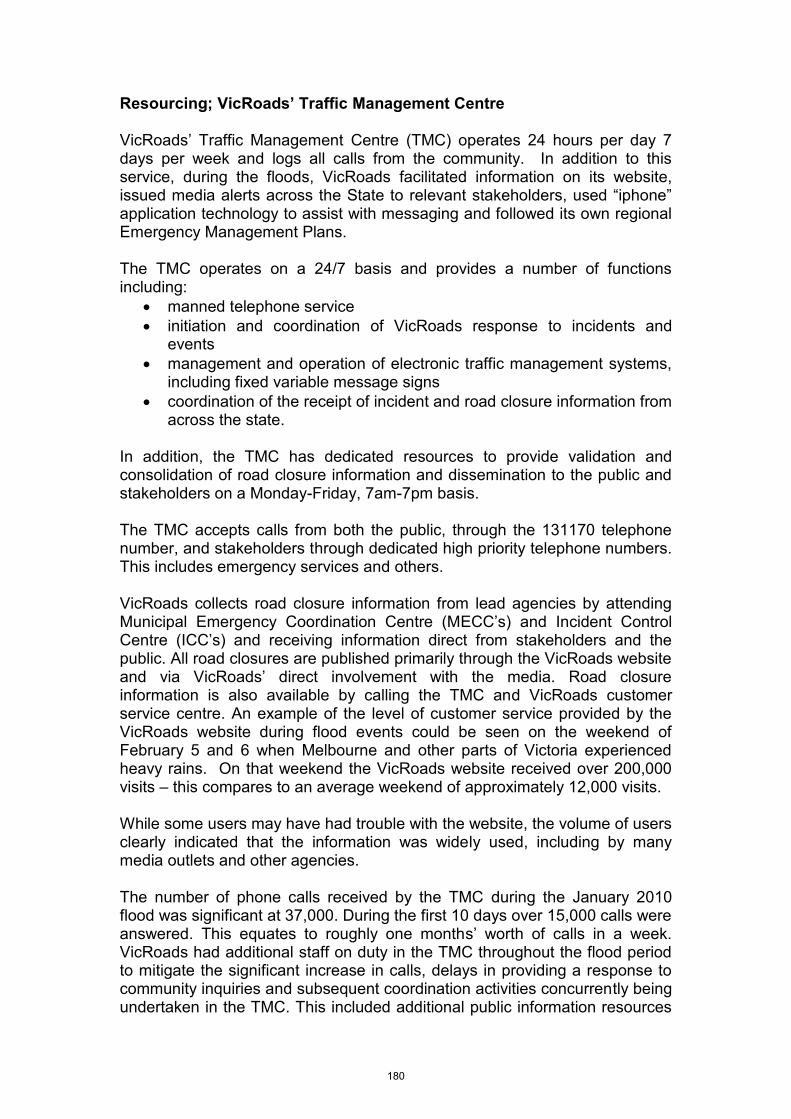
Resourcing; VicRoads’ Traffic Management Centre VicRoads’ Traffic Management Centre (TMC) operates 24 hours per day 7 days per week and logs all calls from the community. In addition to this service, during the floods, VicRoads facilitated information on its website, issued media alerts across the State to relevant stakeholders, used “iphone” application technology to assist with messaging and followed its own regional Emergency Management Plans. The TMC operates on a 24/7 basis and provides a number of functions including:
manned telephone service initiation and coordination of VicRoads response to incidents and
events management and operation of electronic traffic management systems,
including fixed variable message signs coordination of the receipt of incident and road closure information from
across the state. In addition, the TMC has dedicated resources to provide validation and consolidation of road closure information and dissemination to the public and stakeholders on a Monday-Friday, 7am-7pm basis. The TMC accepts calls from both the public, through the 131170 telephone number, and stakeholders through dedicated high priority telephone numbers. This includes emergency services and others. VicRoads collects road closure information from lead agencies by attending Municipal Emergency Coordination Centre (MECC’s) and Incident Control Centre (ICC’s) and receiving information direct from stakeholders and the public. All road closures are published primarily through the VicRoads website and via VicRoads’ direct involvement with the media. Road closure information is also available by calling the TMC and VicRoads customer service centre. An example of the level of customer service provided by the VicRoads website during flood events could be seen on the weekend of February 5 and 6 when Melbourne and other parts of Victoria experienced heavy rains. On that weekend the VicRoads website received over 200,000 visits – this compares to an average weekend of approximately 12,000 visits. While some users may have had trouble with the website, the volume of users clearly indicated that the information was widely used, including by many media outlets and other agencies. The number of phone calls received by the TMC during the January 2010 flood was significant at 37,000. During the first 10 days over 15,000 calls were answered. This equates to roughly one months’ worth of calls in a week. VicRoads had additional staff on duty in the TMC throughout the flood period to mitigate the significant increase in calls, delays in providing a response to community inquiries and subsequent coordination activities concurrently being undertaken in the TMC. This included additional public information resources
180
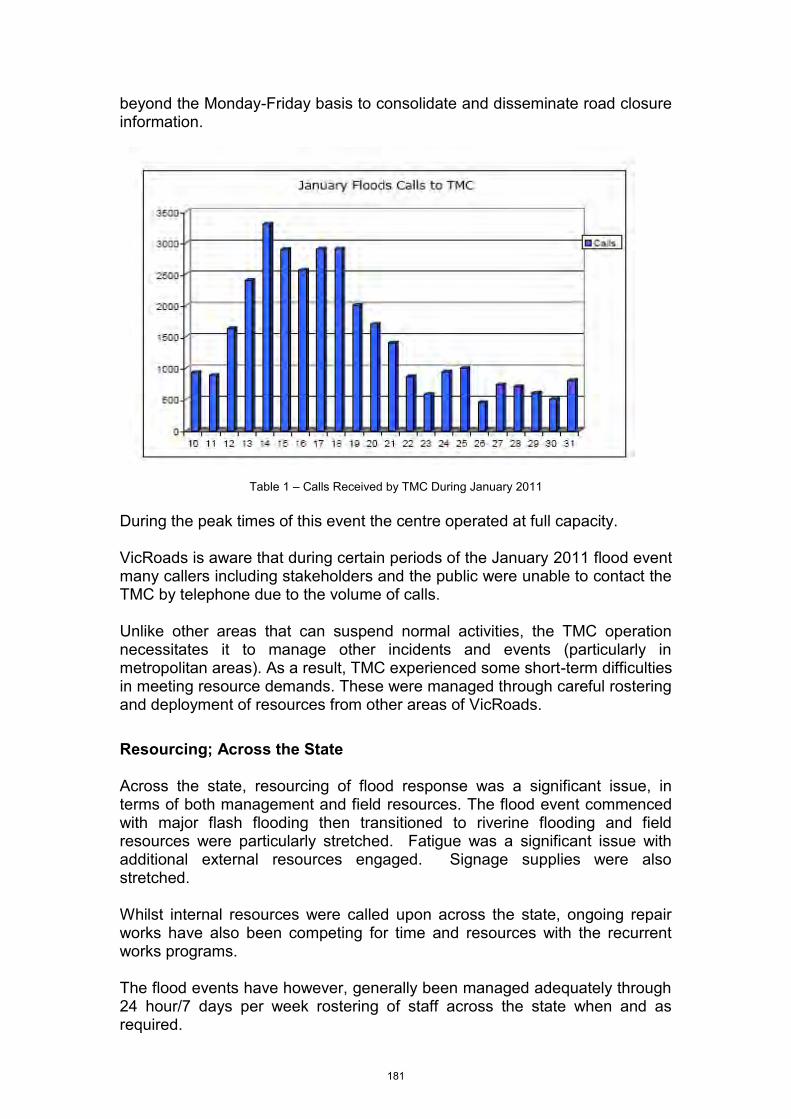
beyond the Monday-Friday basis to consolidate and disseminate road closure information.
Table 1 – Calls Received by TMC During January 2011 During the peak times of this event the centre operated at full capacity. VicRoads is aware that during certain periods of the January 2011 flood event many callers including stakeholders and the public were unable to contact the TMC by telephone due to the volume of calls. Unlike other areas that can suspend normal activities, the TMC operation necessitates it to manage other incidents and events (particularly in metropolitan areas). As a result, TMC experienced some short-term difficulties in meeting resource demands. These were managed through careful rostering and deployment of resources from other areas of VicRoads. Resourcing; Across the State Across the state, resourcing of flood response was a significant issue, in terms of both management and field resources. The flood event commenced with major flash flooding then transitioned to riverine flooding and field resources were particularly stretched. Fatigue was a significant issue with additional external resources engaged. Signage supplies were also stretched. Whilst internal resources were called upon across the state, ongoing repair works have also been competing for time and resources with the recurrent works programs. The flood events have however, generally been managed adequately through 24 hour/7 days per week rostering of staff across the state when and as required.
181
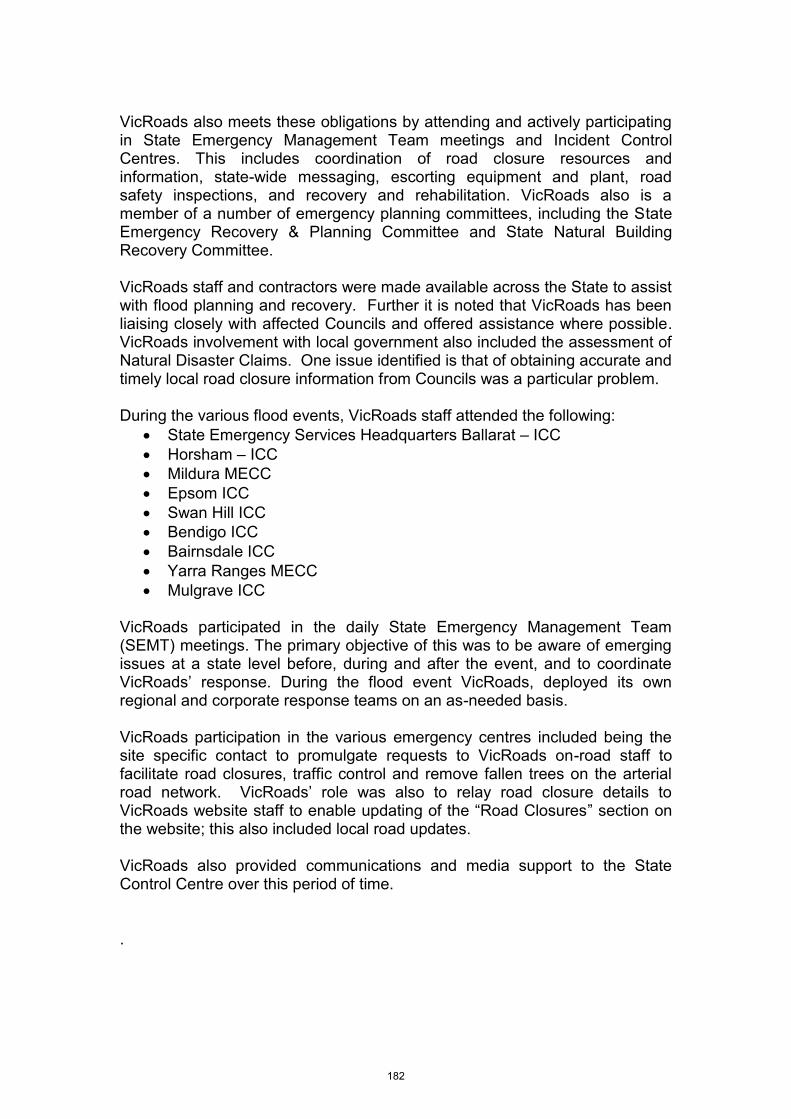
VicRoads also meets these obligations by attending and actively participating in State Emergency Management Team meetings and Incident Control Centres. This includes coordination of road closure resources and information, state-wide messaging, escorting equipment and plant, road safety inspections, and recovery and rehabilitation. VicRoads also is a member of a number of emergency planning committees, including the State Emergency Recovery & Planning Committee and State Natural Building Recovery Committee. VicRoads staff and contractors were made available across the State to assist with flood planning and recovery. Further it is noted that VicRoads has been liaising closely with affected Councils and offered assistance where possible. VicRoads involvement with local government also included the assessment of Natural Disaster Claims. One issue identified is that of obtaining accurate and timely local road closure information from Councils was a particular problem. During the various flood events, VicRoads staff attended the following:
State Emergency Services Headquarters Ballarat – ICC Horsham – ICC Mildura MECC Epsom ICC Swan Hill ICC Bendigo ICC Bairnsdale ICC Yarra Ranges MECC Mulgrave ICC
VicRoads participated in the daily State Emergency Management Team (SEMT) meetings. The primary objective of this was to be aware of emerging issues at a state level before, during and after the event, and to coordinate VicRoads’ response. During the flood event VicRoads, deployed its own regional and corporate response teams on an as-needed basis. VicRoads participation in the various emergency centres included being the site specific contact to promulgate requests to VicRoads on-road staff to facilitate road closures, traffic control and remove fallen trees on the arterial road network. VicRoads’ role was also to relay road closure details to VicRoads website staff to enable updating of the “Road Closures” section on the website; this also included local road updates. VicRoads also provided communications and media support to the State Control Centre over this period of time. .
182
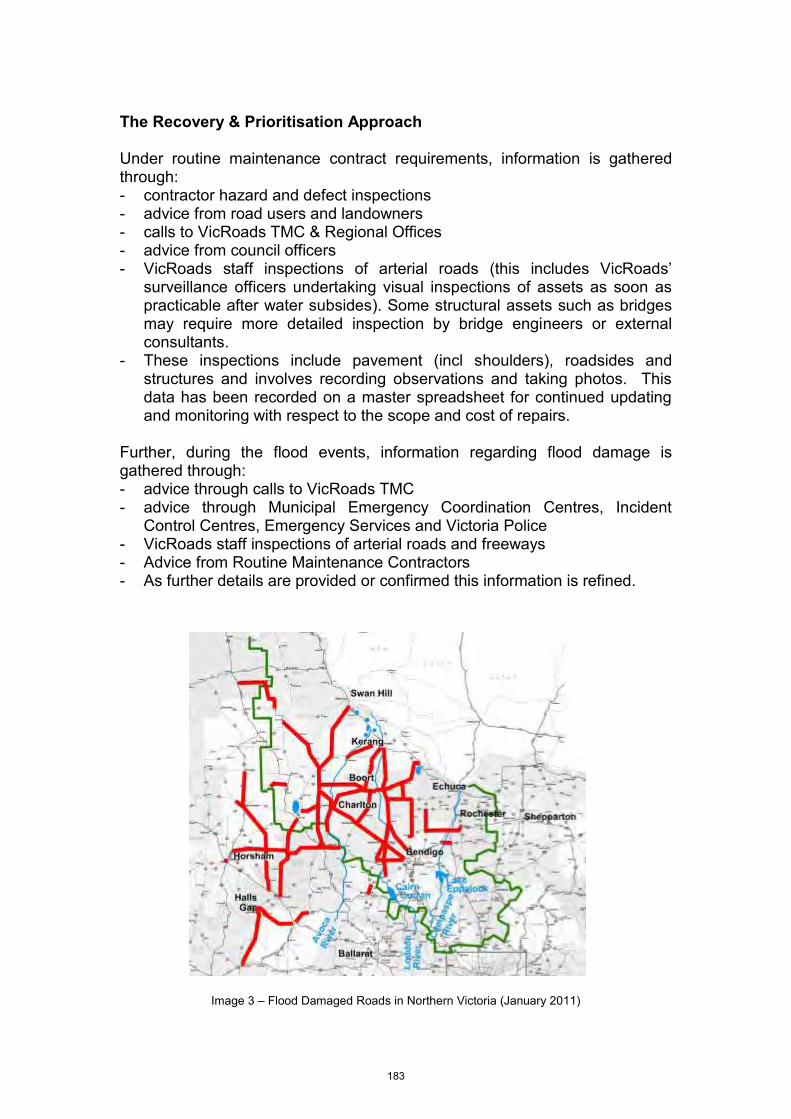
The Recovery & Prioritisation Approach Under routine maintenance contract requirements, information is gathered through: - contractor hazard and defect inspections - advice from road users and landowners - calls to VicRoads TMC & Regional Offices - advice from council officers - VicRoads staff inspections of arterial roads (this includes VicRoads’
surveillance officers undertaking visual inspections of assets as soon as practicable after water subsides). Some structural assets such as bridges may require more detailed inspection by bridge engineers or external consultants.
- These inspections include pavement (incl shoulders), roadsides and structures and involves recording observations and taking photos. This data has been recorded on a master spreadsheet for continued updating and monitoring with respect to the scope and cost of repairs.
Further, during the flood events, information regarding flood damage is gathered through: - advice through calls to VicRoads TMC - advice through Municipal Emergency Coordination Centres, Incident
Control Centres, Emergency Services and Victoria Police - VicRoads staff inspections of arterial roads and freeways - Advice from Routine Maintenance Contractors - As further details are provided or confirmed this information is refined.
Image 3 – Flood Damaged Roads in Northern Victoria (January 2011)
183
The prioritisation process follows the requirements under the Road Management Act 2004 and therefore VicRoads’ Road Management Plan (in consultation with relevant stakeholders). In summary, the process involved: 1st – ensure any damage that could impact road user safety was addressed immediately (eg. closing roads that were inundated). 2nd – undertake any immediate emergency works that would result in opening roads to road users (eg fallen tree removal, addressing blocked pits and culverts). Priority was given to reinstating access for communities and individuals who have been “cut-off” by road closures. Also to provide access to industry including, freight, agricultural and tourism. 3rd – address roads that were causing road congestion / delays (eg roads which were reduced to one way contra flow were addressed next. Works included reinstating washed out culverts or pavement material) 4th – prepared a monitoring list of sites that had incurred land slips. These sites were subsequently inspected by geotechnical engineers, to help prioritise works. It is noted that all reinstatement of assets at this stage are to current standards of construction noting the extent of damage, function and form of asset prior to damage (eg. Destroyed timber bridges). The use of VicRoads’ Technical Consulting Group (during and after the flood events) was also adopted in terms of geotechnical assistance in addressing landslides, erosion and damaged bridge and culvert foundations. It should be noted that due to similar requests from municipalities and other government agencies (i.e. Parks Victoria, V-Line, and Catchment Management Authorities), this resource was stretched across the State. Whilst VicRoads has continued to focus and treat flood recovery on the arterial road network with the utmost priority, it has placed a heavy burden on resourcing (including materials, plant and contractor resources). This is expected to remain challenging for the next 2 years. This is a challenge for VicRoads staff and contractors to identify and commit the works and maintain expenditure control. This will involve ongoing liaison with other key stakeholders such as councils, in order to best prioritise works across the State. Further, the defects caused by the floods are constantly changing. As pavements dry out, the failed areas expand rapidly and further acceleration of pavement cracking, crack sealing and possible excessive potholing in the road network. This may lead to further pavement deterioration ie need for periodic maintenance (reseals/overlays etc.) and pavement rehabilitation works, if timely crack sealing is not undertaken.
184
Resources include deciding road closures which could be signed only (not necessarily manned) or manned dependant on the road and closure, including detour routes involved. However, in some instances where Contractor resources were fully utilised other contractors (i.e. traffic management companies) or in some cases i.e. February event, VicRoads’ Transport Safety Services personnel were utilised. Considering the size of the event, the capacity to respond was generally good. There was some concern expressed generally during the set up of physical road closures particularly in the first few days of the January event as there was a shortage of signs at the peak floods. Closure signage was often provided but detour signage was not available for detour routes. Councils were able to assist in some cases but faced the same problems affecting their roads. Further, for the February flood event VicRoads’ routine Contractors did not have adequate numbers of ‘Water On Road’ signage. Signage and manning of road closures are prioritised according to road function, with priority routes inspected
185
Key Learnings/Way Forward In acknowledgement of the phenomenal effort of recovery across the State and the work undertaken by staff and contractors alike, an internal VicRoads debrief was undertaken during March 2011. This debrief formed part of an overall review of how VicRoads provides information to the public and it has subsequently undertaken a project to provide map-based road closure information for all emergencies in addition to the previous list of roads provided on the website. This will greatly assist people to find which roads are still open rather than just the ones which are closed, thus providing and helping the community to select a route between A and B. It is likely that this will also significantly reduce the number of phone calls VicRoads’ Traffic management Centre (TMC). For the 2010/2011 events, in acknowledging the fast moving event, the provision of updated mapping wasn’t the most practical solution. By the time information was received to be mapped it would essentially be out of date so to suggest an ‘up to the minute’ mapping service was going to solve the issues of accurate public information wasn’t necessarily correct It is expected that the current review will provide better understanding of the road closure process is be developed in order to address any future criticism in the future and to develop ways of being able to present future road closure information in a more user friendly and informative way. There was confusion in media circles as to the timeliness of road closure information on the website. The general community needs to be aware that there is an official and agreed process with other agencies as to what constitutes an official road closure or opening and what needs to happen before it’s either posted to or removed from a website. This includes a better understanding of other authorities capability and capacity in general ie. Victoria Police and SES, including local government would assist this process. As outlined in the Regional Emergency Management Plan, the role of a REMO (Regional Emergency Management Officer) is to coordinate response and recovery activities in the event of a response request from an Emergency Response Coordinator requiring VicRoads to respond under the State Emergency Response Plan (SERP). Specifically, if notification is received by the REMO of an impending or possible SERP emergency, the REMO will: 1. place appropriate personnel and physical resources on alert and 2. seek information on the nature and scope of the emergency to enable appropriate resources to be mobilised. The nature and scope of the impending or possible emergency will determine whether the REMO activates the Region's Emergency Operations Centre (EOC) at this time.
186
VicRoads’ Regional Emergency Management Officers (REMO) attends all Regional Emergency Recovery Planning Committee & MEMPC meetings VicRoads agency reports are tabled at each of these meetings. Victoria Police with executive support provided by State Emergency Service staff are the lead agency for each RERPC. Generally each region RERPC has a “Draft Implementation and Transition Paper” to create an integrated approach to Emergency Management planning in the region that will strengthen emergency management preparedness. The structure complies with the regional response and recovery planning objectives as detailed in the EMMV Part 5. As well, a “Draft” Regional Response Plan is being considered. Adoption of the “Draft Implementation and Transition Paper” as referred to above will provide a mechanism for all the relevant agencies to participate in their respective element/s of emergency management. Further, VicRoads is also consulted in the development of other management plans such as Melbourne Water, Flood management plans. Further, VicRoads’ undertake annual reviews of their own regional emergency response plans (REMP) and provides ongoing training as required. It will also consider a central repository for the EMP’s. It is considered that the extent of reviewing and exercising conducted is adequate to ensure the effectiveness of regional response plans. VicRoads has been involved in exercises held by VicPol which assisted in testing response arrangements. One of the key issues associated with exercising effectiveness of regional response plans is a lack of knowledge of all the various players involved including who VicPol and IFMP interacts with and in what capacity. Other key findings/discussion points resulting from the review include:
Road closures condition status is vital for emergency planning by the relevant agencies.
Communities and road users require access to road closure and alternative route information presented in an appropriate format (ideally mapping).
Having a presence in the community is important: physical (marked vehicles and staff), media updates.
Inventory list created and a process implemented that during initial stages of an emergency the list is distributed to Regions to itemise what is available. Each business area/region to develop a pool or resources and provide adequate training.
Current Emergency Management Plans to be placed in the appropriate databases for access. Ensure each Region has laptops/aircards to be allocated for emergency purposes.
High volumes of public enquiries to the TMC specifically about route information. Projects underway to map floods and to improve online communications to customers and staff.
187
Develop a VicRoads wide communications strategy to keep the community informed about ongoing works to rebuild/repair the network. Also to discuss with Victoria Police, the importance of getting accurate and consistent information about road closures.
Operations – Regions to meet local council representatives and discuss processes for advising of local road closures
Investigate protocol for staff tracking during emergencies – including the investigation of technologies to assist with this. VicRoads lost a few vehicles during the floods.
Teleconferences to be scheduled daily (or as required) during emergency events. Development of a template agenda for each meeting. Development of generic questions commonly asked to help provide an idea of the information which could be included. Acknowledgment of the importance of real-time situation reports (SITREPs) for communication and operational management of the emergency. Expanding the tools to communicate emergency road closure information to map based technologies and social media tools (Twitter).
Need identified for review of the processes for reporting the opening/closure of local road and the inconsistency when other agencies report road closure information.
Innovative campaign identified in Northern Region - ‘We’ll be back’ (see below for sign) once the initial quick fix was finished. There is scope for us to mobilise a more permanent solution. Develop a VicRoads wide communications strategy to keep the community informed about ongoing works to rebuild/repair the network.
Image 4 – An Example of the Community Information Provided
FLOOD AFFECTED ROAD
Permanent repairs are planned
Please be patient
We’ll be back
188
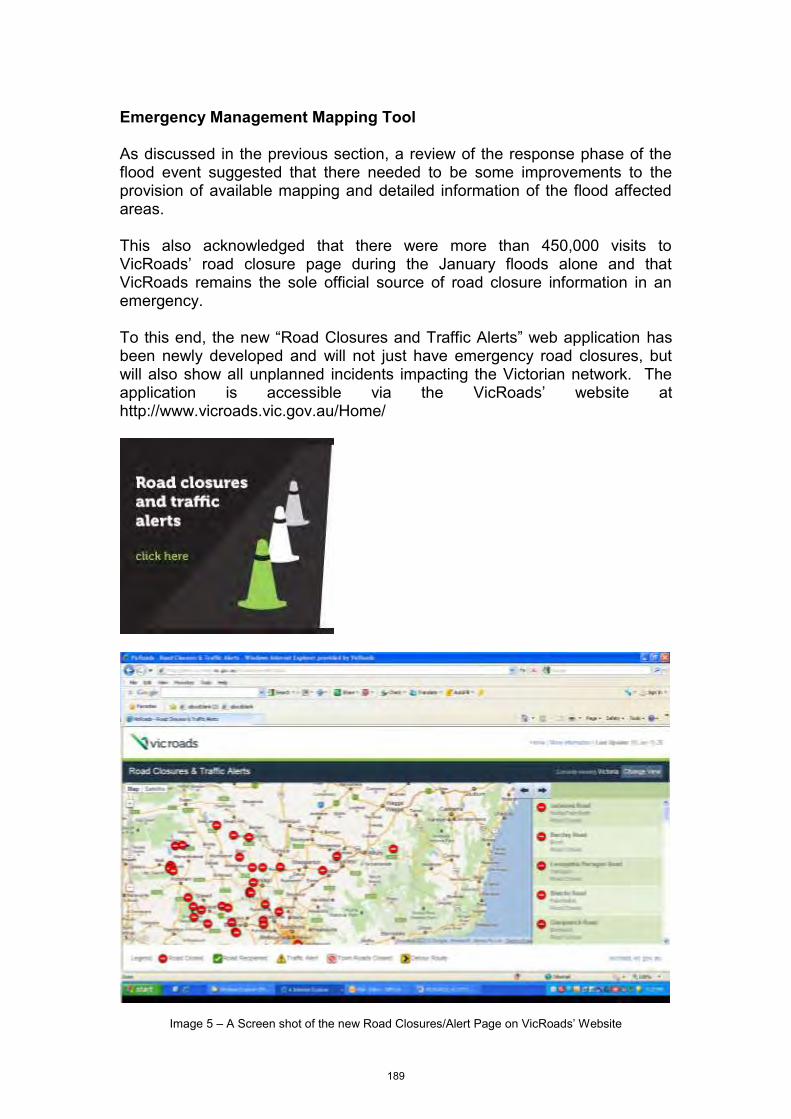
Emergency Management Mapping Tool As discussed in the previous section, a review of the response phase of the flood event suggested that there needed to be some improvements to the provision of available mapping and detailed information of the flood affected areas. This also acknowledged that there were more than 450,000 visits to VicRoads’ road closure page during the January floods alone and that VicRoads remains the sole official source of road closure information in an emergency. To this end, the new “Road Closures and Traffic Alerts” web application has been newly developed and will not just have emergency road closures, but will also show all unplanned incidents impacting the Victorian network. The application is accessible via the VicRoads’ website at http://www.vicroads.vic.gov.au/Home/
Image 5 – A Screen shot of the new Road Closures/Alert Page on VicRoads’ Website
189
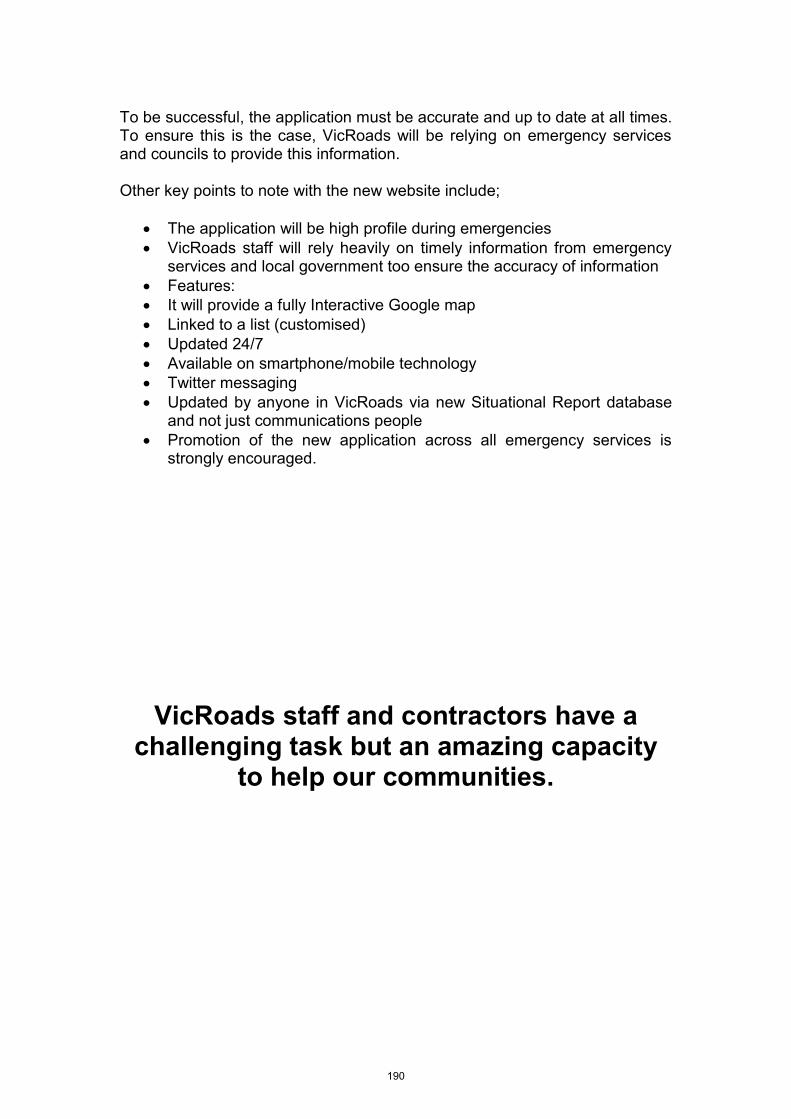
To be successful, the application must be accurate and up to date at all times. To ensure this is the case, VicRoads will be relying on emergency services and councils to provide this information. Other key points to note with the new website include;
The application will be high profile during emergencies VicRoads staff will rely heavily on timely information from emergency
services and local government too ensure the accuracy of information Features: It will provide a fully Interactive Google map Linked to a list (customised) Updated 24/7 Available on smartphone/mobile technology Twitter messaging Updated by anyone in VicRoads via new Situational Report database
and not just communications people Promotion of the new application across all emergency services is
strongly encouraged.
VicRoads staff and contractors have a
challenging task but an amazing capacity to help our communities.
190
Reference List Brown, S, June 2011, “Rebuilding after the 2010/11 Floods”, a presentation to the 2011 Victorian Transport Conference VicRoads, May 2011, Submission to the Victorian Floods Review VicRoads, 16 June 2011, Flood Debrief Paper, presented to VicRoads’ Corporate Management Group VicRoads. November 2011; “Road Closures and Traffic Alerts web application”; presentation to VicRoads internal staff
191
Emergency preparedness for those who care forinfants in developed country contextsGribble and Berry
Gribble and Berry International Breastfeeding Journal 2011, 6:16http://www.internationalbreastfeedingjournal.com/content/6/1/16 (7 November 2011)
192
REVIEW Open Access
Emergency preparedness for those who care forinfants in developed country contextsKarleen D Gribble1* and Nina J Berry2
AbstractEmergency management organisations recognise the vulnerability of infants in emergencies, even in developedcountries. However, thus far, those who care for infants have not been provided with detailed information on whatemergency preparedness entails. Emergency management authorities should provide those who care for infantswith accurate and detailed information on the supplies necessary to care for them in an emergency, distinguishingbetween the needs of breastfed infants and the needs of formula fed infants. Those who care for formula fedinfants should be provided with detailed information on the supplies necessary for an emergency preparedness kitand with information on how to prepare formula feeds in an emergency. An emergency preparedness kit forexclusively breastfed infants should include 100 nappies and 200 nappy wipes. The contents of an emergencypreparedness for formula fed infants will vary depending upon whether ready-to-use liquid infant formula orpowdered infant formula is used. If ready-to-use liquid infant formula is used, an emergency kit should include: 56serves of ready-to-use liquid infant formula, 84 L water, storage container, metal knife, small bowl, 56 feedingbottles and teats/cups, 56 zip-lock plastic bags, 220 paper towels, detergent, 120 antiseptic wipes, 100 nappies and200 nappy wipes. If powdered infant formula is used, an emergency preparedness kit should include: two 900 gtins powdered infant formula, 170 L drinking water, storage container, large cooking pot with lid, kettle, gas stove,box of matches/lighter, 14 kg liquid petroleum gas, measuring container, metal knife, metal tongs, feeding cup,300 large sheets paper towel, detergent, 100 nappies and 200 nappy wipes. Great care with regards hygieneshould be taken in the preparation of formula feeds. Child protection organisations should ensure that foster carersresponsible for infants have the resources necessary to formula feed in the event of an emergency. Exclusive andcontinued breastfeeding should be promoted as an emergency preparedness activity by emergency managementorganisations as well as health authorities. The greater the proportion of infants exclusively breastfed when anemergency occurs, the more resilient the community, and the easier it will be to provide effective aid to thecaregivers of formula fed infants.
Keywords: disasters, emergencies, infant formula, artificial feeding, breastfeeding, emergency preparedness
IntroductionThe World Health Organization and UNICEF GlobalStrategy on Infant and Young Child Feeding recom-mends that infants be exclusively breastfed for the firstsix months of life and then continue to be breastfed,with the addition of complementary foods, for two yearsor more [1]. In an emergency situation, infants who areexclusively breastfed have their health and well beingprotected by the food, water and immune factors
provided by breast milk. Breastfeeding also mitigatesphysiological responses to stress in both infants andtheir mothers, helping them to cope with the stress ofbeing caught up in an emergency situation [2]. However,the majority of children in developed countries havetheir intake of breast milk partially or totally replaced byinfant formula in their first year of life [e.g. [3-5]]. Indeveloping country contexts, formula feeding is fre-quently fatal to the infant [6,7]. In developed countries,good infrastructure, including easy access to cleanwater, electricity and medical care, means that relativelyfew infants die as result of formula feeding [8]. The lowmortality rate associated with formula feeding in
* Correspondence: [email protected] of Nursing and Midwifery, University of Western Sydney, Locked Bag1797, Penrith NSW. 2751. AustraliaFull list of author information is available at the end of the article
Gribble and Berry International Breastfeeding Journal 2011, 6:16http://www.internationalbreastfeedingjournal.com/content/6/1/16
© 2011 Gribble and Berry; licensee BioMed Central Ltd. This is an Open Access article distributed under the terms of the CreativeCommons Attribution License (http://creativecommons.org/licenses/by/2.0), which permits unrestricted use, distribution, andreproduction in any medium, provided the original work is properly cited.
193
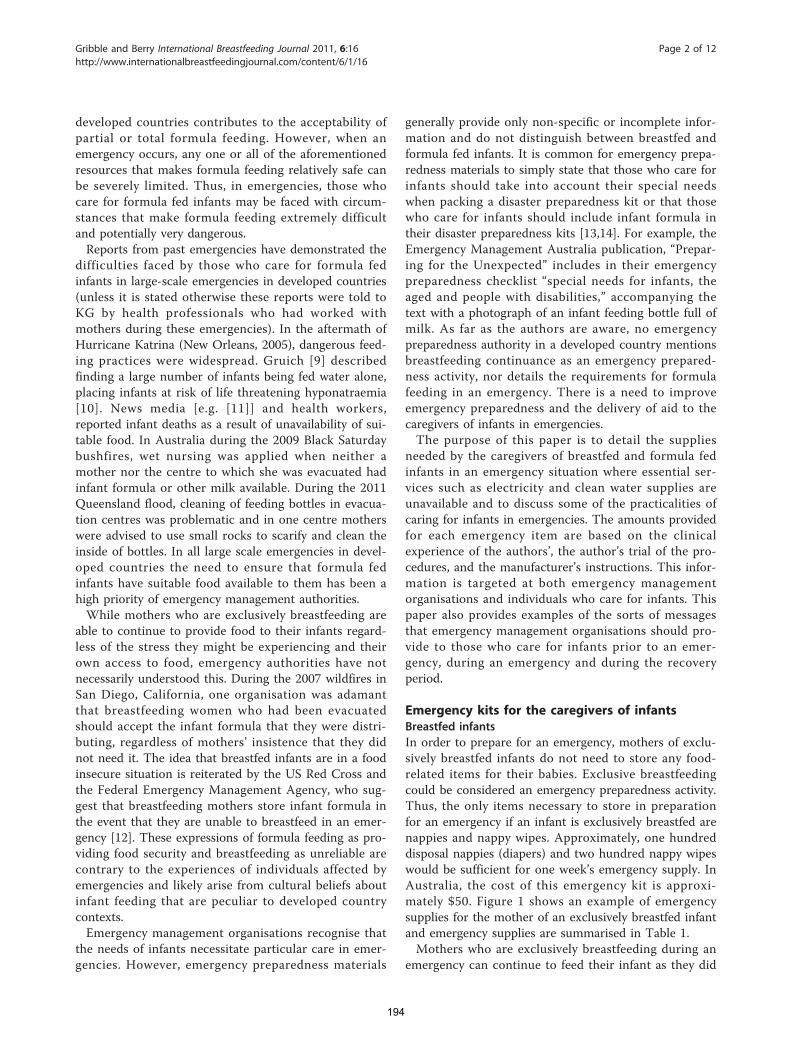
developed countries contributes to the acceptability ofpartial or total formula feeding. However, when anemergency occurs, any one or all of the aforementionedresources that makes formula feeding relatively safe canbe severely limited. Thus, in emergencies, those whocare for formula fed infants may be faced with circum-stances that make formula feeding extremely difficultand potentially very dangerous.Reports from past emergencies have demonstrated the
difficulties faced by those who care for formula fedinfants in large-scale emergencies in developed countries(unless it is stated otherwise these reports were told toKG by health professionals who had worked withmothers during these emergencies). In the aftermath ofHurricane Katrina (New Orleans, 2005), dangerous feed-ing practices were widespread. Gruich [9] describedfinding a large number of infants being fed water alone,placing infants at risk of life threatening hyponatraemia[10]. News media [e.g. [11]] and health workers,reported infant deaths as a result of unavailability of sui-table food. In Australia during the 2009 Black Saturdaybushfires, wet nursing was applied when neither amother nor the centre to which she was evacuated hadinfant formula or other milk available. During the 2011Queensland flood, cleaning of feeding bottles in evacua-tion centres was problematic and in one centre motherswere advised to use small rocks to scarify and clean theinside of bottles. In all large scale emergencies in devel-oped countries the need to ensure that formula fedinfants have suitable food available to them has been ahigh priority of emergency management authorities.While mothers who are exclusively breastfeeding are
able to continue to provide food to their infants regard-less of the stress they might be experiencing and theirown access to food, emergency authorities have notnecessarily understood this. During the 2007 wildfires inSan Diego, California, one organisation was adamantthat breastfeeding women who had been evacuatedshould accept the infant formula that they were distri-buting, regardless of mothers’ insistence that they didnot need it. The idea that breastfed infants are in a foodinsecure situation is reiterated by the US Red Cross andthe Federal Emergency Management Agency, who sug-gest that breastfeeding mothers store infant formula inthe event that they are unable to breastfeed in an emer-gency [12]. These expressions of formula feeding as pro-viding food security and breastfeeding as unreliable arecontrary to the experiences of individuals affected byemergencies and likely arise from cultural beliefs aboutinfant feeding that are peculiar to developed countrycontexts.Emergency management organisations recognise that
the needs of infants necessitate particular care in emer-gencies. However, emergency preparedness materials
generally provide only non-specific or incomplete infor-mation and do not distinguish between breastfed andformula fed infants. It is common for emergency prepa-redness materials to simply state that those who care forinfants should take into account their special needswhen packing a disaster preparedness kit or that thosewho care for infants should include infant formula intheir disaster preparedness kits [13,14]. For example, theEmergency Management Australia publication, “Prepar-ing for the Unexpected” includes in their emergencypreparedness checklist “special needs for infants, theaged and people with disabilities,” accompanying thetext with a photograph of an infant feeding bottle full ofmilk. As far as the authors are aware, no emergencypreparedness authority in a developed country mentionsbreastfeeding continuance as an emergency prepared-ness activity, nor details the requirements for formulafeeding in an emergency. There is a need to improveemergency preparedness and the delivery of aid to thecaregivers of infants in emergencies.The purpose of this paper is to detail the supplies
needed by the caregivers of breastfed and formula fedinfants in an emergency situation where essential ser-vices such as electricity and clean water supplies areunavailable and to discuss some of the practicalities ofcaring for infants in emergencies. The amounts providedfor each emergency item are based on the clinicalexperience of the authors’, the author’s trial of the pro-cedures, and the manufacturer’s instructions. This infor-mation is targeted at both emergency managementorganisations and individuals who care for infants. Thispaper also provides examples of the sorts of messagesthat emergency management organisations should pro-vide to those who care for infants prior to an emer-gency, during an emergency and during the recoveryperiod.
Emergency kits for the caregivers of infantsBreastfed infantsIn order to prepare for an emergency, mothers of exclu-sively breastfed infants do not need to store any food-related items for their babies. Exclusive breastfeedingcould be considered an emergency preparedness activity.Thus, the only items necessary to store in preparationfor an emergency if an infant is exclusively breastfed arenappies and nappy wipes. Approximately, one hundreddisposal nappies (diapers) and two hundred nappy wipeswould be sufficient for one week’s emergency supply. InAustralia, the cost of this emergency kit is approxi-mately $50. Figure 1 shows an example of emergencysupplies for the mother of an exclusively breastfed infantand emergency supplies are summarised in Table 1.Mothers who are exclusively breastfeeding during an
emergency can continue to feed their infant as they did
Gribble and Berry International Breastfeeding Journal 2011, 6:16http://www.internationalbreastfeedingjournal.com/content/6/1/16
Page 2 of 12
194
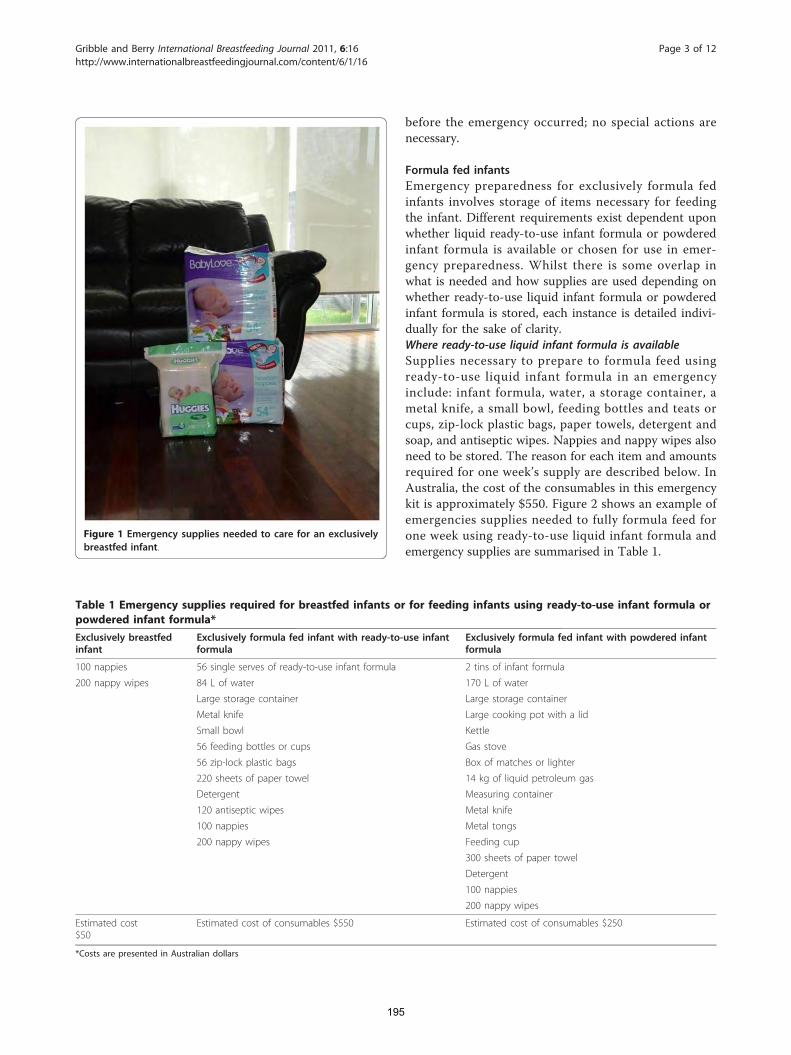
before the emergency occurred; no special actions arenecessary.
Formula fed infantsEmergency preparedness for exclusively formula fedinfants involves storage of items necessary for feedingthe infant. Different requirements exist dependent uponwhether liquid ready-to-use infant formula or powderedinfant formula is available or chosen for use in emer-gency preparedness. Whilst there is some overlap inwhat is needed and how supplies are used depending onwhether ready-to-use liquid infant formula or powderedinfant formula is stored, each instance is detailed indivi-dually for the sake of clarity.Where ready-to-use liquid infant formula is availableSupplies necessary to prepare to formula feed usingready-to-use liquid infant formula in an emergencyinclude: infant formula, water, a storage container, ametal knife, a small bowl, feeding bottles and teats orcups, zip-lock plastic bags, paper towels, detergent andsoap, and antiseptic wipes. Nappies and nappy wipes alsoneed to be stored. The reason for each item and amountsrequired for one week’s supply are described below. InAustralia, the cost of the consumables in this emergencykit is approximately $550. Figure 2 shows an example ofemergencies supplies needed to fully formula feed forone week using ready-to-use liquid infant formula andemergency supplies are summarised in Table 1.
Figure 1 Emergency supplies needed to care for an exclusivelybreastfed infant.
Table 1 Emergency supplies required for breastfed infants or for feeding infants using ready-to-use infant formula orpowdered infant formula*Exclusively breastfedinfant
Exclusively formula fed infant with ready-to-use infantformula
Exclusively formula fed infant with powdered infantformula
100 nappies 56 single serves of ready-to-use infant formula 2 tins of infant formula
200 nappy wipes 84 L of water 170 L of water
Large storage container Large storage container
Metal knife Large cooking pot with a lid
Small bowl Kettle
56 feeding bottles or cups Gas stove
56 zip-lock plastic bags Box of matches or lighter
220 sheets of paper towel 14 kg of liquid petroleum gas
Detergent Measuring container
120 antiseptic wipes Metal knife
100 nappies Metal tongs
200 nappy wipes Feeding cup
300 sheets of paper towel
Detergent
100 nappies
200 nappy wipes
Estimated cost$50
Estimated cost of consumables $550 Estimated cost of consumables $250
*Costs are presented in Australian dollars
Gribble and Berry International Breastfeeding Journal 2011, 6:16http://www.internationalbreastfeedingjournal.com/content/6/1/16
Page 3 of 12
195
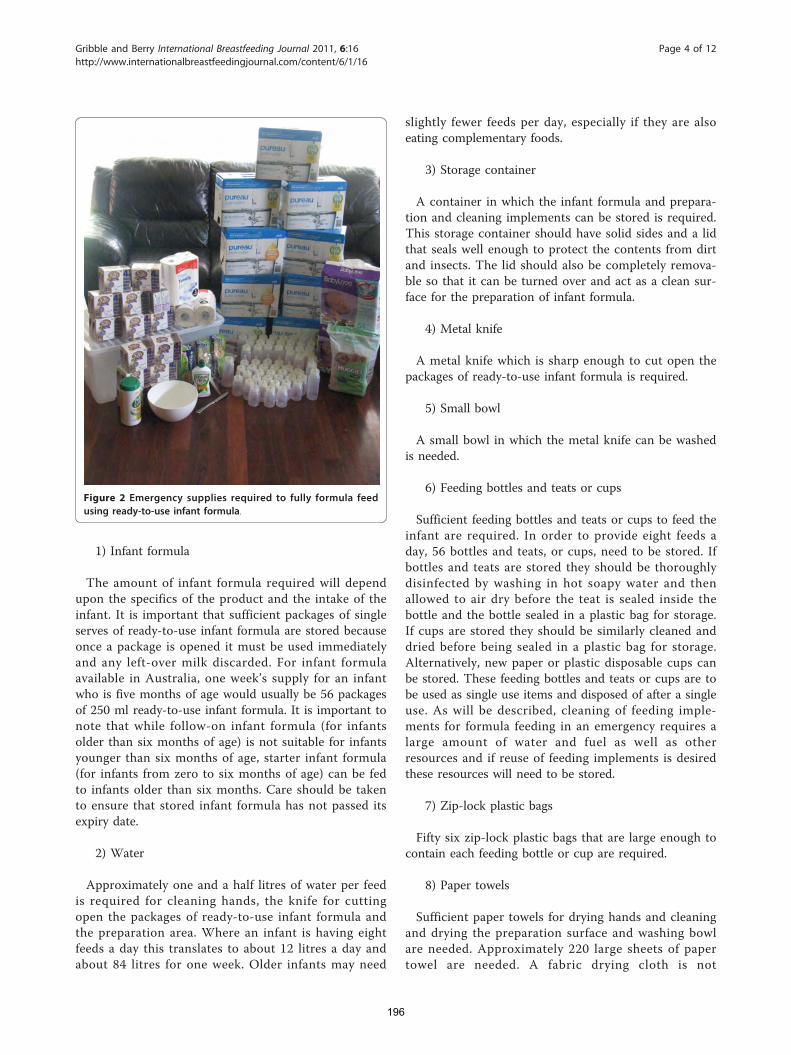
1) Infant formula
The amount of infant formula required will dependupon the specifics of the product and the intake of theinfant. It is important that sufficient packages of singleserves of ready-to-use infant formula are stored becauseonce a package is opened it must be used immediatelyand any left-over milk discarded. For infant formulaavailable in Australia, one week’s supply for an infantwho is five months of age would usually be 56 packagesof 250 ml ready-to-use infant formula. It is important tonote that while follow-on infant formula (for infantsolder than six months of age) is not suitable for infantsyounger than six months of age, starter infant formula(for infants from zero to six months of age) can be fedto infants older than six months. Care should be takento ensure that stored infant formula has not passed itsexpiry date.
2) Water
Approximately one and a half litres of water per feedis required for cleaning hands, the knife for cuttingopen the packages of ready-to-use infant formula andthe preparation area. Where an infant is having eightfeeds a day this translates to about 12 litres a day andabout 84 litres for one week. Older infants may need
slightly fewer feeds per day, especially if they are alsoeating complementary foods.
3) Storage container
A container in which the infant formula and prepara-tion and cleaning implements can be stored is required.This storage container should have solid sides and a lidthat seals well enough to protect the contents from dirtand insects. The lid should also be completely remova-ble so that it can be turned over and act as a clean sur-face for the preparation of infant formula.
4) Metal knife
A metal knife which is sharp enough to cut open thepackages of ready-to-use infant formula is required.
5) Small bowl
A small bowl in which the metal knife can be washedis needed.
6) Feeding bottles and teats or cups
Sufficient feeding bottles and teats or cups to feed theinfant are required. In order to provide eight feeds aday, 56 bottles and teats, or cups, need to be stored. Ifbottles and teats are stored they should be thoroughlydisinfected by washing in hot soapy water and thenallowed to air dry before the teat is sealed inside thebottle and the bottle sealed in a plastic bag for storage.If cups are stored they should be similarly cleaned anddried before being sealed in a plastic bag for storage.Alternatively, new paper or plastic disposable cups canbe stored. These feeding bottles and teats or cups are tobe used as single use items and disposed of after a singleuse. As will be described, cleaning of feeding imple-ments for formula feeding in an emergency requires alarge amount of water and fuel as well as otherresources and if reuse of feeding implements is desiredthese resources will need to be stored.
7) Zip-lock plastic bags
Fifty six zip-lock plastic bags that are large enough tocontain each feeding bottle or cup are required.
8) Paper towels
Sufficient paper towels for drying hands and cleaningand drying the preparation surface and washing bowlare needed. Approximately 220 large sheets of papertowel are needed. A fabric drying cloth is not
Figure 2 Emergency supplies required to fully formula feedusing ready-to-use infant formula.
Gribble and Berry International Breastfeeding Journal 2011, 6:16http://www.internationalbreastfeedingjournal.com/content/6/1/16
Page 4 of 12
196
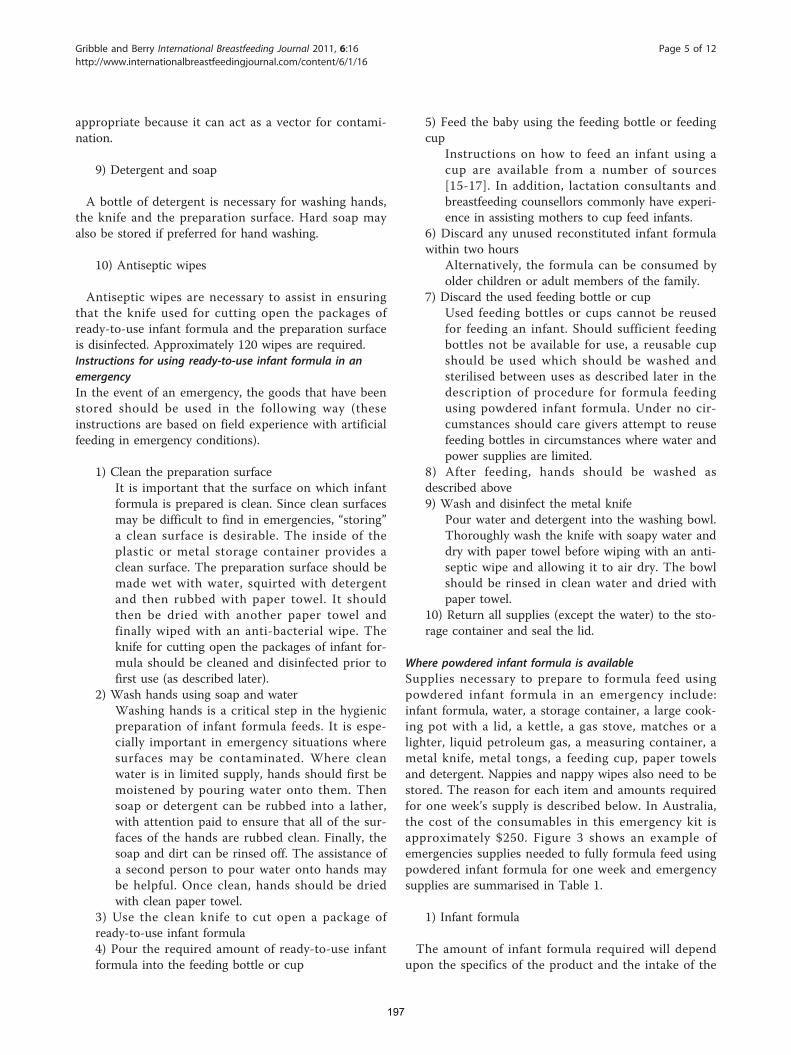
appropriate because it can act as a vector for contami-nation.
9) Detergent and soap
A bottle of detergent is necessary for washing hands,the knife and the preparation surface. Hard soap mayalso be stored if preferred for hand washing.
10) Antiseptic wipes
Antiseptic wipes are necessary to assist in ensuringthat the knife used for cutting open the packages ofready-to-use infant formula and the preparation surfaceis disinfected. Approximately 120 wipes are required.Instructions for using ready-to-use infant formula in anemergencyIn the event of an emergency, the goods that have beenstored should be used in the following way (theseinstructions are based on field experience with artificialfeeding in emergency conditions).
1) Clean the preparation surfaceIt is important that the surface on which infantformula is prepared is clean. Since clean surfacesmay be difficult to find in emergencies, “storing”a clean surface is desirable. The inside of theplastic or metal storage container provides aclean surface. The preparation surface should bemade wet with water, squirted with detergentand then rubbed with paper towel. It shouldthen be dried with another paper towel andfinally wiped with an anti-bacterial wipe. Theknife for cutting open the packages of infant for-mula should be cleaned and disinfected prior tofirst use (as described later).
2) Wash hands using soap and waterWashing hands is a critical step in the hygienicpreparation of infant formula feeds. It is espe-cially important in emergency situations wheresurfaces may be contaminated. Where cleanwater is in limited supply, hands should first bemoistened by pouring water onto them. Thensoap or detergent can be rubbed into a lather,with attention paid to ensure that all of the sur-faces of the hands are rubbed clean. Finally, thesoap and dirt can be rinsed off. The assistance ofa second person to pour water onto hands maybe helpful. Once clean, hands should be driedwith clean paper towel.
3) Use the clean knife to cut open a package ofready-to-use infant formula4) Pour the required amount of ready-to-use infantformula into the feeding bottle or cup
5) Feed the baby using the feeding bottle or feedingcup
Instructions on how to feed an infant using acup are available from a number of sources[15-17]. In addition, lactation consultants andbreastfeeding counsellors commonly have experi-ence in assisting mothers to cup feed infants.
6) Discard any unused reconstituted infant formulawithin two hours
Alternatively, the formula can be consumed byolder children or adult members of the family.
7) Discard the used feeding bottle or cupUsed feeding bottles or cups cannot be reusedfor feeding an infant. Should sufficient feedingbottles not be available for use, a reusable cupshould be used which should be washed andsterilised between uses as described later in thedescription of procedure for formula feedingusing powdered infant formula. Under no cir-cumstances should care givers attempt to reusefeeding bottles in circumstances where water andpower supplies are limited.
8) After feeding, hands should be washed asdescribed above9) Wash and disinfect the metal knife
Pour water and detergent into the washing bowl.Thoroughly wash the knife with soapy water anddry with paper towel before wiping with an anti-septic wipe and allowing it to air dry. The bowlshould be rinsed in clean water and dried withpaper towel.
10) Return all supplies (except the water) to the sto-rage container and seal the lid.
Where powdered infant formula is availableSupplies necessary to prepare to formula feed usingpowdered infant formula in an emergency include:infant formula, water, a storage container, a large cook-ing pot with a lid, a kettle, a gas stove, matches or alighter, liquid petroleum gas, a measuring container, ametal knife, metal tongs, a feeding cup, paper towelsand detergent. Nappies and nappy wipes also need to bestored. The reason for each item and amounts requiredfor one week’s supply is described below. In Australia,the cost of the consumables in this emergency kit isapproximately $250. Figure 3 shows an example ofemergencies supplies needed to fully formula feed usingpowdered infant formula for one week and emergencysupplies are summarised in Table 1.
1) Infant formula
The amount of infant formula required will dependupon the specifics of the product and the intake of the
Gribble and Berry International Breastfeeding Journal 2011, 6:16http://www.internationalbreastfeedingjournal.com/content/6/1/16
Page 5 of 12
197
infant. For infant formula available in Australia, oneweek’s supply for an infant of five months of age wouldusually be two 900 g tins of powdered infant formula. Itis important to note that while follow-on infant formula(for infants older than six months of age) is not suitablefor infants younger than six months of age, starter infantformula (for infants from zero to six months of age) canbe fed to infants older than six months. Care should betaken to ensure that stored infant formula has notpassed its expiry date.
2) Water
Approximately three litres of water per formula feed isrequired to reconstitute infant formula and clean hands,feeding and preparation implements and the preparationsurface. Where an infant is having eight feeds a day thistranslates to about 24 L per day and about 170 L for oneweek. Older infants may need slightly fewer feeds per day,especially if they are also eating complementary foods.Bottled water may be used for reconstitution of powderedinfant formula depending on the mineral concentration ofthe water. In order to be suitable for reconstituting infantformula water should contain less than 200 mg/L sodium,
less than 250 mg/L sulphate and less than 50 mg/L nitrate[18], most bottled drinking water available in developedcountries will meet these requirements.
3) Storage container
A storage container in which the infant formula andpreparation and cleaning implements can be stored isrequired. This storage container should have solid sidesand a lid that seals well enough to protect the contentsfrom dirt and insects. The lid should also be completelyremovable so that it can be turned over to act as a cleansurface for the preparation of infant formula. The sto-rage container can also be used as a basin for washingpreparation and feeding implements or alternatively, aseparate container for washing can be stored.
4) Large cooking pot with a lid
This pot is to be used to boil water for sterilising pre-paration and feeding implements. It needs to be largeenough to be able to completely submerge the measur-ing container, feeding cup, knife and spoon during thesterilisation process. It is always recommended thatimplements used to prepare and feed infant formula besterilised [19], however the need for this process is mag-nified in emergency situations where surfaces can beeasily contaminated. This cooking pot should not beused for purposes other than sterilising (for example, itshould not be used for cooking food).
5) Kettle
A kettle which can be used to boil water on the gasstove for reconstituting infant formula is needed. Thekettle is used to heat water for reconstitution of theinfant formula and for washing feeding and preparationimplements. Heating water for reconstitution of infantformula is necessary because bottled water is not sterileand because powdered infant formula is commonly con-taminated with pathogenic bacteria [19].
6) Gas stove
A gas stove for the heating of the water needed toreconstitute infant formula, clean and sterilise feedingand preparation implements and clean surfaces isrequired. The gas stove should be large enough to safelyheat water in the large cooking pot and kettle.
7) Sufficient matches or a lighter
Matches or a lighter are necessary for the lighting ofthe gas stove. A lighter may be preferable to matches
Figure 3 Emergency supplies required to fully formula feedusing powdered infant formula.
Gribble and Berry International Breastfeeding Journal 2011, 6:16http://www.internationalbreastfeedingjournal.com/content/6/1/16
Page 6 of 12
198
because of the possibility of matches becoming unusableif they come in contact with water. Alternatively, water-proof matches may be stored.
8) Liquid petroleum gas
Approximately 14 kg of liquefied petroleum gas (LPG)is required to heat water for reconstituting infant for-mula and for washing and sterilising. This amount isbased on the following calculation. Energy required toheat 24 L of water from 15°C to boiling temperature atsea level, that is 100°C, is given by the equation Q = mcp (100-15)K (where Q is the amount of energyrequired, m is the mass of water, cp is the heat capacityof water, that is cp = 4.817 kJ/(kg K) and the numbersin parenthesis represent the temperature difference).Then, Q = 23.5 kg ! 4.817 kJ/(kg K) ! 85 K = 9621.96kJ per day of energy required. LPG has a specific caloricvalue of 46.1 MJ/kg. However, this energy cannot beperfectly used to heat water, it is estimated that 90% ofthe energy will be lost. Thus the estimate of the amountof LPG per day required is 2 kg per day or 14 kg forone week. If the gas stove is to be used for cooking,additional fuel will need to be stored.
9) Measuring container
A heatproof, accurate measuring container is requiredfor measuring the water needed to reconstitute theinfant formula and for mixing the infant formula. Infantfeeding bottles cannot be used for reconstitution ofinfant formula because (as will be discussed) they aretoo difficult to clean.
10) Metal knife
A metal knife is needed for levelling measured scoopsof powdered infant formula.
11) Metal spoon.
A metal spoon is needed to mix the powdered infantformula and water.
12) Metal tongs
A pair of metal tongs is needed to remove sterilisedpreparation and feeding implements from hot water.
13) Feeding cup
An open ceramic or metal cup is needed for feedingthe infant. The cup should be shallow enough for thecorners to be able to be easily reached by fingers during
cleaning. Neither a feeding bottle nor a spouted cup isappropriate for feeding an infant in an emergencybecause of the difficulties associated with cleaning themin the absence of running water and electricity/gasplumbing. Infant feeding bottles are particularly difficultto clean adequately even in the best of circumstances; astudy of bottle cleanliness in the UK found that morethan 60% of “cleaned” bottles sampled were contami-nated with bacteria at a level such that they could notbe considered as clean [20]. In an emergency situation,where water may be limited and surfaces contaminated,cleaning feeding bottles and teats adequately may beimpossible, placing infants at a heightened risk of infec-tious disease. Cup feeding is the recommended practicewhen formula feeding is necessary in resource poor set-tings, including in emergencies [16,21-23].
14) Paper towels
Sufficient paper towels for drying hands, the metalknife and spoon and the cooking pot and wiping thepreparation surface are needed. Approximately 300 largesheets of paper towel are needed. A fabric drying clothis not appropriate because it can act as a vector for con-tamination.
15) Detergent
A bottle of detergent is necessary for washing hands,the feeding and preparation implements and the pre-paration surface. Hard soap may also be stored if pre-ferred for hand washing. Anti-bacterial wipes may alsobe stored for wiping down the infant formula prepara-tion surface.
16) Nappies
One hundred disposable nappies.
17) Nappy wipes
Two hundred nappy wipes.Instructions for using powdered infant formula in anemergencyIn the event of an emergency, the goods that have beenstored should be used in the following way (theseinstructions are based on those provided in the publica-tion Safe Preparation and Handling of Powdered InfantFormula [19]).
1) Clean the preparation surfaceIt is important that the surface on which infantformula is prepared is clean. Since clean surfacesmay be difficult to find in emergencies, “storing”
Gribble and Berry International Breastfeeding Journal 2011, 6:16http://www.internationalbreastfeedingjournal.com/content/6/1/16
Page 7 of 12
199
a clean surface is desirable. The inside of theplastic or metal storage container provides aclean surface. The preparation surface should bemade wet with hot water, squirted with detergentand then rubbed with paper towel. It should thenbe dried with another paper towel. The surfacemay also be wiped with anti-bacterial wipes afterwashing with detergent and water. Feeding andpreparation implements should be cleaned andsterilised prior to first use (as described later).
2) Wash hands using soap and waterWashing hands is a critical step in the hygienicpreparation of infant formula. It is especiallyimportant in emergency situations where sur-faces may be contaminated. Where clean water isin limited supply, hands should first be mois-tened by pouring water onto them. Then soap ordetergent can be rubbed into a lather, with atten-tion paid to ensure that all of the surfaces of thehands are rubbed clean. Finally, the soap anddirt can be rinsed off. The assistance of a secondperson to pour water onto hands may be helpful.Once clean, hands should be dried with cleanpaper towel.
3) Boil water for reconstituting powdered infantformula
Boil a sufficient quantity of clean water using thekettle and allow the water to cool for fiveminutes.
4) Measure the required amount of water usingmeasuring container (sterilised after the last feed)
Place the water into the feeding cup (sterilisedafter the last feed).
5) Measure precisely the required amount of pow-dered infant formula
Dip the scoop into the powdered infant formula,ensuring that it is filled above the rim. Do notpress or pack the powder into the scoop. Levelthe measuring scoop by running the back of aknife across the rim of the scoop, allowing theexcess to be returned to the tin. Add the pow-dered infant formula to the hot water in thefeeding cup.
6) Stir to mix with the metal spoon (sterilised afterthe last feed).7) Cool the feed
Ensure that the reconstituted infant formula hascooled sufficiently before feeding to the infant. Ifsufficient water is available, the cup containingthe reconstituted infant formula can be placedinto a container of clean, cool water to speedcooling. Alternately, vigorous stirring will speedcooling. The temperature of the feed should betested by stirring and then dropping a small
amount of the reconstituted milk onto a carer’sinner forearm where it should no longer feelwarm.
8) Feed the baby using the feeding cupInstructions on how to feed an infant using acup are available from a number of sources[15-17]. In addition, lactation consultants andbreastfeeding counsellors commonly have experi-ence in assisting mothers to cup feed infants.
9) Discard any unused reconstituted infant formulawithin two hours.
Alternatively, the formula can be consumed byolder children or adult members of thehousehold.
10) After feeding, before cleaning and sterilising pre-paration and feeding implements, hands should bewashed as described above.11) Wash and sterilise preparation and feedingimplements thoroughly
Boil sufficient water to wash preparation andfeeding implements. Place a sufficient quantity ofthis water and detergent into the storage con-tainer or a basin reserved for this purpose. Greatcare should be taken to ensure that corners arethoroughly cleaned. Preparation and feedingimplements should then be rinsed in clean waterand dried with paper towel before storage in sto-rage container (which will also need to becleaned and dried if it has been used forwashing).
12) Sterilise preparation and feeding implements inpreparation for the next feed
Preparation and storage implements should becompletely submerged in water in the largecooking pot and the water brought to the boil onthe gas stove. Care should be taken to ensurethat there are no trapped air bubbles. When thewater is at a rolling boil the gas may be turnedoff and the implements left in the water in thelidded pot until they are needed. Implementsshould be removed from the pot just before theyare to be used using the clean metal tongs or, ifthis is not practical, returned to the storage con-tainer for storage.
13) Return everything except the water, cookingstove and gas bottle to the storage container andseal the lid.
Preparedness for infants older than six monthsInfants who are older than six months of age are lessvulnerable than younger babies. They are able to eatsolid foods and can safely consume some water. Theirimmune systems are also more mature. Supplies
Gribble and Berry International Breastfeeding Journal 2011, 6:16http://www.internationalbreastfeedingjournal.com/content/6/1/16
Page 8 of 12
200
required by mothers of breastfed infants older than sixmonths should include sufficient nappies and wipes andalso some complementary foods. However, should amother not have appropriate complementary foodsstored, her infant can revert to exclusive breastfeedingwithout harm, as her milk supply will increase inresponse to increased demand. Those who care for for-mula fed infants older than six months of age shouldalso store complementary foods and the goods pre-viously described as necessary for formula feeding, withan adjustment based on the intake of the child. Whereappropriate complementary foods are available, theamount of complementary food can be increased ifinfant formula is in limited supply (even replacing infantformula entirely for a period of time). Infants older thansix months can also be given water to preventdehydration.
Providing aid to the caregivers of infantsIn a large scale emergency, providing aid to the care-givers of infants, particularly infants who are formulafed, should be a priority. Infants, particularly the veryyoung, who do not have access to appropriate food canbecome very sick and even die within days. However,the distribution of supplies needed to formula feedshould be handled by suitably experienced health work-ers (not food distribution workers) who are able to pro-vide an assessment of the needs of the infant andprovide education on how to prepare formula feedsusing the available resources. Should ready-to-use singleserves of infant formula with disposable bottles andteats be available, this can be distributed in preferenceto powdered infant formula and other resources (itshould be made absolutely clear that any left-over for-mula should be discarded after each feed and that bot-tles cannot be reused). Wherever possible, women whoare mixed breastfeeding/formula feeding should beencouraged to avoid using infant formula - and assistedto provide for all of their babies’ nutritional needs bybreastfeeding them very frequently (as often as hourlyshould be expected). Enormous care should be taken toensure that infant formula is not distributed to breast-feeding mothers; previous experience has shown thatwhere infant formula is given to breastfeeding mothersit is frequently used and results in increased rates ofdiarrhoeal illness in infants [24]. It should also be con-sidered that mothers of young, fully formula fed infantsmay still be lactating and be able to reinitiate breastfeed-ing fairly easily. In the stressful circumstances of anemergency, it cannot be assumed that mothers willthink of reinitiating breastfeeding. One of the infantdeaths following Hurricane Katrina was a three weekold fully formula fed baby who had been stranded on aroof for five days after the Hurricane with his mother
who did not have formula to feed him. The baby wasalive when rescued but later died in hospital. A medicalassessment of the infant’s mother revealed that she hadbreasts engorged with milk, however the possibility ofinitiating breastfeeding had not occurred to her.It should not be taken for granted that mothers who
are breastfeeding do not need assistance; breastfeedingmothers need support to continue breastfeeding, espe-cially if they are experiencing difficulties. Emergencyauthorities should access their local mother-to-motherbreastfeeding support organisation as a resource to bothemergency workers and to mothers. Mother-to-mothersupport organisations, while specialising in assistingbreastfeeding mothers, will also be able to help formulafeeding mothers who wish to avoid using infant formulaby re-establishing or increasing breastfeeding. They arealso often a repository of expertise on the cup feedingof infants. Emergency organisations should ensure thatthey have policies and appropriate training in place toenable good practice in the delivery of aid to those whocare for infants.
Caring for formula fed infants when resources toformula feed are not availableIn the event that there are formula fed infants, but notthe resources necessary to formula feed, the followingoptions may be possible. A breastfeeding mother may beavailable to share breast milk with the infant, eitherdirectly from the breast or fed expressed milk in a cup.It should be understood that once breast milk isexpressed it has many of the hazards associated withinfant formula. Thus, breast milk should only beexpressed via hand (there is no place for breast pumpsin emergency response because of the difficulties ofcleaning the pumps) and expressed breast milk shouldbe fed using a disposable cup (never a bottle). If fresh,commercial cows’ milk is available, it may be made sui-table as a short term replacement for infant formula forinfants under six months by the addition of water andsugar (to 100 ml of boiled milk add 50 mls of water andtwo level teaspoons of sugar) [17]. It is important thatinfants under six months of age not be given water todrink because of the risk of hyponatraemia, nor undi-luted cows’ milk because of the risk of kidney damage.
Emergency messagesPrior to emergencies, during emergencies and in theemergency recovery period, emergency managementorganisations should distribute messages targeted atthose who care for infants.
Prior to emergenciesExclusive and continued breastfeeding should be pro-moted by emergency management organisations as an
Gribble and Berry International Breastfeeding Journal 2011, 6:16http://www.internationalbreastfeedingjournal.com/content/6/1/16
Page 9 of 12
201
emergency preparedness activity that provides infantswith a safe and secure food and water supply and pro-tection from infection. In areas with seasonal emergen-cies, communications might include a message such as,“mothers considering ceasing breastfeeding should con-sider waiting until after the [bushfire/wildfire/cyclone/hurricane/typhoon/flooding/snowstorm] season.” In areassusceptible to emergencies such as earthquakes and vol-canic eruptions, the importance of breastfeeding as aprotective behaviour should similarly be promoted. Thecaregivers of formula fed infants should be providedwith information on all of the resources necessary toformula feed in an emergency. Emergency managementagencies should avoid at all costs communicating theidea that emergency preparedness for the caregivers offormula fed infants simply involves storing some addi-tional infant formula. In locations susceptible to emer-gencies, health professionals should routinely discussemergency preparedness with those who are caring forinfants. Those involved in the delivery of aid should beprovided with appropriate training on infant and youngchild feeding in emergencies in order to be able toappropriately manage and deliver aid to the caregiversof infants.
During emergenciesInfants are at greatest risk during the acute phase ofemergencies. Messages should be targeted to themothers of breastfed infants outlining the importance ofexclusive and continued breastfeeding, the ways inwhich mothers can increase their milk supply anddetails of where mothers can obtain assistance if theyare experiencing breastfeeding difficulties. Breastfeedingwomen should be exhorted to avoid starting to useinfant formula during the acute emergency and recov-ery. Messages should also be targeted to those who carefor formula fed infants providing detail on how infantformula should be prepared and delivered in emergen-cies, the importance of not giving young infants waterand details of where caregivers can obtain supplies andassistance with formula feeding.Emergency management agencies should communi-
cate to the general public the message that while infantsare vulnerable and require assistance in emergencies,they require a specific, targeted and supported type ofaid. It should be made clear that donations of infant for-mula are not appropriate and can be harmful. It hasbeen repeatedly found that in the wake of an emergency,large quantities of donations of infant formula arrive.These donations cause logistical difficulties and areoften distributed inappropriately (for example given tobreastfeeding women or to caregivers of formula fedinfants without the other supplies necessary to formulafeed [e.g. [24]]). It is generally accepted that donations
of infant formula (including from infant formula manu-facturers who have historically used emergencies as amarketing opportunity [e.g. [25]]) should be actively dis-couraged in all emergencies. On the contrary, monetarydonations will enable the delivery of appropriate aid toinfants. Where infant formula is purchased by aid orga-nisations there is a greater likelihood of the distributionbeing carefully managed, which benefits both breastfedand formula fed infants.
During the emergency recovery periodThe recovery period of an emergency is often a timewhen the risk of contracting an infectious diseaseincreases. During the recovery period, messages shouldbe targeted to the caregivers of infants highlighting theimportance of exclusive and continued breastfeedingand the importance of maintaining cleanliness and steri-lisation in the preparation of infant formula in order toprevent infectious diseases such as gastroenteritis andrespiratory disease.Further information on infant and young child feeding
and the media is available in the resources of the Infantand Young Child Feeding in Emergencies Core Group[26]. Examples of media messages suitable at each stageof an emergency are presented in Table 2.
Practicalities of formula feeding in emergenciesThe quantity of supplies required to formula feed in anemergency, as well as the process of formula feeding inan emergency as described here, raises the question ofthe feasibility of preparing for an emergency if caringfor a formula fed infant. Certainly the volume of sup-plies means that if the emergency necessitates leavingthe home that it may not be possible to transport thesupplies. Thus, whenever an emergency occurs in adeveloped country context it should be assumed thatthere will be a significant number of formula fed infantsat immediate risk and identification of these infants andprovision of necessary supplies should be of the highestpriority.Even where those who care for formula fed infants
have the necessary supplies, the difficulty of the processof formula feeding itself may leave little room for othernecessary activities and replenishment of supplies mayalso be a problem. Should essential services such aselectricity and piped clean water not become availablewithin a short time, and ready-to-use single serves ofinfant formula (with disposable bottles and teats) not beavailable, evacuation of formula fed infants and thosewho care for them should be considered.
ConclusionsEmergency management organisations recognise the vul-nerability of infants in emergencies, even in developed
Gribble and Berry International Breastfeeding Journal 2011, 6:16http://www.internationalbreastfeedingjournal.com/content/6/1/16
Page 10 of 12
202
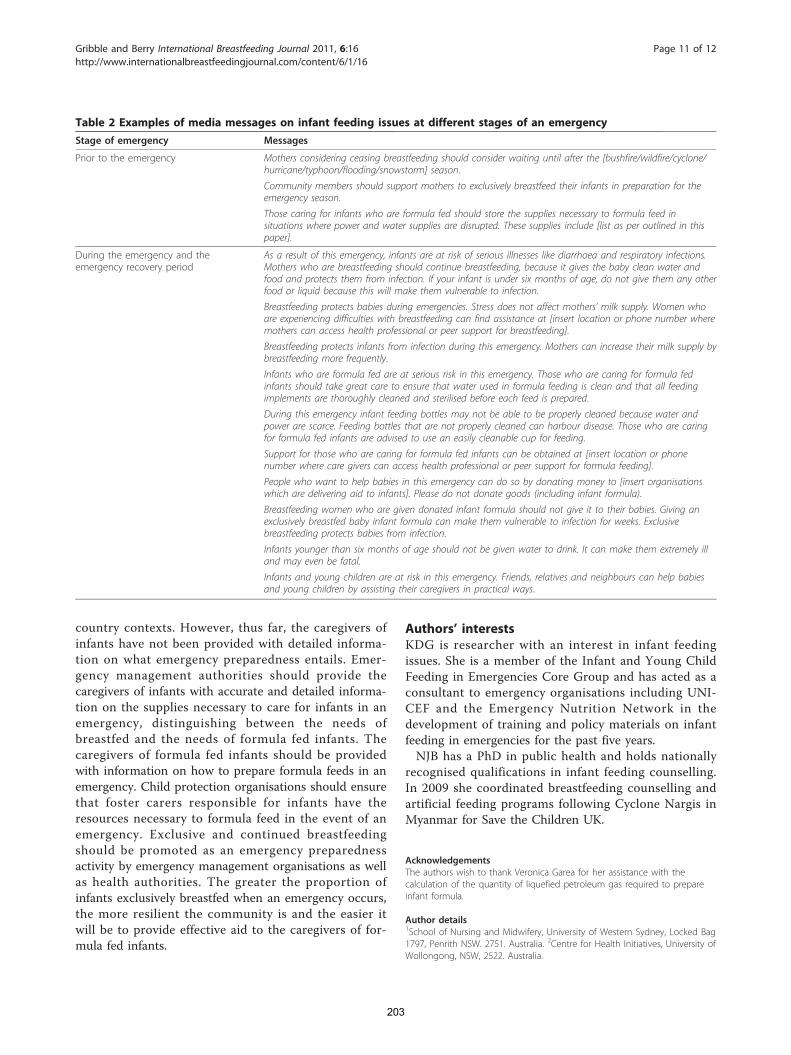
country contexts. However, thus far, the caregivers ofinfants have not been provided with detailed informa-tion on what emergency preparedness entails. Emer-gency management authorities should provide thecaregivers of infants with accurate and detailed informa-tion on the supplies necessary to care for infants in anemergency, distinguishing between the needs ofbreastfed and the needs of formula fed infants. Thecaregivers of formula fed infants should be providedwith information on how to prepare formula feeds in anemergency. Child protection organisations should ensurethat foster carers responsible for infants have theresources necessary to formula feed in the event of anemergency. Exclusive and continued breastfeedingshould be promoted as an emergency preparednessactivity by emergency management organisations as wellas health authorities. The greater the proportion ofinfants exclusively breastfed when an emergency occurs,the more resilient the community is and the easier itwill be to provide effective aid to the caregivers of for-mula fed infants.
Authors’ interestsKDG is researcher with an interest in infant feedingissues. She is a member of the Infant and Young ChildFeeding in Emergencies Core Group and has acted as aconsultant to emergency organisations including UNI-CEF and the Emergency Nutrition Network in thedevelopment of training and policy materials on infantfeeding in emergencies for the past five years.NJB has a PhD in public health and holds nationally
recognised qualifications in infant feeding counselling.In 2009 she coordinated breastfeeding counselling andartificial feeding programs following Cyclone Nargis inMyanmar for Save the Children UK.
AcknowledgementsThe authors wish to thank Veronica Garea for her assistance with thecalculation of the quantity of liquefied petroleum gas required to prepareinfant formula.
Author details1School of Nursing and Midwifery, University of Western Sydney, Locked Bag1797, Penrith NSW. 2751. Australia. 2Centre for Health Initiatives, University ofWollongong, NSW, 2522. Australia.
Table 2 Examples of media messages on infant feeding issues at different stages of an emergencyStage of emergency Messages
Prior to the emergency Mothers considering ceasing breastfeeding should consider waiting until after the [bushfire/wildfire/cyclone/hurricane/typhoon/flooding/snowstorm] season.
Community members should support mothers to exclusively breastfeed their infants in preparation for theemergency season.
Those caring for infants who are formula fed should store the supplies necessary to formula feed insituations where power and water supplies are disrupted. These supplies include [list as per outlined in thispaper].
During the emergency and theemergency recovery period
As a result of this emergency, infants are at risk of serious illnesses like diarrhoea and respiratory infections.Mothers who are breastfeeding should continue breastfeeding, because it gives the baby clean water andfood and protects them from infection. If your infant is under six months of age, do not give them any otherfood or liquid because this will make them vulnerable to infection.
Breastfeeding protects babies during emergencies. Stress does not affect mothers’ milk supply. Women whoare experiencing difficulties with breastfeeding can find assistance at [insert location or phone number wheremothers can access health professional or peer support for breastfeeding].
Breastfeeding protects infants from infection during this emergency. Mothers can increase their milk supply bybreastfeeding more frequently.
Infants who are formula fed are at serious risk in this emergency. Those who are caring for formula fedinfants should take great care to ensure that water used in formula feeding is clean and that all feedingimplements are thoroughly cleaned and sterilised before each feed is prepared.
During this emergency infant feeding bottles may not be able to be properly cleaned because water andpower are scarce. Feeding bottles that are not properly cleaned can harbour disease. Those who are caringfor formula fed infants are advised to use an easily cleanable cup for feeding.
Support for those who are caring for formula fed infants can be obtained at [insert location or phonenumber where care givers can access health professional or peer support for formula feeding].
People who want to help babies in this emergency can do so by donating money to [insert organisationswhich are delivering aid to infants]. Please do not donate goods (including infant formula).
Breastfeeding women who are given donated infant formula should not give it to their babies. Giving anexclusively breastfed baby infant formula can make them vulnerable to infection for weeks. Exclusivebreastfeeding protects babies from infection.
Infants younger than six months of age should not be given water to drink. It can make them extremely illand may even be fatal.
Infants and young children are at risk in this emergency. Friends, relatives and neighbours can help babiesand young children by assisting their caregivers in practical ways.
Gribble and Berry International Breastfeeding Journal 2011, 6:16http://www.internationalbreastfeedingjournal.com/content/6/1/16
Page 11 of 12
203
Authors’ contributionsKDG and NJB conceived of the paper and drafted the manuscript together.Both authors read and approved the final manuscript.
Competing interestsThe authors declare that they have no competing interests.
Received: 19 August 2011 Accepted: 7 November 2011Published: 7 November 2011
References1. WHO, UNICEF: Global Strategy for Infant and Young Child Feeding Geneva:
WHO; 2003.2. Gribble KD, McGrath M, MacLaine A, Lhotska L: Supporting breastfeeding
in emergencies: protecting women’s reproductive rights and maternaland infant health. Disasters 2011.
3. Forde KA, Miller LJ: 2006-07 north metropolitan Perth breastfeedingcohort study: how long are mothers breastfeeding? Breastfeeding Review2010, 18:14-24.
4. Bolling K, Grant C, Hamlyn B, Thorton A: Infant Feeding Survey 2005 Leeds:National Health Service, The Information Centre for Health and Social Care;2007.
5. Bonati M, Vivarelli P, Brunetti M: Il costo economico del non allattamentoal seno. Quaderni 1998, 6:10-13.
6. Jones G, Steketee RW, Black RE, Bhutta ZA, Morris SS: How many childdeaths can we prevent this year? (Child survival II). The Lancet 2003,362:65-71.
7. Coutsoudis A, Coovadia HM, Wilfert CM: HIV, infant feeding and moreperils for poor people: new WHO guidelines encourage review offormula milk policies. Bulletin of the World Health Organization 2008,86:210-214.
8. Chen A, Rogan WJ: Breastfeeding and the risk of postneonatal death inthe United States. Pediatrics 2004, 113:e435-e439.
9. Gruich M: Life-changing experiences of a private practicing pediatrician:perspectives from a private pediatric practice. Pediatrics 2006, 117:S359-364.
10. Moritz M, Ayus J: New aspects in the pathogenesis, prevention, andtreatment of hyponatremic encephalopathy in children. PediatricNephrology 2010, 25:1225-1238.
11. Lipton E, Drew C, Shane S, Rohde D: Breakdowns marked path fromhurricane to anarchy. New York Times, New York; 2005 [http://www.nytimes.com/2005/09/11/national/nationalspecial/11response.html?pagewanted=1&ei=5088&en=fb3d95d685b8f2f4&ex=1284091200&partner=rssnyt&emc=rss].
12. FEMA, American Red Cross: Food and Water in an Emergency 2004.13. Preparing for an Emergency. , 4[http://www.ema.gov.au/www/emaweb/
rwpattach.nsf/VAP/(FC77CAE5F7A38CF2EBC5832A6FD3AC0C)~Preparing+for+the+Unexpected+Cover.PDF/$file/Preparing+for+the+Unexpected+Cover.PDF].
14. Get an emergency kit. [http://www.getprepared.gc.ca/_fl/pub/mrgnc-kt-eng.pdf].
15. Cup-feeding. [http://www.breastfeeding.asn.au/bfinfo/cupfeeding.html].16. Lang S, Lawrence CJ, Orme RL: Cup feeding: an alternative method of
infant feeding. Archives of Disease in Childhood 1994, 71:365-369.17. Emergency Nutrition Network, IBFAN-GIFA, Fondation Terre des hommes,
CARE USA, Action Contre la Faim, UNICEF, UNHCR, WHO, WFP, Linkages:Infant Feeding in Emergencies: Module 2, version 1.1 for health and nutritionworkers in emergency situations Oxford: Emergency Nutrition Network; 2007.
18. Osborn K, Lyons M: Is bottled water really unsafe for making up infantformula? Community Practitioner 2010, 83:31-34.
19. WHO, FAO: Safe preparation and handling of powdered infant formula:guidelines Geneva: WHO; 2006.
20. Redmond EC, Griffith CJ: The importance of hygiene in the domestickitchen: implications for preparation and storage of food and infantformula. Perspectives in Public Health 2009, 129:69-76.
21. World Health Organization: Guiding Principles for Infant and Young ChildFeeding in Emergencies Geneva: World Health Organization; 2004.
22. Linkages Project: Infant Feeding Options in the Context of HIV WashingtonDC: Academy for Educational Development; 2004.
23. FAO, WHO: How to Prepare Formula for Cup-Feeding at Home Geneva: WHO;2007.
24. Hipgrave DB, Assefa F, Winoto A, Sukotjo S: Donated breast milksubstitutes and incidence of diarrhoea among infants and youngchildren after the May 2006 earthquake in Yogyakarta and Central Java.Public Health Nutrition 2011.
25. Gribble KD: ’Many breastfeeding women don’t have milk for theirbabies’: media messages after Cyclone Nargis and the WenChuanearthquake. Disasters .
26. Media and Communication Resources. [http://www.ennonline.net/resources/tag.aspx?tagid=122].
doi:10.1186/1746-4358-6-16Cite this article as: Gribble and Berry: Emergency preparedness forthose who care for infants in developed country contexts. InternationalBreastfeeding Journal 2011 6:16.
Submit your next manuscript to BioMed Centraland take full advantage of:
• Convenient online submission
• Thorough peer review
• No space constraints or color figure charges
• Immediate publication on acceptance
• Inclusion in PubMed, CAS, Scopus and Google Scholar
• Research which is freely available for redistribution
Submit your manuscript at www.biomedcentral.com/submit
Gribble and Berry International Breastfeeding Journal 2011, 6:16http://www.internationalbreastfeedingjournal.com/content/6/1/16
Page 12 of 12
204
Bushfire Awareness and Preparedness of Frail Older and Vulnerable Residents in Yarra Ranges
Karen Kimpton
Master of Emergency Management Program
Charles Sturt University, Bathurst, Australia
Paper presented at EARTH: FIRE AND RAIN Australian & New Zealand Disaster and Emergency Management Conference Brisbane – 16 – 18, April 2012
205
Bushfire Awareness and Preparedness of Frail Older and Vulnerable Residents in Yarra Ranges
Abstract: Findings from the 2009 project; 'Bushfire Awareness and Preparedness of Frail Older and Vulnerable Residents in Yarra Ranges' provided an insight into the rationale of vulnerable persons in responding to Bushfire Risk.
A range of tools were used to identify vulnerable groups and messaging and service coordination issues across the community care sector.
The aim of this workshop presentation is to provide an overview of the project data and data analysis related to messaging and the responses of vulnerable persons and or groups to such messaging.
Fifty five unstructured telephone interviews were completed with vulnerable persons in high fire risk areas. Seven case studies were documented to highlight service coordination issues. (Interviewees agreed to have non identifying information shared). All 55 callers described complex medical, mobility, sensory, or cognitive factors impacting on capacity.
Of the 55 persons interviewed 45 did not have an adequate bushfire survival plan; incorrectly believing Council would open Relief Centres on hot days. When advised Relief Centres would not open on hot days for the purpose of community relocation callers did not have a contingency plan.
The analysis of the themes and trends presenting in interview findings further shaped project direction. The project sought to redress the issues identified in the interviews in the second phase of the project.
Sixty four community care organisations were bought together to workshop identified issues. Three key community organisations were approached to ensure continuity of messaging to vulnerable groups.
Three standardised surveys were developed and distributed to Community Care Providers, Senior Citizens Groups and Community Care Peak Bodies.
Maps were developed to identify vulnerable persons.
Liaison with the Council Home and Community Support unit assisted in quantifying and targeting vulnerable persons who required supported relocation.
This workshop provides the opportunity for those interested to explore project analysis and outcomes.
Keywords: Yarra Ranges, vulnerable, bushfire, preparedness
206
Introduction
In May 2008 a 12 month Shire of Yarra Ranges (the Shire) pilot Bushfire Preparedness project was finalized. The pilot was developed in response to extreme risk assessments for places of assembly and institutions located within the Shire. The extreme risk assessment related to wild fires and structural fires. (Shire of Yarra Ranges, 2007).
The pilot targeted community facilities and community and residential aged care providers. The bed based services provided support and accommodation to frail elderly and disabled persons.
Services were in fire risk areas compounded by the possibility of road access issues should resident relocation be required. The pilot project developed and measured the effectiveness of strategies to increase fire preparation awareness and strengthen community education networks to deliver fire safety messages to community organizations and bed based providers.
The project identified and recommended ongoing work to maintain levels of preparedness for a separate cohort of frail older and vulnerable residents living independently in the community.
Findings determined the need to strengthen bushfire preparedness messaging to this cohort.
Further the Council’s Bushfire Season 2009-2010 Action Plan identified strategies and recommendations to prepare for the coming fire season. ‘Communications’ and ‘Fire Safety Education’ were identified as a ‘high’ priority in ‘developing and implementing a range of strategies to support vulnerable groups with fire safety’. The Action Plan recommended appointing a Community Development Officer ‘to support vulnerable residents with fire safety’.
In 2009 the State Government funded a 6 month Bushfire Preparedness Program in the Shire. There was an identified need for a community development strategy during the summer season to support bushfire preparedness messaging. The timelines for the project were September 2009 to March 2010.
The primary objective of 2009 Bushfire Awareness and Preparedness of Frail Older and Vulnerable Residents in Yarra Ranges project was to identify at risk groups and embed fire safety messages.
The project was targeted to vulnerable frail aged and residents with a disability living independently (in their own homes or in a retirement village) within the community.
A Community Development Officer was appointed to project manage in September 2009. The project was completed in April 2010.
207
Context
The impact of the February 2009 fires that devastated communities across the Shire was significant. The total area burnt was 48,293 hectares or 19.6% of the Shire.
Twelve lives were lost (10 in Steels Creek and two in Toolangi), 161 private dwellings were destroyed, 416 outbuildings were destroyed and 144 businesses were affected. (Shire of Yarra Ranges, 2009).
In response Council activated 5 Relief Centres with the support of Shire staff and employees from other Councils. Council coordinated 229 staff across 616 shifts. The effort was supported by Centrelink, Department of Human Services, Red Cross and other Community Care Organisations (CSOs). (Shire of Yarra Ranges, 2009).
Council’s experience with the expectations of vulnerable persons and their carers’ in relation to the February 2009 Relief Centre caring capacity was expansive. Council policy prescribed Relief Centres as a building or place to provide basic life support and essential needs to affected persons. Community expectations were not in accordance with the policy.
Community anxiety leading into the 2009-2010 Bushfire Season was high.
The broad social and economic impacts from the February 2009 bushfire event continue to be measured. Council’s response to the relief and recovery efforts was expansive and became a priority work effort across all departments to meet the needs of dislocated and traumatised residents throughout 2009-2010.
Another key element of the Council’s work effort was to meet planning, preparation and resource commitments for the pending 2009-2010 Bushfire Season.
Council, Emergency Service Organisations (ESO) and state government departments had revised the approach taken to Bushfire Relief, Recovery and Preparedness following the events of February 2009.
The flow on effect of the 2009 Victorian Royal Bushfires Commission’s investigation of vulnerable community members’ ‘stay or go’ capacity informed direction for bushfire preparedness messaging. (BVRC, 2009). The Victorian state government’s Prepare, Act Survive campaign was the key driver to Community Education for the 2009-2010 bushfire season.
The 2009 Bushfire Awareness and Preparedness of Frail Older and Vulnerable Residents in Yarra Ranges project context was defined by the above determinants and this context shaped the activities of the project.
208
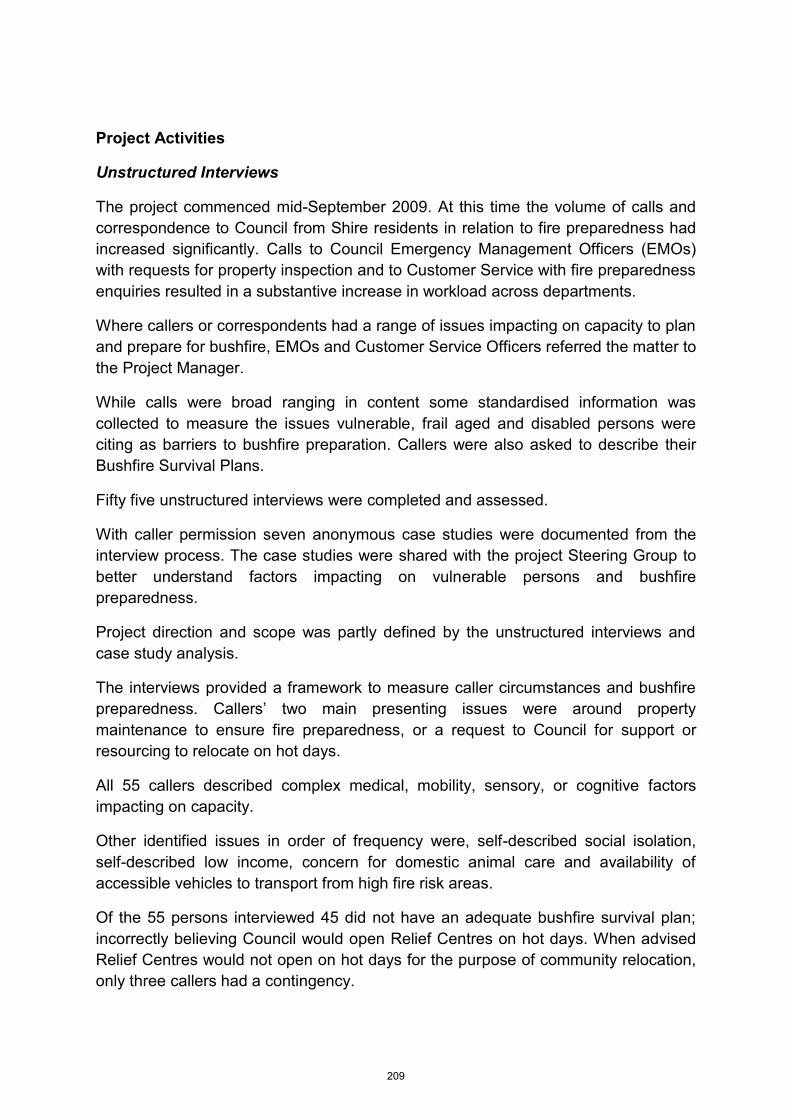
Project Activities
Unstructured Interviews
The project commenced mid-September 2009. At this time the volume of calls and correspondence to Council from Shire residents in relation to fire preparedness had increased significantly. Calls to Council Emergency Management Officers (EMOs) with requests for property inspection and to Customer Service with fire preparedness enquiries resulted in a substantive increase in workload across departments.
Where callers or correspondents had a range of issues impacting on capacity to plan and prepare for bushfire, EMOs and Customer Service Officers referred the matter to the Project Manager.
While calls were broad ranging in content some standardised information was collected to measure the issues vulnerable, frail aged and disabled persons were citing as barriers to bushfire preparation. Callers were also asked to describe their Bushfire Survival Plans.
Fifty five unstructured interviews were completed and assessed.
With caller permission seven anonymous case studies were documented from the interview process. The case studies were shared with the project Steering Group to better understand factors impacting on vulnerable persons and bushfire preparedness.
Project direction and scope was partly defined by the unstructured interviews and case study analysis.
The interviews provided a framework to measure caller circumstances and bushfire preparedness. Callers’ two main presenting issues were around property maintenance to ensure fire preparedness, or a request to Council for support or resourcing to relocate on hot days.
All 55 callers described complex medical, mobility, sensory, or cognitive factors impacting on capacity.
Other identified issues in order of frequency were, self-described social isolation, self-described low income, concern for domestic animal care and availability of accessible vehicles to transport from high fire risk areas.
Of the 55 persons interviewed 45 did not have an adequate bushfire survival plan; incorrectly believing Council would open Relief Centres on hot days. When advised Relief Centres would not open on hot days for the purpose of community relocation, only three callers had a contingency.
209
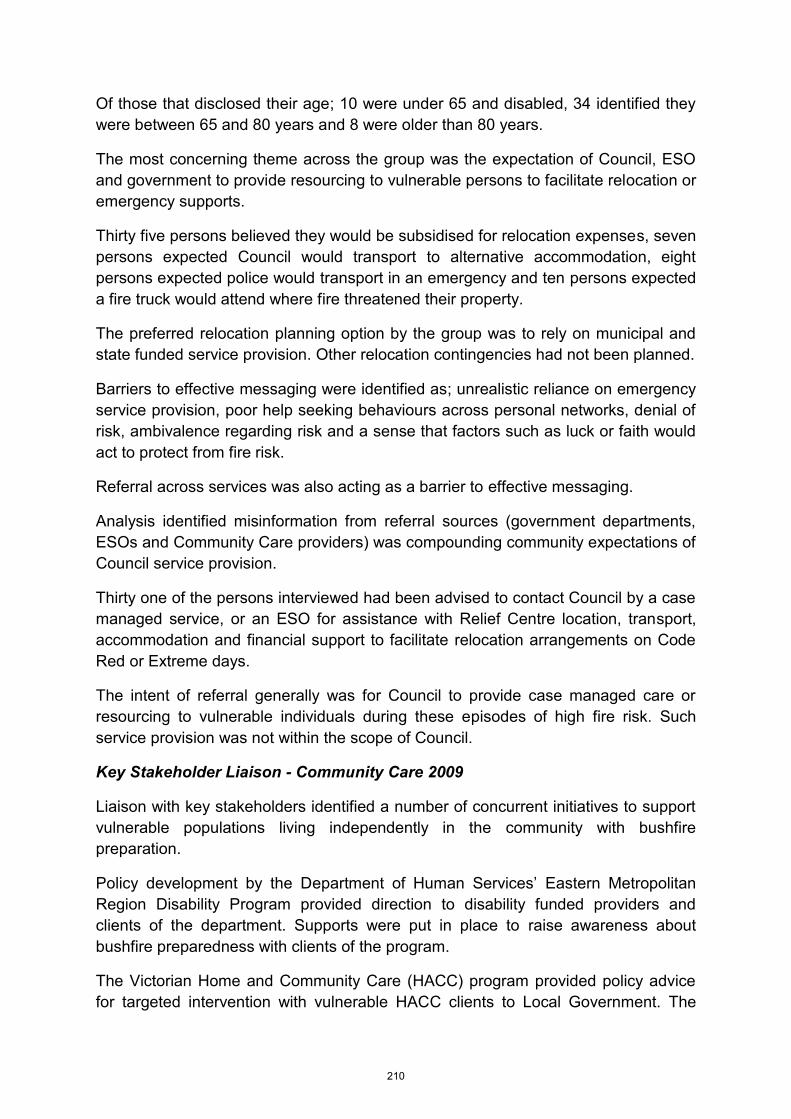
Of those that disclosed their age; 10 were under 65 and disabled, 34 identified they were between 65 and 80 years and 8 were older than 80 years.
The most concerning theme across the group was the expectation of Council, ESO and government to provide resourcing to vulnerable persons to facilitate relocation or emergency supports.
Thirty five persons believed they would be subsidised for relocation expenses, seven persons expected Council would transport to alternative accommodation, eight persons expected police would transport in an emergency and ten persons expected a fire truck would attend where fire threatened their property.
The preferred relocation planning option by the group was to rely on municipal and state funded service provision. Other relocation contingencies had not been planned.
Barriers to effective messaging were identified as; unrealistic reliance on emergency service provision, poor help seeking behaviours across personal networks, denial of risk, ambivalence regarding risk and a sense that factors such as luck or faith would act to protect from fire risk.
Referral across services was also acting as a barrier to effective messaging.
Analysis identified misinformation from referral sources (government departments, ESOs and Community Care providers) was compounding community expectations of Council service provision.
Thirty one of the persons interviewed had been advised to contact Council by a case managed service, or an ESO for assistance with Relief Centre location, transport, accommodation and financial support to facilitate relocation arrangements on Code Red or Extreme days.
The intent of referral generally was for Council to provide case managed care or resourcing to vulnerable individuals during these episodes of high fire risk. Such service provision was not within the scope of Council.
Key Stakeholder Liaison - Community Care 2009
Liaison with key stakeholders identified a number of concurrent initiatives to support vulnerable populations living independently in the community with bushfire preparation.
Policy development by the Department of Human Services’ Eastern Metropolitan Region Disability Program provided direction to disability funded providers and clients of the department. Supports were put in place to raise awareness about bushfire preparedness with clients of the program.
The Victorian Home and Community Care (HACC) program provided policy advice for targeted intervention with vulnerable HACC clients to Local Government. The
210
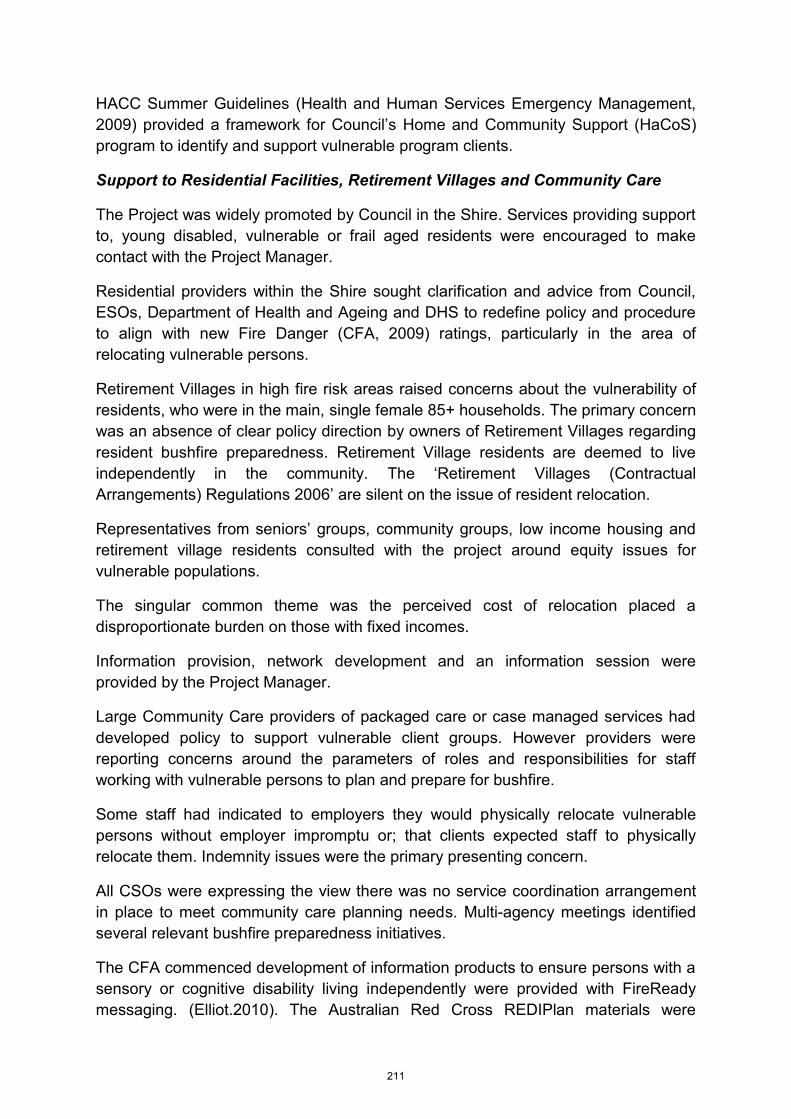
HACC Summer Guidelines (Health and Human Services Emergency Management, 2009) provided a framework for Council’s Home and Community Support (HaCoS) program to identify and support vulnerable program clients.
Support to Residential Facilities, Retirement Villages and Community Care
The Project was widely promoted by Council in the Shire. Services providing support to, young disabled, vulnerable or frail aged residents were encouraged to make contact with the Project Manager.
Residential providers within the Shire sought clarification and advice from Council, ESOs, Department of Health and Ageing and DHS to redefine policy and procedure to align with new Fire Danger (CFA, 2009) ratings, particularly in the area of relocating vulnerable persons.
Retirement Villages in high fire risk areas raised concerns about the vulnerability of residents, who were in the main, single female 85+ households. The primary concern was an absence of clear policy direction by owners of Retirement Villages regarding resident bushfire preparedness. Retirement Village residents are deemed to live independently in the community. The ‘Retirement Villages (Contractual Arrangements) Regulations 2006’ are silent on the issue of resident relocation.
Representatives from seniors’ groups, community groups, low income housing and retirement village residents consulted with the project around equity issues for vulnerable populations.
The singular common theme was the perceived cost of relocation placed a disproportionate burden on those with fixed incomes.
Information provision, network development and an information session were provided by the Project Manager.
Large Community Care providers of packaged care or case managed services had developed policy to support vulnerable client groups. However providers were reporting concerns around the parameters of roles and responsibilities for staff working with vulnerable persons to plan and prepare for bushfire.
Some staff had indicated to employers they would physically relocate vulnerable persons without employer impromptu or; that clients expected staff to physically relocate them. Indemnity issues were the primary presenting concern.
All CSOs were expressing the view there was no service coordination arrangement in place to meet community care planning needs. Multi-agency meetings identified several relevant bushfire preparedness initiatives.
The CFA commenced development of information products to ensure persons with a sensory or cognitive disability living independently were provided with FireReady messaging. (Elliot.2010). The Australian Red Cross REDIPlan materials were
211
providing an all hazards approach to emergency planning with a specific resource for seniors. (Australian Red Cross, 2009).
The CFA FireReady campaign was underway and CFA Region 13 had scheduled community meetings across the Shire. The Project Manager attended several of these meetings and discussed local fire preparedness arrangements with participants.
Workshops
In November 2009 two Community Care workshops were developed by the Project Manager. The workshops enabled Council to advise the sector about bushfire preparedness arrangements for 2009-2010 and clarify Relief Centre operation as a Recovery function. Sub-planning arrangements (reduced service delivery) during extreme weather were detailed for the Council’s HaCoS program. Council also provided advice on emergency management arrangements and the roles and responsibilities of ESOs.
The workshops aimed to address the issues in the Community Care sector related to bushfire preparation policy development and implementation. For all participants this body of work was a pressing emerging issue.
Poor referral practice, indemnity related to staff safety and client care, unrealistic client expectation, gaps in resourcing, reduced service provision in extreme weather and a lack of a coordinated approach were the key themes noted.
The model of practice presented by key speakers was one in which vulnerable persons and their personal carers incorporated an ethos of personal responsibility for bushfire preparedness and community care providers worked to support this position.
ACCV, (Aged and Community Care Victoria) assisted to develop the framework for policy development to support the above position.
The rights and responsibilities of frail aged and disabled persons to self-determine bushfire survival plans and Duty of Care responsibilities by Community Care providers was the focus of policy context discussion.
Workshop participants were provided with the opportunity to ask questions of panel members including WorkSafe Victoria, CFA staff leading resource development for vulnerable persons, other EMO staff and Council.
Participants represented service providers providing a full range of Primary Health, Rehabilitation, Accommodation, Packaged Care, Mental Health, Disability, Frail Aged, In Home Support, Case Management, Social Support, Nursing, Telephone Support and Education services.
212
Participant feedback was mixed. While the majority of participants felt better informed and more able to communicate with clients they remained concerned about duplication of effort for shared clients and the care needs of complex clients.
Sixty four participants attended the workshops.
Information sessions - HaCoS Carers
Three information sessions were provided to Council HaCoS carer staff iterating the findings from the unstructured interviews and workshop themes. Council HaCoS carer staff provide a range of in-home care services to frail elderly and young disabled persons and their carers’.
The sessions allowed staff to discuss duty of care issues and identify strategies to better support bushfire preparedness across work groups and for client groups. Staff expressed concern at these sessions about vulnerable, socially isolated clients with limited personal support networks.
Where relevant, client referral was made to the HaCoS Community Care Executive Officer for a follow up interview. (Council was working on a parallel initiative funded by the HACC program and based on the 2009 HACC Summer Guidelines).
Yarra Ranges Faith Network
An informal information session was provided to Yarra Ranges Faith leadership group to assist with messaging to parishioners and congregants about differing values and attitudes across generations with regard to risk. The session was developed in response to unstructured interview information that indicated faith constructs influenced decision making in risk situations amongst older cohorts. Faith was perceived as a protective mechanism against risk.
Further one small rural church had offered the church premises as a relief centre to church members on high risk fire days. The offer had been made without consideration to traffic management, parking, fire safety assessment of the premises or the capacity of the premises to meet local relief centre need should a fire eventuate.
The faith leadership group was open to ensuring continuity of relocation advice to vulnerable persons. The offer of the church as a relief centre was withdrawn.
Community Information Sessions
Community Information sessions were provided throughout December 2009 and January and February 2010. Two Healesville based Probus Clubs, seven rural Senior Citizens Centres and one Retirement Village participated. Approximately 350 persons attended the information sessions.
213
The sessions provided clarity around Council service provision and enabled the Project Manager to measure emerging trends in terms of responsiveness to bushfire preparedness messaging. The sessions were structured to provide information and advice and included extensive question and answer sessions.
The nature of the sessions differed across groups. Groups located in the Dandenong Ranges presented with strong rights based views around place based solutions such as Neighbourhood Safer Places. Risk and subsequent harm from wildfire was a secondary consideration to the provision of an immediate place based solution.
All groups raised issues related to ageing. Of interest was the consistent anecdotal theme that neighbours were an unreliable source of support to vulnerable elders during an emergency.
While many senior participants stated they would not bother their children for support during relocation, when explored the subtext was fragility around relinquishing a sense of dependence to their adult children.
Towards the end of February 2010 anecdotal issues started to include perceptions adult children were harassing older parents and disabled family members to have bushfire survival plans.
Groups were also expressing strong views that the volume and multiple sources of paper based information were excessive. Many had not read or discarded the information. Strong views began to be expressed about the media campaign as panic driven. The perception was fire risk had been exaggerated.
It had been a relatively mild summer.
Financial risk associated with relocation was generally perceived by all groups as a greater threat to individuals in terms of their personal risk matrix than fire risk.
Right to stay values and attitudes, without a realistic sense of capacity was prevalent amongst older males. Female partners expressed concern about this position.
Single female households expressed concern around the complexity of the tasks related to planning and implementing relocation arrangements. Pet safety was a significant factor in anxiety about these arrangements in conjunction with the costs involved.
Rural and remote groups universally raised issues related to Council responsibility for roadside safety (clearing vegetation), road access and public transport options.
214
Community Radio
Providing community education to socially isolated, vulnerable persons in remote rural locations was an identified Council concern. A community radio station provided programming to disabled persons living in rural and remote communities.
The Project Manager led four Community Radio programs with a bushfire preparedness focus. Two of the sessions were co-presented with Region 13 CFA. The format of the sessions was designed to reinforce FireReady messaging to those who might not have the cognitive or literacy skills to plan and prepare for bushfire.
The sessions emphasised the importance of communication with personal carers and case managers. Personal responsibility for bushfire preparedness was promoted.
Project Products
Mapping
For the purpose of the project vulnerable persons were defined as frail elderly and disabled persons living in a Community Care setting.
Maps (Yarra Ranges Council, 2010) were developed identifying wildfire overlay areas, road access, demographic data (ABS 2006 Census Data) and sites of residential facilities to provide a notional sense of concentrations of vulnerable community care populations. (Commonwealth Health and Ageing Residential facilities were included to eliminate distortions in older cohorts within given postcode areas).
This information was then used in conjunction with Council HaCoS data. The HaCoS data identified clients geographically who had been assessed as socially isolated and/or in receipt of higher than average HaCoS service provision.
This mapping informed project direction and was expanded upon by Council’s HaCoS program in identifying (desk top review) and encouraging or supporting vulnerable Shire residents to develop a Bushfire Survival Plan.
Fliers
To address the issues noted in the unstructured interviews two fliers were developed in October 2009.
The first flier (Yarra Ranges Council, 2010) aimed to increase help seeking behaviours by frail and disabled persons with their personal networks. The second flier encouraged personal carers (family, friends, and neighbours) to support vulnerable persons be fire prepared.
215
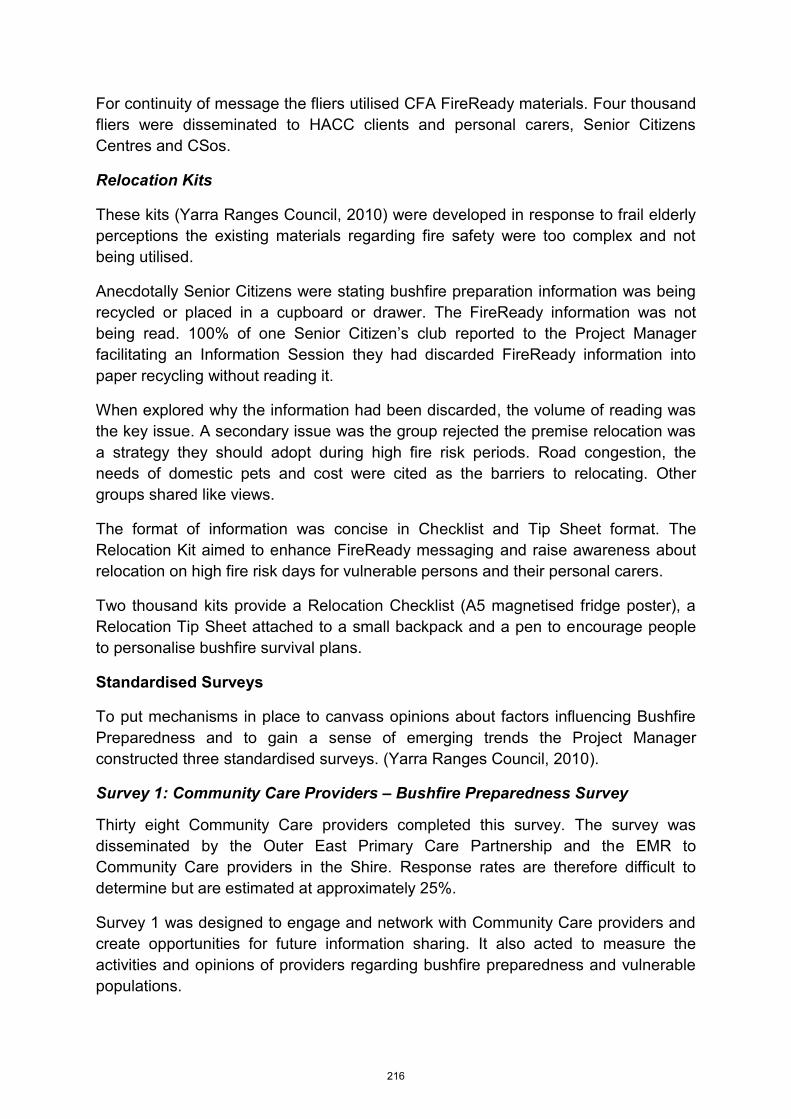
For continuity of message the fliers utilised CFA FireReady materials. Four thousand fliers were disseminated to HACC clients and personal carers, Senior Citizens Centres and CSos.
Relocation Kits
These kits (Yarra Ranges Council, 2010) were developed in response to frail elderly perceptions the existing materials regarding fire safety were too complex and not being utilised.
Anecdotally Senior Citizens were stating bushfire preparation information was being recycled or placed in a cupboard or drawer. The FireReady information was not being read. 100% of one Senior Citizen’s club reported to the Project Manager facilitating an Information Session they had discarded FireReady information into paper recycling without reading it.
When explored why the information had been discarded, the volume of reading was the key issue. A secondary issue was the group rejected the premise relocation was a strategy they should adopt during high fire risk periods. Road congestion, the needs of domestic pets and cost were cited as the barriers to relocating. Other groups shared like views.
The format of information was concise in Checklist and Tip Sheet format. The Relocation Kit aimed to enhance FireReady messaging and raise awareness about relocation on high fire risk days for vulnerable persons and their personal carers.
Two thousand kits provide a Relocation Checklist (A5 magnetised fridge poster), a Relocation Tip Sheet attached to a small backpack and a pen to encourage people to personalise bushfire survival plans.
Standardised Surveys
To put mechanisms in place to canvass opinions about factors influencing Bushfire Preparedness and to gain a sense of emerging trends the Project Manager constructed three standardised surveys. (Yarra Ranges Council, 2010).
Survey 1: Community Care Providers – Bushfire Preparedness Survey
Thirty eight Community Care providers completed this survey. The survey was disseminated by the Outer East Primary Care Partnership and the EMR to Community Care providers in the Shire. Response rates are therefore difficult to determine but are estimated at approximately 25%.
Survey 1 was designed to engage and network with Community Care providers and create opportunities for future information sharing. It also acted to measure the activities and opinions of providers regarding bushfire preparedness and vulnerable populations.
216
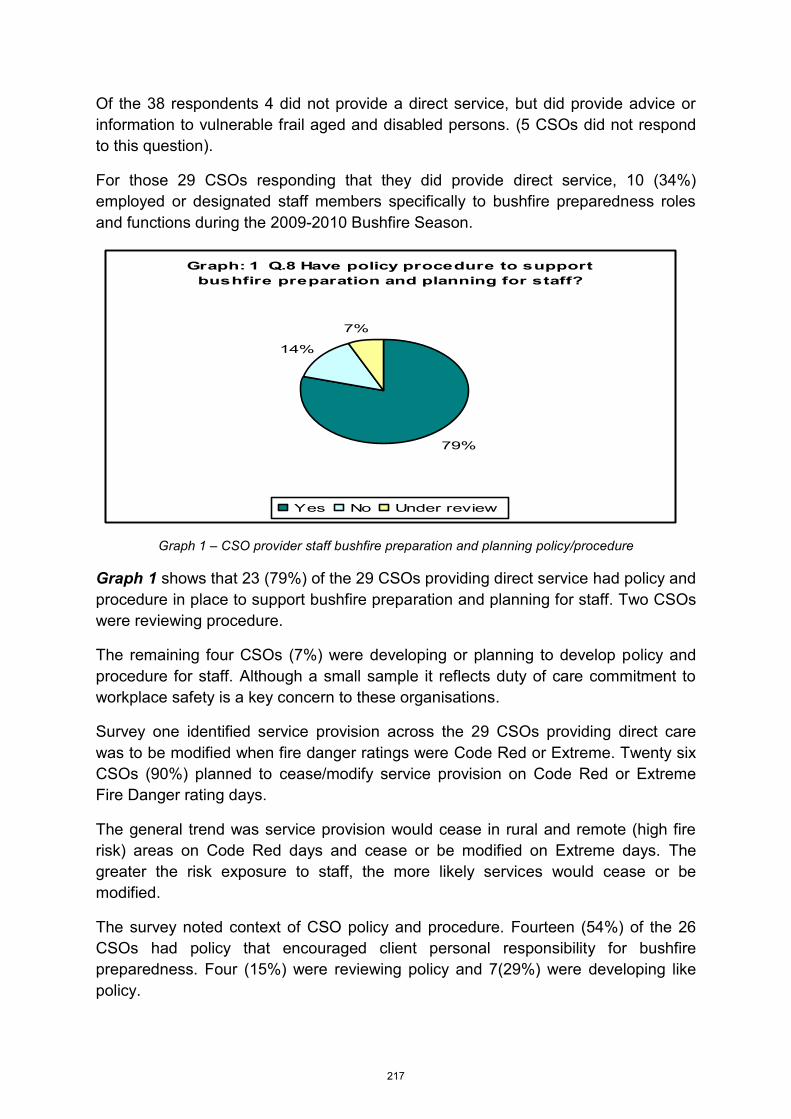
Graph: 1 Q.8 Have policy procedure to support bushfire preparation and planning for staff?
79%
14%
7%
Yes No Under review
Of the 38 respondents 4 did not provide a direct service, but did provide advice or information to vulnerable frail aged and disabled persons. (5 CSOs did not respond to this question).
For those 29 CSOs responding that they did provide direct service, 10 (34%) employed or designated staff members specifically to bushfire preparedness roles and functions during the 2009-2010 Bushfire Season.
Graph 1 – CSO provider staff bushfire preparation and planning policy/procedure
Graph 1 shows that 23 (79%) of the 29 CSOs providing direct service had policy and procedure in place to support bushfire preparation and planning for staff. Two CSOs were reviewing procedure.
The remaining four CSOs (7%) were developing or planning to develop policy and procedure for staff. Although a small sample it reflects duty of care commitment to workplace safety is a key concern to these organisations.
Survey one identified service provision across the 29 CSOs providing direct care was to be modified when fire danger ratings were Code Red or Extreme. Twenty six CSOs (90%) planned to cease/modify service provision on Code Red or Extreme Fire Danger rating days.
The general trend was service provision would cease in rural and remote (high fire risk) areas on Code Red days and cease or be modified on Extreme days. The greater the risk exposure to staff, the more likely services would cease or be modified.
The survey noted context of CSO policy and procedure. Fourteen (54%) of the 26 CSOs had policy that encouraged client personal responsibility for bushfire preparedness. Four (15%) were reviewing policy and 7(29%) were developing like policy.
217
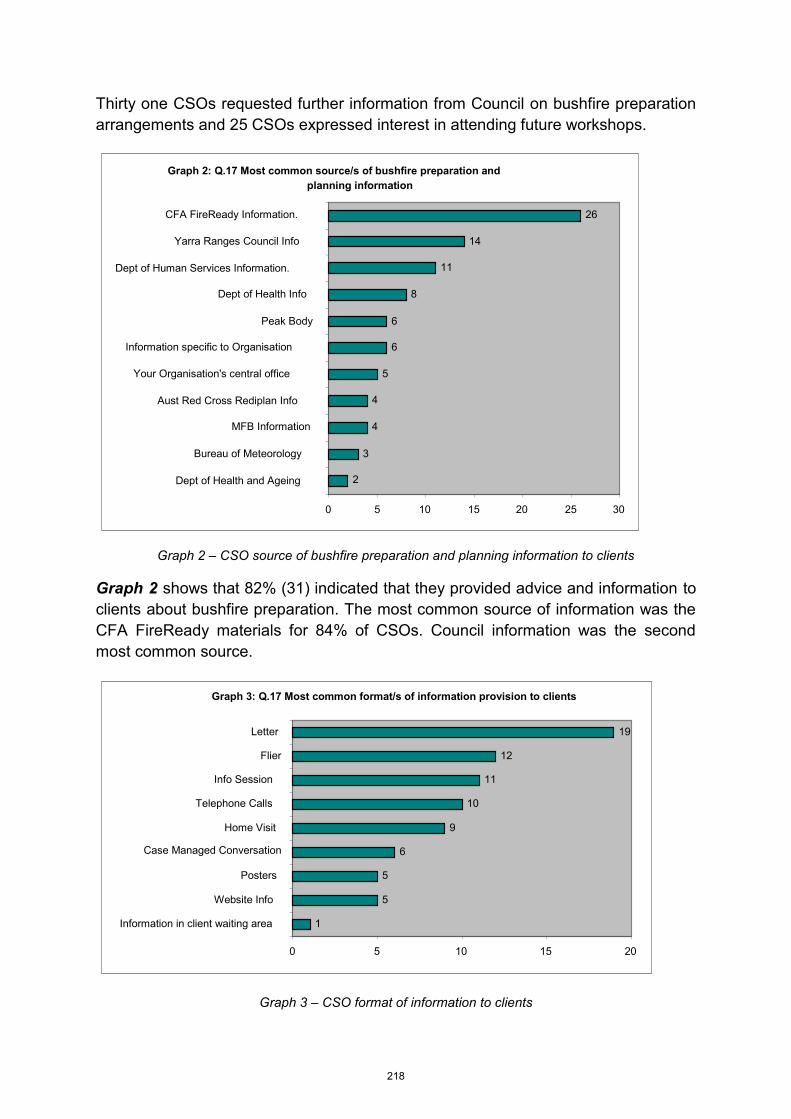
Thirty one CSOs requested further information from Council on bushfire preparation arrangements and 25 CSOs expressed interest in attending future workshops.
Graph 2 – CSO source of bushfire preparation and planning information to clients
Graph 2 shows that 82% (31) indicated that they provided advice and information to clients about bushfire preparation. The most common source of information was the CFA FireReady materials for 84% of CSOs. Council information was the second most common source.
Graph 3 – CSO format of information to clients
Graph 3: Q.17 Most common format/s of information provision to clients
1
5
5
6
9
10
11
12
19
0 5 10 15 20
Information in client waiting area
Website Info
Posters
Case Managed Conversation
Home Visit
Telephone Calls
Info Session
Flier
Letter
Graph 2: Q.17 Most common source/s of bushfire preparation and planning information
2
3
4
4
5
6
6
8
11
14
26
0 5 10 15 20 25 30
Dept of Health and Ageing
Bureau of Meteorology
MFB Information
Aust Red Cross Rediplan Info
Your Organisation's central office
Information specific to Organisation
Peak Body
Dept of Health Info
Dept of Human Services Information.
Yarra Ranges Council Info
CFA FireReady Information.
218
Graph 3 demonstrates how bushfire preparation information and advice was communicated to clients.
The Project Manager noted in conversations with community members at Community Education and Community Information sessions they had received written or verbal advice from several government and Community Care providers.
Survey 2: Peak Body - Bushfire Preparedness Policy Development
Survey 2 was designed to canvass the opinions of various peak advisory groups influencing Community Care policy development. The sample size is small and therefore difficult to interpret. Only 7 responses were received, representing a response rate of 31%.
Five of the 7 responses confirmed the provision of Bushfire Preparation policy and procedure advice to member organisations to support planning for workforce groups. Four Peaks had formulated policy and procedure information based on client personal responsibility. Two had not.
Survey 3: Measure fire plans of vulnerable residents (Senior Citizens)
One hundred and twelve households completed this survey. It was disseminated at three Senior Citizens’ venues (Yarra Valley, Wandin and Montrose) where the Project Manager provided a standardised overview of Council function and survey completion guidelines.
Approximately 70% of participants at the information session completed the survey. Some surveys were completed by couples.
The survey presented an opportunity to measure the Fire Readiness of Senior Citizens following an Extreme Fire Danger Rating in Victoria’s Central Region on 11 January 2010. The Project Manager was scheduled to provide Information Sessions to three groups shortly after the Extreme rating.
Of the 112 responses 57 households planned to relocate on an Extreme Fire Danger Rating day. Fifty five households had not planned to relocate.
On 11 January 2010 only 5 of the 112 (4.4%) households actually relocated.
Survey responses came from 37 single and couple households in rural and remote high fire risk areas.
219
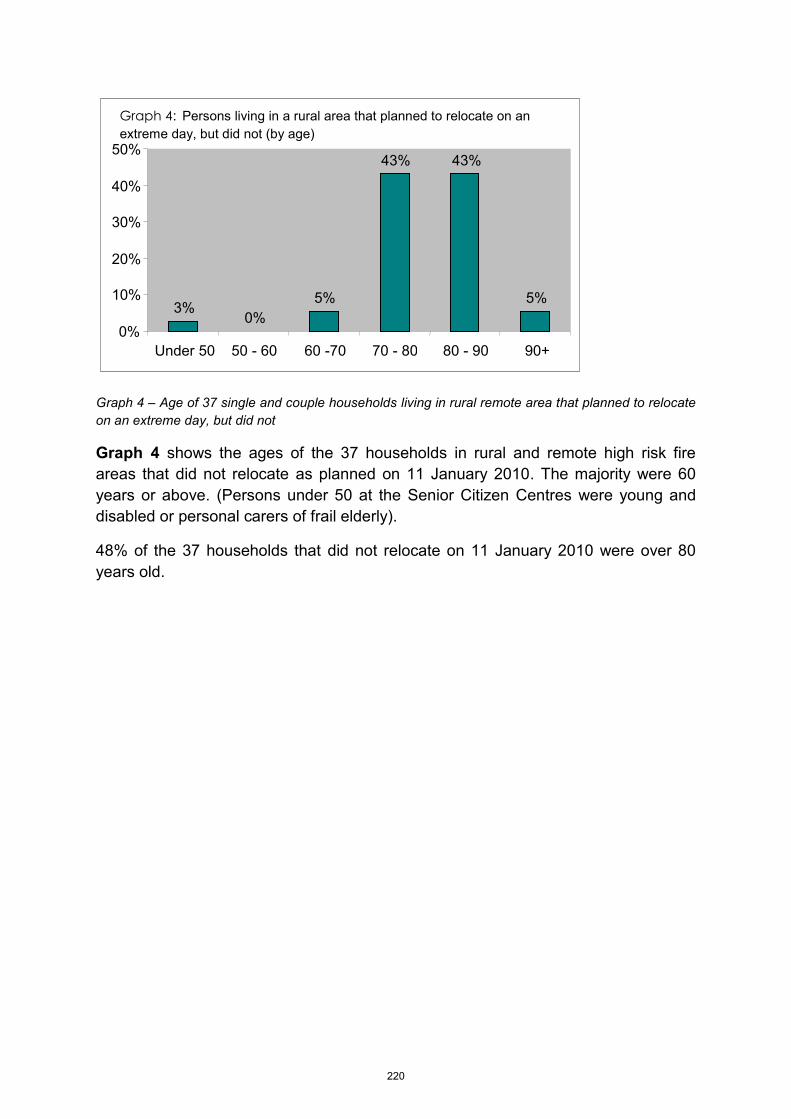
Graph 4 – Age of 37 single and couple households living in rural remote area that planned to relocate on an extreme day, but did not
Graph 4 shows the ages of the 37 households in rural and remote high risk fire areas that did not relocate as planned on 11 January 2010. The majority were 60 years or above. (Persons under 50 at the Senior Citizen Centres were young and disabled or personal carers of frail elderly).
48% of the 37 households that did not relocate on 11 January 2010 were over 80 years old.
Graph 4: Persons living in a rural area that planned to relocate on an extreme day, but did not (by age)
3% 0%
5%
43% 43%
5%
0%
10%
20%
30%
40%
50%
Under 50 50 - 60 60 -70 70 - 80 80 - 90 90+
220
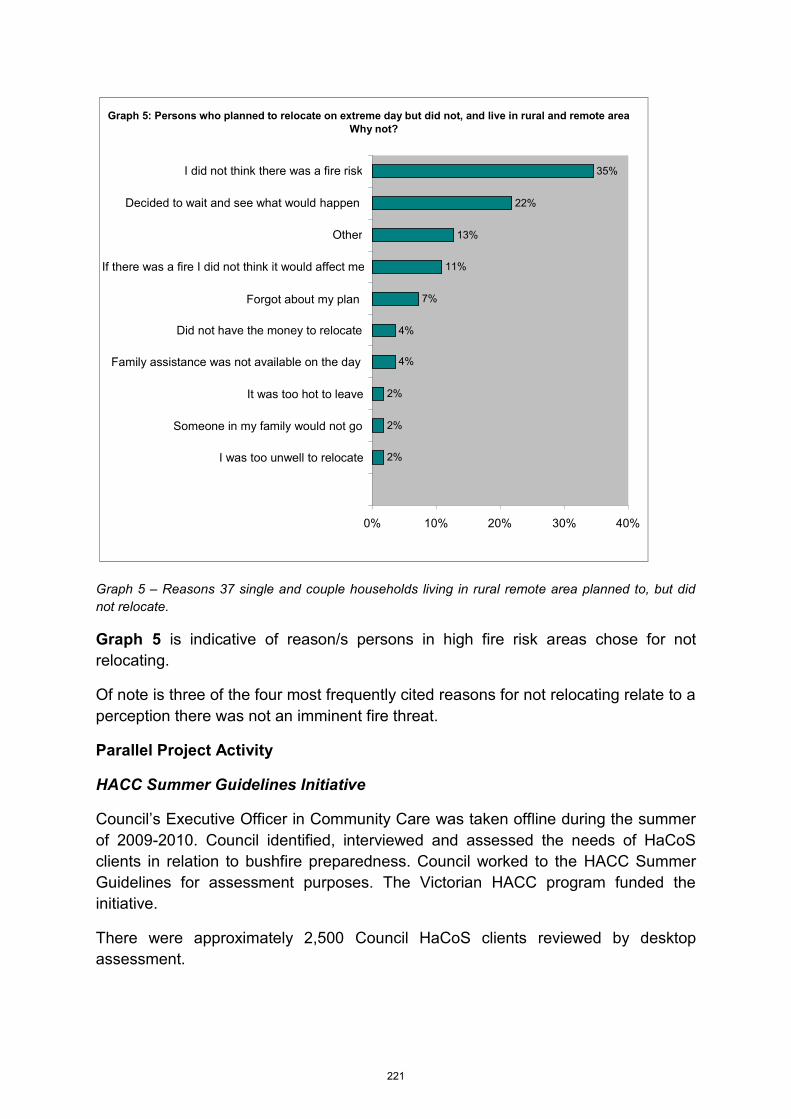
Graph 5 – Reasons 37 single and couple households living in rural remote area planned to, but did not relocate.
Graph 5 is indicative of reason/s persons in high fire risk areas chose for not relocating.
Of note is three of the four most frequently cited reasons for not relocating relate to a perception there was not an imminent fire threat.
Parallel Project Activity
HACC Summer Guidelines Initiative
Council’s Executive Officer in Community Care was taken offline during the summer of 2009-2010. Council identified, interviewed and assessed the needs of HaCoS clients in relation to bushfire preparedness. Council worked to the HACC Summer Guidelines for assessment purposes. The Victorian HACC program funded the initiative.
There were approximately 2,500 Council HaCoS clients reviewed by desktop assessment.
Graph 5: Persons who planned to relocate on extreme day but did not, and live in rural and remote area Why not?
2%
2%
2%
4%
4%
7%
11%
13%
22%
35%
0% 10% 20% 30% 40%
I was too unwell to relocate
Someone in my family would not go
It was too hot to leave
Family assistance was not available on the day
Did not have the money to relocate
Forgot about my plan
If there was a fire I did not think it would affect me
Other
Decided to wait and see what would happen
I did not think there was a fire risk
221
Where high vulnerability was determined, phone and face to face interviews were undertaken. A register of vulnerable clients was created. For those clients of the program identified without capacity or personal networks to prepare for bushfire, Council undertook to provide some resourcing and a relocation option.
Administration of the register remains as work in progress for Council.
Council assessed that only 60 highly vulnerable clients were identified from the 2,500 clients reviewed and only 16 of those clients required full Council support to plan and prepare for bushfire.
This represents 0.28% of HaCoS clients unable to utilise personal networks for assistance with bushfire preparedness and relocation arrangements.
The Executive Officer and the Project Manager of the Bushfire Awareness and Preparedness of Frail Older and Vulnerable Residents in Yarra Ranges worked closely together. The learning from the projects informed HaCoS sub-planning procedures for service delivery modification and the monitoring of outreach staff during high temperatures in Wildfire areas.
Both the Executive Officer and the Project Manager authored project findings in Draft Report for Council consideration. The reports were amalgamated into a joint Council Bushfire Awareness and Preparedness report in July 2010. The report was edited by Vicki Perre, Council’s Manager of the HaCoS program.
Conclusion
The majority of vulnerable frail aged and disabled persons living independently in high fire risk areas did not demonstrate acceptance of bushfire preparedness messaging. Risk was externalised and personal planning around harm minimisation relied on external resourcing and high risk place based solutions.
In September, October and November of 2009 presenting issues amplified anxiety and confusion about bushfire planning arrangements. A mild summer shaped thinking. In February 2010 vulnerable persons were presenting as disconnected from bushfire preparedness messaging.
Peak Bodies were working to support policy formation.
Community Care providers were proactive in developing frameworks to support bushfire preparedness and seek information on ways forward.
Service system resourcing to manage a coordinated approach to meeting the needs of vulnerable community care populations remained a primary concern of providers.
Workforce development was a priority. Staff safety and staff capacity to appropriately support vulnerable groups was an identified need.
222
Significant planning information and advice had been provided to vulnerable persons. Media, the 2009 Victorian Bushfire Royal Commission’s Interim Findings and the long term impact of the events of February 2009 on local communities were strident reminders of the need for bushfire preparation.
However anecdotal information and survey findings demonstrate frail aged and disabled persons were resistant or ambivalent to bushfire preparation planning arrangements inclusive of relocation.
Functionally, place based options were the preferred option. Cost neutrality for any relocation option was perceived as critical.
There were a range of complex psychosocial and place based variables that may have acted as barriers to behaviour change impacting on capacity or willingness to relocate.
Clearly cost, the logistics of travel, and strong public opinion within communities promoting Neighbourhood Safer Places strongly influenced thinking.
It was also apparent that the right to self-determine, the valuing of independence and the perception of capacity to manage obstacles were key determinants for vulnerable persons in decision making.
In February 2010 embedment of the factors that contributed to risk for vulnerable Shire residents during the fires throughout February 2009 had not been internalised. Given the disproportionate harms that came to vulnerable persons during the fires of February 2009 (2009, BVRC) this is a concern.
While only 0.28% of Council’s own vulnerable client group were assessed as unable to relocate, this project noted the majority of vulnerable persons were unwilling to relocate.
This raises questions about the capacity of the Community Care service system and ESOs to support highly vulnerable residents in high fire risk rural and remote areas where those residents choose not to relocate during extreme weather events.
Assessment of risk was not a demonstrated strength of the vulnerable population. Ambivalence regarding personal well-being was amplified by age. Neighbours did not demonstrate, nor were they perceived as a reliable support. Expectation of an ESO or Council to support fire preparation and or relocation was widespread.
Given these issues initiatives to support messaging need to be long term. Bushfire preparation for vulnerable persons must be underpinned by improved Community Care capacity and coordination. Consideration to developing relocation insurance and realistic travel options for vulnerable frail elders and young disabled persons relocating from rural and remote areas may assist to support personal capacity to relocate.
223
Bibliography
2009 Victorian Bushfires Royal Commission, July 2009. ‘Interim Report, Section 7 Stay or Go’ State of Victoria, Melbourne
Australian Red Cross, 2009, ‘Emergency REDiPlan, Household Preparedness for Seniors’ Australian Red Cross, Carlton
CFA, 2009, ‘New Fire Danger Rating’ State of Victoria, Melbourne
Elliott.C, 2010, ‘Accessible Information Update – Issue 2’ CFA, State of Victoria, Melbourne
Health and Human Services Emergency Management, 2009. ‘Summer Strategy for Home and Community Care Funded Organisations’ State of Victoria, Melbourne
Shire of Yarra Ranges, 2007. ‘Fire Prevention Plan 2007-2010’ Shire Yarra Ranges, Lilydale. pp. 24-28 of the document specifies an Extreme Risk assessment for places of assembly and institutions related to a structure or wildfire event. The plan was the genesis for the 2007-2008 Bushfire Preparation Project.
Shire of Yarra Ranges, 2009. ‘Municipal Recovery Action Plan’. Shire Yarra Ranges, Lilydale. pp. 6-14 provides an overview of the impact the February 2009 fires within the Shire and Council’s Relief Centre activity.
Yarra Ranges Council, 2010 ‘Bushfire Awareness and Preparedness of Frail Older and Vulnerable Residents in Yarra Ranges’ Yarra Ranges Council, Lilydale. Appendices A, B and C describe project products. Appendices D, E, F and G describe survey templates and findings.
224
Catastrophic Work / Life Balance: Emergency Responder Role Conflict and Abandonment – Implications for Managers
Greg Linsdell
Senior Lecturer
Charles Sturt University,
Australian Graduate School of Policing, Sydney, Australia
Paper presented at EARTH: FIRE AND RAIN Australian & New Zealand Disaster and Emergency Management Conference Brisbane – 16 – 18, April 2012
225
Catastrophic Work / Life Balance: Emergency Responder Role Conflict and Abandonment – Implications for Managers
Abstract
No one would seriously question the courage of our emergency responders, or their loyalty and sense of duty. But what happens when, in catastrophic emergencies, their duty as responders conflicts with their duty as a partner, parent or child; or in the case of volunteers perhaps, their duty to other organisations?
These dilemmas can result in “role conflict” which can detract from performance at work or result in the “abandonment” of duty. These phenomena have been researched, from time to time, since the 1950’s but the focus returned after Hurricane Katrina that hit New Orleans in 2005. During that event, at a time where a community was in desperate need of police support, 240 of the 1450 strong force did not go to work, some for many weeks. Of the 240, 51 were later fired for “abandoning their posts”. After the storm, another sixty officers resigned and two committed suicide.
In 2011 the University of Delaware, Disaster Research Centre (DRC), reported the results of a meta-evaluation of the research done to examine role strain, role conflict and abandonment in incidents ranging from natural disasters and terrorist attacks to pandemics. The DRC observed that, methodologically, the research fell into two categories; behavioural studies that examined actual incidents, and perception studies that measured what people thought they would do in a hypothetical situation. The results between the groups varied enormously with perception studies predicting up to 70% abandonment in some cases but behavioural studies being far more optimistic to the point that it was suggested that role abandonment would not have a significant operational impact.
This paper will discuss the manifestations of role conflict in emergency services and the potential for role abandonment suggesting that, while the likelihood of mass abandonment is low, there may be a “tipping point” at which it will occur. The Victorian fires of 2009 are examined as an event where one might expect evidence of abandonment. Finally the author will discuss proactive measures that may be considered during the planning, prevention and response phases of a disaster or catastrophe to mitigate against role conflict, thereby increasing performance and reducing the risk of mass abandonment.
Keywords: Role conflict, role abandonment, work/family conflict, volunteers, emergency responders, fire-fighters.
226
Catastrophic Work / Life Balance: Emergency Responder Role Conflict and Abandonment – Implications for Managers
Introduction
The concept of work / life balance is something we have become increasingly aware of in recent times. The need to “have a life” beyond work is seen as not only desirable but also necessary for proper mental and physical health. Organisations have responded with more flexible policies around working hours, location of work and absences. For the most part this revolution in work practice continues, enabled by technology and pushed by generational change. However, there are times where emergency response agencies must insist that people be at work. Communities rely on emergency responders and while routine operations permit flexibility, sudden emergencies and catastrophic events may require people to put work first. This paper examines the literature on the conflicting pressures between work as an emergency responder and other life roles and suggests that under certain extreme circumstances large-scale role abandonment by emergency responders is foreseeable. Proactively reducing the pressures associated with role conflict in the emergency response workforce is likely to increase retention rates, improve operational performance and defer the “tipping point” at which large-scale abandonment is predicted. A number of options and considerations are put forward to assist emergency response managers and agencies in the management of risks associated with role conflict.
Role Conflict and Abandonment
Role conflict refers to the times when it is difficult for individuals to meet the demands of filling multiple roles (Killian, 1952; Westman, 2001). In the context of this paper we are referring to people who have an occupational role as a as a career, retained or volunteer1 emergency responder; such as a fire-fighter, rescuer, paramedic or police officer. These roles require people to face dangers and take risks that other citizens are not exposed to or expected to confront. Such is the selfless bravery and sense of duty among these groups that during relatively recent “mega-events”, such as the World Trade Centre attacks in New York, the unsolicited convergence of emergency responders became a problem in itself. (See Tierney, 2003) Emergency responders do this work for a variety of reasons but commonly it is an intrinsic and altruistic motivation to serve or protect the community and in this way make a contribution to society. Many make the ultimate sacrifice, losing their lives in the course of their duty. (For example see Mayhew, 2001; Ridenour et al., 2008, regarding the health and safety risks of policing and firefighting.)
1 Career officers are those for whom the emergency response role is the primary occupation, usually full-time. Volunteer and retained emergency responders are those who make themselves available for training and call-out to incidents. The difference is that retained officers receive an allowance for being on-call and may be paid while on duty at a call-out. Volunteers are not paid in this way but the term “volunteer” is used in this paper to describe all “non-career” emergency responders because remuneration is not a key factor.
227
Of course emergency responders have ‘life roles’ beyond their profession. They are parents, siblings and children with interdependent relationships with others. They have friends and colleagues who may rely on them and, particularly in the case of volunteers, may have a second “primary” occupation and perhaps customers and employees to whom they have various levels of responsibility. Simultaneously meeting the expectations of these various responsibilities can be difficult. Emergency responders often work shift work and have unpredictable hours and may be subject to call outs. In addition, the strains of emergency response work can lead to changed social and family behaviours that can impact on relationships.
Australian communities are heavily dependent on their 220,000 volunteer fire fighters (J. McLennan, 2008) but being a volunteer can put pressure on other life roles. In 2007 the average resignation rate for Australian volunteer fire agencies was 7.7% (McLennan, Birch, Cowlishaw, & Hayes, 2009, p. 40). A study of South Australian fire services revealed that of those volunteers who resigned between December 2005 and December 2007, 51% left due to “work/family needs” (McLennan, et al., 2009, p. 45). The negative impact on work and family roles was described by McLennan, et al. (2009, p. 45) as the most pervasive of the “(notionally) avoidable reasons why volunteers resign”. In addition, research has illustrated the impact on relationships of absences from home and the subsequent fatigue after duty (See Greenhaus & Beutell, 1985) as well as other changes in behaviour such as intolerance and emotional withdrawal. (See Schultz, Cowan, Cowan, & Brennan, 2004; Story & Repetti, 2006) To further exacerbate the impact of volunteer work there is also the “stress crossover effect” to the partners of volunteers described by Cowlishaw, Evans and McLennan (2010). Stress crossover effect is the process by which stress or strain from work leads to stress or strain experienced by the partner at home often to detrimental effect. (Westman, 2001)
In addition to the potential for conflict between duty and family there can also be role conflict between duty as an emergency responder and other employment. This is especially prevalent in volunteer forces as volunteers are usually responders in addition to their full time employment or activity2. The Australian volunteer agencies are experiencing a trend toward the selective release of volunteers depending on the type of call. For example, like many fire services, the New South Wales Fire & Rescue Service (FRNSW) have expanded their role to include vehicle rescue and HAZMAT incidents in addition to traditional fire fighting and associated duties. Some employers are reported to be making judgments about which call-out volunteers will be released for based on the nature of the incident, such as fires but not motor vehicle collisions; or the threat the incident presents to the local community, meaning within a radius of the local community; or simply refusing to release employees during work hours. For most volunteers the choice between full time employment and the provision of volunteer services isn’t really a choice and there are increasing numbers of rural fire stations that are manned by career fire fighters during business hours. (Brogan, 2012)
2 This is changing in many areas where volunteer ranks are increasingly made up of retirees. (Brogan, 2012)
228
Finally, there is the phenomenon of conflict between “duty and duty” which occurs where responders are members of more than one emergency response agency and is referred to as “two-hat syndrome”. A study of fire and rescue personnel in Atlanta revealed that 22.2% also worked for at least one other public safety agency. (Delinger & Gonzenbach, 2002). There is a general paucity of research in this area but it is quite likely that it is prevalent in the Australian volunteer services as well because many country towns and cities have a limited pool of potential volunteers. The result is multiple memberships that, for the most part, don’t create conflict. Police officers may be volunteer fire officers and volunteer for callouts when they are off-shift. Paramedics may work as rescue personnel on a volunteer basis. However, there are times when a conflict may occur. A practical example of this occurred in central New South Wales where an ambulance officer was called to a serious motor vehicle accident. This officer was also a Deputy Captain of the NSWRFS and, on observing the response of the fire service, decided to changes roles during the event and take control of the fire service response. Naturally this resulted in considerable confusion and some angst among responders. (Brogan, 2012) Of course it would be unusual for such decisions to be made on-scene, rather they will occur at the time of call out, but this demonstrates the potential for multi-agency events to create role conflict and opens the door to thinking about large-scale multi-agency events which require large numbers of emergency responders. It is not difficult to imagine a multi-vehicle collision involving serious injuries and the need to remove people from wrecks combined with a HAZMAT spill from an involved tanker creating a requirement to evacuate local residents. The range of emergency responses, from traffic management, medical, road rescue, hazard management and evacuation would stretch most regional responses in the first minutes and hours.
Role conflicts, of one type or another, are a part of life for many emergency responders and perhaps this is one of the less visible burdens carried by people working in these professions along with exposure to risk and trauma. Those who do not resign will find mechanisms to mitigate and cope with the demands of competing roles such that it does not unduly affect their work or their life. Others may compartmentalize, underperform, delegate responsibility or turn to others for assistance (See Webb, Beverly, McMichael, Noon, & Patterson, 1999). There are also links between role conflict and work related burnout as well as a lowered intention to continue volunteering. (e.g. Lewig, Xanthopoulou, Bakker, Dollard, & Metzer, 2007) In acute cases “role abandonment” may occur. Role abandonment is where a person stops fulfilling the responsibilities associated with a role. It is noted that the word “abandonment” is emotionally charged but in this context it is not used in a judgmental sense. Abandonment behaviours by emergency responders are hard to imagine, and contrary to the devotion to duty and bravery for which these officers are known, but it can and does happen. Abandonment happens where officers are confronted with “wicked” dilemmas, a stark choice between fulfilling their responsibilities to the work and their family. Such a dilemma could affect individual officers from time to time, such as a medical emergency with a family member requiring immediate, unplanned absence from work. Contemporary emergency response organisations have matured sufficiently to cope with such an incident in a supportive manner and without recrimination. However, it is possible to imagine
229
scenarios where large numbers of emergency responders may simultaneously abandon their occupational role at which time there would be a problem due to reduced operational capability. Needless to say, the consequence of mass abandonment may place the communities who rely on emergency services at increased peril. Considerable research has been done with scenario-based projections of role abandonment in emergency responders and health care personnel.
Precursors to Abandonment
Perception studies generate hypothetical scenarios and question people on their likely responses. The strength of this approach is that it enables wide-ranging “what-if” events to be explored across large numbers of respondents. These can be events of a nature or scale that has not yet happened, such as a “dirty bomb” attack in a major city. The down side is the artificiality of the exercise and the difficulty in writing scenarios that are not contrived. Nevertheless perception studies are widely used and can provide very useful indicators. The results from role abandonment related perception studies are somewhat alarming. A meta-evaluation of such studies conducted by the Disaster Research Centre, University of Delaware, found that role abandonment would be a major problem during many types and intensities of disaster (Trainor & Barsky, 2011, p. 15) The range of predictions uncovered were from 20% (Quarantelli, 1978) to as high as 68% (Alexander & Wynia, 2003) with the higher levels of abandonment expected for events with chemical, biological, radiological and nuclear elements.
In contrast, behavioural studies examine actual incidents either through observation and interview or the review of official inquiries. The problem of artificiality associated with perception studies is eliminated because the event has actually occurred, but there are other limitations. Among these is the fact that the range of events and access to participants are restricted. These studies have largely focused on natural disasters such as tornadoes, hurricanes and earthquakes but have also explored public health emergencies (See Trainor & Barsky, 2011, p. 13). The Disaster Research Center meta-evaluation concluded that behavioural studies suggest that the role abandonment “will be minimal except under very specific conditions, such as those that were present in the case of the New Orleans Police Department during Hurricane Katrina”. (Trainor & Barsky, 2011, p. 4). So the question arises, what are the “very specific conditions” for large scale and debilitating role abandonment? As the most well known example of mass role abandonment behaviour, Hurricane Katrina provides some insight.
Hurricane Katrina killed over 1,800 people, affected 28,000 square miles and left tens of thousands homeless (United States Congress, 2006). During this mega-event, at a time where a community was in desperate need of police support, 240 of the 1450 strong police force did not go to work, some for many weeks. Of the 240, 51 were later dismissed for “abandoning their posts” (Trainor & Barsky, 2011, p. 13). Depending on which of these figures you use this is an abandonment rate of either
230
3% or 16% - such levels can significantly degrade an organisation’s ability to respond effectively and support a community in need. After the storm, another sixty officers resigned and two committed suicide.
Hurricane Katrina reveals the possibility that there may be circumstances where large numbers of emergency responders may simultaneously put their duty to their family ahead of their duty to the communities they are sworn to serve. This event also lends more credence to the predictions of perception studies which can create scenarios on the scale of Katrina. But what are the potential elements that may impact on abandonment behaviour? The proximity of emergency responders families must surely be one. In the aftermath of Katrina the first few hours of the search and rescue mission was spent retrieving almost 300 officers from rooftops and attics (Testimony of Warren J. Riley, Superintendent of the New Orleans Police Department, 2006) and over 1000 of its 1450 officers lost their homes (Anderson, 2006). Others have suggested that the responders’ commitment or dedication to their role will be influenced by the existence of organizational problems or failures. At the time of Hurricane Katrina the New Orleans Police Department was reportedly suffering from low morale and chronic understaffing (See Trainor & Barsky, 2011, p. 14). The links between organizational loyalty and role abandonment are not fully understood but it is likely that this was a factor. Perception studies often explore the conditions within an event that may contribute to abandonment. These have revealed two important factors. The first is an absence of mechanisms to care for children and the elderly in the absence of a responder and secondly the ability of the responder to communicate with family members during an event (Mackler, Wilkerson, & Cinti, 2007; Smith, 2007). Both of these factors can be mitigated through action prior to and during an event.
Other studies reveal that the nature of the event may also be an important factor in role conflict and role abandonment. Balicer, Omer Barnett & Everly (2006) surveyed local public health workers and found that nearly half the respondents stated they would not report to duty during an influenza pandemic. Qureshi et al (2005) found that health care workers reported that they were most willing to report to work during mass casualty incidents (86%) and environmental disasters (84%), and were least willing to report during a SARS outbreak (48%), radiological event (57%), or smallpox epidemic (61%). Fear and concern for family and self and personal health problems were the most frequently cited barriers to “willingness.” (Kushma, 2007)
However, a closer examination of the Hurricane Katrina experience suggests motivations for abandonment are more elementary. A case that came to represent the wicked dilemma faced by many officers during that event was that of Paul Schubert who was one of the officers dismissed for leaving his job as a police officer shortly before Hurricane Katrina made landfall. During his disciplinary hearing Schubert said that he needed to take care of his disabled wife, Madeline O’Neill. Madeline required doctor’s care and medicine for her rheumatoid arthritis, diabetes and poor eyesight. Schubert was given leave to evacuate his wife, but was absent for a month as he searched for accommodation, doctors and medicine. During that
231
time he says that he contacted his supervisors at least three times during that period and was told he should take care of his wife and return as soon as he could. Schubert was reported as saying “I couldn’t just abandon her in a hotel room. I would have been signing her death warrant...it tore me up not being here during the storm.” (Johnson, 2006, p. 1)
Of course this type of individual action is understandable, but when it is widespread it creates major problems for effective response summed up by the head of New Orleans Police Association, David Benelli, who was quoted as saying, “You know, if every single officer said he had to take care of family, there would be no one left on this job. This is not a normal job. Police officers take an oath. They are supposed to stay”. (Johnson, 2006)
If key elements of role abandonment include events of large scale which impact significantly on the families of emergency responders then the Victorian bushfires of 2009 were an event where one might expect to see evidence of this.
In the last week of January 2009 the Australian state of Victoria was subjected to an extreme heat wave with temperatures over 43°C recorded for three consecutive days. By February 7th the State was “tinder dry” and the forecast was for similar temperatures with strong winds, ideal conditions for wild fire. The fire and other emergency services prepared for the worst and the public were warned of the extreme fire danger. On that day 316 fires broke out across the state, 173 people were killed, 7562 people were displaced, over 2,000 homes were destroyed and 450,00 hectares of land were burned. (Teague, McLeod, & Pascoe, 2010a), Many fire-fighters were injured physically and psychologically by the fires of 7th February. Two officers lost their lives but many emergency responders also lost family, friends, colleagues and their homes. For example, more than 30 Department of Sustainability and Environment (DSE) staff lost a close family member or their homes (Department of Sustainability and Environment, 2009, p. 22) and almost 300 Country Fire Authority (CFA) volunteers and their families were affected by the fires (Volunteer Fire Brigades Victoria Inc, 2009, p. 14). In terms of the impact on the families of responders this event is quite high, but does not reach the figures from Hurricane Katrina.
The Victorian Bushfires Royal Commission did not voice any concerns about the incidence of abandonment. To the contrary, the Commission declared that it agreed with the comments of Mr David McGahy, Captain of the Arthurs Creek CFA brigade and believed they were equally true of the entire state. McGahy had said:
I never cease to be amazed to this day at the absolute bravery and professionalism of the men and women of my brigade. There were people in charge of trucks that had no idea—they were from Strathewen—whether their houses were there, they had no idea if their families were alive, and they continued to do what was requested of them. They stayed on the line and
232
helped other people. My admiration for the bravery, as I said, of the members of my brigade knows no bounds. (Teague, McLeod, & Pascoe, 2010c, p. 139)
The prevalence of the responder role over family roles during the Victorian fires is also evident in the following statement by the 2009 Victorian Bushfires Royal Commission, which said that it;
“also heard of the impact of volunteering on the family members of CFA volunteers. On 7 February many were left to wonder if their partner, son, daughter, mother or father would return home. Family members supported CFA volunteers by freeing them to protect the community while they stayed to defend the family home. Further support was provided with catering for brigades, maintaining households, or running the family business. The Commission acknowledges the essential role played by the families of CFA volunteers in enabling the volunteers to give priority to their communities during emergencies.” (Teague, et al., 2010c, p. 138)
Of course the Royal Commission was not looking for examples of the abandonment of duties during the event though it may be reasonable to assume that if abandonment had occurred to a critical level it would have been noted. Equally there is little doubt that there were occasions where fire fighters did abandon their fire-fighter role in favour of other responsibilities. There was one particularly tragic example of a member of Victorian Country Fire Authority (CFA) who was reported to have “left his crew to help a relative on 7th February. He was subsequently caught by the fire (and died) as he tried to leave.” (Teague, et al., 2010c, p. 132)
The evidence from the Victorian fires is not sufficient to draw any detailed conclusions about the incidence of role conflict and role abandonment during that event other that to observe that both occurred to some extent but may not have had a significant impact on operational effectiveness. This is consistent with the conclusions of previous behavioural research and the Disaster Research Center’s overall finding which was that “role conflict and role strain are serious and significant problems across hazards, sectors and time (and that) role abandonment … is a rare outcome that typically does not have a significant influence on response operations.” (Trainor & Barsky, 2011, p. 26) So what should we make of the Hurricane Katrina experience?
Hurricane Katrina alerts us to the possibility that large-scale abandonment is possible in certain circumstances, which are not yet fully understood. A useful starting point may be defining the scale of an event which is extraordinary. The distinction between a disaster from a catastrophe may be a starting point. In summary, a disaster become a “catastrophe” when large areas and communities experience major threats to life in a short period requiring immediate responses to restore social order. The result is abrupt and simultaneous interruption of community and social institutions including emergency organisations necessitating outside
233
support often at national levels. (Quarantelli, 2008, pp. 874-875) Indeed there are some highly regarded researchers, such as Quarantelli (2008) who suggest that the abandonment experience of New Orleans was more to do with problems within the Police Force than with role conflict (See also Anderson, 2006). However, this is not an entirely satisfactory explanation as organizational dysfunction may actually contribute to role conflict by reducing the loyalty, and therefore sense of duty, to the emergency responder role thereby increasing the influence of other roles. Mass role abandonment did happen during Hurricane Katrina to an unprecedented level, though Quarantelli (2008) suggests that the behaviour of the St. Croix Police Force during Hurricane Hugo was similar. What are not understood properly are the reasons. To conceptualise the “trigger” to mass abandonment it may be useful to visualize a “tipping point” beyond which otherwise inconsequential levels of abandonment will rise dramatically and possibly to the levels predicted by perception studies. This “tipping point” is the point at which the combination of circumstances shifts the primary duty from emergency response to family or other duty for substantial numbers of responders.
Prevention and Mitigation
Research suggests that role conflict is a precursor to abandonment, therefore addressing role conflict will not only result in better performance of those who remain in their emergency response role, but may also defer the “tipping point” of mass abandonment. As discussed, the literature reveals many factors that contribute to the incidence of role conflict. In summary these are:
1. Impact on responders families – this is the essential ingredient of familial role conflict meaning that the incident must at once require the services of the emergency responder in their occupational role while simultaneously creating a demand for them to fulfill a duty in support of others, primarily family. This concept is discussed in further detail below.
2. Type of disaster – perception studies suggest that willingness to work decreases during disasters involving chemical, biological and nuclear agents. (Trainor & Barsky, 2011, p. 15) Disasters which meet the criteria of a catastrophe may increase the difficulties for families thereby increasing their dependence on the responder.
3. Health of the organization – this is the favoured explanation of those who purport that the Hurricane Katrina case was an exception predicated by low morale and poor discipline. See Quarantelli (2008, pp. 890-891) The rationale is that the sense of duty or loyalty to a dysfunctional agency is less and therefore other roles may take a higher priority.
4. Absence of support mechanisms for the families of responders – This is the most often cited cause of role conflict and stress in responders. (Friedman, 1986; Qureshi, et al., 2005). According to Trainor and Barsky (2011, p. 23) “emergency workers are less likely to experience role tensions if they know that their families will be cared for in the aftermath of an event.”
5. Inability to communicate with family – Emergency responders are less likely to be distracted from their duties by attempts to make contact with family or suffer stress and role conflict if they know their families are safe during an event.
234
6. Prevalence of responders who have a role with another public safety organization – “two hat syndrome” is a potential issue in this regard but the full impact is not known. Multiple memberships of emergency agencies is experienced in Australia but the extent of this needs to be researched and the potential adverse implications during a catastrophe should be assessed to inform policy in the future.
For the managers of emergency response agencies this knowledge provides a range of options to decrease work conflict and increase effectiveness and retention rates while reducing the residual risk of mass abandonment. Most importantly though is the need for emergency response managers and agencies to view the management of role conflict as an organisational responsibility rather than as an individual issue for officers. Role conflict exists because emergency responders are competent people with a strong sense of duty who have obligations to others outside of work. This is not only inevitable it is laudable as it provides balance and a supportive framework for officers. Therefore it is incumbent on agencies to take this into account and take steps to design structures and processes that will reduce the experience of role conflict in its personnel. A range of considerations that require a careful evaluation of the organization will govern the actions that will work for various agencies. For example, how many officers have “two-hats”, what are their roles (Are they critical or not?) and are there policies or contingency arrangements in place for the occasion where the services of that person are simultaneously required by both organisations?
To reduce role conflict the primary area of development should be the facilitation of improved communication with, and support of, responders’ families during the deployment of officers. There are likely to be many ways of avoiding the situation described Mr David McGahy, Captain of the Arthurs Creek CFA brigade who told the Bushfire Royal Commission that “there were people in charge of trucks that had no idea … whether their houses were there, they had no idea if their families were alive” (Teague, et al., 2010c, p. 139) Such uncertainty will inevitably have adverse affects on performance in the field (US Department of Health and Human Services, 2005) and concern for family members is the most significant cause of role conflict (Qureshi, et al., 2005). To help address observed work / family conflict in volunteer fire-fighters it has been suggested that “there is a need for agencies to facilitate the development of processes to better support the families of volunteers” (Cowlishaw, McLennan, & Evans, 2008, p. 28) and a family support and safety network was the primary recommendation of the Disaster Research Center (Trainor & Barsky, 2011, p. 26). Indeed the foremost recommendation of the Disaster Research Center was the development of a Family Support and Safety Framework. Such a framework would:
1. “facilitate family preparedness of an event, 2. provide effective channels for communication from and to the family, and 3. help organise and plan for responder families’ needs.” (Trainor & Barsky,
2011, p. 21)
235
Family preparedness may be facilitated through information packages and support. This will vary according to the prevalent threat, but in a bush-fire area it would mean ensuring that responders’ families’ have made the necessary preparations and have the resources to deal with a threat or evacuate in the absence of the responder. Family readiness may be incorporated into an agencies pre-season preparations with requirements for officers to report back when arrangements are in place. Support and assistance may be provided officially or through family volunteers.
Regular and accurate communication on the status of loved ones will also mitigate against role conflict. A manager in the Victoria CFA described how the perceptions of danger held by family members can be distorted by selective media coverage:
The TV camera will look for the part of the fire that’s got flames shooting in the air, because that gets recognition on the nightly news. Not that ninety-five per cent of the fire perimeter is black. No, the one bit where they’ve got the flame…even if it was from five hours beforehand. Now the family knows very little about what’s gone on. They know little about what training you’ve done because they haven’t been involved in it. Hence, their view of the world is it’s death and destruction. (Cowlishaw, et al., 2008, p. 26)
It is not always possible for responders to call family from the field due to lack of coverage or the intensity of their role. In catastrophic events the mobile phone network is also likely to be compromised through overload or damage. The monitoring of the status of family members is a task that could be undertaken in the communication centre so that officers can check in by radio, when time permits, and be assured that they would be informed if they needed to be removed from the field. This would require a dedicated landline or other communication system (Such as a redundant service network) for family members to update their status and contact details. The call taker should also be in a position to advise family members on the location and condition of the responder. Such a service, albeit a significant imposition on an already taxed communications room would arguably reap considerably benefits in operational effectiveness by reducing role conflict and minimizing the time taken by the officer to independently seek out such information from the event scene. Group SMS and other communication technologies would minimize the call time requirements as long as the cellular and data networks remain active.
Enabling support for families in the aftermath of an event is another measure that will reduce role conflict. Once again this will depend on the nature of the threat in the region, but the provision of transport or supplies for isolated elderly or incapacitated relatives is an example. Provision of shelter facilities for responders’ families who are displaced is another. Measures such as these can be incorporated during the preparation phase so that family volunteers can activate them easily when they are required. (See Trainor & Barsky, 2011, pp. 21-23 for a discussion of other options in these areas.)
236
The proximity of responders’ area of work responsibility to their families’ location is another factor that could be examined. What percentage of officers families live and work in the same geographic area that the responder is likely to be required to serve? What are the roles of these officers in a catastrophic event? Is it possible to avoid this risk by ensuring key personnel will respond from outside the affected area?
In Victoria Police there is an emerging practice to “import” a senior management group to manage an emergency thereby relieving the local command team to focus on the event unencumbered by considerations of affected family, friends and colleagues. The Western Region of Victoria was subjected to extensive flooding in January 2011. Recognising the impact on local commanders and the need for those commanders to show leadership in support of staff and families, an Emergency Response Team from the regional headquarters was dispatched to manage the event. This intervention was supportive and collegiate with the local staff providing support and advice to the Regional team. It was found that this action avoided the risks of reduced performance by key personnel who may have fears for their own families or be providing support for staff with similar fears. It is said that fires can unite communities while floods can divide them. This is partly because floodwaters can be diverted, contained or released to protect some properties, often at the expense of others. Decisions to hold water back, build levies or sandbag critical areas; or release water from containment or demolish existing levies can have positive results for some and dire results for others. The independent commanders were not subject to the role conflict that may have been present in local commanders when it came time to decide which areas would be protected and which would be flooded. The success of the concept of regional Emergency Response Teams to be deployed in support of major events has resulted in steps to extend the model across all regions. (Nugent, 2012) Arrangements to bring in fire fighters from interstate and New Zealand, although motivated primarily by resource requirements, will have a similar effect as these officers do not experience the role conflict of local officers whose families may be in the fire zone.
Conclusion
In conclusion, role conflict is a part of life for emergency responders and can lead to reduced performance levels during disasters, damaged personal relationships, a transfer of stress to partners and lower retention rates by agencies. While emergency response agencies are keeping pace with modern, flexible work practices there is a limit to which these can be adopted and there will be times, particularly in crises, where role conflict reaches intense levels. This knowledge creates an onus on agencies to take proactive measures to reduce role conflict, as the detrimental effects on capability are greatest during the times of greatest need.
Mass role abandonment is a risk that is not fully understood but there is evidence of a number of factors that contribute to its likelihood and role conflict is at the top of this list. There is clearly a need for more research in Australia relating to role conflict
237

and this will occur as awareness of the issue grows. By taking steps to reduce role conflict it is likely that the residual risk of mass abandonment will also be reduced. Some of the measures that are available are low cost and others will increase overheads. In this regard it is worth noting that Australia’s volunteers, the group of emergency responders most vulnerable to role conflict, save state and territory governments 1.5 to 2 billion dollars each year (J. McLennan & Birch, 2005) and no-one can take the risk of mass abandonment during a catastrophe.
238
References
Alexander, G. C., & Wynia, M. K. (2003). Ready and Willing? Physicians' Sense of Preparedness For Bioterrorism. Health Affairs, 22(5), 189-197.
Anderson, W. (2006). "This Isn't Representative of Our Department:" Lessons from Hurricane Katrina for Police Disaster Response Planning. Disasters and the Law.
Balicer, R., Omer, S. B., Barnett, D. J., & G.F., E. (2006). Local public health workers' perceptions toward responding to an influenz pandemic. BMC Public Health, 2011, from http://www.bioedcentral.com/1471-2458/6/99
Brogan, R. (2012). New South Wales Fire Service (Rtd). A/Lecturer in Fire Investigation, Charles Sturt University. Personal communication 28 February 2012.
Cowlishaw, S., Evans, L., & McLennan, J. (2010). Work-family conflict and crossover in volunteer emergency service workers. Work & Stress, 24(4), 342-358.
Cowlishaw, S., McLennan, J., & Evans, L. (2008). Volunteer Firefighting and Family Life: An Organisational Perspective on Conflict between Volunteer and Family Roles. Australian Journal on Volunteering, 13(2), 21-31.
Delinger, R. F., & Gonzenbach, K. (2002). The Two-Hat Syndrome: Determining Response Capabilities and Mutual Aid Limitations. Cambridge, Mass.: Harvard University. John F. Kennedy School of Government.
Department of Sustainability and Environment. (2009). Annual Report 2009. Friedman, B. J. (1986). Role Conflict and Role Abandonment in Disasters: A Need for Empirical
Reorientation: University of Delaware Disaster Research Center. Greenhaus, J. H., & Beutell, N. J. (1985). Sources of conflict between work and family roles. Academy
of Management Review, 10, 76-88. Johnson, K. (2006). Katrina made police choose between duty and loved ones. Retrieved 15
January, 2012, from http://www.usatoday.com/news/nation/2006-02-20-neworleanspolice_x.htm
Killian, L. (1952). The Significance of Multiple-Group Membership in Disasters. The American Journal of Sociology, 42(4), 309-314.
Kushma, J. (2007). Role Abandonment in Disaster: Should we leave this myth behind? Natural Hazards Observer, 21(5).
Lewig, K. A., Xanthopoulou, F., Bakker, A. B., Dollard, M. F., & Metzer, J. C. (2007). Burnout and connectedness among Australian Volunteers. A test of the job demands - resources model. Journal of Vocational Behavior, 71, 429-445.
Mackler, N., Wilkerson, W., & Cinti, S. (2007). Will First-Responders Show Up for Work During a Pandemic? Lessons From a Smallpox Vaccination Survey of Paramedics. Disaster Management and Response, 5(2), 45-48.
Mayhew, C. (2001). Occupational Health and Safety Risks Faced by Police Officers: Australian Institute of Criminology.
McLennan, Birch, Cowlishaw, & Hayes. (2009). Maintaining volunteer firefighter numbers: Adding value to the retention coin. The Australian Journal of Emergency Management, 24(2), 6.
McLennan, J. (2008). Issues facing Australian volunteer-based emergency services organisations: 2008 - 2010: A report prepared for Emergency Management Australia (EMA: Complex Decision Research Group, School of Psychological Science, La Trobe University, Bundoora.
McLennan, J., & Birch, A. (2005). A potential crisis in wildfire emergency response capability? Australia's volunteer firefighters. Environmental Hazards, 6, 101-107.
Nugent, R. (2012). Superintendent, Victoria Police. Personal communciation 26 February 2012. Quarantelli, E. L. (1978). Structural Factors in the Minimization of Role Conflict: A Re-Examination of
the Significance of Multiple Group Membership in Disasters: University of Delaware Disaster Research Center.
239
Quarantelli, E. L. (2008). Conventional Beliefs and Counterintuitive Realities. Scial Research: An International Quarterly of the Social Sciences, 75(3), 873-904.
Qureshi, K., Gershon, R. R., Sherman, M. F., Straub, T., Gebbie, E., McCollum, M., et al. (2005). Health care workers' ability and willingness to report to duty during catastrophic disasters. Journal of Urban Health, 82(3), 378-388.
Ridenour, M., Noe, R. S., Proudfoot, S. L., Jackson, J. S., Hales, T. R., & Baldwin, T. N. (2008). Leading Recommendations for Preventing Fire Fighter Fatalities, 1998 - 2005: National Institute for Occupational Safety and Health
Schultz, P. E., Cowan, P., Cowan, C., & Brennan, R. T. (2004). Coming home upset: Gender, maritial satisfaction, and the daily spillover of workday experience into couple interactions. Journal of Family Psychology, 18, 422-445.
Smith, E. (2007). Emergency health care workers' willingnessness to work during major emergencies and disasters. Australian Journal of Emergency Management, 22(2), 21-24.
Story, L. B., & Repetti, R. (2006). Daily occupational stressors and marital behaviour. Journal of Family Psychology(20), 139-157.
Teague, T. H. B., McLeod, R., & Pascoe, S. (2010a). 2009 Victorian Bushfire Royal Commission Final Report, Summary.
Teague, T. H. B., McLeod, R., & Pascoe, S. (2010c). 2009 Victorian Bushfire Royal Commission Final Report, Fireground Response, Volume 2, Chapter 3.
Testimony of Warren J. Riley, Superintendent of the New Orleans Police Department, 109th Congress. 3 Sess. (2006).
Tierney, K. J. (2003). Conceptualizin and Measuring Organizational and Community Resilience: Lessons from the Emergency Response Following the September 11, 2001 Attack on the World Trade Center: University of Delaware, Disaster Research Center.
Trainor, J. E., & Barsky, L. E. (2011). Reporting for Duty? A Synthesis of Research on Role Conflict, Strain and Abandonment among Emergency Responders during Disasters and Catastrophies: University of Delaware; Disaster Research Center.
United States Congress. (2006). A Failure of Initiative: Final Report of the Select Bipartisan Committee to Investigate the Preparation for and Response to Hurricane Katrina. Washington, DC.
US Department of Health and Human Services. (2005). A Guide to Managing Stress in Crisis Response Professions.
Volunteer Fire Brigades Victoria Inc. (2009). Annual Report: for the year ended 30 June 2009. Webb, G. R., Beverly, M., McMichael, M., Noon, J., & Patterson, T. (1999). Role Improvising Under
Conditions of Uncertainty: A Classification of Types: University of Delaware Disaster Research Center.
Westman, M. (2001). Stress and strain crossover. Human Relations, 54, 717-752.
240
Examining the resilience of rural communities to flooding emergencies
Ian Manock
Lecturer and Emergency Management Courses Coordinator
Charles Sturt University, Bathurst, Australia
(Research team: Dr. Mir Rabiul Islam, Dr. Valerie Ingham, Professor John Hicks, Dr. Richard Sappey, Mr. Christopher Shirley, Mr. Sam Reid and Mr. Craig Ronan)
Paper presented at EARTH: FIRE AND RAIN Australian & New Zealand Disaster and Emergency Management Conference Brisbane – 16 – 18, April 2012
241
Examining the resilience of rural communities to flooding emergencies
Abstract
This paper aims to examine the resilience of an Australian rural community to the impact of flood emergencies. In the past five years, a number of serious flood events have impacted Australian communities, resulting in death and injury to people as well as devastating loss and damage to property and infrastructure. Many inland rural communities are declining in population whilst the average age of these communities is increasing. This decrease in population and increase in age reduces the service functions within those communities which in turn has an impact on the vulnerability of those communities to the impact of natural disasters such as flooding. This vulnerability relates to not only the potential increase in susceptibility of those communities to flooding, but also the decrease in community resilience.
A study of an Australian rural community susceptible to flooding has been conducted to examine the resilience of that community to flooding and to identify issues relating to community vulnerability i.e. resilience and susceptibility, that exist within that community. From this study we hope to be able to identify community resilience strategies that may help other rural communities better prepare for and respond to the impact of natural disasters, including flood.
Keywords: resilience, susceptibility, vulnerability, emergency management, community preparedness, flood emergencies
Introduction
Flooding is a major hazard that threatens a large number of Australian communities on an annual basis. It has been described as Australia’s most deadly natural hazard, with deaths from flooding across the nation between 1788 and 1996 being estimated to be at least 2213 (Gissing, Morgan & Ronan, 2007, p.1).
Be it localised flash flooding resulting from intense rainfall events such as thunderstorms, to widespread and long lasting riverine flooding resulting from heavy rainfall over river system catchments, the results can be devastating in both terms of human impact and damage and destruction to infrastructure and the environment. Flooding has been determined to be Australia’s most costly disaster, with average annual losses estimated to be in the vicinity of $400 million (Bureau of Meteorology, nd (b)).
242
The Bureau of Meteorology has stated that in coming decades: “An increase in the number of dry days is expected across the country, but it is likely that there will be an increase in intense rainfall events in many areas.” (Bureau of Meteorology, 2010, p.6) We have seen this prediction become reality with the intense rainfall events that caused the severe flooding in Queensland and NSW in 2010/11 and again in the severe flooding of southern Queensland and NSW in early 2012, with the rainfall experienced reported to have been the heaviest in 125 years (“Flood evacuations”, 2012). The 2010/11 flooding experienced in Queensland alone resulted in 35 deaths, with three persons still missing, 2.5 million people affected, 29,000 homes and businesses inundated by floodwater and the overall cost of the event estimated at $5 billion (Holmes, 2011, p.20). One of the recommendations from the Queensland Floods Commission of Enquiry related to the need for local governments, who are susceptible to flooding, to conduct community education programs (assisted by the Queensland Government), providing local information on flood awareness and preparedness (Holmes, 2011, p.123). Given that public education, awareness and training is an essential part of the emergency management framework used by all Australian State government emergency management agencies, the message of this recommendation should be adopted nationally. Bangladesh Australia Disaster Research Project In late 2009, a group of academics and researchers at Charles Sturt University, representing the fields of emergency management, economics and psychology, began developing a research project aimed at enhancing the flood awareness and preparedness of local rural communities. The project was designed in two phases. Phase 1 was the examination of community flood preparedness in an overseas developing country at risk from the types of flooding experienced in Australia. Phase 2 was the examination of an Australian rural community at risk from flooding. The results acquired from both phases of the project would then be compared and analysed to identify any similarities, differences, strengths, weaknesses and lessons that could be drawn from the way these different communities approached their flood preparedness. For this first phase, Bangladesh was selected as the focus of investigations. Three communities within Bangladesh were chosen on their susceptibility to different types of flooding – flash flooding, inland riverine flooding and coastal estuarine flooding. With the assistance of the Bangladeshi Government’s Disaster Management Agency, a data gathering visit to Bangladesh was undertaken in late 2010 by two of the CSU researchers. The second phase, based in Australia, focused on the small community of Molong in central west NSW, which is susceptible to flooding and has experienced major flooding on a number of occasions over the past 10 years. A postal survey was
243
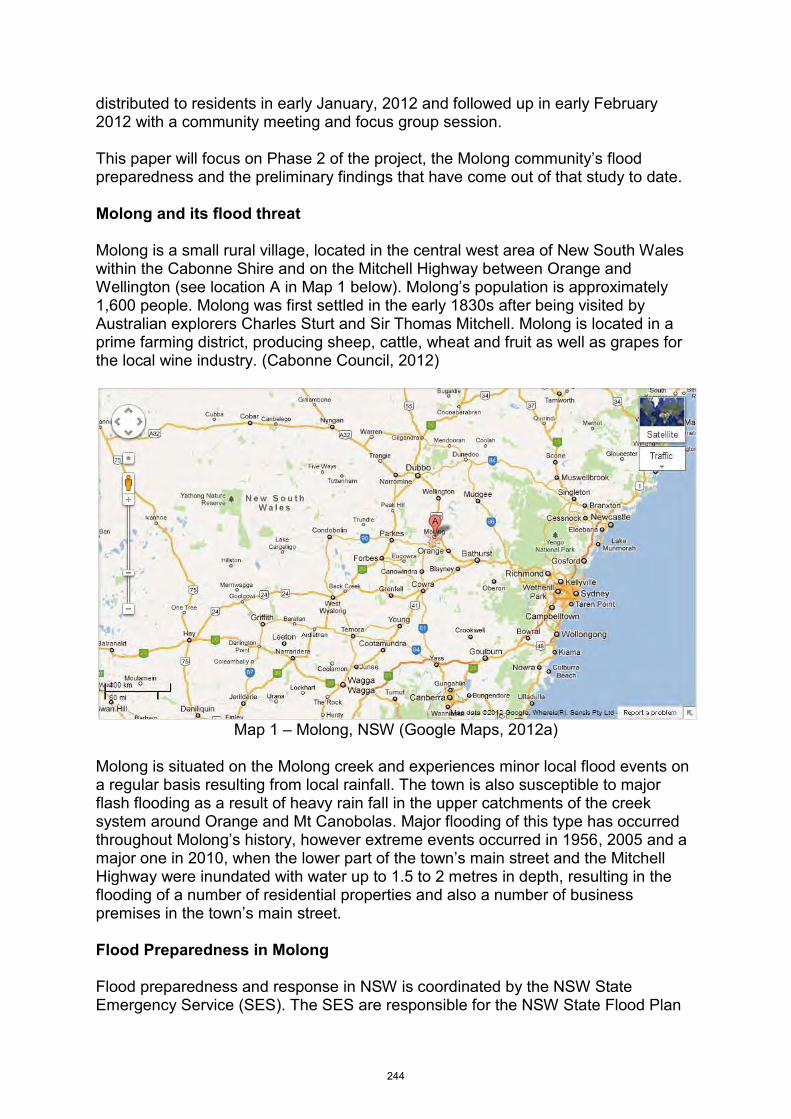
distributed to residents in early January, 2012 and followed up in early February 2012 with a community meeting and focus group session. This paper will focus on Phase 2 of the project, the Molong community’s flood preparedness and the preliminary findings that have come out of that study to date. Molong and its flood threat Molong is a small rural village, located in the central west area of New South Wales within the Cabonne Shire and on the Mitchell Highway between Orange and Wellington (see location A in Map 1 below). Molong’s population is approximately 1,600 people. Molong was first settled in the early 1830s after being visited by Australian explorers Charles Sturt and Sir Thomas Mitchell. Molong is located in a prime farming district, producing sheep, cattle, wheat and fruit as well as grapes for the local wine industry. (Cabonne Council, 2012)
Map 1 – Molong, NSW (Google Maps, 2012a)
Molong is situated on the Molong creek and experiences minor local flood events on a regular basis resulting from local rainfall. The town is also susceptible to major flash flooding as a result of heavy rain fall in the upper catchments of the creek system around Orange and Mt Canobolas. Major flooding of this type has occurred throughout Molong’s history, however extreme events occurred in 1956, 2005 and a major one in 2010, when the lower part of the town’s main street and the Mitchell Highway were inundated with water up to 1.5 to 2 metres in depth, resulting in the flooding of a number of residential properties and also a number of business premises in the town’s main street. Flood Preparedness in Molong Flood preparedness and response in NSW is coordinated by the NSW State Emergency Service (SES). The SES are responsible for the NSW State Flood Plan
244
and Local Flood Plans, developed in consultation with Local Government authorities. In addition to this planning function, the SES also have a community Floodsafe program, providing information and guides to local communities at risk of flooding. In addition to community Floodsafe guides, the SES also produce rural, business and specialist location Floodsafe guides. A specific Molong Floodsafe Guide as well as Molong Flood Evacuation Plan has been produced for the Molong community by the SES in collaboration with the Cabonne Shire Council. These guides are provided online as well as in hard copy to the residents of Molong via letterbox drops and also through the Cabonne Shire Council offices in Molong (NSWSES, 2011). In addition to the flood preparedness information and guides, the Bureau of Meteorology (BOM) in collaboration with the SES also provide specific flood warnings to communities at risk of floods. These warnings come in the form of flood alerts, flood watches, flood advice, generalized flood warnings, warnings of minor, moderate and major flooding, as well as specific river height predictions, (BOM, nd(a)). A dam and creek monitoring station at Borenore, just north of Orange and on the Molong Creek, provide the residents of Molong with warning of potential flash flooding, with between one and two hours notice. One resident stated, “It’s not flooding like western plains flood where you know it’s coming in about a week. We get two hours, three hours at the most” (Molong resident, 2012) However, if local heavy rainfall at Molong is also experienced or prolonged rainfall in the area has saturated the ground, this warning may be reduced to virtually no warning at all, as occurred in the 2005 flood and again in the 2010 flood. Residents during a community focus group stated that “Sometimes, as in the 2010 flood, the first warning you receive is when the torrent of water reaches the town and the town is flooded within an hour or so.” (Molong resident, 2012). Molong Study Preliminary Findings A community flood preparedness postal survey was distributed to the residents of Molong in mid January, 2012. Altogether 730 surveys were distributed and so far approximately 13% have been returned. Analysis of these returns is currently in process. Additional surveys will be conducted in neighbouring villages throughout 2012 to provide a larger base of data for analysis. In addition to the postal survey, a community focus group meeting was conducted in Molong on the 8th February, 2012. Twenty five participants attended the focus group meeting. These participants represented a cross section of the Molong community and included home owners, business owners, local government officials and emergency service representatives. A series of questions relating to community preparedness, resilience, experiences, and economic and psychological impact of flooding were asked of the group. The following are the issues and reflections from community members that came out during the focus group meeting.
245
Community Preparedness Molong residents rely on the formal flood watch and warning systems that are in place and managed by the State Emergency Service (SES). Because of the localized impact area, local SES volunteers carry out a house to house warning when they can and when they have sufficient warning. Some residents also have an informal notification system, where they call their neighbours and other family members when floods are predicted or occur. The residents rely heavily on this small amount of warning in order to lift furniture and goods within their homes and businesses to above the 1 to 2 metre flood level. One resident stated, “we had been away and we were coming home and I said to my husband I think we should lift all the furniture because we had had a lot of rain and the ground was very wet. So we might have had about three weeks of steady rain, and I said if we get any more rain we are going to go under because the ground is just not going to take the water. And of course yes...” (Molong resident, 2012). When discussing the type of warning and amount of notice that they receive, one resident stated, “Well the last flood that we had here which was in 2010, I was in the SES by that time...but the first I knew about it was about at 7 o’clock. My pager went off, and it said residents of Molong had rang in and said the river was flooding. And within half an hour the SES came in and were sand bagging, but that’s the first we knew about that flood then. That was our first warning.” One resident stated, “When the rainfall is over a longer period of time, the predictions for future flooding is better and the warnings provide a little more time to prepare.” Economic Impact of Flooding Flooding in Molong has had a major economic impact, particularly on the business community situated in the low lying area of the town and main street (See location A in map 2 below). Business owners in those locations have stated that locating their businesses in those areas is very good for attracting customers – due to the proximity to the main Mitchell Highway and the town’s main street, Bank Street. However, the location, due to its proximity to Molong Creek and as it is in the low part of town also attracts a higher degree of risk from flooding.
246
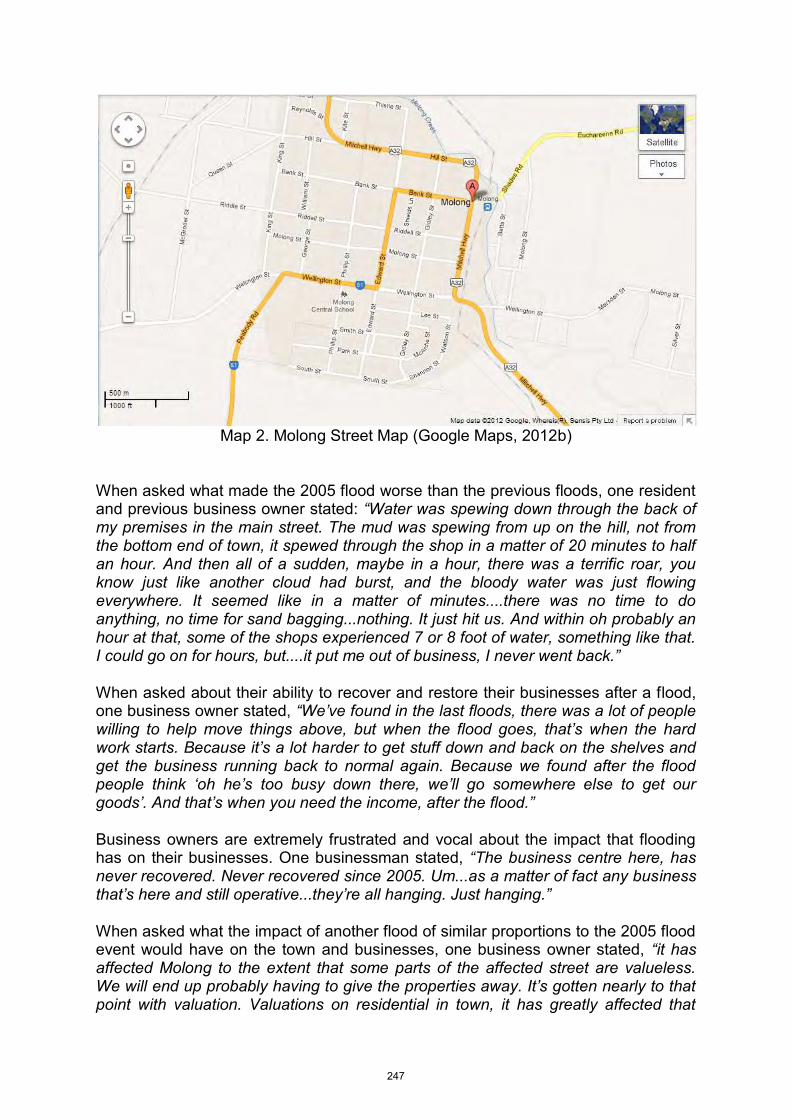
Map 2. Molong Street Map (Google Maps, 2012b)
When asked what made the 2005 flood worse than the previous floods, one resident and previous business owner stated: “Water was spewing down through the back of my premises in the main street. The mud was spewing from up on the hill, not from the bottom end of town, it spewed through the shop in a matter of 20 minutes to half an hour. And then all of a sudden, maybe in a hour, there was a terrific roar, you know just like another cloud had burst, and the bloody water was just flowing everywhere. It seemed like in a matter of minutes....there was no time to do anything, no time for sand bagging...nothing. It just hit us. And within oh probably an hour at that, some of the shops experienced 7 or 8 foot of water, something like that. I could go on for hours, but....it put me out of business, I never went back.” When asked about their ability to recover and restore their businesses after a flood, one business owner stated, “We’ve found in the last floods, there was a lot of people willing to help move things above, but when the flood goes, that’s when the hard work starts. Because it’s a lot harder to get stuff down and back on the shelves and get the business running back to normal again. Because we found after the flood people think ‘oh he’s too busy down there, we’ll go somewhere else to get our goods’. And that’s when you need the income, after the flood.” Business owners are extremely frustrated and vocal about the impact that flooding has on their businesses. One businessman stated, “The business centre here, has never recovered. Never recovered since 2005. Um...as a matter of fact any business that’s here and still operative...they’re all hanging. Just hanging.” When asked what the impact of another flood of similar proportions to the 2005 flood event would have on the town and businesses, one business owner stated, “it has affected Molong to the extent that some parts of the affected street are valueless. We will end up probably having to give the properties away. It’s gotten nearly to that point with valuation. Valuations on residential in town, it has greatly affected that
247
area whether they are in the flood plain or not....because of Banks on the lendings. And they have affected the borrowing for people here, to borrow for their properties to the effect that they can’t get money from them.” One business owner, when asked why he remained in the flood affected area of town stated, “As I said before it’s economic reasons that I’m here. I owe the bank money. I can’t go anywhere. We looked at other premises, but where else do you go? If I go somewhere else I’m losing my foot traffic. Like I’m right on the highway, I’d lose all my highway traffic. If I move my business I’d lose 50% of the business. Straight off. And I can’t afford to do that.” There is also a strong vocal outcry from business owners regarding insurance and obtaining appropriate compensation/ payments for flood losses. One business owner stated “I lost in the vicinity with businesses and stock, $760,000. I was paid 25% of that. That’s all I got, and I never went back. I thought bugger it, I don’t owe anyone anything and I got out. But the fact is that I still own the property there. That’s the nerve-racking thing when you see property developers coming in and want to do something, and then it comes back to development but there’s no re-development in that area, they’re the things that play on us as property owners, it’s nerve-racking.” Residents feel strongly about the impact that engineering of local transportation routes such as the rail and roads has had on the severity of flooding experienced. Local government has undertaken cleanup works within the Molong Creek to reduce the impact of flooding along the creek. One resident, commenting about the speed of the water flow through the creek system during the 2010 flood event stated, “One thing I will say that I think we all will agree had a beneficial effect was getting rid of a lot of the rubbish in the creek where the water did flow through quicker. A lot of people will agree in the last one in 2010 the water did flow through a lot quicker than previous floods. It certainly moved quicker than it did previously.” However, some residents also feel very strongly about the lack of pro-active measures taken by the local government in the form of construction of levy banks and other engineering solutions to reduce the impact of the flash flooding on the town. One business owner stated, “The problem......the 2010 flood, what happened to me, it came up through the drains, not from the river. And that’s what you try and get your head around, is that something that’s taking the water away is causing the problem, because it’s not taking water away it’s backing it through, and you’re thinking why? And then you see the flood plans come out, and you see ‘not cost effective, not cost effective, not cost effective’. And a levy bank was gunna cost $2 million and I think, I’ve got a business here that turns $2 million over a year, but it’s not cost effective to spend $2 million to protect it. And you hear on the radio like this afternoon there was a flash flood in Brisbane and there is a kid missing. So what do you call cost effective and what don’t you call cost effective? Is a life cost effective? And that sort of plays on your mind all the time, they say not cost effective but these pricks, excuse the language, probably don’t have a business where there is a flood zone. And they don’t go through the effects of what happened. The just sit in their ivory towers telling us....and that’s what plays on your mind. You know it can be prevented and it’s not being prevented.”
248
When discussing the community’s perception of lack of action being undertaken by the local government, one resident stated, “the saddest thing coming in here tonight is the number of people here. This place should be packed, but the reason it’s not packed is because everybody knows that nothing is being done. After all the trouble we’ve been going through for the last fifteen years to get something done....and expenditure in water reports and feasibility studies...and it’s all come to the fact that nothing can be done.” Psychological Impact of Flooding When asked about the psychological impact the flooding had caused and whether any form of psychological support had been offered or received, the responses were varying. An interesting comment to come out of the focus group related to the support provided by Government to residential victims of the 2005 floods and not business victims. One business owner stated, “....people in the residential side of Molong, they were offered grants. They got electrical offsets, furniture....given to them. But if you were in business, you were given nothing. Not even offered a grant at a low term interest rate or anything.” From discussions it appeared that no psychological care was overtly offered to the town. The residents stated that they had experienced stress from a variety of inputs. One resident stated, “I mean we went through a lot of bloody stress, and we’re still going through it because we can’t sell the property.” Another resident stated, “I suppose it would be a lot more stressful....someone coming up and offering you however much money for a house you grew up in and you want to grow old and die there. To me that would be more stressful than moving. A lot of those people are elderly, you know if someone came up and said ‘here’s $250000 for your house, get out’, I’d be upset. That’s your house, that’s where you’ve been brought up.” Finally, one resident summed up their frustration by offering a humorous, but unfortunately all too real comment, “We took it all out on council. Council were our psychologists.” Community Resilience All of those interviewed during the focus group stated that they knew of the flood risks associated with living in Molong and most had experienced major flooding in Molong over the past seven year period. One resident summed it up by stating, “I think you’ll find most of the people who have lived here for a very long time will always know...they know what the creek is doing and they you know, are all out looking anyway.” Some residents have taken mitigation measures themselves to reduce the impact of flooding. One resident when talking about measures his father had taken, stated “Yes, he had looked at all previous flood records, and decided that the house should
249
be built up to a certain height, which he did. And that 2005 flood was the only flood that I can remember to have even reached the house. It was the only one that reached the floorboards.” When asked about their own preparedness and resilience to flooding, one resident stated, “Well at this particular point in time, I suppose...I think when we lifted things up in 2005 at my mother’s house, we never put them back down. Most of the stuff in my father’s shed is still up above the benches, and it’s never gone back down. So if the water goes through those sheds again it’s not going to damage anything.” The residents were also very complimentary about the assistance they received from the emergency service, particularly the SES and the Fire Services. The SES were able to provide sandbagging assistance in 2010 and during minor flood events. One resident found the SES use of black polythene sheeting and sandbags in the construction of dams around residential properties very effective. Another resident could only speak praise for the Fire Brigade who during the cleanup after the flood event were able to use their high pressure fire hoses to wash out affected premises, thereby easing the stress and efforts required of home owners. When asked about why the residents stay in Molong, knowing that floods will continue to occur and that the impact of those floods could be very damaging, one resident stated, “We’ve got two schools, a hospital, three doctors, a dental surgeon, a bank....we’ve got probably the best climate that I know of. There’s no humidity here, it’s a very healthy town, vibrant community, agriculture par excellence, very low crime. People can still not lock their doors at night. Why wouldn’t you want to live here? It’s a great town, it’s one of the best towns there is.” Residents feel that the town, when it isn’t flooding, is their version of paradise. The location, in proximity to major towns, distance from Sydney, the climate, local facilities and services make it an attractive place to live. Another resident stated, “Yeah. I travel quite extensively around the state and people say why do you live in Molong and I say it’s the closest place to heaven.” One resident discussing their own personal resilience and why they chose to move to Molong and remain there, even after personally experiencing major flooding stated, “We see floods and fires all around us and it doesn’t matter where you live. I came from a place called Bowen Mountain at Kurrajong. When I bought up there people said you must need your head to be read. Fire will go through there and there is only one road out. But the floods aren’t here all the time. My little house is 120 years old and the floorboards haven’t gotten rotten yet. But you know, it passes quickly. There is always the clean up, but it goes, it doesn’t stay for three days or a week. It doesn’t stop us, we just get back into it.”
250
Conclusions The community in general appears to be very much aware of the types of flooding that Molong faces and the impact that such flooding produces in the short, medium and long term. However, given this flood threat and the known impact it will have, residents are still willing to remain in Molong for a variety of reasons. Some stay because they have to for financial reasons, whilst the majority remain because the simply love their town and its location, climate and the community spirit that pervades there. Residents recognize that the worst flooding occurs as flash flooding caused by extensive and heavy rainfall in the hills around Orange, which then cause a flood of water to flow down the Molong Creek system. They thus rely heavily on the relatively short warnings that they receive from the upstream dam monitoring stations, the BOM and the SES. There appears to be a resignation to the fact that floods will continue to occur and that properties will be inundated, with main street businesses and low lying areas suffering the most effects. Business owners in the lower end of Bank Street (main street) and the Mitchell Highway appear to be caught in an unforgiving loop, in that they need to continue in business in those areas of town because the location not only attracts the greatest customer numbers, but also enables them to maintain mortgage and loan repayments to the banks. However they also recognize that by staying in those locations, they will suffer greater impact from floods in the future, if flood mitigation works on the creek system are not undertaken. Flooding in the Molong township affects the town’s economic stability, with major flooding (such as occurred in 2005 and more recently in 2010) having devastating effects on the main street and highway businesses located in the eastern, lower end of town. Residents of Molong love their community and see the floods as a hazard that can be reduced. They recognize the positive impact that recent cleanup works in the Molong creek system by local government have had, but they still believe that their flooding risk can be greatly reduced with the construction of a levy system along the Molong Creek banks on the eastern side of the township. It is recommended that the Cabonne Shire Council work together with the community and continue to examine the feasibility of a levy system on the Molong Creek in order to improve the resilience of the community to flooding and the long term viability of main street businesses. It would appear that the residents, particularly the business community impacted by severe flooding over the past seven years, are experiencing high degrees of stress. This has been caused not only be the actual physical impact of the floods on their businesses, but also by the long term effects that the floods have had on their financial security.
251

It is recommended that the Cabonne Shire Council, SES and NSW Ministry of Health work together with the community to develop strategies for the implementation of short, medium and long term psychological support to those Molong community members affected by floods. Even though the local community appears to be generally resilient to the impact of flooding, they rely on the support and assistance that they receive from the emergency services during and after floods (particularly the SES and Fire Services). Without this support, the impact of the flooding and its cleanup afterwards would be far more devastating.
252
References
Bureau of Meteorology, nd(a), Flood warning services, Viewed online 28 January 2012, < http://www.bom.gov.au/hydro/flood/flooding.shtml>
Bureau of Meteorology, nd(b), Floods, Viewed 27 January 2012, <http://www.bom.gov.au/climate/c20thc/flood.shtml>.
Bureau of Meteorology, 2010, State of the climate, Bureau of Meteorology, Canberra.
Cabonne Council, 2012, Cabonne Country - Molong, Viewed 27 January 2012, <
http://www.cabonnecountry.com/site/index.cfm?display=109378>
Flood evacuations after Sydney dam spills, 03 March 2012, Herald Sun. Viewed 03 March 2012, <http://www.heraldsun.com.au/news/more-news/state-of-high-alert-as-water-rises-across-nsw/story-fn7x8me2-1226287988115>.
Gissing, A, Morgan, M & Ronan, C 2007, Planning for the inevitable – Emergency planning for floods in NSW, Conference paper for the 47th NSW Floodplain Management Authorities Conference, Gunnedah, 2007.
Google Maps 2012(a), Molong street map. Viewed 27 January 2012, http://maps.google.com.au/maps?hl=en&gs_nf=1&cp=8&gs_id=r&xhr=t&q=molong+nsw&rlz=1R2SUNC_enAU422&bav=on.2,or.r_gc.r_pw.r_qf.,cf.osb&biw=1280&bih=602&wrapid=tljp1331861022890014&um=1&ie=UTF-8&sa=N&tab=wl
Google Maps 2012(b), Molong street map. Viewed 27 January 2012,<
http://maps.google.com.au/maps?hl=en&rlz=1R2SUNC_enAU422&bav=on.2,or.r_gc.r_pw.r_qf.,cf.osb&biw=1280&bih=602&wrapid=tlif133178614646110&q=Molong+street+map&um=1&ie=UTF8&hq=&hnear=0x6b1027bc28e0d069:0x40609b490437b80,Molong+NSW&gl=au&ei=tnFhT6PsFqqkiAeXND4BQ&sa=X&oi=geocode_result&c=title&resnum=1&ved=0CB8Q8gEwAA>
Holmes, CE 2011, Queensland floods Commission of Enquiry – Interim report, Queensland Floods Commission of Enquiry, Brisbane.
Molong resident 2012, focus group interview, 08 February
New South Wales State Emergency Service, 2011, Floodsafe. Viewed 28 January 2012, < http://www.ses.nsw.gov.au/community-safety/floodsafe/
253
Emergency Communications and Warning Systems: Determining Critical Capacities and Capabilities in the Australian Context
Dr Nigel Martin
Senior Lecturer
Australian National University, Canberra, Australia
Dr John Rice
Senior Lecturer
Griffith University, Gold Coast, Australia
Paper presented at EARTH: FIRE AND RAIN Australian & New Zealand Disaster and Emergency Management Conference Brisbane – 16–18, April 2012
254
Emergency Communications and Warning Systems: Determining Critical Capacities and Capabilities in the Australian Context
Abstract: The occurrence of emergencies and natural disasters continues to threaten communities. Importantly, Emergency communications and warning systems (ECWS) allow people to make decisions and take actions across the event lifecycle. This study used expert stakeholder analysis coupled with structured data coding techniques to identify the major ECWS capacities and capabilities. Findings showed that a broad range of ECWS are deployed in Australia. These ECWS capabilities come with social or technological limitations that suggest the importance of an integrated or systems based approach for their construction and deployment. Also, while critical infrastructure vulnerabilities reinforced the argument for integrated systems, it demonstrated the pressing need to build resilience and redundancy into domestic infrastructure networks. In addition, educating and informing users of ECWS was highlighted as a key to successful emergency or disaster response. Finally, new and highly innovative ECWS technologies and solutions should enable improved emergency or disaster management in the future.
Keywords: communications; emergency; stakeholders; systems; warnings.
255
Introduction
“Fire, water and governments know nothing of mercy” (Proverb)
The propensity for natural and human-inspired emergencies and disasters to negatively impact communities provides the motivation and impetus to look further into the needs for Emergency communications and warning systems (ECWS). In recent times, disciplinary authors and experts have sought to raise the profile of various information and communications systems as a mechanism for changing how we inform impacted entities and react to various emergencies and disasters (see Van De Walle et al., 2010). Importantly, our study builds into this cumulative tradition of research and practice in the disaster prevention and management discipline, and assists in creating a greater understanding of the varying communications needs of emergency and disaster stakeholders (Van De Walle and Turoff, 2007). Accordingly, the aim of our study was to examine and analyse the critical capacities and capabilities of ECWS that might be used to deal with adverse events.
In our study of ECWS, we used the opinions, experience and knowledge from expert stakeholders who offered their written views to a federal government inquiry into communications networks and emergency warning systems (Commonwealth of Australia, 2011). This inquiry followed one of the most dangerous summers (2010-2011) in Australia’s history with massive floods in Queensland, New South Wales and Victoria, Cyclone Yasi devastating North Queensland, and bushfires destroying homes and property in Western Australia. Our research methodology used a qualitative data collection and structured coding technique to identify and present the important capacities and capabilities of ECWS. In doing this, we have sought to answer five major questions:
1. What critical capacities and capabilities must ECWS possess to be effective in providing pre-emergency and disaster warnings, operations during the emergency or disaster period, and supporting workforces during the recovery period (i.e. emergency/disaster lifecycle)?
2. What is the nature of the impacts of power outages on ECWS?
3. What is the likely impact of emergencies and natural disasters on current and planned future infrastructure that enable ECWS?
4. What scope exists for improved education of ECWS users to enable better emergency preparation and response?
5. What new and emerging ECWS technologies could assist communities with handling emergencies and natural disasters?
Our study will attempt to answer these questions, while also contrasting the practical and theoretical aspects of ECWS. The balance of the paper will review some
256
relevant ECWS literature, outline and describe the study’s methodology, discuss the major findings, and present our concluding statements.
ECWS related literature
Our study takes the opportunity to survey some of the relevant background literature related to ECWS. An observation of the literature in this area suggests a broad range of studies and theories that cover different system types, technologies, applications and socio-technical issues and factors (Botterell and Addams-Moring, 2007; Carver and Turoff, 2007; Palen et al., 2007; Chen et al., 2008). Some prominent studies and programs look to determine the value and utility of different types of systems, such as decision support, resource management, early warning, communications, and inter-agency enterprise systems (Kapucu, 2006; Kurita et al., 2006; Thompson et al., 2006; Troy et al., 2008). For instance, some Decision support systems (DSS) research argues that the delivery of shared mental models and understanding provides the basis for communication and coordination of actions across emergency and disaster events and functions (Thompson et al., 2006; French and Turoff, 2007; D’Antonio et al., 2009). In addition, other investigations assert the value of composite and agile systems that can undertake various scanning, reporting and information sharing functions in largely chaotic operating environments (Belardo and Karwan, 1986; Bharosa and Janssen, 2010). Accordingly, this suggests that the type of system deployed can have a significant impact on the way that the event is handled.
Studies of various Information and communications technologies (ICT) examine how the use of the technology can make an impact on the emergency or disaster lifecycle (Troy et al., 2008). As an example, research programs suggest that Geographic information systems (GIS) can play a pivotal role in alerting and updating communities on emergency and disaster events (Billa et al., 2004; Kapucu, 2008). Other studies argue the utility of mobile, Internet and social network technology (Arnold et al., 2004; Jaeger et al., 2007; Palen et al., 2007; Van De Walle et al., 2010), commercial and amateur radio stations (Coile, 1997; Collins and Kapucu, 2008), televisions and video networks (Kurita et al., 2006; Patricelli, 2009), and widely available database and open access systems (Iakovou and Douligeris, 2001; Currion et al., 2007; Troy et al., 2008) for collecting and distributing verifiable and relevant information related to an adverse event. This specific technology research suggests that ICT can play a positive role in the handling of emergencies and disasters.
The application of different systems and ICT for emergency and disaster events has also been studied in some detail. As an example, practical investigations have explored and examined the capabilities and advantages of various systems for peer-to-peer, inter-agency, intra-agency and inter-country communications (Quarantelli, 1988; Trim, 2004; Kapucu, 2006; Botterell and Addams-Moring, 2007). Other studies have highlighted the value of using modern systems and technologies for business continuity operations, victims’ management and tracking, and recovery process logging in various disaster and emergency contexts (Arnold et al., 2004; Boin and
257
McConnell, 2007). Hence, the application of enabling systems and technologies can provide assistance to communities and workforces seeking to manage emergencies and disaster events.
The socio-technical issues and concerns that surround ECWS have also been a fertile ground for studies and research programs. Scholars and practitioners have engaged in applied and theoretical research targeted at determining the capacity of ICT systems to engender trust and mutual understanding (Kapucu, 2006; Carver and Turoff, 2007, Jaeger et al., 2007), build system user interest and receptivity (Perry and Nigg, 1985; Mendonça et al., 2007), create social capital (Jaeger et al., 2007), support adoption of the technology and/or systems (Perry and Nigg, 1985; Manoj and Hubenko Baker, 2007), and sponsor actor interactions (Pearce, 2003; Chen et al., 2008; Troy et al., 2008), under emergency and disaster conditions. Thus, these types of studies depict how we might use ECWS to address the complex social and technical issues in a more meaningful and effective manner.
Overall, the ECWS foundation literature is extremely broad and deep in its scope. However, we would assert that a logical extension of this body of work is to simultaneously consider a number of these issues and factors in a combinative study of ECWS against a backdrop of recent floods, cyclones and bushfires. The integration of these types of systems’ capacity and capability issues should provide a further accumulation of knowledge and understanding in this important area of disaster prevention and management.
Research Method
Data Source and Collection
The individual and organization inputs were collected on 18 June 2011 from the Parliament of Australia web pages that were established for the inquiry into the capacity of communication networks and emergency warning systems to deal with emergencies and natural disasters, conducted by the Senate Standing Committee on Environment and Communications (Commonwealth of Australia, 2011). The committee was tasked to investigate and report on the effectiveness of communication networks (including radio, telephone, Internet and other alert systems) across the disaster or emergency lifecycle, having regard to the cyclone, bushfire and flood disasters during the Australian summer 2010-2011; the impact of extended power outages on warning systems and users; the impacts and implications from emergency and disaster events on future communications networks, particularly Australia’s National Broadband Network (NBN); the scope for educating users in the operation of communications equipment when responding to an emergency or disaster; and, new or emerging technologies, including communications spectrum, that could be used in warnings and response to emergencies or disasters (Commonwealth of Australia, 2011). Importantly, the scope of the inquiry provided an aggregate source of stakeholder data for our study.
258
The 43 written stakeholder inputs to the inquiry (available from the inquiry webpage) were collected and compiled into a single document folder for structured coding and analysis (Commonwealth of Australia, 2011). Stakeholder inputs were received from 17 government organizations (i.e. state and local governments, law enforcement agencies, emergency and fire services, geological and meteorological agencies, telecommunications authorities); 11 non-government organizations (i.e. telecommunications industry groups, land management groups, education and research providers, disability advocates, psychology practitioners); 9 public and private companies (i.e. television and radio broadcasting, warning systems technology, communications equipment manufacturers); and 6 private citizens (i.e. male members of law enforcement or emergency services organizations that have extensive experience with ECWS). Collectively, these stakeholders have extensive exposure to emergency and disaster events within the Australian domestic and broader international contexts.
Research Technique and Analysis
The study’s research method used a qualitative technique to collect, structure, code and analyse the written stakeholder submissions (Miles and Huberman, 1997; Denzin and Lincoln, 2005). In this respect, the study has been conducted in the tradition of other stakeholder inquiries where inputs and statements concentrate on a primary issue of concern (Freeman, 1984; Donaldson and Preston, 1995; Freeman et al., 2004). The data structure created for this study mirrors the scope of the government inquiry and is co-matched with the five research questions outlined earlier in the paper (Corley and Gioia, 2004; Commonwealth of Australia, 2011).
In order to analyse the data, we created a project (titled ‘ECWS Project’) using the QSR NVIVO Version 9 analytical software (Walsh, 2003). The written stakeholder submissions were ordered sequentially and transferred to the internal documents folder of the NVIVO project. A tree node structure was developed with ECWS capacities and capabilities assigned as the apex node, and the five capacities and capabilities issues as major branch nodes (see Figure 1).
Submission statements (299 in total) were matched, coded and cross–checked (reviewed for consistency) by the researchers within each major branch node to maintain and assure issue integrity The coded statements were then axially collapsed and transformed into summaries for each ECWS capacities and capabilities issue, which are presented in the discussion of results (Miles and Huberman, 1997; Denzin and Lincoln, 2005). A summary of the project nodes, number of submissions, and coded statements are displayed in Table 1.
Discussion of Results
The following sections of the article provide summaries and discussion of the coded stakeholder submissions that were provided to the government inquiry
259
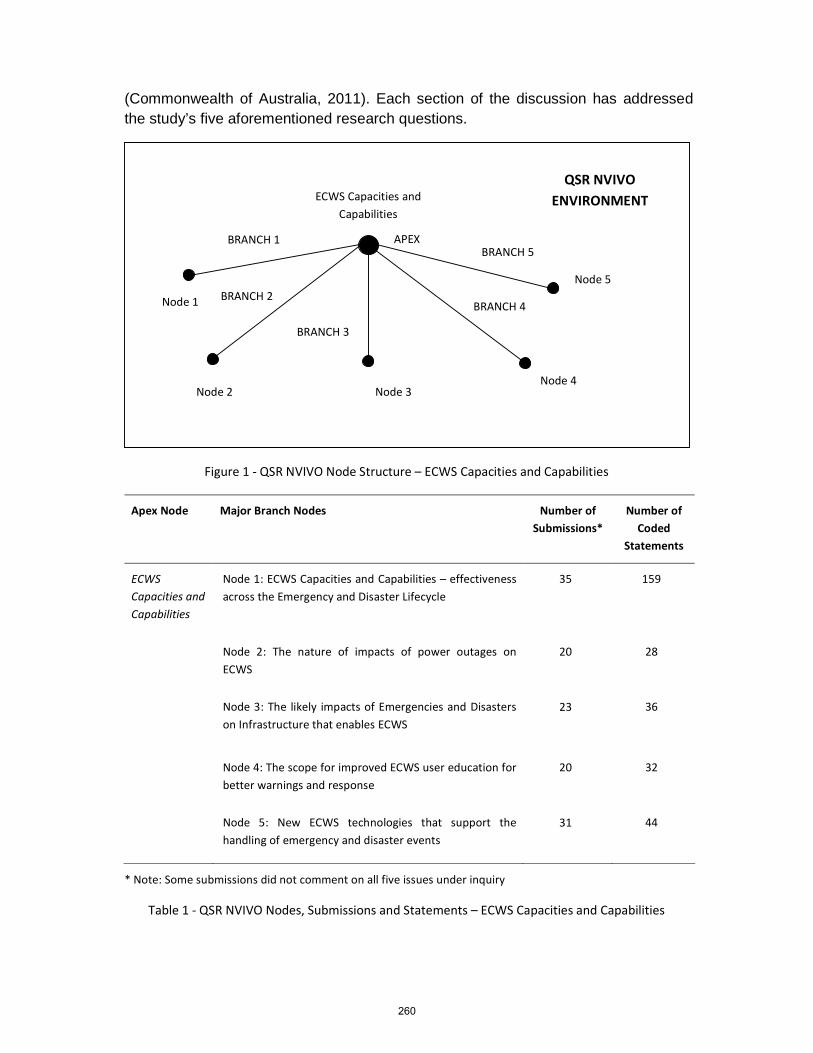
(Commonwealth of Australia, 2011). Each section of the discussion has addressed the study’s five aforementioned research questions.
Figure 1 - QSR NVIVO Node Structure – ECWS Capacities and Capabilities
Apex Node Major Branch Nodes Number of
Submissions*
Number of
Coded
Statements
ECWS
Capacities and
Capabilities
Node 1: ECWS Capacities and Capabilities – effectiveness
across the Emergency and Disaster Lifecycle
35 159
Node 2: The nature of impacts of power outages on
ECWS
20 28
Node 3: The likely impacts of Emergencies and Disasters
on Infrastructure that enables ECWS
23 36
Node 4: The scope for improved ECWS user education for
better warnings and response
20 32
Node 5: New ECWS technologies that support the
handling of emergency and disaster events
31 44
* Note: Some submissions did not comment on all five issues under inquiry
Table 1 - QSR NVIVO Nodes, Submissions and Statements – ECWS Capacities and Capabilities
BRANCH 4
ECWS Capacities and
Capabilities
APEX BRANCH 5
BRANCH 2
BRANCH 1
Node 1
QSR NVIVO
ENVIRONMENT
BRANCH 3
Node 2 Node 3 Node 4
Node 5
260
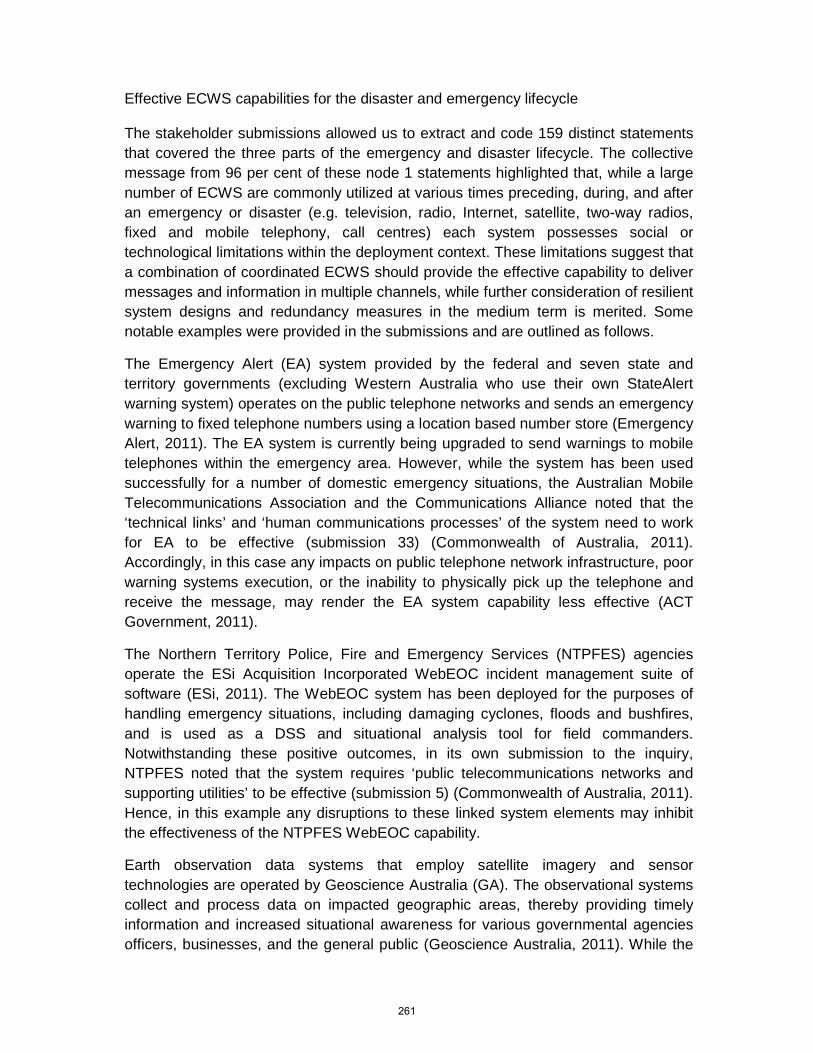
Effective ECWS capabilities for the disaster and emergency lifecycle
The stakeholder submissions allowed us to extract and code 159 distinct statements that covered the three parts of the emergency and disaster lifecycle. The collective message from 96 per cent of these node 1 statements highlighted that, while a large number of ECWS are commonly utilized at various times preceding, during, and after an emergency or disaster (e.g. television, radio, Internet, satellite, two-way radios, fixed and mobile telephony, call centres) each system possesses social or technological limitations within the deployment context. These limitations suggest that a combination of coordinated ECWS should provide the effective capability to deliver messages and information in multiple channels, while further consideration of resilient system designs and redundancy measures in the medium term is merited. Some notable examples were provided in the submissions and are outlined as follows.
The Emergency Alert (EA) system provided by the federal and seven state and territory governments (excluding Western Australia who use their own StateAlert warning system) operates on the public telephone networks and sends an emergency warning to fixed telephone numbers using a location based number store (Emergency Alert, 2011). The EA system is currently being upgraded to send warnings to mobile telephones within the emergency area. However, while the system has been used successfully for a number of domestic emergency situations, the Australian Mobile Telecommunications Association and the Communications Alliance noted that the ‘technical links’ and ‘human communications processes’ of the system need to work for EA to be effective (submission 33) (Commonwealth of Australia, 2011). Accordingly, in this case any impacts on public telephone network infrastructure, poor warning systems execution, or the inability to physically pick up the telephone and receive the message, may render the EA system capability less effective (ACT Government, 2011).
The Northern Territory Police, Fire and Emergency Services (NTPFES) agencies operate the ESi Acquisition Incorporated WebEOC incident management suite of software (ESi, 2011). The WebEOC system has been deployed for the purposes of handling emergency situations, including damaging cyclones, floods and bushfires, and is used as a DSS and situational analysis tool for field commanders. Notwithstanding these positive outcomes, in its own submission to the inquiry, NTPFES noted that the system requires ‘public telecommunications networks and supporting utilities’ to be effective (submission 5) (Commonwealth of Australia, 2011). Hence, in this example any disruptions to these linked system elements may inhibit the effectiveness of the NTPFES WebEOC capability.
Earth observation data systems that employ satellite imagery and sensor technologies are operated by Geoscience Australia (GA). The observational systems collect and process data on impacted geographic areas, thereby providing timely information and increased situational awareness for various governmental agencies officers, businesses, and the general public (Geoscience Australia, 2011). While the
261
satellite systems worked adequately during the emergency events of the Australian summer 2010-2011, GA offered some important insights (submission 3) (Commonwealth of Australia, 2011). First, there is a lack of high speed telecommunications infrastructure between the Alice Springs (NT) satellite ground station and the Canberra information processing centre. This typically results in information processing and dissemination delays of a day or more, and can slow the speed of emergency response. Second, government agencies undertaking emergency or disaster relief work tend to do so using the Internet as an information sharing medium. Importantly, the human processing of information is dependent on web technologies and the technical mechanisms to keep them operating. Thus, this example shows that even modern satellite systems can be subjected to data and information bottlenecks and limitations that may render their capabilities less effective.
The Australian Broadcasting Commission (ABC) plays a primary role in broadcasting emergency information and disseminating disaster warnings to cities and regional communities (ABC, 2011). Critical information from external agencies, such as the Bureau of Meteorology (BOM) or GA, is typically transmitted using ABC television and radio channels, and its Internet sites. Despite the effectiveness of these systems, the Australian Communications Consumer Action Network (ACCAN) highlighted that these forms of communications and warnings must be tailored to the needs of those in the community who have disabilities or limited English language skills (submission 4) (Commonwealth of Australia, 2011). Insufficient visual captions, voice-overs, and sign language interpretations may render these forms of national warnings less effective for vulnerable members of communities. In the ACCAN example, a mix of social and technological factors may limit the effectiveness of the systems’ capabilities.
In summary, the stakeholders presented a mosaic of ECWS capabilities that may be very effective in some circumstances, and possibly less effective in others. This suggests that no one ECWS can be solely relied on when dealing with an emergency or disaster. We would contend that the collective stakeholders’ message that ‘a one size fits all ECWS is less likely to be effective’ is well made. Indeed, the deployment of various coordinated ECWS, using an integrated or ‘systems based’ approach, to deliver an effective combinative capability, may ultimately support a better and more holistic warning, response and recovery environment for communities.
The nature of impacts from power outages on ECWS
In relation to the nature of impacts on ECWS due to the loss of power, we coded 28 specific stakeholder statements. The overwhelming message drawn from the statements is that most emergencies and disasters, particularly floods, fires, earthquakes, tidal surge and storms in the Australian context, will typically result in the loss of mains power and ECWS capabilities. As an example, the New South Wales State Emergency Services (NSW SES) stated that:
262
‘not only would mains power impact ECWS capabilities, but that it is now time to examine the need for adequate redundancies in the power grid, including alternate electricity routing, equipment supplies and logistics, and the capability to replace or supplement hot fuelled generators’ (submission 17) (Commonwealth of Australia, 2011).
In addition, over 60 per cent of the coded node 2 statements opined that alternate power units using solar array technology, rechargeable batteries, uninterrupted power supply units, and fuelled generators should be a critical consideration for current and future ECWS.
It was also noted that, where mains power was unavailable for operational communication systems, 30 per cent of the node 2 statements considered emergency and law enforcement radio networks as an integral and resilient element of the ECWS environment. For example, the Northern Territory, Tasmanian, South Australian, New South Wales and Victorian governments stated their ‘dependency on the government radio networks that could operate continuously for up to 18 hours before requiring recharging’ (submissions 5, 9, 17, 23, and 28) (Commonwealth of Australia, 2011). In a further application of radio technology, the Northern Territory government uses a radio telemetry system for building fire monitoring and alarm, coupled with battery and generator back-up power systems (submission 5) (Commonwealth of Australia, 2011). Accordingly, as shown in these examples, some battery powered ECWS may support limited periods of emergency response in the absence of mains power.
In essence, these stakeholder views highlight two major issues for consideration. First, the likelihood of mains power losses suggests that a coordinated group of ECWS, that use various power sources and back up options, may be more effective in handling an emergency or disaster. This is consistent with our earlier discussion of the integrated ECWS capability and multi-channel messaging. Second, the utilities infrastructure that underpins ECWS should not be considered in isolation. In an emergency or disaster situation, power and telecommunications infrastructure and assets (including auxiliary and back-up systems) must be considered as an important and integral part of the ECWS capability. This underscores the need to review current and future critical utilities infrastructure redundancy arrangements and designs.
The likely event-related impacts on current and future ECWS enabling infrastructure
The submissions allowed us to code 36 specific statements related to the current and future infrastructure required to support ECWS. In addressing this aspect of the inquiry, stakeholders frequently used the terms ‘hardened’, ‘toughened’ and ‘damage resistant’ infrastructure in order to focus attention on the need for utilities infrastructure resilience. As an example, the ABC submission stated that in several regional areas, there was no back-up programming, messaging or power systems in place should extreme bushfire or flood emergencies eventuate (submission 35) (Commonwealth of Australia, 2011). Pivotally, this severely inhibits the capability to
263
fulfil its role as a national emergency broadcast agency. In a similar example, the Lake Macquarie City Council voiced concerns that mobile communications towers and control equipment are extremely vulnerable to bushfires in their regional setting (submission 26) (Commonwealth of Australia, 2011). The message from stakeholders was that current critical infrastructure, particularly in regional areas, is insufficiently robust and lacks adequate protection from bushfire, flooding and storm or cyclone events.
In looking to future telecommunications infrastructure developments, it should be noted that over 25 per cent of the node 3 statements reflected reservations about the construction and deployment of Australia’s NBN (Department of Broadband, Communication and the Digital Economy, 2011). A range of statements argued that the future NBN would be adequate for commercial operations but lacked the ‘hardened’ designs required to withstand extraordinary emergency and disaster events. As an example, in its assessment of NBN utility for emergency operations, the NSW SES asserted that:
‘consideration must be given to alternate and hierarchical communications routing, single point of failure removal, network decentralization, auxiliary power systems for optical fibre operations, improved replacement equipment and logistics strategies, and robust service level agreements for the NBN’ (submission 17) (Commonwealth of Australia, 2011).
Thus, stakeholders are commending that future national infrastructure must be designed and constructed in line with the potential risks and events that emerged during the Australian summer of 2010-2011.
Overall, the stakeholders’ statements send a warning of national infrastructure that is extremely vulnerable to emergencies and disasters, particularly in regional or isolated areas. This outcome adds further weight to our earlier proposition that current and future critical utilities infrastructure resilience and redundancy arrangements should be reviewed; and, where possible, remediation works initiated in the medium term.
Improving ECWS user education for preparedness and response
The 32 coded stakeholder statements universally argued for improvements to emergency and disaster communications education in support of better warning and response outcomes in communities. The NTPFES stated without equivocation that:
‘education and preparedness of the public is the key to success’ (submission 5) (Commonwealth of Australia, 2011).
In addition, over 22 per cent of the node 4 statements argued that broad based education covering all sectors of the community, particularly disabled or non-English speaking persons, should be a priority for government agencies. A strong example of commitment to emergency and disaster education (including the use of ECWS) was
264
provided by the South Australian government that, following the devastating Victorian Black Saturday Bushfires of 2009 (i.e. 173 fatalities and over 5,000 injuries; with 2,029 homes and over 450,000 hectares of land destroyed) (ABC, 2009), established a four year, $12.9 million ‘Prepare-Act-Survive’ emergency education program (submission 9) (Commonwealth of Australia, 2011). The collective stakeholder response emphasizes the importance of ongoing community awareness and education programs in all areas of emergency and disaster management.
New and emerging technologies for handling disasters and emergencies
The 44 coded stakeholders in this area of the inquiry confirmed that new technologies to support emergency and disaster management in the Australian setting are emerging, while noting three main issues raised by the stakeholders. First, commercial industry and businesses have developed a range of innovative ECWS and technologies that support the needs of cities and regionally concentrated communities (4 technology submissions, and over 15 per cent of coded node 5 statements). Some examples of these systems and technologies include Sentinel Alert (i.e. a warning system that uses global positioning systems, satellites and radio transmitter networks to issue location based emergency warnings) (Sentinel Alert, 2011); Yellow Bird (i.e. a warning system that uses emergency alert tone triggers, radio messaging and global positioning systems capabilities to issue location based emergency warnings) (Advance Alert, 2011); and Field Secure (i.e. a warning system that fuses data from various public information sources and sensor networks in order to provide location based emergency warnings) (Fieldsecure, 2011). Collectively, the stakeholders offering (and supporting) these types of communications solutions have displayed the innovative capacity to create useful systems and technologies as part of the combination of ECWS that support emergency and disaster management operations.
Second, the evolution of current generations of mobile and fixed communications technologies represent important emergency and disaster systems capabilities. As an example, over 20 per cent of node 5 statements in this area of the inquiry argued for the development of more Fourth generation (4G) Long term evolution (LTE) systems that supported enhanced mobile broadband for voice, data and video delivery (International Telecommunication Union, 2010). Despite the earlier noted limitations in some mobile telephony infrastructure and coverage across Australia, Telstra stated in their submission that:
‘4G LTE networks provide significant new opportunities to enhance the communications within and between emergency services organisations. These opportunities include new applications, greater security, increased availability, reduced costs, and increased interoperability – so that emergency services are better informed and able to respond more quickly and effectively in the event of an emergency or natural disaster’ (submission 31) (Commonwealth of Australia, 2011).
265
Hence, stakeholders’ statements suggest that the ongoing development and evolution of currently available systems and technologies will provide a valuable component of the combined ECWS in the future.
Third, over 30 per cent of the coded node 5 statements show support for the use of Australia’s ‘Digital Dividend’ (700MHz) and Reallocated Free-to-air television (2.5GHz) communications spectrum for emergency and disaster operations (Australian Communications and Media Authority, 2011). In essence, the termination of analogue television services broadcasting (known as the Digital Dividend), and the reallocation of Free-to-air television spectrum for best use wireless access services, provide opportunities for shared use of the communications spectrum by commercial and public interests. Also, Telstra stated that the use of digital dividend spectrum should be harmonized with the ITU resolution 646-1/WRC-03 (International Telecommunication Union, 2003) that recommends using frequencies in the 700MHz band for advanced public (emergency) protection and disaster relief solutions in the Asia-Pacific region (submission 31) (Commonwealth of Australia, 2011). Accordingly, the stakeholder statements suggest that it would be in the national interest to consider repurposing unused and available spectrum for emergency and disaster support activities.
Conclusions
In concluding the study, we acknowledge that the size of the data collection and analysis is limited in its scope. However, the written stakeholder submissions were provided by experts and practitioners in the field of emergency and disaster management, and are based on a broad range of accumulated knowledge and experience related to emergency and fire services, law enforcement, emergency and disaster broadcasting, technology and communications equipment, technical and regulatory matters, community education, and disability services. Accordingly, the limited size of the data set is compensated to some extent by the quality and collective experiences of the participating stakeholders.
Based on the results, the study raises four important issues for consideration. First, the construction and deployment of several ECWS in the Australian context come with noted social and/or technological limitations. Hence, no single ECWS solution is likely to be effective in all situations. This offers an opportunity to consider the development of more combined, coordinated and integrated groups of ECWS that deliver multiple channels of information and messages (Paton and Moore Johnston, 2006; De Walle et al., 2010). Importantly, this systems based approach for the ECWS capability (Prencipe et al., 2005; Hitchins, 2007; Meadows, 2008) may render improved warning and response outcomes for widespread and regional communities as typified in the Australian context.
Second, the underlying critical infrastructure required to support and enable ECWS capabilities should be continually reviewed and analysed for adequate resilience and
266
system redundancy. The ongoing viability and availability of critical power and telecommunications infrastructure for maintaining the delivery of ECWS capabilities suggests that damage resistance and systemic redundancy and resilience of infrastructure are pivotal issues, particularly in relation to improved integrated systems and design (Shinozuka, 2004; Manyena, 2006; Paton and Moore Johnston, 2006; Boin and McConnell, 2007; McEntire et al., 2010). This is especially important when considering less resourced regional communities or isolated areas as depicted in some Australian examples.
Third, the ongoing delivery of education programs and awareness campaigns for ECWS users should remain an important plank in the handling of emergencies and disasters. Other studies have reinforced the opinions of expert stakeholders used in this research, and argue that education and awareness can support sound decision making and actions that ultimately avert loss of life (Faupel and Styles, 1993; Shaw et al., 2004; Shiwaku et al., 2007; Shiwaku and Shaw, 2008). Given the large number of widespread and regional communities in Australia, adequate penetration of these programs and campaigns should remain a public sector priority.
Finally, the capacity for new ECWS technologies to support and enable emergency and disaster response is evident. The ongoing development of satellite, wireless, mobile and radio based communications technologies should allow ECWS capabilities to expand and grow, subject to any limitations imposed by less resilient supporting infrastructure. In looking forward with optimism, we would hope that future research might examine the use of promising new technologies as part of the ECWS capability here in Australia, and possibly more broadly around the world.
Acknowledgements
The authors gratefully acknowledge the kind support of Senator Mary Fisher, Chairman for the Federal Government Inquiry, and the Australian Senate Standing Committee on Environment and Communications for their timely provision of stakeholder data and public statements that are presented in this paper.
References
Arnold, J. L., Levine, B. N., Manmatha, R, Lee, F, Shenoy, P, Tsai, M-C, Ibrahim, T.K., O’Brien, D.J. and Walsh, D.A. (2004) “Information-sharing in out-of-hospital disaster response: The future role of information technology,” Prehospital and Disaster Medicine, Vol. 9, pp. 201–207.
Advance Alert (2011). “Yellow Bird Alert - Automatic Link to Emergency Radio Transmissions”, available at http://www.yellowbirdalert.com/ (accessed 1 October 2011).
Australian Broadcasting Commission (2009). “Black Saturday”, available at: http://www.abc.net.au/innovation/blacksaturday/#/stories/mosaic (accessed 20 July 2010).
267
Australian Broadcasting Commission (2011). “ABC Emergency”, available at: http://www.abc.net.au/emergency/ (accessed 20 July 2010).
Australian Capital Territory (ACT) Government. (2011) “Use of Emergency Alert during the Mitchell Hazardous Material Fire,” available at: http://esa.act.gov.au/wp-content/uploads/Report-on-the-use-of-EMERGENCY-ALERT-for-Mitchell-fire-September-20111.pdf (accessed 5 October 2011).
Australian Communications and Media Authority (2011). “Allocation of the 700MHz (digital dividend) and 2.5GHz bands”, available at http://www.acma.gov.au/WEB/STANDARD/pc=PC_312315 (accessed 21 September 2011).
Belardo, S. and Karwan, K.R. (1986) “The Development of a Disaster Management Support System through Prototyping”, Information and Management, Vol.10, pp. 93-102.
Bharosa, N. and Janssen, M. (2010). “Extracting Principles for Information Management Adaptability during Crisis Response: A Dynamic Capability View,” in the Proceedings of the 43rd Hawaii International Conference on System Sciences, Koloa, Kauai, Hawaii, 2010, IEEE Computer Society, Washington DC, pp 1-10.
Billa, L, Mansor, S. and Mahmud, A.R. (2004) “Spatial information technology in flood early warning systems: an overview of theory, application and latest developments in Malaysia”, Disaster Prevention and Management, Vol. 13 No. 5, pp. 356-363.
Boin, A. and McConnell, A. (2007) “Preparing for Critical Infrastructure Breakdowns: The Limits of Crisis Management and the Need for Resilience.” Journal of Contingencies and Crisis Management, Vol 15 No 1, pp 50-59.
Botterell, A and Addams-Moring, R. (2007). “Public Warning in the Networked Age: Open standards to the rescue”, Communications of the ACM, Vol. 50, No. 3, pp 59-60.
Carver, L and Turoff, M. (2007). “Human-Computer Interaction: The Human and Computer as a Team in Emergency Management Information Systems”, Communications of the ACM, Vol. 50, No. 3, pp 33-38.
Chen, R., Sharman, R., Rao, R. H. and Upadhyaya, S. (2008). “Coordination in Emergency Response Management”. Communications of the ACM Vol. 51, No.5, pp 66-73.
Coile, R.C. (1997) “The role of amateur radio in providing emergency electronic communication for disaster management”, Disaster Prevention and Management, Vol. 6, No. 3, pp.176 – 185.
Collins, M.L. and Kapucu, N. (2008) “Early warning systems and disaster preparedness and response in local government”, Disaster Prevention and Management, Vol. 17 No. 5, pp.587 - 600
Commonwealth of Australia. (2011) “Inquiry into the capacity of communication networks and emergency warning systems to deal with emergencies and natural disasters”, Senate Standing Committees on Environment and Communications, 2011, available at:
268
http://www.aph.gov.au/senate/committee/ec_ctte/emergency_communications/index.htm (accessed 18 August 2011).
Corley, K.G. and Gioia, D.A. (2004). “Identity Ambiguity and Change in the Wake of a Corporate Spin-Off”. Administrative Science Quarterly Vol. 49, No.2, pp 173–208.
Currion, P., De Silva, C and Van De Walle, B. (2007). “Open source software for disaster management”, Communications of the ACM, Vol. 50, No. 3, pp 61-65.
D’Antonio, S., Romano, L., Khelil, A., and Suri, N. (2009) “INcreasing Security and Protection through Infrastructure REsilience: The INSPIRE Project”, Critical Information Infrastructure Security, Lecture Notes in Computer Science, 2009, Vol. 5508, pp 109-118.
Denzin, N.K. and Lincoln, Y.S. (2005). The Handbook of Qualitative Research 3rd Edition. Sage Publications, Thousand Oaks, CA.
Department of Broadband, Communication and the Digital Economy (2011) “NBN – Empowering Australia”, available at http://www.nbn.gov.au/ (accessed 5 October 2011)
Donaldson, T. and Preston, L.E. (1995) “The Stakeholder Theory of the Corporation: Concepts, Evidence and Implications”. Academy of Management Review Vol. 20, pp 65–91.
Emergency Alert (2011) “Emergency Alert. Be Warned. Be Informed”, available at http://www.emergencyalert.gov.au/ (accessed 30 September 2011)
ESi Incorporated (2011) “ESi Boundless Collaboration – WebEOC Professional”, available at http://www.esi911.com/esi/index.php?option=com_content&task=view&id=377&Itemid=377 (accessed 25 September 2011)
Faupel, C.E. and Styles, S.P. (1993) “Disaster Education, Household Preparedness, and Stress Responses Following Hurricane Hugo”, Environment and Behavior, Vol. 25 No. 2, pp 228-249.
Fieldsecure (2011) “Field Secure – Emergency Warning and Safety Management” available at http://www.fieldsecure.com/ (accessed 20 September 2011)
Freeman, R.E. (1984). Strategic management: A stakeholder approach. Pitman, Boston, MA.
Freeman, R.E., Wicks, A.C. and Parmar, B. (2004) “Stakeholder theory and the corporate objective revisited”. Organization Science, Vol. 15, pp 364–369.
French, S and Turoff, M. (2007). “Decision support systems”, Communications of the ACM, Vol. 50, No. 3, pp 39-40.
Geoscience Australia (2011) “Satellites and Sensors”, available at http://www.ga.gov.au/earth-observation/satellites-and-sensors.html (accessed 4 October 2011)
Hitchins, D.K. (2007). Systems Engineering – A 21st Century Systems Methodology. John Wiley & Sons, West Sussex, UK.
269
Iakovou, E. and Douligeris, C. (2001) “An information management system for the emergency management of hurricane disasters”, International. Journal of Risk Assessment and Management, Vol. 2, No. 3/4, pp 243-262.
International Telecommunication Union (2003) “Resolution 646 (WRC-03) – Public Protection and Disaster Relief”, available at http://www.itu.int/oth/R0B06000014/en (accessed 20 June 2004)
International Telecommunication Union (2010) “ITU paves the way for next generation 4G mobile technologies”, available at http://www.itu.int/net/pressoffice/press_releases/2010/40.aspx (accessed 22 December 2010)
Jaeger, P.T., Shneiderman, B., Fleischmann, K.R., Preece, J., Qua, Y., and Wu, P.F. (2007). “Community response grids: E-government, social networks, and effective emergency management”. Telecommunications Policy, Vol. 3, No. 10-11, pp 592-604.
Kapucu, N. (2006). “Interagency Communication Networks During Emergencies : Boundary Spanners in Multiagency Coordination”, American Review of Public Administration, Vol. 36, No. 2, pp 207–2225.
Kapucu, N. (2008). “Collaborative emergency management: Better community organising, better public preparedness and response”, Disasters, Vol. 32, No. 2, pp 239–262.
Kurita, T., Nakamura, A., Kodama, M. and Colombage, S.R.N. (2006) “Tsunami public awareness and the disaster management system of Sri Lanka”, Disaster Prevention and Management, Vol. 15 , No. 1, pp 92-110
Manoj, B. S and Hubenko Baker, A. (2007). “Communication Challenges in Emergency Response”, Communications of the ACM, Vol. 50, No. 3, pp 51-53.
Manyena, S.B. (2006). “The Concept of Resilience Revisited”, Disasters, Vol. 30, No. 4, pp 433-450.
McEntire, D, Gilmore Crocker, C. and Ekong Peters, M.P.H. (2010) “Addressing vulnerability through an integrated approach”, International Journal of Disaster Resilience in the Built Environment, Vol. 1 No. 1, pp.50-64
Meadows, D.H. (2008). Thinking in Systems. Chelsea Green Publishing Company, White RiverJunction, VT.
Mendoca, D., Jefferson, T and Harrald, J. (2007). “Collaborative adhocracies and mix-and-match technologies in emergency management”, Communications of the ACM, Vol. 50, No. 3, pp 45-49.
Miles, M.B. and Huberman, A.M. (1997). Qualitative Data Analysis – An Expanded Case Book. 2nd ed. Sage Publications, Thousand Oaks, CA.
Palen, L, Hiltz, S.R. and Liu, S.B. (2007). “Online forums supporting grassroots participation in Emergency Preparedness and Response”, Communications of the ACM, Vol. 50, No. 3, pp 54-58.
270
Paton, D. and Moore Johnston, D. (2006). Disaster Resilience: An Integrated Approach. Thomas Books, Springfield, IL.
Patricelli , F., Beakley , J. E., Carnevale, A., Tarabochia, M. and von Lubitz, D. K. J. E. (2009) “Disaster management and mitigation: the telecommunications infrastructure”, Disasters, Vol. 33, pp 23−37.
Pearce, L. (2003) “Disaster management and community planning, and public participation: How to achieve sustainable hazard mitigation”, Natural Hazards, Vol. 28, pp 211–228.
Perry, R.W. and Nigg, J.M. (1985) “Emergency Management: A Challenge for Public Administration”, Public Administration Review, Vol. 45, pp. 72-77
Prencipe, A, Davies, A. and Hobday, M. (2005). The Business of Systems Integration. Oxford University Press, New York, NY.
Quarantelli, E. L. (1988). Disaster crisis management: A summary of research findings. Journal of Management Studies, Vol. 25, pp 373-385.
Sentinel Alert (2011) “Intelligent Public Warning Systems”, available at http://www.sentinelalert.com.au/ (accessed 1 October 2011).
Shaw, R., Kobayashi, K.S.H. and Kobayashi, M. (2004) “Linking experience, education, perception and earthquake preparedness”, Disaster Prevention and Management, Vol. 13 No. 1, pp 39 – 49.
Shinozuka, M. (2004). Resilience of integrated power and water system. Research Progress and Accomplishments, 2003–04. MCEER, Buffalo, NY.
Shiwaku, K. and Shaw, R. (2008) “Proactive co-learning: a new paradigm in disaster education”, Disaster Prevention and Management, Vol. 17 No. 2, pp 183 – 198.
Shiwaku, K., Shaw, R., Kandel, R.C., Shrestha, S.N. and Dixit, A.M. (2007) “Future perspective of school disaster education in Nepal”, Disaster Prevention and Management, Vol. 16 No. 4, pp 576 – 587.
Smith, W., and Dowell, J. (2000). “A case study of co-ordinative decision-making in disaster management”. Ergonomics Vol. 43, pp 1153–1166.
Thompson, S.J., Altay, N, Green, W.G., and Lapetina, J. (2006) “Improving disaster response efforts with decision support systems”. International Journal of Emergency Management Vol. 3, pp. 250–263.
Trim, P.R.J. (2004) “An integrative approach to disaster management and planning”, Disaster Prevention and Management, Vol. 13 No. 3, pp.218 - 225
Troy, D. A., Carson, A., Vanderbeek, J., and Hutton, A. (2008). “Enhancing community-based disaster preparedness with information technology”. Disasters, Vol. 32, No. 1, pp149-165.
Van De Walle, B. and Turoff, M. (2007). “Emergency Response Information Systems: Emerging Trends and Technologies”, Communications of the ACM, Vol. 50, No. 3, pp 29-31.
Van De Walle, B, Turoff, M. and Hiltz, S.R. (2010). Information Systems for Emergency Management, M.E. Sharpe, Armonk, NY.
Walsh, M. (2003). “Teaching qualitative analysis using QSR NVivo”. The Qualitative Report Vol. 8, No. 2, pp 251–256.
271
The Core Volunteer Leanne McCormick, Monash University
The Core Volunteer
Leanne McCormick
Monash University, Melbourne, Australia
Paper presented at EARTH: FIRE AND RAIN Australian & New Zealand Disaster and Emergency Management Conference Brisbane – 16 – 18, April 2012
272
The Core Volunteer Leanne McCormick, Monash University
The Core Volunteer
Abstract
Trained, highly skilled and committed volunteers are of critical value to government and community organisations responsible for coordinating disaster recovery programs in Australia. There are significant challenges in recruiting, training and retaining motivated volunteers, specifically in maintaining capacity and optimal service delivery both during times of peak activity, and quieter periods. Given the absence of financial remuneration, management strategies derived from organisational behavioural science models may benefit the organisations in attracting and retaining suitable volunteers.
The purpose of this study was to measure the level of affective and normative organisational commitment (as an indicator of volunteer engagement), and if a relational psychological contract (the basis of the volunteer’s relationship with the organisation) influences the level of organisational commitment of unpaid volunteers associated with a large Australian not-for-profit organisation.
This study has quantitatively tested the level of attitudinal constructs of organisational commitment and a relational psychological contract, as held by volunteers within a large service delivery organisation in Australia. A cross-sectional anonymous survey was conducted in 2011, using psychometrically valid scales. The relationships between antecedents and commitment outcomes, as well as the influence of the relational psychological contract, were assessed using multiple hierarchical regression analysis.
In terms of preliminary findings, hypotheses were generally supported. A positive and significant relationship was found for role scope, personal importance, organisational support, and need satisfaction for affective commitment; likewise socialisation for normative commitment. A relational psychological contract was found to partially mediate levels of affective and normative commitment.
Understanding the key predictors and implications of the commitment and psychological contract constructs may assist organisations dependent on volunteers tap a deeper and more enduring level of connection with their individual volunteers and assist with maintenance of service delivery outcomes in the longer term.
Keywords: volunteer, psychological contract, organisational commitment, organisational development
273
The Core Volunteer Leanne McCormick, Monash University
Introduction
As a critical component of the contemporary not-for-profit (NFP) organisation, ‘the volunteer “workforce” is both economically, and socially significant’ (Van Vuuren, De Jong & Seydel 2008:315). Moreover, the utilization of human resource management (HRM) and organisational behaviour (OB) principles by NFP management groups, within volunteer programs, supports a broadening of the OD function, in support of volunteer performance and retention (Netting, et al. 2004).
This paper extends the psychological contract (PC) construct (Rousseau 1989) to include volunteers, and specifically how a relational psychological contract (RPC) might influence outcomes of organisational commitment (OC) – affective (AC) and normative (NC), as modelled by Allen & Meyer (1990) on the part of volunteers. Research questions sought to quantitatively confirm important antecedents of AC and NC as well as testing for the mediating influence of a relational psychological contract (RPC) on respective commitment outcomes.
The concepts of PC and OC are both applicable to volunteers. Affinity has been established between a RPC and AC, on the basis of socio-emotional need fulfilment and positive work experiences (Allen, et al 1990; Aselage & Eisenberger 2003; Coyle-Shapiro & Conway, 2005; Guerro & Herrback 2008; Rousseau, Ho & Greenberg 2006). The linkage of RPC with NC has also been noted (see Farmer & Fedor 1999:351; Meyer, Irving & Allen 1997; Rousseau & Wade-Benzoni 1994). However to date, empirical research examining the PC of volunteers remains negligible (Farmer et al. 1999; Vantilborgh et al. 2010).
Background
OC reflects an individual’s acceptance of organisation goals, and intent to actively contribute in support of those goals or organisational well-being (Mowday, Porter & Steers 1982).
Affective Commitment
AC, or the want to stay factor is particularly relevant to volunteering, volunteers being intrinsically motivated to contribute time, energy and expertise, in exchange for non-monetiseable, socio-emotional need fulfilment, and a positive work experience (Van Vuuren et al. 2008). In terms of identifying key antecedents (independent variables) in relation to volunteer commitment, selection was based on previous empirical research which had established a positive relationship between the individual elements and AC. Role scope, role clarity, personal importance, perceived organisational support (dependability), and need satisfaction, have been firmly established for paid employee relationships (Allen, et al 1990; Eder & Eisenberger 2008; Rhoades & Eisenberger 2002), and to a more limited extent, for volunteers (Boezeman & Ellemers 2007; Clary, Snyder & Ridge 1992; Greenslade & White 2005; Luthy & Schrader 2007; Shin & Kleiner 2003; Stephen, Dawley & Stephens 2004; Tidwell 2005; Van Vuuren et al. 2008).
With regard to the individual antecedents, role scope (RS) refers to the number of different tasks required of a job, and the frequency with which those tasks are repeated. The greater the number of individual components, the more challenging
274
The Core Volunteer Leanne McCormick, Monash University
the role is perceived to be (Hackman & Oldham 1976). Role clarity (RC) or ambiguity reflects the degree of uncertainty respondents feel about what actions are required to fulfil a role (Meyer et al 2002).
A sense of personal importance (PI) (Allen & Meyer 1990) reflects the level of respect volunteers perceive from the organisation in relation to donations of their time and energy. It is primarily assessed through feedback and participation in decision making. These aspects contribute to a volunteer’s perception that they are valued, appreciated, and celebrated (Boezeman, et al. 2007; Shin, et al. 2003).
Perceived organizational support (POS) is the belief of employees ‘concerning the degree to which the organization values their contributions and cares about their well-being’ (Eisenberger, et al 1986), and the extent to which individuals can rely on the organisation for support that is a sense of dependability (Farmer & Fedor 1999). A higher level of POS is positively associated with commitment, for both employees (Eder & Eisenberger 2000) and volunteers (Boezeman & Ellemers, 2007).
Personal characteristics fall into demographic and dispositional categories. In this study demographic items (age, tenure, gender and education), were used as control variables. In terms of dispositional factors, need satisfaction (NS) (Clary, et al. 1992) was identified as the most relevant independent factor, with individual elements of value and esteem.
It was thus hypothesised that in relation to the AC of volunteers:
a) role scope will be positively related
b) role ambiguity will be negatively related
c) personal importance will be positively related
d) organisational support will be positively related
e) need satisfaction will be positively related
Normative Commitment
NC is the perceived need to stay on the part of the individual, and is generally judged on the basis of reciprocity (Meyer, Bobocel & Allen 1991), and with particular reference to the volunteer context; socialisation experiences (SE) (Allen et al. 1990).
The validity of SE as an antecedent of NC is based on the assertion that the social experience (prior to and on organisational entry) is highly valued (Allen & Meyer 1990). Commitment levels of volunteers and paid staff alike are positively associated with group norms, reinforced by the social environment (Boezeman, et al. 2007; Eder & Eisenberger 2008; Wymer, et al, 2001).
It was thus hypothesised that in relation to the normative commitment of volunteers:
f) socialisation experiences will be positively related
Psychological Contract
275
The Core Volunteer Leanne McCormick, Monash University
The PC is defined by Rousseau (1989) as ‘individual beliefs in reciprocal obligations’ between contract parties. The PC provides a ‘framework for understanding employee-organisation linkages’ (McFarlane Shore & Tetrick 1994); its interpretive role well established (Rousseau & Wade-Benzoni 1994) in the context of traditional employees with established linkages to job satisfaction, performance, commitment and retention (Grimmer & Oddy 2007).
Research interest in the PC has recently broadened, from traditional employees to a range of stakeholders, including volunteers (Farmer et al.1999; Netting et al. 2004; Liao-Troth 2001, 2005; Starnes 2007; Thompson & Bunderson 2003; Vantilborgh et al. 2010). The features of an individual’s PC will assume a position along the transactional – relational continuum (Atkinson 2007; Rousseau 1990). Transactional contracts consist of ‘specific, close-ended, easily definable’ terms’ (Atkinson 2007:228), typically financial compensation linked to quantifiable employee outcomes. By contrast, relational contracts are ‘more developmental, open-ended, pervasive, socio-emotional, and value-laden in nature, and embedded in a broader network of social concerns such as interpersonal relationships, reputation, and justice’ (Atkinson 2007:228).
Just as the combination of intrinsic motivation and socio-emotional fulfilment has been positively linked to the level of OC and RPC (Grimmer et al. 2007) held by traditional employees, the psychological contract of volunteers is also held to be relational (Penner 2002). Moreover, volunteers tend to be intrinsically motivated, their intentions infused with social justice (Greenslade et al. 2005) or other ideological priorities that align with the mission and values of the organisation.
A predominately theoretical relationship has been established between PC and both AC (Bellou 2007) and more traditionally, NC (Farmer et al, 1999; Meyer et al., 1997; Rousseau 1989; Rousseau 1995; Rousseau & Wade-Benzoni 1994), although very recent literature suggests that interest is rapidly expanding.
Linkages remain tenuous at present, lacking empirical support. For example, role clarity, an important antecedent of AC, is held to be important in ensuring stability of the PC (Rousseau & Wade-Benzoni 1994). Decision-making involvement, a significant component of personal importance, is also associated with the PC (Bellou 2007). Likewise, POS provides a powerful means by which to ‘capture the relational social exchange dimension of the contract as opposed to the short-term transactional one’ (Guerro & Herrback 2008). In reference to need satisfaction, the identification of subconscious needs (such as security; enhancement of self-esteem; and just treatment) (Schneider & Bowen 1995) of an individual may enable development of an appropriate PC (Bellou 2007), and thereby influence how a volunteer might engage with an organization. These aspects have not been specifically tested in a volunteer context.
NC is particularly associated with a RPC (Meyer et al., 1997; Rousseau & Wade-Benzoni 1994). SE (as previously discussed) will influence the nature and direction of the PC. Organisational ‘promises’ will be validated in the context of observations of other staff or volunteers attitudes and behaviours, potentially within a relatively fluid environment in terms of ‘social expectations’ and ‘organisational values’
276
The Core Volunteer Leanne McCormick, Monash University
(Stephens, et al. 2004:484). Sufficient mission and value alignment, will enable negative organisational incidents to be forgiven (Farmer et al. 1999), with individuals working harder and contributing more to the organization (Stephen, et al. 2004).
Accordingly it was hypothesised that a relational psychological contract will mediate the relationships between:
g) role scope, role clarity, personal importance, organisational support, need satisfaction; need satisfaction; and the affective commitment of volunteers, and
h) socialisation experiences and the normative commitment of volunteers.
Method
Self-completed anonymous surveys provided the required data for analysis. Nearly 4,000 volunteers were invited to participate, from a single Australian not-for-profit organisation, during a 4 week period in 2011. Responses were returned direct to the researcher by post or through online submission.
Measures
Included measures for the continuous variables were psychometrically valid, and had been used in other published studies. While many of the scales were necessarily derived from paid staff literature, with some minor word substitution, scales used for volunteers were utilised where possible.
To assess AC and NC the respective 6 item Affective Commitment Scale (ACS) and Normative Commitment Scale (NCS) (Meyer and Allen 1993) were used. Scale validity has previously been reported as acceptable with Cronbach’s alpha ( ranging from .74 to .90 (Allen & Meyer 1996).
To measure the relational psychological contract, an adapted version of Millward and Hopkins (1998) Psychological Contract Scale (PCS) was used, specifically the 12 items of ‘relational’ character, with Cronbach’s equalling .84 (Millward & Brewerton 1999).
Role scope used a 12-item subset of Hackman and Oldhams (1974) Job Diagnostic Survey (JDS), covering task identity, skill variety, task significance and feedback. The scale is still a ‘widely used perceptual measure of job scope’ (Goris 2007:740), used in a number of recent studies (Goris 2007; Goris, Vaught, & Pettit, 2003; Schaubroeck et al., 2007) with Cronbach’s equalling .86 (Van de Vegt 1998).
Role ambiguity was measured through the 6-item reverse scored Job-Related Strain Index (Rizzo, House and Lirtzman (1970), which was formulated to ‘evaluate role ambiguity in all types of organizations…’ (Yoshie et al. 2008:114), and as used by a number of other studies (see Mukerjee & Malhotra, 2006). The scale has also been used in other published studies (see Foote et al. 2005; Trembley & Roger 2004). Cronbach’s has been established as .85 (Mukerjee & Malhotra 2006).
Personal importance was measured through use of a composite measure derived from another volunteer commitment study (Boezeman & Ellemers 2008), which used a limited number of items from each of the Autonomous Respect Scale (Tyler &
277
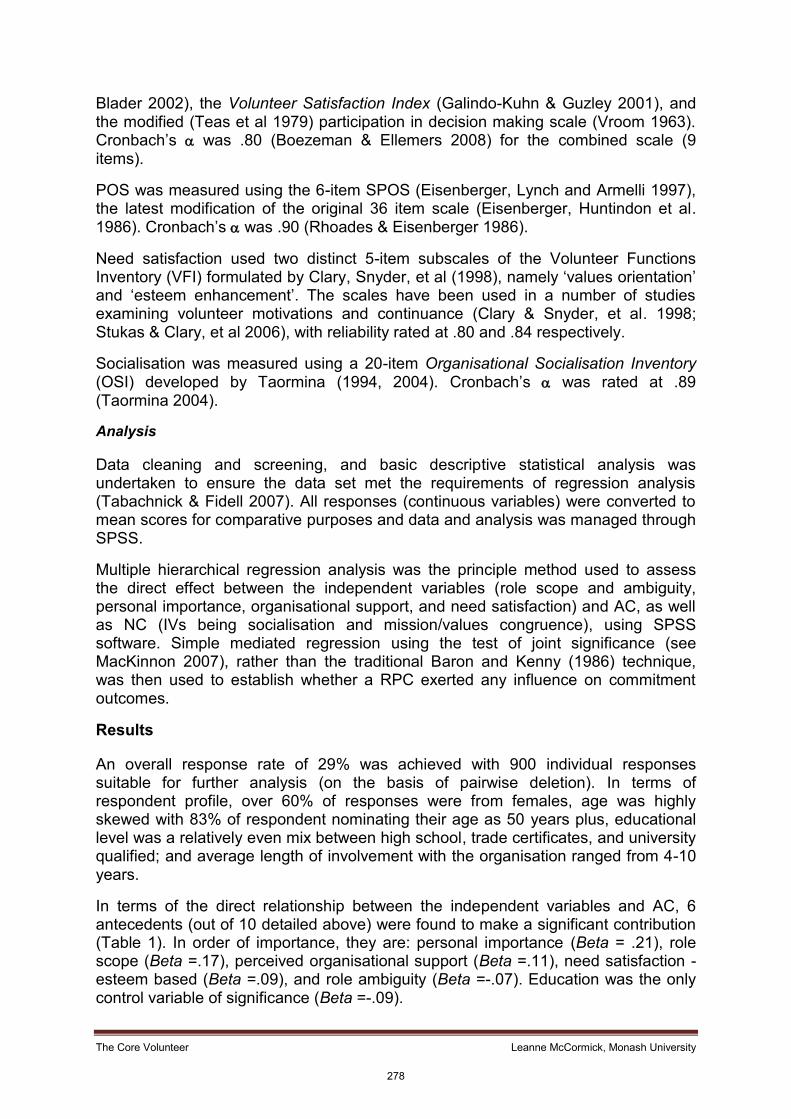
The Core Volunteer Leanne McCormick, Monash University
Blader 2002), the Volunteer Satisfaction Index (Galindo-Kuhn & Guzley 2001), and the modified (Teas et al 1979) participation in decision making scale (Vroom 1963). Cronbach’s was .80 (Boezeman & Ellemers 2008) for the combined scale (9 items).
POS was measured using the 6-item SPOS (Eisenberger, Lynch and Armelli 1997), the latest modification of the original 36 item scale (Eisenberger, Huntindon et al. 1986). Cronbach’s was .90 (Rhoades & Eisenberger 1986).
Need satisfaction used two distinct 5-item subscales of the Volunteer Functions Inventory (VFI) formulated by Clary, Snyder, et al (1998), namely ‘values orientation’ and ‘esteem enhancement’. The scales have been used in a number of studies examining volunteer motivations and continuance (Clary & Snyder, et al. 1998; Stukas & Clary, et al 2006), with reliability rated at .80 and .84 respectively.
Socialisation was measured using a 20-item Organisational Socialisation Inventory (OSI) developed by Taormina (1994, 2004). Cronbach’s was rated at .89 (Taormina 2004).
Analysis
Data cleaning and screening, and basic descriptive statistical analysis was undertaken to ensure the data set met the requirements of regression analysis (Tabachnick & Fidell 2007). All responses (continuous variables) were converted to mean scores for comparative purposes and data and analysis was managed through SPSS.
Multiple hierarchical regression analysis was the principle method used to assess the direct effect between the independent variables (role scope and ambiguity, personal importance, organisational support, and need satisfaction) and AC, as well as NC (IVs being socialisation and mission/values congruence), using SPSS software. Simple mediated regression using the test of joint significance (see MacKinnon 2007), rather than the traditional Baron and Kenny (1986) technique, was then used to establish whether a RPC exerted any influence on commitment outcomes.
Results
An overall response rate of 29% was achieved with 900 individual responses suitable for further analysis (on the basis of pairwise deletion). In terms of respondent profile, over 60% of responses were from females, age was highly skewed with 83% of respondent nominating their age as 50 years plus, educational level was a relatively even mix between high school, trade certificates, and university qualified; and average length of involvement with the organisation ranged from 4-10 years.
In terms of the direct relationship between the independent variables and AC, 6 antecedents (out of 10 detailed above) were found to make a significant contribution (Table 1). In order of importance, they are: personal importance (Beta = .21), role scope (Beta =.17), perceived organisational support (Beta =.11), need satisfaction - esteem based (Beta =.09), and role ambiguity (Beta =-.07). Education was the only control variable of significance (Beta =-.09).
278
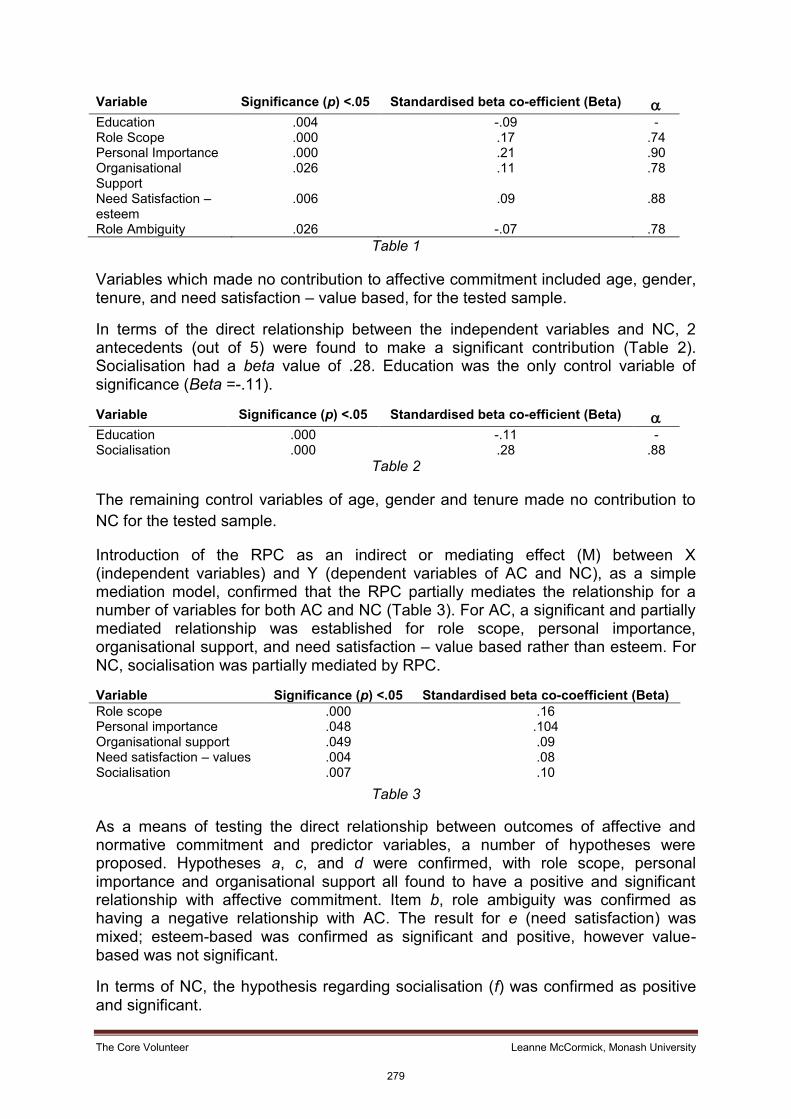
The Core Volunteer Leanne McCormick, Monash University
Variable Significance (p) <.05 Standardised beta co-efficient (Beta) Education .004 -.09 -
Role Scope .000 .17 .74 Personal Importance .000 .21 .90 Organisational Support
.026 .11 .78
Need Satisfaction – esteem
.006 .09 .88
Role Ambiguity .026 -.07 .78 Table 1
Variables which made no contribution to affective commitment included age, gender, tenure, and need satisfaction – value based, for the tested sample.
In terms of the direct relationship between the independent variables and NC, 2 antecedents (out of 5) were found to make a significant contribution (Table 2). Socialisation had a beta value of .28. Education was the only control variable of significance (Beta =-.11).
Variable Significance (p) <.05 Standardised beta co-efficient (Beta) Education .000 -.11 - Socialisation .000 .28 .88
Table 2
The remaining control variables of age, gender and tenure made no contribution to NC for the tested sample.
Introduction of the RPC as an indirect or mediating effect (M) between X (independent variables) and Y (dependent variables of AC and NC), as a simple mediation model, confirmed that the RPC partially mediates the relationship for a number of variables for both AC and NC (Table 3). For AC, a significant and partially mediated relationship was established for role scope, personal importance, organisational support, and need satisfaction – value based rather than esteem. For NC, socialisation was partially mediated by RPC.
Variable Significance (p) <.05 Standardised beta co-coefficient (Beta) Role scope .000 .16 Personal importance .048 .104 Organisational support .049 .09 Need satisfaction – values .004 .08 Socialisation .007 .10
Table 3
As a means of testing the direct relationship between outcomes of affective and normative commitment and predictor variables, a number of hypotheses were proposed. Hypotheses a, c, and d were confirmed, with role scope, personal importance and organisational support all found to have a positive and significant relationship with affective commitment. Item b, role ambiguity was confirmed as having a negative relationship with AC. The result for e (need satisfaction) was mixed; esteem-based was confirmed as significant and positive, however value-based was not significant.
In terms of NC, the hypothesis regarding socialisation (f) was confirmed as positive and significant.
279
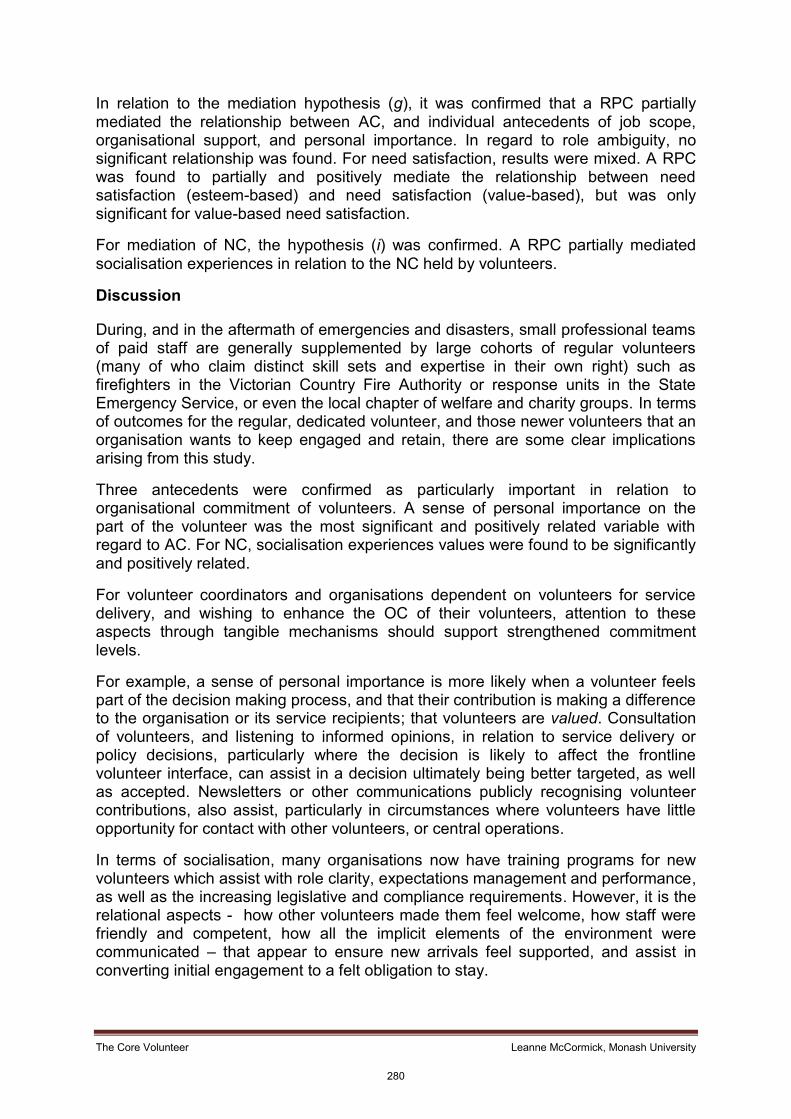
The Core Volunteer Leanne McCormick, Monash University
In relation to the mediation hypothesis (g), it was confirmed that a RPC partially mediated the relationship between AC, and individual antecedents of job scope, organisational support, and personal importance. In regard to role ambiguity, no significant relationship was found. For need satisfaction, results were mixed. A RPC was found to partially and positively mediate the relationship between need satisfaction (esteem-based) and need satisfaction (value-based), but was only significant for value-based need satisfaction.
For mediation of NC, the hypothesis (i) was confirmed. A RPC partially mediated socialisation experiences in relation to the NC held by volunteers.
Discussion
During, and in the aftermath of emergencies and disasters, small professional teams of paid staff are generally supplemented by large cohorts of regular volunteers (many of who claim distinct skill sets and expertise in their own right) such as firefighters in the Victorian Country Fire Authority or response units in the State Emergency Service, or even the local chapter of welfare and charity groups. In terms of outcomes for the regular, dedicated volunteer, and those newer volunteers that an organisation wants to keep engaged and retain, there are some clear implications arising from this study.
Three antecedents were confirmed as particularly important in relation to organisational commitment of volunteers. A sense of personal importance on the part of the volunteer was the most significant and positively related variable with regard to AC. For NC, socialisation experiences values were found to be significantly and positively related.
For volunteer coordinators and organisations dependent on volunteers for service delivery, and wishing to enhance the OC of their volunteers, attention to these aspects through tangible mechanisms should support strengthened commitment levels.
For example, a sense of personal importance is more likely when a volunteer feels part of the decision making process, and that their contribution is making a difference to the organisation or its service recipients; that volunteers are valued. Consultation of volunteers, and listening to informed opinions, in relation to service delivery or policy decisions, particularly where the decision is likely to affect the frontline volunteer interface, can assist in a decision ultimately being better targeted, as well as accepted. Newsletters or other communications publicly recognising volunteer contributions, also assist, particularly in circumstances where volunteers have little opportunity for contact with other volunteers, or central operations.
In terms of socialisation, many organisations now have training programs for new volunteers which assist with role clarity, expectations management and performance, as well as the increasing legislative and compliance requirements. However, it is the relational aspects - how other volunteers made them feel welcome, how staff were friendly and competent, how all the implicit elements of the environment were communicated – that appear to ensure new arrivals feel supported, and assist in converting initial engagement to a felt obligation to stay.
280
The Core Volunteer Leanne McCormick, Monash University
The PC construct offers scope to understand and improve volunteer management by exploiting the ‘positive relationship between OC and volunteering’ (Tidwell 2005:454), as well as providing ‘key insights’ into ‘volunteer behaviour’ (Farmer et al. 1999:350). The role of a confirmed relational psychological contract, and its partial and positive influence on volunteer commitment outcomes, has been a key outcome of this study. Identifying the key aspects of the psychological contract for an organisation’s volunteers offers an opportunity to leverage the relationship of individual volunteers with the organisation, not only in a consistent, positive and additive manner, but in alignment with strategic goals.
Conclusion
While volunteer commitment has attracted research interest, and resulted in a number of recent empirical studies, the psychological contract of volunteers has received far less scrutiny, despite its potential value to volunteer management methodology.
Data from this study confirmed that the PC of volunteers is relational, and the pre-eminence of perceived personal importance as an antecedent of AC specific to the volunteer context. Socialisation results regarding NC also confirm previous findings, with ongoing implications for Australian organisations in the recruitment and maintenance of their volunteer workforce. Of course, these results are correlational only; the associated relationships would benefit from further research.
A substantial number of organisations involved in frontline disaster management service delivery are heavily dependent on the contribution of volunteers to meet their service objectives. The right sort of volunteer is no longer so plentiful that an organisation can afford to take volunteer recruitment and retention for granted. Understanding the key predictors and implications of the commitment and psychological contract constructs enables organisations dependent on volunteers to potentially tap a deeper and more enduring level of connection with their individual volunteers. Organisations with this understanding will have the capacity to better define, and operationalize the promissory expectations and aspects of need satisfaction that are most typical of volunteers and leverage this knowledge to increase the level of want or obligation to stay on the part of their volunteers.
281
The Core Volunteer Leanne McCormick, Monash University
References
Allen, N & Meyer, J 1990 ‘The measurement and antecedents of affective, continuance and normative commitment to the organization’, Journal of Occupational Psychology, vol. 63, pp. 1-18
Amos, E & Weathington, B 2008 ‘An Analysis of the Relation Between Employee-Organisational Value Congruence and Employee Attitudes’, The Journal of Psychology, vol. 142, no. 6, pp. 615-631
Aselage, J & Eisenberger, R 2003 ‘Perceived Organisational Support and Psychological Contracts: A Theoretical Integration’, Journal of Organisational Behaviour, vol. 24, no. 5, pp. 491-509
Atkinson, C 2007 ‘Trust and the psychological contract’, Employee Relations, vol. 29, no, 3, pp. 227-246
Bellou, V 2007 ‘Shaping Psychological Contracts in the Public & Private Sectors: A Human Resources Management Perspective’, International Public Management Journal, vol. 10, no. 3, pp. 327-353
Boezeman, E & Ellemers, N 2007 ‘Volunteering for Charity: Pride, Respect, and the Commitment of Volunteers’, Journal of Applied Psychology, vol. 92, no. 3, pp. 771-785
Clary, E Snyder, M & Ridge, R 1992 ‘A functional strategy for the recruitment, placement and retention of volunteers’, Nonprofit Management and Leadership, no. 2, pp. 333-350
Coyle-Shapiro, J & Conway, N 2005 ‘Exchange relationships: examining psychological contracts and perceived organisational support’, Journal of Applied Psychology, vol. 90, no. 4, pp. 774-781
Cunningham, I 2000 ‘Managing Employee Commitment in the UK Voluntary Sector: A Frontier for Further Research’, Management Research News, vol. 23, no. 9-11, pp. 45-47
Eder, P & Eisenberger, R 2008 ‘Perceived Organisational Support: Reducing the Negative Influence of Coworker Withdrawal Behavior’, Journal of Management, vol. 34, pp. 55-69
Eisenberger, R Huntingdon, R Hutchison, S & Sowa, D 1986 ‘Perceived organizational support’, Journal of Applied Psychology, vol. 71,no. 3, pp. 500-507
Farmer, S & Fedor, 1999 ‘Volunteer Participation and Withdrawal: A Psychological Contract Perspective on the Role of Expectations and Organisational Support’, Nonprofit Management & Leadership, vol. 9, no. 4, pp. 349-366
Greenslade, J & White, K 2005 ‘The Prediction of Above-Average Participation in Volunteerism: A Test of the Theory of Planned Behavior and the Volunteers Functions Inventory in Older Australian Adults’, The Journal of Social Psychology, v145i2, pp.155-172
282
The Core Volunteer Leanne McCormick, Monash University
Grimmer, M & Oddy, M 2007 ‘Violation of the Psychological Contract: The Mediating Effect of Relational Versus Transactional Beliefs,’ Australian Journal of Management, vol. 32, no. 1, pp. 153-174
Guerro, S & Herrbach, O 2008 ‘The affective underpinning of psychological contract fulfillment’, Journal of Managerial Psychology, vol. 23, no. 1, pp. 4-17
Liao-Troth, M 2001 ‘Attitude differences between paid workers and volunteers’, Nonprofit Management and Leadership, vol. 11, no. 4, pp. 423–442 Liao-Troth, M 2005 ‘Are they here for the long haul? The effects of functional motives and personality factors on the psychological contracts of volunteers’ Nonprofit and Voluntary Sector Quarterly, vol. 34, no. 4, pp. 510–530 Luthy, M & Schrader, R 2007 ‘Volunteer Satisfaction: An Analysis of Contributing Factors Among Hospice Workers’, Academy of Accounting and Financial Studies Journal, vol. 11, pp. 51-64
MacKinnon, D Fritz, M Williams, J & Lockwood, C 2007 ‘Distribution of the product confidence limits for the indirect effect: Program PRODCLIN’, Behaviour Research Methods, vol. 39, no. 3, pp. 384-389
McFarlane Shore, L & Tetrick, L 1994, ‘The psychological contract as an explanatory framework in the employment relationship’, Trends in Organizational Behaviour, vol. 1, no. 91, pp. 91-109
Meyer, J Irving, P & Allen, N 1997 ‘Examination of the combined effects of work values and early work experiences on organizational commitment’, Journal of Organisational Behaviour, no. 19, iss. 1, pp. 29-52
Meyer, J Bobocel, R & Allen, N 1991 ‘Development of organizational commitment during the first year of employment: a longitudinal study of pre- and post-entry influences’, Journal of Management, vol. 17, no. 4, pp. 717-733
Meyer, J Stanley, D Herscovitch, L & Topolnysty, L 2002 ‘Affective, Continuance, and Normative Commitment to the Organisation: A Meta-analysis of Antecedents, Correlates and Consequences, Journal of Vocational Behaviour, vol. 62, pp. 20-52
Mowday, R Porter, L Steers, R 1982 Employee-Organisation Linkages: The Psychology of Commitment, Absenteeism, and Turnover, Academic Press, New York
Netting, F Nelson, H Borders, K & Huber, R 2004 ‘Volunteer and Paid Staff Relationships: Implications for Social Work Administration’, Administration in Social Work, vol. 28, no. 3/4, pp. 69-88
Penner, L 2002 ‘Dispositional and Organisational Influences on Sustained Volunteerism: An Interactionist Perspective’, Journal of Social Issues, vol. 58, no. 3, pp. 447-467
Rhoades, L & Eisenberger, R 2002 ‘Perceived Organizational Support: A Review of the Literature’, Journal of Applied Psychology, vol. 87, no. 4, pp. 698-714
283
The Core Volunteer Leanne McCormick, Monash University
Rousseau, D 1989 ‘Psychological and implied contracts in organizations’, Employee Responsibilities and Rights Journal, vol. 2, no. 2, pp. 121-39
Rousseau, D 1995 Psychological Contracts in Organizations. Understanding Written and Unwritten Agreements, Sage Publications, Thousand Oaks, CA
Rousseau, D Ho, V & Greenberg, J 2006 ‘I’Deals: Idiosyncratic Terms in Employment Relationships’, Academy of Management Review, vol. 31, no. 4, pp. 977-994
Rousseau, D & Wade-Benzoni, K 1994 ‘Linking Strategy and Human Resource Practices: How Employee and Customer Contracts Are Created’, Human Resource Management, vol. 33, iss. 3, pp. 463-489
Schneider, B & Bowen, D 1995, Winning the service game, Harvard Business School Press, Cambridge, MA
Shin, S & Kleiner, B 2003 ‘How to manage unpaid volunteers in organizations’, Management Research News, vol. 26, no. 2-4, pp. 63-72
Starnes, B 2007 ‘An analysis of psychological contracts in volunteerism and the effect of contract breach on volunteer contributions to the organization’, The International Journal of Volunteer Administration, vol. 14, no. 3, pp. 31–41 Stephen, R Dawley, D & Stephens, R 2004 ‘Commitment on the Board: A Model of Volunteer Directors’ Levels of Organisational Commitment and Self-Reported Performance’, Journal of Managerial Issues, vol. 16, no. 4, pp. 483-504
Tabachnick, B & Fidell, L 2007 Using Multivariate Statistics, Pearson, Boston, MA, Ch. 4 & 5
Thompson, J & Bunderson, J 2003 ‘Violations of Principle: Ideological Currency in the Psychological Currency’, Academy of Management Review, vol. 28, no. 4, pp. 571-586
Tidwell, M 2005 ‘A Social Identity Model of Prosocial Behaviours Within Nonprofit Organisations’, Nonprofit Management & Leadership, vol. 15, no. 4, pp. 449-468
Van Vuuren, M De Jong, M & Seydel, E 2008 ‘Commitment with or without a stick of paid work: comparison of paid and unpaid workers in a nonprofit organisation’, European Journal of Work and Organisational Psychology, vol. 17, no. 3, pp. 315-326
Vantilborgh, T Bidee, J Pepermans, J Huybrechts, G & Jegers, M 2011 ‘A New Deal for NPO Governance and Management: Implications for Volunteers Using Psychological Contract Theory’, Voluntas, vol. 22, pp. 639-657
Wymer, W & Starnes, B 2001 ‘Conceptual Foundations and Practical Guidelines for Recruiting Volunteers to Serve in Local Nonprofit Organisations: Part 1’, Journal of Nonprofit & Public Sector Marketing, vol. 9, no. 1/2, pp. 63-96
284
Individual and community resilience to natural disasters: a comparison of bushfire and drought events in Victoria
Dr Joanne Millar
Senior Lecturer, Environmental Planning and Policy
Charles Sturt University, Albury, NSW, Australia
Dr Helen Boon
Senior Lecturer, School of Education and The Cairns Institute
James Cook University, Townsville, Australia
Professor Bob Stevenson
The Cairns Institute and School of Education,
James Cook University, Cairns, Australia
Dr Alison Cottrell and Associate Professor David King
Centre for Disaster Studies
James Cook University, Townsville, Australia
Anne Stelling and Maureen Rogers
Research officers, Charles Sturt University, Albury, NSW, Australia
Paper presented at EARTH: FIRE AND RAIN Australian & New Zealand Disaster and Emergency Management Conference Brisbane – 16 – 18, April 2012
285
Individual and community resilience to natural disasters: a comparison of bushfire and drought events in Victoria Abstract This paper compares individual and community resilience to bushfire and drought events in Victoria. Qualitative research was conducted using focus groups and key informant interviews in two Victorian case study areas in 2010. A totaI of 68 interviewees were asked about their experiences of each event, including those most or least affected, the effectiveness of support services and whether communities were better prepared for future events. Bronfenbrenner’s conceptual framework of influences was used as the theoretical lens with which to analyse participant responses. The bushfires generated individual and community resilience whereas the drought tested individual resilience but did not appear to build community resilience. We conclude that there is a need to build community networks before and during times of drought, and to focus on the well being of town residents not just farmers. In bushfire prone areas, newcomers need to be identified and offered support before, during and after a fire event. Keywords bushfire, community, disaster, drought, resilience, women Introduction This paper describes research findings into community experiences of Victorian drought and bushfires as components of a project funded by the Commonwealth Department of Climate Change and Energy Efficiency, led by James Cook University. The research aims to investigate individual and community beliefs, behaviours and policies that support community resilience to disaster events. Case studies of cyclone and flood events in Queensland were also researched (see Boon et al. 2012; Stevenson et al, 2012 in these proceedings). Resilience has been variously defined depending on the level of analysis, for example, individual, community or ecological system. Most definitions incorporate a stressor and the notion of adaptation and return to pre-stressor levels of functioning (Norris et al. 2008).Because climate change impacts involve both rapid and slower onset stressors, the resilience definition adopted here is: ‘‘a process linking a set of adaptive capacities to a positive trajectory of functioning and adaptation after a disturbance’’ (Norris et al. 2008: 130). This definition can be applied to either individual or community resilience. Conceptually, the simplest and most common level of investigation is individual resilience. Most studies indicate that individual resilience is partly a trait and partly a dynamic process and is promoted by two groups of generic factors: 1) personal attributes such as social competence, problem solving, autonomy, self efficacy and sense of future or purpose and 2) contextual, environmental influences such as peers, family, work, school and local community (Boon et al. 2012). In contrast to individual resilience, community resilience is described differently in various studies and defined more loosely. Adger (2000) defines social or community resilience as the ability of communities to withstand external shocks to their social infrastructure.
286
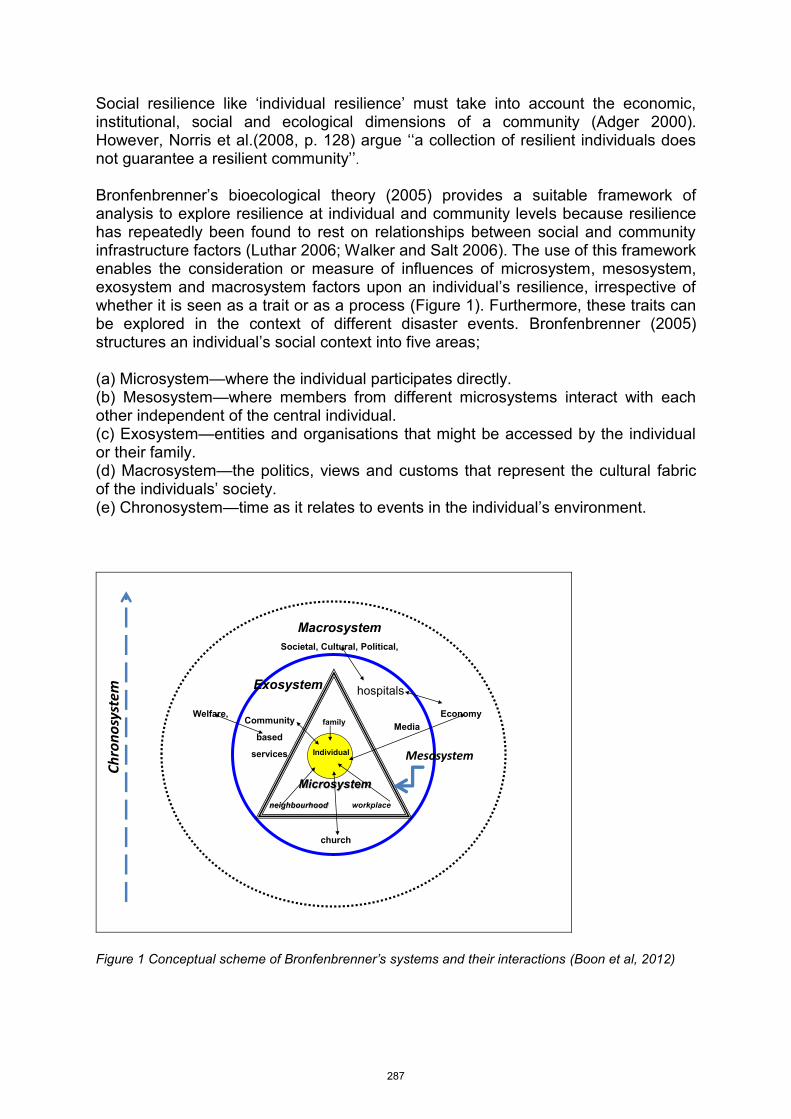
Social resilience like ‘individual resilience’ must take into account the economic, institutional, social and ecological dimensions of a community (Adger 2000). However, Norris et al.(2008, p. 128) argue ‘‘a collection of resilient individuals does not guarantee a resilient community’’. Bronfenbrenner’s bioecological theory (2005) provides a suitable framework of analysis to explore resilience at individual and community levels because resilience has repeatedly been found to rest on relationships between social and community infrastructure factors (Luthar 2006; Walker and Salt 2006). The use of this framework enables the consideration or measure of influences of microsystem, mesosystem, exosystem and macrosystem factors upon an individual’s resilience, irrespective of whether it is seen as a trait or as a process (Figure 1). Furthermore, these traits can be explored in the context of different disaster events. Bronfenbrenner (2005) structures an individual’s social context into five areas;
(a) Microsystem—where the individual participates directly. (b) Mesosystem—where members from different microsystems interact with each other independent of the central individual. (c) Exosystem—entities and organisations that might be accessed by the individual or their family. (d) Macrosystem—the politics, views and customs that represent the cultural fabric of the individuals’ society. (e) Chronosystem—time as it relates to events in the individual’s environment.
MacrosystemSocietal, Cultural, Political,
Welfare, Economy
Individual
Exosystem
Community
based
services
Microsystem
family
neighbourhood workplace
Media
church
hospitals
Chronosystem
Mesosystem
Figure 1 Conceptual scheme of Bronfenbrenner’s systems and their interactions (Boon et al, 2012)
287
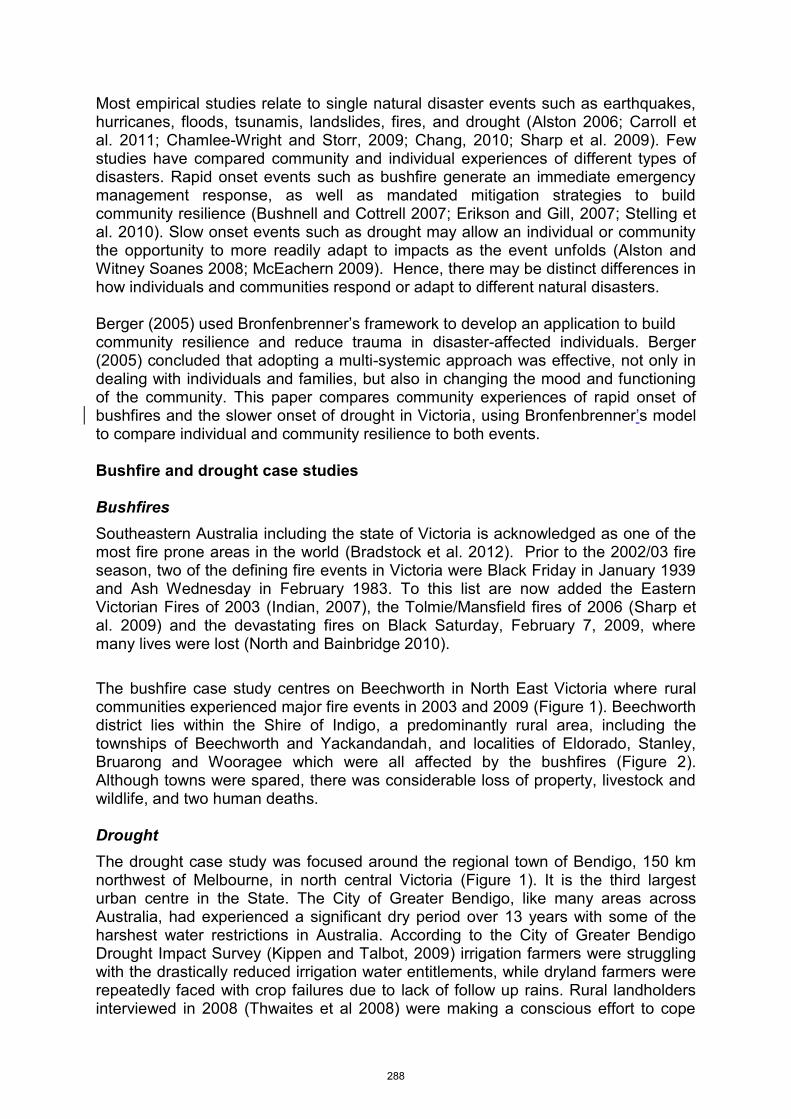
Most empirical studies relate to single natural disaster events such as earthquakes, hurricanes, floods, tsunamis, landslides, fires, and drought (Alston 2006; Carroll et al. 2011; Chamlee-Wright and Storr, 2009; Chang, 2010; Sharp et al. 2009). Few studies have compared community and individual experiences of different types of disasters. Rapid onset events such as bushfire generate an immediate emergency management response, as well as mandated mitigation strategies to build community resilience (Bushnell and Cottrell 2007; Erikson and Gill, 2007; Stelling et al. 2010). Slow onset events such as drought may allow an individual or community the opportunity to more readily adapt to impacts as the event unfolds (Alston and Witney Soanes 2008; McEachern 2009). Hence, there may be distinct differences in how individuals and communities respond or adapt to different natural disasters. Berger (2005) used Bronfenbrenner’s framework to develop an application to build community resilience and reduce trauma in disaster-affected individuals. Berger (2005) concluded that adopting a multi-systemic approach was effective, not only in dealing with individuals and families, but also in changing the mood and functioning of the community. This paper compares community experiences of rapid onset of bushfires and the slower onset of drought in Victoria, using Bronfenbrenner’s model to compare individual and community resilience to both events. Bushfire and drought case studies Bushfires Southeastern Australia including the state of Victoria is acknowledged as one of the most fire prone areas in the world (Bradstock et al. 2012). Prior to the 2002/03 fire season, two of the defining fire events in Victoria were Black Friday in January 1939 and Ash Wednesday in February 1983. To this list are now added the Eastern Victorian Fires of 2003 (Indian, 2007), the Tolmie/Mansfield fires of 2006 (Sharp et al. 2009) and the devastating fires on Black Saturday, February 7, 2009, where many lives were lost (North and Bainbridge 2010). The bushfire case study centres on Beechworth in North East Victoria where rural communities experienced major fire events in 2003 and 2009 (Figure 1). Beechworth district lies within the Shire of Indigo, a predominantly rural area, including the townships of Beechworth and Yackandandah, and localities of Eldorado, Stanley, Bruarong and Wooragee which were all affected by the bushfires (Figure 2). Although towns were spared, there was considerable loss of property, livestock and wildlife, and two human deaths. Drought The drought case study was focused around the regional town of Bendigo, 150 km northwest of Melbourne, in north central Victoria (Figure 1). It is the third largest urban centre in the State. The City of Greater Bendigo, like many areas across Australia, had experienced a significant dry period over 13 years with some of the harshest water restrictions in Australia. According to the City of Greater Bendigo Drought Impact Survey (Kippen and Talbot, 2009) irrigation farmers were struggling with the drastically reduced irrigation water entitlements, while dryland farmers were repeatedly faced with crop failures due to lack of follow up rains. Rural landholders interviewed in 2008 (Thwaites et al 2008) were making a conscious effort to cope
288
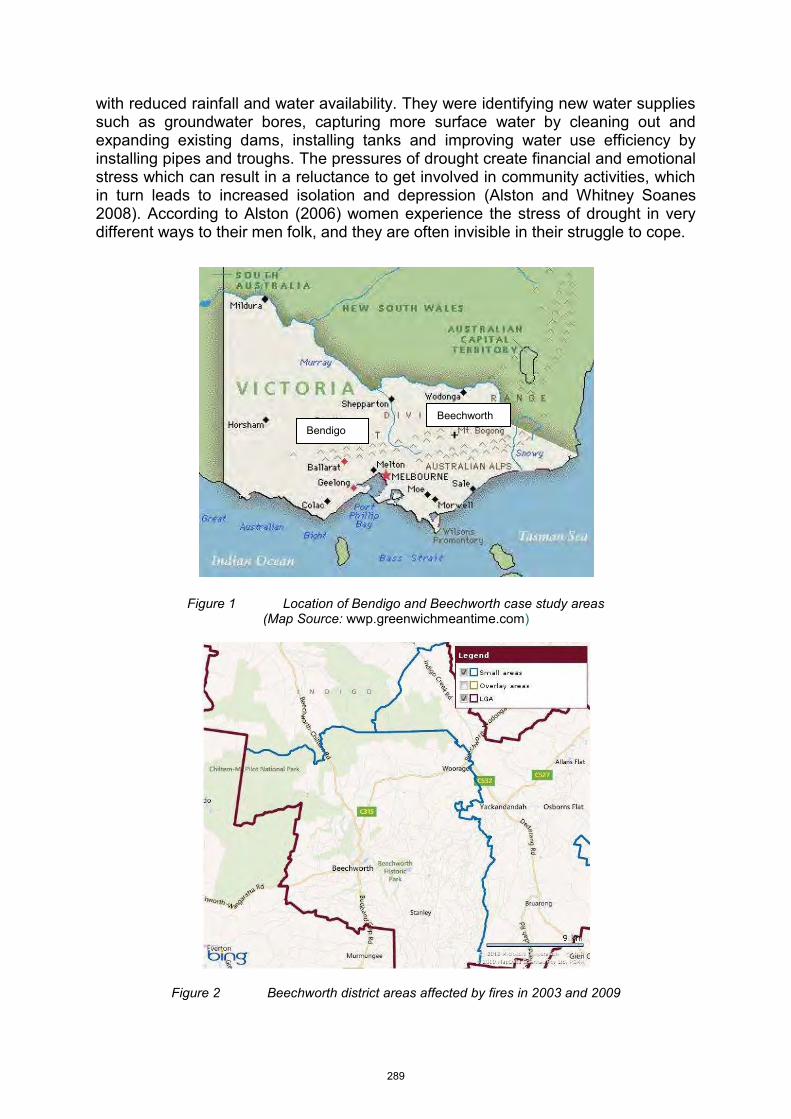
with reduced rainfall and water availability. They were identifying new water supplies such as groundwater bores, capturing more surface water by cleaning out and expanding existing dams, installing tanks and improving water use efficiency by installing pipes and troughs. The pressures of drought create financial and emotional stress which can result in a reluctance to get involved in community activities, which in turn leads to increased isolation and depression (Alston and Whitney Soanes 2008). According to Alston (2006) women experience the stress of drought in very different ways to their men folk, and they are often invisible in their struggle to cope.
Figure 1 Location of Bendigo and Beechworth case study areas (Map Source: wwp.greenwichmeantime.com)
Figure 2 Beechworth district areas affected by fires in 2003 and 2009
Beechworth Bendigo
289
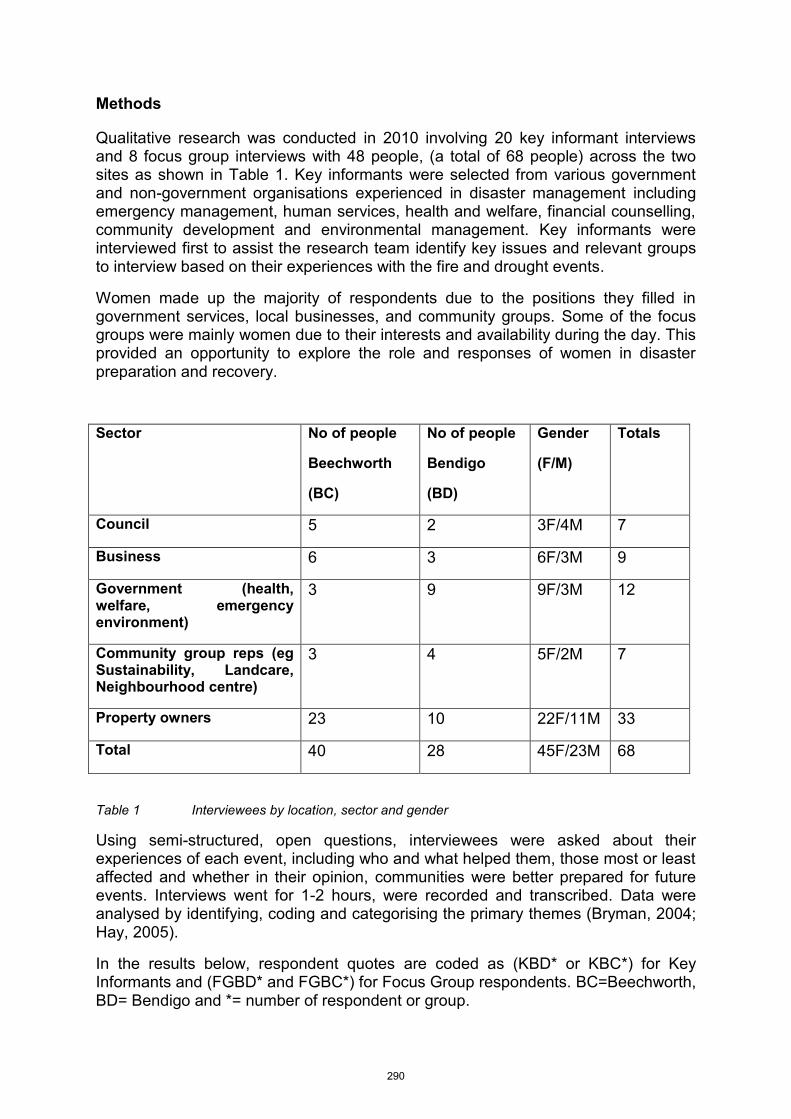
Methods
Qualitative research was conducted in 2010 involving 20 key informant interviews and 8 focus group interviews with 48 people, (a total of 68 people) across the two sites as shown in Table 1. Key informants were selected from various government and non-government organisations experienced in disaster management including emergency management, human services, health and welfare, financial counselling, community development and environmental management. Key informants were interviewed first to assist the research team identify key issues and relevant groups to interview based on their experiences with the fire and drought events.
Women made up the majority of respondents due to the positions they filled in government services, local businesses, and community groups. Some of the focus groups were mainly women due to their interests and availability during the day. This provided an opportunity to explore the role and responses of women in disaster preparation and recovery.
Sector No of people
Beechworth
(BC)
No of people
Bendigo
(BD)
Gender
(F/M)
Totals
Council 5 2 3F/4M 7
Business 6 3 6F/3M 9
Government (health, welfare, emergency environment)
3 9 9F/3M 12
Community group reps (eg Sustainability, Landcare, Neighbourhood centre)
3 4 5F/2M 7
Property owners 23 10 22F/11M 33
Total 40 28 45F/23M 68
Table 1 Interviewees by location, sector and gender
Using semi-structured, open questions, interviewees were asked about their experiences of each event, including who and what helped them, those most or least affected and whether in their opinion, communities were better prepared for future events. Interviews went for 1-2 hours, were recorded and transcribed. Data were analysed by identifying, coding and categorising the primary themes (Bryman, 2004; Hay, 2005).
In the results below, respondent quotes are coded as (KBD* or KBC*) for Key Informants and (FGBD* and FGBC*) for Focus Group respondents. BC=Beechworth, BD= Bendigo and *= number of respondent or group.
290
Results
The fire events built individual and community resilience at all levels
The qualitative findings showed that over the two fire events of 2003 and 2009, individuals and communities had built resilience to coping with bushfires at all levels (micro, meso, exo and macrosystems). People’s experiences of the bushfires around Beechworth generated a consensus that individuals and families (the microsystem) need to be self sufficient to stay and fight fires. Even if there is plenty of support at the exosystem level from fire brigades, police, health services or insurance companies, the view was that one could not rely on them to be there at crucial moments. This meant having the capacity to be self sufficient when utilities fail, with reliable equipment to defend properties. People spoke of having battery operated radios, old style telephones, good fire pumps and water supplies, tough clothing and boots. Taking preventative action, having prior warning of the fire, and time to clean up and move animals were all part of tackling the fire with confidence. “I think it’s better to be self reliant. You can trust yourself, you know where things are. You know how to deal with all those things...” (FGBC2) “...if you’re not experienced enough or capable enough, I mean in our case with my husband’s state of health we would have been a potential burden. They would feel they would have to come and try and save us, whereas they could let the house go...” (FGBC1) Prior experience with fires was seen as an important factor in having individual resilience to such events at the microsystem level. Knowing what to expect gave people a sense of confidence and allowed them to relax somewhat even during the event; “We knew we were fine. We’ve been through it before and know what to expect, what to do…” (KBCI2) “The people who coped best were the people who have done the preparation to be aware of what may happen and can take some action to alleviate the situation. The people that I found have been the worst affected emotionally hadn’t had experience with fires before and had no preparation.” (FGBC4) Long term farmers were described by most respondents as resilient due to their prior experience and practical skills. According to some respondents, farmers see fire as a part of life, something that comes and goes, as do floods, droughts and storms. They are used to looking after themselves and they ‘just get on with it’. “I grew up on a farm and you know, you were told; keep an eye out on those days, and don’t leave the property. It’s a sort of responsibility; for yourself, your family, your community, your livestock. We had a different way of thinking. We took it very seriously. So, you grew up and it was a part of your life.” (KBCI8) Those seen as most vulnerable to fire events were newcomers, the elderly, children and those in the direct front of fighting fires. New landholders from urban areas were
291
thought of as lacking rural knowledge and skills, and being needier. “...they have a different way of thinking – more likely to be expecting someone to come and help than the farmers (KBCI6)” Community services interviewees also identified those people who were unable to process their experiences as less resilient; “... we see a lot of people where once the adrenalin rush is over they start to move into that second stage of coping, which is quite stressful. The first stage is just ‘got to get something done’, whatever you’ve got to do. Once you actually get out of that, it’s got something to do with the long term focus on recovery. Some people stay in a very heightened sort of mind set, so their anxiety and everything stays quite heightened, and I think that those people don’t start coping until that stops... (FGBC4) Many interviewees felt that the help and support of family, friends and neighbours (micro and meso system) during the fire event was crucial. Not only did physical help make it possible to save their homes and farms from burning, but the presence of others gave them opportunities to sleep, eat and relax during the days of watching and waiting. “...we had some friends and (friend’s) dad and uncle. They were fighting the fire and I was back at the house with the girls filling their fire trucks and making sure everything was right at the house...” (FGBC2) Community support (emotional and physical) was vital to recovery of individuals and small towns (meso and exosystems). There was agreement that communities had strengthened as a result of fires, with better communication, improved response and risk reduction strategies, and a stronger community spirit. “Personality wise, friendship wise, even people that you’ve hardly met and talked together, we’re closer because we’ve got things to talk about and a commonality. I think that’s made us stronger...” (FGBC3) Phone calls and messages of goodwill from outside the community (the exosystem) were also greatly appreciated, giving people a psychological boost and allowing them to counter some of the negative media affecting the region. “... there were people ringing and checking that Beechworth was okay and that I was okay, and that was very humbling... It was also a good opportunity for me because being in the Chamber (of Commerce) and the Chamber is very involved in getting the message out to the community that Beechworth - to the tourists in Melbourne - so I’m using these networks to say ‘Please spread the news that we’re okay’,...” (FGBC3) Many participants had attended some form of state government funded Fire Recovery activity, such as community barbeques, concerts or trips away (exo and macrosystem influences). Although the subsequent spending of the Bushfire Recovery funding was severely criticised, most people expressed their appreciation of the activities which brought people together, encouraging them to talk and to share an enjoyable experience.
292
“I went on one of those weekends down to Lorne and it was lovely... it was three hundred women and I enjoyed it very much, and it was very sobering for me because everybody I spoke to had lost their home...” (FGBC2) Service provision at the macro and exosystem levels following the most recent 2009 fires was seen as having improved considerably compared to the 2003 fire event. The 2009 fires and the Bushfires Royal Commission resulted in many legislated changes to planning and operations from CFA to local, state and federal government levels. One example given was the Country Fire Authority realigning its management boundaries to coincide with local government boundaries for smoother operations. The creation of Emergency Management Teams including police and emergency services, local council and state agencies such as the Department of Human Services, means that responses are now co-ordinated across agencies, with responsibilities clearly defined. One particular tool that highlights the influence of macro and exosystems on individual and community resilience is the Vulnerable Persons Register. It provides support for vulnerable people, their carers and families to plan and prepare for fire, and enables a rapid response when emergency action such as evacuation is necessary. “...it’s a strategic thing, also if there’s a bad weather week they will be contacted by an appropriate person for the council or whatever and say ‘Have you enacted your plan?’ And if they haven’t got a plan I think the program was to contact the carer or contact the relatives and say ‘We haven’t got a plan. This is your mum and dad, or whatever, do you think we need something?’.” (FGBC4) Respondents were unanimous that most individuals and communities affected by the fires are now better prepared to face future fire events. Individuals and households have upgraded their equipment, their management systems and their fire plans as a result of their fire experiences. “... we’ve put in a wall phone now, we’ve put another tank in for the bore water and we’ve got them both full, we’ve got generators. We’ve got generators to make power in the house so we can have some light - we had nothing. We’ve put sprinklers on the roof all as a result of this...” (FGBC1) The 2009 Black Saturday fires and the Bushfires Royal Commission had resulted in significant improvements to community infrastructure such as fire refuges and neighbourhood safer places, the equipment, operation and management of the CFA, and communications capacity. Community members lobbied successfully for improvements to telecommunications infrastructure, in particular the new Stanley communications tower. “We’re better prepared, like to spend more money on the infrastructure of the CFA. And the communications people spent money on phones to improve those... I think we’re better prepared because the ABC and the communication people are working on the shortcomings...” (FGBC3)
293
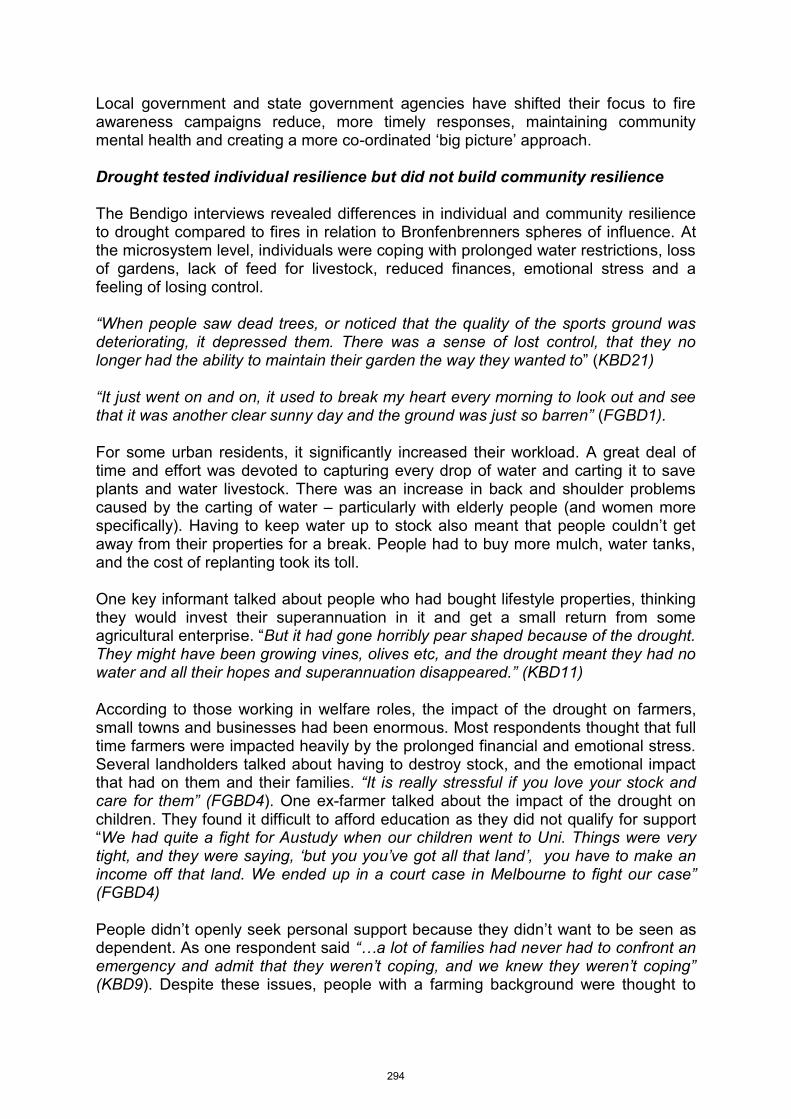
Local government and state government agencies have shifted their focus to fire awareness campaigns reduce, more timely responses, maintaining community mental health and creating a more co-ordinated ‘big picture’ approach. Drought tested individual resilience but did not build community resilience The Bendigo interviews revealed differences in individual and community resilience to drought compared to fires in relation to Bronfenbrenners spheres of influence. At the microsystem level, individuals were coping with prolonged water restrictions, loss of gardens, lack of feed for livestock, reduced finances, emotional stress and a feeling of losing control. “When people saw dead trees, or noticed that the quality of the sports ground was deteriorating, it depressed them. There was a sense of lost control, that they no longer had the ability to maintain their garden the way they wanted to” (KBD21) “It just went on and on, it used to break my heart every morning to look out and see that it was another clear sunny day and the ground was just so barren” (FGBD1). For some urban residents, it significantly increased their workload. A great deal of time and effort was devoted to capturing every drop of water and carting it to save plants and water livestock. There was an increase in back and shoulder problems caused by the carting of water – particularly with elderly people (and women more specifically). Having to keep water up to stock also meant that people couldn’t get away from their properties for a break. People had to buy more mulch, water tanks, and the cost of replanting took its toll. One key informant talked about people who had bought lifestyle properties, thinking they would invest their superannuation in it and get a small return from some agricultural enterprise. “But it had gone horribly pear shaped because of the drought. They might have been growing vines, olives etc, and the drought meant they had no water and all their hopes and superannuation disappeared.” (KBD11) According to those working in welfare roles, the impact of the drought on farmers, small towns and businesses had been enormous. Most respondents thought that full time farmers were impacted heavily by the prolonged financial and emotional stress. Several landholders talked about having to destroy stock, and the emotional impact that had on them and their families. “It is really stressful if you love your stock and care for them” (FGBD4). One ex-farmer talked about the impact of the drought on children. They found it difficult to afford education as they did not qualify for support “We had quite a fight for Austudy when our children went to Uni. Things were very tight, and they were saying, ‘but you you’ve got all that land’, you have to make an income off that land. We ended up in a court case in Melbourne to fight our case” (FGBD4) People didn’t openly seek personal support because they didn’t want to be seen as dependent. As one respondent said “…a lot of families had never had to confront an emergency and admit that they weren’t coping, and we knew they weren’t coping” (KBD9). Despite these issues, people with a farming background were thought to
294
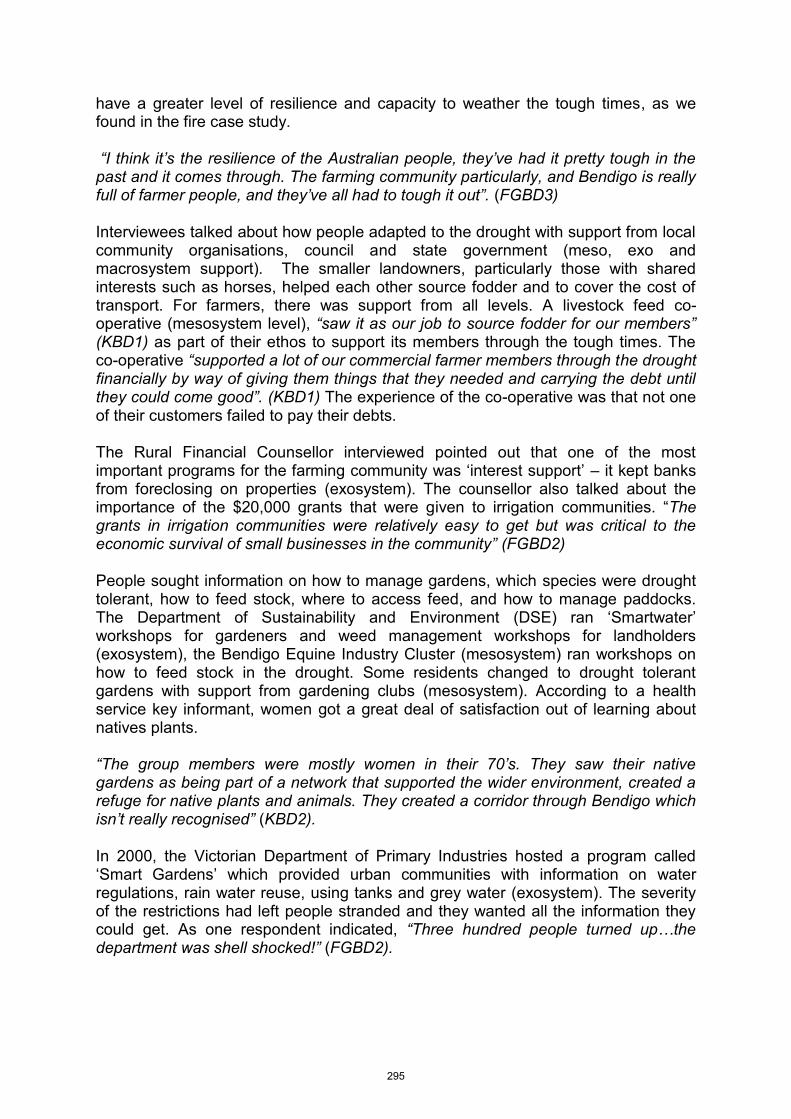
have a greater level of resilience and capacity to weather the tough times, as we found in the fire case study. “I think it’s the resilience of the Australian people, they’ve had it pretty tough in the past and it comes through. The farming community particularly, and Bendigo is really full of farmer people, and they’ve all had to tough it out”. (FGBD3) Interviewees talked about how people adapted to the drought with support from local community organisations, council and state government (meso, exo and macrosystem support). The smaller landowners, particularly those with shared interests such as horses, helped each other source fodder and to cover the cost of transport. For farmers, there was support from all levels. A livestock feed co-operative (mesosystem level), “saw it as our job to source fodder for our members” (KBD1) as part of their ethos to support its members through the tough times. The co-operative “supported a lot of our commercial farmer members through the drought financially by way of giving them things that they needed and carrying the debt until they could come good”. (KBD1) The experience of the co-operative was that not one of their customers failed to pay their debts. The Rural Financial Counsellor interviewed pointed out that one of the most important programs for the farming community was ‘interest support’ – it kept banks from foreclosing on properties (exosystem). The counsellor also talked about the importance of the $20,000 grants that were given to irrigation communities. “The grants in irrigation communities were relatively easy to get but was critical to the economic survival of small businesses in the community” (FGBD2) People sought information on how to manage gardens, which species were drought tolerant, how to feed stock, where to access feed, and how to manage paddocks. The Department of Sustainability and Environment (DSE) ran ‘Smartwater’ workshops for gardeners and weed management workshops for landholders (exosystem), the Bendigo Equine Industry Cluster (mesosystem) ran workshops on how to feed stock in the drought. Some residents changed to drought tolerant gardens with support from gardening clubs (mesosystem). According to a health service key informant, women got a great deal of satisfaction out of learning about natives plants. “The group members were mostly women in their 70’s. They saw their native gardens as being part of a network that supported the wider environment, created a refuge for native plants and animals. They created a corridor through Bendigo which isn’t really recognised” (KBD2). In 2000, the Victorian Department of Primary Industries hosted a program called ‘Smart Gardens’ which provided urban communities with information on water regulations, rain water reuse, using tanks and grey water (exosystem). The severity of the restrictions had left people stranded and they wanted all the information they could get. As one respondent indicated, “Three hundred people turned up…the department was shell shocked!” (FGBD2).
295
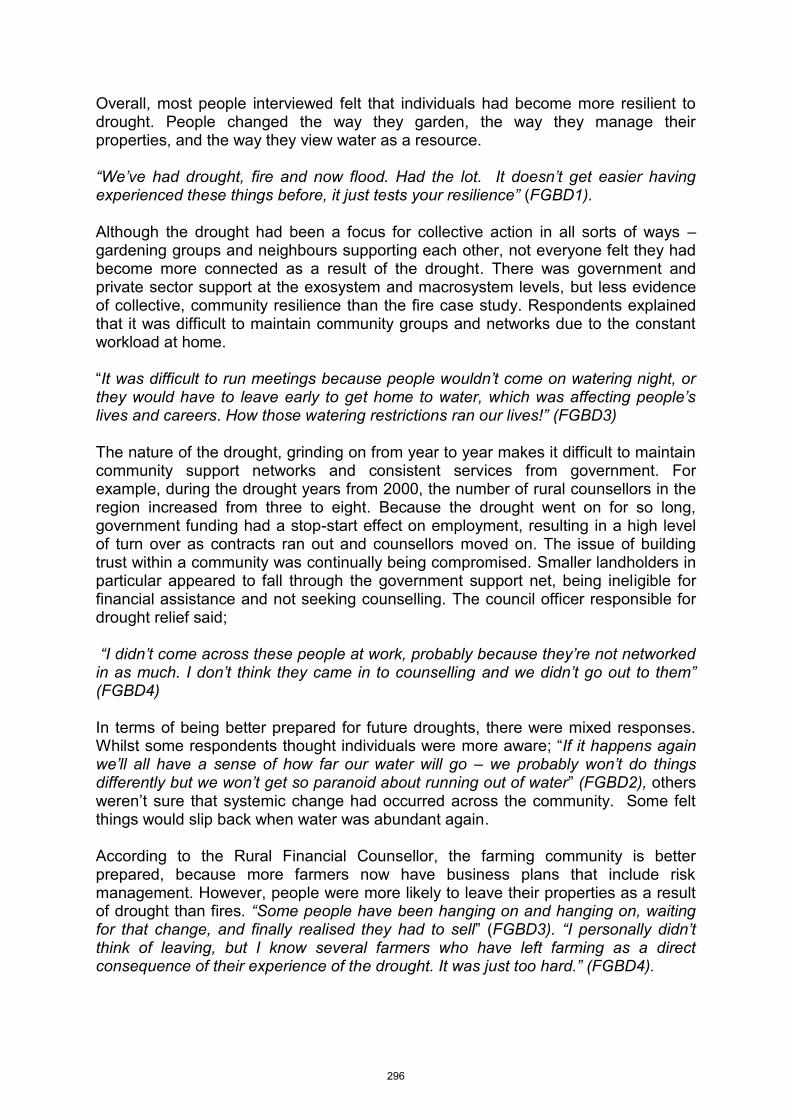
Overall, most people interviewed felt that individuals had become more resilient to drought. People changed the way they garden, the way they manage their properties, and the way they view water as a resource. “We’ve had drought, fire and now flood. Had the lot. It doesn’t get easier having experienced these things before, it just tests your resilience” (FGBD1). Although the drought had been a focus for collective action in all sorts of ways – gardening groups and neighbours supporting each other, not everyone felt they had become more connected as a result of the drought. There was government and private sector support at the exosystem and macrosystem levels, but less evidence of collective, community resilience than the fire case study. Respondents explained that it was difficult to maintain community groups and networks due to the constant workload at home. “It was difficult to run meetings because people wouldn’t come on watering night, or they would have to leave early to get home to water, which was affecting people’s lives and careers. How those watering restrictions ran our lives!” (FGBD3) The nature of the drought, grinding on from year to year makes it difficult to maintain community support networks and consistent services from government. For example, during the drought years from 2000, the number of rural counsellors in the region increased from three to eight. Because the drought went on for so long, government funding had a stop-start effect on employment, resulting in a high level of turn over as contracts ran out and counsellors moved on. The issue of building trust within a community was continually being compromised. Smaller landholders in particular appeared to fall through the government support net, being ineligible for financial assistance and not seeking counselling. The council officer responsible for drought relief said; “I didn’t come across these people at work, probably because they’re not networked in as much. I don’t think they came in to counselling and we didn’t go out to them” (FGBD4) In terms of being better prepared for future droughts, there were mixed responses. Whilst some respondents thought individuals were more aware; “If it happens again we’ll all have a sense of how far our water will go – we probably won’t do things differently but we won’t get so paranoid about running out of water” (FGBD2), others weren’t sure that systemic change had occurred across the community. Some felt things would slip back when water was abundant again. According to the Rural Financial Counsellor, the farming community is better prepared, because more farmers now have business plans that include risk management. However, people were more likely to leave their properties as a result of drought than fires. “Some people have been hanging on and hanging on, waiting for that change, and finally realised they had to sell” (FGBD3). “I personally didn’t think of leaving, but I know several farmers who have left farming as a direct consequence of their experience of the drought. It was just too hard.” (FGBD4).
296
Conclusions
Our research has shown that fire events can quickly generate community cohesion which supports resilience during and shortly after the natural disaster. The influence of support services at the meso and exosystem levels is crucial to enabling local communities to respond and recover. Carroll et al. (2011) and Sharp et al (2009) also found that fires often act as a ‘galvanizing’ influence on communities. However, these studies also reported social conflict and loss of trust arising from dissatisfaction with agency decisions and actions, some of which persisted several years after the fire event. Boon et al. (2012b) also report community criticisms of emergency organisations that did not consult with local people during the Ingham floods in 2006.
Although this was not significant in the Beechworth case study, there were remnants of disagreements with approaches taken in the 2003 fires. The improvements made at the exosystem level in emergency management response to the 2009 fires were highly appreciated by local communities and provided a stark contrast to what happened in 2003. This change gave people a feeling of confidence in their ability to manage future fire events.
Individual resilience to bushfires appears to build more slowly over time as people learn how to prepare, respond and recover from fires. At the micro and mesosystem levels, support from friends and family are paramount to enable individuals to cope with major fires. This was also the case with the drought case study and cyclone case study (Stevenson et al. 2012). Conversely, newcomers who lack close support networks were seen to be more vulnerable and less resilient to both fires and drought. In bushfire prone areas, newcomers need to be identified and offered support before, during and after a fire event. The drought severely tested individual resilience over a long period of time but did not appear to build community resilience despite numerous government support programs, conferring with Norris (2008) that individual resilience does not necessarily build community resilience. We conclude that although slow onset disasters like drought allow more time to adapt practices, people are less likely to seek help and join community networks due to fatigue and potential depression from the relentless conditions. Hence, efforts need to be made to build and maintain community networks before and during times of drought, and to focus on the well being of town residents not just farmers.
297
References
Adger WN (2000) Social and ecological resilience; are they related? Progressive Human Geography 24(3):347–364.
Alston, M. (2006) “I’d Like to Just Walk Out of Here”: Australian Women’s Experience of Drought. Sociologia Ruralis Vol 46:2, p154-170.
Alston, M. and Witney-Soanes, K., (2008) Social impacts of drought and declining water availability in the Murray Darling Basin. Institute of Land, Water and Society, Charles Sturt University, Wagga, NSW.
Berger R (2005) An ecological community-based approach for dealing with traumatic stress: a case of terror attack on a Kibbutz. Journal of Aggressive Maltreatment Trauma 10(1–2):513–526.
Boon, H..J., Cottrell, A., King, D., Stevenson, R.B. and Millar, J. (2012a) ‘Bronfenbrenner’s bioecological theory for modelling community resilience to natural disasters’, Natural Hazards, vol.60, pp.381–408.
Boon, H.J., Clark, B., Cottrell, A., Millar, J., Stevenson, R. King, D. (2012b) Lifestyle ‘at risk’ ? The case of Ingham. Proceedings of the Australian & New Zealand Disaster and Emergency Management Conference Brisbane,
Bradstock, R. A., Gill, M. and Williams, R.J. (eds) (2012) Flammable Australia : fire regimes, biodiversity and ecosystems in a changing world. CSIRO Publishing, Collingwood, Victoria, Australia.
Bronfenbrenner, U. (2005) Making human beings human: bioecological perspectives on human development. Sage, Thousand Oaks
Bryman, A. (2004) Social research methods (2nd ed.). Oxford: Oxford University Press, UK.
Bushnell, S. and Cottrell, A. (2007) Increasing community resilience to bushfire — implications from a north Queensland community case study. The Australian Journal of Emergency Management, Vol. 22 No. 2 pp. 3-9.
Carroll, M. S., Paveglio, T., Jakes, P.J., Higgins, L.L. (2011) Non-tribal community recovery from wildfire five years later: The case of the Rodieo-Chediski Fire. Society and Natural Resources, 24:672-687.
Chamlee-Wright, E. and Storr, VH., 2009, “There’s No Place Like New Orleans’: Sense Of Place And Community Recovery In The Ninth Ward After Hurricane Katrina”, Journal of Urban Affairs, vol.31, no.5, pp.615-634.
Chang, K. 2010, ‘Community cohesion after a natural disaster: insights from a Carlisle flood’, Disasters, Vol. 34, no.2, pp. 289−302.
Cottrell, A. 2005 Communities and bushfire hazard in Australia: More questions than answers. Environmental Hazards, 6, 109-114. ISSN: 1747 7891.
Eriksen, C. and Gill, N., (2010) Bushfire and everyday life: examining the awareness-action ‘gap’ in changing rural landscapes. Geoforum, 41, 814–825.
Hay, I. (ed) (2005) Qualitative Research Methods in Human Geography (2nd Edition), Oxford University Press.
298
Indian, J. (2007) The Use of Local Knowledge in the Australian High Country during the 2003 Bushfires . Australian Journal of Emergency Management, Vol.22(4), p.27-33
Kippen, S. and Talbot, L. (2009) Report of the drought impact survey. City of Greater Bendigo.
Luthar S.S.(2006) Resilience in development: a synthesis of research across five decades. In: Cicchetti D, Cohen DJ (eds) Developmental psychopathology: risk, disorder, and adaptation, vol 3, 2nd edn. Wiley, Hoboken, NJ, USA, pp 739–795.
McEachern, S. (2009). How do communities respond to reduced water supply? The relationship between climate change and social change in regional Victoria. In Martin, J., Rogers,M. Winter, C. Climate change in Regional Australia: Social learning and adaptation. VURRN press, Ballarat, Australia.
Millar, J. (2010) Land use planning and demographic change: mechanisms for designing rural landscapes and communities. Chapter 8 in Luck, G., Black R and Race D (eds) Demographic change in rural Australia: implications for society and environment. Springer, USA. Pp. 86-100
Nelson DR, Adger WN, Brown K (2007) Adaptation to environmental change: contributions of a resilience framework. Annual Review of Environmental Resources 32:395–419
Norris FH, Stevens SP, Pfefferbaum B, Wyche KF, Pfefferbaum RL (2008) Community resilience as a metaphor, theory, set of capacities, and strategy for disaster readiness. American Journal of Community Psychology 41:127–150
North, L. and Bainbridge, J. (2010) The Victorian bushfires and extreme weather events: media coverage, crisis and communication. Media International Australia incorporating Culture and Policy, Issue 137, p.67(4).
Sharp, E., Thwaites, R., Millar, J. and Curtis, A. (2009) Factors Affecting Community-Agency Trust in Bushfire Management: Community Member Perspectives. Report No. 51. Institute of Land, Water and Society, Charles Sturt University, Albury, NSW.
Stelling, A, Millar, J., Boon, H., Cottrell, A., King, D. Stevenson, B. (2011) Recovery from Natural Disasters: Community experiences of bushfires in North East Victoria 2003 to 2009 ILWS Report No. 65. Charles Sturt University, Albury.
Stevenson, B., Boon, H.J., Clark, B., Cottrell, A. King, D. Millar, J. (2012) Recovery from disaster: A case study of individual and community resilience in the face of cyclones. Proceedings of the Australian & New Zealand Disaster and Emergency Management Conference Brisbane
Thwaites, R., Curtis, A., Mazur, N., and Race, D. (2008) Understanding rural landholder responses to climate change. Report No 23 Institute for Land, Water and Society, Charles Sturt University.
Walker B.H, Salt D (2006) Resilience thinking: sustaining ecosystems and people in a changing world. Island Press, Washington
299
Acknowledgements
This work was funded through the National Climate Change Adaptation Research Facility, which is an initiative of, and funded by the Australian Government Department of Climate Change and Energy Efficiency, with additional funding from the Queensland Government, Griffith University, Macquarie University, Queensland University of Technology, James Cook University, The University of Newcastle, Murdoch University, University of Southern Queensland and University of the Sunshine Coast. The role of NCCARF is to lead the research community in a national interdisciplinary effort to generate the information needed by decision-makers in government and in vulnerable sectors and communities to manage the risk of climate change impacts. The views and opinions expressed in this publication not necessarily the views of the Commonwealth, and the Commonwealth does not accept responsibility for any information or advice contained herein.
300
A new way forward: A Community Sector Response Establishing a relationship that is based on capacity, the building of trust, and the security in working together.
Mr Brentyn Parkin, M SocSc (Itl Dev), B.Ed (Primary), B.A (Itl Dev)
Managing Director,
Community Central
www.communitycentral.com.au
Paper presented at EARTH: FIRE AND RAIN Australian & New Zealand Disaster and Emergency Management Conference Brisbane – 16 – 18, April 2012
301
A new way forward: A Community Sector Response Establishing a relationship that is based on capacity, the building of trust, and the security in working together.
Abstract This paper proposes a new way to engage locally with the most vulnerable people through the Community Sector. Importantly, it demonstrates the willingness and capability of the Community Sector to play a central role in responding to community needs in an emergency, and provides practical tools to:
understand the Community Sector, their networks and structures understand the Community Sector resources provide a framework of how the government and the Community Sector can
work together. The most vulnerable people in our community are connected to Community Sector Organisations, Associations and groups who are happy to help, especially in an emergency. Based on extensive consultation across regional Queensland, there is an urgent need to include the Community Sector into the Emergency Management Framework and to develop a strategic and important relationship with the Community Sector. By exploring the Community Action Framework, access to local networks, structures and resources, the new paradigm can be achieved.
Keywords: Community Action Framework, Community Sector participation, social capital, community networks, new emergency management paradigm
Introduction In Australia and New Zealand, federal/state and local governments have spent considerable resources developing community resilience frameworks to support local communities during an emergency. However the Emergency Management Framework1 has failed to engage the Community Sector effectively severely reducing the effectiveness of the community resilience programs and emergency responses. This failure has two serious consequences:
The additional strain on Community Sector resources during an emergency places their vulnerable clients in an even more vulnerable position.
The inefficient use of local community resources places an unnecessary additional burden on local emergency management agencies.
1 The legislated Australian Emergency Management Framework and the Zealand CDEM (National Civil Defence Emergency Management) framework
302
An Inclusive Emergency Management Framework2 that engages the Community Sector takes full advantage of the existing local infrastructure that supports the most vulnerable people in a community. The need to formally include the community sector was raised in more than 30 workshops during the research project (see Attachment 1) across Queensland over two and a half years. It ensures that local responses effectively meet local needs, and enhances an emergency response while minimising the detrimental impact on Community Sector service delivery.
Changes to the current Emergency Management Framework need to be made. It is important to acknowledge that the Community Sector provides the majority of support for vulnerable people in an emergency. Many “organisations within the [Community Sector which includes the] not-for-profit sector provide services to individuals and groups that government and for-profit organisations cannot or will not consider” (Keast, Mandell, Waterhouse, 2011). There is also a broad recognition that a more coordinated public sector/private sector relationship is required (Quarantelli, 2000) to improve communities’ ability to respond in an emergency situation however very little progress has been made. At first glance it may seem like the Community Sector has been engaged in the Emergency Management Framework, with several community organisations actively involved in an emergency response through Memorandums of Understanding (MoU) with government. The MoU outlines agreed upon services that are provided on behalf of government to meet the community expectation. The remaining organisations in the Community Sector have no formal involvement. In recent disasters3 there have been organisations with MoUs to provide emergency services however areas in their organisations not covered by the MoU are disengaged from the Emergency Management Framework. Hence, the broader client group that these organisations assist may find their services are disrupted as the focus of the organisation shifts from their regular operations to providing an emergency response function.
This paper proposes a new way to engage locally with the Community Sector and importantly demonstrates the willingness and capability to play a central role in responding to community needs in an emergency. This paper also provides practical tools to:
understand the Community Sector, their networks and structures understand the Community Sector resources provide a framework of how the government and the Community Sector can work
together. How well do we engage the Community Sector? Ask yourself:
How much time do we spend planning to respond to local disasters? How much of that time is working with the Community Sector? What proportion of that time is spent with actual community organisations,
associations, community groups that know and work with vulnerable people every day?
Local responses to emergencies have a long history. Since the 1930s formal emergency management structures have been emerging within the government. The structures have always engaged individuals as volunteers through a government program such as the State Emergency Service (SES) or Rural Fire Brigade. As my grandfather, a farmer who lived 2 A legislated framework that formally includes the Community Sector 3 In Queensland (2008 Mackay Floods, 2011 Queensland Floods, Cyclone Yasi)
303
through the 1934, 1939 and 1965 Gippsland floods and fires often spoke about our individual responsibility; he said “We knew that we needed to help each other if we were going to protect our property”.4 He knew the limits of what the government could do – and he spoke of his individual responsibility to help himself and his neighbours. The formalisation of the current Emergency Management Framework began in the 1970s and more recently the amendments to the legislative framework provide legal responsibility to local and federal/state government. By subsuming this responsibility critical parts of the Community Sector who would be well-placed to contribute have been disempowered. During times of severe weather events such as cyclones, floods and earthquakes, there is still an expectation that people take personal responsibility however the most vulnerable people experience difficulty in preparing and if necessary, evacuating to a safer location. Most vulnerable people living in the community are in regular contact with Community Sector organisations. Very few organisations have a MoU with local government, and do not have a formal role in the Disaster Management Framework which limits their ability to respond in an effective and coordinated way5. A new way forward – The new Paradigm The new paradigm acknowledges the work of local people and engages individuals through a formal engagement with the Community Sector. The new way forward engages the Community Sector with the support of local government to, where possible, continue to provide support to the most vulnerable people within our community. This new paradigm is only possible by using a common framework that allows an emergency response to use local structures to access community resources. Recent examples demonstrate the need to strengthen the local relationship between the Community Sector and government and formally including the Community Sector into an Inclusive Emergency Management Framework. 2008/2009 Victorian fire season – highlighted and acknowledged the role the Community
Sector played in providing much of the support to vulnerable people prior to, during and throughout the recovery period.6
2011 Queensland floods – highlighted the importance of communication with the Community Sector7 and the significant levels of support the Community Sector provided by responding to the needs of vulnerable people without any direction by government8
2011 Christchurch earthquake - emphasised the role that the Community Sector organisations played and the solutions based approach that they applied to their activities.9
These reports demonstrate a significant gap between the Community Sector and government roles within the Emergency Management Framework. This gap is particularly evident when the majority10 of the Community Sector managers cannot explain the reporting
4 Ernie Parkin, Farmer, Voluntary Capitan Rural Fire, Country Fire Authority, Gippsland, Victoria (1915-2009) 5 Data collected over two and a half years in focus groups and workshops (see Attachment 1) 6 Clark and Arnold (2010) There when needed: Victoria’s responsive community organisations, Office for the Community Sector Department of Planning and Community Development State Government of Victoria 7 Queensland Flood Commission Report Submissions made by Queensland Council for Social Service and Volunteering Queensland 8 Queensland Flood Commission, the Community Sector Organisations began looking at what is needed to support local communities and the recommendations to provide better communication. 9 A review (Vallance, 2011) of the New Zealand disaster response queried where the state was government was unwilling to or unable to effectively engage with the Community Sector during an emergency without a prior relationship needs to be further investigated. 10 Focus Group discussions (between April 2011-Jan 2012) revealed that over 90% of participants could not explain how the Emergency Management system worked, the key PPRR concepts or what they could do to support the Emergency Management System during information sessions after Cyclone Yasi in North Queensland.
304
structures within the Emergency Management Framework, the core roles government agencies perform during an emergency or the key concepts of prevention, preparedness, response and recovery (PPRR). Unless the Community Sector is engaged, the vulnerable members of our community become more vulnerable. The challenges of formally involving the Community Sector in the Disaster Management Framework and emergency recovery effort have been documented widely. Obviously local government and local community organisations need to be able to work together and need a relationship prior to an emergency. Observations previously made (Ward, Becker, Johnstone, 2008; Olshansky, Jonson and Topping, 2006) have highlighted the difficulty of developing a participatory approach in the lead up to or directly after an emergency. Therefore establishing strong, local sustainable, ongoing relationships that are useful in an emergency must be developed as part of the emergency preparedness process. Emerging from research, the new paradigm has been developed to provide a clear structure for the Community Sector during an emergency. This new paradigm recognises and values the different roles that the Community Sector and the government play in an emergency and focuses on establishing a relationship that is based on capacity, the building of trust, and the security in working together. The very nature of the Community Sector, which consists of thousands of organisations and a diverse range of activities, has been a significant barrier to including the Community Sector formally into the Emergency Management Framework. Through a better understanding of the Community Sector, the diversity becomes strength. The diversity of the Community Sector can be better understood by examining three major components of the sector: networks, structures and resources.
1. Valuable Networks (Types of organisations), relationships and knowledge Existing Community Networks There are many different views and debate within the Community Sector about how the sector is defined. The traditional methods of defining the Community Sector are:
organisation type (funded or non-funded) legal status (unincorporated associations, incorporated associations, companies
limited by guarantee or for profit companies); structure (local, regional, national) service provision (direct or indirect) service type (face to face, online or referral);
A new and important definition, particularly in the Emergency Management Framework is defining organisations by the function they provide in a local community. A large organisation may provide several different functions within its community with different activities and different target groups.
305
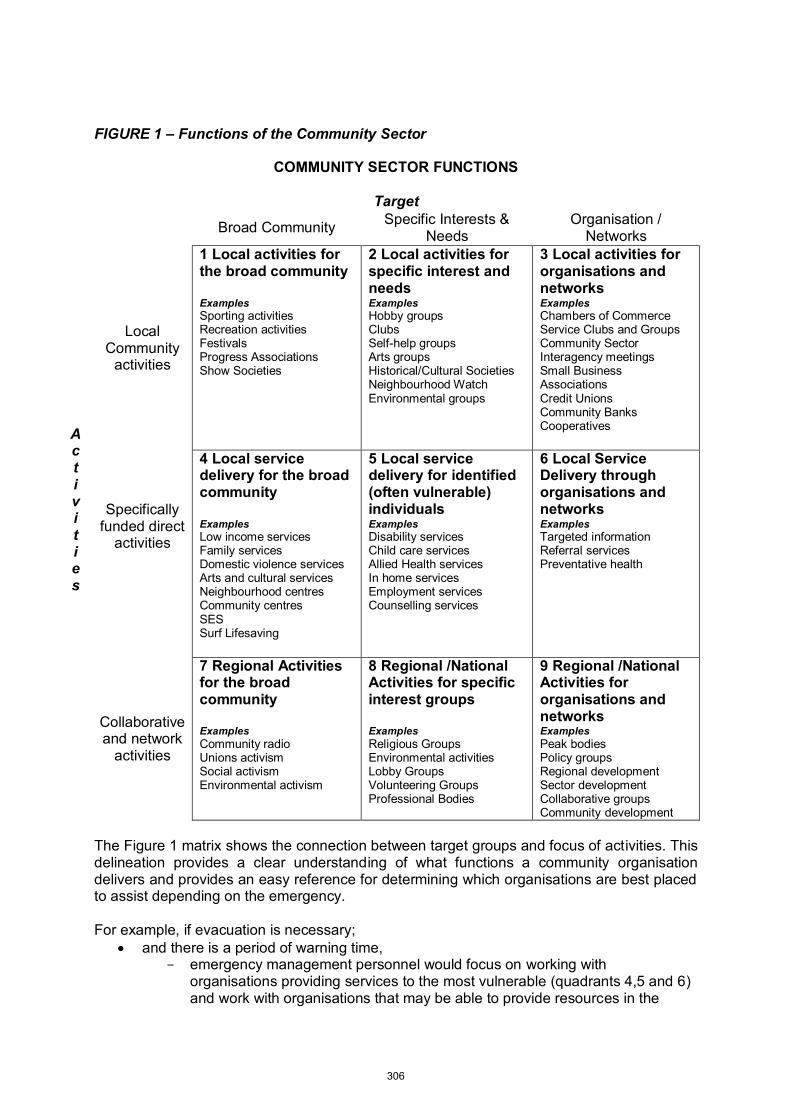
FIGURE 1 – Functions of the Community Sector
COMMUNITY SECTOR FUNCTIONS
Target
Broad Community Specific Interests & Needs
Organisation / Networks
Local Community
activities
1 Local activities for the broad community Examples Sporting activities Recreation activities Festivals Progress Associations Show Societies
2 Local activities for specific interest and needs Examples Hobby groups Clubs Self-help groups Arts groups Historical/Cultural Societies Neighbourhood Watch Environmental groups
3 Local activities for organisations and networks Examples Chambers of Commerce Service Clubs and Groups Community Sector Interagency meetings Small Business Associations Credit Unions Community Banks Cooperatives
Specifically funded direct
activities
4 Local service delivery for the broad community Examples Low income services Family services Domestic violence services Arts and cultural services Neighbourhood centres Community centres SES Surf Lifesaving
5 Local service delivery for identified (often vulnerable) individuals Examples Disability services Child care services Allied Health services In home services Employment services Counselling services
6 Local Service Delivery through organisations and networks Examples Targeted information Referral services Preventative health
Collaborative and network
activities
7 Regional Activities for the broad community Examples Community radio Unions activism Social activism Environmental activism
8 Regional /National Activities for specific interest groups Examples Religious Groups Environmental activities Lobby Groups Volunteering Groups Professional Bodies
9 Regional /National Activities for organisations and networks Examples Peak bodies Policy groups Regional development Sector development Collaborative groups Community development
The Figure 1 matrix shows the connection between target groups and focus of activities. This delineation provides a clear understanding of what functions a community organisation delivers and provides an easy reference for determining which organisations are best placed to assist depending on the emergency. For example, if evacuation is necessary;
and there is a period of warning time, - emergency management personnel would focus on working with
organisations providing services to the most vulnerable (quadrants 4,5 and 6) and work with organisations that may be able to provide resources in the
Ac t i v i t i e s
306
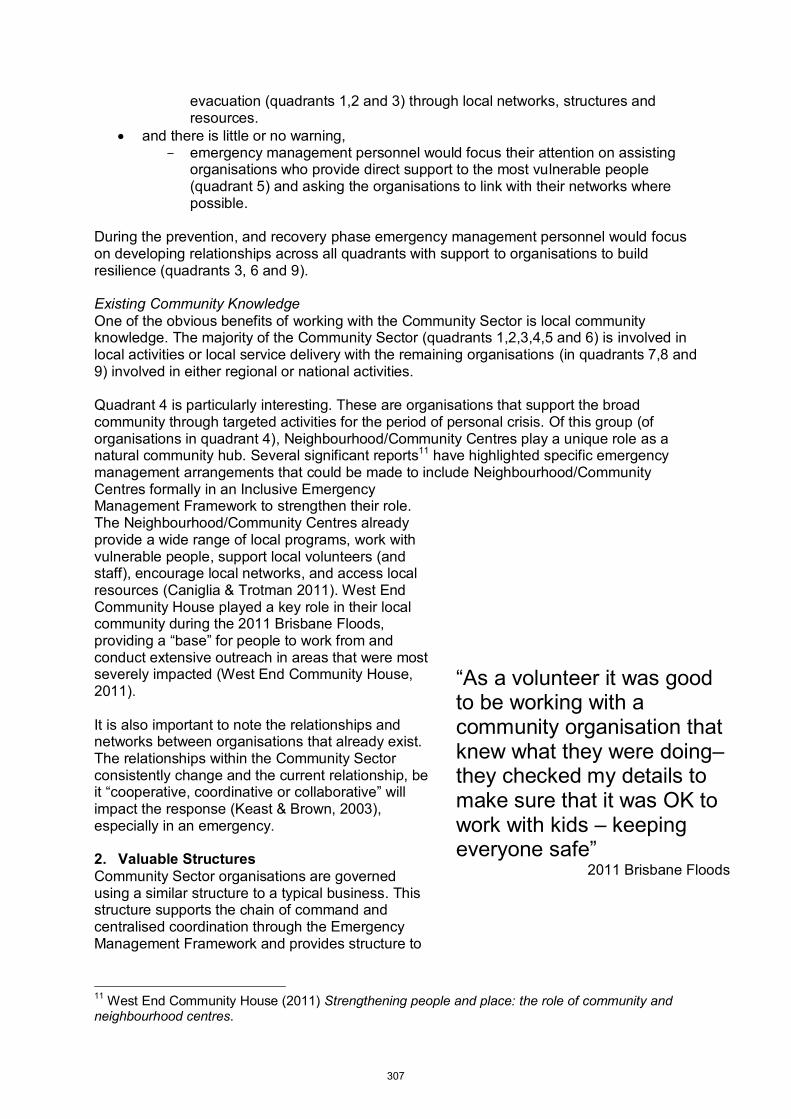
evacuation (quadrants 1,2 and 3) through local networks, structures and resources.
and there is little or no warning, - emergency management personnel would focus their attention on assisting
organisations who provide direct support to the most vulnerable people (quadrant 5) and asking the organisations to link with their networks where possible.
During the prevention, and recovery phase emergency management personnel would focus on developing relationships across all quadrants with support to organisations to build resilience (quadrants 3, 6 and 9). Existing Community Knowledge One of the obvious benefits of working with the Community Sector is local community knowledge. The majority of the Community Sector (quadrants 1,2,3,4,5 and 6) is involved in local activities or local service delivery with the remaining organisations (in quadrants 7,8 and 9) involved in either regional or national activities. Quadrant 4 is particularly interesting. These are organisations that support the broad community through targeted activities for the period of personal crisis. Of this group (of organisations in quadrant 4), Neighbourhood/Community Centres play a unique role as a natural community hub. Several significant reports11 have highlighted specific emergency management arrangements that could be made to include Neighbourhood/Community Centres formally in an Inclusive Emergency Management Framework to strengthen their role. The Neighbourhood/Community Centres already provide a wide range of local programs, work with vulnerable people, support local volunteers (and staff), encourage local networks, and access local resources (Caniglia & Trotman 2011). West End Community House played a key role in their local community during the 2011 Brisbane Floods, providing a “base” for people to work from and conduct extensive outreach in areas that were most severely impacted (West End Community House, 2011). It is also important to note the relationships and networks between organisations that already exist. The relationships within the Community Sector consistently change and the current relationship, be it “cooperative, coordinative or collaborative” will impact the response (Keast & Brown, 2003), especially in an emergency. 2. Valuable Structures Community Sector organisations are governed using a similar structure to a typical business. This structure supports the chain of command and centralised coordination through the Emergency Management Framework and provides structure to
11 West End Community House (2011) Strengthening people and place: the role of community and neighbourhood centres.
“As a volunteer it was good to be working with a community organisation that knew what they were doing– they checked my details to make sure that it was OK to work with kids – keeping everyone safe”
2011 Brisbane Floods
307
allow the Community Sector and the government to work together with confidence. Figure 2 – Community Sector structures
There is clearly a local management structure (see Figure 2) in all Community Sector organisations whether they are local, regional or national. The large organisations duplicate their structure across regions and local areas, however in every organisation there is a local decision maker, the Local Manager who is able to make local decisions. Roles in the Community Sector are not defined by remuneration as the Local Manager may be a volunteer. The structure is predictable and simple and only requires contact with the Local Manager. It is the Local Manager who is responsible for communicating messages internally to Staff / Volunteers or through line management in larger organisations. Existing Administrative Structures One of the biggest challenges in an emergency is providing flexible administrative functions which already exist in the Community Sector. The Community Sector administrative structures keep people safe by providing policies, procedures and rules with specific understanding of: • Regulations (working with children /
people with a disability or older people) • Safety (OHS requirements) • Protection (accident insurance, public
liability insurance) The administrative functions provide capacity to support the directions of the local government in their coordination role. Existing People (Staff/ Volunteers)
“There was so much that needed to be done we just had no idea how we could help”
2011 Yasi Recovery
“I’ve got skills and I did register as a volunteer but with so many volunteers nobody got back to me. I checked with other people but they didn’t seem to know what was going on – I am happy to help”
2011 Cairns - Yasi Response
308
The Health Care and Social Assistance Industry (of which the Community Sector is a primary component) currently employs 11.4% of the Australian Workforce, making it Australia’s largest employing industry. One out of every 72 people in Australia work specifically in the Community Services Sector (Norton, 2010). It is important to consider the level of flexibility in the workforce and the existing management structure to support volunteers. The Community Sector operates in an environment of constant change. Over time, the Local Manager and Staff / Volunteers have developed the ability to quickly adapt to changes as they occur as long as the expectations are clear. Another important capability is the structure to support Volunteers. Approximately 28% of the Australian population who currently volunteer are actively involved in the Community Sector (Volunteering Australia, 2010). By engaging the Community Sector, an alternative model to directing individuals to a centralised system or portal where they are hard to deploy, linking people back to local community organisations builds capacity, provides a stronger local response and provides help where it is most needed. Volunteering Queensland (2011), observed in Brisbane, approximately 6% of the population offered to volunteer12 through the volunteer portal with others volunteering directly. Further research is needed to identify how many of these volunteers were active and for those that were not, could they be linked to the Community Sector and provide longer term help. Spontaneous volunteers may have a short term desire to volunteer. “A week after registering on the database, a vast majority that were contacted were not prepared to volunteer” (Volunteering Queensland 2011:5). Further research is needed to identify ways where spontaneous volunteers can be engaged where they are best suited; either directly on the emergency effort or other service delivery as needed. Identifying organisations who work with highly vulnerable people (Figure 1, quadrant 5 and 6) or support organisations that support targeted programs for the broad community (partially Figure 1, quadrant 4) and building their capacity to manage volunteers in a structured way provides a valuable resource during an emergency that is also useful to the organisation in general operations. 3. Valuable Resources Limited information is available about the combined value of Community Sector assets, however in 2006-07, new capital expenditure by
12 Estimates based on Population Dwelling Profile, Brisbane City Council (The State of Queensland (Queensland Treasury, 2012) the total registrations registered through (Community Response to extreme Weather) 65% of CREW Registrations reported in the Flood Commission Report that included registrations across Queensland.
“We have staff and a bus – we just don’t know where it is needed”
2011 Brisbane Floods
“It’s less about who pays and more about respect – and not having to wait to hear what is happening from the radio”
2007 Cyclone Larry
“When we heard that people were being evacuated and the council were in charge – I hope they know where Susan is and that they remember her medication”
2011 Cairns – Yasi Response
309
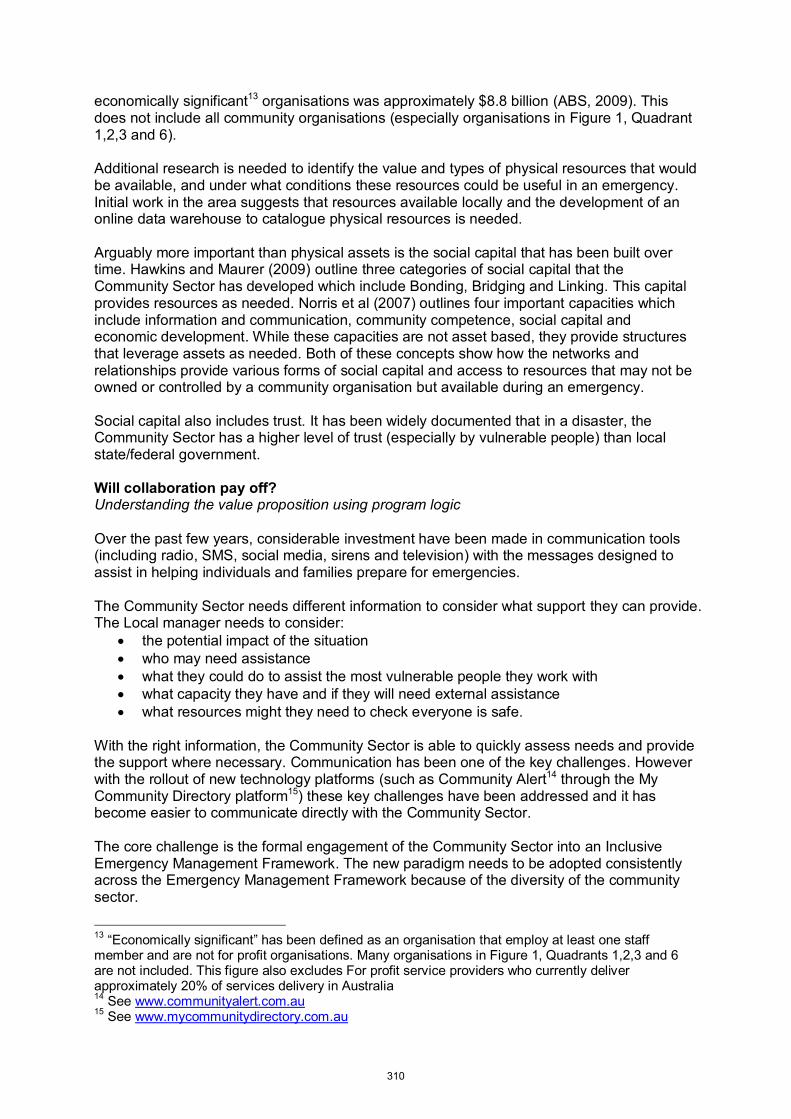
economically significant13 organisations was approximately $8.8 billion (ABS, 2009). This does not include all community organisations (especially organisations in Figure 1, Quadrant 1,2,3 and 6). Additional research is needed to identify the value and types of physical resources that would be available, and under what conditions these resources could be useful in an emergency. Initial work in the area suggests that resources available locally and the development of an online data warehouse to catalogue physical resources is needed. Arguably more important than physical assets is the social capital that has been built over time. Hawkins and Maurer (2009) outline three categories of social capital that the Community Sector has developed which include Bonding, Bridging and Linking. This capital provides resources as needed. Norris et al (2007) outlines four important capacities which include information and communication, community competence, social capital and economic development. While these capacities are not asset based, they provide structures that leverage assets as needed. Both of these concepts show how the networks and relationships provide various forms of social capital and access to resources that may not be owned or controlled by a community organisation but available during an emergency. Social capital also includes trust. It has been widely documented that in a disaster, the Community Sector has a higher level of trust (especially by vulnerable people) than local state/federal government. Will collaboration pay off? Understanding the value proposition using program logic Over the past few years, considerable investment have been made in communication tools (including radio, SMS, social media, sirens and television) with the messages designed to assist in helping individuals and families prepare for emergencies. The Community Sector needs different information to consider what support they can provide. The Local manager needs to consider:
the potential impact of the situation who may need assistance what they could do to assist the most vulnerable people they work with what capacity they have and if they will need external assistance what resources might they need to check everyone is safe.
With the right information, the Community Sector is able to quickly assess needs and provide the support where necessary. Communication has been one of the key challenges. However with the rollout of new technology platforms (such as Community Alert14 through the My Community Directory platform15) these key challenges have been addressed and it has become easier to communicate directly with the Community Sector. The core challenge is the formal engagement of the Community Sector into an Inclusive Emergency Management Framework. The new paradigm needs to be adopted consistently across the Emergency Management Framework because of the diversity of the community sector.
13 “Economically significant” has been defined as an organisation that employ at least one staff member and are not for profit organisations. Many organisations in Figure 1, Quadrants 1,2,3 and 6 are not included. This figure also excludes For profit service providers who currently deliver approximately 20% of services delivery in Australia 14 See www.communityalert.com.au 15 See www.mycommunitydirectory.com.au
310
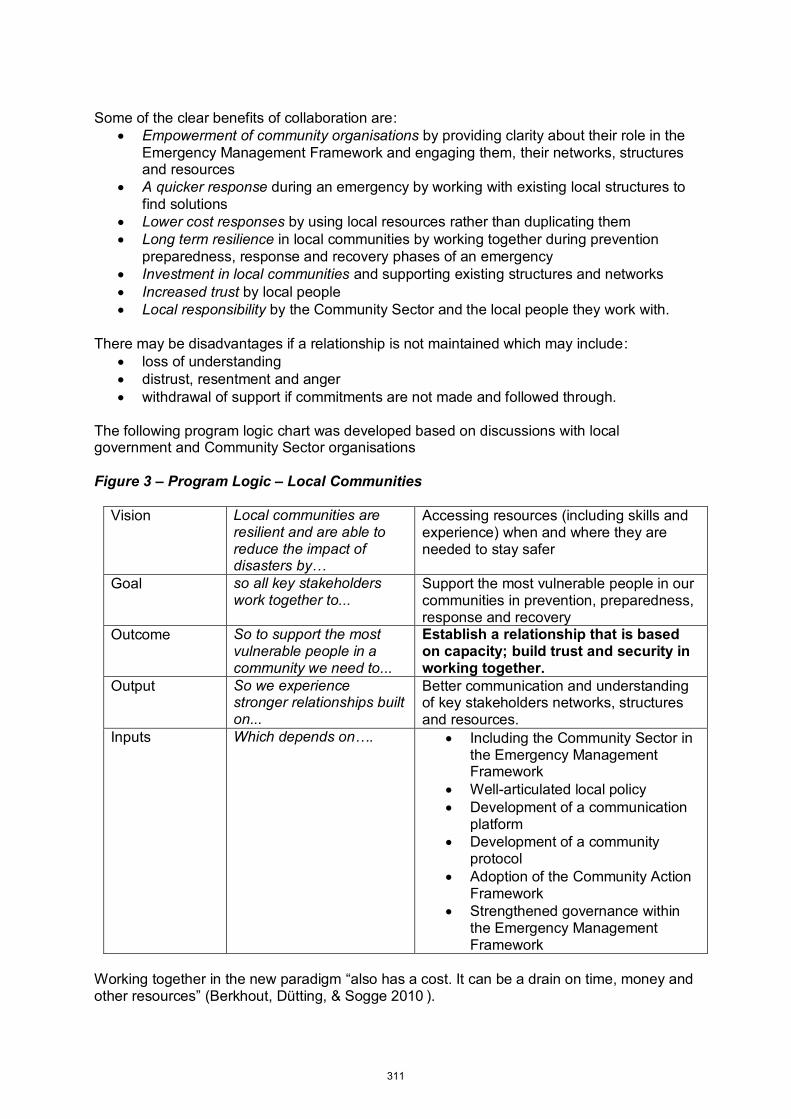
Some of the clear benefits of collaboration are:
Empowerment of community organisations by providing clarity about their role in the Emergency Management Framework and engaging them, their networks, structures and resources
A quicker response during an emergency by working with existing local structures to find solutions
Lower cost responses by using local resources rather than duplicating them Long term resilience in local communities by working together during prevention
preparedness, response and recovery phases of an emergency Investment in local communities and supporting existing structures and networks Increased trust by local people Local responsibility by the Community Sector and the local people they work with.
There may be disadvantages if a relationship is not maintained which may include:
loss of understanding distrust, resentment and anger withdrawal of support if commitments are not made and followed through.
The following program logic chart was developed based on discussions with local government and Community Sector organisations Figure 3 – Program Logic – Local Communities
Vision Local communities are resilient and are able to reduce the impact of disasters by…
Accessing resources (including skills and experience) when and where they are needed to stay safer
Goal so all key stakeholders work together to...
Support the most vulnerable people in our communities in prevention, preparedness, response and recovery
Outcome So to support the most vulnerable people in a community we need to...
Establish a relationship that is based on capacity; build trust and security in working together.
Output So we experience stronger relationships built on...
Better communication and understanding of key stakeholders networks, structures and resources.
Inputs Which depends on…. Including the Community Sector in the Emergency Management Framework
Well-articulated local policy Development of a communication
platform Development of a community
protocol Adoption of the Community Action
Framework Strengthened governance within
the Emergency Management Framework
Working together in the new paradigm “also has a cost. It can be a drain on time, money and other resources” (Berkhout, Dütting, & Sogge 2010 ).
311
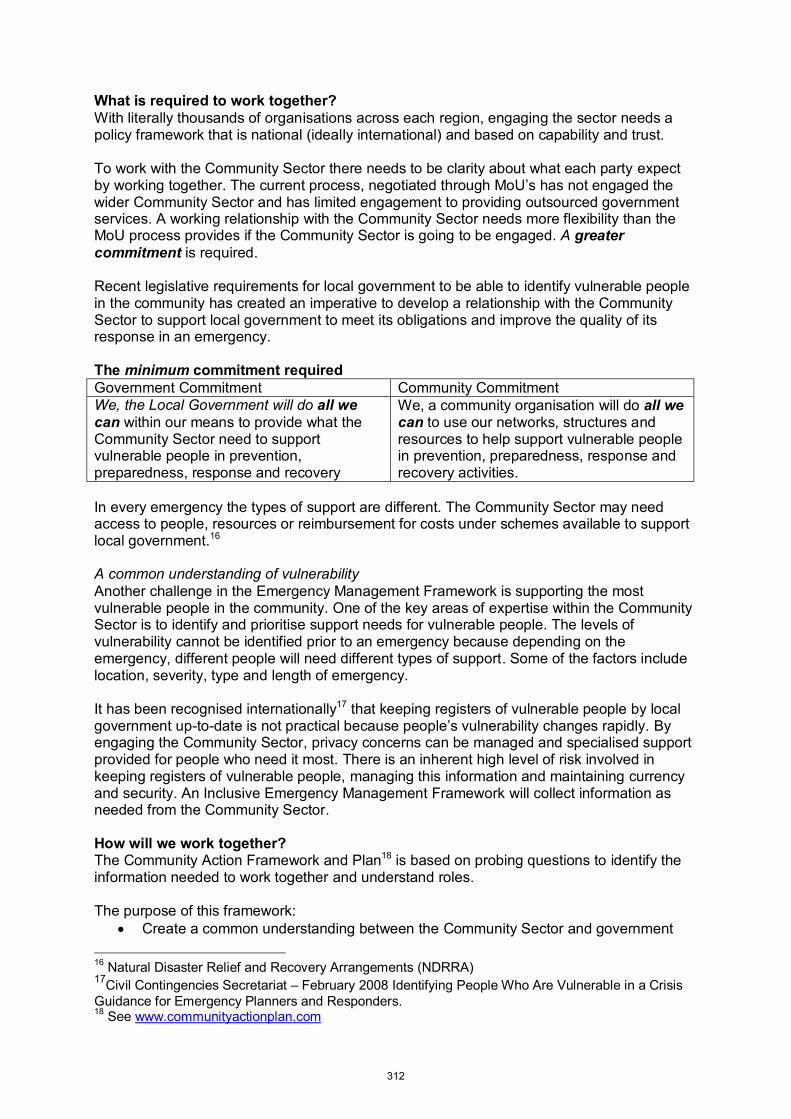
What is required to work together? With literally thousands of organisations across each region, engaging the sector needs a policy framework that is national (ideally international) and based on capability and trust. To work with the Community Sector there needs to be clarity about what each party expect by working together. The current process, negotiated through MoU’s has not engaged the wider Community Sector and has limited engagement to providing outsourced government services. A working relationship with the Community Sector needs more flexibility than the MoU process provides if the Community Sector is going to be engaged. A greater commitment is required. Recent legislative requirements for local government to be able to identify vulnerable people in the community has created an imperative to develop a relationship with the Community Sector to support local government to meet its obligations and improve the quality of its response in an emergency. The minimum commitment required Government Commitment Community Commitment We, the Local Government will do all we can within our means to provide what the Community Sector need to support vulnerable people in prevention, preparedness, response and recovery
We, a community organisation will do all we can to use our networks, structures and resources to help support vulnerable people in prevention, preparedness, response and recovery activities.
In every emergency the types of support are different. The Community Sector may need access to people, resources or reimbursement for costs under schemes available to support local government.16 A common understanding of vulnerability Another challenge in the Emergency Management Framework is supporting the most vulnerable people in the community. One of the key areas of expertise within the Community Sector is to identify and prioritise support needs for vulnerable people. The levels of vulnerability cannot be identified prior to an emergency because depending on the emergency, different people will need different types of support. Some of the factors include location, severity, type and length of emergency. It has been recognised internationally17 that keeping registers of vulnerable people by local government up-to-date is not practical because people’s vulnerability changes rapidly. By engaging the Community Sector, privacy concerns can be managed and specialised support provided for people who need it most. There is an inherent high level of risk involved in keeping registers of vulnerable people, managing this information and maintaining currency and security. An Inclusive Emergency Management Framework will collect information as needed from the Community Sector. How will we work together? The Community Action Framework and Plan18 is based on probing questions to identify the information needed to work together and understand roles. The purpose of this framework:
Create a common understanding between the Community Sector and government 16 Natural Disaster Relief and Recovery Arrangements (NDRRA) 17Civil Contingencies Secretariat – February 2008 Identifying People Who Are Vulnerable in a Crisis Guidance for Emergency Planners and Responders. 18 See www.communityactionplan.com
312
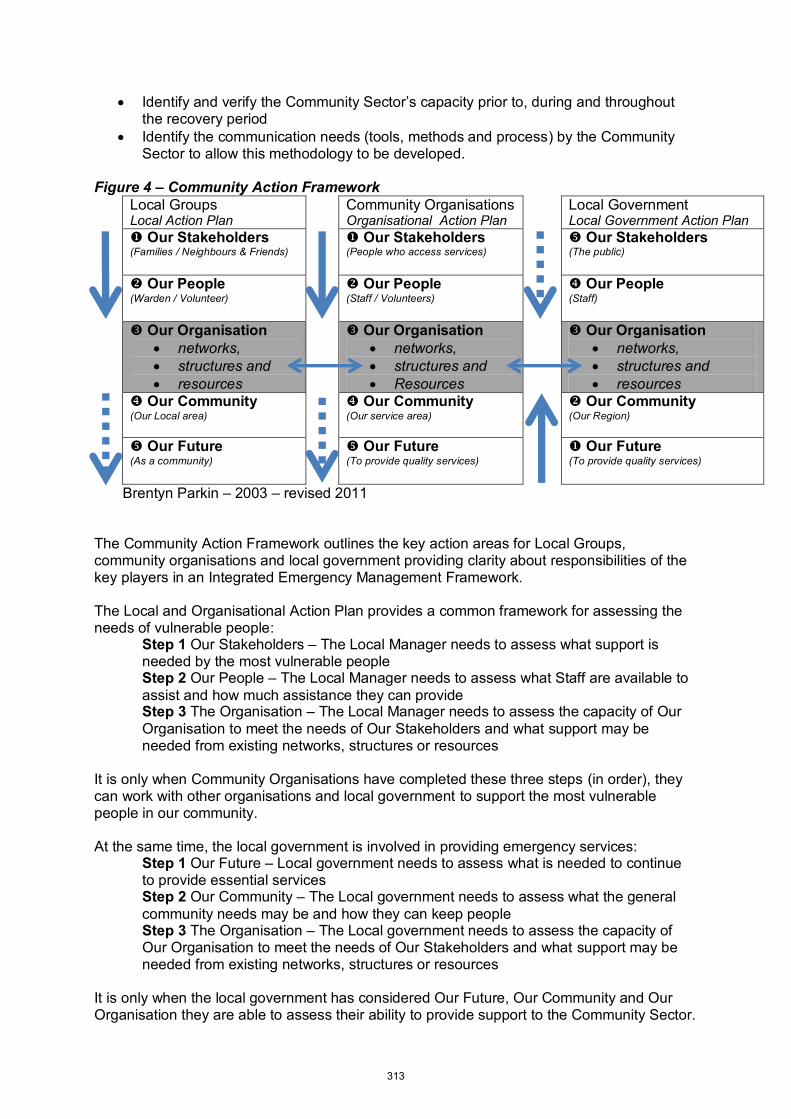
Identify and verify the Community Sector’s capacity prior to, during and throughout the recovery period
Identify the communication needs (tools, methods and process) by the Community Sector to allow this methodology to be developed.
Figure 4 – Community Action Framework Local Groups
Local Action Plan Community Organisations
Organisational Action Plan Local Government
Local Government Action Plan Our Stakeholders
(Families / Neighbours & Friends) Our Stakeholders
(People who access services) Our Stakeholders
(The public)
Our People (Warden / Volunteer)
Our People (Staff / Volunteers)
Our People (Staff)
Our Organisation networks, structures and resources
Our Organisation networks, structures and Resources
Our Organisation networks, structures and resources
Our Community (Our Local area)
Our Community (Our service area)
Our Community (Our Region)
Our Future (As a community)
Our Future (To provide quality services)
Our Future (To provide quality services)
Brentyn Parkin – 2003 – revised 2011 The Community Action Framework outlines the key action areas for Local Groups, community organisations and local government providing clarity about responsibilities of the key players in an Integrated Emergency Management Framework. The Local and Organisational Action Plan provides a common framework for assessing the needs of vulnerable people:
Step 1 Our Stakeholders – The Local Manager needs to assess what support is needed by the most vulnerable people Step 2 Our People – The Local Manager needs to assess what Staff are available to assist and how much assistance they can provide Step 3 The Organisation – The Local Manager needs to assess the capacity of Our Organisation to meet the needs of Our Stakeholders and what support may be needed from existing networks, structures or resources
It is only when Community Organisations have completed these three steps (in order), they can work with other organisations and local government to support the most vulnerable people in our community. At the same time, the local government is involved in providing emergency services:
Step 1 Our Future – Local government needs to assess what is needed to continue to provide essential services Step 2 Our Community – The Local government needs to assess what the general community needs may be and how they can keep people Step 3 The Organisation – The Local government needs to assess the capacity of Our Organisation to meet the needs of Our Stakeholders and what support may be needed from existing networks, structures or resources
It is only when the local government has considered Our Future, Our Community and Our Organisation they are able to assess their ability to provide support to the Community Sector.
313

As the needs are assessed the Community Sector and Local government can progress to Step 4, Step and 5. The Community Action Framework has led to the development of Community Action Plans. These plans are currently being developed in Cairns/Townsville and Bundaberg. The initial response has been:
closer working relationships between community organisations an efficient, cost effective communication tool that enhances relationships identification of vulnerable sectors of the community in regards to preparedness,
response and recovery In conclusion, there have been a range of positive and negative experiences when engaging the Community Sector in the Emergency Management Framework and without a clear commitment about how the government and the Community Sector are going to work together, the vulnerable are more vulnerable. There is a clear benefit in Community Sector engagement; however it is based on a relationship which requires regular communication. Rather than developing individual local strategies a national approach is required. By working with the Community Sector and using the Community Action Framework it is easier to identify capacity and link with local networks, structures and resources. Adopting the Community Action Plan Framework allows community organisations and the government to begin working together, based on the assumption that we have a broad agreement that the actions taken will be directed locally and supported by resources where possible. While there is broad acknowledgement that there needs to be engagement, neither the government or the Community Sector have embraced a framework that supports engagement. There are two clear challenges: The government needs to make a commitment to support the Community Sector, and the Community Sector need to take responsibility and engage with the government to do all they can to support vulnerable people during an emergency.
314
References ABS (Australia Bureau of Statistics), 2008 - 1998, Not for Profit Organisations, 2006-07, Cat. no. 8106.0, Reissue, Canberra. Berkhout, Dütting G., Sogge D., The Dynamics of NGO collaboration, Civil Society Building Woking Paper Series 1/2010 pp4 Brown, K. and Keast, R. (2003) Citizen-Government Engagement: Community Connection through Networked Arrangements, Asian Journal of Public Administration 25(1), 107-132. Caniglia F., Trotman, A., 2011 A Silver Lining: Community Development, crisis and belonging (accessed online http://www.communitydoor.org.au/A-Silver-Lining) Civil Contingencies Secretariat (2008), Identifying People Who Are Vulnerable in a Crisis Guidance for Emergency Planners and Responders. (accessed online Cottrell, A. (2005) Communities and bushfire hazard in Australia: More questions than answers. Environmental Hazards, 6, 109-114. ISSN: 1747 7891. Department of Education, Employment and Workplace Relations, 2011 Australian Jobs 2011. Hawkins, R., & Maurer, K., (2009) Bonding, Bridging and Linking: How Social Capital Operated in New Orleans following Hurricane Katrina: British Journal of Social Work Volume: 40, Issue: 6, Publisher: BASW, Pages: 1777-1793: ISSN: 00453102
Keast, R., Mandell, M., & Waterhouse, J., 2011, Big, Bigger, Best? The impact of Reforms on the Not-for-Profit Sector in Queensland PMRA Conference Paper Clark, M., & Arnold, S., (2010) There when needed: Victoria’s responsive community organisations, Office for the Community Sector Department of Planning and Community Development State Government of Victoria Norton, M., (2010) The Queensland Community Services Sector (2010) Commissioned by the Queensland Council of Social Service pp52. Volunteering Queensland (2011) Submission to the Queensland Floods Commission of Inquiry. [Accessed online http://www.floodcommission.qld.gov.au/] Queensland Flood Commission of Enquiry, Queensland Flood Commission of Enquiry Interim Report [Accessed online http://www.floodcommission.qld.gov.au/] Queensland Council of Social Service (QCOSS), 2011 Submission to the Queensland Floods Commission of Inquiry. [Accessed online http://www.floodcommission.qld.gov.au/] Victorian Fire Commission Vallance, S., (2011) Early Disaster Recovery: A guide for Recovery Australasian Journal of Disaster and Trauma Studies, Volume 2011-2 pp 19 Volunteering Australia (2010) National Survey of Volunteering Issues 2010 [Accessed online http://www.volunteeringaustralia.org/files/VXN9WD0EWD/NationalSurvey10_web_final.pdf]
315
Ward, J., Becker, J. & Johnston, D. (2008). Community participation in recovery planning : A case study from the 1998 Ohura flood, GNS Science Report 2008. West End Community House (2011) Strengthening people and place: the role of community and neighbourhood centres [accessed online http://www.westendcommunityhouse.org.au/wp-content/uploads/2011/12/Strengthening-People-and-Places-Vers.pdf] Olshansky, Robert B., Laurie A. Johnson, Kenneth C. Topping, “Rebuilding communities following disaster: Lessons from Kobe and Los Angeles,” Built Environment 32(4): 354-374, 2006. Quarantelli, E.(2000) "Emergencies, Disasters, and Catastrophes are Different Phenomena". Preliminary Papers. University of Delaware Disaster Research Center.
316

Attachment 1 – Project Acknowledgement The findings of this paper are based on extensive community consultations on emergency management conducted over the past two and a half years. Assistance was provided through the Commonwealth Government’s National Disaster Resilience Program (NDRP) and funding from the Queensland Government’s Building Rural Communities Program - Blue Print for the Bush Program, providing over $40,000 and an estimate of over $35,000 in kind support by the Community. More than 30 workshops and focus groups across Queensland’s regional centres and towns involved over 400 participants including senior and operational state government emergency management staff, local councils and staff from community service organisations providing services to vulnerable people. The research was conducted through the generous participation of people in the following Council areas:
Cooktown Shire Council Tablelands Regional Council Cairns Regional Council Cassowary Coast Regional Council Mt Isa City Council Townsville Regional Council Mackay Regional Council Central Highlands Regional Council Bundaberg Regional Council Fraser Coast Regional Council Gympie Regional Council Brisbane City Council
In conversations based around communication (and Volunteer Alert – www.volunteeralert.com.au) Participants shared practices that are currently working, described gaps in operations during recent disaster events and identified processes, structures and ways that we could work together to improve support provided to the most vulnerable people in the Community. Volunteer Alert was supported by our key partners Far North Queensland Volunteers and Volunteering North Queensland this project would not have been possible. More information about Volunteer Alert can be found at www.volunteeralert.com.au
317
Satellite data based semi-real time media contents to promote public awareness of natural disasters Kithsiri Perera Lecturer Faculty of Engineering and Surveying and Australian Centre for Sustainable Catchments, University of Southern Queensland, West Street, Toowoomba 4350 QLD Australia, [email protected] Ryutaro Tateishi Professor
Centre for Environmental Remote Sensing (CEReS), Chiba University, 1-33 Yayoi-cho, Inage-ku, 263-8522, Japan.
Paper presented at EARTH: FIRE AND RAIN Australian & New Zealand Disaster and Emergency Management Conference Brisbane: 16 – 18, April 2012
318
Satellite data based semi-real time media contents to promote public awareness of natural disasters
Kithsiri Perera¹* and Ryutaro Tateishi²
¹*Faculty of Engineering and Surveying and Australian Centre for Sustainable Catchments, University of Southern Queensland, West Street, Toowoomba 4350 QLD Australia, [email protected]
²Centre for Environmental Remote Sensing (CEReS), Chiba University, 1-33 Yayoi-cho, Inage-ku, 263-8522, Japan.
Keywords: Disaster mitigation, Media-GIS, MODIS, Semi-real-time, Mobile contents Abstract: Natural disaster mitigation is a collective effort of; forecast, assessment, and encouraging the public participation in disaster mitigation. This study focused on the rarely addressed aspect, “the value of public awareness” on natural disasters. The promotion of public awareness can be linked to the better public participation in disaster mitigation efforts. This study used satellite data and Geographic Information Systems (GIS) to produce semi-real-time “Media-GIS” contents to widen the public awarness. The methodology to produce Media-GIS contents is based on; fundamentals of GIS, satellite images, and data extracted from Google Earth. Hence contents carry inherent characters of GIS and different from conventional graphics use in media. Also the graphical variables like, size, value, texture, hue, orientation, and shape, were optimized to match with target content users (age group, social group) and medium (print, TV, WEB, mobile), while minimizing the cost. With the brake of the disaster news, MODIS (250m) satellite data can be extracted in GeoTIFF and KLM (Keyhole Markup Language) formats. The KML file was overlayed on Google Earth, to extract spatial information of the disaster site. Then, in ArcGIS environment, GeoTIFF file was transferred into Photoshop for production of the graphical image map content. This Photoshop content can be used independently or as a new KML file in ArcGIS. The resulted KLM file will be the GIS media content for TV, WEB, mobile, or for print media. When public get these location based semi-real time information of the disaster, they start to pay a greater attention due to various links they have to the respective disaster hit region or similarities of own region and disaster hit region. This situation will support to increase the public awareness of the disaster, and indirectly help to attract more public support in disaster mitigation programs. Two cases studies; Brisbane flood disaster occurred in early 2011 and the on-going disastrous flood in Bangkok, are presented in the study. 1. Introduction
In modern world “Media” in all mediums are having a tremendous impact on every aspect of our daily life. While it is a massive business, media plays as the prime controlling tool in all forms of propaganda to address general mass. Media (the plural of "medium") is a truncation of the term "media of communication," referring to dissemination of facts, opinions, entertainments, and other information, through newspapers, magazines, outdoor advertising, film, radio, television, the World Wide Web (WWW), books, CDs, DVDs, videocassettes, computer games, and other forms of publishing (newworldencyclopedia, 2008). With the arrival of electronic media, digital printing, and WWW, a constant demand pushed to invent innovative developments in content production of media. In this background, reports related to natural disasters are playing a prominent field in media topics, since disasters are directly related to people, economy, and natural environment. The victims of earthquakes, hurricanes and tsunamis are perceived as 100% blameless and get a bigger sympathy from the content viewer, while the victims of wars do not enjoy such absolute status (Stroehlein A., 2010). The requirement of high speed relief assistances, immediate damage assessments, and disaster mitigation efforts have a relation with media contents on the respective disasters. This is due to the high impact of media contents on the public in the modern society. However, the lack of location based fresh information and maps in these media reports make a significant limitation in contents. Two WEB based news report samples from 2011 Queensland and Thailand flood disasters are presented in figure 1. This study examined a large amount of disaster news articles in web and found nearly all these reports are mainly
319
carry local photos, few maps, but very rarely carry semi-real-time information acquired from satellites.
Figure 1. Two typical samples of disaster news articles in WEB posted by one of the top rank news companies (source: BBC news), but with no support from freely available satellite images.
These news items are travelling around the world through WWW and other electronic and print media, where people even don’t have proper understanding of the relative location of the disaster. When news travels around the world at lightning speed using satellite communication systems, it’s beneficial for readers to have information on location and any semi-real-time pictorial information of the disaster. The application of satellite images, especially semi-real-time satellite images can be a very effective addition for reporting of most of the natural disasters (USGS, 2011; Altan at el, 2010; Nakya et al, 2007, Perera & Pathirana, 2006). The use of the term “semi-real-time” in this report represents the time factor related to real-time satellite images and processing and production time of the disaster content based of the particular satellite image. With regard to natural disasters, this time factor should not exceed the arrival of satellite to take same image frame again.
GIS (Geographic information systems) can be successfully used to build a link between disaster news and location based semi-real-time information derived from satellite images. GIS uses a computer-based process to collection or capture, maintain, store, analysis, and distribute spatial data and associate attributes (Nationmaster.com 2010). In application, GIS is widely used in scientific investigations, resource management, and development
320
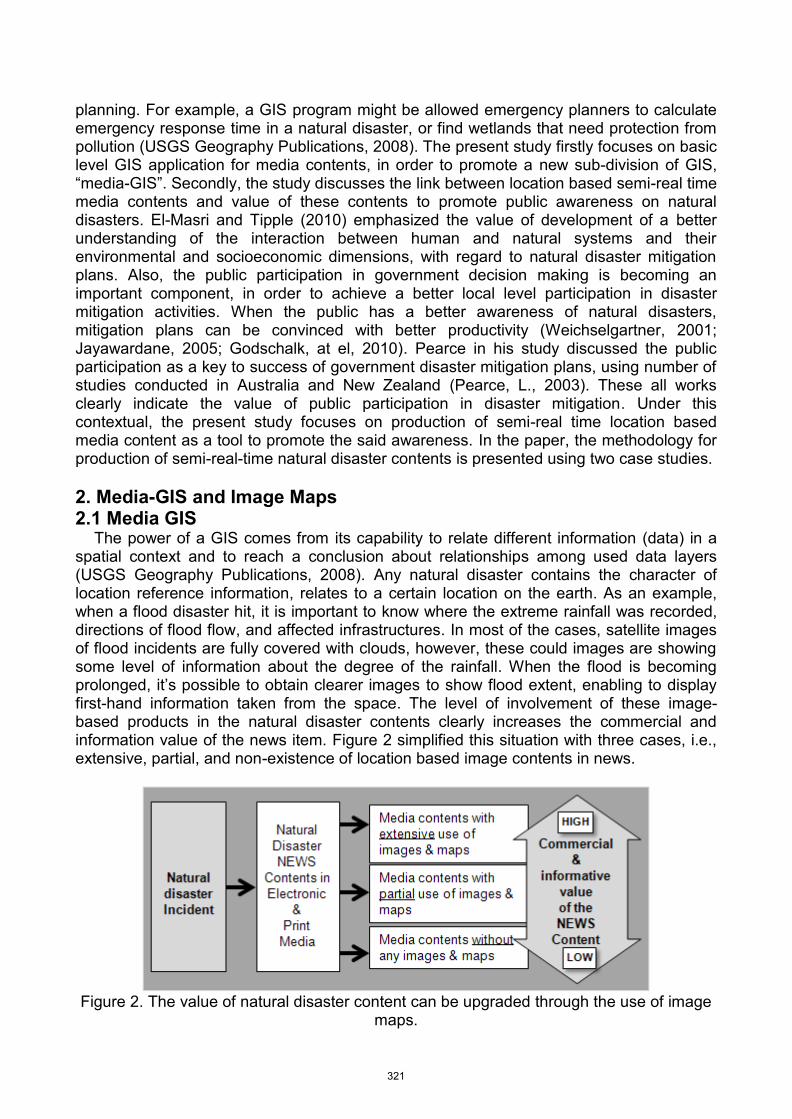
planning. For example, a GIS program might be allowed emergency planners to calculate emergency response time in a natural disaster, or find wetlands that need protection from pollution (USGS Geography Publications, 2008). The present study firstly focuses on basic level GIS application for media contents, in order to promote a new sub-division of GIS, “media-GIS”. Secondly, the study discusses the link between location based semi-real time media contents and value of these contents to promote public awareness on natural disasters. El-Masri and Tipple (2010) emphasized the value of development of a better understanding of the interaction between human and natural systems and their environmental and socioeconomic dimensions, with regard to natural disaster mitigation plans. Also, the public participation in government decision making is becoming an important component, in order to achieve a better local level participation in disaster mitigation activities. When the public has a better awareness of natural disasters, mitigation plans can be convinced with better productivity (Weichselgartner, 2001; Jayawardane, 2005; Godschalk, at el, 2010). Pearce in his study discussed the public participation as a key to success of government disaster mitigation plans, using number of studies conducted in Australia and New Zealand (Pearce, L., 2003). These all works clearly indicate the value of public participation in disaster mitigation. Under this contextual, the present study focuses on production of semi-real time location based media content as a tool to promote the said awareness. In the paper, the methodology for production of semi-real-time natural disaster contents is presented using two case studies. 2. Media-GIS and Image Maps 2.1 Media GIS
The power of a GIS comes from its capability to relate different information (data) in a spatial context and to reach a conclusion about relationships among used data layers (USGS Geography Publications, 2008). Any natural disaster contains the character of location reference information, relates to a certain location on the earth. As an example, when a flood disaster hit, it is important to know where the extreme rainfall was recorded, directions of flood flow, and affected infrastructures. In most of the cases, satellite images of flood incidents are fully covered with clouds, however, these could images are showing some level of information about the degree of the rainfall. When the flood is becoming prolonged, it’s possible to obtain clearer images to show flood extent, enabling to display first-hand information taken from the space. The level of involvement of these image-based products in the natural disaster contents clearly increases the commercial and information value of the news item. Figure 2 simplified this situation with three cases, i.e., extensive, partial, and non-existence of location based image contents in news.
Figure 2. The value of natural disaster content can be upgraded through the use of image
maps.
321
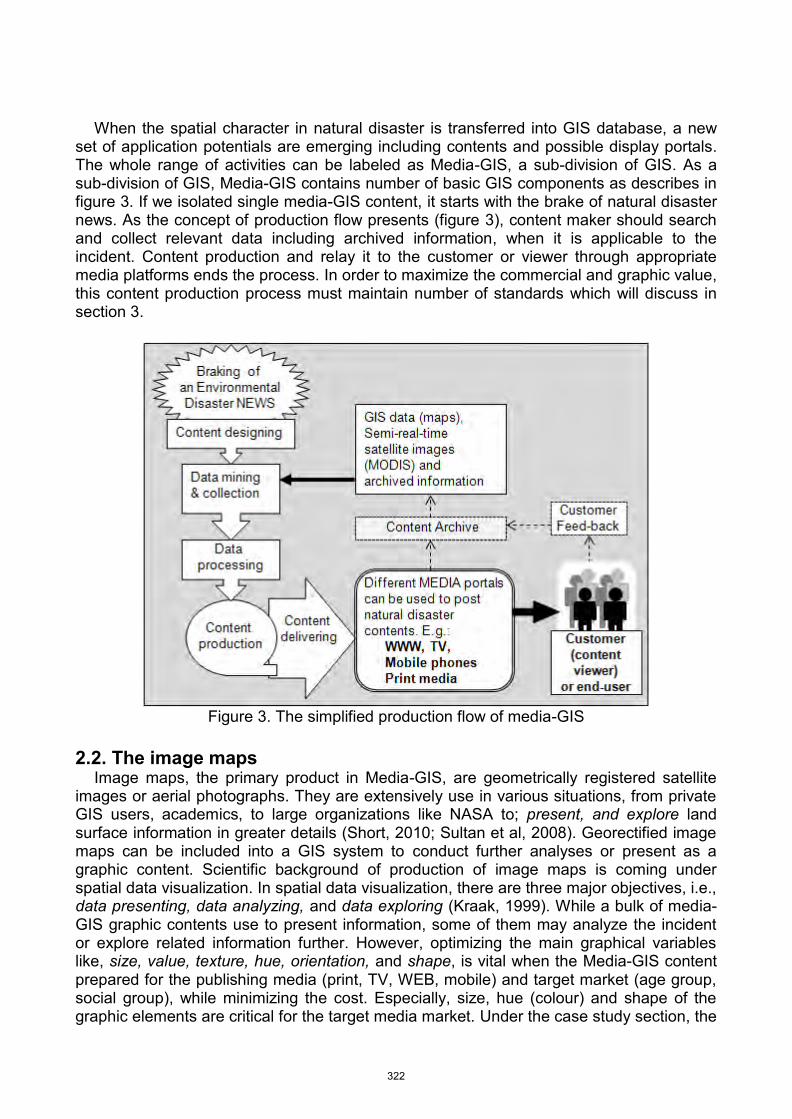
When the spatial character in natural disaster is transferred into GIS database, a new
set of application potentials are emerging including contents and possible display portals. The whole range of activities can be labeled as Media-GIS, a sub-division of GIS. As a sub-division of GIS, Media-GIS contains number of basic GIS components as describes in figure 3. If we isolated single media-GIS content, it starts with the brake of natural disaster news. As the concept of production flow presents (figure 3), content maker should search and collect relevant data including archived information, when it is applicable to the incident. Content production and relay it to the customer or viewer through appropriate media platforms ends the process. In order to maximize the commercial and graphic value, this content production process must maintain number of standards which will discuss in section 3.
Figure 3. The simplified production flow of media-GIS
2.2. The image maps
Image maps, the primary product in Media-GIS, are geometrically registered satellite images or aerial photographs. They are extensively use in various situations, from private GIS users, academics, to large organizations like NASA to; present, and explore land surface information in greater details (Short, 2010; Sultan et al, 2008). Georectified image maps can be included into a GIS system to conduct further analyses or present as a graphic content. Scientific background of production of image maps is coming under spatial data visualization. In spatial data visualization, there are three major objectives, i.e., data presenting, data analyzing, and data exploring (Kraak, 1999). While a bulk of media-GIS graphic contents use to present information, some of them may analyze the incident or explore related information further. However, optimizing the main graphical variables like, size, value, texture, hue, orientation, and shape, is vital when the Media-GIS content prepared for the publishing media (print, TV, WEB, mobile) and target market (age group, social group), while minimizing the cost. Especially, size, hue (colour) and shape of the graphic elements are critical for the target media market. Under the case study section, the
322
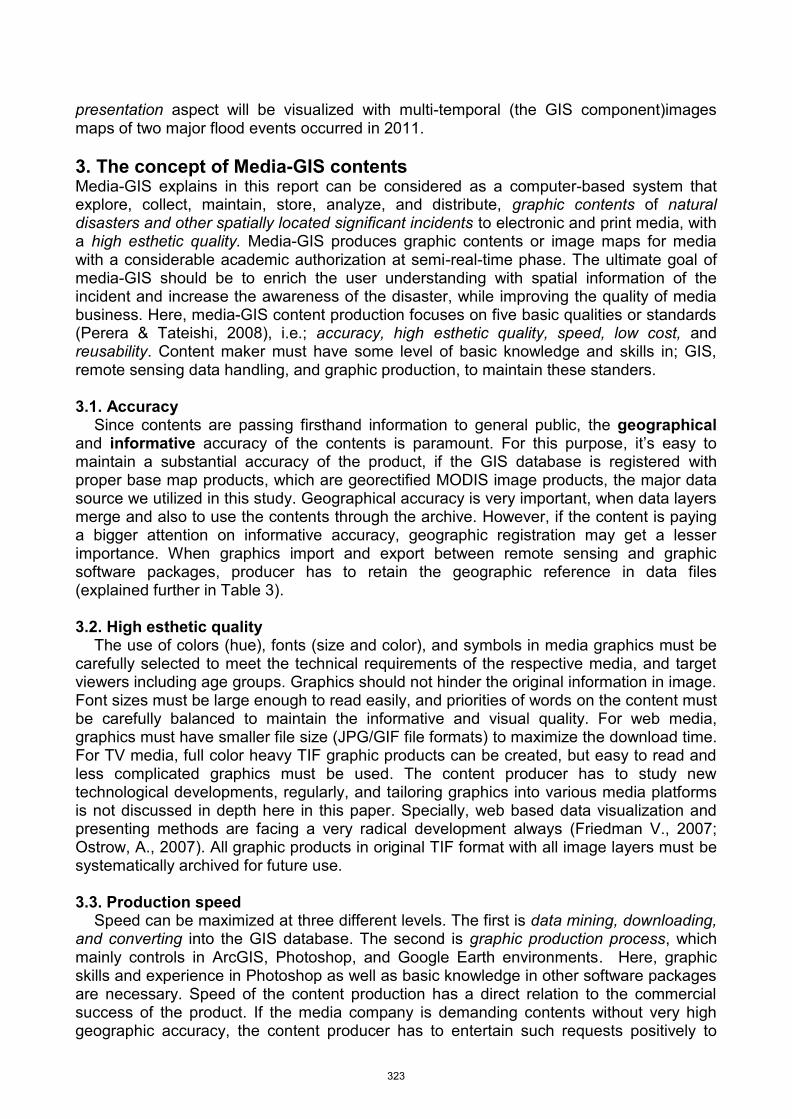
presentation aspect will be visualized with multi-temporal (the GIS component)images maps of two major flood events occurred in 2011. 3. The concept of Media-GIS contents Media-GIS explains in this report can be considered as a computer-based system that explore, collect, maintain, store, analyze, and distribute, graphic contents of natural disasters and other spatially located significant incidents to electronic and print media, with a high esthetic quality. Media-GIS produces graphic contents or image maps for media with a considerable academic authorization at semi-real-time phase. The ultimate goal of media-GIS should be to enrich the user understanding with spatial information of the incident and increase the awareness of the disaster, while improving the quality of media business. Here, media-GIS content production focuses on five basic qualities or standards (Perera & Tateishi, 2008), i.e.; accuracy, high esthetic quality, speed, low cost, and reusability. Content maker must have some level of basic knowledge and skills in; GIS, remote sensing data handling, and graphic production, to maintain these standers. 3.1. Accuracy
Since contents are passing firsthand information to general public, the geographical and informative accuracy of the contents is paramount. For this purpose, it’s easy to maintain a substantial accuracy of the product, if the GIS database is registered with proper base map products, which are georectified MODIS image products, the major data source we utilized in this study. Geographical accuracy is very important, when data layers merge and also to use the contents through the archive. However, if the content is paying a bigger attention on informative accuracy, geographic registration may get a lesser importance. When graphics import and export between remote sensing and graphic software packages, producer has to retain the geographic reference in data files (explained further in Table 3). 3.2. High esthetic quality
The use of colors (hue), fonts (size and color), and symbols in media graphics must be carefully selected to meet the technical requirements of the respective media, and target viewers including age groups. Graphics should not hinder the original information in image. Font sizes must be large enough to read easily, and priorities of words on the content must be carefully balanced to maintain the informative and visual quality. For web media, graphics must have smaller file size (JPG/GIF file formats) to maximize the download time. For TV media, full color heavy TIF graphic products can be created, but easy to read and less complicated graphics must be used. The content producer has to study new technological developments, regularly, and tailoring graphics into various media platforms is not discussed in depth here in this paper. Specially, web based data visualization and presenting methods are facing a very radical development always (Friedman V., 2007; Ostrow, A., 2007). All graphic products in original TIF format with all image layers must be systematically archived for future use. 3.3. Production speed
Speed can be maximized at three different levels. The first is data mining, downloading, and converting into the GIS database. The second is graphic production process, which mainly controls in ArcGIS, Photoshop, and Google Earth environments. Here, graphic skills and experience in Photoshop as well as basic knowledge in other software packages are necessary. Speed of the content production has a direct relation to the commercial success of the product. If the media company is demanding contents without very high geographic accuracy, the content producer has to entertain such requests positively to
323
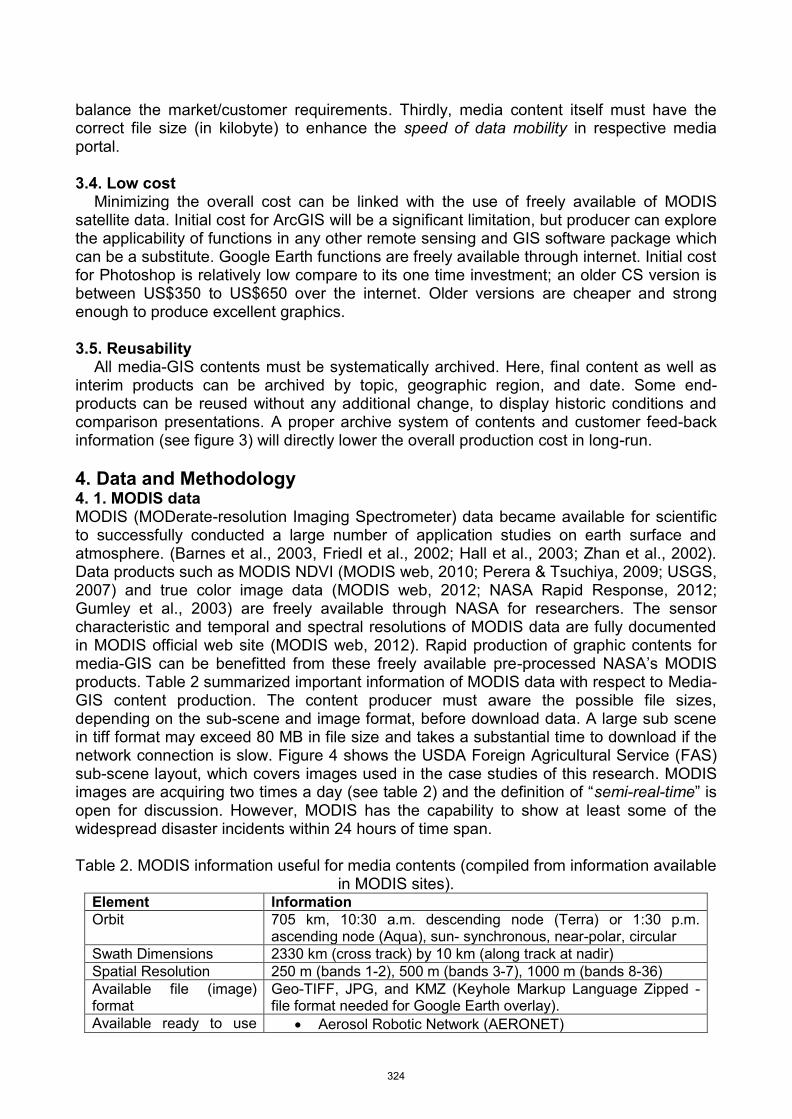
balance the market/customer requirements. Thirdly, media content itself must have the correct file size (in kilobyte) to enhance the speed of data mobility in respective media portal. 3.4. Low cost
Minimizing the overall cost can be linked with the use of freely available of MODIS satellite data. Initial cost for ArcGIS will be a significant limitation, but producer can explore the applicability of functions in any other remote sensing and GIS software package which can be a substitute. Google Earth functions are freely available through internet. Initial cost for Photoshop is relatively low compare to its one time investment; an older CS version is between US$350 to US$650 over the internet. Older versions are cheaper and strong enough to produce excellent graphics. 3.5. Reusability
All media-GIS contents must be systematically archived. Here, final content as well as interim products can be archived by topic, geographic region, and date. Some end-products can be reused without any additional change, to display historic conditions and comparison presentations. A proper archive system of contents and customer feed-back information (see figure 3) will directly lower the overall production cost in long-run.
4. Data and Methodology 4. 1. MODIS data MODIS (MODerate-resolution Imaging Spectrometer) data became available for scientific to successfully conducted a large number of application studies on earth surface and atmosphere. (Barnes et al., 2003, Friedl et al., 2002; Hall et al., 2003; Zhan et al., 2002). Data products such as MODIS NDVI (MODIS web, 2010; Perera & Tsuchiya, 2009; USGS, 2007) and true color image data (MODIS web, 2012; NASA Rapid Response, 2012; Gumley et al., 2003) are freely available through NASA for researchers. The sensor characteristic and temporal and spectral resolutions of MODIS data are fully documented in MODIS official web site (MODIS web, 2012). Rapid production of graphic contents for media-GIS can be benefitted from these freely available pre-processed NASA’s MODIS products. Table 2 summarized important information of MODIS data with respect to Media-GIS content production. The content producer must aware the possible file sizes, depending on the sub-scene and image format, before download data. A large sub scene in tiff format may exceed 80 MB in file size and takes a substantial time to download if the network connection is slow. Figure 4 shows the USDA Foreign Agricultural Service (FAS) sub-scene layout, which covers images used in the case studies of this research. MODIS images are acquiring two times a day (see table 2) and the definition of “semi-real-time” is open for discussion. However, MODIS has the capability to show at least some of the widespread disaster incidents within 24 hours of time span.
Table 2. MODIS information useful for media contents (compiled from information available
in MODIS sites). Element Information Orbit 705 km, 10:30 a.m. descending node (Terra) or 1:30 p.m.
ascending node (Aqua), sun- synchronous, near-polar, circular Swath Dimensions 2330 km (cross track) by 10 km (along track at nadir) Spatial Resolution 250 m (bands 1-2), 500 m (bands 3-7), 1000 m (bands 8-36) Available file (image) format
Geo-TIFF, JPG, and KMZ (Keyhole Markup Language Zipped - file format needed for Google Earth overlay).
Available ready to use Aerosol Robotic Network (AERONET)
324
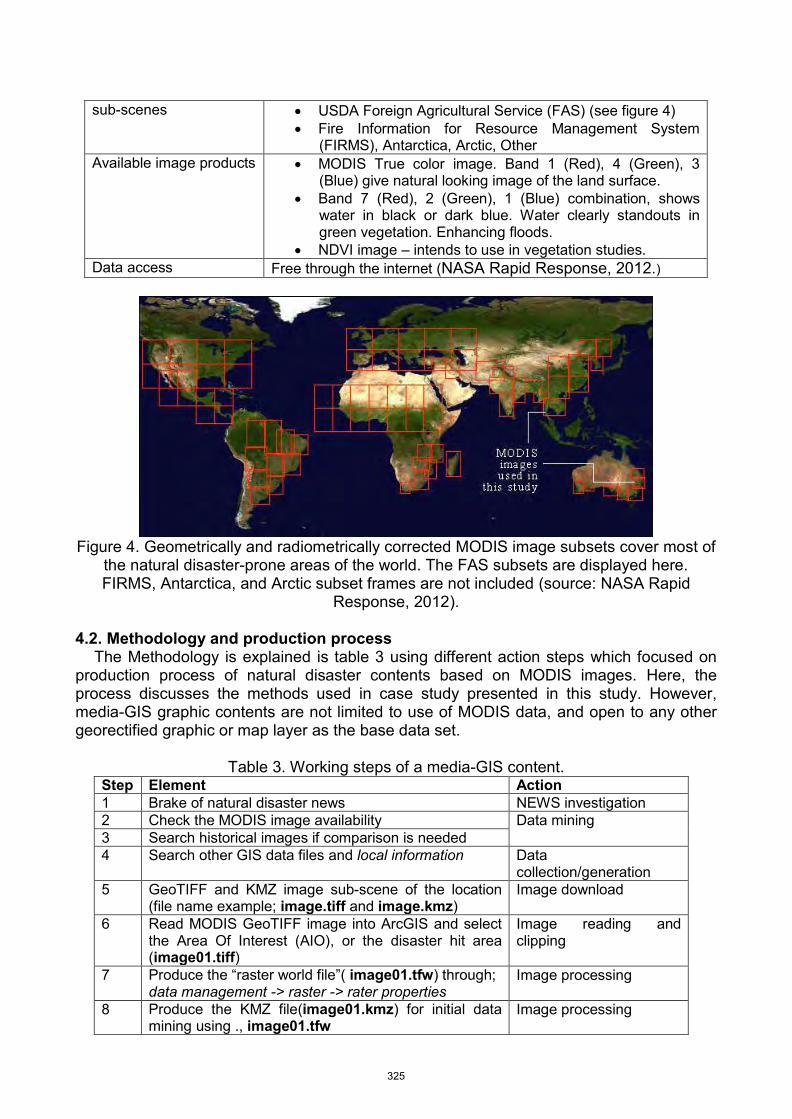
sub-scenes USDA Foreign Agricultural Service (FAS) (see figure 4) Fire Information for Resource Management System
(FIRMS), Antarctica, Arctic, Other Available image products MODIS True color image. Band 1 (Red), 4 (Green), 3
(Blue) give natural looking image of the land surface. Band 7 (Red), 2 (Green), 1 (Blue) combination, shows
water in black or dark blue. Water clearly standouts in green vegetation. Enhancing floods.
NDVI image – intends to use in vegetation studies. Data access Free through the internet (NASA Rapid Response, 2012.)
Figure 4. Geometrically and radiometrically corrected MODIS image subsets cover most of
the natural disaster-prone areas of the world. The FAS subsets are displayed here. FIRMS, Antarctica, and Arctic subset frames are not included (source: NASA Rapid
Response, 2012). 4.2. Methodology and production process
The Methodology is explained is table 3 using different action steps which focused on production process of natural disaster contents based on MODIS images. Here, the process discusses the methods used in case study presented in this study. However, media-GIS graphic contents are not limited to use of MODIS data, and open to any other georectified graphic or map layer as the base data set.
Table 3. Working steps of a media-GIS content. Step Element Action 1 Brake of natural disaster news NEWS investigation 2 Check the MODIS image availability Data mining 3 Search historical images if comparison is needed 4 Search other GIS data files and local information Data
collection/generation 5 GeoTIFF and KMZ image sub-scene of the location
(file name example; image.tiff and image.kmz) Image download
6 Read MODIS GeoTIFF image into ArcGIS and select the Area Of Interest (AIO), or the disaster hit area (image01.tiff)
Image reading and clipping
7 Produce the “raster world file”( image01.tfw) through; data management -> raster -> rater properties
Image processing
8 Produce the KMZ file(image01.kmz) for initial data mining using ., image01.tfw
Image processing
325
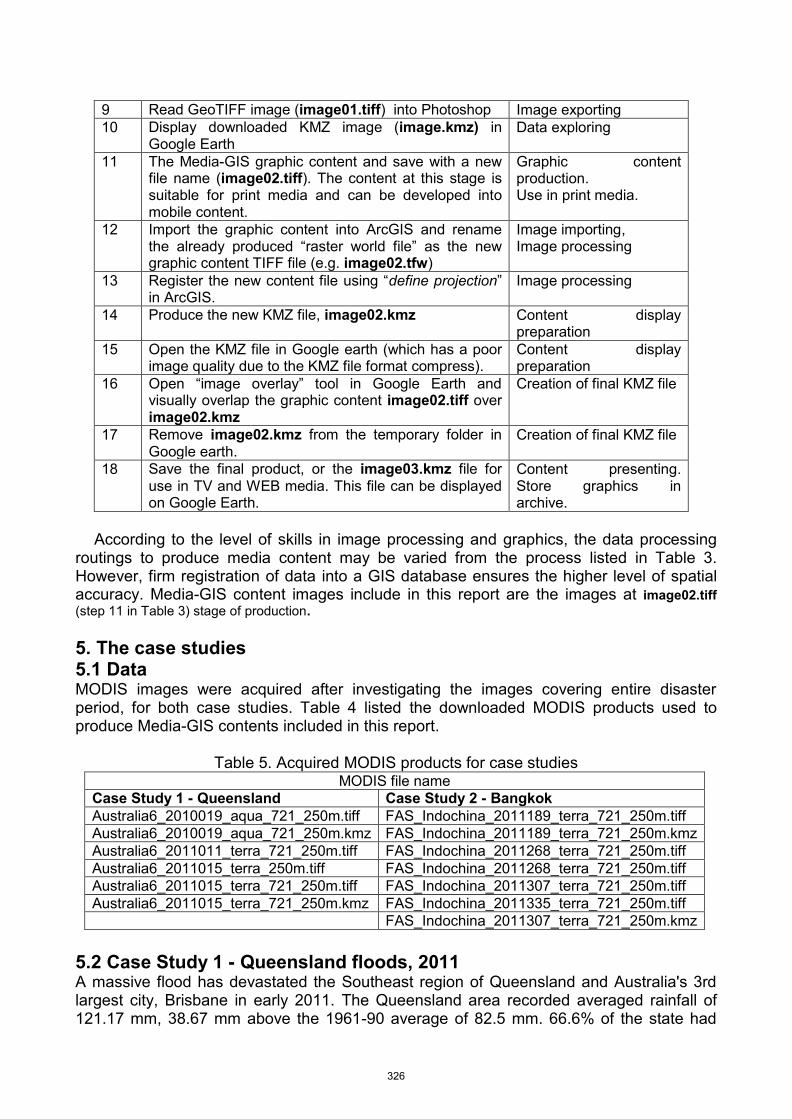
9 Read GeoTIFF image (image01.tiff) into Photoshop Image exporting 10 Display downloaded KMZ image (image.kmz) in
Google Earth Data exploring
11 The Media-GIS graphic content and save with a new file name (image02.tiff). The content at this stage is suitable for print media and can be developed into mobile content.
Graphic content production. Use in print media.
12 Import the graphic content into ArcGIS and rename the already produced “raster world file” as the new graphic content TIFF file (e.g. image02.tfw)
Image importing, Image processing
13 Register the new content file using “define projection” in ArcGIS.
Image processing
14 Produce the new KMZ file, image02.kmz Content display preparation
15 Open the KMZ file in Google earth (which has a poor image quality due to the KMZ file format compress).
Content display preparation
16 Open “image overlay” tool in Google Earth and visually overlap the graphic content image02.tiff over image02.kmz
Creation of final KMZ file
17 Remove image02.kmz from the temporary folder in Google earth.
Creation of final KMZ file
18 Save the final product, or the image03.kmz file for use in TV and WEB media. This file can be displayed on Google Earth.
Content presenting. Store graphics in archive.
According to the level of skills in image processing and graphics, the data processing
routings to produce media content may be varied from the process listed in Table 3. However, firm registration of data into a GIS database ensures the higher level of spatial accuracy. Media-GIS content images include in this report are the images at image02.tiff (step 11 in Table 3) stage of production. 5. The case studies 5.1 Data MODIS images were acquired after investigating the images covering entire disaster period, for both case studies. Table 4 listed the downloaded MODIS products used to produce Media-GIS contents included in this report.
Table 5. Acquired MODIS products for case studies MODIS file name
Case Study 1 - Queensland Case Study 2 - Bangkok Australia6_2010019_aqua_721_250m.tiff FAS_Indochina_2011189_terra_721_250m.tiff Australia6_2010019_aqua_721_250m.kmz FAS_Indochina_2011189_terra_721_250m.kmz Australia6_2011011_terra_721_250m.tiff FAS_Indochina_2011268_terra_721_250m.tiff Australia6_2011015_terra_250m.tiff FAS_Indochina_2011268_terra_721_250m.tiff Australia6_2011015_terra_721_250m.tiff FAS_Indochina_2011307_terra_721_250m.tiff Australia6_2011015_terra_721_250m.kmz FAS_Indochina_2011335_terra_721_250m.tiff FAS_Indochina_2011307_terra_721_250m.kmz
5.2 Case Study 1 - Queensland floods, 2011 A massive flood has devastated the Southeast region of Queensland and Australia's 3rd largest city, Brisbane in early 2011. The Queensland area recorded averaged rainfall of 121.17 mm, 38.67 mm above the 1961-90 average of 82.5 mm. 66.6% of the state had
326
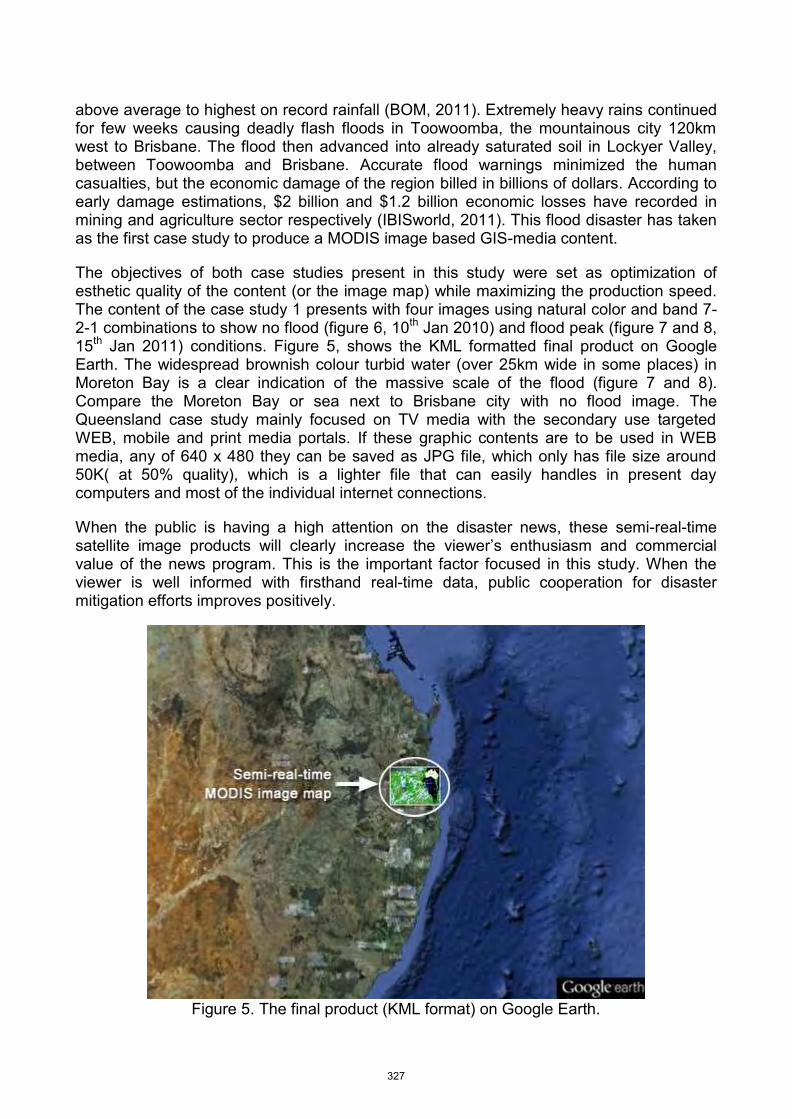
above average to highest on record rainfall (BOM, 2011). Extremely heavy rains continued for few weeks causing deadly flash floods in Toowoomba, the mountainous city 120km west to Brisbane. The flood then advanced into already saturated soil in Lockyer Valley, between Toowoomba and Brisbane. Accurate flood warnings minimized the human casualties, but the economic damage of the region billed in billions of dollars. According to early damage estimations, $2 billion and $1.2 billion economic losses have recorded in mining and agriculture sector respectively (IBISworld, 2011). This flood disaster has taken as the first case study to produce a MODIS image based GIS-media content.
The objectives of both case studies present in this study were set as optimization of esthetic quality of the content (or the image map) while maximizing the production speed. The content of the case study 1 presents with four images using natural color and band 7-2-1 combinations to show no flood (figure 6, 10th Jan 2010) and flood peak (figure 7 and 8, 15th Jan 2011) conditions. Figure 5, shows the KML formatted final product on Google Earth. The widespread brownish colour turbid water (over 25km wide in some places) in Moreton Bay is a clear indication of the massive scale of the flood (figure 7 and 8). Compare the Moreton Bay or sea next to Brisbane city with no flood image. The Queensland case study mainly focused on TV media with the secondary use targeted WEB, mobile and print media portals. If these graphic contents are to be used in WEB media, any of 640 x 480 they can be saved as JPG file, which only has file size around 50K( at 50% quality), which is a lighter file that can easily handles in present day computers and most of the individual internet connections.
When the public is having a high attention on the disaster news, these semi-real-time satellite image products will clearly increase the viewer’s enthusiasm and commercial value of the news program. This is the important factor focused in this study. When the viewer is well informed with firsthand real-time data, public cooperation for disaster mitigation efforts improves positively.
Figure 5. The final product (KML format) on Google Earth.
327
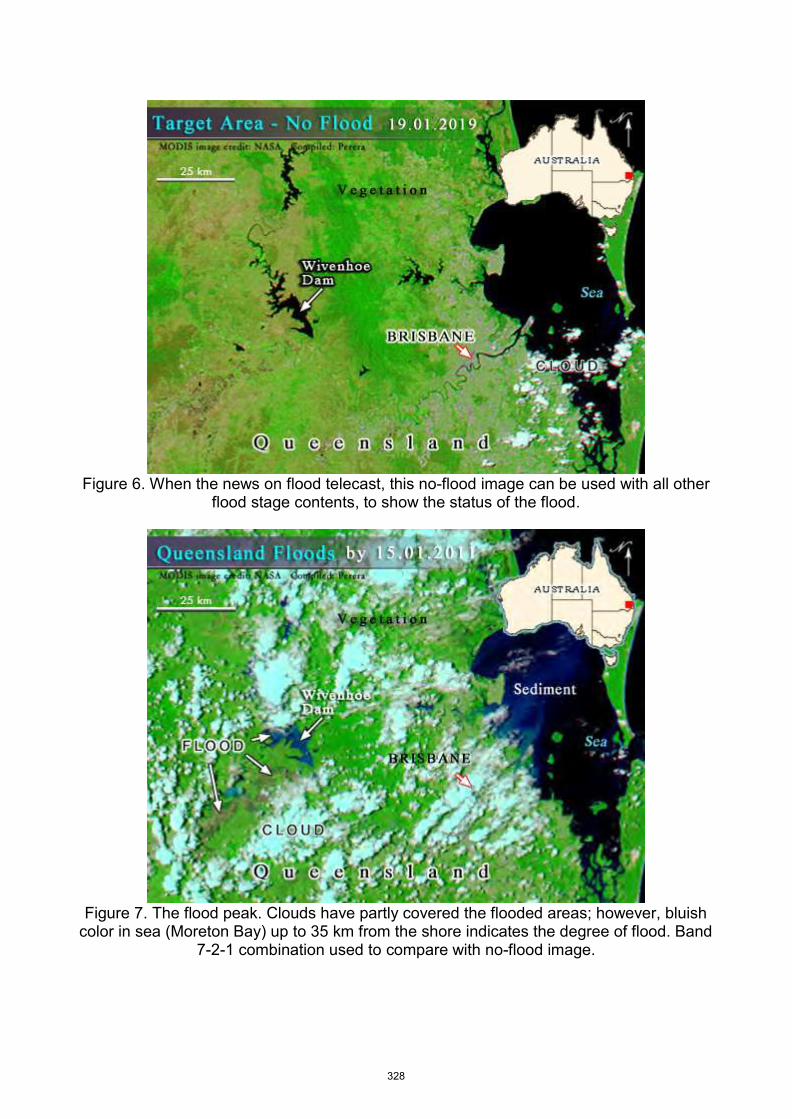
Figure 6. When the news on flood telecast, this no-flood image can be used with all other
flood stage contents, to show the status of the flood.
Figure 7. The flood peak. Clouds have partly covered the flooded areas; however, bluish
color in sea (Moreton Bay) up to 35 km from the shore indicates the degree of flood. Band 7-2-1 combination used to compare with no-flood image.
328
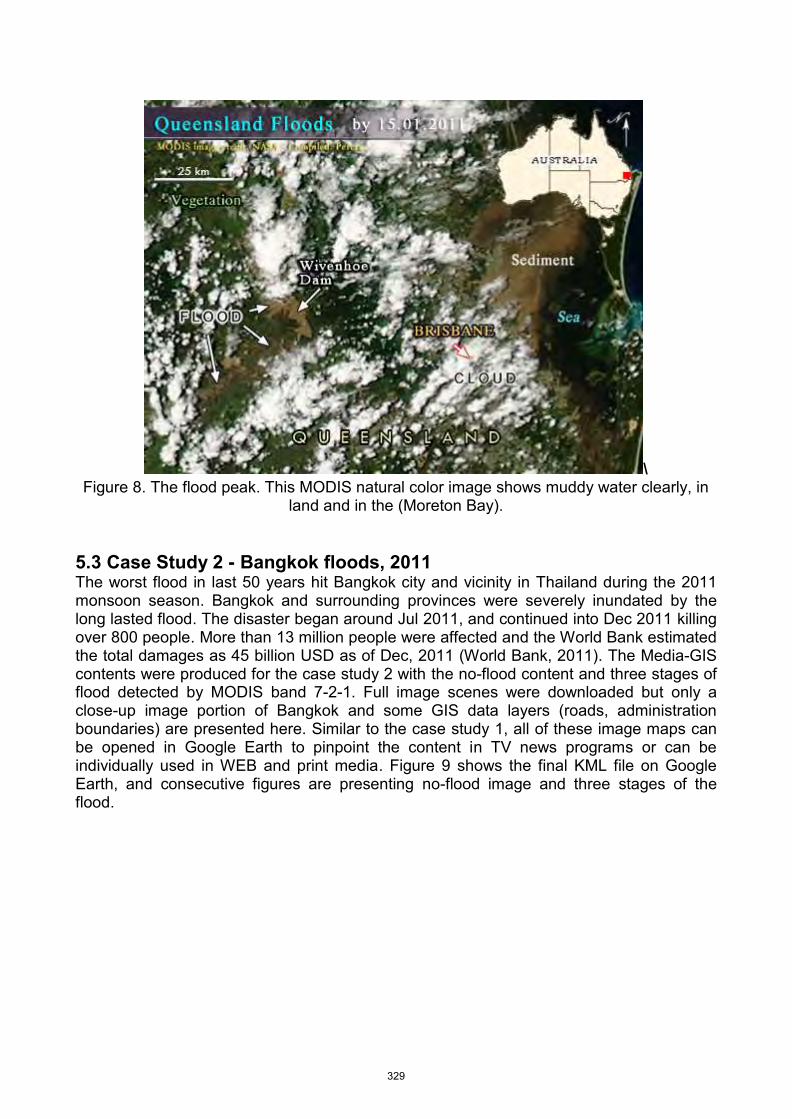
\ Figure 8. The flood peak. This MODIS natural color image shows muddy water clearly, in
land and in the (Moreton Bay).
5.3 Case Study 2 - Bangkok floods, 2011 The worst flood in last 50 years hit Bangkok city and vicinity in Thailand during the 2011 monsoon season. Bangkok and surrounding provinces were severely inundated by the long lasted flood. The disaster began around Jul 2011, and continued into Dec 2011 killing over 800 people. More than 13 million people were affected and the World Bank estimated the total damages as 45 billion USD as of Dec, 2011 (World Bank, 2011). The Media-GIS contents were produced for the case study 2 with the no-flood content and three stages of flood detected by MODIS band 7-2-1. Full image scenes were downloaded but only a close-up image portion of Bangkok and some GIS data layers (roads, administration boundaries) are presented here. Similar to the case study 1, all of these image maps can be opened in Google Earth to pinpoint the content in TV news programs or can be individually used in WEB and print media. Figure 9 shows the final KML file on Google Earth, and consecutive figures are presenting no-flood image and three stages of the flood.
329
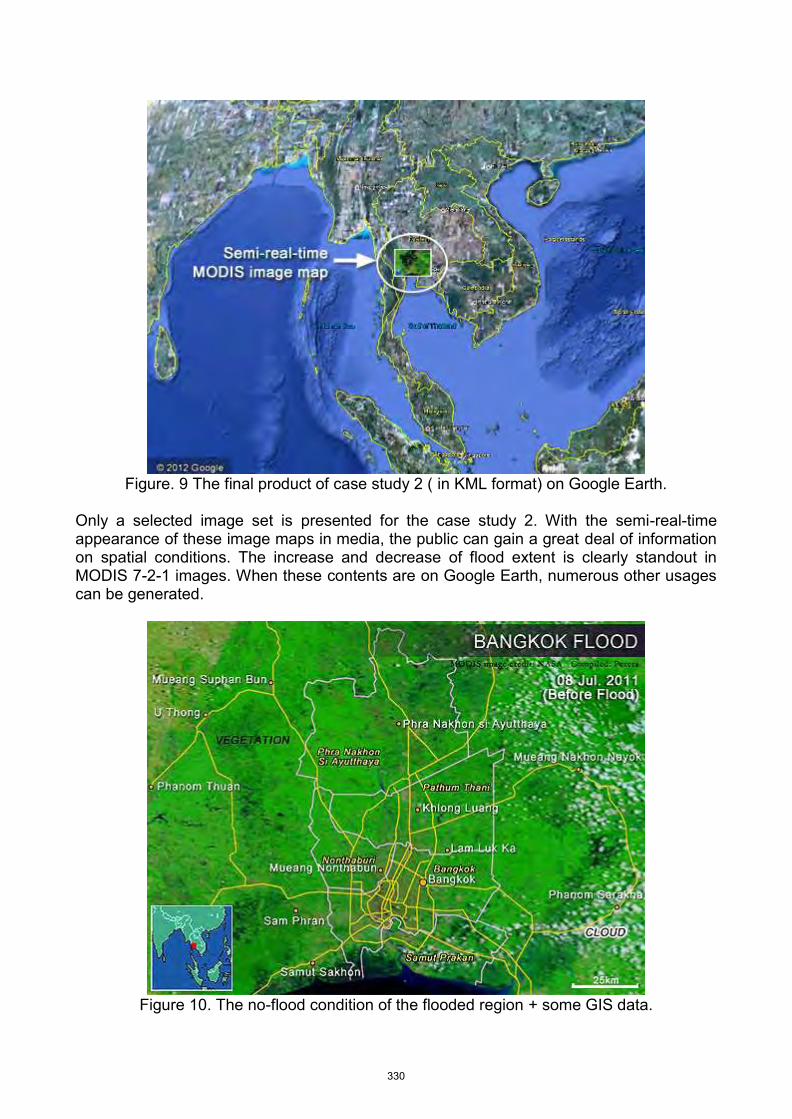
Figure. 9 The final product of case study 2 ( in KML format) on Google Earth.
Only a selected image set is presented for the case study 2. With the semi-real-time appearance of these image maps in media, the public can gain a great deal of information on spatial conditions. The increase and decrease of flood extent is clearly standout in MODIS 7-2-1 images. When these contents are on Google Earth, numerous other usages can be generated.
Figure 10. The no-flood condition of the flooded region + some GIS data.
330
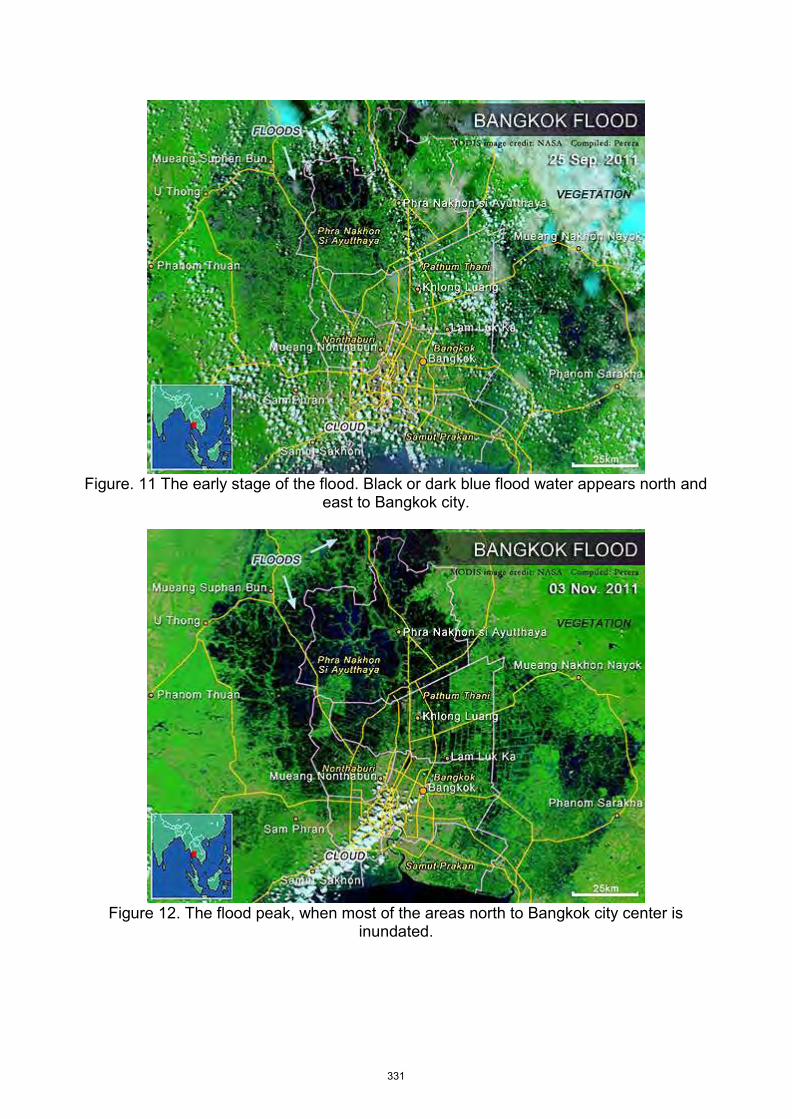
Figure. 11 The early stage of the flood. Black or dark blue flood water appears north and
east to Bangkok city.
Figure 12. The flood peak, when most of the areas north to Bangkok city center is
inundated.
331
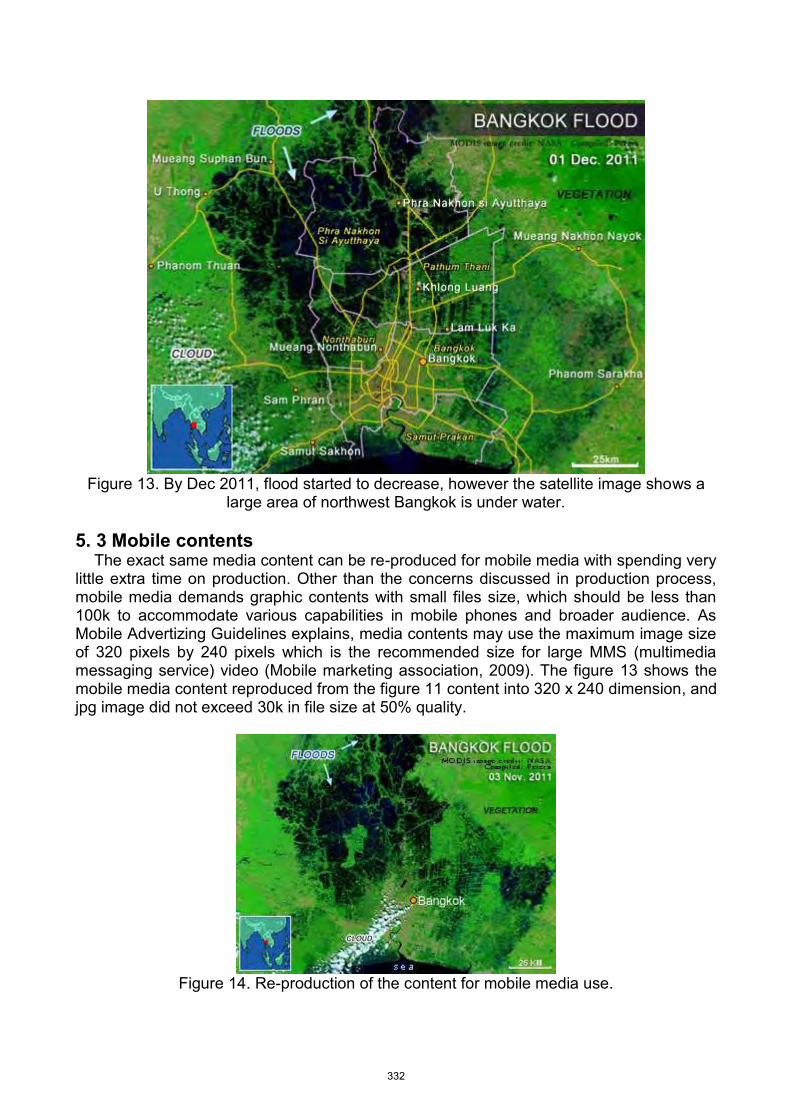
Figure 13. By Dec 2011, flood started to decrease, however the satellite image shows a
large area of northwest Bangkok is under water. 5. 3 Mobile contents
The exact same media content can be re-produced for mobile media with spending very little extra time on production. Other than the concerns discussed in production process, mobile media demands graphic contents with small files size, which should be less than 100k to accommodate various capabilities in mobile phones and broader audience. As Mobile Advertizing Guidelines explains, media contents may use the maximum image size of 320 pixels by 240 pixels which is the recommended size for large MMS (multimedia messaging service) video (Mobile marketing association, 2009). The figure 13 shows the mobile media content reproduced from the figure 11 content into 320 x 240 dimension, and jpg image did not exceed 30k in file size at 50% quality.
Figure 14. Re-production of the content for mobile media use.
332
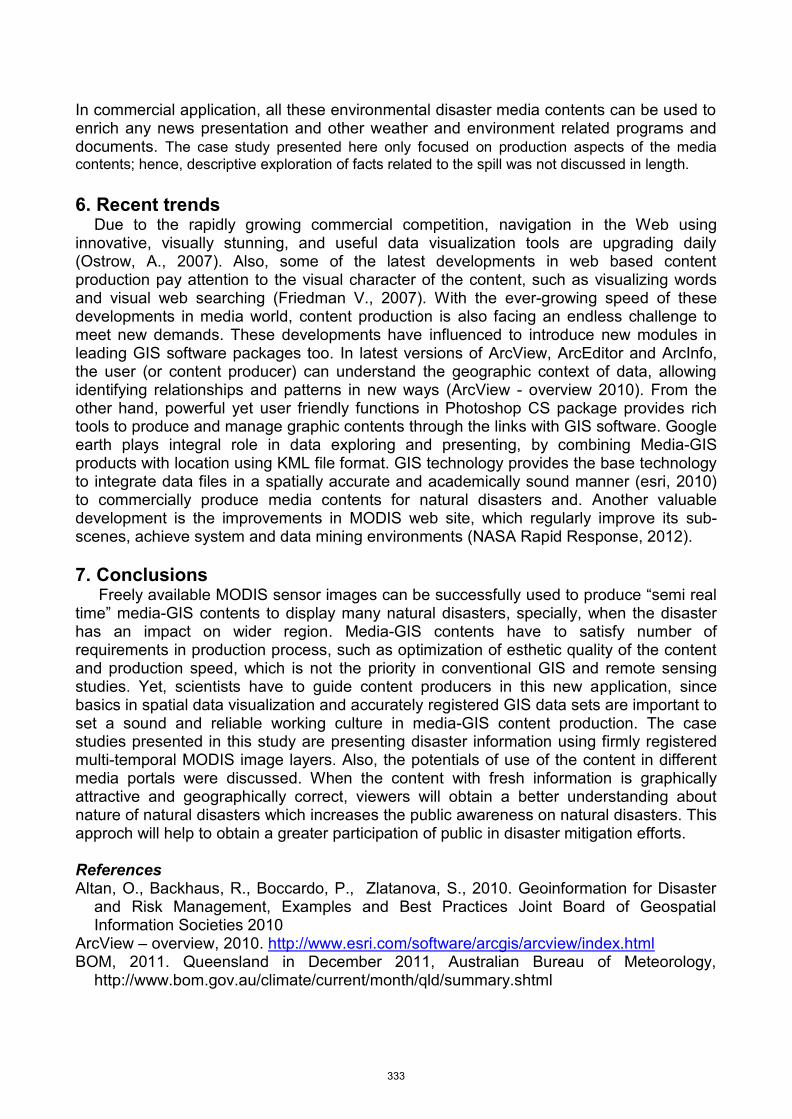
In commercial application, all these environmental disaster media contents can be used to enrich any news presentation and other weather and environment related programs and documents. The case study presented here only focused on production aspects of the media contents; hence, descriptive exploration of facts related to the spill was not discussed in length. 6. Recent trends
Due to the rapidly growing commercial competition, navigation in the Web using innovative, visually stunning, and useful data visualization tools are upgrading daily (Ostrow, A., 2007). Also, some of the latest developments in web based content production pay attention to the visual character of the content, such as visualizing words and visual web searching (Friedman V., 2007). With the ever-growing speed of these developments in media world, content production is also facing an endless challenge to meet new demands. These developments have influenced to introduce new modules in leading GIS software packages too. In latest versions of ArcView, ArcEditor and ArcInfo, the user (or content producer) can understand the geographic context of data, allowing identifying relationships and patterns in new ways (ArcView - overview 2010). From the other hand, powerful yet user friendly functions in Photoshop CS package provides rich tools to produce and manage graphic contents through the links with GIS software. Google earth plays integral role in data exploring and presenting, by combining Media-GIS products with location using KML file format. GIS technology provides the base technology to integrate data files in a spatially accurate and academically sound manner (esri, 2010) to commercially produce media contents for natural disasters and. Another valuable development is the improvements in MODIS web site, which regularly improve its sub-scenes, achieve system and data mining environments (NASA Rapid Response, 2012).
7. Conclusions
Freely available MODIS sensor images can be successfully used to produce “semi real time” media-GIS contents to display many natural disasters, specially, when the disaster has an impact on wider region. Media-GIS contents have to satisfy number of requirements in production process, such as optimization of esthetic quality of the content and production speed, which is not the priority in conventional GIS and remote sensing studies. Yet, scientists have to guide content producers in this new application, since basics in spatial data visualization and accurately registered GIS data sets are important to set a sound and reliable working culture in media-GIS content production. The case studies presented in this study are presenting disaster information using firmly registered multi-temporal MODIS image layers. Also, the potentials of use of the content in different media portals were discussed. When the content with fresh information is graphically attractive and geographically correct, viewers will obtain a better understanding about nature of natural disasters which increases the public awareness on natural disasters. This approch will help to obtain a greater participation of public in disaster mitigation efforts. References Altan, O., Backhaus, R., Boccardo, P., Zlatanova, S., 2010. Geoinformation for Disaster
and Risk Management, Examples and Best Practices Joint Board of Geospatial Information Societies 2010
ArcView – overview, 2010. http://www.esri.com/software/arcgis/arcview/index.html BOM, 2011. Queensland in December 2011, Australian Bureau of Meteorology,
http://www.bom.gov.au/climate/current/month/qld/summary.shtml
333
El-Masri, S., & Tipple, G., 2010. Natural Disaster, Mitigation and Sustainability: The Case of Developing Countries, The Case of Developing Countries, International Planning Studies, 7:2, 157-175
esri, 2010. GIS for Media and press, http://www.esri.com/industries/media/index.html Friedl, M.A., McIver, D.K., Hodges, J.C.F., Zhang, X.Y., et al., 2002. Global land cover
mapping from MODIS: algorithms and early results. Remote Sens Environ 83, pp 287–302
Friedman, V., 2007. Data Visualization: Modern Approaches, http://www.smashingmagazine.com/2007/08/02/data-visualization-modern-approaches/
Godschalk, D. R., brody, S., burby, R., 2003. Public Participation in Natural Hazard Mitigation Policy Formation: Challenges for Comprehensive Planning, Journal of Environmental Planning and Management, 46:5, 733-754
Gumley, L., Descloitre, J., Shmaltz, J.. Creating, 2003. Reprojected True Color MODIS Images: A Tutorial. University of Wisconsin–Madison, 19 pages.
Hall, D.K., Riggs, G.A., Salomonson, V.V., DiGirolamo, N.E., Bayr, K.J., 2002. MODISsnow cover products. Remote Sens. Environ. 83, pp.181–194
IBISworld, 2011. Queensland floods: The economic impact, www.ibisworld.com.au Jayawardane, A.K.W., (2005). Disaster Mitigation Initiatives in Sri Lanka,
http://management.kochi-tech.ac.jp/PDF/IWPM/IWPM_Jayawardane.pdf Kraak, M., 1999. 'Visualising spatial distributions', in Geographical information systems,
vol. 1, 2nd edn, John Wiley & Sons, Canada, pp. 157-173. Mobile marketing association, 2009. Mobile Advertizing Guidelines, Version 04.
http://www.mmaglobal.com/mobileadvertising.pdf MODIS web, 2012. http://modis.gsfc.nasa.gov/ Nakya, S., Rangsipanich, A., Kaewsing, W., 2007. Applications of terra MODIS data for
disaster monitoring in Thailand, Geo-Informatics and Space Technology Development Agency, Thailand.
NASA Rapid Response, 2012. http://lance.nasa.gov/imagery/rapid-response/ Nationmaster.com 2010. Encyclopedia - Geographic information system
http://www.statemaster.com/encyclopedia/Geographic-information-system newworldencyclopedia 2008. mass media,
http://www.newworldencyclopedia.org/entry/Mass_media Ostrow, A., 2007. 16 Awesome Data Visualization Tools,
http://mashable.com/2007/05/15/16-awesome-data-visualization-tools/ Pearce, L. (2003). Disaster Management and Community Planning, and Public
Participation: How to Achieve Sustainable Hazard Mitigation, Natural Hazards 28: 211–228, 2003.
Perera, K. & Pathirana, A., 2006. The role of MODIS data in visualizing flood disaster information for mass media. Asian Journal of Geoinformatics, 6 (3). ISSN 1513-6728
Perera K., & Tateishi R., 2008. Semi-real time media contents on haze hazard in Ganges River Basin, 14th CEReS International Symposium of Remote Sensing, Nov 2008
Perera, K., & Tsuchiya, K., 2009. Experiment for mapping land cover and its change in south eastern Sri Lanka utilizing 250 m resolution MODIS, Advances in Space Research 43, pp. 1349–1355
Short N. M., 2010. Remote Sensing Tutorials, Ecological Damage from Natural and Manmade Events Oil Spills, http://rst.gsfc.nasa.gov/Sect3/Sect3_6a.html
Stroehlein A., 2010. Why the media prefer natural disasters? http://www.alertnet.org/db/blogs/3159/2010/00/21-100650-1.htm
Sultan A, H. S. Lim, M. Z. MatJafri, K. Abdullah and N., Saleh, 2008. Innovative satellite image map of R.Alkhabrta area, Saudi Arabia using high resolution image, The
334
International Archives of the Photogrammetry, Remote Sensing and Spatial Information Sciences. Vol. XXXVII. Part B7. Beijing
USGS Geography Publications, 2008. Geographic Information Systems, http://edc2.usgs.gov/pubslists/gis_poster/index.php
USGS, 2007. MODIS NDVI products, https://lpdaac.usgs.gov/lpdaac/products USGS, 2011. Near Real-time Satellite Data Delivery for Natural Disasters,
https://lpdaac.usgs.gov/user_community/data_in_action Weichselgartner, J. (2001). Disaster Prevention and Management, Emerald Article:
Disaster mitigation: the concept of vulnerability revisited. Disaster Prevention and Management, Vol. 10 Iss: 2 pp. 85 - 95
World Bank, 2011. The World Bank Supports Thailand's Post-Floods Recovery Effort http://go.worldbank.org/TCFEHXJML0
Zhan, X., Sohlberg, R.A., Townshend, J.R, G., DiMiceli, C., Caroll, M.L., Eastman, J.C., Hansen, M.C., DeFries, R.S., 2002. Detection of land cover changes using MODIS 250 m data. Remote Sens. Environ. 83, pp. 336–350
335
Shipping Disaster of The Rena in the New Zealand Waters: Looking into the Possible Causes and Ongoing Recovery Operations?
Dr. Ram Roy
Senior Lecturer in Management
Eastern Institute of Technology, Napier, New Zealand.
Paper presented at EARTH: FIRE AND RAIN Australian & New Zealand Disaster and Emergency Management Conference Brisbane, 16 – 18, April 2012
336
Shipping Disaster of The Rena in the New Zealand Waters: Looking into the Possible Causes and Ongoing Recovery Operations?
Abstract This paper deals briefly into the past shipping disasters in the New Zealand waters and investigates the reasons behind the recent shipping disaster in Tauranga, where the recovery operations are still going on. Based on the external sources of information, personal visits and interviews with various people, the paper collates and analyses the causes behind the disaster using statistical tools and techniques such as Ishikawa diagram, and decision tree analysis. The main objectives behind the paper are to identify the potential causes of the Rena disaster using various sources of information, list the important events during the recovery operations, analyze the various alternatives and the associated risks and gains using a decision tree, to identify the effects of this disaster on supply chain management and customers’ businesses, to carry out a post-incident-review, and to recommend ways in which such disasters in future should be responded to.
Keywords: disaster, management, recovery, oil-spillage, risk-analysis
Introduction This paper briefly collates the important shipping disasters that occurred in the New Zealand waters (Table 1) for a period of over a hundred years (1863-1968). It is observed from Table 1 that the reasons behind most of the ship disasters are still unknown. Although fire incidents have occurred only twice, it has caused the maximum deaths (549) followed by the storms (99). Also noted is the interval of disasters. Earlier (1863-68) the incidents were occurring almost every two years, but after 1868 it was about every 6 to 8 years which may be due to improved technology and better safety policies followed by the shipping companies. The happiest interval without any shipping disasters was 41 years (1909-50) which later changed to 7-8 years. So, what could be the reasons behind this interval? Is it because the crew members and the shipping companies become slack and complacent with their health and safety procedures after every few years? After this brief introductory account of past disasters, the paper shifts its focus to the very recent disaster that took place near the port of Tauranga in New Zealand. The paper identifies the potential reasons (some confirmed while others unconfirmed) behind one of the worst disasters in country’s maritime history. A brief background of this incident is given below. While this paper is in progress, we also came across two ship disasters one in Italy (The Costa Concordia) on 15th Jan 2012 and other in Christmas Island of Australia. Background of the incident Various newspapers and electronic media in New Zealand and all over the world reported the ship disaster that took place on Oct 5, 2011. A ship named ‘The Rena’, with a s peed of about 17 knots (20 mph), ran aground
on the Astrolabe reef, about 17 kms away from the coast of Tauranga in New Zealand. The ship was carrying 1,368 containers (8 of them with hazardous materials), 1,700 tons of heavy fuel oil and 200 tons of marine diesel. Initially
337
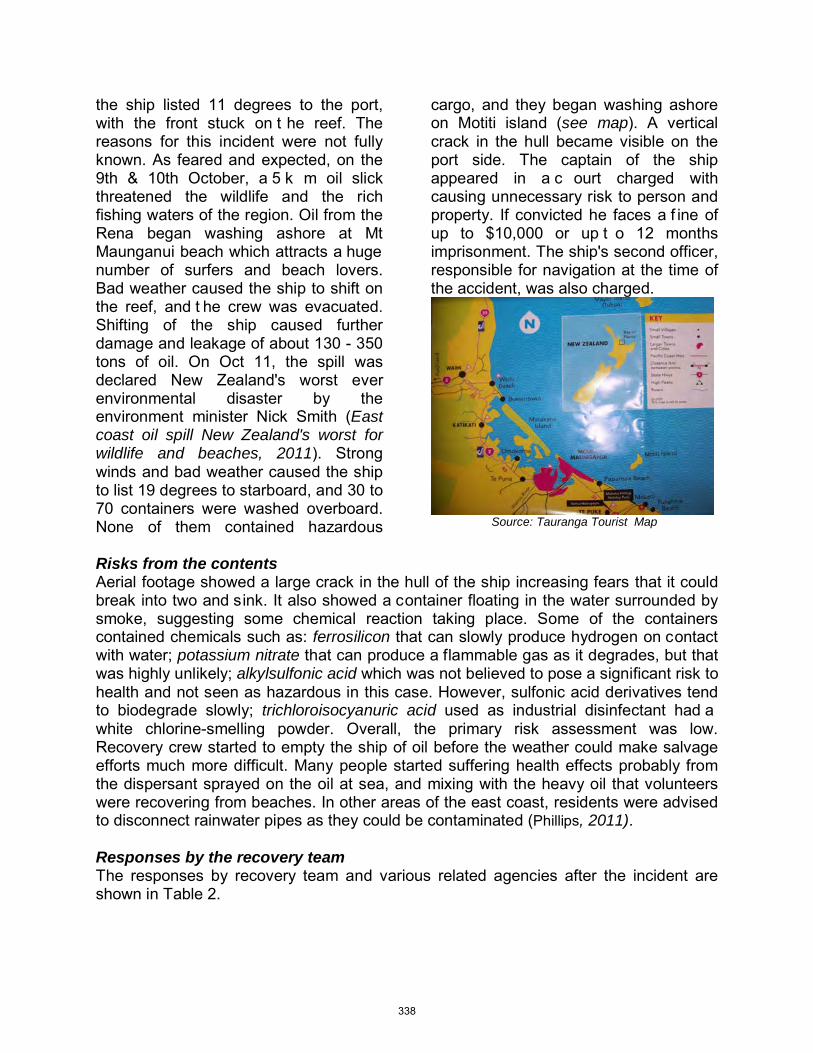
the ship listed 11 degrees to the port, with the front stuck on t he reef. The reasons for this incident were not fully known. As feared and expected, on the 9th & 10th October, a 5 k m oil slick threatened the wildlife and the rich fishing waters of the region. Oil from the Rena began washing ashore at Mt Maunganui beach which attracts a huge number of surfers and beach lovers. Bad weather caused the ship to shift on the reef, and t he crew was evacuated. Shifting of the ship caused further damage and leakage of about 130 - 350 tons of oil. On Oct 11, the spill was declared New Zealand's worst ever environmental disaster by the environment minister Nick Smith (East coast oil spill New Zealand's worst for wildlife and beaches, 2011). Strong winds and bad weather caused the ship to list 19 degrees to starboard, and 30 to 70 containers were washed overboard. None of them contained hazardous
cargo, and they began washing ashore on Motiti island (see map). A vertical crack in the hull became visible on the port side. The captain of the ship appeared in a c ourt charged with causing unnecessary risk to person and property. If convicted he faces a f ine of up to $10,000 or up t o 12 months imprisonment. The ship's second officer, responsible for navigation at the time of the accident, was also charged.
Source: Tauranga Tourist Map
Risks from the contents Aerial footage showed a large crack in the hull of the ship increasing fears that it could break into two and sink. It also showed a container floating in the water surrounded by smoke, suggesting some chemical reaction taking place. Some of the containers contained chemicals such as: ferrosilicon that can slowly produce hydrogen on contact with water; potassium nitrate that can produce a flammable gas as it degrades, but that was highly unlikely; alkylsulfonic acid which was not believed to pose a significant risk to health and not seen as hazardous in this case. However, sulfonic acid derivatives tend to biodegrade slowly; trichloroisocyanuric acid used as industrial disinfectant had a white chlorine-smelling powder. Overall, the primary risk assessment was low. Recovery crew started to empty the ship of oil before the weather could make salvage efforts much more difficult. Many people started suffering health effects probably from the dispersant sprayed on the oil at sea, and mixing with the heavy oil that volunteers were recovering from beaches. In other areas of the east coast, residents were advised to disconnect rainwater pipes as they could be contaminated (Phillips, 2011). Responses by the recovery team The responses by recovery team and various related agencies after the incident are shown in Table 2.
338
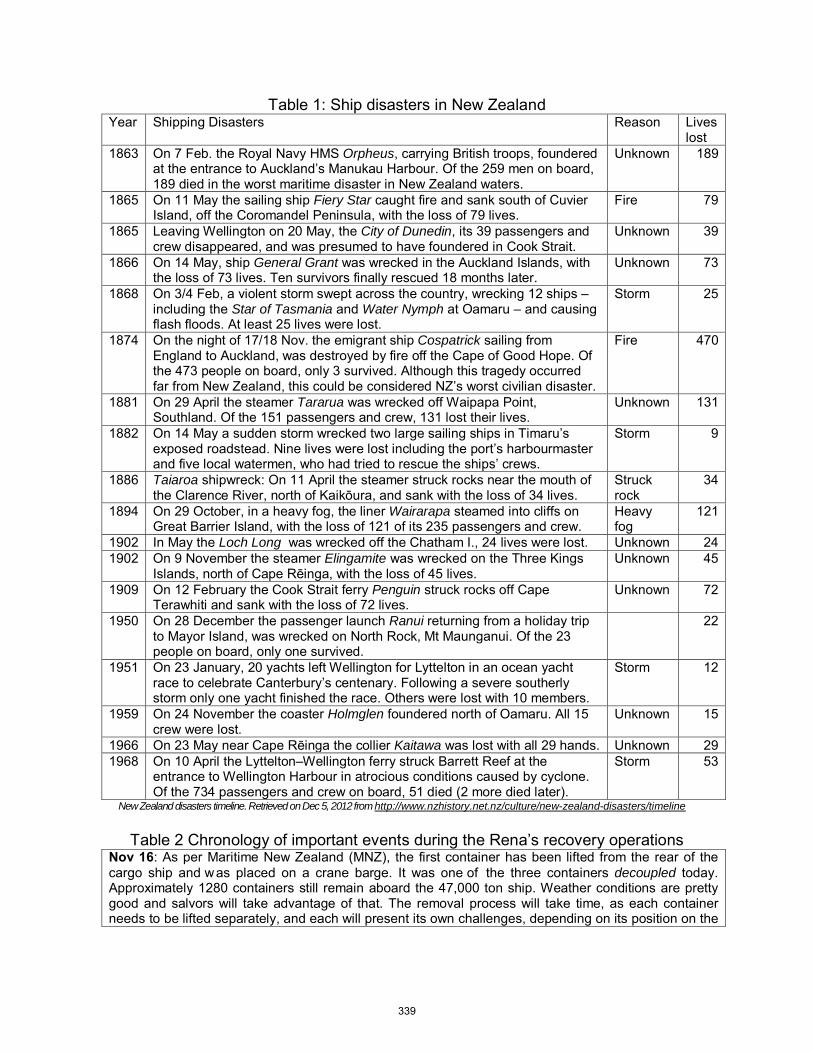
Table 1: Ship disasters in New Zealand Year Shipping Disasters Reason Lives
lost 1863 On 7 Feb. the Royal Navy HMS Orpheus, carrying British troops, foundered
at the entrance to Auckland’s Manukau Harbour. Of the 259 men on board, 189 died in the worst maritime disaster in New Zealand waters.
Unknown 189
1865 On 11 May the sailing ship Fiery Star caught fire and sank south of Cuvier Island, off the Coromandel Peninsula, with the loss of 79 lives.
Fire 79
1865 Leaving Wellington on 20 May, the City of Dunedin, its 39 passengers and crew disappeared, and was presumed to have foundered in Cook Strait.
Unknown 39
1866 On 14 May, ship General Grant was wrecked in the Auckland Islands, with the loss of 73 lives. Ten survivors finally rescued 18 months later.
Unknown 73
1868 On 3/4 Feb, a violent storm swept across the country, wrecking 12 ships – including the Star of Tasmania and Water Nymph at Oamaru – and causing flash floods. At least 25 lives were lost.
Storm 25
1874 On the night of 17/18 Nov. the emigrant ship Cospatrick sailing from England to Auckland, was destroyed by fire off the Cape of Good Hope. Of the 473 people on board, only 3 survived. Although this tragedy occurred far from New Zealand, this could be considered NZ’s worst civilian disaster.
Fire 470
1881 On 29 April the steamer Tararua was wrecked off Waipapa Point, Southland. Of the 151 passengers and crew, 131 lost their lives.
Unknown 131
1882 On 14 May a sudden storm wrecked two large sailing ships in Timaru’s exposed roadstead. Nine lives were lost including the port’s harbourmaster and five local watermen, who had tried to rescue the ships’ crews.
Storm 9
1886 Taiaroa shipwreck: On 11 April the steamer struck rocks near the mouth of the Clarence River, north of Kaikōura, and sank with the loss of 34 lives.
Struck rock
34
1894 On 29 October, in a heavy fog, the liner Wairarapa steamed into cliffs on Great Barrier Island, with the loss of 121 of its 235 passengers and crew.
Heavy fog
121
1902 In May the Loch Long was wrecked off the Chatham I., 24 lives were lost. Unknown 24 1902 On 9 November the steamer Elingamite was wrecked on the Three Kings
Islands, north of Cape Rēinga, with the loss of 45 lives. Unknown 45
1909 On 12 February the Cook Strait ferry Penguin struck rocks off Cape Terawhiti and sank with the loss of 72 lives.
Unknown 72
1950 On 28 December the passenger launch Ranui returning from a holiday trip to Mayor Island, was wrecked on North Rock, Mt Maunganui. Of the 23 people on board, only one survived.
22
1951 On 23 January, 20 yachts left Wellington for Lyttelton in an ocean yacht race to celebrate Canterbury’s centenary. Following a severe southerly storm only one yacht finished the race. Others were lost with 10 members.
Storm 12
1959 On 24 November the coaster Holmglen foundered north of Oamaru. All 15 crew were lost.
Unknown 15
1966 On 23 May near Cape Rēinga the collier Kaitawa was lost with all 29 hands. Unknown 29 1968 On 10 April the Lyttelton–Wellington ferry struck Barrett Reef at the
entrance to Wellington Harbour in atrocious conditions caused by cyclone. Of the 734 passengers and crew on board, 51 died (2 more died later).
Storm 53
New Zealand disasters timeline. Retrieved on Dec 5, 2012 from http://www.nzhistory.net.nz/culture/new-zealand-disasters/timeline
Table 2 Chronology of important events during the Rena’s recovery operations Nov 16: As per Maritime New Zealand (MNZ), the first container has been lifted from the rear of the cargo ship and was placed on a crane barge. It was one of the three containers decoupled today. Approximately 1280 containers still remain aboard the 47,000 ton ship. Weather conditions are pretty good and salvors will take advantage of that. The removal process will take time, as each container needs to be lifted separately, and each will present its own challenges, depending on its position on the
339
vessel and how badly damaged it is (One container down, 1279 to go, 16 Nov 2011). Nov 17: Calm seas allowed 15 more containers to be lifted from the rear of the cargo ship to a crane barge. “With every container removed, the consequences are lessened, but every day is a new day and each container presents its own puzzle. Cranes cannot operate in winds greater than around 24 knots, so we are very much at the mercy of the weather. Even if it looks calm, strong winds can halt operations," MNZ salvage unit manager Kenny Crawford said. Salvors have fitted 220 transponders to containers aboard the ship and tugs are there to provide additional support for vessel operations. Approximately 1260 containers remain aboard the ship. At a rate of 18 containers/day, it would take more than 2 months to complete the job. No reports of oiling on b eaches; although teams of spill responders were ready to deal with such situations (Rena may have to be broken up, 17 Nov 2011). Nov 18: With most of the oil off the Rena and an environmental disaster seemingly averted, its owners and managers have thanked and apologized to New Zealanders, without specifying how much it will pay to cover the damage caused. While the insurance company of Rena's owners (The Swedish Club) have said they will meet their obligations ‘in full’, they have not outlined whether that would be capped according to its legal liability. New Zealand law restricts liability to $12 million, and taxpayers could be called upon to cover the remaining costs (Rena apology, but no word on compo, 18 Nov 2011). Nov 21: Total number of containers removed went to 64. The containers landed at the Port of Tauranga included two that were refrigerated, and held the remains of rotting food. Container recovery company processed those containers within two hours. Other work included the continued skimming of oil from the starboard fuel oil tank. A warm water washing trial at Mt Maunganui to remove residual oil from rocks had gone well. Health checks and micro-chipping of around 60 penguins were under way at the oiled wildlife facility before their planned release (Winds batter Rena salvors 21 Nov 2011). Nov 24: Containers could spill from the Rena as bad weather continues to shake the fragile cargo ship. The container recovery company Braemar Howells has vessels and personnel on s tandby, ready to respond if any containers fall overboard. Electronic sensors on board continue to monitor the ship's condition and indicated no significant change overnight. (Cooke and Johnston, 24 Nov 2011). Dec 4: Rough weather and s trong swells around the reef have caused oil previously trapped under Rena to leak. The ship suffered significant damage to its hull and salvors saw blobs of oil floating from the wreck. The strong swells at the reef were continuing to prevent container removal operations and were putting stress on t he damaged wreck. Electronic sensors used to monitor the wreck are not indicating any significant change in its movement (Gillies, 4 Dec 2011). Dec 19: Sharks attacked sonar equipment being used to look for containers that fell off the cargo ship. As a result, the recovery team had not been able to do s onar work yesterday. Total number of containers removed so far is 227. A container with meat products fell off the Rena and had been recovered, taking the total number of containers washed overboard from the ship to 89. Braemar Howells was processing 219 containers brought ashore. Dive inspections showed buckling damage continued to develop near the no.6 hold on the ship's starboard side which would be monitored. Also, a narrow trail of rainbow sheen was visible off the bow of the Rena to the northwest for 1km. (Sharks attack Rena salvage sonar gear, 19 Dec 2011).
Literature Review Researchers have worked on di fferent aspects of disaster recovery and management ranging from planning, forecasting, risk analysis, implementing, and evaluation. So, what is disaster recovery to start with? Disaster recovery is the process, policies and procedures related to preparing for recovery of infrastructure critical to an organization after a nat ural or human-induced disaster. Disaster recovery is a s ubset of business continuity. While business continuity involves planning for keeping all aspects of a business functioning in the midst of disruptive events, disaster recovery focuses on the systems that support business functions (Wikipedia, Jan 2012).
Researchers have also focused on scenario planning and what-if analysis approach to identify various kinds of solutions for different ranges of potential situations caused by
340
storm, fire, flood, oil spillage, earthquake, and tsunami. Schroeder (2011), for example, suggested ‘what if that doesn’t work’ approach for businesses where he advises very strongly that every small business needs to ask one c ritical question with respect to his/her current planning environment, ‘What if that doesn’t work?’ This according to Schroeder will help in making the operations really resilient, however, honest answers in this approach are very critical.
Business continuity has become a vital requirement within the overall corporate strategy, and disaster planning can play a very important role in the business continuity. In this context, Barry (2011) has highlighted the linkage between business continuity and technology, and has recommended that corporate should identify critically their strengths and weaknesses in the recovery plan and technology. Barry stresses that business continuity planners have relied on technology to assist in responding to a disruptive event. Staying prepared requires more than just a documented business continuity plan but teamwork from all stakeholders. A good plan should start with a risk impact analysis. Most companies will purchase an in-depth risk assessment and then do nothing about it which is like making a list of essentials to pack in a kit in case of a house fire but never assembling the kit. Companies that invest the time, resources, and technology into business continuity plans are better prepared to handle business disruptions. Shipping has become one of the most preferred modes of cargo transport and with this the risk on s ea has increased. Oil spills are becoming very common and disaster management needs to deal with it and its collateral damages on aquatic life and environment. It is very important to know how to deal with oil in the sea waters. In the related context, Mohammed et al. (2002) reported eco-toxicological examination of petroleum products and discussed factors affecting the removal of oil spill in marine and soil environments. According to them, ‘the effect of oil spill on the environment is described by four factors: organisms, soil, water and type of oil’. There are various methods to handle oil spills and oil contaminated sites. However, removal of the oil from the water surface or contaminated sites depends mainly on the oil type, weather conditions, penetration depth of the hydrocarbons and soil type. They also stress the importance of responding immediately to any oil accident whether onshore or offshore to minimize the potential environmental consequences. Oil contamination occurring on land can be handled using two procedures, viz. in-situ or ex-situ remediation. Curtis et al (2011) in their research analyzed structural and personal exposure to Hurricane Katrina. While structural exposure is measured by flood height and building damage; the personal exposure is measured by the locations of 911 calls made during the response. Using these variables, this paper characterizes the geography of exposure and also demonstrates the utility of a r obust analytical approach in understanding health-related challenges to disadvantaged populations during recovery. Analysis is conducted using a multiple additive regression tree (MART), which displays considerable improvement over traditional regression analysis. The most revealing finding is that African Americans experienced disproportionate exposure in both structural and personal contexts.
341
Decisions about disaster preparedness are rarely informed by cost-benefit analyses. Ruben et al (2011) presented an economic model to address the thorny question, ‘how prepared is prepared enough?’ Difficulties related to the use of cost-benefit analysis in the field of disaster management concern the tension between the large number of high-probability events that can be handled by a s ingle emergency response unit and the small number of low-probability events that must be handled by a large number of them. A further special feature of disaster management concerns the opportunity for cooperation between different emergency response units. To account for these issues, they introduced a portfolio approach which shows that it would be us eful to define disaster preparedness not in terms of capacities, but in terms of the frequency with which response capacity is expected to fall short. Another issue that concerns decision makers is whether they should go for in-house option or outside disaster recovery experts. Fordham (2011) has discussed this issue in the context of database disaster management and stresses that organizations seeking to maintain control over their valuable data, maximize utilization of existing staff and infrastructure and reduce costs, might attempt to realize these benefits through an in-house disaster recovery solution. Depending on the industry, disruptions can cost a company millions of dollars per hour. A company not wanting to add the ongoing cost of a service provider on top of those potential losses may be attracted to the in-house option. But with the shorter recovery time objectives, the specialized expertise required to achieve rapid recovery following a declared disaster and the high cost of creating and maintaining a truly resilient computing environment, many organizations may find that outsourcing to a service provider offers a more effective and economical disaster recovery or business continuity solution. This must have been the case in the decision making process of the Rena disaster management too where the services of outside providers have been used. Fordham concludes that organization could reap benefit by hiring the expertise of a highly trained staff focused exclusively on disaster recovery and business continuity. He advises that organizations should seriously consider to avail themselves of state-of-the-art facilities purpose-built to meet the recovery requirements of a modern business, and to achieve a r ecovery delivered with the speed and effectiveness to reduce the duration and impact of a business disruption.
Satapathy and Walia (2007) reports that fires cause a large number of deaths and injuries in India, and present many complex emergency management challenges. They reinforced the importance of adherence to safety regulations; the role of effective relief and rehabilitation; public-private partnership in disaster management; and t he importance of media management, humanitarian assistance during crisis management and response, gender sensitivity in relief and rehabilitation, and services provided to reduce mental health risks for the injured children and families.
Masuriera et al (2005) examined how reconstruction differs from routine construction, and focused on the challenges of allocation of responsibility for coordination, scarcity of resources and the application of legislation and regulations that were written for routine construction rather than post-disaster reconstruction.
342
Disaster recovery team and other agencies can learn lessons from the experiences of recent earthquakes and responses in New Zealand and Japan. On March 11, 2011 a magnitude 9.0 earthquake rocked the main island of Japan followed by tsunami which caused human, social and economic damages. The whole world watched the videos of exploding nuclear power plant buildings, demolished cities and personal accounts of the tragedy. After this event in Japan, many US firms were caught unprepared and had to face severe disruptions in their supply chains. Electronics and aerospace manufacturers with a significant supply chain presence in Japan had to face a high risk of parts outages. When they contacted their suppliers in the earthquake region, the initial reports were grim, and they informed their executives of the possible loss of critical parts, and estimated huge revenue loss. In the end, cross-functional global teams worked for a month very intensely to determine which suppliers had factories in the earthquake zone. Most manufacturers had not mapped that information before the earthquake and obtaining the information took weeks. “The shortages of components from our tier one suppliers were bad news as each component is generally used in multiple products. Still, the real nail biter was the possibility that a raw material deep in the supply chain could be unavailable,” related a supply chain manager (Brennan, 2011).
Brennan (2011) stresses four key points that could help suppliers with their supply chain network spread overseas: (i) don’t apply the 80/20 rule to supply chain disaster preparedness, (ii) identify supplier factory locations before a crisis hits, (iii) visibility into supply chain sub-tiers remains a key challenge, and (iv) large crisis events shift market share among competitors. “Natural disasters and supply chain disruptions are inevitable. To protect the revenue and marketing share, manufacturers must work proactively with their critical suppliers to know their factory locations and ensure they have adequate disaster preparedness in place. That visibility needs to extend into their supply chain sub-tiers as well. ‘During the recovery period, a weakened supply chain is vulnerable to other risks that might not otherwise lead to supply chain failure, therefore the need for better supply chain risk management is even greater’ (Brennan, Lessons Learned from the Japan Earthquake, 2011).
Dean et al. (2008) in their report points out that existing New Zealand legislation does not provide adequately for the facilitation of reconstruction projects following a major disaster. While the construction industry would most likely cope with a medium sized disaster if the base work load was at an average Resilient Organisations 3 M arch 2008 level, a l arge scale disaster coinciding with a h igh base load could require up to 180,000 additional construction workers. This information could be very relevant to the ongoing reconstruction project in Christchurch after the recent earthquakes. Report also highlights the urgent need for a well-developed and understood protocol or procedure for procurement in the event of disasters. International experience demonstrates the effectiveness of reflecting the cost of ‘downtime’ by linking performance payments with the speed of reconstruction.
Feedback on responses to the disaster In order to feel the pulses of businesses and assess the after effects of The Rena disaster, the author went to Tauranga and covered some of the key beaches along the east coast of Bay of Plenty (viz. Waihi beach, Mt Maunganui beach, Papamoa beach, Te Puke, and Maketu beach). On 10-11 Jan 2012, the containers from the ship and
343
their contents washed ashore on Waihi beach, and they were being cleared off by local authorities using tractors and loaders under the supervision of Maritime New Zealand (MNZ). Down south on the Papamoa beach, the author met with two wildlife experts and 20 volunteers who were getting ready to deal with new debris and oil coming from the Rena after its stern started sinking on 10th Jan 2012. Wildlife experts and team leader were seen briefing the volunteers how to deal with the oil affected birds and debris. There was an open stockyard set up to receive all the debris coming from the Rena. At Maketu beach, some personnel from the city care were taking precautionary measures in anticipation of the arrival of debris to their beach. People were spreading booms across the estuary to prevent oil leakage into the back waters. Day tourists were also taking interest in these activities and were seen going along the beach to see any tell tale sign of oil spillage. Some people also felt uncomfortable and little embarrassed in discussing the ship disaster and recovery operations. On the whole, the author felt that lots of resources (viz. booms, helicopters, barge, cranes, boats, personnel, fire-fighters, security personnel, volunteers, temporary yards, tractors, etc) were being used and all efforts were being made to the success of the recovery operations. The biggest challenge was the unpredictable weather conditions which impacted the behaviour of oil sheen movement. Computer modelling was used by the MTNZ to forecast the likelihood of oil reaching the coastline so that the recovery authorities could coordinate and prepare for dealing with the situations. It was possible to see from a vantage point the bow of the Rena about 17 kms away from the Maketu coast.
And what do the people say? During the visit, the author talked to a range of people running different kinds of businesses: motels, hotels, restaurants, and tour operators. Some of them are given: a) Do you think the number of tourists coming to Tauranga has decreased after the Rena disaster? Yes, the number has gone down because people who look forward to recreational activities are discouraged to some extent. They think they may not get full value for their money. But most of them are still coming as the beaches have been cleaned up.
b) And do you think this has affected your business negatively? No, in fact it has increased my business because the number of decreased tourists has been well compensated by logistics personnel and officials of Maritime New Zealand, Svitzer, and other agencies dealing with the after effects of the disaster. This has added to the overall economic activities of hotels, motels, restaurants, transport, etc.
c) And how do you think this recovery or rescue operations are going on? I think the operation is slow and could have been made faster. The ship stern and bow should have been brought to the shore earlier. I know there could have been some leakage of oil in this process but that is happening even otherwise. At least the problem of recovering the containers could have been much easier and less expensive then than now when the stern section has gone down with containers on it, and bow will go down too...which is just a matter of time. He further added that the operation is very expensive. For example, about $500,000 has been spent just on visibility jackets and uniforms for volunteers.
344
d) Opinion of the wildlife experts at Papamoa beach on the recovery operations: So, what is being done here along the beach? Well, we have kept our volunteers ready. They have been asked to dispose off the dead animals or birds and hand over the live and affected ones to wild life experts who will treat them at the wildlife care facility centre.
e) And what’s your opinion about the ongoing operations? I think it’s going well and it will be even better with our experiences gained in dealing with the event and the wildlife. We are doing everything possible to make things better.
In response to my email to Kenneth W. Crawford, Manager, Salvage Unit, Maritime New Zealand, Wellington, www.maritimenz.govt.nz/contact-us on 18th Jan 2012. f) Is there a plan to bring the wreckage of the ship to the shore? The plans for dealing with the forward and after sections of the ship are still being re-developed. Bear in mind that, from the start, the priorities have been to: remove the oil, remove the containers, and remove the wreck. We are currently still in the container removal phase. Plans are, however, being worked out as we speak to see what the next steps are with respect to wreck removal. These are developed by the salvors and given to MNZ to review and comment on as appropriate.
g) There was a crack visible soon after the disaster and some people feel that some early steps (viz. joining the two sides of the crack with metal straps) should have been taken up to reduce the crack initiation and further propagation. Why such steps were not taken? While to a lay-person, this may appear to offer a suitable solution to hold the sections together; this would have been a totally pointless exercise. There would have been no strength whatsoever in the structure, and the damage the sea can do is clearly evident from subsequent events.
h) Was there any other way to accelerate the rate of unloading of containers from the Rena? Have we lost the valuable time? Safety is the priority. While there have been no fatalities with this incident, this is the way everyone wants to keep it. Every step in the container removal operation (as with all other aspects) is carefully considered. While it may appear to be a r isky process, it is actually well controlled.
i) I sometimes feel that containers should have been unloaded from both the far ends of the ship (the bow and the stern) to reduce the bending stress and shear forces along the crack line. I am sure some structural engineers would have suggested the same thing. Any comments please? Bending moments and shear forces are continually monitored by a team of naval architects. The effect of all ballast operations and cargo removal on the stresses in the vessel were assessed and accounted for at every stage of the operation. Research Objectives The main objectives behind this paper are to: (a) identify the potential causes behind the Rena disaster using external sources of information (viz. electronic and print media), personal interviews and individual’s comments, (b) list the important events during the recovery operations, (c) compare the different alternative actions and approaches using
345
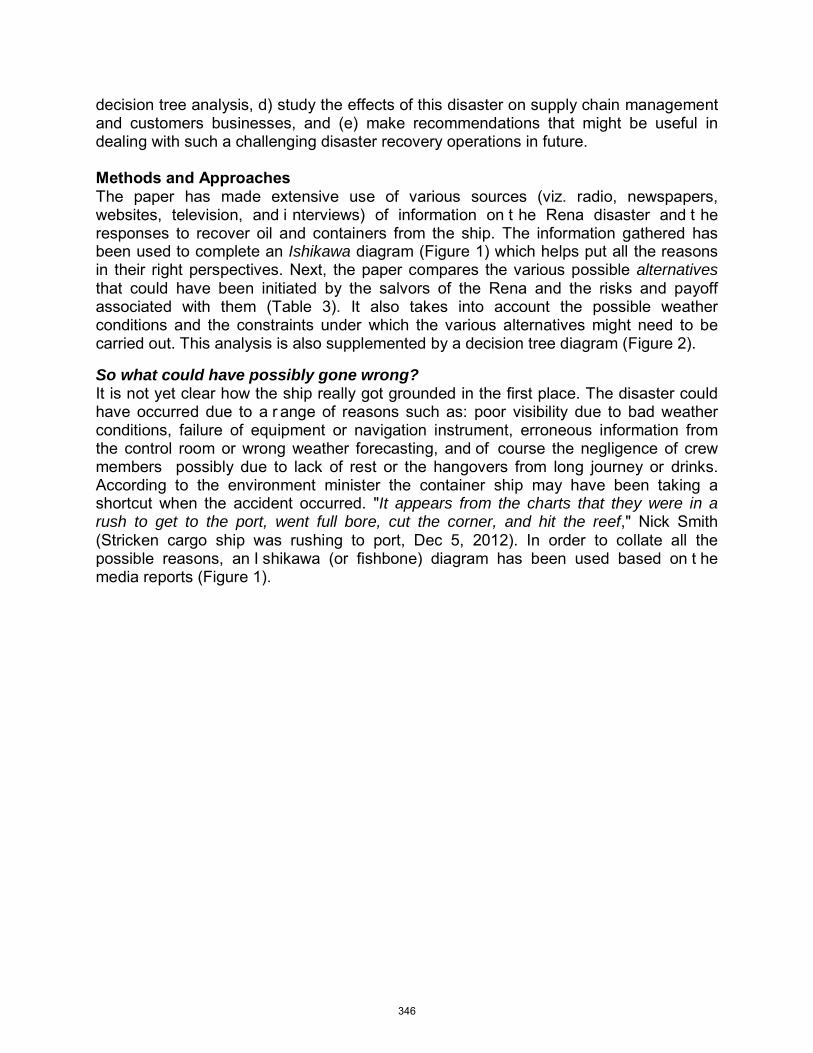
decision tree analysis, d) study the effects of this disaster on supply chain management and customers businesses, and (e) make recommendations that might be useful in dealing with such a challenging disaster recovery operations in future. Methods and Approaches The paper has made extensive use of various sources (viz. radio, newspapers, websites, television, and i nterviews) of information on t he Rena disaster and t he responses to recover oil and containers from the ship. The information gathered has been used to complete an Ishikawa diagram (Figure 1) which helps put all the reasons in their right perspectives. Next, the paper compares the various possible alternatives that could have been initiated by the salvors of the Rena and the risks and payoff associated with them (Table 3). It also takes into account the possible weather conditions and the constraints under which the various alternatives might need to be carried out. This analysis is also supplemented by a decision tree diagram (Figure 2).
So what could have possibly gone wrong? It is not yet clear how the ship really got grounded in the first place. The disaster could have occurred due to a r ange of reasons such as: poor visibility due to bad weather conditions, failure of equipment or navigation instrument, erroneous information from the control room or wrong weather forecasting, and of course the negligence of crew members possibly due to lack of rest or the hangovers from long journey or drinks. According to the environment minister the container ship may have been taking a shortcut when the accident occurred. "It appears from the charts that they were in a rush to get to the port, went full bore, cut the corner, and hit the reef," Nick Smith (Stricken cargo ship was rushing to port, Dec 5, 2012). In order to collate all the possible reasons, an I shikawa (or fishbone) diagram has been used based on t he media reports (Figure 1).
346
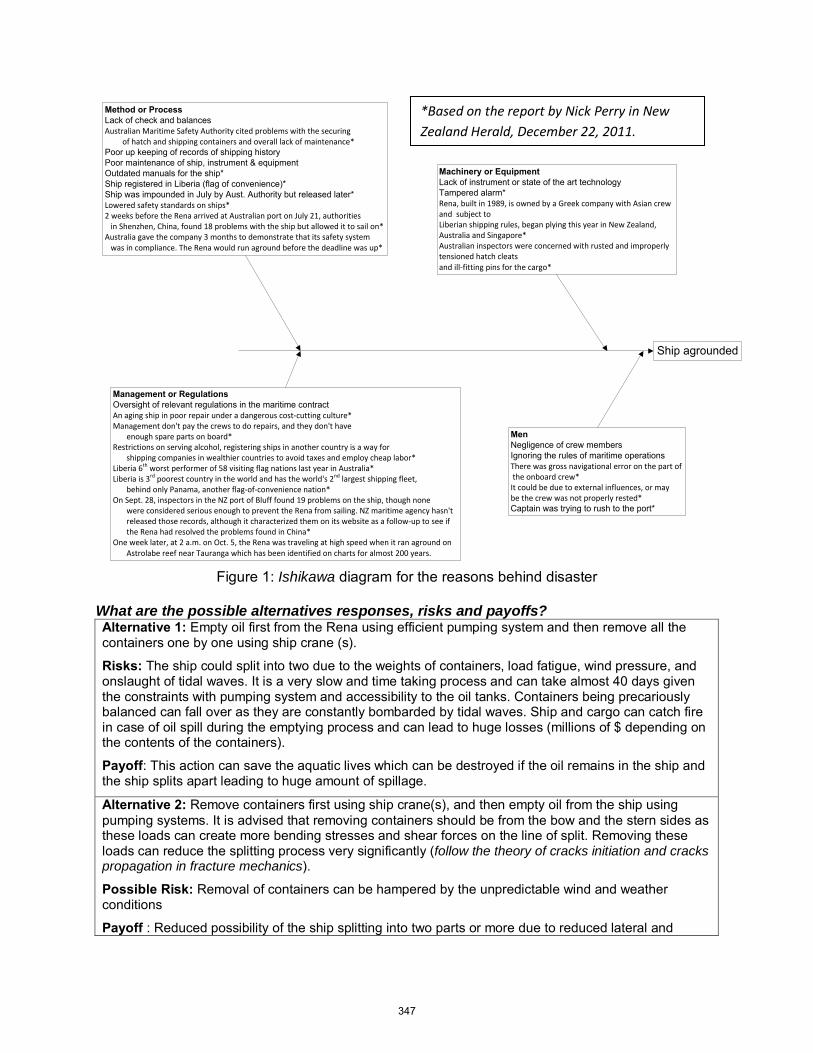
Ship agrounded
Method or ProcessLack of check and balancesAustralian Maritime Safety Authority cited problems with the securing of hatch and shipping containers and overall lack of maintenance*Poor up keeping of records of shipping historyPoor maintenance of ship, instrument & equipmentOutdated manuals for the ship*Ship registered in Liberia (flag of convenience)*Ship was impounded in July by Aust. Authority but released later*Lowered safety standards on ships*2 weeks before the Rena arrived at Australian port on July 21, authorities in Shenzhen, China, found 18 problems with the ship but allowed it to sail on*Australia gave the company 3 months to demonstrate that its safety system was in compliance. The Rena would run aground before the deadline was up*
Management or RegulationsOversight of relevant regulations in the maritime contractAn aging ship in poor repair under a dangerous cost-cutting culture*Management don't pay the crews to do repairs, and they don't have enough spare parts on board*Restrictions on serving alcohol, registering ships in another country is a way for shipping companies in wealthier countries to avoid taxes and employ cheap labor*Liberia 6th worst performer of 58 visiting flag nations last year in Australia*Liberia is 3rd poorest country in the world and has the world's 2nd largest shipping fleet, behind only Panama, another flag-of-convenience nation*On Sept. 28, inspectors in the NZ port of Bluff found 19 problems on the ship, though none were considered serious enough to prevent the Rena from sailing. NZ maritime agency hasn't released those records, although it characterized them on its website as a follow-up to see if the Rena had resolved the problems found in China*One week later, at 2 a.m. on Oct. 5, the Rena was traveling at high speed when it ran aground on Astrolabe reef near Tauranga which has been identified on charts for almost 200 years.
Machinery or EquipmentLack of instrument or state of the art technologyTampered alarm* Rena, built in 1989, is owned by a Greek company with Asian crew and subject to Liberian shipping rules, began plying this year in New Zealand, Australia and Singapore*Australian inspectors were concerned with rusted and improperly tensioned hatch cleatsand ill-fitting pins for the cargo*
MenNegligence of crew membersIgnoring the rules of maritime operationsThere was gross navigational error on the part of the onboard crew*It could be due to external influences, or may be the crew was not properly rested*Captain was trying to rush to the port*
Figure 1: Ishikawa diagram for the reasons behind disaster What are the possible alternatives responses, risks and payoffs? Alternative 1: Empty oil first from the Rena using efficient pumping system and then remove all the containers one by one using ship crane (s).
Risks: The ship could split into two due to the weights of containers, load fatigue, wind pressure, and onslaught of tidal waves. It is a very slow and time taking process and can take almost 40 days given the constraints with pumping system and accessibility to the oil tanks. Containers being precariously balanced can fall over as they are constantly bombarded by tidal waves. Ship and cargo can catch fire in case of oil spill during the emptying process and can lead to huge losses (millions of $ depending on the contents of the containers).
Payoff: This action can save the aquatic lives which can be destroyed if the oil remains in the ship and the ship splits apart leading to huge amount of spillage.
Alternative 2: Remove containers first using ship crane(s), and then empty oil from the ship using pumping systems. It is advised that removing containers should be from the bow and the stern sides as these loads can create more bending stresses and shear forces on the line of split. Removing these loads can reduce the splitting process very significantly (follow the theory of cracks initiation and cracks propagation in fracture mechanics).
Possible Risk: Removal of containers can be hampered by the unpredictable wind and weather conditions
Payoff : Reduced possibility of the ship splitting into two parts or more due to reduced lateral and
*Based on the report by Nick Perry in New Zealand Herald, December 22, 2011.
347
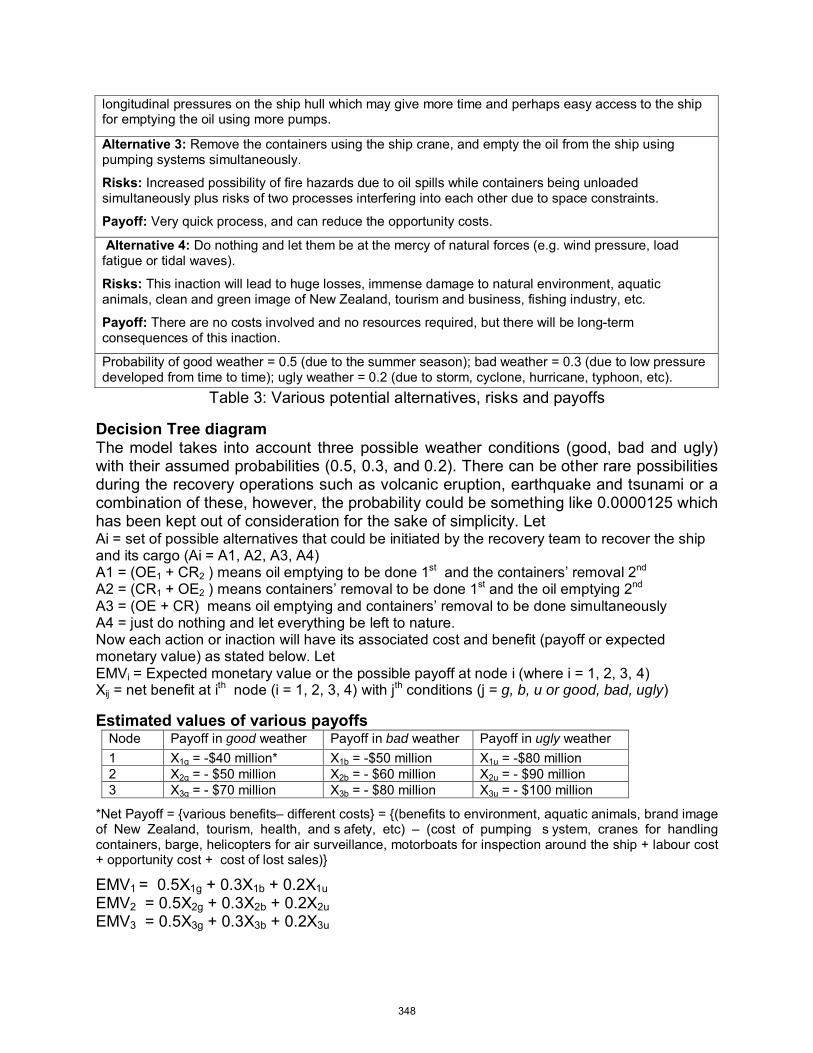
longitudinal pressures on the ship hull which may give more time and perhaps easy access to the ship for emptying the oil using more pumps.
Alternative 3: Remove the containers using the ship crane, and empty the oil from the ship using pumping systems simultaneously.
Risks: Increased possibility of fire hazards due to oil spills while containers being unloaded simultaneously plus risks of two processes interfering into each other due to space constraints.
Payoff: Very quick process, and can reduce the opportunity costs.
Alternative 4: Do nothing and let them be at the mercy of natural forces (e.g. wind pressure, load fatigue or tidal waves).
Risks: This inaction will lead to huge losses, immense damage to natural environment, aquatic animals, clean and green image of New Zealand, tourism and business, fishing industry, etc.
Payoff: There are no costs involved and no resources required, but there will be long-term consequences of this inaction.
Probability of good weather = 0.5 (due to the summer season); bad weather = 0.3 (due to low pressure developed from time to time); ugly weather = 0.2 (due to storm, cyclone, hurricane, typhoon, etc).
Table 3: Various potential alternatives, risks and payoffs
Decision Tree diagram The model takes into account three possible weather conditions (good, bad and ugly) with their assumed probabilities (0.5, 0.3, and 0.2). There can be other rare possibilities during the recovery operations such as volcanic eruption, earthquake and tsunami or a combination of these, however, the probability could be something like 0.0000125 which has been kept out of consideration for the sake of simplicity. Let Ai = set of possible alternatives that could be initiated by the recovery team to recover the ship and its cargo (Ai = A1, A2, A3, A4) A1 = (OE1 + CR2 ) means oil emptying to be done 1st and the containers’ removal 2nd A2 = (CR1 + OE2 ) means containers’ removal to be done 1st and the oil emptying 2nd A3 = (OE + CR) means oil emptying and containers’ removal to be done simultaneously A4 = just do nothing and let everything be left to nature. Now each action or inaction will have its associated cost and benefit (payoff or expected monetary value) as stated below. Let EMVi = Expected monetary value or the possible payoff at node i (where i = 1, 2, 3, 4) Xij = net benefit at ith node (i = 1, 2, 3, 4) with jth conditions (j = g, b, u or good, bad, ugly)
Estimated values of various payoffs Node Payoff in good weather Payoff in bad weather Payoff in ugly weather 1 X1g = -$40 million* X1b = -$50 million X1u = -$80 million 2 X2g = - $50 million X2b = - $60 million X2u = - $90 million 3 X3g = - $70 million X3b = - $80 million X3u = - $100 million
*Net Payoff = {various benefits– different costs} = {(benefits to environment, aquatic animals, brand image of New Zealand, tourism, health, and s afety, etc) – (cost of pumping s ystem, cranes for handling containers, barge, helicopters for air surveillance, motorboats for inspection around the ship + labour cost + opportunity cost + cost of lost sales)}
EMV1 = 0.5X1g + 0.3X1b + 0.2X1u EMV2 = 0.5X2g + 0.3X2b + 0.2X2u EMV3 = 0.5X3g + 0.3X3b + 0.2X3u
348
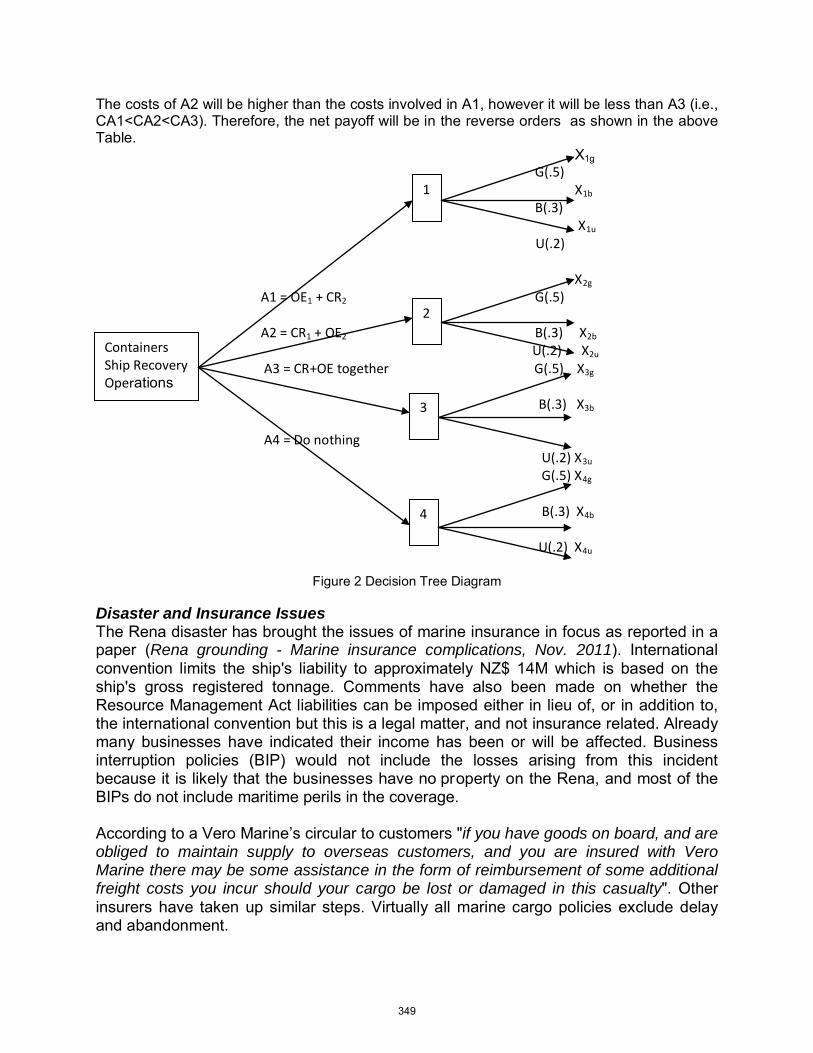
The costs of A2 will be higher than the costs involved in A1, however it will be less than A3 (i.e., CA1<CA2<CA3). Therefore, the net payoff will be in the reverse orders as shown in the above Table. X1g G(.5) X1b B(.3) X1u
U(.2) X2g A1 = OE1 + CR2 G(.5) A2 = CR1 + OE2 B(.3) X2b
U(.2) X2u A3 = CR+OE together G(.5) X3g
B(.3) X3b
A4 = Do nothing U(.2) X3u
G(.5) X4g B(.3) X4b
U(.2) X4u
Figure 2 Decision Tree Diagram
Disaster and Insurance Issues The Rena disaster has brought the issues of marine insurance in focus as reported in a paper (Rena grounding - Marine insurance complications, Nov. 2011). International convention limits the ship's liability to approximately NZ$ 14M which is based on the ship's gross registered tonnage. Comments have also been made on whether the Resource Management Act liabilities can be imposed either in lieu of, or in addition to, the international convention but this is a legal matter, and not insurance related. Already many businesses have indicated their income has been or will be affected. Business interruption policies (BIP) would not include the losses arising from this incident because it is likely that the businesses have no property on the Rena, and most of the BIPs do not include maritime perils in the coverage. According to a Vero Marine’s circular to customers "if you have goods on board, and are obliged to maintain supply to overseas customers, and you are insured with Vero Marine there may be some assistance in the form of reimbursement of some additional freight costs you incur should your cargo be lost or damaged in this casualty". Other insurers have taken up similar steps. Virtually all marine cargo policies exclude delay and abandonment.
Containers Ship Recovery Operations
2
3
4
1
349
Conclusions and Recommendations a) Enhanced visibility: Initial investigation suggests that human errors have caused the Rena disaster. Although Astrolabe reef is well marked on the maritime map, there is scope for making it more visible especially during the night or poor visibility conditions to prevent any disasters in the future. Modern technology like satellite, GPS, RFID may be used to track such sea based barriers or obstructions to prevent such incidents. b) Disruption in supply chain: The approach (what if that doesn’t work?) suggested by Schroeder (2011) could be used by suppliers while sending items to overseas customers by shipping to avoid disruption in supply chain. Suppliers sending their items to New Zealand customers by The Rena could have done better by asking this question to themselves. What if the shipping option doesn’t work? Well, they can split their orders and supply the items on two ships rather than one. But, what if that doesn’t work? due to a strong storm which can disrupt all the shipping modes of transport. Well in that case they could have used other sources of supply such as using their strategic partners overseas who are not affected by this storm. That sounds a very plausible alternative. But what if that too doesn’t work? Then the supply can be made by air cargo perhaps in small volumes to maintain supply in critical areas for the time during which the recovery operations on ship is in progress. c) Although it is very difficult to benchmark the speed of recovery process carried out by the team, it appeared slow at times to the public. The forces of nature have provided the team with enough time and opportunity to apply more equipment and resources to remove oil and containers from the ship. Removal process could have been carried out even during the night using lighting arrangement, and the night vision technology because it was summer season. Things could have been much worse and slower in the winter season. d) Post-Incident Review: It is essential to carry out a post-incident review (PIR) to evaluate responses of the recovery team to identify gaps or weaknesses, and determine ways and means to strengthen them. Morgan (2011) suggests that ‘PIR should be carried out by a team of individuals that are not part of the organization or were not involved with the response to the incident’. However, the responders and managers should be given opportunity to provide their input in the process. PIR should evaluate the recovery operations in terms of performance measures such as speed, cost, effectiveness, and flexibility. It should also address the issues of planning, prevention, mitigation, and implementation of disaster response. The PIR process clearly provides an opportunity to learn from disasters and crises. e) There seems to be huge ambiguity in terms of who should pay for the cost of recovery operations. Insurance clause in the international maritime regulations should be modified to express clearly the role of ship-owners in terms of the expenses of disaster recovery operations. Acknowledgements The author acknowledges the support of Maritime, New Zealand, Wildlife volunteers, Tauranga Community, and Eastern Institute of Technology, Hawke’s Bay, New Zealand for their help during the research paper. The author also thanks Vineeta Roy for her help in proofreading.
350
References Barry, S. R. Business continuity and technology – the strengths and the weaknesses, Disaster Recovery Journal, 24(3), 2011. Retrieved on 22 Dec 2011 from http://www.drj.com/2011-articles/summer-2011-volume-24-issue-3/business-continuity-and-technology-the-strengths-and-the-weaknesses.html Brennan, P. Lessons learned from the Japan earthquake, Disaster Recovery Journal, 24(3), Summer 2011. Retrieved on 21 Dec 2011 from http://www.drj.com/2011-articles/summer-2011-volume-24-issue-3/lessons-learned-from-the-japan-earthquake.html
Curtis, A., Li, B., Brian D. M., Jacqueline W. M. and John, P. A multiple additive regression tree analysis of three exposure measures during Hurricane Katrina, Disasters, 35(1), p: 19−35, 2011.
Fordham, D. Choosing between the in-house option or a service provider for disaster recovery/business continuity. Retrieved on 24 Dec 2011 from http://www.drj.com/2011-articles/online-exclusive/choosing-between-the-in-house-option-or-a-service-provider-for-disaster-recoverybusiness-continuity.html
Masuriera, J., Rotimia, J.O. and Wilkinson, S. A comparison between routine construction and post-disaster reconstruction with case studies from New Zealand. 22nd ARCOM Conference on Current Advances in Construction Management Research, Birmingham, U.K. 4-6th Sep., 2005.
Mohammed M. and Musaed N. Removal techniques of oil from marine and soil environments, Proceedings of the symposium on Maritime Disaster Management, Jan 19-23, 2002.
Morgan, M. The post-incident review process: can you correct the weakness (2011)? http://www.drj.com/article-archives/risk-analysis/the-post-incident-review-process-can-you-correct-the-weakness.html Myburgh, D., Wilkinson, S. and Seville, E. Post-disaster reconstruction research in New Zealand: An industry update, Resilient Organisations Research Report, March 2008.
Rena grounding – marine insurance complications. Risk Management Newsletter no. 194, Independent risk management and insurance consultants, Sloan risk management services, Wellington, Nov. 2011.
Ruben J., Helsloot, I., Beerens, R. and Vrijling, J. How prepared is prepared enough? Disasters, 35(1), p.130−142, 2011.
Satapathy, S., and Walia, A. Affected parents' and other stakeholders' perception of a fire disaster management in India: A situational analysis. Disaster Management & Response, 5(4), p. 111-118, Oct-Dec 2007. Schroeder, K. What if that doesn’t work? Some timely thoughts for small business. Disaster Recovery Journal, 24(3), 2011. http://www.drj.com/2011-articles/summer-2011-volume-24-issue-3/what-if-that-dont-work-some-timely-thoughts-for-small-business.html Other links: Disaster recovery. Retrieved on 1 Jan 2012 from http://en.wikipedia.org/wiki/Disaster_recovery
Cooke, M. and Johnston, K. Weather may spill containers from fragile Rena, Retrieved on 24th Nov. 2011 from http://www.stuff.co.nz/environment/rena-crisis/6024854/Weather-may-spill-containers-from-fragile-Rena
351
East coast oil spill New Zealand's worst for wildlife and beaches. Retrieved on 28th Dec 2011 from http://www.suite101.com/news/east-coast-oil-spill-new-zealands-worst-for-wildlife-and-beaches-a392433#ixzz1iSAJofl7 Gillies, A. More Rena oil to hit beaches, 4 December, 2011.
One container down, 1279 to go. Retrieved on 16th Nov 2011 from http://www.stuff.co.nz/environment/rena-crisis/5979816/One-container-down-1279-to-go Perry, N. Rena had at least 17 safety problems before crash, New Zealand Herald, 22nd Dec, 2011. http://www.nzherald.co.nz/nz/news/article.cfm?c_id=1&objectid=10774919 Phillips, S. Possible toxic effects from New Zealand oil spill disaster, 15 Oct, 2011. http://www.suite101.com/news/possible-toxic-effects-from-new-zealand-oil-spill-disaster-a393383#ixzz1h6q96Lyg Rena apology, but no word on compo, Fairfax New Zealand, 18 November 2011.
Stricken cargo ship was rushing to port. Retrieved on 5th Dec, 2011 from http://www.aljazeera.com/news/asia-pacific/2011/10/2011101561925823312.html
352
New perspectives on disaster response: the role of systems theory and methods
Dr Paul M. Salmon, Dr Natassia Goode, Professor Frank Archer, Dr Caroline Spencer, Dudley McArdle & Professor Rod McClure
Monash Disaster Resilience Initiative, Monash University, Melbourne, Australia
Paper presented at EARTH: FIRE AND RAIN Australian & New Zealand Disaster and Emergency Management Conference Brisbane – 16 – 18, April 2012
353
New perspectives on disaster response: the role of systems theory and methods
Abstract This paper argues that systems theory-based human factors methods have a key role to play in understanding and enhancing systems of disaster response. This argument is tested by an application of a popular risk management framework to the analysis of bushfire response activities. Specifically, an Accimap analysis of the collective response to a recent major Australian bushfire was conducted. The analysis is used to test the applicability of this approach in a disaster response context. In conclusion, the analysis demonstrates that such approaches are highly suited to the analysis of disaster response efforts. Moreover, it is argued that, compared to the existing individual component failures approach, this holistic systems approach provides a more comprehensive understanding of response system performance and better promotes improvements in disaster response systems.
Keywords: disaster response, bushfires, systems approach
Introduction
Disasters, both natural and man-made, represent a substantial social, economic, environmental and global public health problem of major importance. For example, the United Nations International Strategy for Disaster Reduction (UNISDR) estimates that, over the past 12 years, 1.1 million people have been killed and 2.7 billion affected as a result of disasters, with associated costs in economic damage of over a trillion US Dollars (UNISDR, 2012). Evidence suggests that the frequency, scale and impacts of disasters are likely to increase significantly in the future (e.g. Aini & Fakhrul-Razi, 2010), which in turn suggests that the health, social and financial burden of disasters is also likely to increase significantly.
The collective governmental, emergency service, environmental and military agency response to disasters represents one of the primary mechanisms for minimising the effects of disasters. Despite often heroic efforts the performance of multi-agency disaster response systems is often sub-optimal, with factors such as lack of an overt coordinating structure, unclear or conflicting agency roles and responsibilities, incompatible processes and technologies, and inadequate equipment being commonly cited (Goode et al, 2011). In the past high profile post disaster inquiries have been used to identify the factors causing sup-optimal performance (e.g. VBRC, 2010). Although useful in that sub-optimal conditions are identified, it is argued here that this approach is trapped within a reductionist paradigm that perpetuates repetition of these conditions during future response efforts. There is a focus on
354
failed components in isolation (e.g. equipment, single agencies, procedures, teamwork) and although multiple failures are often identified, the causal relationships between them are often not made clear. Holistic accounts of how different conditions interact with one another to shape the performance of the overall disaster response system are not produced. This ‘hunt for the broken component’ mentality has been identified as a major factor limiting understanding of performance and safety and also the countermeasures developed from post event analyses (e.g. Dekker, 2011).
A new approach to understanding and enhancing disaster response system performance is required. It is argued here that a systems approach (e.g. Dekker, 2011; Leveson, 2011; Rasmussen, 1997) is appropriate and that analysis methods underpinned by systems theory provide a more holistic approach for identifying, in-depth, why disaster response systems did not perform optimally. This paper tests this argument through an application of such an approach to the analysis of bushfire response activities. Specifically, an Accimap analysis of the response to a recent major Australian bushfire is presented. The aim of the analysis was to determine whether systems theory-based frameworks are compatible with the analysis of disaster response activities.
A systems approach to the analysis of disaster response
The systems approach to complex sociotechnical system performance centres on the notion that safety is an emergent property arising from non-linear interactions between multiple components across complex sociotechnical systems (e.g. Leveson, 2011). In order to understand performance in a way that supports appropriate interventions, it is the relationships between components of the system that are of interest, not the individual components themselves (e.g. Ottino, 2003).
Various systems-based safety and risk management models have emerged over the past two decades (e.g. Leveson, 2011; Rasmussen, 1997; Reason, 1990). Rasmussen’s risk management framework (Rasmussen, 1997, see Figure 1), for example, describes the various levels (e.g. government, regulators, company, company management, staff, and work) comprising complex sociotechnical systems. According to the model each level is involved in safety and performance management via the control of hazardous processes through laws, rules, and instructions. For systems to function efficiently and safely, decisions made at higher governmental, regulatory, and managerial levels of the system should propagate down and be reflected in the decisions and actions occurring at the lower levels. Conversely, information at the lower levels regarding the system’s status needs to transfer up the hierarchy to inform the decisions and actions occurring at the higher levels (Cassano-Piche et al, 2009). Without this so called ‘vertical integration’, systems can lose control of the processes that they are designed to control (Cassano-Piche et al, 2009).
355
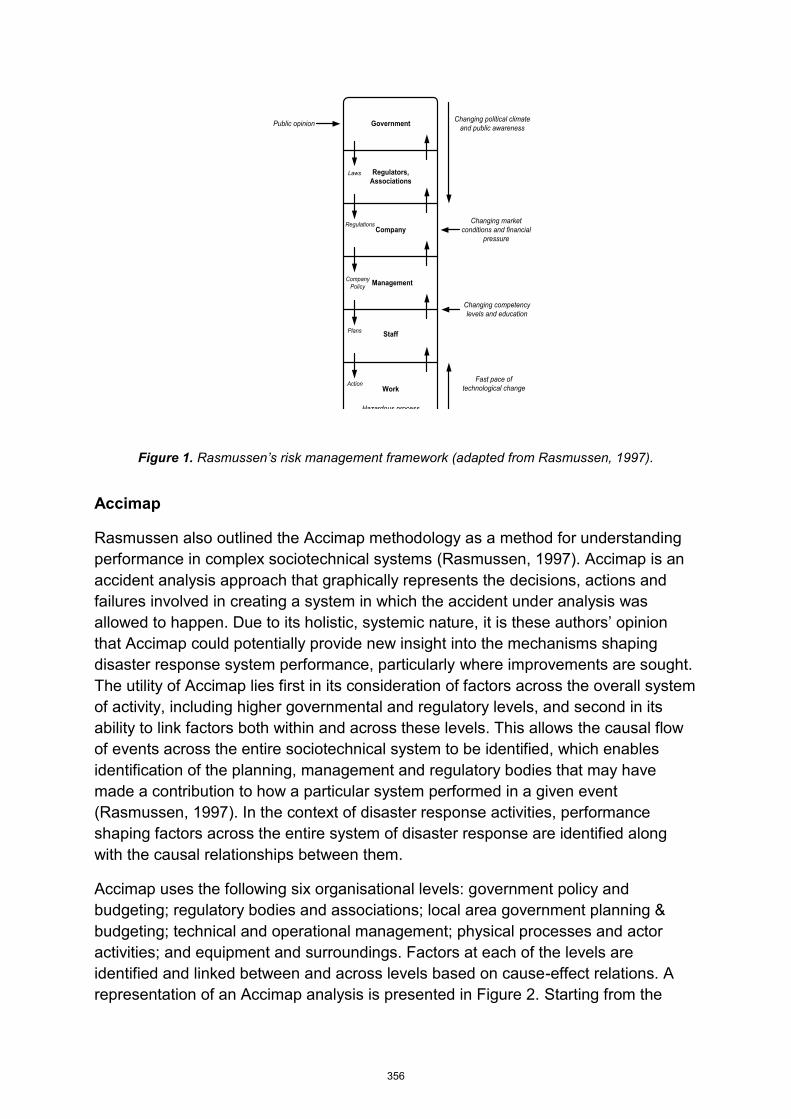
Figure 1. Rasmussen’s risk management framework (adapted from Rasmussen, 1997).
Accimap
Rasmussen also outlined the Accimap methodology as a method for understanding performance in complex sociotechnical systems (Rasmussen, 1997). Accimap is an accident analysis approach that graphically represents the decisions, actions and failures involved in creating a system in which the accident under analysis was allowed to happen. Due to its holistic, systemic nature, it is these authors’ opinion that Accimap could potentially provide new insight into the mechanisms shaping disaster response system performance, particularly where improvements are sought. The utility of Accimap lies first in its consideration of factors across the overall system of activity, including higher governmental and regulatory levels, and second in its ability to link factors both within and across these levels. This allows the causal flow of events across the entire sociotechnical system to be identified, which enables identification of the planning, management and regulatory bodies that may have made a contribution to how a particular system performed in a given event (Rasmussen, 1997). In the context of disaster response activities, performance shaping factors across the entire system of disaster response are identified along with the causal relationships between them.
Accimap uses the following six organisational levels: government policy and budgeting; regulatory bodies and associations; local area government planning & budgeting; technical and operational management; physical processes and actor activities; and equipment and surroundings. Factors at each of the levels are identified and linked between and across levels based on cause-effect relations. A representation of an Accimap analysis is presented in Figure 2. Starting from the
Government
Regulators, Associations
Company
Management
Staff
Work
Hazardous process
Laws
Regulations
Company Policy
Plans
Action
Public opinion Changing political climate and public awareness
Changing market conditions and financial
pressure
Changing competency levels and education
Fast pace of technological change
356
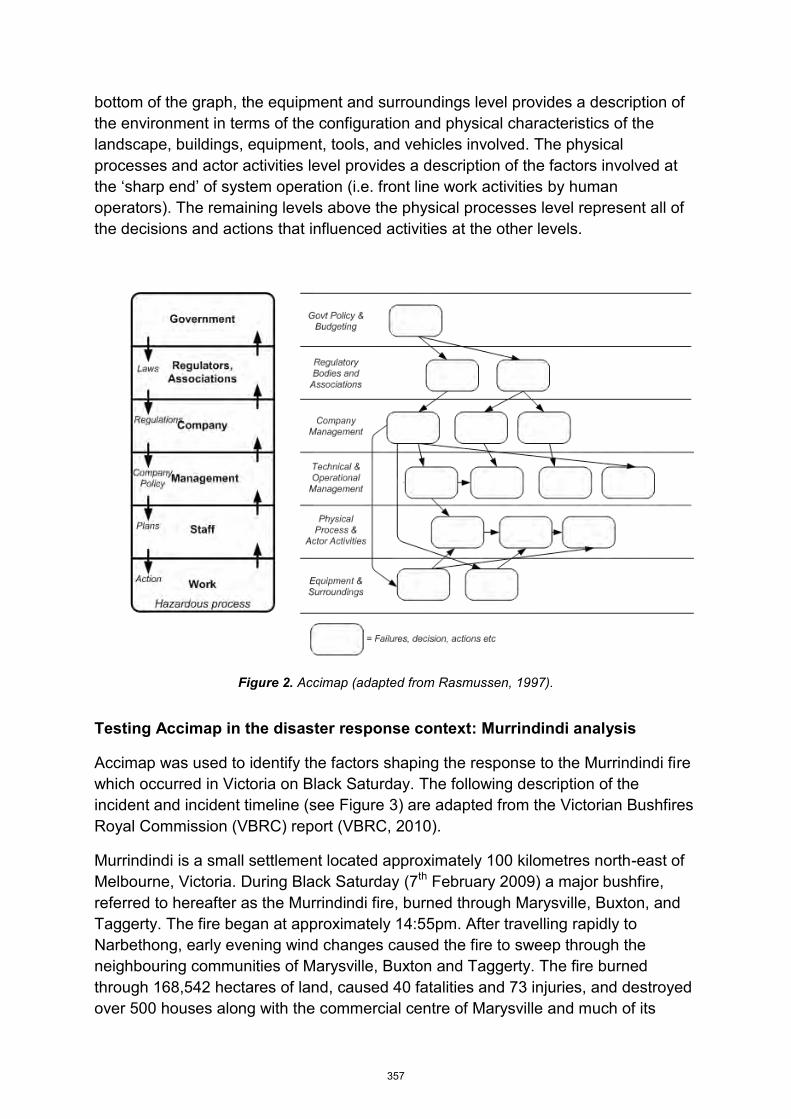
bottom of the graph, the equipment and surroundings level provides a description of the environment in terms of the configuration and physical characteristics of the landscape, buildings, equipment, tools, and vehicles involved. The physical processes and actor activities level provides a description of the factors involved at the ‘sharp end’ of system operation (i.e. front line work activities by human operators). The remaining levels above the physical processes level represent all of the decisions and actions that influenced activities at the other levels.
Figure 2. Accimap (adapted from Rasmussen, 1997).
Testing Accimap in the disaster response context: Murrindindi analysis
Accimap was used to identify the factors shaping the response to the Murrindindi fire which occurred in Victoria on Black Saturday. The following description of the incident and incident timeline (see Figure 3) are adapted from the Victorian Bushfires Royal Commission (VBRC) report (VBRC, 2010).
Murrindindi is a small settlement located approximately 100 kilometres north-east of Melbourne, Victoria. During Black Saturday (7th February 2009) a major bushfire, referred to hereafter as the Murrindindi fire, burned through Marysville, Buxton, and Taggerty. The fire began at approximately 14:55pm. After travelling rapidly to Narbethong, early evening wind changes caused the fire to sweep through the neighbouring communities of Marysville, Buxton and Taggerty. The fire burned through 168,542 hectares of land, caused 40 fatalities and 73 injuries, and destroyed over 500 houses along with the commercial centre of Marysville and much of its
357
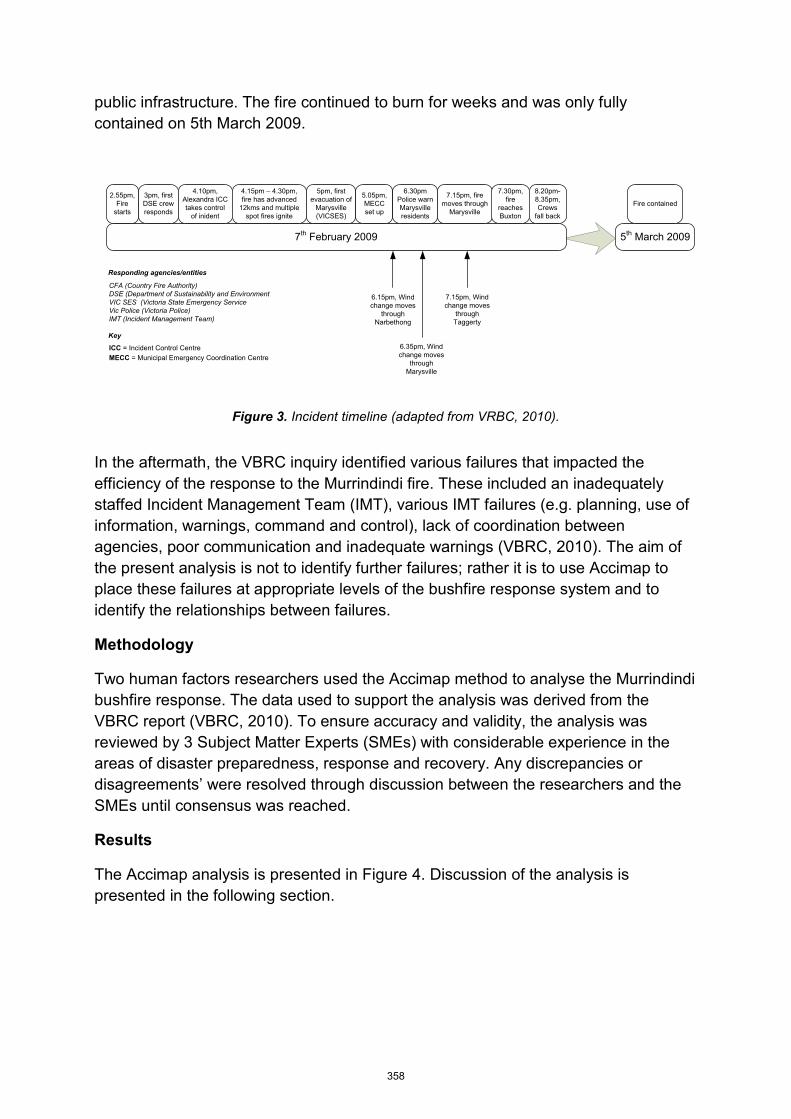
public infrastructure. The fire continued to burn for weeks and was only fully contained on 5th March 2009.
Figure 3. Incident timeline (adapted from VRBC, 2010).
In the aftermath, the VBRC inquiry identified various failures that impacted the efficiency of the response to the Murrindindi fire. These included an inadequately staffed Incident Management Team (IMT), various IMT failures (e.g. planning, use of information, warnings, command and control), lack of coordination between agencies, poor communication and inadequate warnings (VBRC, 2010). The aim of the present analysis is not to identify further failures; rather it is to use Accimap to place these failures at appropriate levels of the bushfire response system and to identify the relationships between failures.
Methodology
Two human factors researchers used the Accimap method to analyse the Murrindindi bushfire response. The data used to support the analysis was derived from the VBRC report (VBRC, 2010). To ensure accuracy and validity, the analysis was reviewed by 3 Subject Matter Experts (SMEs) with considerable experience in the areas of disaster preparedness, response and recovery. Any discrepancies or disagreements’ were resolved through discussion between the researchers and the SMEs until consensus was reached.
Results
The Accimap analysis is presented in Figure 4. Discussion of the analysis is presented in the following section.
5th March 2009
6.15pm, Wind change moves
through Narbethong
7.15pm, Wind change moves
through Taggerty
7th February 2009
2.55pm, Fire
starts
3pm, first DSE crew responds
4.10pm, Alexandra ICC takes control
of inident
4.15pm – 4.30pm, fire has advanced
12kms and multiple spot fires ignite
5pm, first evacuation of
Marysville (VICSES)
5.05pm, MECC set up
6.30pm Police warn Marysville residents
7.15pm, fire moves through
Marysville
7.30pm, fire
reaches Buxton
8.20pm-8.35pm, Crews
fall back
Fire contained
6.35pm, Wind change moves
through Marysville
ICC = Incident Control Centre
Key
MECC = Municipal Emergency Coordination Centre
Responding agencies/entities
CFA (Country Fire Authority)DSE (Department of Sustainability and EnvironmentVIC SES (Victoria State Emergency ServiceVic Police (Victoria Police)IMT (Incident Management Team)
358
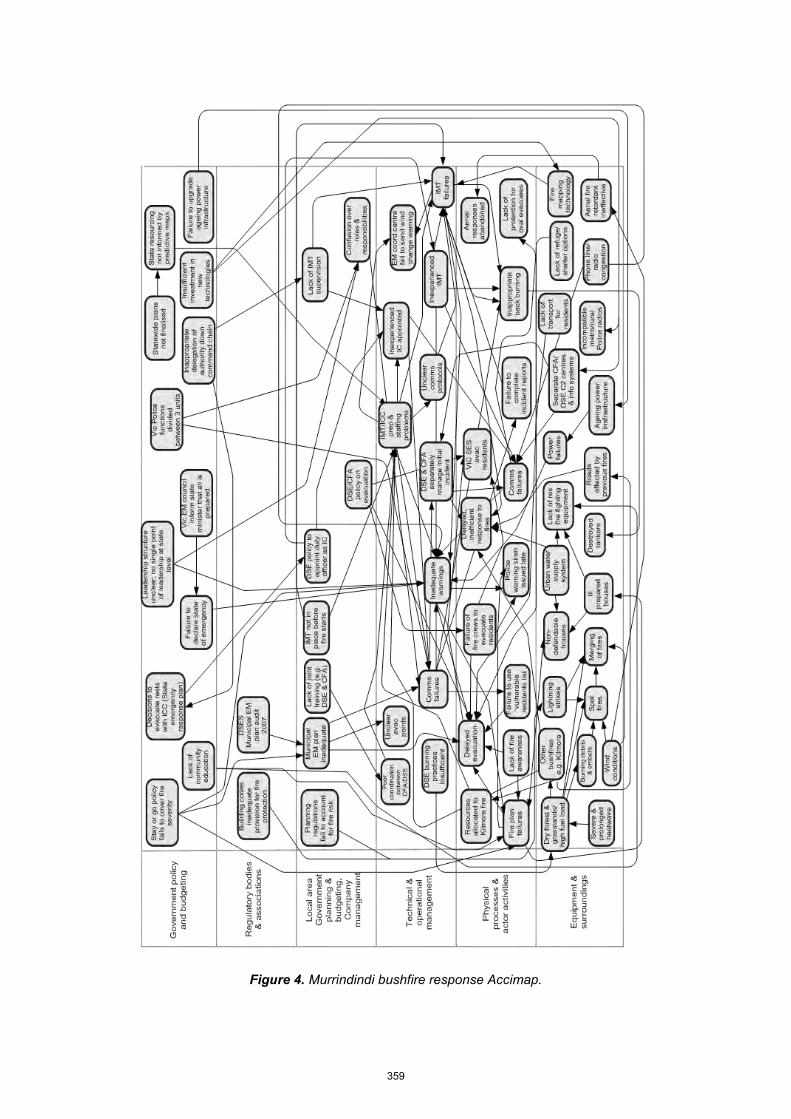
Figure 4. Murrindindi bushfire response Accimap.
359
Equipment & surroundings
The environmental conditions were ideal for the creation and maintenance of a large, rapidly spreading, ferocious bushfire. Victoria had endured one of its most severe and prolonged heatwaves in the weeks leading up to the fire and temperatures on the day were in excess of 40 degrees. The prolonged heatwave meant that the surrounding forests and grasslands were extremely dry. There were also strong and variable wind conditions which eventually grew into storm conditions. Not only did these fan the fire but they also facilitated rapid directional changes and escorted burning debris and embers up to distances of 15km (VBRC, 2011), which in turn created spot fires and placed properties etc under the threat of fire. Dense vegetation in the area provided a high fuel load at around 50 tonnes a hectare (VBRC, 2011) and the local forests comprised tall, mature, mountain and alpine ash trees which are easily ignited and have loose hanging bark ribbons which burn and can be transported significant distances by convection columns (VBRC, 2011). Lightning strikes caused by a huge pyrocumulonimbus cloud that had developed above the fire served to trigger other fires from early evening onwards. On the morning of the 8th February, a major fire from Kilmore east merged with the Murrindindi fire, dramatically increasing its scale and ferocity.
Problems with public infrastructure and housing were evident. Many houses were ill-prepared for the bushfire season and some were non-defendable. The options for evacuation were limited. No bushfire shelters or refuges had been built in the townships and some vulnerable residents (i.e. elderly, disabled) lacked transportation. Roads in and around the Murrindindi shire were affected by fires, rendering them impassable; for example, the initial CFA and DSE response was delayed as they could not take direct fire affected routes to the fire. Power failures, due to the bushfires and ageing infrastructure, were also problematic; one severely impacted the Buxton and Marysville water supply system, which meant that Buxton residents were without water. An inability of the water within the Marysville reticulation network to flow quickly meant that demand could not be met. As water pressure dropped, water flow in elevated parts of the shire stopped. As a result, over half of Marysville was without water by the evening of the 7th February. A power failure also took the local radio station off air for almost forty minutes after 5pm, preventing transmission of messages and warnings.
The equipment used during the response is also important. The CFA and DSE operated from separate command centres, had different information systems, and the radios used by the Metropolitan and Regional Police were incompatible, one being digital and one being analogue. This led to communications problems between the two groups and the fire agencies. Severe phone and radio congestion further exacerbated this. There was also a general lack of residential fire fighting equipment, meaning that residents could not properly defend properties. Finally, the wind conditions meant that aerial fire attacks were ineffective.
360
Physical processes and actor activities level
This level focuses primarily on activities ‘on the ground’ by residents and the emergency services. From the onset fire fighting resources were depleted due to an existing fire in neighbouring Kilmore. The initial fire attack was sub-optimal as first responding crews were delayed in responding due to fire affected roads, (VBRC, 2010).
Resident’s fire plans were placed under scrutiny by the VBRC. Some residents did not have one, some of the plans were inadequate (i.e. failing to take into account the lack of power and water) and many were inappropriate given the severity of the fire. Further, many fire plans were not enacted in a timely manner; many residents only left in response to trigger events such as the fire being in close proximity or being personally told to leave (VBRC, 2010). Finally, many residents had a general lack of fire awareness, which in turn shaped their fire plan and enactment of it.
The fire plan failures are linked to a general failure of residents to evacuate or be evacuated. This is also linked to a failure by fire crews to evacuate residents; however, this has to be considered in the context of the overall system. The State Emergency Response Plan left the decision to evacuate residents with the Incident Controller (IC) and the Incident Management Team (IMT) did not consider evacuation of any towns during the incident. On the ground, the CFA’s policy prevented crews from providing stay or go advice. As a result fire crews could not evacuate Marysville without permission from the IC. At around 4.30 in the afternoon, the Victoria State Emergency Service (VICSES) enacted their evacuation plan for vulnerable residents. However, the Murrindindi Shire Council list of vulnerable residents was not utilised. A more general evacuation of Marysville was not advised until around 6.30pm in the evening when Police issued siren warnings.
Various communications failures that impacted the response are placed at this level. These included the inability of a fire tower observer, due to phone and radio line congestion, to communicate his concerns regarding the fire and its risk to Marysville to the IMT until around 4pm. Some DSE crew members were also unable to communicate their observations on the fire and other spot fires to the IMT. Information from a reconnaissance flight over Marysville also failed to reach the IMT. These communications failures limited the IMT’s situation awareness of operations on the ground and of the fire itself. A failure by fire crews to complete incident reports compounded this, rendering the tracking of fire-fighters and their vehicles difficult. Information flow from the IMT to fire crews was also limited. The IMT failed to communicate that there was insufficient time to complete a back burn due to an impending change in wind conditions. Fire crews barely escaped, one tanker sustained serious damage and another was destroyed.
Technical and operational management
361
The technical and operational management level primarily deals with the composition of the IMT and their management of the incident, but also covers the higher command levels of the DSE and CFA and the interactions between agencies and the IMT. Many issues surrounding the composition and performance of the IMT are present at this level. Preparation and staffing of the IMT was identified as a key factor shaping the response (VBRC, 2010). Before the fire the IMT was already depleted due to staff members being allocated to other major fires. For the first two hours of the fire there was no information officer to deal with preparation and distribution of warnings. Handovers were also not conducted between the IMTs at different locations, leading to confusion over who was managing the response. The inexperience of IMT staff meant that they were inadequately prepared for the fire. The first Incident Controller (IC) held only level 1 Qualifications. Notably a much more experienced level 3 qualified IC was available. A level 2 controller was appointed following the initial unsuccessful fire attack; however, he did not arrive at the incident control centre until around 17:30. Again, the experienced level 3 controller was available. The level 3 controller was eventually appointed on the morning of the 8th February.
The IMT’s planning for, and management of, the incident is represented in the Accimap under the general item of ‘IMT failures’. They did not prepare an incident action plan until the 8th February. The VBRC concluded that the IMT did not provide appropriate strategic and operational direction to those on the ground. Information use and management by the IMT was also flawed; the VBRC concluded that the IMT failed to make good use of various sources of information available to them, including a fire tower observer, air reconnaissance, and DSE crew leaders’ reports on fire behaviour and location, and local weather forecasts from the integrated Emergency Coordination Centre. This meant that they did not have sufficiently accurate information regarding the situation, which in turn meant that warnings were inadequate or erroneous. This must be considered, however, alongside the fact that information flow to the incident control centre was limited. The failure by the IMT to seek a local weather forecast is also important; this meant that they did not have sufficiently accurate information regarding the weather conditions, which in turn meant that warnings were inadequate or erroneous.
Coordination between the CFA and DSE during the response was poor (VBRC, 2010). The initial response was managed by the CFA, and there was no coordination of CFA and DSE resources. After the initial attack, the DSE was appointed the control agency. There was no official handover from the CFA to DSE which led to confusions over responsibilities. CFA crews continued to report to CFA’s Yea Group headquarters, rather than the IMT overseeing the incident. Some CFA fire crews received information about the predicted wind change from CFA Group Officers, rather than the IMT. CFA level 3 staff were available during the response, but they remained at the CFA Group Office, a short distance from the location of the IMT.
362
Communications failures are also present at this level; these reflect communications failures associated with the IMT (i.e. between the IMT and other agencies) and between other agencies such as the VICSES and local council and CFA and DSE. IMT communications protocols were also unclear.
Local area government planning
The local area government planning level captures decisions and actions at the strategic level of response. Various issues were identified in Murrindindi Shire council’s preparation for bushfires. The planning scheme contained no clear plans for mitigating bushfire risk. The risks related to the lack of a reticulated water system were discussed, but no course of action was identified to deal with these risks. Permits were required to remove vegetation and the exemptions were restrictive compared to the state planning guidelines. As part of Victoria’s Planning Provisions local council planning schemes can incorporate the Wildfire Management Overlay (WMO), which identifies “areas where the intensity of wildfire is significant and likely to pose a threat to life and property” (p.219, Vol.2). The WMO did not apply to the townships of Marysville, Kinglake and Kinglake West, although the VBRC notes that “It is obvious from aerial photographs taken before the fire that these were ‘areas where the intensity of wildfire is significant and likely to pose a threat to life and property” (p.219, Vol. 2). The Murrindindi Municipal Emergency Management Plan (MMEMP) lacked detail concerning the most appropriate roads for evacuation, the size of the population, vulnerable community members who might need assistance during evacuation, locations of schools and hospitals, places of refuge, possible locations for emergency relief centres or responsibilities for evacuation.
At the local level, the Alexandra ICC (which was to become the ICC for the Murrindindi fire) was not finalised prior to the fire, having only level 2 ICC resources and facilities in place before the fire. The plan was to send level 3 staff when needed, despite weather conditions forecast to be worse than those on Ash Wednesday. These arrangements differed from other regions where level 3 staff were allocated to ICCs in preparation. The DSE policy to appoint the present duty officer as the IC is also represented at this level. Other pertinent factors at this level include the lack of joint training exercises between the DSE and CFA, the DSE and CFA policy on evacuation, which did not encourage evacuation or enable fire fighters to provide specific stay or go advice, and a lack of supervision of the IMT, which included the absence of a system for monitoring the quality of warnings being issued by them (VBRC, 2010).
The evacuation of Marysville was hindered by CFA/DSE policies on evacuation. Although the State Emergency Response Plan allocates the responsibility for evacuation to the IC, DSE practice does not encourage evacuation. Similarly, CFA personnel are precluded from advising residents whether to evacuate. As a result, VICSES decided to evacuate Marysville as the fire grew close to the township.
Regulatory bodies and associations
363
In 2007 the Director of Victoria State Emergency Service conducted an audit of the MMEMP plan in 2007 and subsequently deemed it to meet the standards set out in the Emergency Management Act. The VBRC report that the audit failed to detect that the plan lacked details regarding most aspects of preparedness, response and recovery.
At the time of the incident, the Building Code of Australia’s bushfire safety construction standards only applied to new buildings in areas that had been designated as bushfire prone (BPAs) by local councils. The criteria for designating BPAs in the Building Code of Australia were unclear, and as a result many local councils failed to apply it, which meant that Marysville was not designated a BPA.
Government policy and budgeting
Victoria’s bushfire safety policy, “stay or go” impacted the decisions made by residents and fire agency personnel on the day. The policy stated that households should make plans before the bushfire season to leave the area early before the fires, or stay and defend a well-prepared defendable home. The policy did not take into account that high fuel loads and heatwave conditions result in ferocious fires that cannot be contained. Even well prepared homes were destroyed by the fire, and many residents died defending their homes. The policy also shaped the focus of the warnings that were issued, which primarily instructed residents to enact their fire plans. Many residents had no fire plan or only a vague plan to leave when they received a clear signal that they were in danger. As a result, a number of residents died in their attempt to leave at the last minute. The policy also failed to mention alternative options, such as evacuation and refuges. This may have influenced the Murrindindi Municipal Fire Plan which lacked details concerning the best roads for evacuation and places of refuges. Community education programs accompanying the policy were also found to be lacking (VBRC, 2010). CFA educational materials failed to provide adequate information about fire behaviour and inform residents of the risks involved in defending a house. Victoria’s ageing power infrastructure also played a significant role in the inadequate response. While not a direct cause of the fire (as it was of other Black Saturday fires), the power infrastructure lacked resilience, resulting in a loss of power at 17:15 on 7th February. As a result, the town water supply was cut off, the local radio station was unable to broadcast warnings during a critical period and emergency relief centres were unable to operate effectively.
The VBRC inquiry report suggests that the Police and Emergency Services Minister should have declared a state of disaster (VBRC, 2010). This would have increased the focus on warnings and resolved some of the leadership issues during the response to the fires (VBRC, 2010). The decision not to declare a state of emergency was informed by the Victorian Emergency Management Council Coordination Group’s advice that the CFA and DSE were ‘ready in all the key high danger areas’ (p.72, Vol.2 VBRC), although this was not the case in the Murrindindi Shire, as nine
364
Alexandra IMT staff had been sent to deal with other fires. During the response, at the state level Victoria Police functions and resources were divided between three centres, one of which was located at the opposite end of the city to the others. This created confusion about responsibilities and leadership during the response, and impacted communications between the police and fire agencies. Overall, at the state level the leadership structure during the response was unclear; there was no single agency responsible for the response, which led to confusion over responsibilities at the state level. In turn, this added to confusion over CFA and DSE responsibilities at the local level during the Murrindindi fire.
A number of failures were identified in the strategic preparation for, and response to, the emergency. Insufficient investment in new technologies has been a long standing issue for the CFA, DSE and Victorian Police. The main fire mapping technology used by the CFA and DSE was overwhelmed by the demand on the 7th of February and had to be restarted a number of times, leaving IMTs without access to critical information.
At the State level, there was no single point of leadership, with command shared by the Chief Officer of the CFA, the Chief Fire Officer of DSE and the Chief Commissioner of Police. The responsibilities of each post were unclear, which in some cases led to confusion over who was executing the command function. The VBRC noted that there was a “disturbing trend” (p.79) to delegate responsibility further down the chain of command, most notably to the incident control centres” (p.79, Vol.2), which resulted in a lack of IMT supervision. State wide plans were not finalised to assign resources to the most threatening fires, and the VBRC found that decisions were made regarding the allocation of resources and personnel without reference to predictive fire maps. These factors contributed to the severe shortage of staff and resources allocated to the Murrindindi fires.
Discussion
The aim of this article was to put forward the Accimap methodology (Rasmussen, 1997) as a suitable approach for examining disaster response activities. Accimap was used to describe the factors influencing the response to the Murrindindi bushfire that occurred during Black Saturday in Victoria, Australia. The results provide support for the Accimap approach as a valid and appropriate analysis methodology for use in the disaster response context. Holistic in nature, the output was able to represent the factors present across the overall system of disaster response that shaped how the response unfolded and ultimately its efficiency.
Importantly, the analysis was able to specify the relationships between the factors both within and across the different system levels. This is extremely powerful, since it allows a rapid understanding of why different factors occurred and also engenders development of more appropriate interventions, since it supports treatment of failures across the system that influence the way in which the disaster response system performs. Treatment of wider systems failures, identified through systems-based
365
analyses, is more appropriate than the treatment of local factors at the ‘sharp end’ of system operation, since the factors creating the sharp end behaviours are removed following analysis efforts (e.g. Reason, 1990; Dekker, 2002; Leveson, 2004). For example, identifying that equipment, such as radios, was inefficient is useful; however, without a systems analysis, the higher level factors that shaped what equipment was purchased are not understood. Recommendations on the purchase of new equipment are thus likely to be ineffective since the same higher level conditions that led to the purchasing of ineffective equipment still remain, untreated, within the disaster response system. The use of Accimap analyses for generating pro-active improvements to disaster response systems is therefore recommended. In particular, planners could use Accimap analyses to develop policy and practice designed to remove higher systems level factors.
The Accimap approach is generic and can be applied to any form of disaster response, be it bushfires, flood events, hurricanes or even man-made disasters such as terrorist attacks. This is attractive since it supports understanding and enhancement of disaster response systems for all hazards, as opposed to one type in isolation. Further, analysis from different disaster types can be compared easily. Finally, Accimap is simple learn and apply, and the output is easily interpretable. Practitioners working in the emergency management area will be able to grasp and apply the method with only minimal training, and the simplicity of the output is such that emergency management personnel will easily be able to interpret analysis outputs.
References
Aini, M. S., & Fakhrul-Razi, A. (2010). Development of socio-technical disaster model. Safety Science, 48:10, pp. 1286-1295
Cassano-Piche, A. L., Vicente, K. J., & Jamieson, G. A. (2009). A test of Rasmussen’s risk management framework in the food safety domain: BSE in the UK. Theoretical Issues in Ergonomics Science, 10:4, pp. 283-304.
Dekker, S. (2011). Drift into failure: from hunting broken components to understanding complex systems. Ashgate, Aldershot, UK.
Goode, N., Spencer, C., Archer, F., McArdle, D., Salmon, P. M., McClure, R. J. (2011). Review of recent Australian disaster inquiries. Attorney Generals Department Report, October 2011.
Leveson, N. G. (2011). Applying systems thinking to analyze and learn from events. Safety Science, 49:1, pp. 55-64
Ottino, J., (2003). Complex systems. AIChE Journal, 49, pp. 292 - 299.
Rasmussen, J. (1997). Risk management in a dynamic society: A modelling problem. Safety Science, 27:2/3, 183-213.
366
Reason, J. (1990). Human Error. New York, Cambridge University Press.
United Nations International Strategy for Disaster Reduction (2012). The economic and human impact of disasters in the last 12 years. http://www.unisdr.org/, accessed 4th April 2012.
Victorian Royal Bushfires Commission (2010). Final report, Volume II – Fire preparation, response and recovery.
367
Recovery from disaster: A case study of individual and community resilience in the face of cyclones Professor Bob Stevenson, PhD, M.S., BA, Dip Nat Res, Dip Ed, James Cook University, Australia Dr Helen Boon, PhD, BSc (Hons), PGCE, Senior Lecturer, James Cook University, Australia Brenton Clark, BA (Hons), James Cook University, Australia Dr Joanne Millar, PhD, BAgrSci, Senior Lecturer, Charles Sturt University, Australia Dr Alison Cottrell, PhD, MSPD, BA, GCTT, Senior Lecturer, James Cook University, Australia Associate Professor David King, PhD, BA (Hons), PGCE, James Cook University, Australia Australian & New Zealand Disaster and Emergency Management Conference Brisbane, April 16 – 18, 2012 This work was funded through the National Climate Change Adaptation Research
Facility, which is an initiative of, and funded by the Australian Government Department of Climate Change and Energy Efficiency, with additional funding from the Queensland Government, Griffith University, Macquarie University, Queensland University of Technology, James Cook University, The University of Newcastle, Murdoch University, University of Southern Queensland and University of the Sunshine Coast. The role of NCCARF is to lead the research community in a national interdisciplinary effort to generate the information needed by decision-makers in government and in vulnerable sectors and communities to manage the risk of climate change impacts. The views and opinions expressed in this publication not necessarily the views of the Commonwealth, and the Commonwealth does not accept responsibility for any information or advice contained herein.
368
Recovery from disaster: A case study of individual and community resilience in the face of cyclones Abstract This paper reports one of four case studies that are part of a larger study aimed at identifying indicators of individual and community resilience to a disaster event. The case studies were conducted in eastern Australia communities which have experienced different kinds of natural disasters or extreme weather events, namely: cyclone, flood, fire and drought. This research was intended to identify the characteristics and indicators of resilience in and across different communities experiencing different natural disasters. The case study reported here draws on data collected from individual and focus group interviews to examine factors perceived to be critical to individual and community recovery from a major cyclone. Two different groups of participants were interviewed: (1) a cross-section of community residents or stakeholders (e.g. small business owners, farmers, construction workers, women’s groups); and (2) disaster emergency (e.g., state emergency management services, emergency medical services, fire and rescue, ambulance) and recovery respondents (e.g., community welfare agencies, mental health professionals) who were involved in assisting the community during and after the event. A semi-structured interview posed questions to both groups on what helped during and after the event, how different groups coped and which ones were most affected, with particular attention paid to beliefs, behaviours and policies cited as promoting post-disaster resilience. Key findings that emerged include the critical role in individual and household resilience of strong social networks or experience in being self-sufficient, and the importance of coordinated material and psychological assistance through the recovery phase, particularly to people whose housing or businesses suffered severe damage. The implications of the study raise a challenge for disaster respondents and policymakers of finding an appropriate balance in the extent of support provided and enabling individuals and communities to develop adaptive capacity without becoming dependent on external assistance. Keywords: disaster, community, cyclone, adaptation, climate change Introduction The world’s climate is experiencing marked changes. With predictions of hightened climatic uncertainty brought about by global climate change, there is an urgent need to examine disaster impacted communities to find out what has supported their sustainability and adaptation to living in natural hazard prone areas. When a natural hazard overwhelms a community, the consequent disaster shuts down many services and impacts upon the capacity of local institutions to function. An unprepared community might be pushed into crisis. It is during the immediate period before a natural hazard impact, during the passage of the hazard, and in the days immediately following, that communities must rely on their own knowledge and adaptive capacity to prepare, survive, cope and recover. Community surveys in Australia underscore a lack of preparation for a range of gradual onset hazards such
369
as floods (ABS 2008; GNS 2007), bushfire (Bushnell, Balcombe and Cottrell 2007), and cyclones (Anderson-Berry and King 2005). Emergency management responses and strategies within this context face many challenges. Data on disasters and disaster risk reduction are often lacking at the local Australian level, which can constrain improvements in local vulnerability reduction (IPCC 2012). In an effort to design effective adaptation and risk management strategies it is critical that government, especially local government and emergency management examine best practice: what strategies increase effective responses to natural hazards, reduce vulnerability to hazard impact and enhance community recovery in specific contexts? Post-disaster recovery and reconstruction processes do not only provide an opportunity for reducing weather- and climate-related disaster risk and for improving adaptive capacity locally, they also provide valuable knowledge and lessons for application more broadly, increasing the capacity for longer-term planning and policy changes for sustainable development nationally and internationally. Post-disaster case studies can illuminate the diverse factors that influence individual and community resilience. This understanding can be used to design interventions to improve community resilience for responding to and recovering from emergency climate change contingencies. This paper reports one of four case studies that are part of a larger project aimed at identifying private and public sector groups’ beliefs, behaviours and policies that support community resilience to a disaster event. The case studies were conducted of communities in eastern Australia which have experienced different kinds of natural disasters or extreme weather events, namely: cyclone, flood, fire and drought. This research was intended to identify the characteristics and indicators of resilience to climate change in and across different communities and different natural disasters. The case study reported here examined how people responded to and recovered from a major cyclone. A range of perceptions of individual and community resilience were documented through individual and focus group interviews. Particular attention was paid to beliefs, behaviours and policies cited by particular community sectors as assisting recovery and promoting post-disaster resilience. A Framework for Studying Recovery from Disaster Bronfenbrenner’s bioecological model or systems theory (1979; 1989) “is often used to help understand the dynamic relationship between risk and protection. The model is helpful because it supports exploration of relationships and processes, rather than being limited to a simplistic list of risk factors” (Sutherland, 2005, p. 600). This model therefore lends itself well to the examination of risk or vulnerability and protection or resilience in the face of extreme climate events in that it views the individual’s adaptive capacity within a system of multilevel environmental relationships. This suggested its usefulness as a conceptual framework to examine the influences that shape individuals’ resilience in a disaster impacted community given that resilience can be viewed as the ability to positively adjust or adapt to adversity. We used this model (Figure 1) to organise factors that individuals cite as helpful according to the placement of the factor in relation to the individual’s ecosystem
370
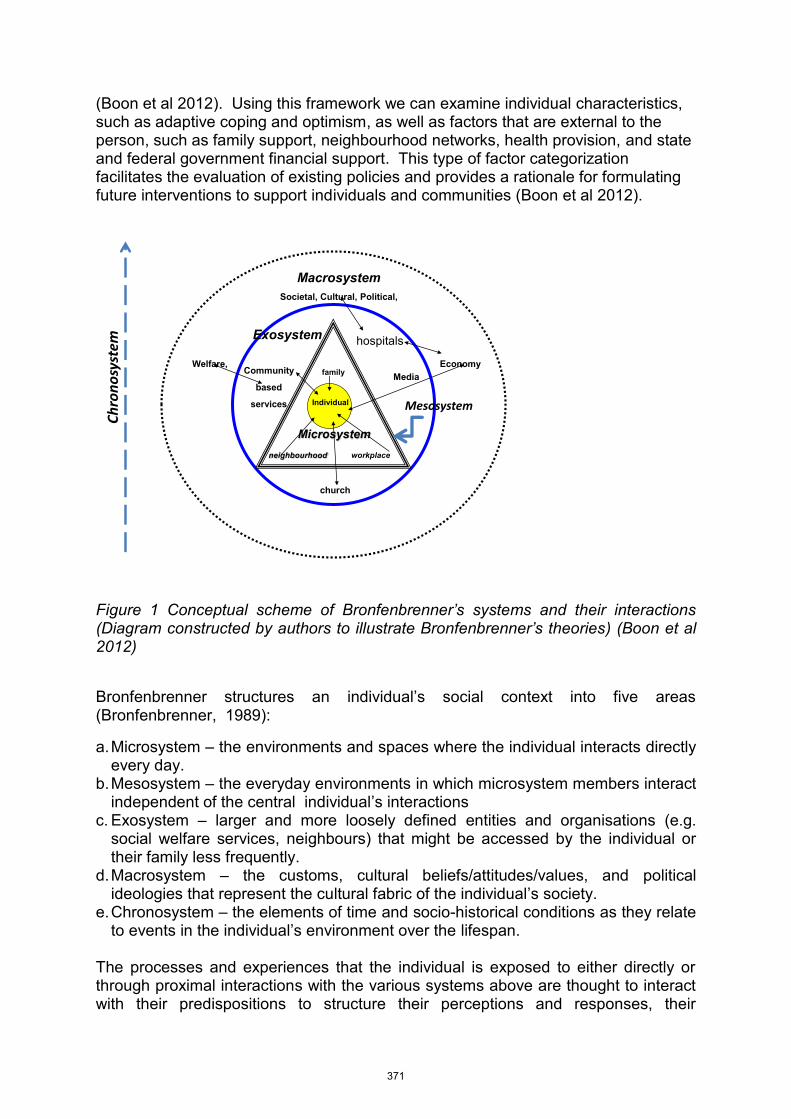
(Boon et al 2012). Using this framework we can examine individual characteristics, such as adaptive coping and optimism, as well as factors that are external to the person, such as family support, neighbourhood networks, health provision, and state and federal government financial support. This type of factor categorization facilitates the evaluation of existing policies and provides a rationale for formulating future interventions to support individuals and communities (Boon et al 2012).
MacrosystemSocietal, Cultural, Political,
Welfare, Economy
Individual
Exosystem
Community
based
services
Microsystem
family
neighbourhood workplace
Media
church
hospitals
Chronosystem
Mesosystem
Figure 1 Conceptual scheme of Bronfenbrenner’s systems and their interactions (Diagram constructed by authors to illustrate Bronfenbrenner’s theories) (Boon et al 2012)
Bronfenbrenner structures an individual’s social context into five areas (Bronfenbrenner, 1989):
a. Microsystem – the environments and spaces where the individual interacts directly every day.
b. Mesosystem – the everyday environments in which microsystem members interact independent of the central individual’s interactions
c. Exosystem – larger and more loosely defined entities and organisations (e.g. social welfare services, neighbours) that might be accessed by the individual or their family less frequently.
d. Macrosystem – the customs, cultural beliefs/attitudes/values, and political ideologies that represent the cultural fabric of the individual’s society.
e. Chronosystem – the elements of time and socio-historical conditions as they relate to events in the individual’s environment over the lifespan.
The processes and experiences that the individual is exposed to either directly or through proximal interactions with the various systems above are thought to interact with their predispositions to structure their perceptions and responses, their
371
behaviours, their adaptation and their acquisition of knowledge and skills (Bronfenbrenner and Ceci 1994). The Context Innisfail is located 88km south of Cairns and 260km north of Townsville at the confluence of the North and South Johnstone rivers. It is a major centre within the Cassowary Coast Regional Shire that also includes the towns of Babinda, Tully, Mission Beach and Cardwell. Innisfail and the surrounding region’s main industries include tourism, aquaculture, agriculture and tropical fruit horticulture, with a prominent reliance on the sugar cane and banana industries (innisfail.oz-e.com.au, 2010). The town and the surrounding region is widely known for its multicultural and ethnic diversity with many people within the community originating from overseas or descendants of migrants from countries such as Italy, Greece, the former Yugoslavia, India and northern Laos (innisfail.oz-e.com.au, 2010). According to the Australian Bureau of Statistics’ (ABS) 2006 census data, the former Johnstone Statistical Local Area (SLA) consisted of 12.6% of the population born outside of Australia and 9.2% identifying as Indigenous Australians (ABS 2010). Innisfail’s notable ethnic and cultural diversity is also coupled with a large proportion of families (73%) and a corresponding youthful population. Almost 20% of the former Johnstone SLA’s population were aged between 0 and 14 years of age (ABS 2010). The former Johnstone SLA represents a broad spectrum of vocations with a predominance of managers, technicians, trade workers and labourers with 10.7% of workers involved in the construction industry and 12.3% in property and business services (ABS 2010). Primary industries, however, were the largest contributor to the region comprising 39.7% of the businesses categorised by industry according to the 2006 census data (ABS 2010a). Immediately following Cyclone Larry there was a decrease in population within the now defunct Johnstone Shire area (ABS 2010). By 2007 the population of the former Johnstone SLA began to gradually recover with the population surpassing pre-cyclone levels by 2008 (ABS 2010). According to Queensland Government statistics, the projected population for the Cassowary Coast Local Government Area (LGA) will reach 29,623 by 2011 (Office of Economic and Statistical Research (OESR), 2010). The Cyclone Event During the early hours of the 18th March 2006 Cyclone Larry formed from a low-pressure system over the Coral Sea and was classified by the Bureau of Meteorology (BOM) as a severe Category 3 cyclone and continued to intensify into a Category 5 as it tracked towards the northern Queensland coast (BOM 2007). The eye of the cyclone crossed the coast near Innisfail around daybreak on the 20th March 2006. Upon landfall wind gusts were estimated to have reached up to 240km/h, which led to Larry being categorised as a Category 4 cyclone.
372
Cyclone Larry’s winds had a devastating impact, destroying thousands of buildings throughout the cyclone affected area. Fortunately no lives were lost with only 30 recorded injuries. The large-scale devastation created by Cyclone Larry led to over 300 people being evacuated from their homes throughout the cyclone affected area (Australian Red Cross 2006; BOM 2007). Electricity transmission lines were cut both to the north and southwest of Innisfail, with extensive damage to the electrical distribution network. This led to the disruption of power to vital utilities such as the local hospital, and water supply and treatment facilities (Adrian Hitchman et al 2006). Other vital infrastructure was either badly damaged or disrupted with all road and rail access to the region being cut for several days following Cyclone Larry due to heavy flooding (Hitchman et al 2006). Many houses lost their roofs during the event and the Insurance Council of Australia recorded a total of $540 million in insurance claims resulting from Cyclone Larry (The Honourable Peter Beattie, 2006; BOM 2007). Aims of the Study The aim of this research was to understand community perceptions about what assisted in the response to and recovery from the 2006 Cyclone Larry in the Innisfail region. This understanding was intended to help identify indicators of resilience to climate contingencies in a diverse community experiencing cyclones and to link community level factors with individual level factors of resilience. We were also interested in identifying private and public sector groups’ beliefs, behaviours and policies that have supported community resilience to a cyclone.
Methods Interviews were conducted with two different groups:
(1) key informants (KI) comprising various categories of disaster emergency (e.g., state emergency management services, emergency medical services, fire and rescue, ambulance) and recovery respondents (e.g., community welfare agencies, mental health professionals) who were involved in assisting the community during and after the event.
(2) a cross-section of community residents (R) (e.g. small business owners, farmers, construction workers, women’s groups) determined from a demographic profile of each community and conversations with key informants and community representatives of various organisations.
Members of these two groups were not mutually exclusive as many engaged in disaster response were also members of the affected community. Particular attention was paid to including (although not always successfully) participants for the community focus groups and key informants, those most affected by the event and to members of vulnerable groups, even if they were not widely represented in the community. A semi-structured interview of open questions was developed for use with each group. Questions to informants and the community addressed the kinds of assistance that helped (and/or were provided) both during the event and after the event, how different groups coped and which ones were most affected, and the impact on the community. The difficulty of scheduling people at the same time led to only two focus groups being conducted and many individual or paired interviews.
373
The length of interviews varied from around 30 minutes to two hours. Interviews were conducted between August, 2010 and January, 2011 with a series of final interviews scheduled in early February on responses to Cyclone Larry unable to be completed because of Cyclone Yasi. A total of eighteen key informants and twenty community residents were interviewed at this site. All the community residents who were interviewed lived in the Innisfail region at the time of Cyclone Larry. Interviews were taped in most cases and transcribed (except in a few cases where recordings were inaudible) and notes were taken and later expanded. Transcribed tapes (or notes when transcriptions not available) from interviews were analysed separately using the qualitative data technique of open coding in which the main issues that emerged are first identified and coded. These codes were then categorised into themes or recurrent patterns. Common themes were identified within and across the Bronfenbrenner categories of scale: the microsystem, mesosystem, exosystem, macrosystem and chronosystem. Findings A number of major themes emerged from the interview participants’ responses to five major interview questions:
(1) What or who helped during and after the cyclone? (2) Who were most affected? (3) How did different groups cope during and after the cyclone? Who didn’t cope
well? (4) What was the perceived (short and long term) impact on the community? (5) How prepared is the community to face future cyclones?
Key influences or factors were first identified among the responses to each of these questions. For example, three factors emerged from the responses to the first question (what and who helped?) as important to helping individuals and the community during and immediately after the cyclone. These were: readiness or preparedness for the event; immediate responses from government and other agency services to meet basic needs (e.g., food, water, energy supplies, medical); and community spirit. Three broad groups were identified as providing assistance – various government agencies at all levels (including the Army); non-profit national and local community organisations; and members of the community itself. The factors identified within responses to each question were then constructed into major themes across the question responses in relation to both the immediate response to and recovery from the cyclone. Findings are presented in categories of system level themes. The major themes at the micro-system level were: contributing factors to readiness or preparedness; and the impact (i.e., the most affected) on individuals and families whose homes or crops were severely damaged. The mesosystem themes were social networks; and the impact (i.e., the least resilient groups) on the poor, young and new or transient residents. Four themes emerged at the exosystem or local community, regional, state and federal levels: community spirit; kinds of assistance provided by local business, non-government and community organisations; response by private regional infrastructure providers; and kinds of assistance provided by state and federal government. A number of claims are made within and across these themes.
374
The Microsystem of Individuals and Families Readiness/Preparedness Stakeholders reported being placed on a high state of readiness before the cyclone occurred, which assisted in their preparation for and response to the event. An awareness that the cyclone had a high possibility of impacting the Innisfail area - the cyclone “was in the news, it was everywhere” (R) leading up to its landfall - alerted most stakeholders. Prior experiences and learning gleaned from fellow members within the community reportedly contributed to creating this state of readiness by helping jolt a number of stakeholders into action. As one local stakeholder commented, seeing her elderly father who had been through numerous cyclones feverishly prepare his property made her think “ok this is serious…I was thinking hell if he is cleaning up we better start doing something.” Being ready and prepared for the impact of the cyclone and feeling “self-sufficient” also included having canned food, water, gas bottles and other supplies on hand (KI,R). One respondent argued that residents of Far North Queensland are also better mentally prepared because of experiences of living with extreme weather events. Emergency respondents, however, had a somewhat different view of the community’s awareness of and preparation for the impending cyclone. While respondents reported that information technologies, particularly the internet, allowed them to accurately track the cyclone’s path (KI), they believed this warning was not widely disseminated or known until at least two days prior to the event, when the local Mayor informed the community at a local festival to go home and get their families and properties prepared. This perceived late notice was viewed as contributing to ill-preparedness and a lack of readiness. A number of respondents noted that many people did not seem to “know what was going on”, or acted complacently (KI,R). Some stakeholders agreed that there was at least a disbelief, which could be seen as bordering on complacency, among some people in the community that resulted in a lack of preparation. This applied not only to some “newcomers” to Innisfail who had never experienced a cyclone before and were unaware of its potentially serious impact, but also to those who had experienced previous cyclone warnings but were in a state of disbelief that the cyclone would actually hit Innisfail (but swing away and miss the town) – a feeling reinforced by the weather the day before the cyclone struck being calm and sunny with many folk participating in a local festival.
“I had a conversation with one of our carers and I rang them because once I had been called into work… and then went and rang family day care providers who come in and they service… and said to this particular carer, 'have you notified your parents what are you going to do tomorrow have you cancelled care?’ and they said ‘what for?’ I said ‘the cyclone is coming’, and he said do you really think it is going to hit?’ ‘Well everybody else thinks it is’...” (KI)
The increased accuracy that has been developed in predicting the path of cyclones was viewed as not consistently reflected in the media. Internet websites such as the Bureau of Meteorology were seen as reliable, however traditional media resources such as Television and Radio news media were seen as ‘not clear about anything’
375
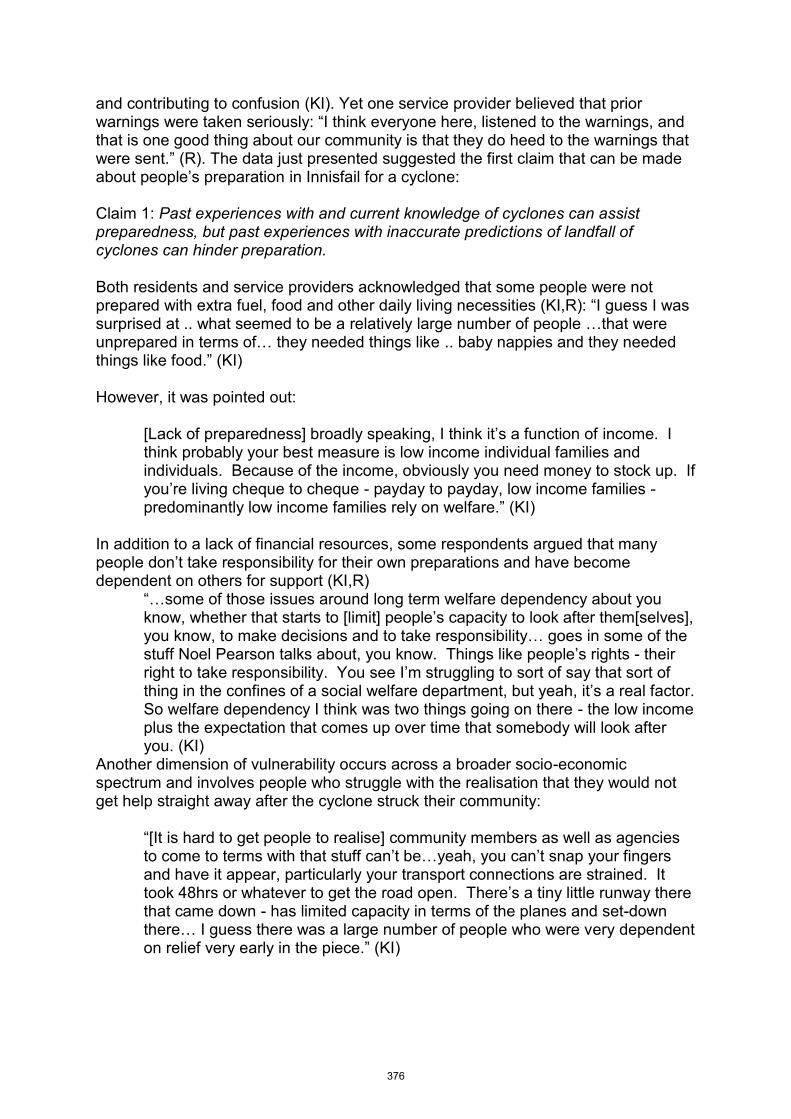
and contributing to confusion (KI). Yet one service provider believed that prior warnings were taken seriously: “I think everyone here, listened to the warnings, and that is one good thing about our community is that they do heed to the warnings that were sent.” (R). The data just presented suggested the first claim that can be made about people’s preparation in Innisfail for a cyclone: Claim 1: Past experiences with and current knowledge of cyclones can assist preparedness, but past experiences with inaccurate predictions of landfall of cyclones can hinder preparation. Both residents and service providers acknowledged that some people were not prepared with extra fuel, food and other daily living necessities (KI,R): “I guess I was surprised at .. what seemed to be a relatively large number of people …that were unprepared in terms of… they needed things like .. baby nappies and they needed things like food.” (KI) However, it was pointed out:
[Lack of preparedness] broadly speaking, I think it’s a function of income. I think probably your best measure is low income individual families and individuals. Because of the income, obviously you need money to stock up. If you’re living cheque to cheque - payday to payday, low income families - predominantly low income families rely on welfare.” (KI)
In addition to a lack of financial resources, some respondents argued that many people don’t take responsibility for their own preparations and have become dependent on others for support (KI,R)
“…some of those issues around long term welfare dependency about you know, whether that starts to [limit] people’s capacity to look after them[selves], you know, to make decisions and to take responsibility… goes in some of the stuff Noel Pearson talks about, you know. Things like people’s rights - their right to take responsibility. You see I’m struggling to sort of say that sort of thing in the confines of a social welfare department, but yeah, it’s a real factor. So welfare dependency I think was two things going on there - the low income plus the expectation that comes up over time that somebody will look after you. (KI)
Another dimension of vulnerability occurs across a broader socio-economic spectrum and involves people who struggle with the realisation that they would not get help straight away after the cyclone struck their community:
“[It is hard to get people to realise] community members as well as agencies to come to terms with that stuff can’t be…yeah, you can’t snap your fingers and have it appear, particularly your transport connections are strained. It took 48hrs or whatever to get the road open. There’s a tiny little runway there that came down - has limited capacity in terms of the planes and set-down there… I guess there was a large number of people who were very dependent on relief very early in the piece.” (KI)
376
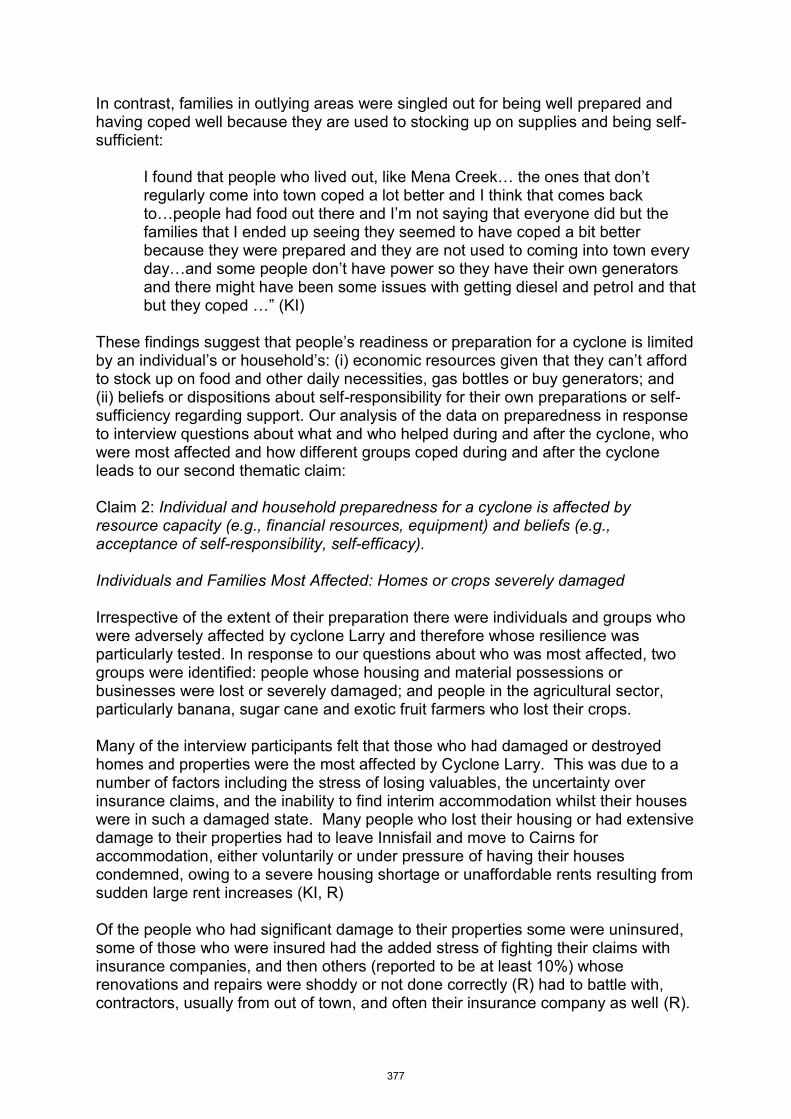
In contrast, families in outlying areas were singled out for being well prepared and having coped well because they are used to stocking up on supplies and being self-sufficient:
I found that people who lived out, like Mena Creek… the ones that don’t regularly come into town coped a lot better and I think that comes back to…people had food out there and I’m not saying that everyone did but the families that I ended up seeing they seemed to have coped a bit better because they were prepared and they are not used to coming into town every day…and some people don’t have power so they have their own generators and there might have been some issues with getting diesel and petrol and that but they coped …” (KI)
These findings suggest that people’s readiness or preparation for a cyclone is limited by an individual’s or household’s: (i) economic resources given that they can’t afford to stock up on food and other daily necessities, gas bottles or buy generators; and (ii) beliefs or dispositions about self-responsibility for their own preparations or self-sufficiency regarding support. Our analysis of the data on preparedness in response to interview questions about what and who helped during and after the cyclone, who were most affected and how different groups coped during and after the cyclone leads to our second thematic claim: Claim 2: Individual and household preparedness for a cyclone is affected by resource capacity (e.g., financial resources, equipment) and beliefs (e.g., acceptance of self-responsibility, self-efficacy). Individuals and Families Most Affected: Homes or crops severely damaged Irrespective of the extent of their preparation there were individuals and groups who were adversely affected by cyclone Larry and therefore whose resilience was particularly tested. In response to our questions about who was most affected, two groups were identified: people whose housing and material possessions or businesses were lost or severely damaged; and people in the agricultural sector, particularly banana, sugar cane and exotic fruit farmers who lost their crops. Many of the interview participants felt that those who had damaged or destroyed homes and properties were the most affected by Cyclone Larry. This was due to a number of factors including the stress of losing valuables, the uncertainty over insurance claims, and the inability to find interim accommodation whilst their houses were in such a damaged state. Many people who lost their housing or had extensive damage to their properties had to leave Innisfail and move to Cairns for accommodation, either voluntarily or under pressure of having their houses condemned, owing to a severe housing shortage or unaffordable rents resulting from sudden large rent increases (KI, R) Of the people who had significant damage to their properties some were uninsured, some of those who were insured had the added stress of fighting their claims with insurance companies, and then others (reported to be at least 10%) whose renovations and repairs were shoddy or not done correctly (R) had to battle with, contractors, usually from out of town, and often their insurance company as well (R).
377
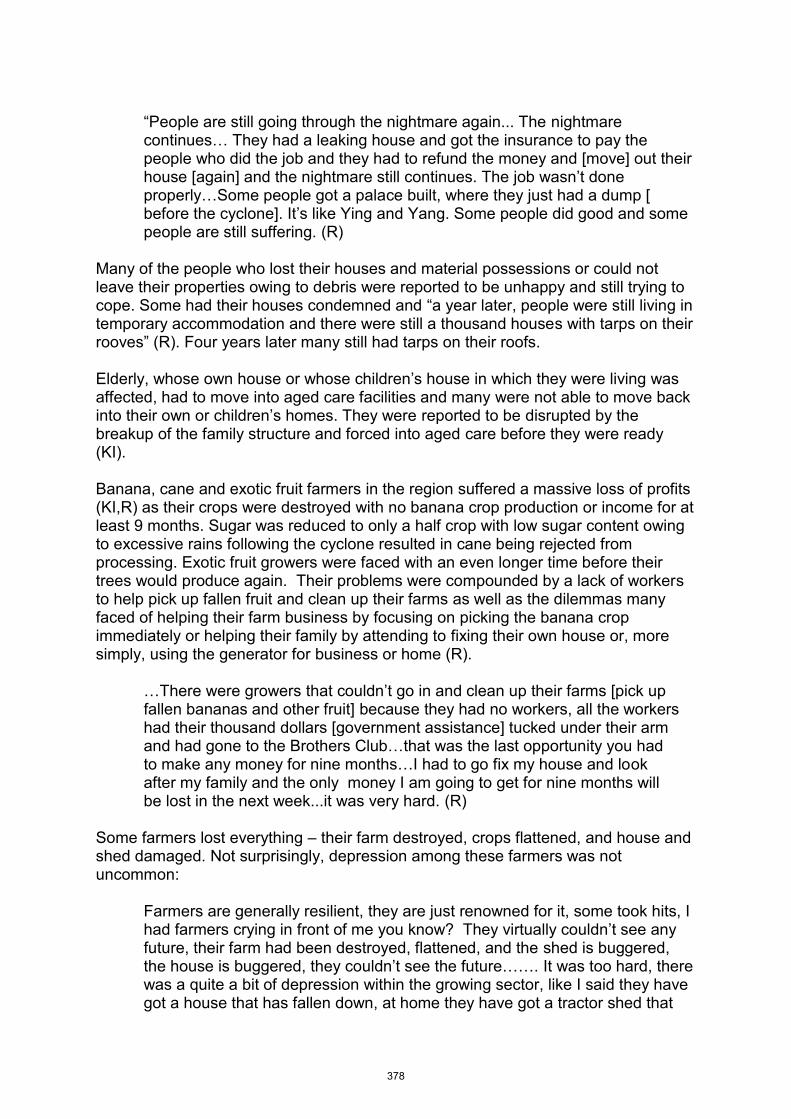
“People are still going through the nightmare again... The nightmare continues… They had a leaking house and got the insurance to pay the people who did the job and they had to refund the money and [move] out their house [again] and the nightmare still continues. The job wasn’t done properly…Some people got a palace built, where they just had a dump [ before the cyclone]. It’s like Ying and Yang. Some people did good and some people are still suffering. (R)
Many of the people who lost their houses and material possessions or could not leave their properties owing to debris were reported to be unhappy and still trying to cope. Some had their houses condemned and “a year later, people were still living in temporary accommodation and there were still a thousand houses with tarps on their rooves” (R). Four years later many still had tarps on their roofs. Elderly, whose own house or whose children’s house in which they were living was affected, had to move into aged care facilities and many were not able to move back into their own or children’s homes. They were reported to be disrupted by the breakup of the family structure and forced into aged care before they were ready (KI). Banana, cane and exotic fruit farmers in the region suffered a massive loss of profits (KI,R) as their crops were destroyed with no banana crop production or income for at least 9 months. Sugar was reduced to only a half crop with low sugar content owing to excessive rains following the cyclone resulted in cane being rejected from processing. Exotic fruit growers were faced with an even longer time before their trees would produce again. Their problems were compounded by a lack of workers to help pick up fallen fruit and clean up their farms as well as the dilemmas many faced of helping their farm business by focusing on picking the banana crop immediately or helping their family by attending to fixing their own house or, more simply, using the generator for business or home (R).
…There were growers that couldn’t go in and clean up their farms [pick up fallen bananas and other fruit] because they had no workers, all the workers had their thousand dollars [government assistance] tucked under their arm and had gone to the Brothers Club…that was the last opportunity you had to make any money for nine months…I had to go fix my house and look after my family and the only money I am going to get for nine months will be lost in the next week...it was very hard. (R)
Some farmers lost everything – their farm destroyed, crops flattened, and house and shed damaged. Not surprisingly, depression among these farmers was not uncommon:
Farmers are generally resilient, they are just renowned for it, some took hits, I had farmers crying in front of me you know? They virtually couldn’t see any future, their farm had been destroyed, flattened, and the shed is buggered, the house is buggered, they couldn’t see the future……. It was too hard, there was a quite a bit of depression within the growing sector, like I said they have got a house that has fallen down, at home they have got a tractor shed that
378

isn’t working for them, some just decided they didn’t want to do anything, it was like they were stunned. I had one bloke come here, he couldn’t get me on my phone, my phone would go off the hook every day, he came around to the shed and he just sat there and started crying I said ‘mate go and see a doctor’…I said ‘you gotta go and see a doctor’... (R)
As indicated, farmers are generally resilient “once they got over the initial shock .. they just got stuck into and did what they needed to do.” However, for some farmers who were at their financial limit or close to retirement, the financial or psychological impact of the cyclone pushed them beyond the boundaries of their resilience and they left the industry. Claim 3: As well as capacity and beliefs, the severity and nature of the impact of a cyclone on households have a large influence on individual and family resilience (and therefore on their need for external assistance or support from government and other agencies). The Least Resilient: Economically strained and new or transient residents As already discussed low socio-economic groups were unable to afford to prepare adequately for the cyclone, but views differed on how well they coped with recovery from the cyclone. One respondent argued that people from low socio-economic groups were:
well looked after .... provided financial assistance …lot of them [people from low socio-economic groups] relied on a lot of the funding that came through so they were getting money in one hand and they were also getting handouts for food and fuel in town were given out and things like that were given to them. Life was good for those probably at the bottom of the scale who normally don’t have those things ... (KI)
On the other hand, those from limited economic resource groups whose rental housing or own, especially uninsured, home was damaged to the extent of being uninhabitable had to leave town because of unaffordable rents and, in the latter case, hope and wait for government assistance to carry out repairs. Similarly, people whose business was already somewhat precarious and who received insufficient government assistance to overcome their recovery costs had to close their businesses. Claim 4: Those who lack economic resources and receive insufficient government or insurance assistance to overcome major housing or business damage sustained in the event, and new or transient and other community residents who lack community connections are likely to be the most vulnerable in their resilience to a cyclone. The Mesosystem and Social Networks As Bronfenbrenner’s model identifies, individuals interact directly with people in their microsystem which includes family, friends, neighbours and workplace colleagues. These relationships constitute one level of a social network. As one respondent
379

stated, if people “didn’t have any relations in the area, they didn’t know where to go, they didn’t know how to go there and a lot of places” (KI). According to Bronfenbrenner’s framework, an individual can also access the connections of family members, neighbours and work colleagues to other systems (e.g., a parent’s workplace, a child’s school, a neighbour’s sporting club), known as exosystems. In other words, people are members of multiple communities (workplace, school, church, sports clubs) in addition to their place of residence. The above comments about transients and newcomers lacking local connections highlight the importance of these social networks or networks of communities which contribute to social capital which is a contributor to resilience (Cottrell et al 2007). Those individuals, including elderly, who remained connected to the community and knew others around them, were deemed to have coped better:
I think [even if you are from a low income background] but you’re still strongly connected, and feel a part of your community, have good strong community networks or engage with community groups. So hence, you’ll see that - so you can be low income and old…huge generalisations here, but you can be an older person on a low income so the pension only, but if you engage with the CWA and the Senior Citizens Hall and you go and play bridge every Wednesday with neighbours and Doris and all that and you’ve got family and you know the butcher, the baker, the candle-stick maker, you know, you’re well placed, your buffeted, your connected, you’re not going to be left alone if you’re liked… so you reach out to help people [and] people [will] reach out to help you. (KI)
Social networks, especially among ethnic groups such as Italians and indigenous communities, were seen as a strong positive influence and helpful coping mechanism (KI). The indigenous community was fairly resilient (KI,R) because it was suggested they are not as dependent on businesses and farms which were affected (R) and have cohesiveness and sense of their place within the community (KI)
The indigenous community is a perfect example [of resiliency] you can be low income but because you’re part of a community and you have a place in community - as long as it’s a reasonably functioning community which I think it’s fair to say, you know - the communities out the back of Tully.... In the scale of things, uh, you know, are still quite a cohesive community there. You had high needs - you had high needs all over the place but often that sort of setting is an example of resiliency, having resilience through social connectedness, and having a place in the world I guess and a place in your community. (KI)
On the other hand, two groups that were mentioned as not coping well after the event were itinerants or ‘transients’ and ‘newcomers.’ Transients were seen as not as well prepared financially or in terms of awareness of cyclone threat (KI), while newcomers were portrayed as lacking the knowledge and experience to know how to prepare for the event as well as the deep roots in the community that would have enabled them to connect to sources of advice, support and assistance.
380
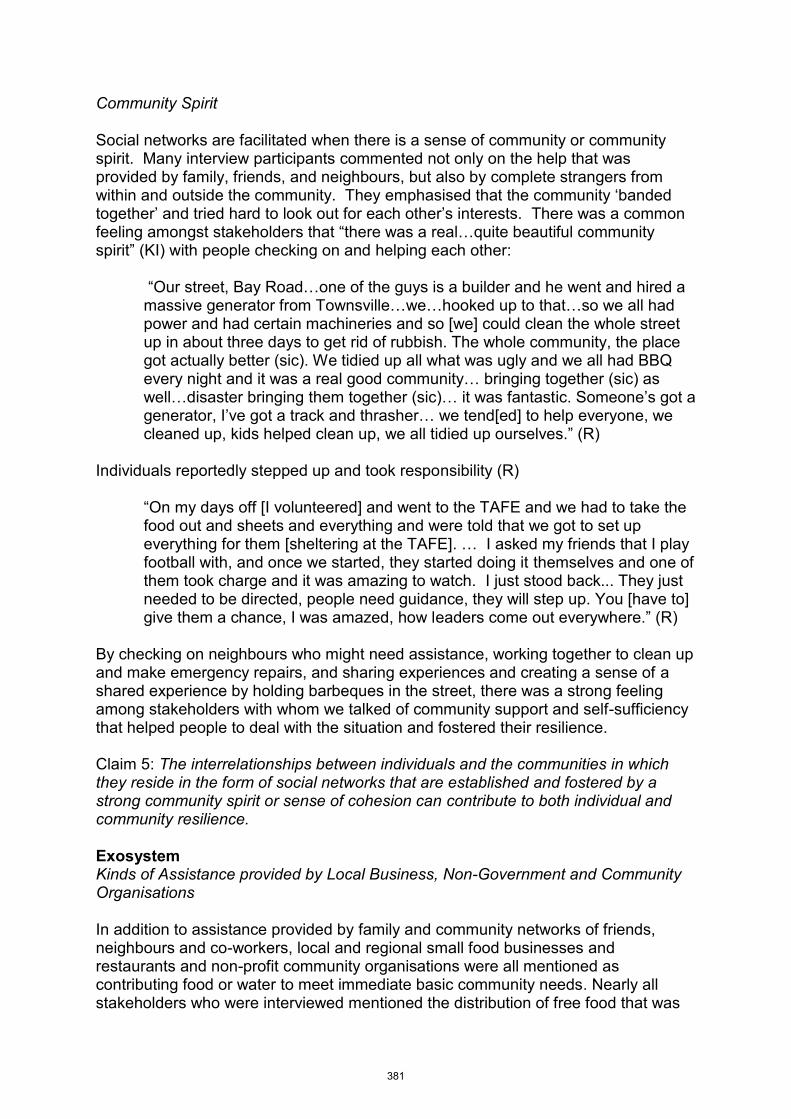
Community Spirit Social networks are facilitated when there is a sense of community or community spirit. Many interview participants commented not only on the help that was provided by family, friends, and neighbours, but also by complete strangers from within and outside the community. They emphasised that the community ‘banded together’ and tried hard to look out for each other’s interests. There was a common feeling amongst stakeholders that “there was a real…quite beautiful community spirit” (KI) with people checking on and helping each other:
“Our street, Bay Road…one of the guys is a builder and he went and hired a massive generator from Townsville…we…hooked up to that…so we all had power and had certain machineries and so [we] could clean the whole street up in about three days to get rid of rubbish. The whole community, the place got actually better (sic). We tidied up all what was ugly and we all had BBQ every night and it was a real good community… bringing together (sic) as well…disaster bringing them together (sic)… it was fantastic. Someone’s got a generator, I’ve got a track and thrasher… we tend[ed] to help everyone, we cleaned up, kids helped clean up, we all tidied up ourselves.” (R)
Individuals reportedly stepped up and took responsibility (R)
“On my days off [I volunteered] and went to the TAFE and we had to take the food out and sheets and everything and were told that we got to set up everything for them [sheltering at the TAFE]. … I asked my friends that I play football with, and once we started, they started doing it themselves and one of them took charge and it was amazing to watch. I just stood back... They just needed to be directed, people need guidance, they will step up. You [have to] give them a chance, I was amazed, how leaders come out everywhere.” (R)
By checking on neighbours who might need assistance, working together to clean up and make emergency repairs, and sharing experiences and creating a sense of a shared experience by holding barbeques in the street, there was a strong feeling among stakeholders with whom we talked of community support and self-sufficiency that helped people to deal with the situation and fostered their resilience. Claim 5: The interrelationships between individuals and the communities in which they reside in the form of social networks that are established and fostered by a strong community spirit or sense of cohesion can contribute to both individual and community resilience. Exosystem Kinds of Assistance provided by Local Business, Non-Government and Community Organisations In addition to assistance provided by family and community networks of friends, neighbours and co-workers, local and regional small food businesses and restaurants and non-profit community organisations were all mentioned as contributing food or water to meet immediate basic community needs. Nearly all stakeholders who were interviewed mentioned the distribution of free food that was
381
cooked by local cafes and sent in by out-of-town restaurants as well as donated food distributed by the Salvation Army and water distributed by a bottling manufacturer and later on, the government (R, KI) A number of NGOs and local non-profit organisations were also very active in the post-cyclone period (R, KI) and helped the community during recovery with economic and material assistance, as well as counselling services. These included the Red Cross, Seventh Day Adventist Church, St. Vincent de Paul and several small local organisations. Smaller community-based organizations helped people with their bills, fuel vouchers, and advocacy:
A lot of [the smaller community based organisations] manage what’s called an emergency relief scheme so they…not related to disaster, but also for people who struggle to meet their bills or whatever can - they’re funded through the State and Commonwealth government to occasionally provide financial assistance to families in need or it can be assistance in terms of food vouchers and things like that, so they have their emergency relief programs…you know, information, referral, counselling, neighbourhood centres, [they] can sometimes do advocacy …you know, case management... (KI)
There’s a whole support system around the Indigenous community as well…so Indigenous health organisations…which is down in Innisfail is the Mamu Health Organisation…so they have a big role. (KI)
In addition to offering material forms of support, some noted that even for those who did not need or want such assistance their presence provided a useful opportunity to just talk:
I do remember people coming around and offering to help, the church and the Red Cross and everything were coming around and offering help but yeah I suppose it was available but like people are they go 'nah we are right' but some people just come and had a chat which was good at times. (R)
Response by Private Regional Infrastructure Providers Repairing vital infrastructure is a major task following a cyclone that confronts utility providers, such as in the case of Cyclone Larry, Ergon Energy and Telstra. The larger towns in North Queensland, such as Innisfail, do have permanent diesel generators which mean that power was not completely lost and therefore available to the emergency response teams. Restoration of power, however, was a major concern to restaurants, cafes and food stores and many families for preventing food spoilage and contamination. The local power company was praised for its quick response in bringing in large generators to provide power for whole suburbs (R) and to repair damaged infrastructure. (R)
“Ergon sent a whole troupe of people from all around Australia and sent them up here. I didn’t have power at my place for two weeks; two and a half
382
weeks… they did a really good job considering there was a lot of damage to the power [distribution network]. (R)
Others apparently did not find the loss of power a major issue: “I don’t know why, I didn’t really hear any people whinge about lack of [electricity]” (R). One resident claimed the reason was that people found other things to do (than watching TV and sitting in air conditioning). Kinds of Assistance provided by State and Federal Government The immediate response by the local disaster management group, the army, State Emergency Services, and the local council was widely viewed by local Innisfail residents as efficient and well coordinated:
“I think [the response] was really well coordinated between the disaster management response group locally, the SES, and the army I think they worked really well to get everything done… That side of it I think was handled particularly well, even though there was people complaining, but they would complain no matter what.” (R)
Cyclone Larry, being considered one of the biggest cyclones since Tracy which hit Darwin in 1974, became a “political hot potato…basically the minute it happened there was (sic) politicians one after the other come into town…every politician comes in with a truckload of whatever you want, whatever you need” (KI). Political concerns to not repeat the poor response to New Orleans after Katrina (KI,R) resulted in the community receiving more government assistance than similar events. As one resident stated, “we were really lucky that Larry came after Katrina.” The role of government at all levels in assisting recovery efforts was also generally viewed positively, including assistance provided to businesses (reportedly $10,000) and the injection of cash into the community
Collectively it was fantastic. Within two months, everything is down and flat, it was tidy and clean. It was amazing the speed they’ve got the town back to normal. I think it was because the incentives they gave us were spot-on. … But they [the incentives] didn’t come until a little bit later and at first people would jump in anyway without incentives. That was a week later when the government gave everyone $1000. There was no cash around. But ATM didn’t work so you couldn’t get fuel out because there was no electricity and generators ran out. (R)
Besides financial support, psychological services and support were also provided by the state government through the Queensland Health program on mental health, which was described as helping farmers deal with depression:
We had a lot of growers meetings after the cyclone...and we had people from Centrelink from Queensland Health and they did talks on mental health issues and that side of it, (inaudible) there was people everywhere here and in Tully, Babinda, if you needed help you could go and talk to someone privately and it was a very good response just a month after the cyclone, the first couple of weeks there was probably a gap, after that once people got on the ground
383
here, if you needed somebody they were here.” (R) The state government’s response phase, which lasted six months, assisted people with accommodation and daily living requirements. Two community recovery mental health teams were then set up providing extra assistance, in conjunction with various agencies, for another 12 months. A large increase in mental health cases was expected but did not occur, just a large call for assistance immediately after the cyclone but then that tapered off (KI).
“…We expected a great deal [of mental health issues within the Innisfail community following Cyclone Larry] but I think one of the good …one of the things that came out of Larry was we really didn’t attribute any deaths to Larry. And because of that, I think that…my personal opinion was that made it more easy for the people in the affected area to process their emotions about how Larry had affected them a lot more positively and move on… we were looking for say, a 12% increase [in people seeking their services] and we didn’t get it. We didn’t get anywhere near it…didn’t get near it. I think we were lucky to get about half of them, so that was interesting side-effect of Larry.” (KI)
A dilemma of government assistance was raised by a couple of the interview participants who feel a major downside to the assistance that was provided to the Innisfail community by all levels of government and a range of non-government organisations is that the community’s resilience has been eroded. They argued that people now expect financial assistance following a major disaster, and are unwilling to help themselves and following the event many people have displayed a lack of integrity and self-sufficiency.
“I think the concern at the moment is mostly that there was considerable assistance afterwards and there’s a bit of an expectation now that, that assistance will be there for any event and we found that in the floods because we have annual flooding every year and with the following floods that occurred people were starting to take white goods down into the water instead of putting them up because they think they might get a new washing machine or whatever and they were starting to ring up before that was even announced ' what's the number to get the money?' So it’s set a precedent now that we have to reverse.” (KI)
Claim 6: The kinds (e.g., economic, material, medical/health), extent and timing of assistance provided by local and regional non-government and private bodies and state and federal government agencies are critical to both individual and community post-cyclone resilience but can also create a dependency that inhibits the development of resiliency. Conclusion As a consequence of socio-historical conditions (the chronosystem) in modern societies (the macrosystem) individuals have become more dependent on services and institutions in both their local community (within their exosystem) and the larger society (macrosystem). This economic or psychological dependency can become a particular problem when interactions with these institutions are ruptured by a major
384
disaster such as an extreme weather event. People’s expectations regarding assistance were described as degrading their preparedness as many do not take responsibility or have the economic resources to become self-sufficient, leave before the event or mitigate the risks. In contrast, those individuals, households and groups who have strong social networks (in their microsystem) are able to draw on shared material and social resources to sustain them during and through the aftermath of a cyclone. For example, in the indigenous community in Innisfail the strengths of their (microsystem and mesosystem) interactions made them less dependent on organizations in the larger community (exosystem) during the period of chaos following a cyclone than individuals who lack such close social or cultural ties or relationships. They are able to rely on extended family and neighbours for support for managing or maintaining basic functions and structures. Similarly, those who have had to be more self-sufficient owing to their circumstances (e.g., rural fringe dwellers) are likely to cope better because of their capacity to draw on their own resources and knowledge of more traditional methods of survival (by finding substitutes for lack of power for cooking and entertainment). Individuals with limited or weak family or neighbourhood (microsystem) interactions (e.g., community newcomers, transients) are likely to have a limited mesosystem which reduces their interactions with supportive community groups and organisations (in the exosystem). A lack of these connections can hinder interactions with loosely defined or informal community groups as well as the larger and more impersonal government and non-government services and organizations. This suggests that our societies have become potentially more vulnerable and less resilient to disasters unless individuals and communities can draw on personal and social resources and capacities. Yet in an urbanized and suburbanized environment the opportunities to make these connections are not always readily present. Despite living in environments that, by and large, do not provide support for the development of autonomy, competence, and relatedness, some individuals survive and thrive by relying more heavily on their own abilities. In the face of increased extreme climate contingencies others need to be assisted to learn such adaptive strategies and hence become more resilient. At the same time, recovery from such extreme climate events as cyclones is beyond the sole capacity of most individuals and communities. Finding a balance between adequate economic and psychological support and creating a dependence on external assistance is a challenge for policymakers and respondents charged with responsibility for helping individuals and communities bounce back from and adapt to disaster events. References Anderson-Berry, L. and King, D. 2005, Mitigation of the Impact of Tropical Cyclones in Northern Australia through Community Capacity Enhancement. Mitigation and Adaptation Strategies for Global Change, vol. 10, pp. 367-392. Springer Australian Bureau of Statistics (ABS) 2010. 1379.0.55.001 National Regional Profile, Cassowary Coast (R) - Johnstone, 2004-2008. Canberra. Australian Bureau of Statistics .2008, Social Trends 2008. Available online www.abs.gov.au Adams, A.M., Madhavan, S. and Simon, D. 2002, ‘Women’s social
385
networks and child survival in Mali’, Social Science and Medicine, vol. 54, pp.165-178. Australian Red Cross. 2006, Red Cross Volunteers Assisting Cyclone Victimes [Online]. Available: http://www.redcross.org.au/QLD/news_CycloneLarry.htm [Accessed 7 September 2010]. Beattie, P. 2006, Premier urges residents to prepare for Cyclone Larry. Queensland Government. Boon, H., Cottrell, A., King, D., Stevenson, R. and Millar, J. 2012, Bronfenbrenner’s bioecological theory for modelling community resilience to natural disasters. Natural Hazards, vol:60, no.2, pp. 381-408. Brofenbrenner, U. 1989, Ecological systems theory. Ann Child Dev vol:6, pp187–249. Brofenbrenner, U. 1979, The ecology of human development. Cambridge, MA: Harvard University Press. Bronfenbrenner, U. and Ceci, S. 1994, Nature nurture reconceptualised in developmental perspective: a bioecological model. Psychol Rev vol:101, no.4, pp.568–586. Bureau of Meteorology (BOM) 2007, Severe Tropical Cyclone Larry. Australian Government: Commonwealth of Australia. Bushnell, S., Balcombe, L. and Cottrell, A. 2007, ‘Community and fire service perceptions of bushfire issues in Tamborine Mountain: what’s the difference?’ Australian Journal of Emergency Management, vol. 22, no.3, pp.3-9. GNS. 2007, Flood risk perceptions, education and warning in four communities in New South Wales, Australia – results of a questionnaire survey, 2005. GNS Scientific Report 2007/30. Hitchman, A, Cechet, B, Edwards, M, Boughton, G, Milne, M, Mullaly, D, and Thankappan, M. 2006, Preliminary assessment of Tropical Cyclone Larry, AusGeo News, September 2006, No 83, Canberra: Commonwealth of Australia. IPCC, 2012, Summary for Policymakers. In: Managing the Risks of Extreme Events and Disasters to Advance Climate Change Adaptation [Field, C.B., V. Barros, T.F. Stocker, D. Qin, D.J. Dokken, K.L. Ebi, M.D. Mastrandrea, K.J. Mach, G.-K. Plattner, S.K. Allen, M. Tignor, and P.M. Midgley (eds.)]. A Special Report of Working Groups I and II of the Intergovernmental Panel on Climate Change. Cambridge University Press, Cambridge, UK, and New York, NY, USA, pp. 1-19. Office of Economic and Statistical Research 2010, Queensland Regional Profiles: Cassowary Coast Regional. Queensland Government. Sutherland, D. 2005, Resiliency and collateral learning in science in some students of Cree ancestry. Science Education, vol:89, no.4, pp. 595-613.
386
Urban resilience: Bouncing back, coping, thriving
Dr Suzanne Vallance
Lecturer
Lincoln University, Canterbury, New Zealand
Paper presented at EARTH: FIRE AND RAIN Australian & New Zealand Disaster and Emergency Management Conference Brisbane – 16 – 18, April 2012
387
Urban resilience: Bouncing back, coping, thriving
Abstract: The recent Christchurch earthquakes provide a unique opportunity to better understand the relationship between pre-disaster social fault-lines and post-disaster community fracture. As a resident of Christchurch, this paper presents some of my reflections on the social structures and systems, activities, attitudes and decisions that have helped different Canterbury ‘communities’ along their road to recovery, and highlights some issues that have, unfortunately, held us back.
These reflections help answer the most crucial question asked of disaster scholarship: what can recovery agencies (including local authorities) do - both before and after disaster - to promote resilience and facilitate recovery. This paper – based on three different definitions of resilience - presents a thematic account of the social recovery landscape. I argue that ‘coping’ might best be associated with adaptive capacity, however ‘thriving’ or ‘bounce forward’ versions of resilience are a function of a community’s participative capacity.
Keywords: resilience; community engagement; recovery; earthquakes; disaster; Canterbury
Introduction
On September 4th 2010, at 4.36 am, the Canterbury (New Zealand) region was rocked by a large 7.1 magnitude earthquake that moved Canterbury 2 metres closer to Australia. Although there were no casualties, certain suburbs of the city of Christchurch, and parts of Kaiapoi in the neighbouring Waimakariri District, suffered extensive land damage in the form of liquefaction (known colloquially as sand volcanoes) and lateral spread (surface rupture and slippage). These geological phenomena left some residents homeless and many more living in sub-standard housing. Then, 6 months later, almost directly under the city of Christchurch, another 6.8 magnitude earthquake occurred. Though technically ‘smaller’, the peak ground acceleration of 2.2 (over twice that of gravity) was one of the highest ever recorded and, according to Professor Yeats, Professor Emeritus of Geology at Oregon State University in Corvallis, USA, this would have ‘flattened’ most world cities.1 This time, 181 people were killed (most of them in the collapse of two large inner city buildings) and many more were injured. Those homes that had already been affected in the first earthquake generally suffered further damage and some previously unscathed hillside suburbs also became unstable. The CBD was devastated, and considerable areas of the inner city – the ‘drop zones’ - will remain off-limits until two tall, unstable buildings are deconstructed.
1 www.stuff.co.nz/national/christchurch-earthquake/4711189/Tuesday-quake-no-aftershock
388
The recovery process has been delayed and complicated by the on-going aftershocks; as of January 2012, almost one year after the February quake, the Canterbury region has suffered 4 major events of 6+ magnitude or more on the Richter scale with each of these causing significant liquefaction and lateral spread; over 3000 of 3+, many of which exacerbate existing damage and make the author’s filing cabinet rattle; and nearly 7000 of lesser magnitude. Given the extended nature of earthquake sequence, finding companies to re-insure infrastructure has proved difficult and has slowed the recovery.
The cost of repair is considerable, and climbing. Latest estimates (approximately 8 months on) put the bill at about US $20 billion or 8 per cent of the country’s GDP. To put this in perspective, the bill from Hurricane Katrina was less than 1 per cent of the United States’ GDP. The 1995 Kobe earthquake in Japan cost just over 2 per cent of that country’s GDP, and the bill for the more recent event there in March 2011 is estimated to be between 3 and 5 per cent. The ‘silver lining’, if there is one, was summarised by Roger Sutton, CEO of the Canterbury Earthquake Recovery Authority (CERA): When asked if he was concerned about the earthquakes causing more damage he replied ‘There's not much left to break’.
The costs to businesses and communities are difficult to quantify, but we know they are considerable because much of the ‘soft’ social infrastructure is as badly damaged as the pipes and buildings. Though the final figures are not yet in, as of January 2012, we believe between 10,000 and 12,000 homes in the Red Zones2 will be demolished. Other aspects of daily life, besides housing, have also been significantly affected: schools, churches, community halls, recreation centres, shopping malls, corner shops, restaurants, fast food outlets – many of the everyday sites and activities we take for granted – have closed or relocated. This widespread displacement, relocation and closure has had consequences for the so-called ‘unaffected’ parts of the city: some schools are accommodating two different institutions and doing ‘double shifts’ 8 months later; ‘inner-city’ issues such as weekend drunken revelry and prostitution has shifted to suburban centres; and traffic delays are common. This has profoundly altered residents’ patterns of behaviour and disrupted many of those basic routines that glue everyday life together.
2 The label of the ‘Red Zone’ was originally applied to parts of the CBD that had been cordoned off.
The term is now applied to several suburban areas where the land damage is so extensive, and land remediation so expensive, that rebuilding is not possible in the short-term. In July 2011, residents in these Red Zones were offered a property buy-out package from the central government.
389
The aim of this paper is to highlight how, where and why the social or soft infrastructure of Christchurch has broken along several ‘fault-lines’ which, like our geotechnical fractures, have the potential to cause considerable damage. Indeed, it is claimed that the term ‘natural disaster’ is a misnomer, and that the catastrophe lies in our expectations and social systems - before and after certain events - that make disasters possible or even probable (see, for example, Hinchliffe and Woodward, 2004 on BSE; Clarke, 2008 on Hurricane Katrina). In attempting to highlight the fissures exposed by the earthquakes, I begin with some discussion of three terms crucial to this account - ‘disaster’, ‘community’ and ‘resilience’. For convenience3 I divide my observations of ways in which recovery authorities might help communities build resilience - pre- and post-disaster - so as to facilitate recovery. This is not so much a chronological account as an outline of a complex web of factors that will inevitably play out differently in other contexts.
Communities and disasters
There is considerable debate as to the definition and characteristics of ‘community’ (Chamberlain, Vallance, Perkins, 2010). Increased ‘mobility’, interpreted in a broad sense, challenges the traditional view of communities as geographically-bound entities, connected in and through particular places. It is now common to hear about ‘communities of interest’, ‘professional’ and ‘virtual’ communities, all of which have contributed to claims that ‘geography is dead’. Consequently, there is now considerable debate as to what essential features are required in order for a ‘collective’ to become a ‘community’, though many claim that important ideas include shared values and common goals (Williams and Pocock, 2009); a common sense of identity (Scott and Marshall, 2005); or a web of affect-laden ties and common culture (Etzioni, 1996). Rather than settling on a particular set of features, Thorns (2002) categorised three different uses of the term based on geography, other social systems, and emotional ties. He pointed out that the uses and applications of community are highly variable and the only common factor among them is that they all involve people.
This debate over the meaning of community becomes particularly problematic in the post-disaster context. By definition a disaster contains several elements: a community of interest or social system is affected; it is affected adversely; and the adverse effects must be of a magnitude that compromises functionality (to distinguish meaningfully between ‘disasters’ and ‘inconveniences’). Based on my observations here in Christchurch, this means, in practice, that the glue that bound
3 I am aware that by reinforcing ‘the event’ as the problem, rather than the social structures and
systems that actually create the problems, the labels ‘pre-‘ and ‘post-disaster’ actually undermine my claim that there are no ‘natural catastrophes’.
390
many pre-existing, well-defined communities together suddenly dissolved either temporarily or permanently. Schools closed which cut children off from each other, and made life difficult for working parents who then become isolated from their colleagues; Residents’ Association representatives suddenly left the city making neighbourhoods difficult to access, co-ordinate and communicate with; churches were reduced to rubble leaving the congregation with no-where to meet, and so on. I will return to a more detailed account of this compromise of functionality and its consequences in due course, but for now, it is important to establish a connection between these suddenly ‘inaccessible’ communities and broader recovery processes with particular emphasis on ‘engagement’.
Recovery best-practice consistently advocates for ‘community engagement’ (Kweit and Kweit, 2004; Etye, 2004; Coghlan, 2004; Coles and Buckle, 2004; Waugh and Streib, 2006; Murphy, 2007; Hauser, Sherry and Swartz, 2008; Wilson, 2009; Vallance, 2011; Norman, 2004) with the benefits said to include political stability, identifying workable solutions to the range of problems recovery presents, sharing and delegation of duties, securing community ‘buy-in’ to the process, building trust and promoting a positive and cathartic recovery. It is often assumed in all this that recovery authorities are 1) willing and 2) able to engage communities that are themselves 3) willing and 4) able to be engaged (Vallance, 2011a). Unfortunately, if any one of these four assumptions folds, the recovery process can stall.4 Further, as Olshansky, Johnson and Topping (2006, p. 368-9) noted, community engagement is key but ‘to work most effectively after disasters, community organizations should already be in place and have working relationships with the city [officials]. It is difficult to invent participatory processes in the intensity of a post-disaster situation’. Pre-existing relationships are, therefore, critical to the recovery process. This raises interesting questions about the connections between recovery, resilience and the role of communities.
Communities, disasters and resilience
Resilience is another of those terms capturing a range of definitions and approaches, and is arguably coming to replace ‘sustainability’ as the latest policy buzzword. Nonetheless, it has a long history and has been employed widely in engineering, business administration and organisation behaviour models, civil defence and
4 I would argue that this may be occurring in Christchurch. On the 1st of Feb 2012, roughly a year on, over 4000 people marched on the
civic offices of the Christchurch City Council (CCC) demanding a change of leadership. Across the political spectrum, dissatisfaction with
both the Mayor and CEO is high, and the CCC has been routinely described as ‘dysfunctional’ and ‘bureaucratically buggered’.
Reinvestment in the city has been sluggish, and at three times normal levels, out-migration is high. Various sources, at different times,
estimated the loss to be between 4 and 17 per cent).
391
emergency management (CDEM), social work, and socio-ecological systems (SES). Across this varied literature, ‘resilience’ has three related definitions that reflect these numerous disciplinary ties. The first supposes an ideal ‘steady-state’ or equilibrium to which a system bounces back following a disturbance. The second relates to the extent to which a system is able to self-organise or cope with a disturbance and restore functionality. The third recognises that a system may have multiple ideal states and that being able to bounce back to normal might be less important – or even less desirable - than the ability to adapt and thrive in new conditions (i.e., its ‘adaptive capacity’). The adaptive capacity of a socio-ecological system refers to its ability to cope with change by observing, learning and then modifying the way it interacts with the world, over different geographic and temporal scales (Folke et al., 2002). Manyena, O'Brien, O’Keefe, and Rose (2011) have described this as a system’s ability to ‘bounce forward’. Because this last definition works with imagined futures rather than a return to normal, bouncing forward situates resilience as an expression of the way people expect or want the world to be. Thus, the ability to bounce forward depends as much on our collective capacity for expectative abstract thought, as it does on our technical ability and/or financial resources.
It also depends on what Lorenz (2011) has called participative capacity which speaks to the flow and distribution of power and resources in a social system. It is this participative capacity that allows people’s expectations and their ideas about what ‘recovery’ might mean, to flavour the overall process. Solnit’s (2009) work, for example, suggests that ‘normal’ life is the catastrophe and ‘disaster’ is actually the opportunity to make things better. She writes:
Disaster reveals what the world could be like…It reveals mutual aid as a default operating principle and civil society as something waiting in the wings when it is absent from the stage. A world could be built on this basis, and to so would redress the long divides that produce everyday pain, poverty, and loneliness (p. 313).
This is where those earlier questions around the nature of community, various communities’ roles in recovery, and the quality of community engagement become critical.
In summarising the above, several points deserve to be highlighted. First, the recovery literature acknowledges the importance of community engagement but takes for granted that the post-disaster community landscape will be recognisable. On the contrary, the very nature of ‘disaster’ as involving compromised functionality means that this is probably not the case. The community’s ‘glue’ – whatever that was – has likely eroded. Second, resilience – particularly the ‘thriving’ interpretation – depends on both adaptive capacity (within the community) and participative capacity
392
(engagement and relationship with others).5 This brings us back to the original focus of this paper which was to contribute to a better understanding of hidden social fault-lines, exposed by the earthquake, that may promote community resilience and facilitate recovery or hinder the process.
Methodology
It would be fair to say that the methodology used for this research is rather ‘messy’. This seems an unlikely and unprofessional admission, yet the term messy is the most appropriate given the rapidly changing circumstances associated with disaster recovery, and John Law’s (2004) work where he argues that our research methods actually create rather than reveal ‘reality’. This is true not just of (participant) action research, but also of more ‘natural scientific’ research relying on bioassays and penetrometers. The latter have been used extensively here to help gauge land damage and land stability. Some of these assessments are clearly at odds with those of residents who disagree with the land zoning decisions that penetrometers helped shape. The idea is that our methods, even those so-called ‘objective’ measures are highly political as they shape our social world.
Research philosophy aside, in practical terms, it is acknowledged that qualitative methods are best able to provide rich data that help us understand the ambiguity and temporal liveliness of the social world (Flick, 2006; Babbie, 2010). The rapidly changing landscape of recovery continually affected the types of questions and demanded a fluid and flexible methodology. The actual methods employed for this research included (often participant) observation of numerous public events and meetings, and unstructured interviews with active ‘community’ representatives (loosely defined). These opportunities arose through my on-going involvement with Gap Filler, Greening the Rubble, CanCERN, the Community Forum and the AvON network, all of which emerged in the wake of the quakes. My relationship and familiarity with these groups has allowed me to contextualise their concerns and build a picture that, inevitably, can only be partial, situated and temporary. Thus, rather than trying to establish what exactly happened and predict for others in other places what will happen, my goal here was to contribute to a better understanding of themes (fractures and fault-lines) that seemed to promote community resilience and facilitate or hinder recovery.
Pre-disaster fault-lines
5 Parallel debates occur around the notion of social capital – often described in terms of strong/weak,
vertical/horizontal, or binding, bonding and bracing capitals. See Putnam (1995) or Vallance (2011b) for an overview.
393
Formal structures of governance
As Olshansky, Johnson and Topping (2006) argued, post-disaster recovery is heavily influenced by pre-event patterns of governance, behaviour, social structures, expectations, cultural competencies and so on. The Christchurch case is very interesting as, historically, it had a reputation as ‘the People’s Republic’. Ex-Mayor of Christchurch Vicki Buck popularised this slogan in the 1980s and even had T-shirts printed with these words, presumably to reflect the strong social focus held by the 24 elected Councillors and their leader. The Christchurch City Council (CCC) now has only 12 elected councillors, two from each Ward, and the Mayor. Each ward also has 5 elected Community Board representatives making up the 2nd tier of elected local government. Traditionally, these representatives held some ‘mana’ or standing in their communities, and Community Board members were seen to wield considerable influence both ‘at the coal face’ and within council. Their position today is more ambiguous; some describe the role as ‘token’.
The number of open (to the public) standing council committee meetings exceeded that which we have today, where closed meetings have become the norm. Information flows up and down the council hierarchy have also changed in the last 30 years. The 12 Councillors and ‘lower level staff’ no longer have ready access to certain information and some have been discouraged (or forbidden) from talking to media and academics. In November 2011, Cr Chrissie Williams resigned citing this as one of the reasons for leaving, and in January this year, Cr Sue Wells even asked the government to replace the Council with appointed commissioners because Councillors could no longer do their jobs.6
Further, the old model of community-based teams working together on holistic solutions before advocating to higher levels has been replaced with one where employees report directly and individually to their managers at the civic offices in the central city. Community Board delegations that were extensive have been reduced. As a result of these changes, the Christchurch City Council was described in a report for the Royal Commission as having promoted a ‘corporate’ approach (Richardson, 2008), first under CEO Lesley McTurk, and now under the incumbent CEO, Tony Marryatt.
The pre-existing issues outlined here – the number and type of opportunities for community engagement, information flows, the locus of decision-making, lack of transparency, and the relationship between the different parts of local government – have all come to play an important role post-disaster. Most significantly, the CCC’s 6 http://www.stuff.co.nz/the-press/news/6299843/Council-is-tearing-itself-apart-Sue-Wells
394
“dysfunction” has been a critical factor shaping the role played by the Canterbury Earthquake Recovery Authority. Rather than supporting and enabling the CCC, CERA has essentially taken over many of the Council’s functions and residents are very uncertain as to who is responsible for what. Their dissatisfaction recently came to a head at a protest attended by over 4, 000 people demanding mid-term elections and the CEO, Tony Marryatt’s, resignation. This adds weight to Kweit and Kweit’s (2004) observation that inadequate community engagement can lead to political instability.
Formal and non-formal relationships
‘Collaboration’ is another of those words that acts as a catch-all for a range of activities, including ‘co-production’, ‘co-management’, ‘deliberative democracy’, ‘deep democracy’, ‘collaborative planning’, ‘diffuse’ decision-making and numerous other participatory models. Many of these, including the IAP2,7 Arnstein’s (1969) ‘Ladder of participation’ and Pretty’s ‘Typology of Participation’ (1994; in Kumar, 2002) try to categorise types of citizen or community involvement in formal planning processes from ‘token’ or ‘passive’ informing/consulting, through to more ‘active’ forms based on empowerment and self-mobilisation. This more active or engaged end of the spectrum is particularly useful post-disaster but, as Olshansky, Johnson and Topping (2006) pointed out, it is immensely difficult to build the skills and an appropriate participatory framework for this after the catastrophe has struck. It is therefore important to build collaborative and participatory capacity (Lorenz, 2011) pre-disaster through, for example, shared management of community resources, the development and implementation of small scale projects like community gardens, and so on.
Community development
In Christchurch the CCCs’s ‘community advocates’ have been replaced with ‘strengthening community advisors’ who have slightly different roles and responsibilities. Whatever label one gives to these staff members, certain characteristics of the role are worth enhancing pre-disaster so as to facilitate post-disaster recovery and resilience. These characteristics include being geographically dispersed and located in the community (or suburban centres) rather than a central office. They should be in a position to facilitate holistic responses to social, cultural, economic and environmental issues or take a ‘helicopter view’. This means their coverage may not be much more than 4000 households.8 They should have some
7 http://www.iap2.org/displaycommon.cfm?an=5 8 This figure of 4000 was used by representatives from nearby Waimakariri District Council (WDC)
whose earthquake recovery strategy has been seen as exemplary. A presentation from Sandra James at WDC is available on http://www.lincoln.ac.nz/Services-facilities-and-support/Conference-
395
knowledge of community development techniques, and conflict resolution. These staff members should have a mandate, and necessary support, to liaise with communities as soon as possible after the event (so long as their safety is not compromised). Part of their role should be to gather and transmit information, to identify and support new and established community leaders, and help communities (re)form.
Civil society and the non-governmental sector
Other factors, pre-disaster, that are now shaping the recovery process here in Christchurch include the quality, quality and degree of overlap among different civil society groups and non-governmental organisations. These form social reserves or community ‘spare capacity’ to borrow a term from systems theory. These various formal and informal social networks should be geographically and thematically diverse. As one example of how and why this important, an early supporter of a post-quake civil society organisation - the Canterbury Communities Earthquake Recovery Network (CanCERN)9 – was an employee at the Delta Community Trust, a non-governmental organisation. Delta helped CanCERN become a community by acting as a repository for funding (aid agencies do not like giving money to individuals, even if they are leaders of community recovery initiatives), providing meeting spaces, and general administrative support. In light of this, keeping reasonably up-to-date lists of the various NGOs and CSOs, and supporting their development, is a sensible pre-disaster investment. My view is that some of these existing and emergent groups – such as the student volunteer army10 - filled the gap left by recovery authorities (including the CCC) who were themselves temporarily dysfunctional.11
Funding
The opportunities and regulations around discretionary funding are very important post-disaster. It is recommended that pre-disaster a pool of funding be ready to go at a moment’s notice with good flexibility around the application process, criteria, closing dates and accountability. My observation was that community groups could make small amounts of money go a long way. CanCERN (www.cancern.org.nz),
facilities-and-event-management/Professional-Development-Group/Resilient-Futures/Resilient-futures-conference-recordings/ 9 The author is a CanCERN Board member. 10 Community Board member Sam Johnson quickly mobilised thousands of people – the Volunteer Student Army - to help shovel liquefaction using Facebook and Twitter. The Farmy Army co-ordinated farmers with heavy farm machinery to do the same.
11 The Civic offices were damaged in the earthquake and then off-limits for weeks whilst nearby buildings were demolished. The same thing happened to the Regional Council’s bunker which had consequences for their ability to respond effectively. It is a warning to those who would locate their civil defence headquarters near other hazards; have a Plan B.
396
Gap Filler (www.gapfiller.co.nz), Greening the Rubble (www.greeningtherubble.co.nz) and AvON (www.avonotakaronetwork.co.nz) all started with nothing except goodwill and ideas that resounded with the public imagination, but are now fairly well-recognised actors in the recovery process. Their journey would have been easier and possibly more fruitful with adequate support early on.
It is important to recognise that many of the emergent communities that spring up after a disaster will not have any track record. I would suggest that iterative funding schedules are therefore useful, though other disagree: Evan Smith, formerly from CanCERN, read an early version of this paper and argued that “Short contract periods although being helpful for agility are actually detrimental because they lack security and require a much higher level of reporting and administration”. Overall, he disagreed with the idea of short, iterative funding timeframes, but interviews with recovery authorities revealed practical difficulties around bestowing large sums of money to people with no track record. Funding criteria and reporting must therefore strike a delicate balance between meeting needs for accountability and meeting the needs of the community.
Post-disaster fractures and fault-lines
Leadership # 1 (Central Government)
As much as I would like to think that there are important techniques and strategies associated with disaster recovery (and I will list some of these below), it is clear that leadership and leadership style are fundamental to the recovery process. The very top level of decision-makers (central government) must ensure that the various recovery agencies and authorities are working together as soon as possible. Here, we have witnessed CERA, the CCC, the Earthquake Commission, Fletchers (who won the tender for the rebuild), and various insurance companies all playing important roles but, often, the responsibilities of each are unclear. This leads to unnecessary duplication of effort or, worse, gaps that none of them seem to want to fill.
A related point, though one that is less clear-cut, is relationship between recovery authorities like CERA and central government. CERA is loosely modelled on VBRRA but an important difference is that CERA is not a stand alone agency but newly created government department. This raises interesting questions over the extent to which the Minister is willing and able to be openly critical of his own department, and vice versa.
397
Leadership # 2 (Regional/City/District)
‘Our success will not be measured by the kilometres of pipe and road that we replace, but by how the people come through this’, Jim Palmer, CEO, WDC.
In contrast to the CCC, post-earthquake, the nearby Waimakariri District Council (WDC) quickly established a local ‘hub’ in the worst affected area where residents could access a Support Co-ordinator who knew about the area and understood the various support structures and services available (such as emergency funding for house repairs, etc). WDC also undertook a pastoral care programme which included door knocking, cups of tea and, as some residents were being told their homes were to be demolished, cakes baked by neighbours and nearby residents. ‘Open conversation’, where the bad news is conveyed with support, has characterised WDC’s communication strategy. The framework they used was based on an Asset Based Community Development Programme where the guiding questions included:
What is it you want to RETAIN?
What would you like to REGAIN?
What would you CHANGE/MODIFY?
What doesn’t WORK?
What would you CREATE if we could?12
I have heard many Kaiapoi residents express a degree of gratitude for this, and although there have been problems, by and large, residents in WDC appear satisfied with the overall tone of the recovery there and the efforts of their council.
The CCC, by comparison, is less clearly demonstrating a recovery strategy or, perhaps more accurately, the approach is not one where the residents of the city feel they have priority. In fact, at a Community Forum13 meeting, the CEO of Christchurch City Council Tony Marryatt stated that the focus had been on doing what the government had told them to do which was to repair major infrastructure and develop the Draft Central City Plan. This has resulted in many residents – those with few ties
12 This information is contained in a presentation by Sandra James available on http://www.lincoln.ac.nz/PageFiles/12552/Lincoln-18th-April-2011-Sandra-James.pdf 13 Members of the 40 strong forum were selected from candidates nominated by various Canterbury-based interest groups, and now includes representatives from businesses, Residents Associations, CSOs and NGOs. The author is a member. None of us are sure what the selection criteria were, or what our mandate is.
398
to the CBD and relatively intact infrastructure – feeling left out of the recovery process and has resulted in the protest mentioned earlier.
Leadership #3 Community
I have argued elsewhere (Vallance, 2011b) that, post-earthquake, communities14 in Canterbury had to first become before they could become engaged and indicated an important role for basic community development. Disasters, by definition, compromise functionality of, in this case, communities. Restoring functionality thus involves recognising the altered nature of the community leadership landscape. Helping emerging leaders in their new role becomes critical as they may have little previous experience in leadership roles and may be completely unaware of existing processes, procedures, plans, or policies. They need to be identified and enabled.
Identifying new leaders may be difficult because, as my observations here suggest, they really do build credibility from the ground up rather than ‘shouting from the treetops’. They may not actually see themselves to be ‘leaders’. Nonetheless, they will be the ones who, with no funding to speak of, show initiative and set up meals on wheels for the elderly, organise community meetings to obtain and share information, co-ordinate teams of students to shovel liquefaction, lobby for residents’ rights and needs, develop a local neighbourhood recovery plan, or set up local ‘suicide watches’ on people in the neighbourhood who are not coping...But, if the recovery authority is actively out there liaising with the affected communities in a meaningful way, these new leaders are pretty obvious. Aligning quickly with these new leaders (whilst not ignoring existing structures if they remain intact) is critical.
Once they have been identified, they should be enabled. This can be achieved through various means including adequately funding their position, resourcing (provide rooms, photocopiers, computers, access to legal aid, etc), up-skilling or, importantly, providing information.
Information flows
Johnson (2011) has called information the ‘currency of recovery’ and its value should not be underestimated. In the early response phase residents in badly affected communities were so desperate for information that they would ask the ‘loo man’15 what was going on. Those who have access to reliable information gain real
14 Frankly, the same applies to the recovery authorities themselves. CERA did not even exist this time last year and the EQC went from a small staff of 22 to over 700. It has taken time for these organisations to become functional. 15 ‘Loo men’ dropped off and collected the port-o-loos from areas without sewerage.
399
credibility in the community and this can be a way of endorsing new leaders and promoting participative capacity before formal funding starts flowing.
Information flows should work both ways; it is not always about conveying messages but also about acquiring information. Engaging communities can be seen as a way of gathering relevant and useful data upon which to base important decisions and identify workable solutions to ‘wicked’ problems.16
Engaging communities and working with new and established community leaders gives recovery authorities another option when it comes to delivering ‘bad news’. Complex and/or unwelcome news might best be delivered face-to-face or in a small supportive group. Community leaders are best-placed to identify what will work best. As but one example, the Community Forum asked that difficult or controversial or complex messages not be issued on a Friday because it means residents have to wait the whole weekend for clarification on the finer points.17 If the message should suit the medium, community leaders can help recovery authorities understand what is most appropriate in terms of timing and delivery.
When answers are not known – and this is very common after a disaster - it is tempting to retreat to the safety of the civic offices, however, this can be extremely counter-productive. It is important to remember that residents do not actually expect recovery authorities to know everything immediately. Many would ‘prefer to see time spent making the right decision rather than time wasted fixing the wrong one’ (CanCERN meeting Oct, 2011). However, when answers are not known, an information timeline should be indicated because ‘the only thing worse than not knowing is not knowing when you’ll know’. This has been particularly true for residents here who have waited and waited to find out if there house has been ‘red-zoned’ and are wondering whether or not to buy a new pair of gumboots to cope with the liquefaction, plant out their tomatoes, order firewood for the winter, or enrol their kids at a particular school...The message it not to wait for certainty and glossy pamphlets; indicative timelines at least allow people to get on with a life of sorts; complete information vacuums can drive people to despair.
In early recovery, it can seem as if the only constant is rapid change. Communities and, it must be said, recovery authorities are forming and re-forming after lost 16 See Vallance (2011b) for an example involving the lack of engagement over sewerage and temporary/permanent solutions. 17 CanCERN workers had noted a demonstrable rise in violence and alcohol abuse over weekends if bad news was issued on a Friday.
400
functionality. Roles are still being negotiated and this can make information flows difficult. A helpful technique here in Christchurch was to get a representative from EQC, AMI (the insurer of the largest number of damaged homes, Fletchers (the ‘rebuilding company’) and Tonkin and Taylor (the geotech company) in one place18 for a community meeting with residents who were asked to sit in clusters according to the street in which they lived. A very strong facilitator then went around the room, from street to street as it were, asking residents to voice their concerns. This strategy allowed everyone the opportunity to speak and also provided ‘small’ community issues to be identified. This can be very productive in areas where a sense of community is fairly weak and ‘geographically close’ residents do not even know each other. As one example, once several street residents got to know each other in this forum they realised the geotech assessments were incorrect and were able to ask for a re-evaluation. As another example, it became clear that fixing the sewerage for one household often meant a nasty problem for someone else along the sewerage lateral and they were able to suggest a more co-ordinated approach. Finally, hearing other people’s stories took some residents away from seeing ‘their’ problem in isolation, and allowed them to ‘place’ the earthquake geographically. On a number of levels, this way of organising community meetings can foster the development of holistic solutions to communal problems.
Transitions
Recovery often seems to be construed as a race towards ‘normal’ or ‘better’, as if there were some kind of definitive end point. Conversely, much of the recent ‘normal’ planning literature now speaks of a ‘post-normal’ condition where we should acknowledge the limits of our predictive science and move towards ‘post-positivist’ (see, for example, Allmendinger, 2009) or ‘contingent’ planning models (see, for example, Francois, 2008; de Roo and Silva, 2010; Loorbach, 2010). Though ‘disaster’ presents some challenges for non-disaster planning approaches, some of the lessons from the post-positivist planning literature are both interesting and salient as key features include concepts of complexity and uncertainty. This literature has some very practical implications around process (e.g. Whatmore and Landstrom’s (2011) work on flood apprentices) and content (e.g. Gunder, 2008 and Gunder and Hillier’s (2007) work on ‘hauntology’ and what should be recognised in planning). This literature highlights and challenges some fundamental planning principles, whether recovery-based or not, that assume planning will actually achieve a desired outcome. The idea of a ‘plan’ becomes distinctly ‘fuzzy’ and, as a result, experimenting with new ways of getting things done becomes more important.
18 I believe this was useful for both the residents and recovery agents and authorities, as they each got to hear what the others agencies were actually saying and this helped shape the relationship between them. Unfortunately, CCC representatives were noticeably absent from these meetings.
401
A new way of getting things done in Christchurch emphasises ‘temporary solutions’ and ‘transitional arrangements’. These include temporary ‘emergency repairs’ to homes and businesses; temporary installations, such as those developed by Gap Filler and Greening the Rubble; the ‘transitional city’ outlined in the draft Central City Plan which acknowledges the lengthy timeframes of this recovery; and CERA which has a 5 year life span. Debates about the actual value of ‘temporary’ solutions have framed these activities; is it worth investing in something we know will not endure?
My own view, based on the Christchurch case, is that temporary solutions are immensely valuable because they promote experimentation and innovation; provide opportunities for trial runs; give residents and recovery authorities the opportunity to do something useful; and, importantly, temporary activities help balance the hasty demand for progress with the time needed for careful planning.
To alleviate concerns that the transitional arrangements might become permanent, temporary activities and organisations should have an exit strategy. As one example, Greening the Rubble and Gap Filler both have a strategy (and now a demonstrable history) of leaving a site in as good, or better, condition than they found it, not least because they have a commitment to re-using as much material as they can. This clear exit strategy associated with temporary installations gives site owners confidence in the project management and sites are readily available as a result.
Conversely, CERA which has a legislative 5 year life span is ‘gearing up’ rather than planning their exit, and the roles of CCC and CERA are becoming increasingly blurred. There is a sense, rightly or wrongly, that the CCC is focussing on the CBD (as outlined in the Draft Central City Plan) whilst CERA is responsible for everything else, including the Draft Recovery Strategy for Greater Christchurch. At a practical level there has been some duplication of roles, with one example being CERA’s provision of its own summertime activities programme, which is usually the domain of the CCC. There has also been confusion about the role of the Community Forum, and whether this has replaced the elected Council and Community Board members. Though it is understood that CERA will not endure beyond 2015, they seem to lack an exit strategy that will leave democracy, capacity and capability in Christchurch as it was before the quakes. The lesson here seems to be to make sure temporary recovery agencies add capacity without eroding capability.
Concluding thoughts
402
In this paper I have identified potential ‘fault-lines’ which, like those geotechnical fractures, have the potential to fracture and erode a community’s resilience. I have argued that these ‘fault-lines’ or ‘species of trouble’ (Erikson, 1995) that might hinder recovery include – pre-disaster – formal structures governance; the relationship between formal and informal structures; community development; the role and status of CSEs and NGOs; and the management of emergency funding pools. Post-disaster, potentially difficult areas include leadership at the state, regional/city/district and community levels; information flows or ‘the currency of recovery’; and the value and management of temporary solutions.
The Canterbury earthquakes have –unfortunately - provided an opportunity to examine pre-disaster and post-disaster efforts, by communities and recovery authorities, to promote resilience and recover from disaster. Identifying and addressing, pre-disaster, those areas of weakness may help facilitate recovery.19 On the other hand, if I had to pinpoint one factor that has caused a great deal of trauma post-disaster, it would have to be leadership. Referring back to the introductory sections, I argued that community resilience – in a thriving sense – was a function of both adaptive capacity and participative capacity. Elsewhere I have argued that communities must take some responsibility for becoming a community so as to build participative capacity, and be engaged in recovery processes. Yet, much of the responsibility for participative capacity rests with formally appointed leaders, such as our Minister for Earthquake Recovery Gerry Brownlee, and the Mayors and CEOs of our local authorities. Have they ensured that their models of governance enable and encourage community participation or are they focussing on the pipes and pavements? Ultimately, ‘recovery’ is not something that authorities and agencies simply decide is happening or has happened; recovery is in the eye of the beholder thus it is important to take the community with you.
References
Allmendinger, P. (2009). Planning Theory. New York: Palgrave MacMillan.
Babbie, E. (2010). The Practice of Social Research. Belmont; Wadsworth.
Chamberlain, P., Vallance, S., Perkins, H. and Dupuis, A. (2010). Community commodified: Planning for a sense of community in residential subdivisions. A paper presented at the Australasian Housing Researchers Conference, Auckland, 17-19th November, 2010
19 Ironically we may never know because if we are successful, disasters are averted or the costs reduced!
403
Clarke, L. (2008). Worst-case thinking and official failure in Katrina. In H. Richardson, P. Gordon, and J. Moore (Eds.). Natural Disaster Analysis after Hurricane Katrina: Risk Assessment, Economic Impacts and Social Implications (pp. 84-92). Cheltenham, UK, Edward Elgar.
Coghlan, A. (2004). Recovery management in Australia: A community based approach. In S. Norman (Ed.). Proceedings of the New Zealand Recovery Symposium, 12-13th July, 2004 (pp. 81-91). Napier, New Zealand. Ministry of Civil Defence and Emergency Management.
Coles, E. and Buckle, P. (2004). Developing community resilience as a foundation for effective disaster recovery. Australian Journal of Emergency Management, 19, 6-15.
De Roo, G. and Silva, E. (2010). A Planner’s Encounter with Complexity. Surrey, Burlington: Ashgate Publishing Company.
Etye, A. (2004). Psychosocial aspects of recovery: Practical implications for disaster managers. In S. Norman (Ed.), Proceedings of the New Zealand Recovery Symposium, 12-13th July, 2004 (pp. 135-142). Napier, New Zealand: Ministry of Civil Defence and Emergency Management.
Etzioni, A. (1996). The Responsive Community: A Communitarian Perspective. American Sociological Review, 61(1), 1-11.
Flick, U. (2006). An Introduction to Qualitative Research. London; Sage.
Folke, C., Carpenter, C., Elmqvist, T., Gunderson, L., Holling, C. and Walker, B. (2002). Resilience and sustainable development: Building adaptive capacity in a world of transformations. AMBIO: A Journal of the Human Environment, 31, 437-440.
Francois, C. (2008). Complexity: a challenge to governance. Systems Research and Behavioural Science, 25, pp. 355-357.
Gunder, M. and Hillier, J. (2007). Problematising responsibility in planning theory and practice: On seeing the middle of the string. Progress in Planning, 68, 57-96
Gunder, M. (2011). Ideologies of certainty in a risky world. Planning Theory. 7, 186-206.
Hauser, E., Sherry, E. and Swartz, N. (2008). Risk, preparation and rescue. In H. Richardson, P. Gordon, and J. Moore (Eds.), Natural disaster analysis after Hurricane Katrina: Risk assessment, economic impacts and social implications (pp. 93-120), Cheltenham, UK, Edward Elgar.
Hinchliffe, S. and Woodward, K. (2004). The Natural and the Social: Uncertainty, Risk, Change. London: Routledge
404
Kweit, M. and Kweit, R. (2004). Citizen participation and citizen evaluation in disaster recovery. The American Review of Public Administration, 34, 354-373.
Law, J. (2004). After Method : Mess in Social Science Research. London: Routledge.
Loorbach, D. (2010). Transition management for sustainable development: A prescriptive, complexity-based governance framework. Governance, 23, pp. 161–183.
Lorenz, D. (2011). The diversity of resilience: Contributions from a social science perspective. Natural Hazards, online first, www.springerlink.com/content/jp68pv2185320301/
Manyena, S., O'Brien, G., O'Keefe, P. and Rose, J. (2011). Disaster resilience: A bounce back or bounce forward ability? Local Environment, 16, 417-424.
Murphy, B. (2007). Locating social capital in resilient community-level emergency management. Natural Hazards, 41, 297–315.
Norman, S. (2004). Focus on recovery: A holistic framework. In S. Norman (Ed.), Proceedings of the New Zealand Recovery Symposium, 12-13th July, 2004. Napier, New Zealand. Ministry of Civil Defence and Emergency Management, pp. 31 – 46.
Olshansky, R., Johnson, L., and Topping, K. (2006). Rebuilding communities following disaster: Lessons from Kobe and Los Angeles. Built Environment, 32, 354-375.
Richardson, M. (2008). Setting Community Boards in Context: A Report for the Royal Commission on Auckland Governance. Salt and Light HIS Limited.
Scott, J. and Marshall, G. (Eds.). (2005). Oxford Dictionary of Sociology (3rd ed.). Oxford: Oxford University Press.
Solnit, R. (2009). A Paradise Built in Hell: The Extraordinary Communities that Arise in Disaster. London: Penguin Books.
Thorns, D. C. (2002). The Transformation of Cities: Urban Theory and Urban Life. New York: Palgrave Macmillan.
Vallance, S. (2011a). Early disaster recovery: A Citizens’ Guide. Australasian Journal of Disaster and Trauma Studies, 2011-2.
Vallance, S. (2011b). Community, resilience and recovery: Building or burning bridges? Lincoln Planning Review, 3,1, 4-7.
Waugh, W. and Streib, G. (2006). Collaboration and leadership for effective emergency management. Public Administration Review, 66, 131–140.
405

Whatmore, S. and Landstrom, C. (2011). Flood apprentices; An exercise in making things public. Economy and Society, 40, 582-610.
Wilson, P. (2009). Deliberative Planning for Disaster Recovery: Re-membering New Orleans. Journal of Public Deliberation, 5, 1-25.
Williams, P. and Pocock, B. (2009). Building community for different stages of life: physical and social infrastructure in master planned communities. Community, Work & Family, 13(1), 71-87.
406
Design-led strategies for bushfire preparedness
Yoko Akama, Susan Chaplin, Richard Philips, Keith Toh
Bushfire CRC research team: ‘Effective Communication: Communities and Bushfire’.
RMIT University, Melbourne, Australia
Paper presented at EARTH: FIRE AND RAIN Australian & New Zealand Disaster and Emergency Management Conference Brisbane – 16 – 18, April 2012
407
Design-led strategies for bushfire preparedness
Abstract
To date, both government and fire authorities in Victoria have deployed a variety of
communication messages on bushfire awareness. Yet, distributing information to a
wide audience is not enough to increase people’s preparedness for bushfire. These
forms of communication sustain a transmission process that reinforces the power-
dynamics of control, making audiences passive. It perpetuates the disempowerment
felt by communities who are not engaged in a dialogic process, further broadening
the gap between ‘expert’ fire authorities and ‘non-expert’ community. This paper
presents co-design methods that were used to facilitate a dialogic form of
communication on bushfire preparedness with community members in the Southern
Otways, Victoria. The research engaged a group of 20 residents to facilitate co-
creation and communication of local knowledge of the geographical environment
through visualisation. These methods show potential of bridging relationships
between neighbours and the importance of social interactions that can lead to better
fire preparation.
Keywords: communication, community, design-based methodology, participation,
visualisation
Introduction
Evidence now shows that, despite the effectiveness of distributing information to the broader public, this method alone is not enough to increase people’s preparedness
for bushfire (Robinson 2003). The paper further builds on this evidence to argue that this form of communication-as-transmission process reinforces the power-dynamics that currently exists between the fire authorities and the community. The transmission view of communication considers audiences as passive agents. It is seen as a way to achieve immediate, unimpeded transmission of messages as a form of control of distance and people (Carey 1998). The paper will begin by elaborating on the different frameworks of communication that perpetuates the obstacles in communicating bushfire risk. It then moves to describe the complacency and disempowerment felt by communities, further broadening the gap between ‘expert’ fire authorities, who has knowledge and experience of bushfires, and the community as ‘non-experts’ seen to have little or poor knowledge.
In an attempt to explore and facilitate a dialogic form of communication, a team of researchers undertook investigations in community-level awareness of bushfire risk. This paper draws on one particular case study in the Southern Otways, Victoria, Australia, a regional coastal area that has been identified as high risk and has not seen catastrophic fire since 1939. The research project is a collaborative partnership between design researchers from [Name withheld] University, local community
408
organisations and the Community Fireguard facilitator in the Barwon-Corangamite area. The data was collated during August 2009-February 2010 that included fieldwork, household visits, focus groups and interviews with residents and Fire Chiefs. This was followed by a workshop that engaged 20 residents on strengthening awareness, resilience and preparedness for bushfires. The latter part of the paper describes details of the design-led methods that were trailed during the workshop.
The term ‘design’ in the context of this paper refers to both the tangible materiality
(artefacts) and intangible methods and processes. Design thinking is commonly described as an iterative process that involves re-framing of what we understand the problem to be (Buchanan 1992; Kimbell 2009). Our knowledge changes as we talk to different people and undergo various stages of the research inquiry. Instead of isolating design to one part of a project (ie to produce the final artefact or technical innovation), designers often see their involvement with various aspects of the project as an entire design process (Kimbell 2011). Terms such as ‘co-design’ are often
used to describe processes that help project stakeholders to ‘find solutions for themselves’ (Morelli 2007, pp. 5-6). The role of the designer, then, is to amplify the creativity of other people (Sanders 2007), facilitating through co-creation and to see people as experts of their own experiences and contexts. This role and view was critical to this research where the practitioners brought multiple sets of expertise as communication designers, researchers and educators.
As such, the variety of design-led methods described in this paper includes artefacts and methods. In particular, it will focus on two design methods called Playful Triggers (Akama et al, 2007; Loi 2005) and ‘What if’ scenario cards, which were
used during the workshop in the Southern Otways. These were used to facilitate co-creation and communication of local knowledge of the geographical environment. Through this process, each resident shared their limited knowledge of their neighbours and geographical areas. This in turn opened up assumptions or generalisations, inviting other participants to question what they knew. The process of visualising tacit or informal knowledge made it tangible and concrete. Casual, collective knowledge of others in a bushfire context became substantial, valuable and significant for mitigation and planning. These design methods show the importance of social interactions and demonstrate potential of bridging relationships between neighbours that can lead to better fire preparation.
Defining ‘communication’
The term ‘communication’ is a rich tangle of intellectual and cultural strands that confronts us with a longing for utopia where nothing can be misunderstood (Peters 2000). Communication is both the most intuitively human and every-day mundane processes, as well as being the force that drive political, religious, commercial and personal interactions.
409
The most common definition of ‘communication’ refers to the activity of imparting or
transmitting messages, information, ideas or knowledge. The transmission view of communication dominates in most industrial cultures due to its historical association with the movement of goods, people and the rapid development of transportation. The rise of the mass media between the 19th and 20th centuries, particularly with the invention of the telegraph with its capacity to send electronic messages over long distances, made communications more symbolic rather than physical (Morley 2005). Early models of mass communication emphasised mechanistic processes where explicit units of information were delivered immediately. This was a form of control of distance and people (Carey 1988).
Yet, there is another, ancient concept of communication that is also critical to our understanding. Carey describes the ritual view of communication that is linked to terms such as ‘sharing’, ‘participation’, ‘association’ and ‘fellowship’. It is connected
to an ancient identity and common roots to terms such as ‘commonness’,
‘communion’, ‘community’ and ‘communication’. The connection between
‘communication’ and ‘community’ is significant where communication can be viewed
as the very constitution of a community. The key is to recognise that a community is not an entity that exists, which happens to communicate. Instead, communities are best described as ‘constituted in and through their changing patterns of
communication’ (Morely 2005, p. 50). Seen this way, a ritual view of communication is not the direction and extension of messages in space but it is maintenance of society in time and the representation of shared beliefs.
Communication brings the community into being, rather than provide predefined identities, which is then expressed or represented. It is a symbolic order that manifests an ongoing, fragile social process (Carey 1988). Carey also draws on Dewey’s description of communication as ‘human fellowship’ that produces social bonds. Dewey describes that the things people have in common – aims, beliefs, aspirations, knowledge, like-mindedness – ‘cannot be passed physically from one to
another like bricks; they cannot be shared as persons would share a pie by dividing it into physical pieces … consensus demands communication’ (Dewey in Carey 1988,
p. 22). Through this sharing, entities such as ‘communities of interest’ or
‘communities of practices’ are formed.
The social process of communication is emphasised further by Bush who explains that communication occurs when people complete the messages by ‘bringing their
own expectations and interpretive practices to the exchange’ (2003, p. 26). This
critiques the transmission view of communication as sending and receiving messages in a ‘neutral’ form. Communication, on a social, personal level is a dialogic
process of meaning-making through exchange. The process of meaning-making is a personal act and it can have many variables (Bush 2003; Krippendorff 2006).
There is rich discourse in the fields of design, education, psychology, management, and community development, for example, that describe the limitation to change,
410
growth, learning and sustainable transformation when the context for such development is dominated and enforced by a authorial figure ie, parent-child, teacher-student, manager-employee etc. Further compounding the process of change and transformation is the complexity of social problems, which has been categorised as ‘wicked problems’ (Rittel & Webber, 1973) that defy a standard problem-solving approach in eluding clear problem definition. A ‘wicked problem’ is a
dynamic moving target characterised by interlocking issues, interests and constraints and require constant negotiation and cascading, interconnected interventions that may not solve the problem, although it should reveal more of its nature and scope for more informed intervention. Many scholars (eg. Buchanan 1992) propose the suitability of design to such problems on the basis that design is an iterative process, especially forms of design founded on co-creation where stakeholders have an integral role in managing issues by influencing responses in an ongoing change process (Darwin 2010). A key element of many social initiatives is their bottom-up orientation and collaborative nature in drawing on the local, situated knowledge of people (Parker & Parker 2007).
In the context of community engagement and bushfire preparedness, a ritual view of communication that is dialogic, communal and personal is a critical framework to enable, guide and support capacity-building. Such forms of communication that emphasises human-to-human engagement, interaction and conversation, can allow individuals to ‘make-sense’ of the complex issues and challenges related to
bushfires preparedness in their own words, view and contexts. Scaffolding a ritual view of communication can create and build social bonds where learning and transformation of behaviour can take place among a supportive group, leading to more resilient and sustainable change. These ideas will be further discussed in the paper through the design-led workshops that were conducted. But first, we look at current problems in communicating bushfire risks that have used a transmission view of communication that is hindering some community’s preparedness for bushfire.
Current obstacles in communicating bushfire risk
In Victoria alone, there are approximately 14 authorities and agencies competing for air-time, potentially providing contradictory messages and overloading the public with too much information related to bushfire risks (Fairbrother et al. 2011). For example, many elderly residents from the Yarra Ranges, Victoria, had found the paper-based information of preparedness ‘excessive’ (Yarra Ranges Council 2010), often having
difficulty in interpreting the information and how it might apply to their own situation. Similarly, residents interviewed in the Southern Otways, including staff from the Country Fire Authority (CFA) who provide services to those areas, have also disclosed that the Fire Ready information packs delivered to residents remain sealed in their plastic packs, unopened and unused.
411
It is not just printed materials that are at risk of being ignored or perceived as being ineffective. Interviews with residents in Kilmore-East after 2009 Black Saturday tragedy indicates that there was confusion and lack of trust for websites in triggering or enacting resident’s fire plan (Elliott & McLennan 2011). Only 1% of those
interviewed described fire agency websites as the information source in triggering their bushfire plans. In fact, almost half of the residents interviewed (51%) relied on environmental indications and phone calls from family and friends as cues for enacting their plans. Elliott and McLennan’s study reveals that the slowness of information updates on websites, the ambiguity of information provided and a perceived absence of threat warnings through the official channels of communication were some of the reasons for not relying on the internet for information.
More critical is the unreliability of infrastructure to communicating bushfire preparedness. Even if these messages are updated on the website in a timely way and worded in a manner that is direct and unambiguous, all electronic forms of communication are as reliable as the weakest link. Topography of landscapes makes mobile phone or internet reception inconsistent. If power-lines are exposed, they can become easily damaged and disconnected in extreme heat, wind and fire, as seen during the events of 2009 Black Saturday. A place like the Southern Otways has poor coverage in radio, TV, internet and mobile phone. Many residents voiced their frustration in being unable to depend on the ABC radio for locally specific, timely and relevant news broadcast. Inadequate mobile coverage and poor reception of local radio stations are voiced as being one of the most concerning communication problems occurring in many regional parts of Australia.
These communication and infrastructure obstacles put into question the national telephone-based emergency warning system that is undergoing implementation. Under the ‘Emergency Alert’ system, emergency services will send warning
messages to phones and mobile phones (CFA website 2011). This method is further disadvantaged because the alerts are sent to billing addresses of mobile phones, rather than where the phone is at the time of emergency. Many holiday homeowners might own a property in high bushfire risk areas, whilst having their main resident and postal address elsewhere. Given that the peak bushfire season coincides with the summer holidays, there is grave concern that many holiday homeowners and the tourists who rent from them, will not receive the SMS alerts. Coupling this fact with the accounts from the field reveals that a complete dependency on mass-communication is not fail-safe. The dominant and prevailing mindset towards communication, seen only as a transmission of information, is one of many critical obstacles in re-thinking different ways to communicating risk and preparedness for bushfires.
In conjunction with the distanced, print or technology based forms of mass-communication, the CFA for example, have been conducting Fire Ready presentations during the bushfire season for a number of years. However, even these locally situated, face-to-face communications have its obstacles. We have
412
observed in a number of locations in Victoria and Tasmania that there were mixed views on how the community perceives the role and effectiveness of fire authorities. There are strong emotions held by some members of the community caused by ‘meeting fatigue’ and mistrust that presenters were simply ‘towing the company line’.
The fire authorities’ speakers who undertake community talks are required to adhere
to a management-approved script to avoid any potential litigation (Goodman, Stevens & Rowe 2009), disabling them from offering personal opinions to questions that are locally specific and situated. This impression of impenetrable bureaucracy, so unappealing to the locals, is another reason for their lack of attendance and trust. Residents in the Southern Otways voiced that the presentations were always the same, and they found little value in attending the community meetings. Non-local representatives with little in-depth knowledge of the local area are unable to build the necessary trust with the community or provide information that is relevant to their specific contexts.
Irrespective of clear, accessible information displayed on websites or receiving brochures on household preparation, many residents in the Southern Otways have voiced that these have not led them to be more proactive towards bushfire preparation. This is also evidenced in the hazards field that provision of information is not directly related to the adoption of hazards adjustment (Brenkert-Smith 2010). Similarly, these communication devices, due to the variety in medium, messages, authority, tangibility and durability, are providing a false perception among the community and the fire authorities, that an abundance of communication is taking place between these constituents. This can be critiqued, however, that transmission and distribution of information is taking place, together with perpetual reinforcements of control through such transmissions, reflecting the culture of command and control that has traditionally characterised the emergency services.
It can be argued that the transmission and control of communication diminishes empowerment, participation and capacity-building for change by the community. A stronger belief in the fire agencies’ ability to manage the threat of bushfire reduces
levels of personal bushfire mitigation (Paton 2006). To further evidence this view, we observed complacency for preparedness and dependency on the fire services to ‘tell
them what to do’ in many communities in Victoria (Southern Otways and St Arnaud) and Tasmaina (Derby, Kingborough and Huon Valley). The changing demographic of these areas also compounds issues of dependency and false-expectations. Urban dwellers who are used to service delivery are moving into rural settings where self-reliance and locally-based initiatives become more important. As a result, the influx of newcomers is fragmenting the networks and groups within communities like the Southern Otways.1
1 For example, see Akama and Ivanka (2010) research on the social network analysis conducted in the Southern Otways where they had tried to understand the fragmentation and build connections between neighbours for greater preparedness.
413
There is a danger when this false perception, reinforced by the authority of communication artefacts, replaces the critical human-to-human engagement needed for behaviour change to occur. Informal social processes are also important mechanisms for spreading information, yet its critical role lacks recognition in bushfire communication. Brenkert-Smith’s (2010) research on communities in
Colorado on bushfire mitigation indicate the benefits of bridging relationships between neighbours and the importance of social interactions that can lead to better fire preparation. Knowledgeable neighbours, who share the same risk, can often be more trusted, relied upon and become sources of vital information, than the ‘official’
experts. Her study reveals that many of these permanent residents become interpreters and consolidators of information, tailoring and detailing the information to enable it to become immediately applicable to the neighbouring property and local environment.
Next, we look more closely at the ritual view of communication that was explored in a workshop with residents in the Southern Oways. The dialogic, communal and personal one-to-one interactions between residents were facilitated through a variety of design methods.
Exploring various design ‘scaffolds’
Playful Triggers to visualise ‘community of place’
The term, ‘scaffolding’, is central to the way we undertook participant engagement. It
has origins in education (Wood, Bruner & Ross 1976) and cognitive psychology (Vygotsky 1978). Constructing temporary structures to provide alternative routes to problem solving and to enable cooperative learning with one another supports learning. Reciprocity is also key tenet to scaffolding (Holton & Clarke 2006) and to promote ‘collective generativity’ among ordinary people (Sanders 2002). Participants of the bushfire awareness workshop brought their individual knowledge and expertise to the group activity, effectively facilitating the learning and understanding of the groups’ local environmental conditions and community fabric. The researchers undertook a co-design approach to initiate ‘living’ change processes (Meroni &
Sangiorgi 2011) to facilitate ‘social creativity’ (Fischer 2003) that can generate new
insights. The design methods described here are change-agents to catalyse action and enable people to build their capabilities so they can co-design solutions that address their circumstance, rather than being instructed what to do in a top-down manner.
414
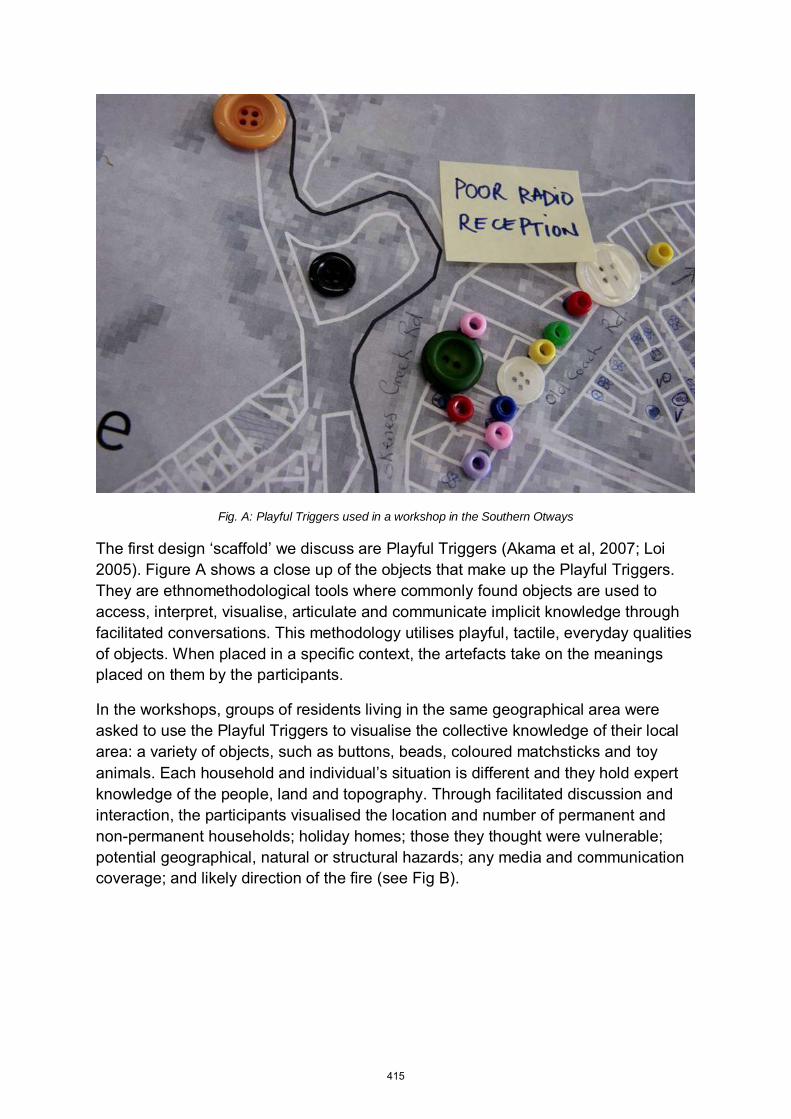
Fig. A: Playful Triggers used in a workshop in the Southern Otways
The first design ‘scaffold’ we discuss are Playful Triggers (Akama et al, 2007; Loi 2005). Figure A shows a close up of the objects that make up the Playful Triggers. They are ethnomethodological tools where commonly found objects are used to access, interpret, visualise, articulate and communicate implicit knowledge through facilitated conversations. This methodology utilises playful, tactile, everyday qualities of objects. When placed in a specific context, the artefacts take on the meanings placed on them by the participants.
In the workshops, groups of residents living in the same geographical area were asked to use the Playful Triggers to visualise the collective knowledge of their local area: a variety of objects, such as buttons, beads, coloured matchsticks and toy animals. Each household and individual’s situation is different and they hold expert
knowledge of the people, land and topography. Through facilitated discussion and interaction, the participants visualised the location and number of permanent and non-permanent households; holiday homes; those they thought were vulnerable; potential geographical, natural or structural hazards; any media and communication coverage; and likely direction of the fire (see Fig B).
415
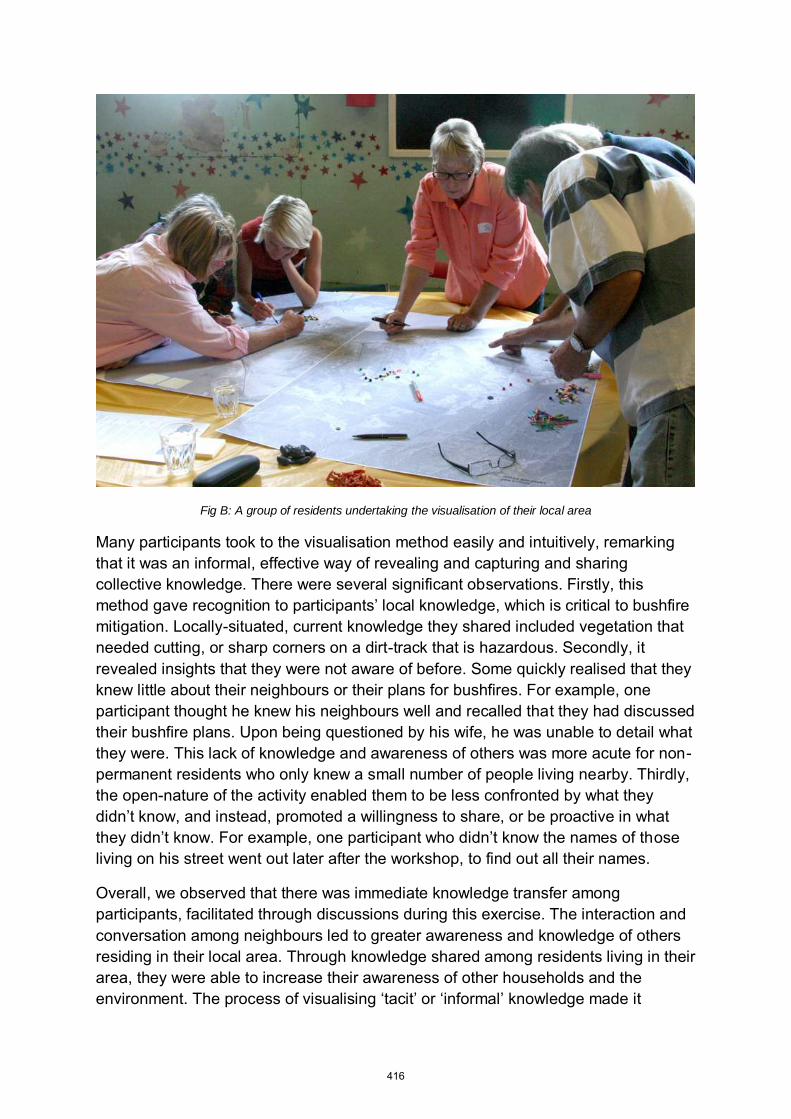
Fig B: A group of residents undertaking the visualisation of their local area
Many participants took to the visualisation method easily and intuitively, remarking that it was an informal, effective way of revealing and capturing and sharing collective knowledge. There were several significant observations. Firstly, this method gave recognition to participants’ local knowledge, which is critical to bushfire
mitigation. Locally-situated, current knowledge they shared included vegetation that needed cutting, or sharp corners on a dirt-track that is hazardous. Secondly, it revealed insights that they were not aware of before. Some quickly realised that they knew little about their neighbours or their plans for bushfires. For example, one participant thought he knew his neighbours well and recalled that they had discussed their bushfire plans. Upon being questioned by his wife, he was unable to detail what they were. This lack of knowledge and awareness of others was more acute for non-permanent residents who only knew a small number of people living nearby. Thirdly, the open-nature of the activity enabled them to be less confronted by what they didn’t know, and instead, promoted a willingness to share, or be proactive in what
they didn’t know. For example, one participant who didn’t know the names of those living on his street went out later after the workshop, to find out all their names.
Overall, we observed that there was immediate knowledge transfer among participants, facilitated through discussions during this exercise. The interaction and conversation among neighbours led to greater awareness and knowledge of others residing in their local area. Through knowledge shared among residents living in their area, they were able to increase their awareness of other households and the environment. The process of visualising ‘tacit’ or ‘informal’ knowledge made it
416
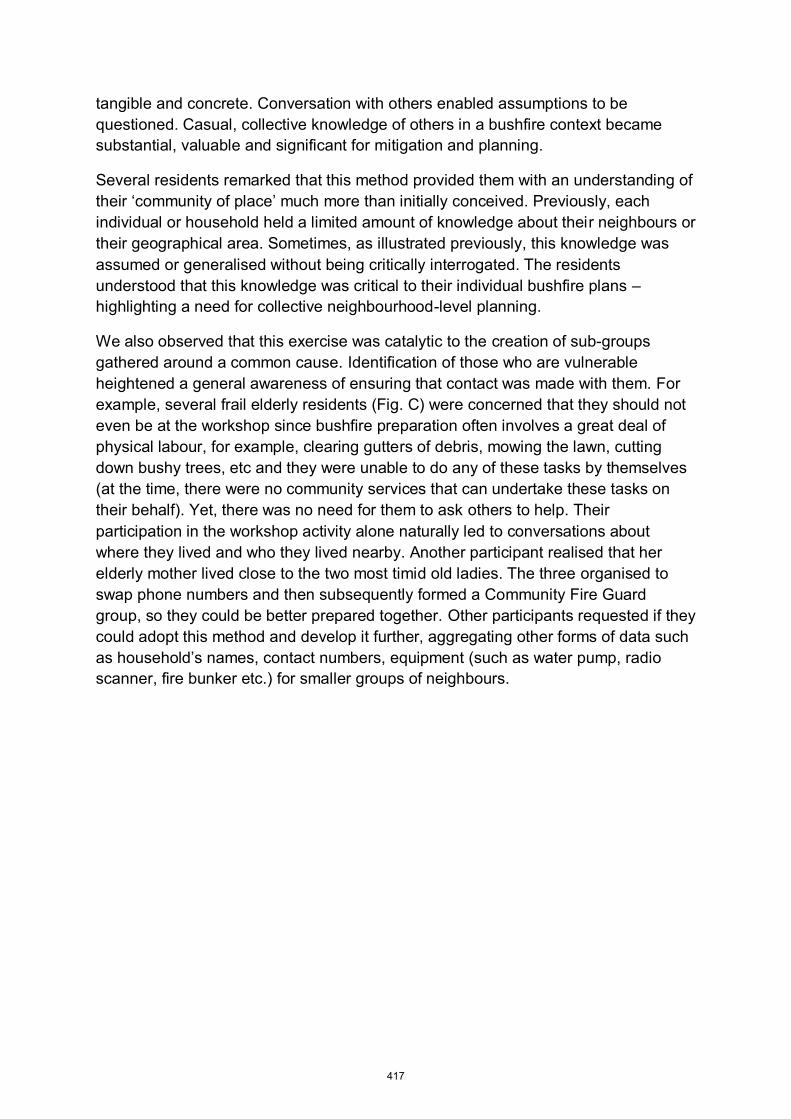
tangible and concrete. Conversation with others enabled assumptions to be questioned. Casual, collective knowledge of others in a bushfire context became substantial, valuable and significant for mitigation and planning.
Several residents remarked that this method provided them with an understanding of their ‘community of place’ much more than initially conceived. Previously, each
individual or household held a limited amount of knowledge about their neighbours or their geographical area. Sometimes, as illustrated previously, this knowledge was assumed or generalised without being critically interrogated. The residents understood that this knowledge was critical to their individual bushfire plans – highlighting a need for collective neighbourhood-level planning.
We also observed that this exercise was catalytic to the creation of sub-groups gathered around a common cause. Identification of those who are vulnerable heightened a general awareness of ensuring that contact was made with them. For example, several frail elderly residents (Fig. C) were concerned that they should not even be at the workshop since bushfire preparation often involves a great deal of physical labour, for example, clearing gutters of debris, mowing the lawn, cutting down bushy trees, etc and they were unable to do any of these tasks by themselves (at the time, there were no community services that can undertake these tasks on their behalf). Yet, there was no need for them to ask others to help. Their participation in the workshop activity alone naturally led to conversations about where they lived and who they lived nearby. Another participant realised that her elderly mother lived close to the two most timid old ladies. The three organised to swap phone numbers and then subsequently formed a Community Fire Guard group, so they could be better prepared together. Other participants requested if they could adopt this method and develop it further, aggregating other forms of data such as household’s names, contact numbers, equipment (such as water pump, radio
scanner, fire bunker etc.) for smaller groups of neighbours.
417
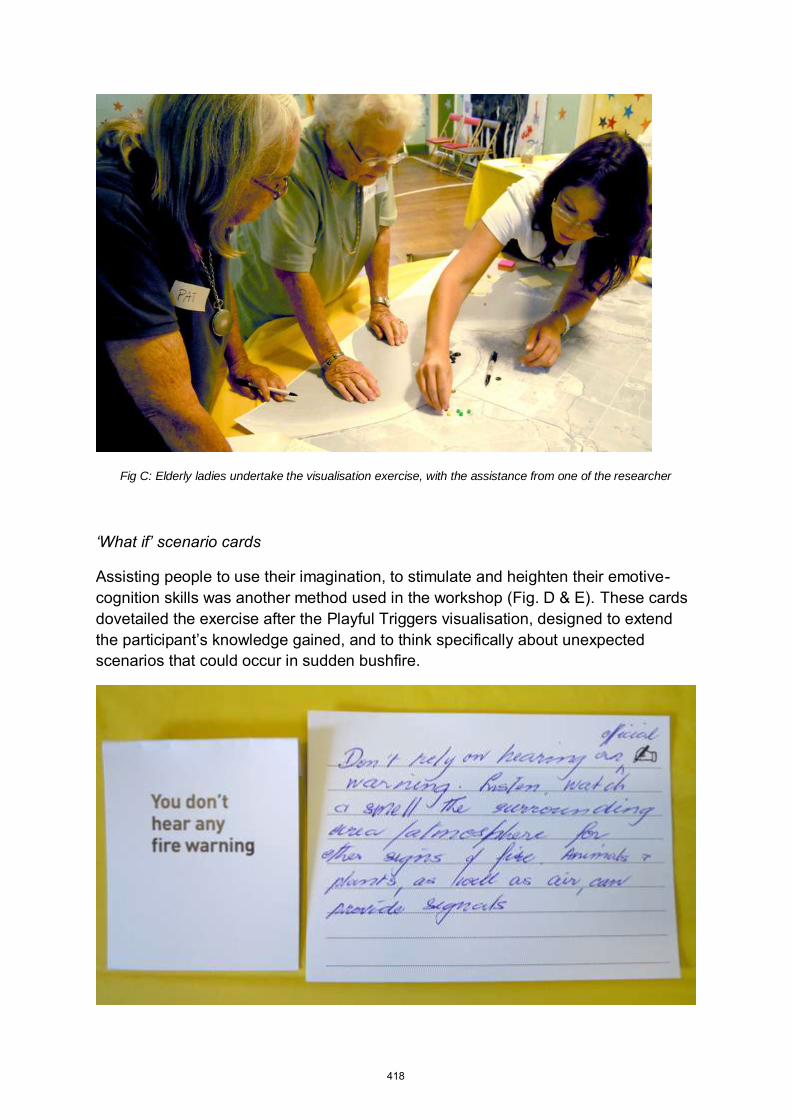
Fig C: Elderly ladies undertake the visualisation exercise, with the assistance from one of the researcher
‘What if’ scenario cards
Assisting people to use their imagination, to stimulate and heighten their emotive-cognition skills was another method used in the workshop (Fig. D & E). These cards dovetailed the exercise after the Playful Triggers visualisation, designed to extend the participant’s knowledge gained, and to think specifically about unexpected
scenarios that could occur in sudden bushfire.
418
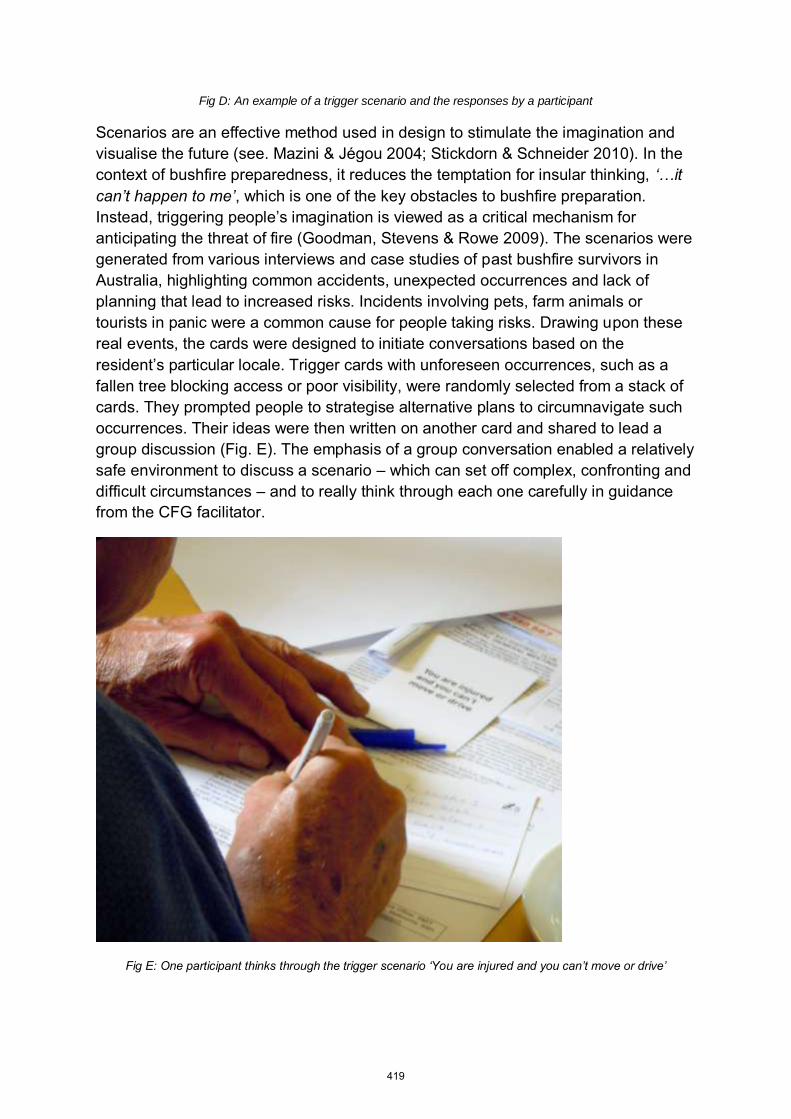
Fig D: An example of a trigger scenario and the responses by a participant
Scenarios are an effective method used in design to stimulate the imagination and visualise the future (see. Mazini & Jégou 2004; Stickdorn & Schneider 2010). In the context of bushfire preparedness, it reduces the temptation for insular thinking, ‘…it
can’t happen to me’, which is one of the key obstacles to bushfire preparation. Instead, triggering people’s imagination is viewed as a critical mechanism for
anticipating the threat of fire (Goodman, Stevens & Rowe 2009). The scenarios were generated from various interviews and case studies of past bushfire survivors in Australia, highlighting common accidents, unexpected occurrences and lack of planning that lead to increased risks. Incidents involving pets, farm animals or tourists in panic were a common cause for people taking risks. Drawing upon these real events, the cards were designed to initiate conversations based on the resident’s particular locale. Trigger cards with unforeseen occurrences, such as a
fallen tree blocking access or poor visibility, were randomly selected from a stack of cards. They prompted people to strategise alternative plans to circumnavigate such occurrences. Their ideas were then written on another card and shared to lead a group discussion (Fig. E). The emphasis of a group conversation enabled a relatively safe environment to discuss a scenario – which can set off complex, confronting and difficult circumstances – and to really think through each one carefully in guidance from the CFG facilitator.
Fig E: One participant thinks through the trigger scenario ‘You are injured and you can’t move or drive’
419
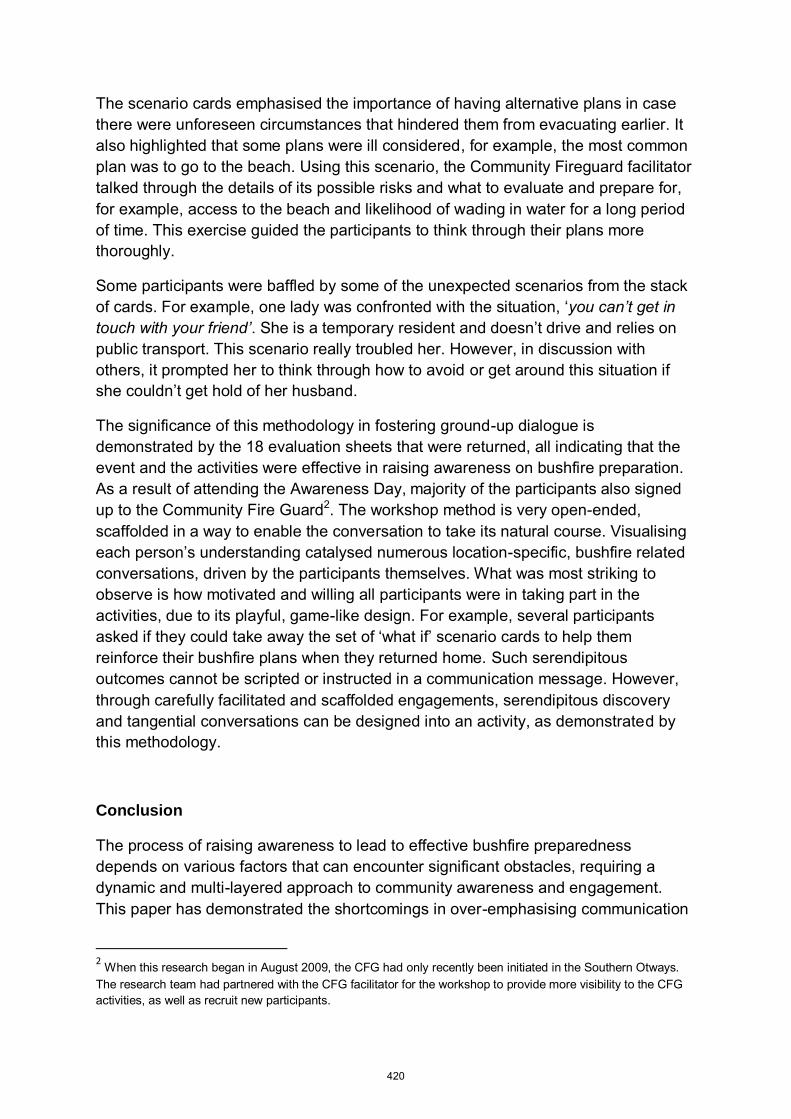
The scenario cards emphasised the importance of having alternative plans in case there were unforeseen circumstances that hindered them from evacuating earlier. It also highlighted that some plans were ill considered, for example, the most common plan was to go to the beach. Using this scenario, the Community Fireguard facilitator talked through the details of its possible risks and what to evaluate and prepare for, for example, access to the beach and likelihood of wading in water for a long period of time. This exercise guided the participants to think through their plans more thoroughly.
Some participants were baffled by some of the unexpected scenarios from the stack of cards. For example, one lady was confronted with the situation, ‘you can’t get in
touch with your friend’. She is a temporary resident and doesn’t drive and relies on
public transport. This scenario really troubled her. However, in discussion with others, it prompted her to think through how to avoid or get around this situation if she couldn’t get hold of her husband.
The significance of this methodology in fostering ground-up dialogue is demonstrated by the 18 evaluation sheets that were returned, all indicating that the event and the activities were effective in raising awareness on bushfire preparation. As a result of attending the Awareness Day, majority of the participants also signed up to the Community Fire Guard2. The workshop method is very open-ended, scaffolded in a way to enable the conversation to take its natural course. Visualising each person’s understanding catalysed numerous location-specific, bushfire related conversations, driven by the participants themselves. What was most striking to observe is how motivated and willing all participants were in taking part in the activities, due to its playful, game-like design. For example, several participants asked if they could take away the set of ‘what if’ scenario cards to help them
reinforce their bushfire plans when they returned home. Such serendipitous outcomes cannot be scripted or instructed in a communication message. However, through carefully facilitated and scaffolded engagements, serendipitous discovery and tangential conversations can be designed into an activity, as demonstrated by this methodology.
Conclusion
The process of raising awareness to lead to effective bushfire preparedness depends on various factors that can encounter significant obstacles, requiring a dynamic and multi-layered approach to community awareness and engagement. This paper has demonstrated the shortcomings in over-emphasising communication
2 When this research began in August 2009, the CFG had only recently been initiated in the Southern Otways. The research team had partnered with the CFG facilitator for the workshop to provide more visibility to the CFG activities, as well as recruit new participants.
420
based on solely transmitting information. Limited understandings of communication are obstacles in achieving behaviour change that is engaging and sustainable. It argued that catalysing behaviour change could only occur when the actors are enacting their self-empowerment. Our exploration of fostering knowledge sharing in a social context through a variety of design methods could be developed further, in parallel with more formal methods initiated by the fire authorities. There is untapped potential at the community level for households to learn from and assist one another. Yet this informal, participatory form of communication lacks stronger recognition by the fire authorities that are more concerned about the danger of promoting misguided information. It is critical to understand that the methods we explored are catalysts to building relationships for communities who, ultimately, have to rely on their shared resources and networks in a catastrophic event like a bushfire. In these dramatic events, communication can catalyse social cohesion and fellowship that become one of the most vital lifelines that residents can depend upon. Our team are continuing discussions with the fire authorities and, in particular with the DSE on their program on ‘fire learning network’ that have fruitful synergies with our
approach3. Other examples include the use of social media technology, like Bushfire Connect (Funnell 2011), which crowd-sources information from the community who become the first responders to a bushfire event. These initiatives show potential for a hands-on, participatory engagement that is promoted and supported by partnerships among bushfire researchers, community organisations and fire authorities.
Acknowledgements
We would like to thank the invaluable input by the residents and fire agency staff in the Southern Otways, St Arnaud, Kinborough, Huon Valley, Scottsdale as well as the co-operation of the Community Fire Guard facilitator in Barwon-Corangamite area, the Southern Otways Landcare Netowrk and Otway Health Community Services. This research has been funded by the School of Media and Communication, Design Research Institute and the Bushfire CRC at RMIT University.
References
Akama, Y., Cooper, R., Vaughan, L., Viller, S., Simpson, M., & Yuille, J. (2007). Show and tell: Accessing and communicating implicit knowledge through artefacts. Artifact, 1(3), 172-181.
3 See the work conducted by Simone Blair, Clair Campbell and Matt Campbell on ‘A case study of a strategic
conversation about fire in Victoria, Australia, 2010, published by the Department of Sustainability and Environment. It gives an excellent account of their processes in facilitating and supporting a ground-up, dialogic conversation on bushfire awareness.
421
Akama, Y., & Ivanka, T. (2010). What community? Facilitating awareness of
‘community’ through Playful Triggers. Paper presented at the The Eleventh
Conference on Participatory Design 2010, Sydney, Australia, Nov 29 – Dec 3, 2010.
Blair, S., Campbell, C., & Campbell, M. (2010). A case study of a strategic
conversation about fire in Victoria, Australia: Department of Sustainability and Environment. Report Number 79)
Brenkert-Smith, H. (2010). Building bridges to fight fire: the role of informal social interactions in six Colorado wildland-urban interface communities. International
Journal of Wildland Fire, 19, 689-697.
Buchanan, R. (1992). Wicked problems in design thinking. Design Issues, 8(2), 5-21.
Bush, A. (2003). Beyond Pro Bono. In S. Heller & V. Vienne (Eds.), Citizen Designer
- Perspectives on Design Responsibility (pp. 25-31). New York: Allworth Press.
Carey, J. (1998). Communication as culture: essays on media and society. London: Routledge.
CFA. (2011). Bushfire alerts and warnings: What to expect and where to find information. CFA website, accessed on 18th Jan 2011 from http://www.cfa.vic.gov.au/warnings-and-incidents/understand-bushfire-warnings.htm
Darwin, T. (2010). From the townhall into the studio: Design, Democracy and Community Resilience. The Journal of Design Strategies, 4(1), 29-33.
Elliott, G., & McLennan, J. (2011). Civilian decision making under stress: use of fire
agency web-sites on Black Saturday, Bushfire CRC, accessed 10th January 2011 from http://www.bushfirecrc.com/resources/poster/civilian-decision-making-under-stress-use-fire-agency-web-sites-black-saturday
Fairbrother, P., Chaplin, S., Philips, R., & Toh, K. (2011). Bushfire Communication Schema - Tracking Variety of Sources, Modes and Audiences. Bushfire CRC: Bushfire CRC.
Fischer, G. (2003). Meta-Design: Beyond User-Centred and Participatory Design. Paper presented at the HCI International, Crete, Greece, June 2003.
Funnell, A. (2011). Emergencies, disasters and the role of digital technology. On
Future Tense: ABC Radio National, broadcasted on 10th November 2011. Accessed
via pod cast on 27th January 2012 at
http://www.abc.net.au/radionational/programs/futuretense/emergencies-disasters-
and-the-role-of-digital/3652170
Goodman, H., Stevens, K., and Rowe, C. (2009) Mt Bold Case Study: Bushfire CRC / RMIT University.
422
Holton, D., & Clarke, D. (2006). Scaffolding and metacognition. International Journal
of Mathematical Education in Science and Technology, 37, 137-143.
Kimbell, L. (2009). Beyond design thinking: Design-as-practice and designs-in-
practice. Paper presented at the CRESC Conference.
Kimbell, L. (2011). Designing for services as one way of designing services. International Journal of Design, 5(2), 1-12.
Krippendorff, K. (2006). The Semantic Turn: A New Foundation for Design. Boca Raton: Taylor & Francis.
Morelli, N. (2007). "Social Innovation and New Industrial Contexts: Can Designers "Industrialize" Socially Responsible Solutions?" Design Issues 23(4): 3-21.
Loi, D. (2005). The Book of Probes. Lavoretti Per Bimbi: Playful Triggers as key to
foster collaborative practices and workspaces where people learn, Wonder and play. RMIT University, Melbourne.
Manzini, E., & Jegou, F. (2004). Sustainable Everyday: Scenarios of Urban Life. Retrieved 27 October, 2007, from http://sustainable-everyday.net/scenarios/?page_id=28
Meroni, A., & Sangiorgi, D. (2011). Design for services. Farnham, England: Gower.
Morley, D (2005), ‘ Communication’ in Bennett T., Grossberg L., Morris M., eds.,
New Keywords: A Revised Vocabulary of Culture and Society, Oxford, Blackwell, pp.47-50.
Parker, S., & Parker, S. (2007). Unlocking innovation. Why citizens hold the key to
public servcie reform. London: Demos.
Paton, D., Kelly, G., Burgelt, P., & Doherty, M. (2006). Preparing for bushfires: understanding intentions. Disaster Prevention and Management, 15(4), 566-575.
Peters, J. D. (2000). Introduction: The problem of communication. In J. D. Peters (Ed.), Speaking into the Air: A history of the idea of communication (pp. 1-10). Chicago: University of Chicago Press.
Robinson, L. (2003). Education for resilience: Community safety communication for natural hazards, accessed 8th August 2009, from http://www.enablingchange.com.au/Resilience_and_risk.pdf
Rittel, H.W.J. and Webber M.M. (1973). Dilemmas in a general theory of planning. Policy Sciences, 4(2):155-169.
Sanders, E. B. (2002). Scaffolds for Experiencing in the New Design Space. Information Design, pp. 1-6.
423
Sanders, E. (2007). Design Research: From Market-Driven Era to User-centred innovation. Retrieved 25th October, 2007, from http://www.masternewmedia.org/interface_and_navigation_design/design-research/state-of-design-research-from-market-driven-era-to-user-centered-innovation-MakeTools-Liz-Sanders-20071019.htm
Strickdorn, M., & Schneider, J. (2010). This is service design thinking. Amsterdam: BIS Publishers.
Wood, D., Bruner, J., & Ross, G. (1976). The Role of Tutoring in Problem Solving. Journal of Child Psychology and Psychiatry, 17, 89-100.
Vygotsky, L.S. (1978) In: Cole, M., John-Steiner, V., Scribner S. and Souberman, E. (eds) Mind in Society: the Development of Higher Psychological Processes. Harvard University Press, Cambridge, MA.
Yarra Ranges Council (2010) “I Fought Two Wars, I Can Fight This: Bushfire
awareness and preparedness of frail older and vulnerable residents in Yarra
Ranges, Project Report, Yarra Ranges Council, Lilydale, accessed 22nd January 2011, from www.yarraranges.vic.gov.au
424
ISBN: 978-0-9808147-4-3Publisher DetailsPublisher AST Management Pty LtdContact Cathryn GertzosAddress PO Box 29, Nerang QLD 4211Telephone +61 7 5502 2068Fax +61 7 5527 3298Email: [email protected]


![Earth Wind & Fire Medley [Lowden]](https://img.pdfslide.us/doc/110x75/563db91a550346aa9a9a0806/earth-wind-fire-medley-lowden.jpg)