Embed Size (px)
Citation preview
Earth Exploration Toolbook
Exploring Seafloor Topology ChapterPilot Study, Corvallis High School, May 2008
Conducted by Michelle Kinzel1 and Brian Wake
2
1) Oregon State University, Department of Geosciences2) Corvallis High School Science Department
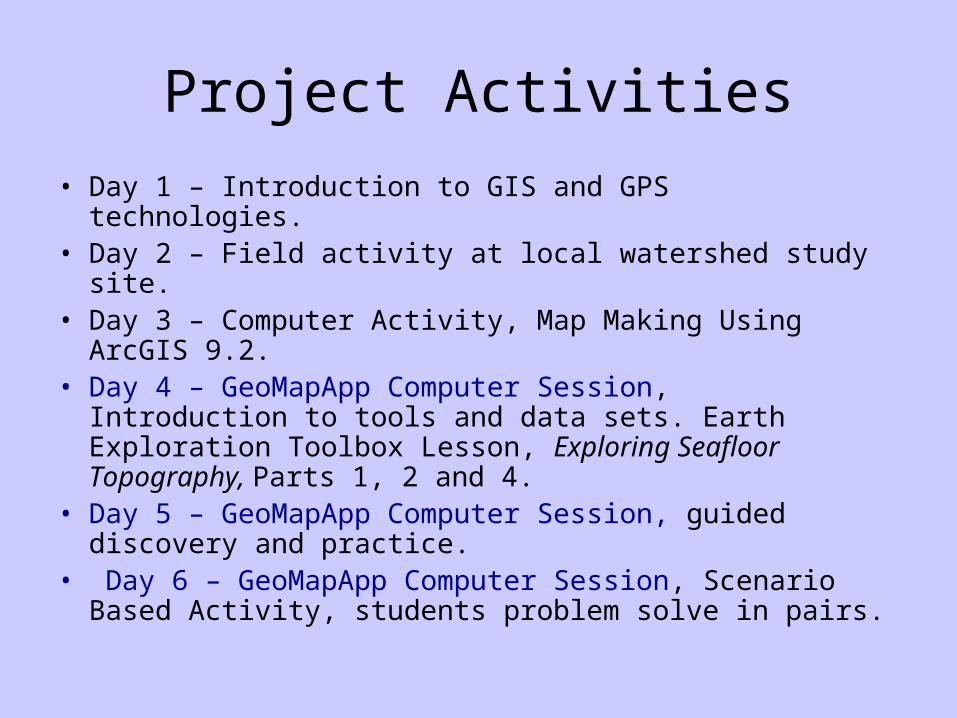
Project Activities
• Day 1 – Introduction to GIS and GPS technologies. • Day 2 – Field activity at local watershed study site. • Day 3 – Computer Activity, Map Making Using ArcGIS
9.2. • Day 4 – GeoMapApp Computer Session, Introduction to
tools and data sets. Earth Exploration Toolbox Lesson, Exploring Seafloor Topography, Parts 1, 2 and 4.
• Day 5 – GeoMapApp Computer Session, guided discovery and practice.
• Day 6 – GeoMapApp Computer Session, Scenario Based Activity, students problem solve in pairs.
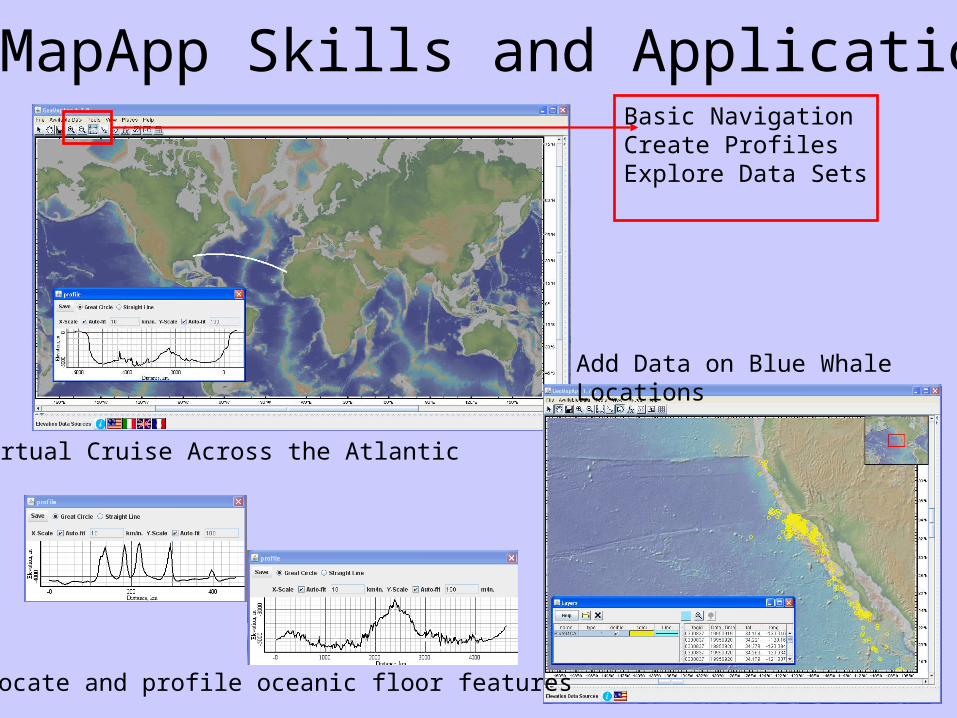
GeoMapApp Skills and Applications
Virtual Cruise Across the Atlantic
Add Data on Blue Whale Locations
Basic NavigationCreate ProfilesExplore Data Sets
Locate and profile oceanic floor features
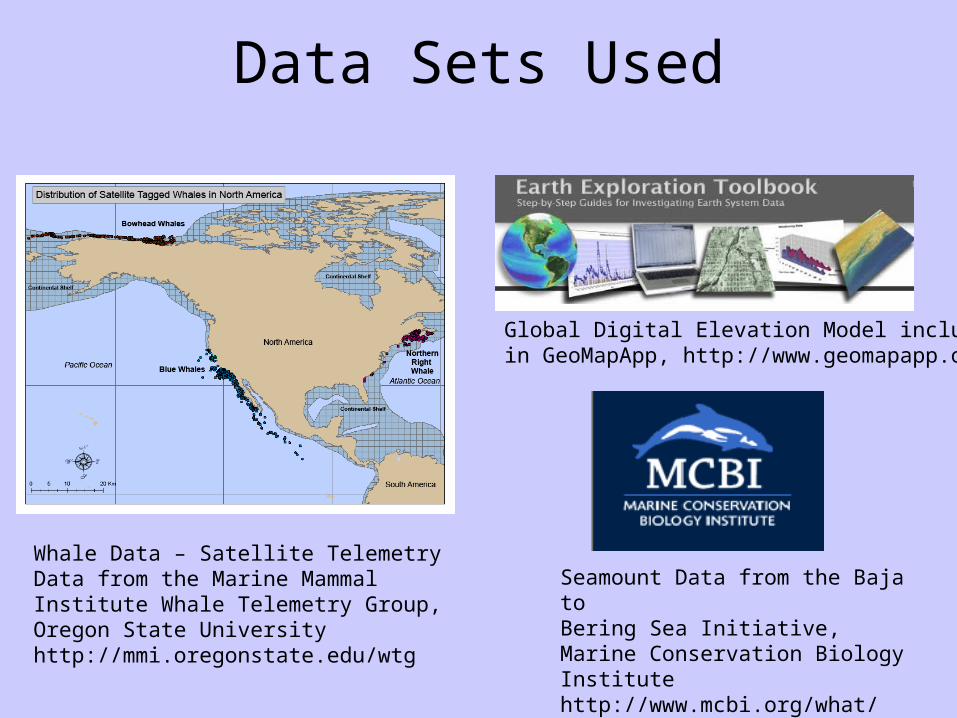
Data Sets Used
Whale Data – Satellite Telemetry Data from the Marine Mammal Institute Whale Telemetry Group, Oregon State Universityhttp://mmi.oregonstate.edu/wtg
Seamount Data from the Baja to Bering Sea Initiative, Marine Conservation Biology Institutehttp://www.mcbi.org/what/b2bcd.htm
Global Digital Elevation Model included in GeoMapApp, http://www.geomapapp.org/
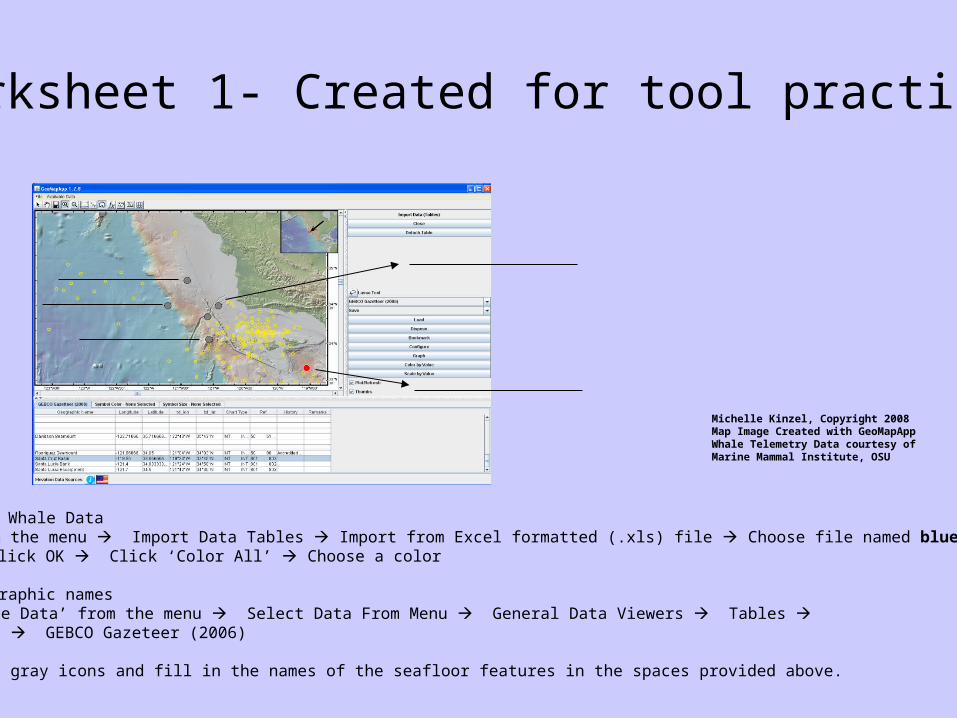
1. Add the Blue Whale DataChoose File from the menu Import Data Tables Import from Excel formatted (.xls) file Choose file named blue95CA.xlsClick Open Click OK Click ‘Color All’ Choose a color
2. Add the geographic namesChoose ‘Available Data’ from the menu Select Data From Menu General Data Viewers Tables Geographic Names GEBCO Gazeteer (2006)
3. Click on the gray icons and fill in the names of the seafloor features in the spaces provided above.
Michelle Kinzel, Copyright 2008Map Image Created with GeoMapAppWhale Telemetry Data courtesy of Marine Mammal Institute, OSU
Worksheet 1- Created for tool practice
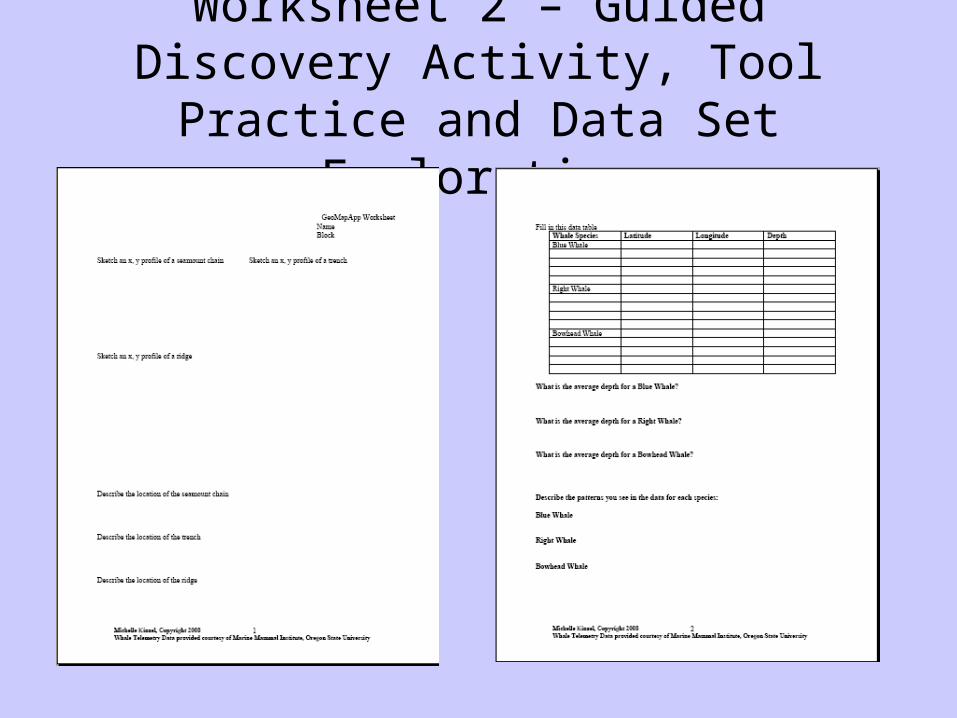
Worksheet 2 – Guided Discovery Activity, Tool Practice and Data Set
Exploration
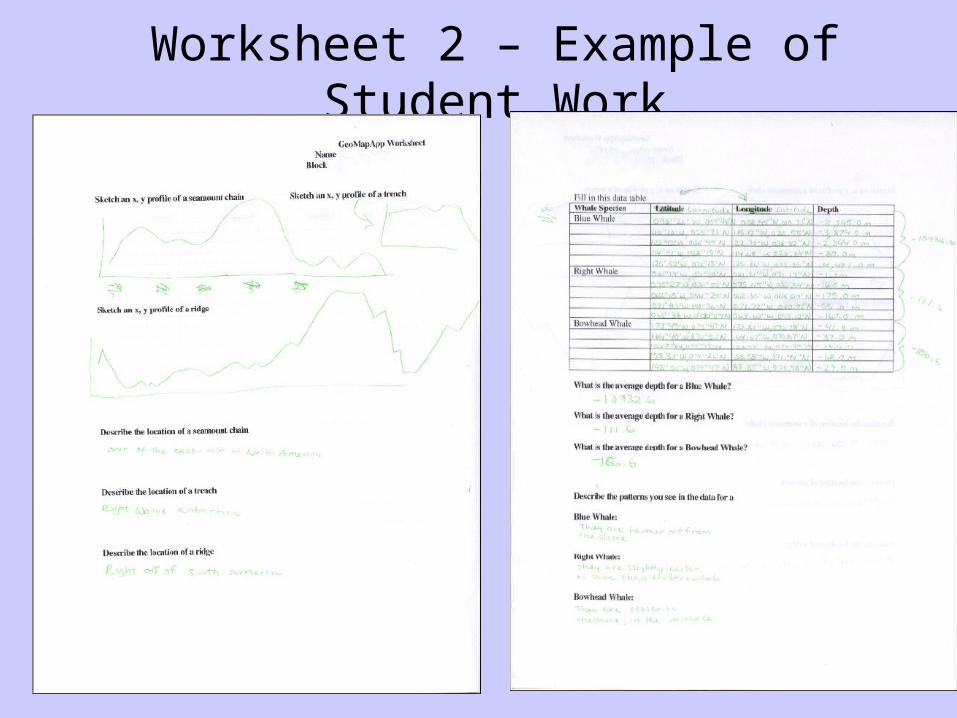
Worksheet 2 – Example of Student Work
Scenario
• Presented students with an open ended scenario to encourage use of tools and exploration of data set.
• Students worked in pairs to encourage time for discussion, reflection and dialogue.
Scenario: You are a marine mammal biologist working for the National Marine Fisheries Service. You have been asked to prepare a report about the migrations and movements of blue whales along the Pacific Coast of North America. You must give information about the locations of the whales and the seamounts they might be feeding on.
As part of your report, please propose an area in Canada, United States and Mexico for a Marine Reserve. You can propose a marine reserve area no greater than 250,000 square km. You reserves in Mexico and the United States should include at least one seamount.
Once you have chosen your reserve, estimate and report the depth, distance from shore and slope of the seamounts inside the reserve.
Draw your reserve on the map titled ‘Pacific Coastal Seamounts’
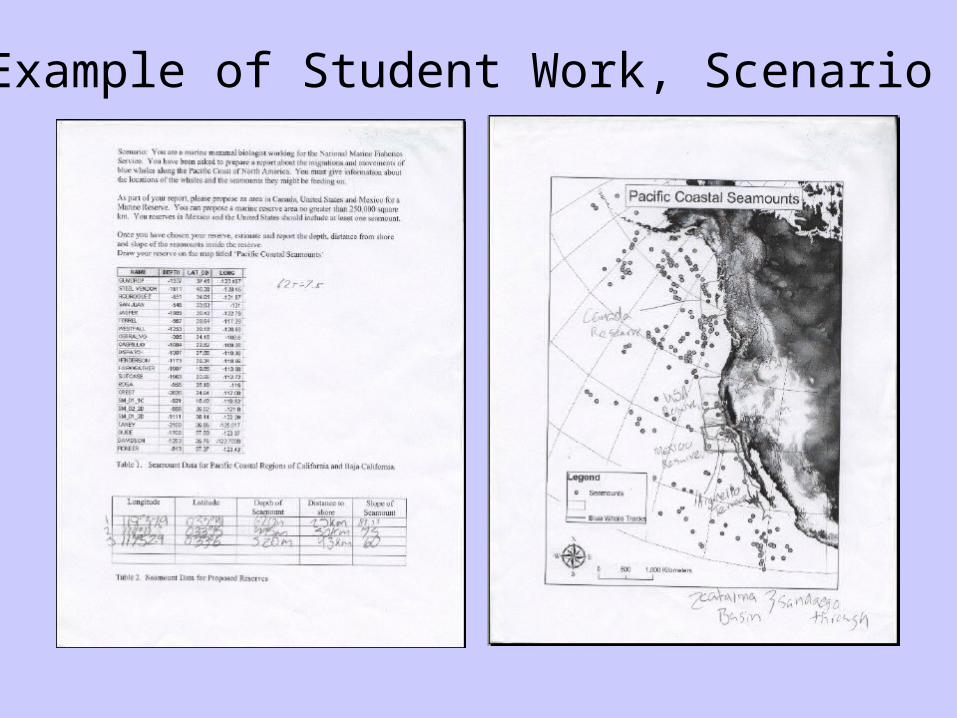
Example of Student Work, Scenario