Embed Size (px)
Citation preview

Earth and Planetary Science Letters 374 (2013) 227–238
Contents lists available at SciVerse ScienceDirect
Earth and Planetary Science Letters
0012-82http://d
n CorrP.O. Box
E-m
journal homepage: www.elsevier.com/locate/epsl
A middle Miocene relative paleointensity record fromthe Equatorial Pacific
Christian Ohneiser a,n, Gary Acton b, James E.T. Channell c,Gary S. Wilson a,d, Yuhji Yamamoto e, Toshi Yamazaki f
a Department of Geology, University of Otago, P.O. Box 56, Dunedin, New Zealandb Department of Geology, University of California – Davis, One Shields Avenue, Davis, CA 95616, USAc Department of Geological Sciences, University of Florida, P.O. Box 112120, Gainesville, FL 32611-2120, USAd Department of Marine Science, University of Otago, P.O. Box 56, Dunedin, New Zealande Center for Advanced Marine Core Research, Kochi University, B200 Monode, Nankoku, Kochi 783-8502, Japanf Geological Survey of Japan, AIST Atmosphere and Ocean Research Institute, University of Tokyo Kashiwa 277-8564, Japan
a r t i c l e i n f o
Article history:Received 10 August 2012Received in revised form23 April 2013Accepted 24 April 2013
Editor: J. Lynch-Stieglitzfrom 85 to 74.87 m, is interpreted as the later part of Chron C6n (18.614–19.599 Ma). Thirty-three other
Available online 1 July 2013
Keywords:Exp 320U1336magnetostratigraphyRPImiddle-MioceneGPTS
1X/$ - see front matter & 2013 Elsevier B.V. Ax.doi.org/10.1016/j.epsl.2013.04.038
esponding author at: Department of Geology,56, Dunedin, New Zealand.ail address: [email protected] (C.
a b s t r a c t
We present a high-resolution magnetostratigraphy and relative paleointensity (RPI) record derived fromthe upper 85 m of IODP Site U1336, an Equatorial Pacific early to middle Miocene succession recoveredduring Expedition 320/321. The magnetostratigraphy is well resolved with reversals typically located towithin a few centimeters resulting in a well-constrained age model. The lowest normal polarity interval,
magnetozones occur from 74.87 to 0.85 m, which are interpreted to represent the continuous sequenceof chrons onset of Chron C5Er (18.748 Ma) to the end of Chron C5An.1n (12.014 Ma). We identify threeputative previously-unrecognized subchrons within Chron C5Cn.1n, Chron 5Bn.1r, and C5ABn. Sedimen-tation rates vary from about 7 to 15 m/Myr with a mean of about 10 m/Myr. We observe rapid, apparentchanges in the sedimentation rate at geomagnetic reversals between ∼16 and 19 Ma that indicate acalibration error in geomagnetic polarity timescale (ATNTS2004). The remanence is carried mainly bynon-interacting particles of fine-grained magnetite, which have FORC distributions characteristic ofbiogenic magnetite. Given the relative homogeneity of the remanence carriers throughout the 85-m-thick succession and the fidelity with which the remanence is recorded, we have constructed a relativepaleointensity (RPI) record that provides new insights into middle Miocene geomagnetic field behavior.The RPI record indicates a gradual decline in field strength between 18.5 Ma and 14.5 Ma, and indicatesno discernible link between RPI and either chron duration or polarity state.
& 2013 Elsevier B.V. All rights reserved.
1. Introduction
Integrated Ocean Drilling Program (IODP) Site U1336 (lat5118.735′N, long 126117.002′W, Fig. 1) was drilled in April 2009in a water depth of 4327 m as one site in the IODP Expedition 320/321 Pacific Equatorial Age Transect (PEAT) (Pälike et al., 2009,2012). The aim of Expedition 320/321 was to recover a compositeCenozoic succession from the paleoequatorial Pacific sedimentbulge (e.g., Lyle, 2003). Drilling at Site U1336 recovered a ∼300 mthick early Oligocene to middle Miocene succession of pelagicsediments—a time when Antarctica was thought to have sup-ported smaller, more dynamic ice sheets than today (e.g., Florindo
ll rights reserved.
University of Otago,
Ohneiser).
et al., 2005), the Carbon Compensation Depth (CCD) was deep(e.g., Lyle, 2003) and the deep sea benthic oxygen isotope recordindicates relatively heavy oxygen isotope values (e.g., Zachos et al.,2001a, 2001b; Pälike et al., 2006).
In this paper we present the magnetostratigraphy from SiteU1336 which is a key chronological dataset underpinning thecorrelation of individual PEAT drill sites, separated by up to2800 km, that target different intervals between the Eoceneand Pleistocene. Shipboard paleomagnetic analyses revealed thatdiagenetic alteration below ∼85 m at Site U1336 has completelyremoved remanence carriers from the sediments (Pälike et al.,2009). However, the upper ∼85 m from Holes U1336A and U1336Bcontain a stable magnetization that spans the early to middleMiocene period (∼19–13 Ma).
Studies by Lanci et al. (2004), from the nearby ODP Site 1218(∼780 km WNW of U1336, Fig. 1), resulted in a well-constrainedmagnetostratigraphy from post-cruise u-channel analyses. Initial

Fig. 1. Location map showing Site U1336, and other IODP Expedition 320/321drill sites.
C. Ohneiser et al. / Earth and Planetary Science Letters 374 (2013) 227–238228
age models from Site U1336 indicated that sedimentation rateswere five times greater during the early–middle Miocene at thissite thereby warranting further study using continuous u-channelsamples. The recovery of this pristine record, with a relatively highsedimentation rate, also provided a unique opportunity to inves-tigate the evolution of the early to middle Miocene geomagneticfield.
The geomagnetic polarity timescale (GPTS, ATNTS2004, Lourenset al., 2004) provides a reference template and absolute ages forglobally synchronous geomagnetic reversals that have becomecentral to the construction of geologic timescales. Stratigraphiccorrelation within polarity zones requires interpolation or extra-polation between/from recorded reversals although in the last∼20 yr relative paleointensity (RPI) records that track the relativestrength of the geomagnetic field have been used for long-distancecorrelation (e.g. Stoner et al., 1995). Efforts to stack globallydistributed RPI records have resulted in reference records for thelast 3 Myr that can be used as a dating tool (e.g. Guyodo and Valet,1999; Yamazaki and Oda, 2005; Channell et al., 2009; Ziegler et al.,2011). RPI reference records from periods older than 3 Ma are scarcebecause of a paucity of successions with well-resolved RPI records,which are not biased by perturbations in sedimentation rate and/orsediment character. High quality RPI records from older periods aresorely needed so that age models can be more precisely constructedfor successions throughout the Cenozoic.
2. Methods
Site U1336 was recovered using the Advanced Piston Corer (APC)to a depth of 184.8 m below seafloor. In all cases, when we discussdepths within drill cores, these are based on the core compositedepth below seafloor (CCSF) as reported in the initial reportsvolume (Pälike et al., 2009). The entire succession presented here(0–85 m) was cored using a non-magnetic cutting shoe and corebarrels, that minimize unwanted magnetic overprinting of thesediments. The APC, when combined with non-magnetic coringtools, is unique in its ability to sample unconsolidated sedimentswith minimal physical and magnetic disturbance resulting in high-quality cores with which to study the evolution of the geomagneticfield and develop magnetostratigraphies.
Site U1336 cores were demagnetized in fields of 20 mT duringExpedition 320/321 as part of the initial core characterization andage model construction effort (Pälike et al., 2009). U-channelsampling of Site U1336 was conducted at the IODP Core Repositoryat Texas A&M University, where we collected a continuous,
composite ∼85 m u-channel record (from 0 to 85 m), from holesU1336A and U1336B. The u-channel samples were shipped to theOtago Paleomagnetic Research Facility (OPRF) at the University ofOtago, Dunedin, New Zealand.
Magnetic moment measurements of u-channels were made at1 cm intervals using a 2G Enterprises DC 760.5, pass-throughsuperconducting rock magnetometer housed in a magneticallyshielded room at the OPRF. U-channel were demagnetized at 5 mTincrements in fields between 20 mT and 50 mT, then at 60 mT,70 mT and finally at 100 mT using the in-line AF demagnetizationcoils of the 2G magnetometer. After AF demagnetization ananhysteretic remanent magnetization (ARM) was imparted usinga DC bias field of 39.79 A/m (0.05 mT) in alternating fields of100 mT with a tray speed of 8 cm/s. A tray speed of 8 cm/s (theslowest possible on the 2G magnetometer) was chosen afterBrachfeld et al. (2004) demonstrated that samples do not acquirethe full DC bias field to saturation with the default tray speed of30 cm/s. A faulty calibration of the DC bias field associated withthe ARM unit allowed a weak DC field to be imparted on eightu-channels during NRM demagnetization. The weak DC fieldresulted in negatively inclined demagnetization vectors, whichdid not trend to the origin of orthogonal component vector plotsand therefore resulted in high MAD estimates. ARM acquisitionand demagnetization was carried out after recalibration of theARM unit, and ARMs were demagnetized in AF peak fieldsincreasing in 10 mT steps between 20 mT and 60 mT. Magneticsusceptibility was measured on each u-channel at 2 cm intervalsusing a narrow aperture (24 mm diameter) Bartington suscept-ibility loop fitted to the Geotek multisensor core logger.
Thermomagnetic, first order reversals curves (FORCs), hyster-esis and isothermal remanent magnetization (IRM) analyses wereconducted on selected samples to determine the magnetic miner-alogy. Thermomagnetic curves were generated at the OPRF usingan AGICO MFK-1CS Kappabridge. Samples (0.25 cm3) were heatedto temperatures of 700 1C in air. Some samples were heated in anargon atmosphere to prevent oxidation, but this was unsuccessfulprobably because of clays dehydrating during heating. Hysteresis,IRM, and FORC (Pike et al., 1999; Roberts et al., 2000) measure-ments were made on 0.15–0.1 g crushed samples at the IstitutoNazionale di Geofisica e Vulcanologia (INGV), Rome, Italy, using aPrinceton Measurements Corporation Vibrating Sample Magnet-ometer (VSM, MicroMag 2900). Two FORCs were measured foreach sample analyzed: an initial low resolution FORC with a fieldspacing of 2 mT, an interaction field (Hu) ranging from −60 to+60 mT, and coercivity field (Hc) ranging from 0 to 100 mT. Asecond high resolution FORC, designed specifically to identifybiogenic magnetite, was measured with a field spacing of 0.8 mT,Hu between −15 and +15 mT, and Hc between 0 and 100 mT. Todefine better the biogenic magnetite peak an additional higherresolution measurement was made on sample U1336B-5H-6A80 cm with a very fine field spacing of 0.4 mT. FORC data wereprocessed using the FORCinel software package of Harrisonand Feinberg (2008). A smoothing factor (SF) of between 5 and 8(Roberts et al., 2000) was applied to data depending on themagnetic concentration and hence noise level.
Spectral analyses of the ARM and RPI data were performedusing the DOS based SPECTRUM software of Schulz and Stattegger(1997) where smoothing was done using weighted overlappedsegment averaging (WOSA) with a 50% overlapping window and aHanning taper to define spectral peaks. In all spectral analyses, weuse an Oversampling Factor (OFAC) of 4, a highest frequency factor(HIFAC) 1, and a level of significance (λ) of 0.05.
Demagnetization data were plotted on orthogonal vector com-ponent plots using the PuffinPlot software package (Lurcock andWilson, 2012). Equal area stereoplots and intensity decay curveswere also used to help determine the demagnetization behavior

C. Ohneiser et al. / Earth and Planetary Science Letters 374 (2013) 227–238 229
and polarities of each sample. Polarity determinations of the primarydepositional remanent magnetizations (DRM) were obtained fromprincipal component analyses (PCA, Kirschvink, 1980) of the 20–50 mT peak field interval comprising seven demagnetization stepswhere ∼80% of the magnetization was lost. PCAs were anchored tothe origin of orthogonal vector component plots in all cases exceptwhere a DC field was inadvertently imparted on sediments resultingin offset vectors and a free fit for PCAs (see Section 4). Our RPI recordwas constructed using the slope of the best fit line between NRM andthe ARM demagnetization data as described by Channell et al. (2002)and implemented in the UPmag software by Xuan and Channell(2009). We also use the traditional NRM/ARM normalizer to fill gapsin our record (e.g., Tauxe, 1993). Data are available at PANGAEA—Network for Geological and Environmental Data (www.pangaea.de)http://doi.pangaea.de/10.1594/PANGAEA.810526.
Fig. 2. Natural remanent magnetization (NRM) intensity (after 20 mT demagnetization)(MS) from Site U1336. The ARM and MS data reveal conspicuous cycles, which are pacedis a magnetite grain-size proxy that indicates uniform down-core magnetic grain size e
3. Magnetic mineralogy and NRM, ARM, and MS
3.1. NRM, ARM and MS variations
Down core NRM, ARM and MS variations are shown in Fig. 2.Shipboard measurements revealed an average NRM of ∼1�10−3 A/mwhere the variability reflects not only variations in the primary DRMbut also variations in overprints, which the sediment acquired afterdeposition and during or since coring of sediments. Demagnetizationof sediments at the OPRF resulted in an average remaining magneti-zation of ∼1.2�10−4 A/m after the 20 mT demagnetization step. ARMsimparted at the OPRF resulted in magnetizations of ∼5�10−2 A/m andMSmeasurements, which more or less mirrored ARM variations, wereon average 8.5�10−5 (SI). Conspicuous cycles are present in both theMS and ARM data but less apparent in the NRM data. MS variations
, anhysteretic remanent magnetization (ARM), and volume magnetic susceptibilitywith eccentricity (see Fig. 7). Susceptibility of ARM divided by susceptibility (kARM/kxcept in the upper 7 m).

C. Ohneiser et al. / Earth and Planetary Science Letters 374 (2013) 227–238230
reflect changes in the concentration of magnetite in these sediments,and ARM variations largely reflect changes in the concentration offine-grained magnetite grains when magnetite is the dominantmagnetic mineral. Overall, ARM and NRM intensity does not vary bymore than an order of magnitude, which is generally considered anacceptable range for accurate RPI determinations (Tauxe, 1993).
3.2. Magnetic mineralogy
The demagnetization behavior of Site U1336 u-channels (Fig. 3)indicates that ∼80% of the original NRM is lost at peak AF fields of
Fig. 3. Demagnetization behavior of Site U1336 from selected intervals. Demagnetizationsingle magnetization component, albeit weakly magnetized, that was 80% demagnetizadditional high coercivity component is present that was not fully demagnetized (see t
60 mT, indicating that low coercivity magnetic minerals are thedominant carriers of NRM. Hysteresis and IRM analyses (Fig. 4)indicate the presence of low-coercivity magnetic minerals. TheDay plot (Day et al., 1977; Dunlop, 2002a, 2002b; Fig. 4) indicateshysteresis ratios consistent with pseudo-single domain (PSD)magnetite or mixtures of PSD and single domain (SD). Themagnetite grain size proxy, kARM/k (Fig. 2), the ratio of thesusceptibility of ARM (ARM intensity divided by the bias field) tomagnetic susceptibility, indicates low values and minimal varia-tion below ∼7 m (∼12.7 Ma) indicating minimal changes in mag-netic grain-size down core. Above ∼7 m greater kARM/k variability
was effective at removing any viscous overprints by the 20 mT step and revealed aed by the 60 mT peak field step. In some intervals (e.g. 75.83 m and 22.83 m) anext for explanation).

Fig. 4. (a) and (b) Thermomagnetic, (c) hysteresis, (d) isothermal remanent magnetization (IRM), and (f)–(i) FORC analyses of selected samples from Site U1336. (e) The Dayplot (Day et al., 1977; Dunlop, 2002a, 2002b) indicates pseudo-single domain (PSD) magnetite or mixtures of PSD and single domain (SD). Thermomagnetic analyses indicateCurie temperatures of ∼580 1C, which are consistent with magnetite.
C. Ohneiser et al. / Earth and Planetary Science Letters 374 (2013) 227–238 231
(including negative values) coincide with higher density sedi-ments, which may be caused by variable carbonate content asthe drill site descended below the CCD at ∼12 Ma (Pälike et al.,2009, 2012). The abrupt increase of the kARM/k ratio at the base ofthe succession (below 85 m) coincides with the first evidence ofdissolution diagenesis, which prevented a further study of oldersediments. Thermomagnetic analyses (Fig. 4) indicate Curie tem-peratures of ∼580 1C, which are consistent with magnetite andagree with IRM and hysteresis data (Fig. 4).
FORC analyses of 28 samples distributed throughout the corewere used to define the magnetic mineralogy and revealed thatsediments from the upper 85 m are dominated by non-interacting,single domain grains of (likely biogenic) magnetite. Furthermore,the FORC diagrams mimic those of the Lake Ely sediments, whichhave a magnetization carried by isolated or intact chains of magneto-fossils composed of biogenic magnetite (Egli et al., 2010). Biogenicmagnetite is produced by magnetotactic bacteria, which are prokar-yotic organisms that live near the sediment water interface andbiomineralize magnetite (and occasionally greigite under anoxic,diagenetic conditions) in a thin cellular membrane (e.g., Bazylinskiet al., 1995; Bazylinski and Frankel, 2004). Biogenic magnetite istypically very pure Fe304 (no cation substitution) with a near perfectSD grain-size and crystal structure, the ideal magnetic grain forcarrying a DRM in sediments. The very narrow central ridge of theFORC (Fig. 4i) with its uniformwidth along its entire length indicatesthat magnetostatic interactions are very weak (Egli et al., 2010). Thelow average Median Destructive Field (MDF) of ARM of only 26.5 mT
along the entire studied section indicates the dominance of moder-ately soft magnetite; furthermore, the interaction (or bias) width forthe main FORC distribution at half its peak value is proportional tothe measurement increment as noted for the Lake Ely sediments(Egli et al., 2010). Such behavior could, of course, be representative ofisolated SD and small PSD magnetite grains of any origin, includingpossibly eolian material. The similarity of the FORCs to the FORCsassociated with biogenic magnetite implies that the primary rema-nence carrier is biogenic magnetite, as concluded by Channell et al.(2013) at nearby IODP Sites U1334 and U1335.
4. Magnetostratigraphy and paleomagnetic age model
Fig. 5 shows the component declination from Holes U1336Aand U1336B, the resulting stacked declination and inclination forSite U1336, virtual geomagnetic poles (VGPs), and median angulardeviation (MAD) associated with the component calculation.Paleomagnetic inclination is close to zero as expected becausethe site is located close to the paleoequator where the timeaveraged geomagnetic field is essentially horizontal and not usefulfor assigning polarity zones. Declination was, therefore, the onlymeans by which to construct the magnetostratigraphy. Unfortu-nately, the cores were not azimuthally oriented because ofproblems with the orienting tool. We therefore developed amagnetostratigraphy for Site U1336 by mapping paleomagneticreversals for each core, paying particular attention to the

Fig. 5. (a) Reoriented declination from Holes U1336A (gray) and U1336B (black), (b) virtual geomagnetic dipole (VGP) calculated from the reoriented declination stack,(c) MAD estimates from PCA calculations, (d) stacked inclination and declination, and correlation with the GPTS (e) where black intervals indicate normal polarity and whiteintervals indicate reversed polarity. (f) Key nannofossil FADs and LADs are also shown which help constrain the correlation. At the base of the U1336, faint shallow, negativeand positive inclination alternations (e.g. the C5En–C5Er–C6n reversals pattern) help confirm the correlation with the GPTS. Subchrons not found in the standard GPTS areindicated by “?”. Shaded intervals indicate where a weak ARM was unintentionally imparted on the sediments during demagnetization (see text for discussion).
C. Ohneiser et al. / Earth and Planetary Science Letters 374 (2013) 227–238232
overlapping segments between cores from Holes U1336A and B. Bycoring and stratigraphically correlating multiple holes, then spli-cing the recovered material into one composite stratigraphicsection, as was done during Expedition 320 (Pälike et al., 2009),a continuous record of declination could subsequently be obtained.One needs only to correlate the resulting ∼1801 alternation indeclination to the geomagnetic polarity timescale (GPTS), whichcan be facilitated with biostratigraphic information. Our correlationwith the geomagnetic polarity time scale (GPTS, ATNTS2004,Lourens et al., 2004), was guided by first and last appearancedatums (FAD and LAD, respectively) of microfossils in core catchersamples as reported in the initial reports volume (Pälike et al.,2009). By utilizing the overlap of cores between Holes U1336A andU1336B, a composite declination stack was constructed where onlyone, unique polarity pattern was possible, which could, in turn, be
confidently correlated with the GPTS. Individual cores were thenreoriented back into approximate geographic coordinates moreaccurately by subtracting the mean declination from each observeddeclination resulting in normal polarity intervals with ∼01 declina-tion and reversed polarity intervals with ∼1801 declination. This isonly an approximate return to geographic coordinates because thePacific Plate has moved relative to the spin axis over the past20 Myr but only by an amount that would cause the meandeclination to deviate from 01 by at most about 151 (Acton andGordon, 1994; Horner-Johnson and Gordon, 2010).
Low MAD values typically less than 101 (Fig. 5) indicate thehigh quality of the demagnetization data. Discrete intervals withhigh (above 151) MAD values (Fig. 5) occur at geomagneticreversals and in thin intervals with poor demagnetization behavioror are attributed to a faulty calibration of the ARM unit where
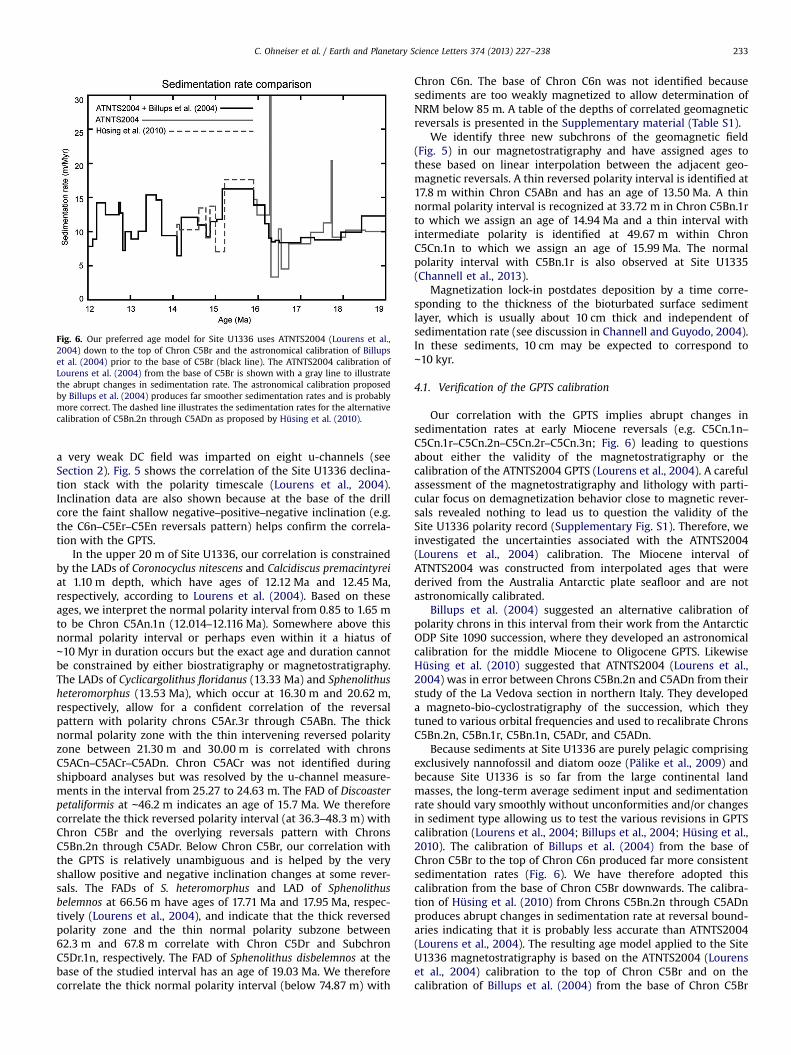
Fig. 6. Our preferred age model for Site U1336 uses ATNTS2004 (Lourens et al.,2004) down to the top of Chron C5Br and the astronomical calibration of Billupset al. (2004) prior to the base of C5Br (black line). The ATNTS2004 calibration ofLourens et al. (2004) from the base of C5Br is shown with a gray line to illustratethe abrupt changes in sedimentation rate. The astronomical calibration proposedby Billups et al. (2004) produces far smoother sedimentation rates and is probablymore correct. The dashed line illustrates the sedimentation rates for the alternativecalibration of C5Bn.2n through C5ADn as proposed by Hüsing et al. (2010).
C. Ohneiser et al. / Earth and Planetary Science Letters 374 (2013) 227–238 233
a very weak DC field was imparted on eight u-channels (seeSection 2). Fig. 5 shows the correlation of the Site U1336 declina-tion stack with the polarity timescale (Lourens et al., 2004).Inclination data are also shown because at the base of the drillcore the faint shallow negative–positive–negative inclination (e.g.the C6n–C5Er–C5En reversals pattern) helps confirm the correla-tion with the GPTS.
In the upper 20 m of Site U1336, our correlation is constrainedby the LADs of Coronocyclus nitescens and Calcidiscus premacintyreiat 1.10 m depth, which have ages of 12.12 Ma and 12.45 Ma,respectively, according to Lourens et al. (2004). Based on theseages, we interpret the normal polarity interval from 0.85 to 1.65 mto be Chron C5An.1n (12.014–12.116 Ma). Somewhere above thisnormal polarity interval or perhaps even within it a hiatus of∼10 Myr in duration occurs but the exact age and duration cannotbe constrained by either biostratigraphy or magnetostratigraphy.The LADs of Cyclicargolithus floridanus (13.33 Ma) and Sphenolithusheteromorphus (13.53 Ma), which occur at 16.30 m and 20.62 m,respectively, allow for a confident correlation of the reversalpattern with polarity chrons C5Ar.3r through C5ABn. The thicknormal polarity zone with the thin intervening reversed polarityzone between 21.30 m and 30.00 m is correlated with chronsC5ACn–C5ACr–C5ADn. Chron C5ACr was not identified duringshipboard analyses but was resolved by the u-channel measure-ments in the interval from 25.27 to 24.63 m. The FAD of Discoasterpetaliformis at ∼46.2 m indicates an age of 15.7 Ma. We thereforecorrelate the thick reversed polarity interval (at 36.3–48.3 m) withChron C5Br and the overlying reversals pattern with ChronsC5Bn.2n through C5ADr. Below Chron C5Br, our correlation withthe GPTS is relatively unambiguous and is helped by the veryshallow positive and negative inclination changes at some rever-sals. The FADs of S. heteromorphus and LAD of Sphenolithusbelemnos at 66.56 m have ages of 17.71 Ma and 17.95 Ma, respec-tively (Lourens et al., 2004), and indicate that the thick reversedpolarity zone and the thin normal polarity subzone between62.3 m and 67.8 m correlate with Chron C5Dr and SubchronC5Dr.1n, respectively. The FAD of Sphenolithus disbelemnos at thebase of the studied interval has an age of 19.03 Ma. We thereforecorrelate the thick normal polarity interval (below 74.87 m) with
Chron C6n. The base of Chron C6n was not identified becausesediments are too weakly magnetized to allow determination ofNRM below 85 m. A table of the depths of correlated geomagneticreversals is presented in the Supplementary material (Table S1).
We identify three new subchrons of the geomagnetic field(Fig. 5) in our magnetostratigraphy and have assigned ages tothese based on linear interpolation between the adjacent geo-magnetic reversals. A thin reversed polarity interval is identified at17.8 m within Chron C5ABn and has an age of 13.50 Ma. A thinnormal polarity interval is recognized at 33.72 m in Chron C5Bn.1rto which we assign an age of 14.94 Ma and a thin interval withintermediate polarity is identified at 49.67 m within ChronC5Cn.1n to which we assign an age of 15.99 Ma. The normalpolarity interval with C5Bn.1r is also observed at Site U1335(Channell et al., 2013).
Magnetization lock-in postdates deposition by a time corre-sponding to the thickness of the bioturbated surface sedimentlayer, which is usually about 10 cm thick and independent ofsedimentation rate (see discussion in Channell and Guyodo, 2004).In these sediments, 10 cm may be expected to correspond to∼10 kyr.
4.1. Verification of the GPTS calibration
Our correlation with the GPTS implies abrupt changes insedimentation rates at early Miocene reversals (e.g. C5Cn.1n–C5Cn.1r–C5Cn.2n–C5Cn.2r–C5Cn.3n; Fig. 6) leading to questionsabout either the validity of the magnetostratigraphy or thecalibration of the ATNTS2004 GPTS (Lourens et al., 2004). A carefulassessment of the magnetostratigraphy and lithology with parti-cular focus on demagnetization behavior close to magnetic rever-sals revealed nothing to lead us to question the validity of theSite U1336 polarity record (Supplementary Fig. S1). Therefore, weinvestigated the uncertainties associated with the ATNTS2004(Lourens et al., 2004) calibration. The Miocene interval ofATNTS2004 was constructed from interpolated ages that werederived from the Australia Antarctic plate seafloor and are notastronomically calibrated.
Billups et al. (2004) suggested an alternative calibration ofpolarity chrons in this interval from their work from the AntarcticODP Site 1090 succession, where they developed an astronomicalcalibration for the middle Miocene to Oligocene GPTS. LikewiseHüsing et al. (2010) suggested that ATNTS2004 (Lourens et al.,2004) was in error between Chrons C5Bn.2n and C5ADn from theirstudy of the La Vedova section in northern Italy. They developeda magneto-bio-cyclostratigraphy of the succession, which theytuned to various orbital frequencies and used to recalibrate ChronsC5Bn.2n, C5Bn.1r, C5Bn.1n, C5ADr, and C5ADn.
Because sediments at Site U1336 are purely pelagic comprisingexclusively nannofossil and diatom ooze (Pälike et al., 2009) andbecause Site U1336 is so far from the large continental landmasses, the long-term average sediment input and sedimentationrate should vary smoothly without unconformities and/or changesin sediment type allowing us to test the various revisions in GPTScalibration (Lourens et al., 2004; Billups et al., 2004; Hüsing et al.,2010). The calibration of Billups et al. (2004) from the base ofChron C5Br to the top of Chron C6n produced far more consistentsedimentation rates (Fig. 6). We have therefore adopted thiscalibration from the base of Chron C5Br downwards. The calibra-tion of Hüsing et al. (2010) from Chrons C5Bn.2n through C5ADnproduces abrupt changes in sedimentation rate at reversal bound-aries indicating that it is probably less accurate than ATNTS2004(Lourens et al., 2004). The resulting age model applied to the SiteU1336 magnetostratigraphy is based on the ATNTS2004 (Lourenset al., 2004) calibration to the top of Chron C5Br and on thecalibration of Billups et al. (2004) from the base of Chron C5Br

C. Ohneiser et al. / Earth and Planetary Science Letters 374 (2013) 227–238234
down-section. A similar conclusion regarding issues with theATNTS2004 timescale in this interval has been drawn byChannell et al. (2013) based on the magnetic stratigraphy at sitesU1334 and U1335. As synchronous sedimentation rate changes areunlikely to have occurred at three sites in the Equatorial Pacific(Sites U1334, U1335, and U1336) and in the South Atlantic (ODPSite 1090), it is very likely that ATNTS2004 needs adjustment.
Chron C5Dr.1n is recognized in the U1336 magnetostratigraphyas well as at Sites U1334 and U1335 (Channell et al., 2013), whichallows us to improve the calibration for this short polarity interval.Lourens et al. (2004) assigned an age of 17.400 Ma for boththe upper and lower ages, and Channell et al. (2003) assigned17.501 Ma and 17.556 Ma as the upper and lower ages, respec-tively, from studies of ODP Site 1090. At Site U1336, C5Dr.1n isbetter defined than at ODP Site 1090 allowing us to improve thecalibration by linear interpolation between the top and bottom ofchron C5Dr. Our resulting preferred upper and lower ages forC5Dr.1n are 17.560 Ma and 17.617 Ma, respectively, implying aduration of 57 kyr.
Fig. 7. Spectral power of anhysteretic remanent magnetization (ARM) and relativepaleointensity (RPI) data from 15 Ma to 16 Ma. Spectral analysis of ARM dataillustrates the strong eccentricity cycles are well above the white noise level andanalysis of RPI data for the same interval indicates that the any cyclic componentsare below the white noise level, and not statistically significant.
5. Relative paleointensity (RPI) record
The NRM intensity of a sedimentary DRM depends on theconcentration, type and grain-size of magnetic minerals, and onthe strength of the Earth's magnetic field. If the NRM is carried by SDor PSD magnetite and can be normalized for changes in concentra-tion of remanence carrying grains, the relative intensity of themagnetizing field (RPI) can be determined (King et al., 1983;Tauxe, 1993; Channell et al., 2008). Previous studies have shownthat by stacking multiple RPI records (e.g. the SINT-2000 stack ofValet et al. (2005), PISO-1500 of Channell et al. (2009), and PADM2Mof Ziegler et al. (2011)) common, global features (either peaks ortroughs) can be identified providing an additional tool for strati-graphic correlation, and dating, of sedimentary successions betweengeomagnetic reversals. Before RPI can be estimated, the environ-mentally driven changes in the magnetization (e.g. variations in theconcentration of remanence-carrying grains through time) must beremoved. This is accomplished by normalizing the NRM with alaboratory-induced magnetization (ARM or IRM). By normalizing theNRM through the laboratory-induced magnetization (in this studywe have used ARM), the RPI can be estimated because all envir-onmentally driven changes in concentration and grain-size areremoved from the record. As described above, the upper 85 m ofSite U1336 are characterized by non-interacting (possibly biogenic)SD to small PSD magnetite making Site U1336 the ideal site fromwhich to construct an RPI record for the middle Miocene.
To ensure that our normalization procedure has removed anyorbitally paced magnetic concentration cycles, we conducted spec-tral analysis of ARM and RPI data between 15 and 16 Ma, an intervalwith strong cycles. Fig. 7 shows the spectral power of ARM whichindicates eccentricity paced cycles that are five orders of magnitudeabove a white noise background. The spectral power of RPI does notindicate statistically significant orbital peaks, for the same interval,implying that the RPI record reflects changes in magnetization ofsediments driven by variations of the geomagnetic field. The SiteU1336 RPI record is the most robust and of the highest quality yetpublished for this period, and therefore we can use it to assess thebehavior of the middle Miocene geomagnetic field.
Fig. 8 illustrates the RPI stack for Site U1336 with RPI estimatesmade using the traditional NRM normalized by ARM (e.g., Tauxe,1993) and the slope fit method of Channell et al. (2002) asimplemented in the UPmag software by Xuan and Channell(2009). The slope of best fit is based on NRM and ARM demagne-tization steps at 20, 30, 40, 50, and 60 mT. The correlationcoefficient (r) is shown to indicate the robustness of best-fit line
and the polarity reversals record is from Fig. 5. Average sedimen-tation rates at Site U1336 are around ∼10 m/Myr (∼1 cm/kyr)allowing us to resolve the RPI of the geomagnetic field on time-scales of ∼5–6 kyr when taking into account the Gaussian-shapedresponse functions of pickup coils (at half-peak width) in the OPRF2G magnetometer (X¼4.628, Y¼−4.404, and Z¼-6.280 cm).
RPI estimates are more reliable after ∼13.7 Ma (above the base ofChron C5ABr) and from the base of Chron C5Br to the base of thestudied interval (r-values of 40.95). A gap in our slope RPI estimatesin Chron C5Br (between 15.50 Ma and 15.65 Ma) was caused byinadvertently sampling this interval for other analyses before thesecond phase of ARM acquisition and demagnetization (see Section 2).
Fig. 8 further illustrates that low intensity intervals coincidewith geomagnetic reversals as expected. The decline and recoveryfrom geomagnetic reversals is variable, however, in the older,more reliable portion of the record, where reversals are generallycharacterized by a rapid decline in field strength followed by aslower recovery. The three subchrons or excursions identifiedearlier are also all associated with some of the weakest parts ofthe RPI record indicating a collapse of the geomagnetic field.Visually, the record also indicates that each polarity interval has arather unique character with some chrons having higher varia-bility and a greater average intensity than others. We see noevidence of ‘saw tooth’ patterns or decaying field strength leadingup to geomagnetic reversals in our record as was inferred byValet and Meynadier (1993). However, we are unable to excludedefinitively the existence of sawtooth or cyclic decay–recoverypatterns from our data because additional, independent agecontrol is unavailable in our study.
To determine further whether individual polarity chrons have aunique or repeating RPI character, we conducted simple statisticaltests of the RPI slope data for polarity intervals (Fig. 9) with theinterval the base of Chron C5ADn (14.581 Ma) to the base of ChronC5Er (18.614 Ma) containing the most robust RPI data. C6n isexcluded because the basal reversal was not identified. Statisticswere calculated for each polarity interval by dividing the record bythe value at the reversal boundary where RPI is at its lowest.

Fig. 8. Relative paleointensity (RPI) record from Site U1336 divided into 2.5 Myr intervals. Declination (black) and inclination (gray) and the correlation with the GPTS areshown in each interval. Both the slope (red—determined from the 20, 30, 40, 50, and 60 mT steps) and NRM/ARM (blue—20 mT step) RPI records are shown and the linearcorrelation coefficient (r-value), which indicates the robustness of the slope fit. Conspicuous and abrupt collapses of the geomagnetic field are associated with eachgeomagnetic reversal. (For interpretation of the references to color in this figure legend, the reader is referred to the web version of this article.)
C. Ohneiser et al. / Earth and Planetary Science Letters 374 (2013) 227–238 235

Fig. 9. Mean, variance, and skewness of relative paleointensity (RPI) data for each chron from the top of Chron C5An.1n (12.014 Ma) to the base of Chron C5Er (18.614 Ma).The gray area indicates the interval with less robust (poor) RPI estimates. The data show higher RPIs in older chrons with a gradual upcore reduction. Variance and skewnessof each chron show no clear correlation with the duration of a chron or polarity state. The data also show that the younger and older segments of Chron C5Dr have differentbehavior with a mean RPI of 0.011 and 0.016 (older to younger respectively); Chron C5Dr.1n is the apparent divider.
C. Ohneiser et al. / Earth and Planetary Science Letters 374 (2013) 227–238236
The analyses reveal that mean RPI values generally decline aschrons become younger over this 14–19 Ma interval. This resultconflicts with Tauxe (2006) who compiled absolute paleointensityestimates from DSDP/ODP submarine basaltic samples and foundan increase in field strength between ∼20 Ma and ∼15 Ma. Addi-tional RPI records covering this interval are needed to excludesubtle, long-term changes in magnetic mineralogy at Site U1336 asa cause of declining apparent geomagnetic field strength. We see norelationship between duration of a chron and the mean RPI(Supplementary Fig. S3), in contrast with the conclusions of Tauxeand Hartl (1997) and Constable et al. (1998). Nor do we see anyrelationship between the duration of a polarity chron and thevariance about the mean or the skewness of the RPI data (Fig. 9).
Ziegler et al. (2011) suggested from 86 stacked relative paleoin-tensity records, spanning the last 2 Myr, that the Brunhes Chronhad ∼20% stronger geomagnetic intensity than the MatuyamaChron. Likewise the SINT-2000 (Valet et al., 2005) also indicateda weaker field strength during the Matuyama Chron whencompared with the Brunhes Chron. On the other hand, the PISO-1500 paleointensity stack (Channell et al., 2009) does not indicatea difference of mean intensity for Brunhes and Matuyama chronsover the last 1.5 Myr. To test further the distribution and relation-ship of RPI estimates and polarity we have plotted the slopedetermined RPI distribution from all data and for a selectedinterval with high quality RPI estimates between the top of ChronC5Cn.1n (15.898 Myr) to the base of Chron C5Er (18.614 Ma)(Fig. 10). We selected the Chron C5Cn.1n to Chron C5Er intervalbecause there are an approximately equal number of reversed andnormal polarity samples with roughly equal data density (1202normal polarity and 1229 reversed polarity RPI estimates) andbecause this interval has the lowest overall r-value and thereforecontains the most robust RPI estimates. Our distribution is basedon 30 equally spaced bins (0.03/bin) of the slope fit data. Fig. 10
illustrates that the difference between polarities is relatively smallalthough on average reversed polarity intervals have stronger RPIthan normal polarity intervals and that the reversed polarity dataare skewed in favor of higher intensities. This may, of course, onlybe a feature of the specific interval we have analyzed.
6. Conclusions
The Site U1336 magnetostratigraphy presented here providesprecise depth control of geomagnetic reversals recorded in theupper 85 m that spans the ∼12–19.4 Ma interval. The magnetiza-tion of the sediment is carried almost exclusively by SD and smallPSD magnetite, probably of biogenic origin. Our magnetostrati-graphy is correlated with the GPTS with a precision of a fewcentimeters and contains three subchrons that do not feature incontemporary timescales, to which we assign linearly interpolatedages of 13.50 Ma, 14.94 Ma, and 15.99 Ma. We have tested thecalibration of the ATNTS2004 GPTS (Lourens et al., 2004) byobserving changes in sedimentation rate at reversal boundaries.We find that the astronomical calibration proposed by Billups et al.(2004) produces much smoother changes in sedimentationbetween polarity reversals, and is therefore probably more correct(see also Channell et al., 2013). On the other hand, the astronom-ical calibration suggested by Hüsing et al. (2010) between C5Bn.2nand C5ADn produces abrupt changes in sedimentation rate atreversals, which may indicate that it is not reliable. The magnetos-tratigraphic age model indicates that sedimentation rates werebetween 7 m/Myr and 16 m/Myr and were on average ∼10 m/Myrbefore the site descended beneath the CCD at ∼12 Ma.
The apparent dominance of SD (biogenic) to small PSD magne-tite as the remanence carrier allowed us to construct a well-constrained RPI record of the succession. Our data indicate that
Fig. 10. RPI distribution for normal (black) and reversed (gray) polarity RPIestimates for the entire data set and for the most robust RPI data between thetop of Chron C5Cn.1n and the base of Chron C5Er. Data plotted for the entireinterval are likely contaminated by poor RPI estimates and may be biased becausemore RPI estimates are derived from normal polarity chrons, than reversed polaritychrons. We focus our analysis between Chrons C5Cn.1n to the base of Chron C5Erbecause this interval has the highest quality RPI estimates and because dataare split roughly 50/50 between normal and reversed polarity states, with similarproportions for each polarity state.
C. Ohneiser et al. / Earth and Planetary Science Letters 374 (2013) 227–238 237
the geomagnetic field may have declined in strength between 18.5and 14.5 Ma. We see no relationship between the strength of thegeomagnetic field and the duration of the chron or the polaritystate, and suggest that, when viewed over a long periods, eachpolarity chron has a unique RPI character.
The Site U1336 RPI record is a first step in developing a global-average stacked paleointensity record for the early–middle Miocene.When enough records with a wide geographic distribution becomeavailable a stacking procedure such as those employed to produce theSINT-2000 (Valet et al., 2005), PISO-1500 (Channell et al., 2009) andPADM2M (Ziegler et al., 2011) records may result in a valuableadditional dating tool for early and middle Miocene successions.
Acknowledgments
This research used samples and data provided by the IntegratedOcean Drilling Program (IODP). Funding for this work was pro-vided by grants from the University of Otago and from the U.S. NSF(OCE 0961161, OCE 0961412, OCE 0960999) and by U.S. Science
Support Program (USSSP) Post Expedition Activity (PEA) awards.Participation of T.Y and Y.Y. to IODP Exp. 320/321 was supported byJ-DESC and CDEX/JAMSTEC. We thank Fabio Florindo for helpfulcomments and revisions to this manuscript and Leonardo Sagnottifor technical support with FORC analyses. We thank the IODPtechnicians and staff and the Expedition 320/321 ShipboardScientific Party, who provided a plethora of information throughshipboard analyses and discussions. We also thank the JOIDESResolution crew for their efforts in collecting the core upon whichthis study is based. We gratefully acknowledge the constructivecriticism provided by the anonymous reviewers who helpedimprove this manuscript.
Appendix A. Supplementary materials
Supplementary data associated with this article can be found inthe online version at http://dx.doi.org/10.1016/j.epsl.2013.04.038.
References
Acton, G.D., Gordon, R.G., 1994. Paleomagnetic tests of Pacific Plate reconstructionsand implications for motion between hotspots. Science 263, 1246–1254.
Bazylinski, D., Frankel, R., 2004. Magnetosome formation in prokaryotes. Nat. Rev.Microbiol. 2, 217–230.
Bazylinski, D., Frankel, R., Heywood, B., Mann, S., King, J., Donaghay, P., Hanson, A.,1995. Controlled biomineralization of magnetite (Fe3O4) and gregite (Fe3S4) in amagnetotactic bacterium. Appl. Environ. Microbiol. 61, 3232–3239.
Billups, K., Pälike, H., Channell, J.E.T., Zachos, J.C., Shackleton, N.J., 2004. Astronomiccalibration of the late Oligocene through early Miocene geomagnetic polaritytime scale. Earth Planet. Sci. Lett. 224, 33–44.
Brachfeld, S.A., Kissel, C., Laj, C., Mazaud, A., 2004. Behavior of u-channels duringacquisition and demagnetization of remanence: implications for paleomagneticand rock magnetic measurements. Phys. Earth Planet. Inter. 145, 1–8.
Channell, J.E.T., Galeotti, S., Martin, E.E., Billups, K., Scher, H.D., Stoner, J.S., 2003.Eocene to Miocene magnetostratigraphy, biostratigraphy, and chemostratigra-phy at ODP Site 1090 (sub-Antarctic South Atlantic). Geol. Soc. Am. Bull. 115,607–623.
Channell, J.E.T., Guyodo, Y., 2004. The Matuyama chronozone at ODP Site 982(Rockall Bank): evidence for decimeter-scale magnetization lock-in depths. In:Channell, J.E.T., Kent, D.V., Lowrie, W., Meert, J. (Eds.), Timescales of thePaleomagnetic Field, vol. 145. AGU Geophysical Monograph Series, pp. 205–219.
Channell, J.E.T., Hodell, D., Xuan, C., Mazaud, A., Stoner, J.S., 2008. Age calibratedrelative paleointensity for the last 1.5 Myr at IODP Site U1308 (North Atlantic).Earth Planet. Sci. Lett. 274, 59–71.
Channell, J.E.T., Mazaud, A., Sullivan, P., Turner, S., Raymo, M.E., 2002. Geomagneticexcursions and paleointensities in the Matuyama Chron at Ocean DrillingProgram Sites 983 and 984 (Iceland Basin). J. Geophys. Res. 107, 2114, http://dx.doi.org/10.1029/2001JB000491.
Channell, J.E.T., Xuan, C., Hodell, D.A., 2009. Stacking paleointensity and oxygenisotope data for the last 1.5 Myr (PISO-1500). Earth Planet. Sci. Lett. 283, 14–23.
Constable, C.G., Tauxe, L., Parker, R.L., 1998. Analysis of 11 Myr of geomagneticintensity variation. J. Geophys. Res. 103, 171735–171748.
Channell, J.E.T., Ohneiser, C., Yamamoto, Y., Kesler, M.S., 2012. Oligocene–Miocenemagnetic stratigraphy carried by biogenic magnetite at Sites U1334 and U1335(equatorial Pacific Ocean). Geochem. Geophys. Geosyst. 14 (2), http://dx.doi.org/10.1029/2012GC004429.
Day, R., Fuller, M., Schmidt, V.A., 1977. Hysteresis properties of titanomagnetites:grain-size and compositional dependence. Phys. Earth Planet. Inter. 13,260–267.
Dunlop, D.J., 2002a. Theory and application of the Day plot (Mrs/Ms versus Hcr/Hc) 1.Theoretical curves and test using titanomagnetite data. J. Geophys. Res 107,2056, http://dx.doi.org/10.1029/2001JB000486.
Dunlop, D.J., 2002b. Theory and application of the Day plot (Mrs/Ms versus Hcr/Hc) 2.Application to data for rocks, sediments, and soils. J. Geophys. Res 107, 2057,http://dx.doi.org/10.1029/2001JB000487.
Egli, R., Chen, A., Winklhofer, M., Kodama, K.P., Horng, C.S., 2010. Detection ofnoninteracting single domain particles using first-order reversal curve dia-grams. Geochem. Geophys. Geosyst. 11, 1–22.
Florindo, F., Wilson, G.S., Roberts, A.P., Sagnotti, L., Verosub, K.L., 2005. Magnetos-tratigraphic chronology of a late Eocene to early Miocene glacimarine succes-sion from the Victoria Land Basin, Ross Sea, Antarctica. Global Planet. Change45, 207–236.
Guyodo, Y., Valet, J.P., 1999. Global changes in intensity of the Earth's magnetic fieldduring the past 800 kyr. Nature 399, 249–252.
Harrison, R., Feinberg, J., 2008. FORCinel: an improved algorithm for calculatingfirst-order reversal curve distributions using locally weighted regressionsmoothing. Geochem. Geophys. Geosyst. 9, 1–11.

C. Ohneiser et al. / Earth and Planetary Science Letters 374 (2013) 227–238238
Horner-Johnson, B.C., Gordon, R.G., 2010. True polar wander since 32 Ma B.P.: apaleomagnetic investigation of the skewness of magnetic anomaly 12r on thePacific plate. J. Geophys. Res. 115, 9101.
Hüsing, S.K., Cascella, A., Hilgen, F.J., Krijgsman, W., Kuiper, K.F., Turco, E., Wilson, D.,2010. Astrochronology of the Mediterranean Langhian between 15.29 and14.17 Ma. Earth Planet. Sci. Lett. 290, 254–269.
King, J., Banerjee, S.K., Marvin, J., 1983. A new rock-magnetic approach to selectingsediments for geomagnetic paleointensity studies: application to paleointensityfor the last 4000 years. J. Geophys. Res 88, 5911–5921.
Kirschvink, J.L., 1980. The least-squares line and plane and the analysis ofpalaeomagnetic data. Geophys. J. R. Astron. Soc. 62, 699–718.
Lanci, L., Pares, J., Channell, J.E.T., Kent, D.V., 2004. Miocene magnetostratigraphyfrom Equatorial Pacific sediments (ODP Site 1218, Leg 199). Earth Planet. Sci.Lett. 226, 207–224.
Lourens, L.J., Hilgen, F.J., Laskar, J., Shackleton, N.J., Wilson, D., 2004. The Neogeneperiod. In: Gradstein, F., Ogg, J., Smith, A. (Eds.), A Geological Time Scale.Cambridge University Press, pp. 409–440.
Lurcock, P.C., Wilson, G.S., 2012. PuffinPlot: a versatile, user-friendly program forpaleomagnetic analysis. Geochem. Geophys. Geosyst. 13, Q06Z45, http://dx.doi.org/10.1029/2012GC004098.
Lyle, M., 2003. Neogene carbonate burial in the Pacific Ocean. Paleoceanography 18,1–21.
Pälike, H., Lyle, M.W, Nishi, H., Raffi, I., Ridgwell, A., Gamage, K., Klaus, A., Acton, G.,Anderson, L., Backman, J., Baldauf, J., Beltran, C., Bohaty, S.M., Bown, P., Busch,W., Channell, J.E.T., Chun, C.O.J., Delaney, M., Dewangan, P., Jones, T.D., Edgar, K.M., Evans, H., Fitch, P., Foster, G.L., Gussone, N., Hasegawa, H., Hathorne, E.C.,Hayashi, H., Herrle, J.O., Holbourn, A., Hovan, S., Hyeong, K., Iijima, K., Ito, T.,Kamikuri, S., Kimoto, K., Kuroda, J., Leon-Rodriguez, L., Malinverno, A., Moore Jr.,T.C., Murphy, B.H., Murphy, D.P., Nakamura, H., Ogane, K., Ohneiser, C., Richter,C., Robinson, R., Rohling, E.J., Romero, O., Sawada, K., Scher, H., Schneider, L.,Sluijs, A., Takata, H., Tian, J., Tsujimoto, A., Wade, B.S., Westerhold, T., Wilkens,R., Williams, T., Wilson, P.A., Yamamoto, Y., Yamamoto, S., Yamazaki, T., Zeebe, R.E., 2012. A Cenozoic record of the equatorial Pacific carbonate compensationdepth. Nature 488, 609–614.
Pälike, H., Nishi, H., Lyle, M., Raffi, I., Klaus, A., Gamage, K., 2009. and the Expedition320/321 Scientists, 2009. Pacific Equatorial Transect , IODP Preliminary Report,p. 320. http://dx.doi.org/10.2204/iodp.pr.320.2009.
Pälike, H., Norris, R.D., Herrle, J.O., Wilson, P.A., Coxall, H.K., Lear, C.H., Shackleton,N.J., Tripati, A.K., Wade, B.S., 2006. The heartbeat of the Oligocene climatesystem. Science 314, 1894–1898.
Pike, C.R., Roberts, A.P., Verosub, K.L., 1999. Characterizing interactions in finemagnetic particle systems using first order reversal curves. J. Appl. Phys. 85,6660–6667.
Roberts, A.P., Pike, C.R., Verosub, K.L., 2000. First order reversal curve diagrams: anew tool for characterizing the magnetic properties of natural samples.J. Geophys. Res. 105, 28461–28475.
Schulz, M., Stattegger, K., 1997. Spectrum: spectral analysis of unevenly spacedpaleoclimatic time series. Comput. Geosci. 23, 929–945.
Stoner, J.S., Channell, J.E.T., Hillaire-Marcel, C., 1995. Late Pleistocene relativegeomagnetic paleointensity from deep Labrador Sea: regional and globalcorrelations. Earth Planet. Sci. Lett. 134, 237–252.
Tauxe, L., 1993. Sedimentary records of relative paleointensity of the geomagneticfield: theory and practice. Rev. Geophys. 31, 319–354.
Tauxe, L., Hartl, P., 1997. 11 million years of Oligocene geomagnetic field behaviour.Geophys. J. Int. 128, 217–229.
Tauxe, L., 2006. Long-term trends in paleointensity: the contribution of DSDP/ODPsubmarine basaltic glass collections. Phys. Earth Planet. Inter. 156, 223–241.
Valet, J.P., Meynadier, L., 1993. Geomagnetic field intensity and reversals during thepast four million years. Nature 366, 234–238.
Valet, J.P., Meynadier, L., Guyodo, Y., 2005. Geomagnetic dipole strength andreversal rate over the past two million years. Nature 435, 802–805.
Xuan, C., Channell, J.E.T., 2009. UPmag: MATLAB software for viewing and proces-sing u channel or other pass-through paleomagnetic data. Geochem. Geophys.Geosyst. 10, 1–12 http://dx.doi.org/10.1029/2009GC002584.
Yamazaki, T., Oda, H.H., 2005. A geomagnetic paleointensity stack between 0.8 and3.0 Ma from equatorial Pacific sediment cores. Geochem. Geophys. Geosyst. 6,Q11H20, http://dx.doi.org/10.1029/2005GC001001.
Zachos, J., Pagani, M., Sloan, L., Thomas, E., Billups, K., 2001a. Trends, rhythms, andaberrations in global climate 65 Ma to present. Science 292, 686–693.
Zachos, J.C., Shackleton, N.J., Revenaugh, J.S., Pälike, H., Flower, B.P., 2001b. Climateresponse to orbital forcing across the Oligocene–Miocene boundary. Science292, 274–278.
Ziegler, L., Constable, C.G., Johnson, C.L., Tauxe, L., 2011. PADM2M: a penalizedmaximum likelihood model of the 0–2 Ma palaeomagnetic axial dipolemoment. Geophys. J. Int. 184, 1069–1089.