Embed Size (px)
Citation preview
Earth and Planetary Science Letters 309 (2011) 153–165
Contents lists available at ScienceDirect
Earth and Planetary Science Letters
j ourna l homepage: www.e lsev ie r.com/ locate /eps l
Paleomagnetism of early Paleogene marine sediments in southern Tibet, China:Implications to onset of the India–Asia collision and size of Greater India
Zhiyu Yi ⁎, Baochun Huang, Junshan Chen, Liwei Chen, Hailong WangState Key Laboratory of Lithospheric Evolution, Institute of Geology and Geophysics of the Chinese Academy of Sciences, Beijing 100029, China
⁎ Corresponding author at: Institute of Geology and GSciences, No. 19, Bei Tucheng Xilu, Chaoyang District, Bei82998425; fax: +86 10 62010846.
E-mail addresses: [email protected] (Z. Yi), bchu(B. Huang).
0012-821X/$ – see front matter © 2011 Elsevier B.V. Adoi:10.1016/j.epsl.2011.07.001
a b s t r a c t
a r t i c l e i n f oArticle history:Received 10 March 2011Received in revised form 30 June 2011Accepted 1 July 2011Available online 28 July 2011
Editor: T.M. Harrison
Keywords:Tethyan HimalayaGreater IndiaIndia–Asia collisionpaleomagnetismPaleogenemarine sediments
We report a paleomagnetic study of Paleocene marine sediments in the Gamba area of the Tethyan Himalayanterrane, southern Tibet, which aims to accurately locate the position of the northernmargin of Greater India andfurther constrain timing of initial contact between India and Asia. Following detailed rock magnetic andpaleomagnetic experiments on a total of 675 drill-core samples collected from the Zongpu and Upper Jidulaformations, characteristic remanent magnetizations (ChRMs) were successfully isolated from most samplesfollowing alternating field (AF) or integrated thermal and AF demagnetization. The ChRMs are of dual polarityand pass fold and reversal tests indicating a pre-folding origin. Together with detailed biostratigraphicinvestigation of the sampling section, a magnetic polarity sequence is constructed from data at 167 sampledhorizons and satisfactorily correlates with polarity chrons C24r to C27r dating the Zongpu Formation between~56.2 and 61.8 Ma on the geomagnetic polarity time scale. The ChRM directions from the Zongpu Formation aregrouped stratigraphically into 33 sites and yield two paleopoles of 71.6°N, 277.8°E (A95=2.5°) and 67.3°N,266.3°E (A95=3.5°) for the time intervals comprising 56 to 59 Ma and 59 to 62 Ma, respectively. These newpaleopoles imply that the Tethyan Himalayan terrane was sited at low latitudes in the Northern Hemisphereduring the interval ~62–56Ma, suggesting that initial contact between the TethyanHimalaya and Lhasa terraneswas established before 60.5±1.5 Ma, and very likely occurred near the Cretaceous–Tertiary boundary, at least inthe central part of the suture zone. The results also indicate that at least 1500±480 kmof post-collisional crustalshortening occurred within the Himalayas. From the analysis of available paleomagnetic data obtained on bothsides of the suture zone, we propose a conceptional collision model for the India–Asia collision.
eophysics, Chinese Academy ofjing 10029, China. Tel.: +86 10
ll rights reserved.
© 2011 Elsevier B.V. All rights reserved.
1. Introduction
Collision of India andAsia has created the Tibetan plateau (Allègre etal., 1984; Chang et al., 1986; Dewey et al., 1989), and the continuousevolution of the Tibetanplateauhas greatly changed the environment insurrounding areas (Brookfield, 1998; Clark et al., 2004; Molnar et al.,1993; Raymo and Ruddiman, 1992). The initial time of the India–Asiacollision is undoubtedly one of themost important boundary conditionsfor the evolution model of the Himalaya–Tibetan orogenic system, andthus becomes a starting point for almost all studies in the Tibetanplateau (Chen et al., 2010).
The timing of collision between India and Asia has been acontroversial issue during the past decade and several recent paleo-magnetic studies have aimed to constrain the latitudinal position of theinitial contact between India and Asia (e.g., Chen et al., 2010; Dupont-Nivet et al., 2010; Liebke et al., 2010; Najman et al., 2010). These
investigations have ruled out the model for an Oligocene India–Asiacollision (e.g., Aitchison et al., 2000, 2007; Aitchison andDavis, 2001; Aliand Aitchison, 2008), and implied that initial contact between India andAsia occurred no later than ~50 Ma (Chen et al., 2010; Dupont-Nivet etal., 2010; Liebke et al., 2010;Najmanet al., 2010).Although these studiesstrongly support the traditional view of the timing India–Asia collisionat ~55–50 Ma (e.g., Klootwijk et al., 1992; Patriat and Achache, 1984),the model for a much earlier collision, for example during the lateCretaceous or near the Cretaceous–Paleogene (K/Pg) boundary (e.g., Caiet al., 2011; Ding et al., 2003, 2005; Jaeger et al., 1989; Mo et al., 2003,2008) still retain support. Collisionbetween two continents is defined asthe contact between continental lithospheres accompanied by thedisappearance of oceanic lithosphere. Therefore, for a continentalcollision in approximately a north–south direction as in the India–Asiacollision, the most direct evidence is whether terranes distributed inboth sides of suture zone have comparable paleolatitudes. This providesthe key evidence for understanding when and where the Indian andAsian continents initially collided (Huang et al., 2010).
Recently, several paleomagnetic studies have been carried out onthe Linzizong volcanic rocks in the Lhasa terrane (Chen et al., 2010;Dupont-Nivet et al., 2010; Liebke et al., 2010; Sun et al., 2010; Tan etal., 2010) and group-mean results for individual formation indicate
154 Z. Yi et al. / Earth and Planetary Science Letters 309 (2011) 153–165
that the leading edge of the Asian continent was located at 6.7°N forthe Dianzhong, 11.6°N for the Nianbo, and 16.8°N for the Panaformations (Najman et al., 2010). Our newly revised paleomagneticdata for the Linzizong Group in the Linzhou basin of the Lhasa terrane(Fig. 1a) yield three individual paleopoles at 66.4°N, 262.5°E (N=20,A95=6.3°), 69.7°N, 268.6°E (N=13, A95=6.3°), and 68.6°N, 232.3°E(N=18, A95=5.9°) for the Dianzhong (~64–60 Ma), Nianbo (~60–50 Ma), and Pana formations(~50–44 Ma), respectively (Chen et al.,in progress). Collectively, these data indicate low paleolatitudes of5.8°N±6.3° to 11.5°N±5.9° for the Lhasa terrane during formation ofthe Linzizong Group.
However, late Cretaceous to early Paleogene paleomagnetic dataobtained from the Himalayan terrane, which lies on the southern side ofthe Indus–YarlungZangbo suture zone (IYSZ, Fig. 1a), are still rarebecauseof poor natural conditions, serious remagnetization and the lack ofvolcanic rocks. Thepaucity of reliable paleomagnetic datawithprecise ageconstraints in the Tethyan Himalaya is obviously unfavorable fordetermination of the shape and size of Greater India and for definingthe paleogeographic position of the northern leading edge of the Indiancontinent. To address this problem, some researchers have attempted touse paleolatitudes calculated from remagnetization components in older
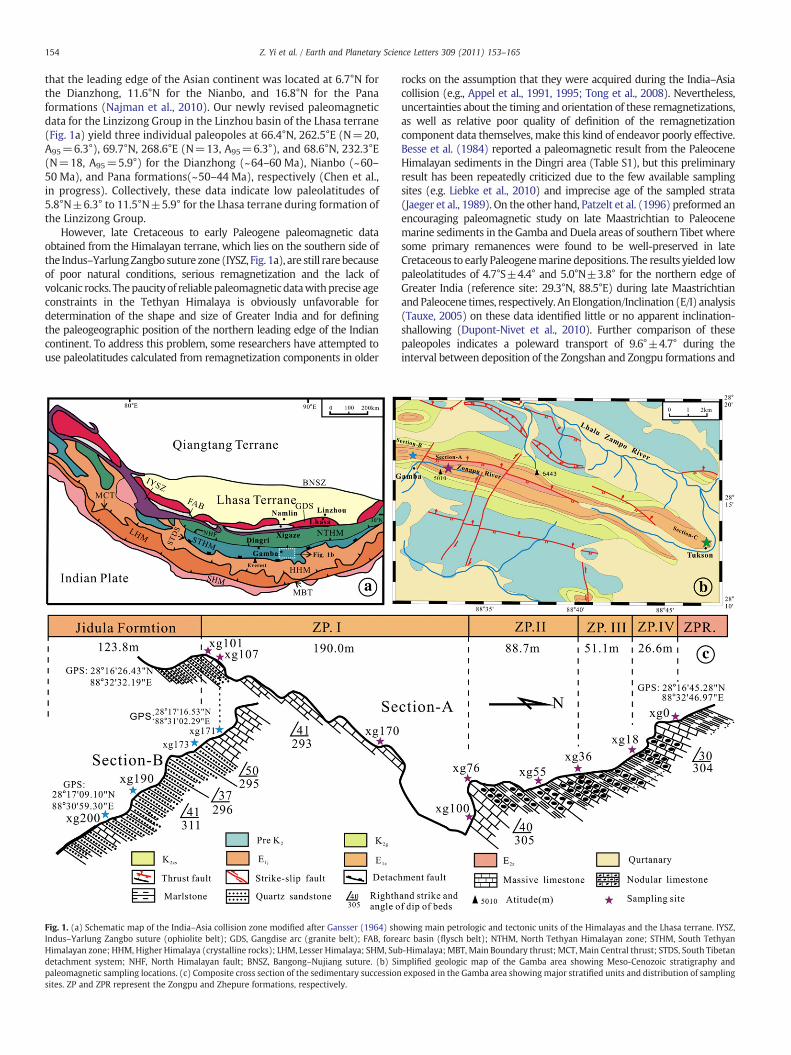
Fig. 1. (a) Schematic map of the India–Asia collision zone modified after Gansser (1964) shIndus–Yarlung Zangbo suture (ophiolite belt); GDS, Gangdise arc (granite belt); FAB, foreHimalayan zone; HHM, Higher Himalaya (crystalline rocks); LHM, Lesser Himalaya; SHM, Sudetachment system; NHF, North Himalayan fault; BNSZ, Bangong–Nujiang suture. (b) Sipaleomagnetic sampling locations. (c) Composite cross section of the sedimentary successionsites. ZP and ZPR represent the Zongpu and Zhepure formations, respectively.
rocks on the assumption that they were acquired during the India–Asiacollision (e.g., Appel et al., 1991, 1995; Tong et al., 2008). Nevertheless,uncertainties about the timing and orientation of these remagnetizations,as well as relative poor quality of definition of the remagnetizationcomponent data themselves, make this kind of endeavor poorly effective.Besse et al. (1984) reported a paleomagnetic result from the PaleoceneHimalayan sediments in the Dingri area (Table S1), but this preliminaryresult has been repeatedly criticized due to the few available samplingsites (e.g. Liebke et al., 2010) and imprecise age of the sampled strata(Jaeger et al., 1989). On the other hand, Patzelt et al. (1996) preformed anencouraging paleomagnetic study on late Maastrichtian to Paleocenemarine sediments in the Gamba and Duela areas of southern Tibet wheresome primary remanences were found to be well-preserved in lateCretaceous to early Paleogenemarine depositions. The results yielded lowpaleolatitudes of 4.7°S±4.4° and 5.0°N±3.8° for the northern edge ofGreater India (reference site: 29.3°N, 88.5°E) during late MaastrichtianandPaleocene times, respectively. AnElongation/Inclination (E/I) analysis(Tauxe, 2005) on these data identified little or no apparent inclination-shallowing (Dupont-Nivet et al., 2010). Further comparison of thesepaleopoles indicates a poleward transport of 9.6°±4.7° during theinterval between deposition of the Zongshan and Zongpu formations and
owing main petrologic and tectonic units of the Himalayas and the Lhasa terrane. IYSZ,arc basin (flysch belt); NTHM, North Tethyan Himalayan zone; STHM, South Tethyanb-Himalaya; MBT, Main Boundary thrust; MCT, Main Central thrust; STDS, South Tibetanmplified geologic map of the Gamba area showing Meso-Cenozoic stratigraphy andexposed in the Gamba area showing major stratified units and distribution of sampling
155Z. Yi et al. / Earth and Planetary Science Letters 309 (2011) 153–165
provides a first-order paleomagnetic constraint on the shape of GreaterIndia andonset of the India–Asia collision.However, due to fast northwardmovement of the Himalayan terrane during late Maastrichtian toPaleocene times, these preliminary results are obviously not enough todefine motion details for the Himalayan terrane during this period, andare insufficient to accurately determine the timing of India–Asia collisionas well as potential collision-related crustal shortening within theHimalayas. Therefore, more combined paleontostratigraphic and paleo-magnetic investigationson lateCretaceous–Paleogenemarine successionsin the Himalayas are required to resolve these issues (Chen et al., 2010).
In this study, we carry out a combined magnetostratigraphic andmagnetotectonic study of early Paleogene Tethyanmarine sediments inthe Gamba area of southern Tibet, where relatively detailed paleontos-tratigraphic investigations (Wan et al., 2002a, b; Willems and Zhang,1993) and the potential preservation of primary remanence (Patzelt etal., 1996) provide a sound basis for our study.We thereby aim to obtainsome early Paleogene paleopoles with precise age constraints andaccurately locate the northern leading edge of the Indian continent.Together with recently-obtained paleomagnetic constraints from thesouthern leading edge of the Asian continent, this enables us to estimatethe timing of initial contact between India and Asia, the northernextension of Greater India, and to further develop a geodynamic modelfor the India–Asia collision.
2. Geological setting and paleomagnetic sampling
The structure of the India–Asia collision orogenic belt is shown inFig. 1a, inwhichprimary tectonic units fromnorth to south comprise theLhasa terrane, the IYSZ, and theHimalayan terrane. The later is generallyregarded as the northern part of the Indian platewhere a complex fold–fault system developed during the convergence and collision of Indiaand Asia (e.g. Yin and Harrison, 2000). The main tectonic boundarieswithin the Himalayas consist of the South Tibetan detachment system(STDS),Main Central thrust (MCT),Main Boundary thrust (MBT), whichaccordingly divided the Himalayas into the Tethyan Himalaya, HigherHimalaya, Lesser Himalaya and Sub-Himalaya. The Tethyan Himalayacan be further divided into North and South zones by the Tingri–GambaFault which regionally belongs to the North Himalayan Fault (NHF). TheNorth Tethyan Himalaya zone is built up mainly of limestones, cherts,sandstones and mélanges representative of a sedimentary assemblageformed in shelf slope to deep basin environments. The South Zone is builtupmainly of limestones,well-sorted sandstones andmarls indicative of astable shelf environment (e.g., Pan and Ding, 2005). Noting that the shelfslope to deep basin environments generally marks the transitionbetween continental and oceanic crusts (Hedberg, 1970), and thatcrustal shortening in the TethyanHimalayahas been estimated tobeonly~130–140 km (Ratschbacher et al., 1994), it is possible that the TethyanHimalaya is preserved as the northern leading edge of Greater India.
In the Gamba area, a continuous late Cretaceous to early Paleogenemarine sedimentary succession is well-preserved as three lithostrati-graphic units namely the Zongshan, Jidula and Zongpu formations(Gansser, 1964; Wan et al., 2000, 2002a,b; Wen, 1987a,b; Willems andZhang, 1993). Detailed lithological and biostratigraphic studies aregiven byWan (1985);Willems and Zhang (1993) andWan et al. (2000,2002a,b). The Jidula Formation consists mainly of ferruginous sand-stones with a thickness of ~130 m which can be sub-divided into threemembers comprising lower sandstones (Member I), black limestones(Member II), and upper sandstones (Member III). Appearance of theforaminifera Rotalia hensoni Smout, R. dukharni Smout, Smoutina cruysiDrooger, Lockhartia sp. along with Rotalia sp. and Smoutina sp. at thebottomof the Jidula Formation indicate aDanianage (Wanet al., 2002a).The Zongpu Formation is mainly composed of carbonate rocks with athickness of ~360 m and could be sub-divided into four memberscomprising, in ascending order, massive limestones (Member I), marls(Member II), nodular limestones (Member III), and well-beddedlimestones (Member IV). Planktonic foraminifera of the angulata zone
occurring at 5.5 m above the base of this formation suggest that theMember I is to be classified into theMiddle Paleocene. This is confirmedby ostracods appearing in the lower part of Member I (about 4.5 mabove the boundary) which suggest a Danian age; the more frequentoccurrence of foraminifera Miscellanea miscella for the first time at thetopof theMember I indicates a Thanetianage. Strata developed fromthetop of Member I to the top of theMember III have a clear Thanetian agein the light of the predominant distribution of Miscellanea miscella,Discocyclina and Ranikothalia. The expansion of the foraminifera genusAlveolina, Orbitolites and first small Nummulites permits an assignmentof the upper ~25 m of the Zongpu Formation to Eocene time (Willemsand Zhang, 1993).
Our sampling area near the townof Gamba is shown in Fig. 1b,wherea relatively complete succession of the Zongpu Formation was selectedfor magnetostratigraphic sampling. Three or more individually orienteddrill-cores were collected from each horizon with a sampling intervaltypically of 1–2 m between successive horizons, although it wassometimes as large as3–5 mormorewhere the sequencewascomposedmostly ofmarls. A total of 510 sampleswere collected from170 horizonscomprising a total sampling thickness of ~356.4 m (Fig. 1c). Meanwhile,type section of the Jidula Formation developed near the town of Gambawas also sampled although only 84 cores of sandstone in 30 horizonswere collected because of incomplete development of the successionand the prevalence of coarse grain sizes (Fig. 1b–c). A further 81 samplesfrom 8 sites of well-bedded limestones, belonging lithologically toMember I of the Zongpu Formationwere collected for a fold test from thesection near the village of Tukson, about several tens kilometers awayfrom the type section of the Zongpu Formation (Fig. 1b). All the sampleswere collected with a portable gasoline-powered drill and oriented insitu by both magnetic and sun compasses.
3. Rock magnetic investigations
Cylindrical specimens ~2.0–2.2 cm in length were cut from fieldcore samples and some selected fresh endmaterials were subjected torock magnetic analysis. Acquisition and back-field demagnetization ofisothermal remanent magnetization (IRM) as well as thermaldemagnetization of composite IRMs (Lowrie, 1990), were carriedout to identify the main magnetic minerals in the collected samples.Twelve pilot samples were magnetized with a pulse magnetizer(2G660) from 0.01 to 2.4 Tesla (T), and IRM intensity measuredfollowing each step of magnetization. After executing back-fielddemagnetization of IRM, direct current (DC) magnetic fields of 2.7, 0.4and 0.1 T were applied to the Z-axis, Y-axis and X-axis of each sampleseparately. Thermal demagnetization up to 680 °C was performed in aTD-48 thermal demagnetizer and remanent magnetizations weremeasured using a 2G-755R cryogenic magnetometer.
The samples can be divided into three categories according to resultsof rock magnetic experiments. Firstly, most limestone samples from theZongpu Formation reveal a complete saturation at ~0.3 T withremanence coercivity (Hcr) less than 0.1 T (Fig. S1a). This indicatesthat these samples are dominated by low-coercivity ferromagnets.Similarly demagnetization of composite IRMs indicates that all threecomponents decreased dramatically at ~400°C and the soft andmediumcomponents unblock completely at ~480°C (Fig. S1e) significantly belowthe Curie point of pure magnetite. A few limestone samples from theZongpu Formation and most sandstone samples from the JidulaFormation show a rapid increase in IRM intensity before 0.2 T and afurther gradual increase up to 2.4 T, the remanence coercivity generallylies between 0.1 and 0.2 T (Fig. S1b–c), suggesting that these samples arecomposed of both low and high coercivity magnetic minerals. Demag-netization of the composite IRMs shows that the hard and mediumcomponents usually unblock completely at 650 °C indicative of thepresence of hematite; the dramatic decrease of IRM intensity of the softandmedium components at ~400 °C, as well as the complete unblockingof the soft component at ~500 °C to 560 °C (Fig. S1f–g), identifies the
156 Z. Yi et al. / Earth and Planetary Science Letters 309 (2011) 153–165
presence of magnetite. A few limestone samples from the ZongpuFormation showavery slow increaseof IRM intensity before 0.5 T and failto saturate up to 2.4 T with higher remanence coercivity in excess of~0.5–1.0 T (Fig. S1d). Demagnetization of composite IRMs indicated thatthe hard component was generally unblocked during temperatureintervals between 80 and 200 °C (Fig. S1h) indicating that these samplesare dominated by goethite.
Collectively, the main magnetic carriers of remanence are eithermagnetite in most limestones from the Zongpu Formation, or bothmagnetite and hematite in some limestones from the Zongpu Formationand in sandstones from the Jidula Formation; goethite appears topredominate in a few limestone and sandstone samples.
4. Paleomagnetic results and analysis
Following evaluation of rock magnetic behaviors resolved from pilotsamples, all specimens were subject to either progressive thermal or AFdemagnetization. In general, progressive AF demagnetization or anintegrated approach comprising thermal demagnetization to 250 °Cfollowed by AF demagnetization up to 89 mT was applied to specimensfrom the Zongpu Formation in the light of their relatively lower naturalremanent magnetization (NRM) (generally less than 0.1 mA/m) and thepredominance of low-coercivity magnetic minerals. For the specimens
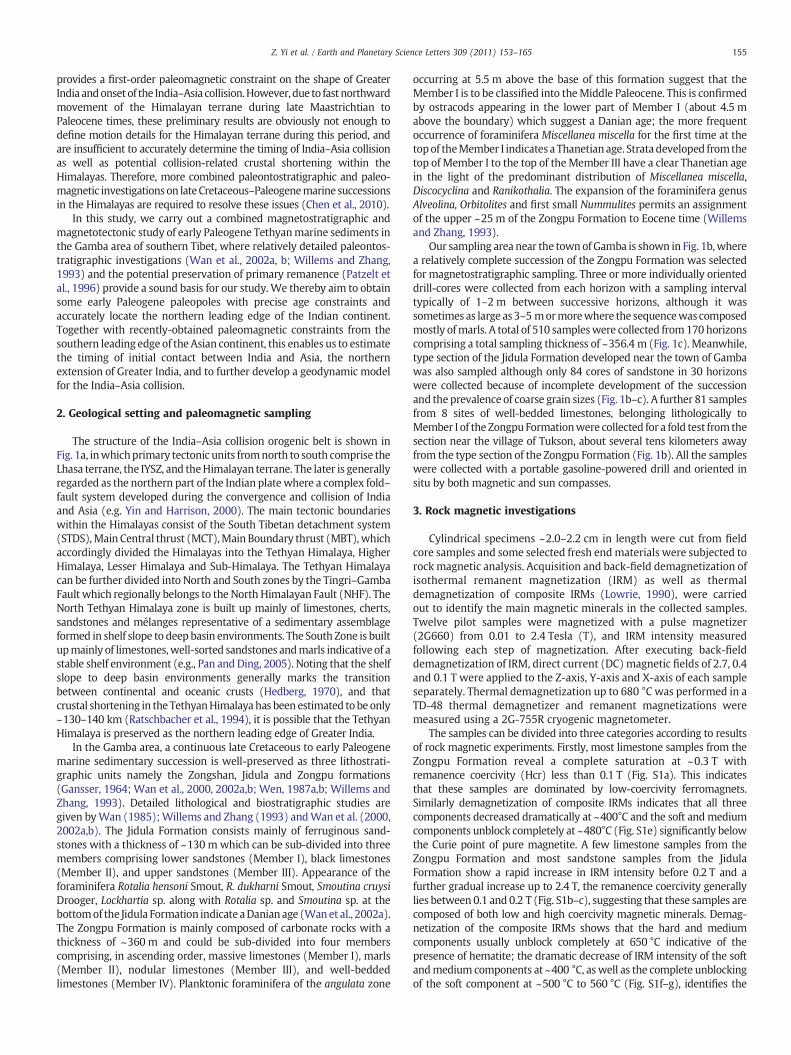
Fig. 2. Orthogonal (Zijderveld) and stereonet vector plots of representative specimens fromendpoints projected onto horizontal and vertical planes (lower and upper hemisphere), res
from the Jidula Formation, however, only thermal demagnetization wasapplied because of the existence of high-coercivity hematite. Thermaldemagnetization was performed in a TD-48 thermal demagnetizer withresidual magnetic field minimized to less than 10 nT inside the coolingchamber. Demagnetization intervals were 50 or 100 to 500 °C,subsequently reduced to steps of 30, 20 or 10 °C as the maximumunblocking temperatures of the remanence carriers were approached.Magnetizations were measured using a 2G-755R cryogenic magnetom-eter and performed in the Paleomagnetism and GeochronologyLaboratory (PGL) of the Institute of Geology and Geophysics, ChineseAcademy of Sciences where magnetometers and demagnetizers areinstalled in a magnetic shielded room with the field minimized to lessthan 300 nT. Demagnetization resultswere evaluated using stereograph-ic projections and orthogonal (Zijderveld, 1967) diagramswith the latterused to resolve component structures. Equivalent component directionswere calculated by principal component analysis (Kirschvink, 1980) orgreat-circle fitting of magnetizations (McFadden and McElhinny, 1988),and interval-mean results were determined using standard Fisherianmethod (Fisher, 1953).
In general, for the specimens from the Zongpu Formation, a softviscous component or a low temperature component with an in-situdirection approximately paralleling the present geomagnetic field isremoved by about 15 mT or 250 °C. After this removal, 284 out of 510
different levels. Directions are plotted in-situ; solid and open circles represent vectorpectively.
157Z. Yi et al. / Earth and Planetary Science Letters 309 (2011) 153–165
specimens yield a well defined characteristic remanence (ChRM)recognized by at least four successive steps between 20 and 89 mT(Fig. 2a–d, f) andwithmaximumangular deviation (MAD) less than10°.On the other hand, there are 35 out of the remaining 226 specimensshowing a clear distribution of NRM endpoints along a great circle,indicating that the ChRMmay have been obliterated (Fig. 2e); in thesecases some interval-mean directions of ChRM were calculated bycombining remagnetization great circles with direction observationsusing McFadden and McElhinny's (1988) method. However, the otherremaining 191 demagnetized specimens did not yield any stable ChRMafter the removal of a viscous component and the scattered NRMdirections on equal-area projection diagrams during demagnetizationindicated a poor record of the paleomagnetic field.
For the Jidula Formation, only 20 out of 84 demagnetized specimensyielded a stable high temperature ChRM after the removal of a viscouscomponent by temperatures of 250–300 °C. The ChRM is generallyisolated over the temperature intervals of either 610–670 °C or 500–590 °C (Fig. 2g–h). This demagnetization behavior is compatible withthe rockmagnetic resultswhich identify the presence of bothmagnetiteand hematite. Unfortunately, most specimens yielded erratic demag-netization trajectories and failed to isolate a ChRMcomponent.We haveno concise explanation for this behavior but it does seem to correlate
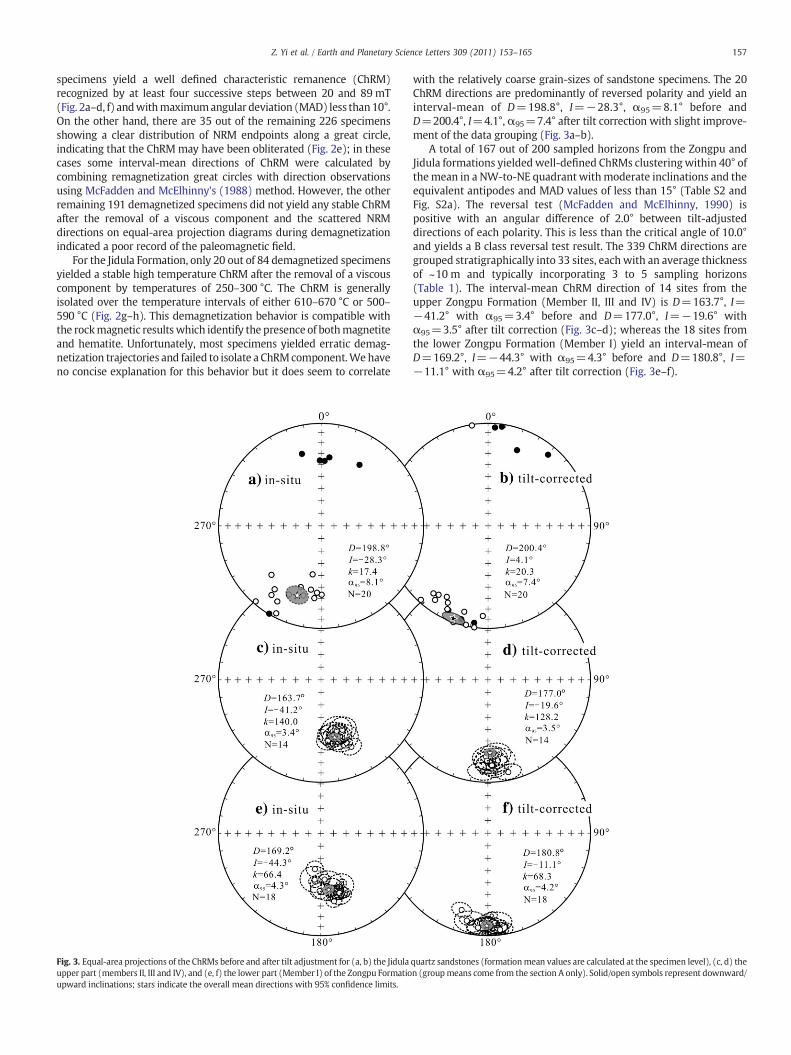
Fig. 3. Equal-area projections of the ChRMs before and after tilt adjustment for (a, b) the Jidulaupper part (members II, III and IV), and (e, f) the lower part (Member I) of the Zongpu Formatioupward inclinations; stars indicate the overall mean directions with 95% confidence limits.
with the relatively coarse grain-sizes of sandstone specimens. The 20ChRM directions are predominantly of reversed polarity and yield aninterval-mean of D=198.8°, I=−28.3°, α95=8.1° before andD=200.4°, I=4.1°, α95=7.4° after tilt correction with slight improve-ment of the data grouping (Fig. 3a–b).
A total of 167 out of 200 sampled horizons from the Zongpu andJidula formations yielded well-defined ChRMs clustering within 40° ofthemean in a NW-to-NE quadrant withmoderate inclinations and theequivalent antipodes and MAD values of less than 15° (Table S2 andFig. S2a). The reversal test (McFadden and McElhinny, 1990) ispositive with an angular difference of 2.0° between tilt-adjusteddirections of each polarity. This is less than the critical angle of 10.0°and yields a B class reversal test result. The 339 ChRM directions aregrouped stratigraphically into 33 sites, each with an average thicknessof ~10 m and typically incorporating 3 to 5 sampling horizons(Table 1). The interval-mean ChRM direction of 14 sites from theupper Zongpu Formation (Member II, III and IV) is D=163.7°, I=−41.2° with α95=3.4° before and D=177.0°, I=−19.6° withα95=3.5° after tilt correction (Fig. 3c–d); whereas the 18 sites fromthe lower Zongpu Formation (Member I) yield an interval-mean ofD=169.2°, I=−44.3° with α95=4.3° before and D=180.8°, I=−11.1° with α95=4.2° after tilt correction (Fig. 3e–f).
quartz sandstones (formationmean values are calculated at the specimen level), (c, d) then (groupmeans come from the section A only). Solid/open symbols represent downward/
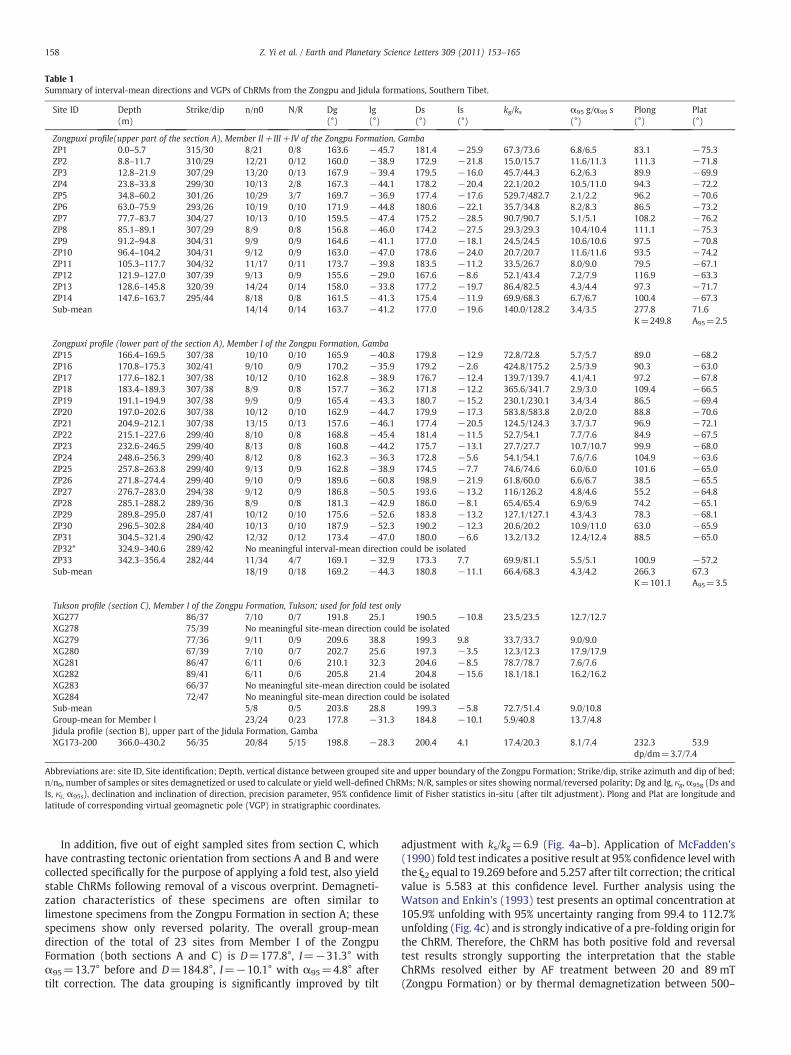
Table 1Summary of interval-mean directions and VGPs of ChRMs from the Zongpu and Jidula formations, Southern Tibet.
Site ID Depth(m)
Strike/dip n/n0 N/R Dg(°)
Ig(°)
Ds(°)
Is(°)
kg/ks α95 g/α95 s(°)
Plong(°)
Plat(°)
Zongpuxi profile(upper part of the section A), Member II+III+IV of the Zongpu Formation, GambaZP1 0.0–5.7 315/30 8/21 0/8 163.6 −45.7 181.4 −25.9 67.3/73.6 6.8/6.5 83.1 −75.3ZP2 8.8–11.7 310/29 12/21 0/12 160.0 −38.9 172.9 −21.8 15.0/15.7 11.6/11.3 111.3 −71.8ZP3 12.8–21.9 307/29 13/20 0/13 167.9 −39.4 179.5 −16.0 45.7/44.3 6.2/6.3 89.9 −69.9ZP4 23.8–33.8 299/30 10/13 2/8 167.3 −44.1 178.2 −20.4 22.1/20.2 10.5/11.0 94.3 −72.2ZP5 34.8–60.2 301/26 10/29 3/7 169.7 −36.9 177.4 −17.6 529.7/482.7 2.1/2.2 96.2 −70.6ZP6 63.0–75.9 293/26 10/19 0/10 171.9 −44.8 180.6 −22.1 35.7/34.8 8.2/8.3 86.5 −73.2ZP7 77.7–83.7 304/27 10/13 0/10 159.5 −47.4 175.2 −28.5 90.7/90.7 5.1/5.1 108.2 −76.2ZP8 85.1–89.1 307/29 8/9 0/8 156.8 −46.0 174.2 −27.5 29.3/29.3 10.4/10.4 111.1 −75.3ZP9 91.2–94.8 304/31 9/9 0/9 164.6 −41.1 177.0 −18.1 24.5/24.5 10.6/10.6 97.5 −70.8ZP10 96.4–104.2 304/31 9/12 0/9 163.0 −47.0 178.6 −24.0 20.7/20.7 11.6/11.6 93.5 −74.2ZP11 105.3–117.7 304/32 11/17 0/11 173.7 −39.8 183.5 −11.2 33.5/26.7 8.0/9.0 79.5 −67.1ZP12 121.9–127.0 307/39 9/13 0/9 155.6 −29.0 167.6 −8.6 52.1/43.4 7.2/7.9 116.9 −63.3ZP13 128.6–145.8 320/39 14/24 0/14 158.0 −33.8 177.2 −19.7 86.4/82.5 4.3/4.4 97.3 −71.7ZP14 147.6–163.7 295/44 8/18 0/8 161.5 −41.3 175.4 −11.9 69.9/68.3 6.7/6.7 100.4 −67.3Sub-mean 14/14 0/14 163.7 −41.2 177.0 −19.6 140.0/128.2 3.4/3.5 277.8 71.6
K=249.8 A95=2.5
Zongpuxi profile (lower part of the section A), Member I of the Zongpu Formation, GambaZP15 166.4–169.5 307/38 10/10 0/10 165.9 −40.8 179.8 −12.9 72.8/72.8 5.7/5.7 89.0 −68.2ZP16 170.8–175.3 302/41 9/10 0/9 170.2 −35.9 179.2 −2.6 424.8/175.2 2.5/3.9 90.3 −63.0ZP17 177.6–182.1 307/38 10/12 0/10 162.8 −38.9 176.7 −12.4 139.7/139.7 4.1/4.1 97.2 −67.8ZP18 183.4–189.3 307/38 8/9 0/8 157.7 −36.2 171.8 −12.2 365.6/341.7 2.9/3.0 109.4 −66.5ZP19 191.1–194.9 307/38 9/9 0/9 165.4 −43.3 180.7 −15.2 230.1/230.1 3.4/3.4 86.5 −69.4ZP20 197.0–202.6 307/38 10/12 0/10 162.9 −44.7 179.9 −17.3 583.8/583.8 2.0/2.0 88.8 −70.6ZP21 204.9–212.1 307/38 13/15 0/13 157.6 −46.1 177.4 −20.5 124.5/124.3 3.7/3.7 96.9 −72.1ZP22 215.1–227.6 299/40 8/10 0/8 168.8 −45.4 181.4 −11.5 52.7/54.1 7.7/7.6 84.9 −67.5ZP23 232.6–246.5 299/40 8/13 0/8 160.8 −44.2 175.7 −13.1 27.7/27.7 10.7/10.7 99.9 −68.0ZP24 248.6–256.3 299/40 8/12 0/8 162.3 −36.3 172.8 −5.6 54.1/54.1 7.6/7.6 104.9 −63.6ZP25 257.8–263.8 299/40 9/13 0/9 162.8 −38.9 174.5 −7.7 74.6/74.6 6.0/6.0 101.6 −65.0ZP26 271.8–274.4 299/40 9/10 0/9 189.6 −60.8 198.9 −21.9 61.8/60.0 6.6/6.7 38.5 −65.5ZP27 276.7–283.0 294/38 9/12 0/9 186.8 −50.5 193.6 −13.2 116/126.2 4.8/4.6 55.2 −64.8ZP28 285.1–288.2 289/36 8/9 0/8 181.3 −42.9 186.0 −8.1 65.4/65.4 6.9/6.9 74.2 −65.1ZP29 289.8–295.0 287/41 10/12 0/10 175.6 −52.6 183.8 −13.2 127.1/127.1 4.3/4.3 78.3 −68.1ZP30 296.5–302.8 284/40 10/13 0/10 187.9 −52.3 190.2 −12.3 20.6/20.2 10.9/11.0 63.0 −65.9ZP31 304.5–321.4 290/42 12/32 0/12 173.4 −47.0 180.0 −6.6 13.2/13.2 12.4/12.4 88.5 −65.0ZP32* 324.9–340.6 289/42 No meaningful interval-mean direction could be isolatedZP33 342.3–356.4 282/44 11/34 4/7 169.1 −32.9 173.3 7.7 69.9/81.1 5.5/5.1 100.9 −57.2Sub-mean 18/19 0/18 169.2 −44.3 180.8 −11.1 66.4/68.3 4.3/4.2 266.3 67.3
K=101.1 A95=3.5
Tukson profile (section C), Member I of the Zongpu Formation, Tukson; used for fold test onlyXG277 86/37 7/10 0/7 191.8 25.1 190.5 −10.8 23.5/23.5 12.7/12.7XG278 75/39 No meaningful site-mean direction could be isolatedXG279 77/36 9/11 0/9 209.6 38.8 199.3 9.8 33.7/33.7 9.0/9.0XG280 67/39 7/10 0/7 202.7 25.6 197.3 −3.5 12.3/12.3 17.9/17.9XG281 86/47 6/11 0/6 210.1 32.3 204.6 −8.5 78.7/78.7 7.6/7.6XG282 89/41 6/11 0/6 205.8 21.4 204.8 −15.6 18.1/18.1 16.2/16.2XG283 66/37 No meaningful site-mean direction could be isolatedXG284 72/47 No meaningful site-mean direction could be isolatedSub-mean 5/8 0/5 203.8 28.8 199.3 −5.8 72.7/51.4 9.0/10.8Group-mean for Member I 23/24 0/23 177.8 −31.3 184.8 −10.1 5.9/40.8 13.7/4.8Jidula profile (section B), upper part of the Jidula Formation, GambaXG173-200 366.0–430.2 56/35 20/84 5/15 198.8 −28.3 200.4 4.1 17.4/20.3 8.1/7.4 232.3 53.9
dp/dm=3.7/7.4
Abbreviations are: site ID, Site identification; Depth, vertical distance between grouped site and upper boundary of the Zongpu Formation; Strike/dip, strike azimuth and dip of bed;n/n0, number of samples or sites demagnetized or used to calculate or yield well-defined ChRMs; N/R, samples or sites showing normal/reversed polarity; Dg and Ig, κg, α95g (Ds andIs, κs, α95s), declination and inclination of direction, precision parameter, 95% confidence limit of Fisher statistics in-situ (after tilt adjustment). Plong and Plat are longitude andlatitude of corresponding virtual geomagnetic pole (VGP) in stratigraphic coordinates.
158 Z. Yi et al. / Earth and Planetary Science Letters 309 (2011) 153–165
In addition, five out of eight sampled sites from section C, whichhave contrasting tectonic orientation from sections A and B and werecollected specifically for the purpose of applying a fold test, also yieldstable ChRMs following removal of a viscous overprint. Demagneti-zation characteristics of these specimens are often similar tolimestone specimens from the Zongpu Formation in section A; thesespecimens show only reversed polarity. The overall group-meandirection of the total of 23 sites from Member I of the ZongpuFormation (both sections A and C) is D=177.8°, I=−31.3° withα95=13.7° before and D=184.8°, I=−10.1° with α95=4.8° aftertilt correction. The data grouping is significantly improved by tilt
adjustment with ks/kg=6.9 (Fig. 4a–b). Application of McFadden's(1990) fold test indicates a positive result at 95% confidence level withthe ξ2 equal to 19.269 before and 5.257 after tilt correction; the criticalvalue is 5.583 at this confidence level. Further analysis using theWatson and Enkin's (1993) test presents an optimal concentration at105.9% unfolding with 95% uncertainty ranging from 99.4 to 112.7%unfolding (Fig. 4c) and is strongly indicative of a pre-folding origin forthe ChRM. Therefore, the ChRM has both positive fold and reversaltest results strongly supporting the interpretation that the stableChRMs resolved either by AF treatment between 20 and 89 mT(Zongpu Formation) or by thermal demagnetization between 500–
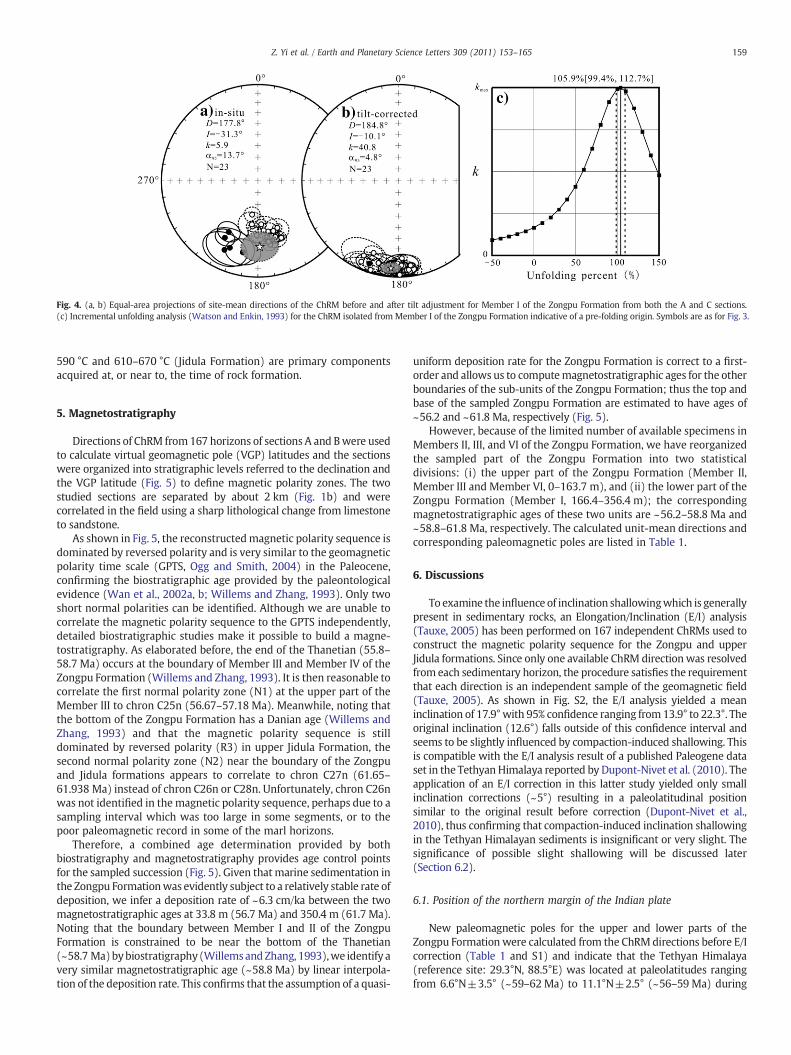
Fig. 4. (a, b) Equal-area projections of site-mean directions of the ChRM before and after tilt adjustment for Member I of the Zongpu Formation from both the A and C sections.(c) Incremental unfolding analysis (Watson and Enkin, 1993) for the ChRM isolated from Member I of the Zongpu Formation indicative of a pre-folding origin. Symbols are as for Fig. 3.
159Z. Yi et al. / Earth and Planetary Science Letters 309 (2011) 153–165
590 °C and 610–670 °C (Jidula Formation) are primary componentsacquired at, or near to, the time of rock formation.
5. Magnetostratigraphy
Directions of ChRM from167 horizons of sections A and Bwere usedto calculate virtual geomagnetic pole (VGP) latitudes and the sectionswere organized into stratigraphic levels referred to the declination andthe VGP latitude (Fig. 5) to define magnetic polarity zones. The twostudied sections are separated by about 2 km (Fig. 1b) and werecorrelated in the field using a sharp lithological change from limestoneto sandstone.
As shown in Fig. 5, the reconstructedmagnetic polarity sequence isdominated by reversed polarity and is very similar to the geomagneticpolarity time scale (GPTS, Ogg and Smith, 2004) in the Paleocene,confirming the biostratigraphic age provided by the paleontologicalevidence (Wan et al., 2002a, b; Willems and Zhang, 1993). Only twoshort normal polarities can be identified. Although we are unable tocorrelate the magnetic polarity sequence to the GPTS independently,detailed biostratigraphic studies make it possible to build a magne-tostratigraphy. As elaborated before, the end of the Thanetian (55.8–58.7 Ma) occurs at the boundary of Member III and Member IV of theZongpu Formation (Willems and Zhang, 1993). It is then reasonable tocorrelate the first normal polarity zone (N1) at the upper part of theMember III to chron C25n (56.67–57.18 Ma). Meanwhile, noting thatthe bottom of the Zongpu Formation has a Danian age (Willems andZhang, 1993) and that the magnetic polarity sequence is stilldominated by reversed polarity (R3) in upper Jidula Formation, thesecond normal polarity zone (N2) near the boundary of the Zongpuand Jidula formations appears to correlate to chron C27n (61.65–61.938 Ma) instead of chron C26n or C28n. Unfortunately, chron C26nwas not identified in the magnetic polarity sequence, perhaps due to asampling interval which was too large in some segments, or to thepoor paleomagnetic record in some of the marl horizons.
Therefore, a combined age determination provided by bothbiostratigraphy and magnetostratigraphy provides age control pointsfor the sampled succession (Fig. 5). Given that marine sedimentation inthe Zongpu Formationwas evidently subject to a relatively stable rate ofdeposition, we infer a deposition rate of ~6.3 cm/ka between the twomagnetostratigraphic ages at 33.8 m (56.7 Ma) and 350.4 m (61.7 Ma).Noting that the boundary between Member I and II of the ZongpuFormation is constrained to be near the bottom of the Thanetian(~58.7 Ma)bybiostratigraphy(WillemsandZhang, 1993),we identify avery similar magnetostratigraphic age (~58.8 Ma) by linear interpola-tion of the deposition rate. This confirms that the assumption of a quasi-
uniform deposition rate for the Zongpu Formation is correct to a first-order and allows us to computemagnetostratigraphic ages for the otherboundaries of the sub-units of the Zongpu Formation; thus the top andbase of the sampled Zongpu Formation are estimated to have ages of~56.2 and ~61.8 Ma, respectively (Fig. 5).
However, because of the limited number of available specimens inMembers II, III, and VI of the Zongpu Formation, we have reorganizedthe sampled part of the Zongpu Formation into two statisticaldivisions: (i) the upper part of the Zongpu Formation (Member II,Member III and Member VI, 0–163.7 m), and (ii) the lower part of theZongpu Formation (Member I, 166.4–356.4 m); the correspondingmagnetostratigraphic ages of these two units are ~56.2–58.8 Ma and~58.8–61.8 Ma, respectively. The calculated unit-mean directions andcorresponding paleomagnetic poles are listed in Table 1.
6. Discussions
To examine the influence of inclination shallowingwhich is generallypresent in sedimentary rocks, an Elongation/Inclination (E/I) analysis(Tauxe, 2005) has been performed on 167 independent ChRMs used toconstruct the magnetic polarity sequence for the Zongpu and upperJidula formations. Since only one available ChRM directionwas resolvedfrom each sedimentary horizon, the procedure satisfies the requirementthat each direction is an independent sample of the geomagnetic field(Tauxe, 2005). As shown in Fig. S2, the E/I analysis yielded a meaninclination of 17.9° with 95% confidence ranging from 13.9° to 22.3°. Theoriginal inclination (12.6°) falls outside of this confidence interval andseems to be slightly influenced by compaction-induced shallowing. Thisis compatible with the E/I analysis result of a published Paleogene dataset in the Tethyan Himalaya reported by Dupont-Nivet et al. (2010). Theapplication of an E/I correction in this latter study yielded only smallinclination corrections (~5°) resulting in a paleolatitudinal positionsimilar to the original result before correction (Dupont-Nivet et al.,2010), thus confirming that compaction-induced inclination shallowingin the Tethyan Himalayan sediments is insignificant or very slight. Thesignificance of possible slight shallowing will be discussed later(Section 6.2).
6.1. Position of the northern margin of the Indian plate
New paleomagnetic poles for the upper and lower parts of theZongpu Formation were calculated from the ChRMdirections before E/Icorrection (Table 1 and S1) and indicate that the Tethyan Himalaya(reference site: 29.3°N, 88.5°E) was located at paleolatitudes rangingfrom 6.6°N±3.5° (~59–62 Ma) to 11.1°N±2.5° (~56–59 Ma) during
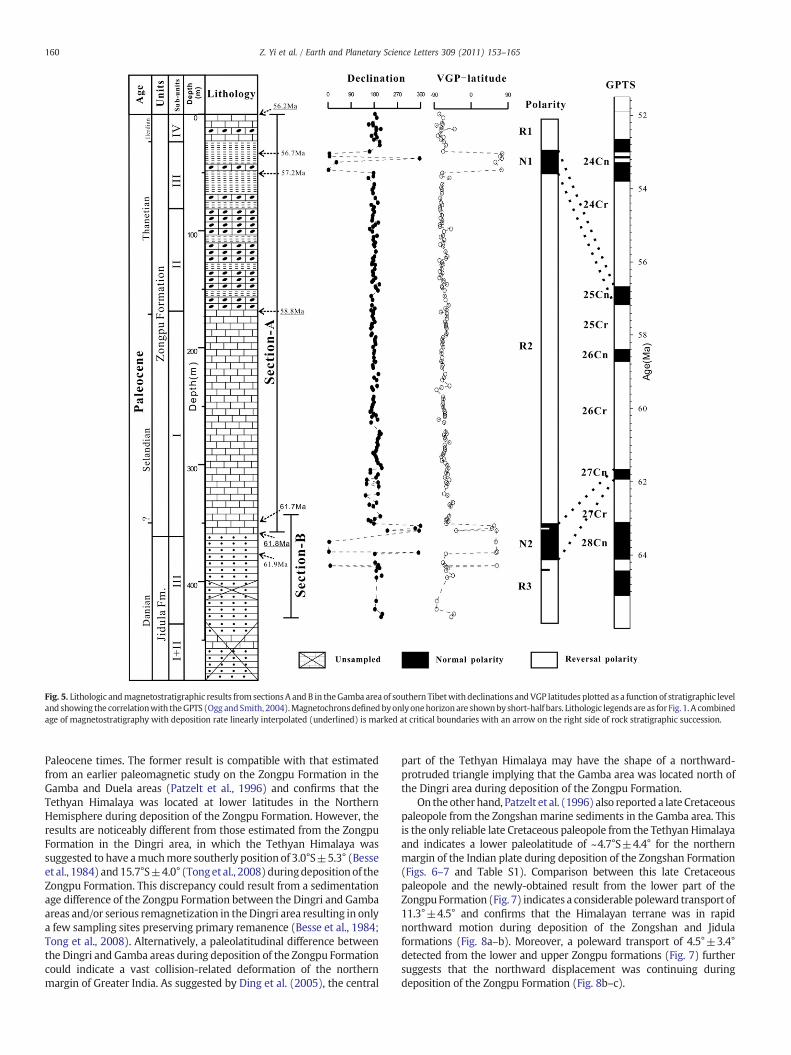
Fig. 5. Lithologic andmagnetostratigraphic results from sectionsA and B in theGamba area of southern Tibetwith declinations andVGP latitudes plotted as a function of stratigraphic leveland showing the correlationwith theGPTS (Ogg andSmith, 2004).Magnetochronsdefinedbyonlyonehorizonare shownbyshort-half bars. Lithologic legends are as for Fig. 1. A combinedage of magnetostratigraphy with deposition rate linearly interpolated (underlined) is marked at critical boundaries with an arrow on the right side of rock stratigraphic succession.
160 Z. Yi et al. / Earth and Planetary Science Letters 309 (2011) 153–165
Paleocene times. The former result is compatible with that estimatedfrom an earlier paleomagnetic study on the Zongpu Formation in theGamba and Duela areas (Patzelt et al., 1996) and confirms that theTethyan Himalaya was located at lower latitudes in the NorthernHemisphere during deposition of the Zongpu Formation. However, theresults are noticeably different from those estimated from the ZongpuFormation in the Dingri area, in which the Tethyan Himalaya wassuggested to have amuchmore southerly position of 3.0°S±5.3° (Besseet al., 1984) and15.7°S±4.0° (Tonget al., 2008)duringdepositionof theZongpu Formation. This discrepancy could result from a sedimentationage difference of the Zongpu Formation between the Dingri and Gambaareas and/or serious remagnetization in theDingri area resulting in onlya few sampling sites preserving primary remanence (Besse et al., 1984;Tong et al., 2008). Alternatively, a paleolatitudinal difference betweenthe Dingri and Gamba areas during deposition of the Zongpu Formationcould indicate a vast collision-related deformation of the northernmargin of Greater India. As suggested by Ding et al. (2005), the central
part of the Tethyan Himalaya may have the shape of a northward-protruded triangle implying that the Gamba area was located north ofthe Dingri area during deposition of the Zongpu Formation.
On theother hand, Patzelt et al. (1996) also reported a late Cretaceouspaleopole from the Zongshanmarine sediments in the Gamba area. Thisis the only reliable late Cretaceous paleopole from the Tethyan Himalayaand indicates a lower paleolatitude of ~4.7°S±4.4° for the northernmargin of the Indian plate during deposition of the Zongshan Formation(Figs. 6–7 and Table S1). Comparison between this late Cretaceouspaleopole and the newly-obtained result from the lower part of theZongpuFormation (Fig. 7) indicates a considerable poleward transport of11.3°±4.5° and confirms that the Himalayan terrane was in rapidnorthward motion during deposition of the Zongshan and Jidulaformations (Fig. 8a–b). Moreover, a poleward transport of 4.5°±3.4°detected from the lower and upper Zongpu formations (Fig. 7) furthersuggests that the northward displacement was continuing duringdeposition of the Zongpu Formation (Fig. 8b–c).
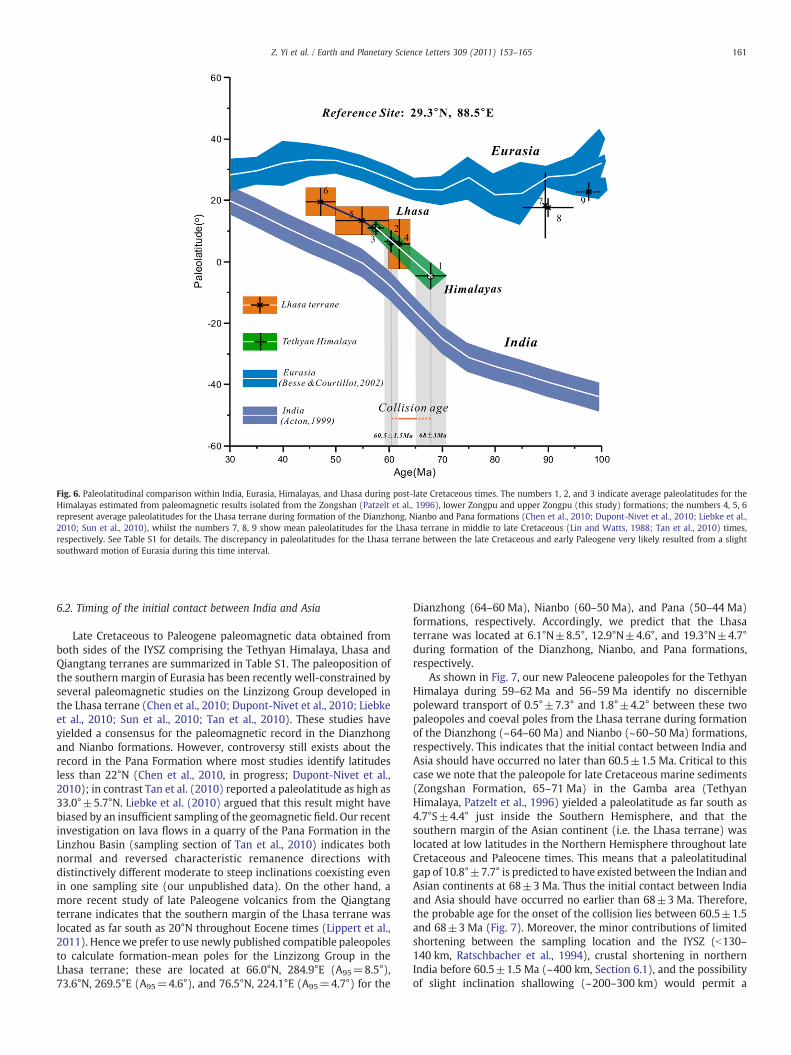
Fig. 6. Paleolatitudinal comparison within India, Eurasia, Himalayas, and Lhasa during post-late Cretaceous times. The numbers 1, 2, and 3 indicate average paleolatitudes for theHimalayas estimated from paleomagnetic results isolated from the Zongshan (Patzelt et al., 1996), lower Zongpu and upper Zongpu (this study) formations; the numbers 4, 5, 6represent average paleolatitudes for the Lhasa terrane during formation of the Dianzhong, Nianbo and Pana formations (Chen et al., 2010; Dupont-Nivet et al., 2010; Liebke et al.,2010; Sun et al., 2010), whilst the numbers 7, 8, 9 show mean paleolatitudes for the Lhasa terrane in middle to late Cretaceous (Lin and Watts, 1988; Tan et al., 2010) times,respectively. See Table S1 for details. The discrepancy in paleolatitudes for the Lhasa terrane between the late Cretaceous and early Paleogene very likely resulted from a slightsouthward motion of Eurasia during this time interval.
161Z. Yi et al. / Earth and Planetary Science Letters 309 (2011) 153–165
6.2. Timing of the initial contact between India and Asia
Late Cretaceous to Paleogene paleomagnetic data obtained fromboth sides of the IYSZ comprising the Tethyan Himalaya, Lhasa andQiangtang terranes are summarized in Table S1. The paleoposition ofthe southern margin of Eurasia has been recently well-constrained byseveral paleomagnetic studies on the Linzizong Group developed inthe Lhasa terrane (Chen et al., 2010; Dupont-Nivet et al., 2010; Liebkeet al., 2010; Sun et al., 2010; Tan et al., 2010). These studies haveyielded a consensus for the paleomagnetic record in the Dianzhongand Nianbo formations. However, controversy still exists about therecord in the Pana Formation where most studies identify latitudesless than 22°N (Chen et al., 2010, in progress; Dupont-Nivet et al.,2010); in contrast Tan et al. (2010) reported a paleolatitude as high as33.0°±5.7°N. Liebke et al. (2010) argued that this result might havebiased by an insufficient sampling of the geomagnetic field. Our recentinvestigation on lava flows in a quarry of the Pana Formation in theLinzhou Basin (sampling section of Tan et al., 2010) indicates bothnormal and reversed characteristic remanence directions withdistinctively different moderate to steep inclinations coexisting evenin one sampling site (our unpublished data). On the other hand, amore recent study of late Paleogene volcanics from the Qiangtangterrane indicates that the southern margin of the Lhasa terrane waslocated as far south as 20°N throughout Eocene times (Lippert et al.,2011). Hencewe prefer to use newly published compatible paleopolesto calculate formation-mean poles for the Linzizong Group in theLhasa terrane; these are located at 66.0°N, 284.9°E (A95=8.5°),73.6°N, 269.5°E (A95=4.6°), and 76.5°N, 224.1°E (A95=4.7°) for the
Dianzhong (64–60 Ma), Nianbo (60–50 Ma), and Pana (50–44 Ma)formations, respectively. Accordingly, we predict that the Lhasaterrane was located at 6.1°N±8.5°, 12.9°N±4.6°, and 19.3°N±4.7°during formation of the Dianzhong, Nianbo, and Pana formations,respectively.
As shown in Fig. 7, our new Paleocene paleopoles for the TethyanHimalaya during 59–62 Ma and 56–59 Ma identify no discerniblepoleward transport of 0.5°±7.3° and 1.8°±4.2° between these twopaleopoles and coeval poles from the Lhasa terrane during formationof the Dianzhong (~64–60 Ma) and Nianbo (~60–50 Ma) formations,respectively. This indicates that the initial contact between India andAsia should have occurred no later than 60.5±1.5 Ma. Critical to thiscase we note that the paleopole for late Cretaceous marine sediments(Zongshan Formation, 65–71 Ma) in the Gamba area (TethyanHimalaya, Patzelt et al., 1996) yielded a paleolatitude as far south as4.7°S±4.4° just inside the Southern Hemisphere, and that thesouthern margin of the Asian continent (i.e. the Lhasa terrane) waslocated at low latitudes in the Northern Hemisphere throughout lateCretaceous and Paleocene times. This means that a paleolatitudinalgap of 10.8°±7.7° is predicted to have existed between the Indian andAsian continents at 68±3 Ma. Thus the initial contact between Indiaand Asia should have occurred no earlier than 68±3 Ma. Therefore,the probable age for the onset of the collision lies between 60.5±1.5and 68±3 Ma (Fig. 7). Moreover, the minor contributions of limitedshortening between the sampling location and the IYSZ (b130–140 km, Ratschbacher et al., 1994), crustal shortening in northernIndia before 60.5±1.5 Ma (~400 km, Section 6.1), and the possibilityof slight inclination shallowing (~200–300 km) would permit a
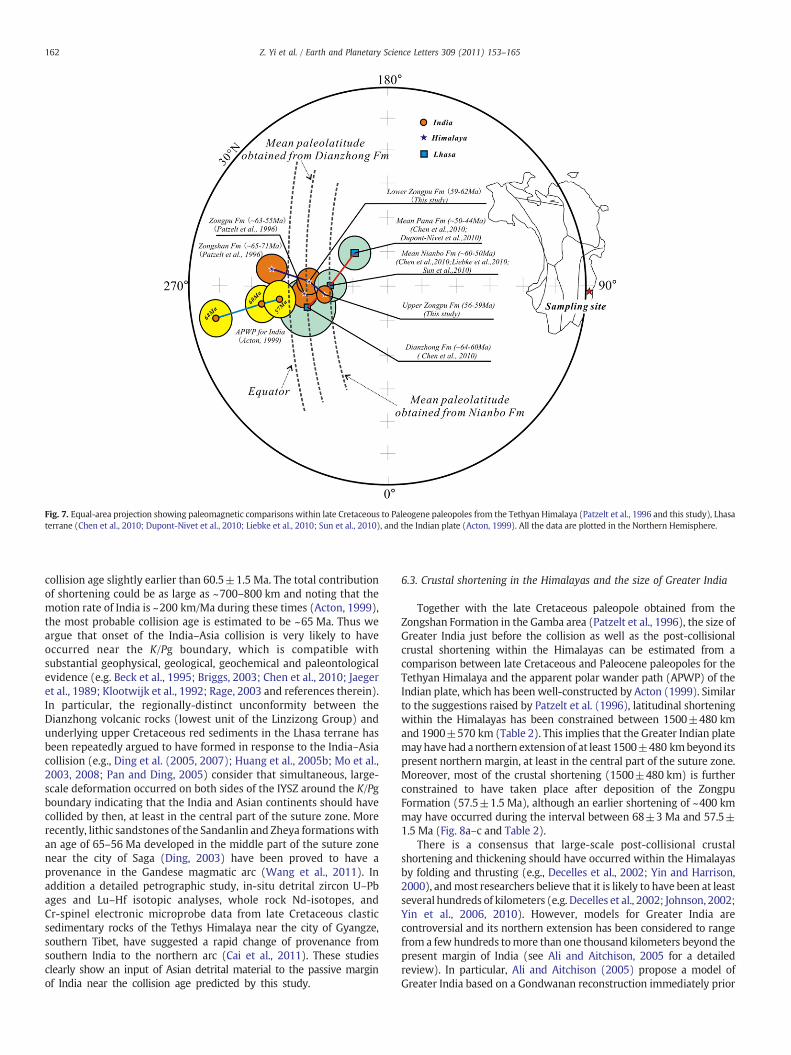
Fig. 7. Equal-area projection showing paleomagnetic comparisons within late Cretaceous to Paleogene paleopoles from the Tethyan Himalaya (Patzelt et al., 1996 and this study), Lhasaterrane (Chen et al., 2010; Dupont-Nivet et al., 2010; Liebke et al., 2010; Sun et al., 2010), and the Indian plate (Acton, 1999). All the data are plotted in the Northern Hemisphere.
162 Z. Yi et al. / Earth and Planetary Science Letters 309 (2011) 153–165
collision age slightly earlier than 60.5±1.5 Ma. The total contributionof shortening could be as large as ~700–800 km and noting that themotion rate of India is ~200 km/Ma during these times (Acton, 1999),the most probable collision age is estimated to be ~65 Ma. Thus weargue that onset of the India–Asia collision is very likely to haveoccurred near the K/Pg boundary, which is compatible withsubstantial geophysical, geological, geochemical and paleontologicalevidence (e.g. Beck et al., 1995; Briggs, 2003; Chen et al., 2010; Jaegeret al., 1989; Klootwijk et al., 1992; Rage, 2003 and references therein).In particular, the regionally-distinct unconformity between theDianzhong volcanic rocks (lowest unit of the Linzizong Group) andunderlying upper Cretaceous red sediments in the Lhasa terrane hasbeen repeatedly argued to have formed in response to the India–Asiacollision (e.g., Ding et al. (2005, 2007); Huang et al., 2005b; Mo et al.,2003, 2008; Pan and Ding, 2005) consider that simultaneous, large-scale deformation occurred on both sides of the IYSZ around the K/Pgboundary indicating that the India and Asian continents should havecollided by then, at least in the central part of the suture zone. Morerecently, lithic sandstones of the Sandanlin and Zheya formations withan age of 65–56 Ma developed in the middle part of the suture zonenear the city of Saga (Ding, 2003) have been proved to have aprovenance in the Gandese magmatic arc (Wang et al., 2011). Inaddition a detailed petrographic study, in-situ detrital zircon U–Pbages and Lu–Hf isotopic analyses, whole rock Nd-isotopes, andCr-spinel electronic microprobe data from late Cretaceous clasticsedimentary rocks of the Tethys Himalaya near the city of Gyangze,southern Tibet, have suggested a rapid change of provenance fromsouthern India to the northern arc (Cai et al., 2011). These studiesclearly show an input of Asian detrital material to the passive marginof India near the collision age predicted by this study.
6.3. Crustal shortening in the Himalayas and the size of Greater India
Together with the late Cretaceous paleopole obtained from theZongshan Formation in the Gamba area (Patzelt et al., 1996), the size ofGreater India just before the collision as well as the post-collisionalcrustal shortening within the Himalayas can be estimated from acomparison between late Cretaceous and Paleocene paleopoles for theTethyan Himalaya and the apparent polar wander path (APWP) of theIndian plate, which has been well-constructed by Acton (1999). Similarto the suggestions raised by Patzelt et al. (1996), latitudinal shorteningwithin the Himalayas has been constrained between 1500±480 kmand 1900±570 km (Table 2). This implies that the Greater Indian platemayhavehad a northern extensionof at least 1500±480 kmbeyond itspresent northern margin, at least in the central part of the suture zone.Moreover, most of the crustal shortening (1500±480 km) is furtherconstrained to have taken place after deposition of the ZongpuFormation (57.5±1.5 Ma), although an earlier shortening of ~400 kmmay have occurred during the interval between 68±3 Ma and 57.5±1.5 Ma (Fig. 8a–c and Table 2).
There is a consensus that large-scale post-collisional crustalshortening and thickening should have occurred within the Himalayasby folding and thrusting (e.g., Decelles et al., 2002; Yin and Harrison,2000), andmost researchers believe that it is likely to have been at leastseveral hundreds of kilometers (e.g. Decelles et al., 2002; Johnson, 2002;Yin et al., 2006, 2010). However, models for Greater India arecontroversial and its northern extension has been considered to rangefrom a few hundreds tomore than one thousand kilometers beyond thepresent margin of India (see Ali and Aitchison, 2005 for a detailedreview). In particular, Ali and Aitchison (2005) propose a model ofGreater India based on a Gondwanan reconstruction immediately prior
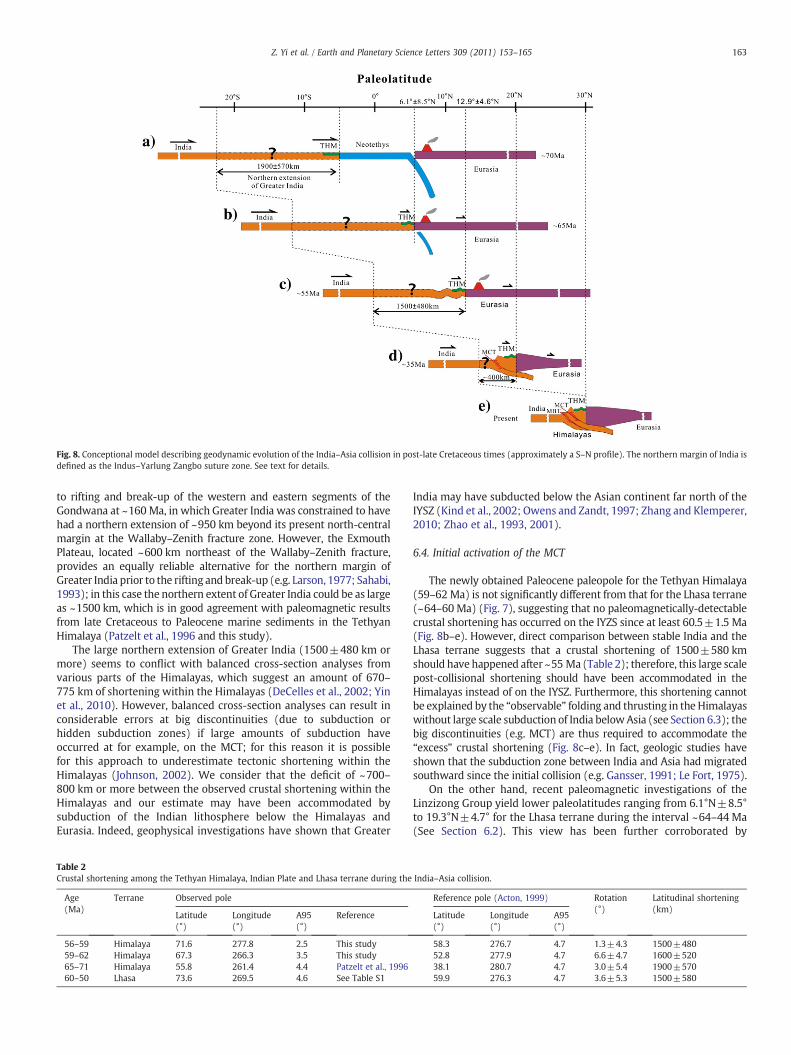
Fig. 8. Conceptional model describing geodynamic evolution of the India–Asia collision in post-late Cretaceous times (approximately a S–N profile). The northern margin of India isdefined as the Indus–Yarlung Zangbo suture zone. See text for details.
163Z. Yi et al. / Earth and Planetary Science Letters 309 (2011) 153–165
to rifting and break-up of the western and eastern segments of theGondwana at ~160 Ma, in which Greater India was constrained to havehad a northern extension of ~950 km beyond its present north-centralmargin at the Wallaby–Zenith fracture zone. However, the ExmouthPlateau, located ~600 km northeast of the Wallaby–Zenith fracture,provides an equally reliable alternative for the northern margin ofGreater India prior to the rifting and break-up (e.g. Larson, 1977; Sahabi,1993); in this case the northern extent of Greater India could be as largeas ~1500 km, which is in good agreement with paleomagnetic resultsfrom late Cretaceous to Paleocene marine sediments in the TethyanHimalaya (Patzelt et al., 1996 and this study).
The large northern extension of Greater India (1500±480 km ormore) seems to conflict with balanced cross-section analyses fromvarious parts of the Himalayas, which suggest an amount of 670–775 km of shortening within the Himalayas (DeCelles et al., 2002; Yinet al., 2010). However, balanced cross-section analyses can result inconsiderable errors at big discontinuities (due to subduction orhidden subduction zones) if large amounts of subduction haveoccurred at for example, on the MCT; for this reason it is possiblefor this approach to underestimate tectonic shortening within theHimalayas (Johnson, 2002). We consider that the deficit of ~700–800 km or more between the observed crustal shortening within theHimalayas and our estimate may have been accommodated bysubduction of the Indian lithosphere below the Himalayas andEurasia. Indeed, geophysical investigations have shown that Greater
Table 2Crustal shortening among the Tethyan Himalaya, Indian Plate and Lhasa terrane during the
Age(Ma)
Terrane Observed pole
Latitude(°)
Longitude(°)
A95(°)
Reference
56–59 Himalaya 71.6 277.8 2.5 This study59–62 Himalaya 67.3 266.3 3.5 This study65–71 Himalaya 55.8 261.4 4.4 Patzelt et al., 199660–50 Lhasa 73.6 269.5 4.6 See Table S1
India may have subducted below the Asian continent far north of theIYSZ (Kind et al., 2002; Owens and Zandt, 1997; Zhang and Klemperer,2010; Zhao et al., 1993, 2001).
6.4. Initial activation of the MCT
The newly obtained Paleocene paleopole for the Tethyan Himalaya(59–62 Ma) is not significantly different from that for the Lhasa terrane(~64–60 Ma) (Fig. 7), suggesting that no paleomagnetically-detectablecrustal shortening has occurred on the IYZS since at least 60.5±1.5 Ma(Fig. 8b–e). However, direct comparison between stable India and theLhasa terrane suggests that a crustal shortening of 1500±580 kmshould have happened after ~55 Ma (Table 2); therefore, this large scalepost-collisional shortening should have been accommodated in theHimalayas instead of on the IYSZ. Furthermore, this shortening cannotbe explained by the “observable” folding and thrusting in the Himalayaswithout large scale subduction of India belowAsia (see Section 6.3); thebig discontinuities (e.g. MCT) are thus required to accommodate the“excess” crustal shortening (Fig. 8c–e). In fact, geologic studies haveshown that the subduction zone between India and Asia had migratedsouthward since the initial collision (e.g. Gansser, 1991; Le Fort, 1975).
On the other hand, recent paleomagnetic investigations of theLinzizong Group yield lower paleolatitudes ranging from 6.1°N±8.5°to 19.3°N±4.7° for the Lhasa terrane during the interval ~64–44 Ma(See Section 6.2). This view has been further corroborated by
India–Asia collision.
Reference pole (Acton, 1999) Rotation(°)
Latitudinal shortening(km)
Latitude(°)
Longitude(°)
A95(°)
58.3 276.7 4.7 1.3±4.3 1500±48052.8 277.9 4.7 6.6±4.7 1600±52038.1 280.7 4.7 3.0±5.4 1900±57059.9 276.3 4.7 3.6±5.3 1500±580
164 Z. Yi et al. / Earth and Planetary Science Letters 309 (2011) 153–165
paleomagnetic study of ~30–40 Ma volcanic rocks from central Tibet(Lippert et al., 2011); this suggests that the Lhasa terrane was sited asfar south as 20°N throughout Eocene times. However, in the light ofthe APWP of India (Acton, 1999), the current northernmargin of Indiamay have been at 16°N±4.7° during the latest Eocene (~35 Ma). Thisindicates that ~1100 km or more of tectonic shortening should havebeen absorbed by this time taking into account the 1500±480 kmnorthern extension of Greater India. Such a large scale crustalshortening can hardly have been absorbed by the Himalayas withoutsubduction of India below Asia (see Section 6.3); thus the initiation oflarge scale subduction of India below Asia as well as activation of theMCT is very likely to have occurred as early as ~35 Ma (Fig. 8d). Thisview is compatible with new Zircon SHRIMP U–Pb dating of theYalaxaingbo granite in the Tethyan Himalaya which indicates that theemplacement of the Yalaxaingbo pluton, as well as activation of theMCT, occurred as early as ~45–35 Ma (Qi et al., 2008; Xu et al., 2011;Zeng et al., 2009).
7. Conclusions
In the light of paleontological constraints on the Zongpu marinesediments in the Tethyan Himalaya, magnetostratigraphic investiga-tions date the Zongpu Formation in the Gamba area at ~56.2–61.8 Ma.Further paleomagnetic analysis has yielded two paleomagnetic poles,at 71.6°N, 277.8°E with A95=2.5° and 67.3°N, 266.3°E with A95=3.5°for the upper (~56–59 Ma) and lower (~59–62 Ma) parts of thisformation respectively. The available paleomagnetic constraints onthe kinematics of the terranes at both sides of the IYSZ, as well as aconceptional model for the India–Asia collision in its the early stages,are summarized in Fig. 8:
(1) The Tethyan Himalayan terrane, i.e. the northern margin ofGreater India, may still have been located as far south as 4.7°S±4.4° just south of the equator during late Cretaceous times andcontinued its fast northward transport during deposition of theZongshan Formation. The Lhasa terrane was located at lowlatitudes in the Northern Hemisphere during these times (Fig. 8a).
(2) Paleopoles from the lower Zongpu Formation (Member I, ~62–59 Ma) in the Tethyan Himalaya and the Dianzhong volcanics(~64–60 Ma) in the Lhasa terrane essentially overlap predictingno significant poleward transport of 0.5°±7.3° between themand suggesting that an initial contact between the TethyanHimalaya and Lhasa terranes should have been established priorto 60.5±1.5 Ma (Fig. 8b). We argue that onset of the India–Asiacollision most likely occurred near the K/Pg boundary, at least inthe central part of the IYSZ. This is in agreementwith a large bodyof geological and geochemical evidence.
(3) The poleward transport of 4.5°±3.4° for the Himalayan terraneduring deposition of the Zongpu Formation (~62–56 Ma)suggests that the Tethyan Himalaya continued its northwardmovement during this interval. Comparison between Paleocenepaleopoles from the Zongpu Formation in the Tethyan Himalayaand coeval ones for the Indian plate (Acton, 1999) suggests anorthern extension of Greater India of at least 1500±480 kmprior to onset of the India–Asia collision. The majority of thiscrustal shortening may have been absorbed by folding andthrusting within the Himalayas and subduction of India belowAsia after 57.5±1.5 Ma) (Fig. 8c–d).
(4) The Lhasa terrane was probably still located as far south as20°N throughout Eocene times (Lippert et al., 2011), however,the current leading edge of continental India may have arrivedat 16°N±4.7° by ~35 Ma, implying that considerable crustalshortening (~1100 km or more) should have occurred withinthe Himalayas as early as ~35 Ma and resulted in large scalesubduction of India below Asia as well as activating the MCT(Fig. 8d).
Nonetheless, all the conclusions above are based upon paleomag-netic studies carried out within limited areas in the central part of theTethyan Himalaya and Lhasa terranes. For a suture zone extending~2500 km in approximately an east–west direction, much morepaleomagnetic study is desirable to better understand the full historyof the India–Asia collision. In addition our interpretation of thenorthern extension of Greater India and the timing of onset of theIndia–Asia collision is undoubtedly based on the assumption that theTethyan Himalaya is a part of the passive margin of Greater India.Although this is favored by most researchers recent studies carriedout by Liu et al. (Li et al., 2010; Liu et al., 2010) suggest that theTethyan Himalaya could be a part of the Lhasa terrane or aninteroceanic arc within the Neo-Theyan Ocean. Hence more detailedinvestigations of the APW path of the Tethyan Himalaya duringCretaceous to Paleogene times is required to determine paleoposi-tions for the Tethyan Himalaya relative to India and the Lhasa terraneand could play an important part in accurately understanding theonset of the India–Asia collision.
Acknowledgments
We thank Zhonghai Zhuang and Bu Qiong for field assistance andacknowledge Drs. Wenjiao Xiao and John D.A. Piper for helpfuldiscussions and comments. We also appreciate Mark Harrison(Editor), Guillaume Dupont-Nivet and two anonymous reviewersfor insightful comments and suggestions. This work was supported bythe Key Items of Knowledge Innovation Programs of the ChineseAcademy of Sciences (KZCX2-YW-Q09-01) and the National NaturalScience Foundation of China (41072156).
Appendix A. Supplementary data
Supplementary data to this article can be found online at doi:10.1016/j.epsl.2011.07.001.
References
Acton, G.D., 1999. Apparent polar wander of India since the Cretaceous withimplications for regional tectonics and true polar wander. In: Radhakrishna, T., etal. (Ed.), The Indian Subcontinent and Gondwana: A Palaeomagnetic and RockMagnetic Perspective: Geol. Soc. India Mem., 44, pp. 129–175.
Aitchison, J.C., Ali, J.R., Davis, A.M., 2007. When and where did India and Asia collide?J. Geophys. Res. 112 (B05423), 1–12.
Aitchison, J.C., Zhu, B.D., Davis, A.M., Liu, J.B., Luo, H., Malpas, J.G., McDermid, I.R.C., Wu,H.Y., Ziabrev, S.V., Zhou, M.F., 2000. Remnants of a Cretaceous intra-oceanicsubduction system within the Yarlung–Zangbo suture (southern Tibet). EarthPlanet. Sci. Lett. 183, 231–244.
Aitchison, J.C., Davis, A.M., 2001. When did the India–Asia collision really happen?Gondwana Res. 4, 560–561.
Ali, J.R., Aitchison, J.C., 2005. Greater India. Earth Sci. Rev. 72, 169–188.Ali, J.R., Aitchison, J.C., 2008. Gondwana to Asia: Plate tectonics, paleogeography and the
biological connectivity of the Indian sub-continent from the Middle Jurassicthrough latest Eocene (166–35 Ma). Earth Sci. Rev. 88, 145–166.
Allègre, C.J., Courtillot, V., Tapponnier, P., et al., 1984. Structure and evolution of theHimalaya–Tibet orogenic belt. Nature 307, 17–22.
Appel, E., Muller, R., Widder, R.W., 1991. Paleomagnetic results from the Tibetansedimentary series of the Manang area (North central Nepal). Geophys. J. Int. 104,255–266.
Appel, E., Patzelt, A., Chouker, C., 1995. Secondary palaeoremanence of Tethyansediments from the Zanskar Range (NW Himalaya). Geophys. J. Int. 122, 227–242.
Beck, R.A., Burbank, D.W., Sercombe, W.J., et al., 1995. Stratigraphic evidence for anearly collision between northwest India and Asia. Nature 373, 55–58.
Besse, J., Courtillot, V., Pozzi, J.P., Westphal, M., Zhou, Y.X., 1984. Paleomagneticestimates of crustal shortening in the Himalayan thrusts and Zangbo suture. Nature311, 621–626.
Briggs, J.C., 2003. The biogeographic and tectonic history of India. J. Biogeogr. 30,381–388.
Brookfield,M.E., 1998. The evolution of the great river systems of southernAsia during theCenozoic India–Asia collision: rivers draining southwards. Geomorphology 22,285–312.
Cai, F.L., Ding, L., Yue, Y.H., 2011. Provenance analysis of upper Cretaceous strata in theTethys Himalaya, southern Tibet: implications for timing of India–Asia collision.Earth Planet. Sci. Lett. 305 (1–2), 195–206.
Chang, C.F., Chen, N.S., Coward, M.P., et al., 1986. Preliminary conclusions of the Royal-Society and Academia-Sinica 1985 geotraverse of Tibet. Nature 323, 501–507.
165Z. Yi et al. / Earth and Planetary Science Letters 309 (2011) 153–165
Chen, J.S., Huang, B.C., Sun, L.S., 2010. New constraints to the onset of the India–Asiacollision: paleomagnetic reconnaissance on the Linzizong Group in the Lhasa Block,China. Tectonophysics 489, 189–209.
Clark, M.K., Schoenbohm, L.M., Royden, L.H., Whipple, K.X., Burchfiel, B.C., Zhang, X.,Tang, W., Wang, E., Chen, L., 2004. Surface uplift, tectonics, and erosion of easternTibet from large-scale drainage patterns. Tectonics 23 2002TC001402.
DeCelles, P.G., Robinson, D.M., Zant, G., 2002. Implications of shortening in theHimalayan fold-thrust belt for uplift of the Tibetan Plateau. Tectonics 21 (6).
Dewey, J.F., Cande, S., Pitman, W.C., 1989. Tectonic evolution of the India EurasiaCollision Zone. Eclogae Geol. Helv. 82, 717–734.
Ding, L., 2003. Paleocene deep-water sediments and radiolarian fauna: implications forevolution of Yarlung Zangbo foreland basin, southern Tibet. Sci. China D 33, 47–58 (inChinese).
Ding, L., Kapp, P., Wan, X.Q., 2005. Paleocene–Eocene record of ophiolite obduction andinitial India–Asia collision, south central Tibet. Tectonics 24 (TC3001), 1–18.
Ding, L., Kapp, P., Yue, Y., Lai, Q., 2007. Postcollisional calc-alkaline lavas and xenoliths from987 the southern Qiangtang terrane, central Tibet. Earth Planet. Sci. Lett. 254, 28–38.
Ding, L., Kapp, P., Zhong, D.L., Deng, W.M., 2003. Cenozoic volcanism in Tibet: evidencefor a transition from oceanic to continental subduction. J. Petrol. 44, 1833–1865.
Dupont-Nivet, G., Lippert, P.C., van Hinsbergen, D.J.J., Meijers, M.J.M., Kapp, P., 2010.Palaeolatitude and age of the Indo-Asia collision: palaeomagnetic constraints.Geophys. J. Int. 182, 1189–1198.
Fisher, R.A., 1953. Dispersion on a sphere. Proc. R. Soc. Lond. A 217, 295–305.Gansser, A., 1964. The Geology of the Himalayas. Wiley, New York, NY. 289 pp.Gansser, A., 1991. Facts and theories on the Himalayas. Eclogae Geol. Helv. 84, 33–59.Hedberg, H.D., 1970. Continental margins from viewpoint of the petroleum geologist.
AAPG Bull. 54.Huang, B.C., Chen, J.S., Yi, Z.Y., 2010. Paleomagnetic discussion of when and where India
and Asia initially collided. Chin. J. Geophys. 53 (9), 2045–2058.Huang, Y.C., Yang, D.M., Zheng, C.Q., He, Z.H., Dai, L.N., Li, J.G., Zhang, Y.Y., 2005b. The
geochemical characteristics of the Pana volcanic rocks of the Linzizong Group in theZhaxue area, Linzhou County, Tibet and its geological implication. J. Jilin Univ.(Earth Sci. edition) 35 (5), 576–580 (in Chinese).
Jaeger, J.J., Courtillot, V., Tapponnier, P., 1989. Paleontological view of the ages of theDeccan Traps, the Cretaceous Tertiary/boundary, and the India–Asia collision.Geology 17, 316–319.
Johnson, M.R.W., 2002. Shortening budgets and the role of continental subductionduring the India–Asia collision. Earth Sci. Rev. 59, 101–123.
Kind, R., Yuan, X., Saul, J., Nelson, D., Sobolev, S.V., Mechie, J., Zhao, W., Kosarev, G., Ni, J.,Achauer, U., Jiang, M., 2002. Seismic images of crust and upper mantle beneathTibet: evidence for Eurasian plate subduction. Science 298, 1219–1221.
Kirschvink, J.L., 1980. The least-square line and plane and the analysis of paleomagneticdata. Geophys. J. R. Astron. Soc. 62, 699–718.
Klootwijk, C.T., Gee, J.S., Peirce, J.W., Smith, G.M., Mcfadden, P.L., 1992. An early India–Asia contact-paleomagnetic constraints from Ninetyeast Ridge, ODP Leg 121.Geology 20, 395–398.
Larson, R., 1977. Early Cretaceous break up of Gondwanaland of western Australia.Geology 5, 57–60.
Le Fort, P., 1975. Himalayas: the collided range. Present knowledge of the continentalarc. Am. J. Sci. 275A, 1–44.
Li, G.W., Liu, X.H., Pullen, A., Wei, L.J., Liu, X.B., Huang, F.X., Zhou, X.J., 2010. In-situdetrital zircon geochronology and Hf isotopic analyses from Upper Triassic Tethyssequence strata. Earth Planet. Sci. Lett. 297, 461–470.
Liebke, U., Appel, E., Ding, L., Neumann, U., Antolin, B., Xu, Q., 2010. Position of the Lhasaterrane prior to India–Asia collision derived from palaeomagnetic inclinations of53 Ma old dykes of the Linzhou Basin: constraints on the age of collision and post-collisional shortening within the Tibetan Plateau. Geophys. J. Int. 182, 1199–1215.
Lin, J., Watts, D.R., 1988. Palaeomagnetic results from the Tibetan Plateau. Phil. Trans. R.Soc. A 327, 239–262.
Lippert, P.C., Zhao, X.X., Coe, R.S., Lo, C.H., 2011. Palaeomagnetism and 40Ar/39Argeochronology of upper Palaeogene volcanic rocks from Central Tibet: implicationsfor the Central Asia inclination anomaly, the paleolatitude of Tibet and post-50 Mashortening within Asia. Geophys. J. Int. 184, 131–146.
Liu, X.H., Ju, Y.T., Wei, L.J., Li, G.W., 2010. An alternative tectonic model for the YarlungZangbo Suture. Sci. China (Ser. D) 53 (1), 448–463.
Lowrie, W., 1990. Identification of ferromagnetic minerals in a rock coercivity andunblocking temperature properties. Geophys. Res. Lett. 17, 159–162.
McFadden, P.L., McElhinny, M.W., 1988. The combined analysis of remagnetization circlesand direct observations in paleomagnetism. Earth Planet. Sci. Lett. 87, 161–172.
McFadden,P.L., 1990.Anewfold test forpaleomagnetic studies.Geophys. J. Int. 103, 163–169.McFadden, P.L., McElhinny, M.W., 1990. Classification of the reversal test in
palaeomagnetism. Geophys. J. Int. 103 (3), 725–729.Mo, X.X., Niu, Y.L., Dong, G.C., Zhao, Z.D., Hou, Z.Q., Su, Z., Ke, S., 2008. Contribution of
syncollisional felsic magmatism to continental crust growth: a case study of thePaleogene Linzizong volcanic succession in southern Tibet. Chem. Geol. 250, 49–67.
Mo, X.X., Zhao, Z.D., Deng, J.F., Dong, G.C., Zhou, S., Guo, T.Y., Zhang, S.Q., Wang, L.L.,2003. Response of volcanism to the India–Asia collision. Earth Sci. Front. 10,135–148 (in Chinese).
Molnar, P., England, P., Martinod, J., 1993. Mantle dynamics, uplift of the TibetanPlateau, and the Indian monsoon. Rev. Geophys. 31, 357–396.
Najman, Y., Appel, E., Boudagher-Fadel, M., et al., 2010. The timing of India–Asiacollision: geological, biostratigraphic and palaeomagnetic constraints. J. Geophys.Res. 46, 531–554.
Ogg, J., Smith, A.G., 2004. The geomagnetic polarity time scale. In: Gradstein, F.M., Ogg, J.G.,Smith, A.G. (Eds.), A Geological Time Scale. Cambridge University Press, Cambridge,Cambridge, pp. 63–86.
Owens, T.J., Zandt, G., 1997. Implications of crustal property variations for models ofTibetan plateau evolution. Nature 387, 37–43.
Pan, G.T., Ding, J., 2005. The Qinghai-Tibet Plateau and its adjacent area map 1:1500000.Chengdu Map Publishing House, Chengdu. China. (in Chinese).
Patriat, P., Achache, J., 1984. India Eurasia collision chronology has implications forcrustal shortening and driving mechanism of plates. Nature 311, 615–621.
Patzelt, A., Li, H., Wang, J., Appel, E., 1996. Palaeomagnetism of Cretaceous to Tertiarysediments from southern Tibet: evidence for the extent of the northern margin ofIndia prior to the collision with Eurasia. Tectonophysics 259, 259–284.
Qi, X.X., Zeng, L.S., Meng, X.J., Xu, Z.Q., Li, T.F., 2008. Zircon SHRIMP U–Pb dating for Dalagranite in the Tethyan Himalaya and its geological implication. Acta Petrol. Sin. 24(7), 1501–1508 (in Chinese).
Rage, J.C., 2003. Relationships of the Malagasy fauna during the late Cretaceous:northern or southern routes ? Acta Paleontol. Pol. 48, 661–662.
Ratschbacher, L., Frisch,W., Lui, G., Chen, C., 1994. Distributed deformation in southern Tibetduring and after the India–Asia collision. J. Geophys. Res. 99 (B10), 19,917–19,945.
Raymo, M.E., Ruddiman, W.F., 1992. Tectonic forcing of late Cenozoic climate. Nature359, 117–122.
Sahabi, M., 1993. Un modèl général de l'évolution de l'Océan Indien. Unpublished PhDthesis, Université Bretagne, Brest, p. 330.
Sun, Z., Jiang, W., Li, H., Pei, J., Zhu, Z., 2010. New paleomagnetic results of Paleocenevolcanic rocks from the Lhasa block: tectonic implications for the collision of Indiaand Asia. Tectonophysics 490, 257–266.
Tan, X., Gilder, S., Kodama, K.P., Jiang, W., Han, Y., Zhang, H., 2010. New paleomagneticresults from the Lhasa block: revised estimation of latitudinal shortening acrossTibet and implications for dating the India–Asia collision. Earth Planet. Sci. Lett.293, 396–404.
Tauxe, L., 2005. Inclination flattening and the geocentric axial dipole hypothesis. EarthPlanet. Sci. Lett. 233, 247–261.
Tong, Y., Yang, Z., Zheng, L., Yang, T., Shi, L., Sun, Z., Pei, J., 2008. Early Paleocenepaleomagnetic results from southern Tibet, and tectonic implications. Int. Geol. Rev.50, 546–562.
Wan, X.Q., 1985. Cretaceous strata and foraminifera from Gamba, Tibet. Contributionsto the geology of the Qinghai-Xizang (Tibet). Plateau 16, 203–228 (in Chinese).
Wan, X.Q., Zhao, W.J., Li, G.B., 2000. Restudy of the upper Cretaceous in Gamba, Tibet.Geoscience 14 (3), 281–285 (in Chinese).
Wan, X.Q., Jansa, L.F., Sarti,M., 2002a. Cretaceous andPaleogene boundary strata in southernTibet and their implication for the India–Eurasia collision. Lethaia 35, 131–146.
Wan, X.Q., Liang, D.Y., Li, G.B., 2002b. Paleocene strata in Gamba, Tibet and influence oftectonism. Acta Geol. Sin. 76 (2), 155–162 (in Chinese).
Wang, J.G., Hu, X.M., Luba, J.S., Huang, Z.C., 2011. Provenance of the upper Cretaceous–Eocene deep-water sandstones in Sangdanlin, southern Tibet: constraints on thetiming of initial India–Asia collision. J. Geol. 119 (3), 293–309.
Watson, G.S., Enkin, R.J., 1993. The fold test in paleomagnetism as a parameterestimation problem. Geophys. Res. Lett. 20, 2135–2137.
Wen, S.X., 1987a. Cretaceous system. Stratigraphy of the Mount Qomolangma Region.Science Press, Beijing, pp. 130–159 (in Chinese).
Wen, S.X., 1987b. Tertiary system. Stratigraphy of the Mount Qomolangma Region.Science Press, Beijing, pp. 160–180 (in Chinese).
Willems, H., Zhang, B.G., 1993. Cretaceous and lower Tertiary sediments of the TethysHimalaya in the area of Gamba (south Tibet, PR China). In: Willems, H. (Ed.),Geoscientific Investigations in the Tethyan Himalayas: Ber. Fachbereich Geowiss.Univ. Bremen, 38, pp. 3–27.
Xu, Z.Q., Yang, J.S., Li, H.B., Zhang, Z.M., Liu, Y., 2011. On the tectonics of the India–Asiacollision. Acta Geol. Sin. 85 (1), 1–33 (in Chinese).
Yin, A., Dubey, C.S., Kelty, T.K., Gehres, G.E., Chou, C.Y., Grove, M., Lovera, O., 2006.Structural evolution of the Arunachal Himalaya and implications for asymmetricdevelopment of the Himalayan orogen. Curr. Sci. 90, 195–206.
Yin, A., Dubey, C.S., Kelty, T.K., Webb, A.A.G., Harrison, T.M., Chou, C.Y., Célérier, J., 2010.Geologic correlation of the Himalayan orogen and Indian craton: part 2. Structuralgeology, geochronology, and tectonic evolution of the Eastern Himalaya. Geol. Soc.Am. Bull. 122 (3–4), 360–395.
Yin, A., Harrison, T.M., 2000. Geologic evolution of the Himalayan–Tibetan orogen.Annu. Rev. Earth Planet. Sci. Lett. 28, 211–280.
Zeng, L.S., Liu, J., Gao, L.E., Xie, K.J., Wen, L., 2009. Early Oligocene anatexis in the Yardoigneiss dome, southern Tibet and geological implications. Chin. Sci. Bull. 54 (1),104–112 (in Chinese).
Zhang, Z., Klemperer, S., 2010. Crustal structure of the Tethyan Himalaya, southern Tibet:new constraints from old wide-angle seismic data. Geophys. J. Int. 181, 1247–1260.
Zhao, W., Mechie, J., Brown, L.D., Guo, J., Haines, S., Hearn, T., Klemperer, S.L., Ma, Y.S.,Meissner, R., Nelson, K.D., Ni, J.F., Pananont, P., Rapine, R., Ross, A., Saul, J., 2001.Crustal structure of central Tibet as derived from project INDEPTH wide-angleseismic data. Geophys. J. Int. 145, 486–498.
Zhao, W., Nelson, K.D., Che, J., Quo, J., Lu, D., Wu, C., Liu, X., 1993. Deep seismic reflectionevidence for continental underthrusting beneath southern Tibet. Nature 366, 557–559.
Zijderveld, J.D.A., 1967. A.C. demagnetization of rocks: analysis of results. In: Collinson,D.W., Creer, K.M., Runcorn, S.K. (Eds.), Methods on Paleomagnetism. Elsevier,Amsterdam, pp. 254–286.


![Easy paleo spaghetti recipe with tomato sauce [Paleo, Keto]](https://img.pdfslide.us/doc/110x75/58aa1fde1a28abff6b8b5931/easy-paleo-spaghetti-recipe-with-tomato-sauce-paleo-keto.jpg)