Embed Size (px)
Citation preview

siemens.com
Twice-raised guidance exceeded – historic success through strong team performance»The fiscal year just ended was one of the strongest in the history of our company. Setting aside portfolio divestments, it was actually the best. We worked hard and I am proud of what our global team has achieved. In fiscal 2017 we will continue working with full concentration on the execution of Vision 2020,« said Joe Kaeser, President and Chief Executive Officer of Siemens AG.
Fiscal 2016
Orders and revenue both 5% higher compared to fiscal 2015, at €86.5 billion and €79.6 billion, respectively, for a book-to-bill ratio of 1.09; excluding currency translation effects, orders and revenue both up 6%
Industrial Business profit up 13%, at €8.7 billion; strong increases in Power and Gas, Energy Management, and Wind Power and Renewables and growth in other Divisions and Healthineers, more than offsetting a substantial decline in Process Industries and Drives
Industrial Business profit margin reached 10.8%, with all industrial businesses except Process Industries and Drives within their target ranges
Net income of €5.6 billion reflects the strong operating performance; fiscal 2015 net income of €7.4 billion included €3.0 billion related to divestments of the hearing aid business and Siemens’ stake in BSH Bosch und Siemens Hausgeräte GmbH (BSH)
Basic earnings per share (EPS) of €6.74, above the raised target range announced in the third quarter; basic EPS of €8.84 a year earlier included €3.66 related to the sale of the hearing aid business and the BSH stake
Siemens proposes a dividend of €3.60 per share
Q4 Fiscal 2016
Fourth-quarter orders of €20.3 billion, 14% lower than the prior-year period which included a substantially higher volume from large orders; excluding the change from large orders, orders rose moderately
Revenue 3% higher, at €22.0 billion, for a book-to-bill ratio of 0.93; excluding currency translation effects, revenue up 5%, orders down 13%
Industrial Business profit remains strong at €2.4 billion, with a 10.9% profit margin; increases in most Divisions largely offset by a negative swing in Process Industries and Drives due to previously announced capacity adjustments
Net income up 18%, at €1.2 billion; basic earnings per share (EPS) up 21%, at €1.42 compared to €1.18 in Q4 FY 2015
Munich, Germany, November 10, 2016
Earnings Release Q4 FY 2016July 1 to September 30, 2016

Earnings Release Q4 FY 2016 | Siemens
2
Siemens
Q4 % Change
(in millions of €) FY 2016 FY 2015 Actual Comp.
Orders 20,326 23,716 (14)% (13)%
Revenue 21,953 21,328 3% 5%Profit Industrial Business 2,448 2,447 0%
therein: severance (333) (264)Profit marginIndustrial Business 10.9% 11.3%
excl. severance 12.4% 12.5%Income from continuing operations 1,182 1,001 18%
therein: severance (349) (343)
Net income 1,176 1,000 18%Basic earnings per share (in €) 1.42 1.18 21%
Free cash flow (continuing and discontinued operations) 3,570 4,375 (18)%ROCE (continuing and discontinued operations) 11.9% 10.7%
Currency translation effects took one percentage point from order and two percentage points from revenue development; portfolio effects had a minimal effect on volume development year-over-year
Orders down due to a lower volume of large orders, particularly in Power and Gas and Wind Power and Renewables; orders rose moderately excluding the change from large orders
Industrial Business order backlog was €113 billion
Revenue increase in all industrial businesses except Process Industries and Drives, and driven by double-digit growth in Power and Gas, due mainly to a sharp increase in Egypt
Profit Industrial Business: increases in most of the Divisions offset by Process Industries and Drives, where profit turned negative due mainly to severance charges related to previously announced capacity adjustments
Income from continuing operations: improvement due mainly to Centrally managed portfolio activities, which benefited from a strong positive swing relating to a major asset retirement obligation and also included a lower loss from at-equity investments
Decrease in Free cash flow from Industrial Business, to €4.034 billion from a high level of €4.952 billion in Q4 FY 2015. Free cash flow in the prior-year period benefited from significantly higher project prepayments at Power and Gas
ROCE increase driven by higher net income
Underfunding of Siemens’ pension plans as of September 30, 2016: €12.8 billion (June 30, 2016: €12.7 billion)

Earnings Release Q4 FY 2016 | Industrial Business
3
Power and Gas
Q4 % Change
(in millions of €) FY 2016 FY 2015 Actual Comp.
Orders 3,218 5,297 (39)% (38)%
Revenue 4,545 4,118 10% 12%
Profit 509 418 22%
therein: severance (23) (91) therein: integration costs Dresser-Rand (14) (19)
Profit margin 11.2% 10.2% excl. severance and integration costs 12.0% 12.8%
Orders came in substantially lower due to a smaller volume from large orders compared to Q4 FY 2015, when the Middle East recorded several large orders including in Egypt; the book-to-bill ratio dropped below 1 for the current quarter
Revenue growth driven by strong execution from the backlog particularly including large orders in Egypt; increases in all three reporting regions
Profitability influenced by a less favorable revenue mix, including a lower share from the service business; the current period includes lower severance as well as positive effects totaling €70 million from measurement of inventories; Q4 FY 2015 included a positive effect of €55 million related to a project settlement
Overcapacities continue to create an aggressive competitive environment, resulting in increased price pressure
Wind Power and Renewables
Q4 % Change
(in millions of €) FY 2016 FY 2015 Actual Comp.
Orders 1,205 2,716 (56)% (56)%
Revenue 1,597 1,504 6% 11%
Profit 132 72 84%
therein: severance (2) (3)
Profit margin 8.3% 4.8%
excl. severance 8.4% 5.0%
After very strong order growth in the first nine months, lower volume from large orders in the fourth quarter; Q4 FY 2015 included a €1.2 billion order for an offshore wind-farm, including service, in Germany and several large orders in the onshore business
Clear revenue increase in the offshore new unit business despite negative effects from currency translation
Continued strong profitability driven by higher revenue, improved productivity in production and installation, increased capacity utilization, and a larger contribution from the service business
Energy Management
Q4 % Change
(in millions of €) FY 2016 FY 2015 Actual Comp.
Orders 3,376 3,290 3% 4%
Revenue 3,573 3,473 3% 5%
Profit 299 259 15%
therein: severance (52) (51)
Profit margin 8.4% 7.5%
excl. severance 9.8% 8.9%
Increase in orders mainly due to growth in the high voltage products and digital grid businesses
Revenue up mainly due to growth in the solutions and transformer businesses; increase in all three reporting regions
Robust profit development compared to the strong year-end quarter a year earlier, including profitability improvements in a majority of businesses led by the high voltage products and solutions businesses

Earnings Release Q4 FY 2016 | Industrial Business
4
Building Technologies
Q4 % Change
(in millions of €) FY 2016 FY 2015 Actual Comp.
Orders 1,770 1,662 7% 7%
Revenue 1,698 1,679 1% 2%
Profit 196 222 (12)%
therein: severance (10) (7)
Profit margin 11.5% 13.2%
excl. severance 12.1% 13.6%
Continued strong order growth driven mainly by contract wins in the solutions business for energy efficiency projects in the U.S.
Revenue growth in Asia, Australia and the Americas
Strong profit contribution in typically robust year-end quarter
Mobility
Q4 % Change
(in millions of €) FY 2016 FY 2015 Actual Comp.
Orders 2,274 2,387 (5)% (3)%
Revenue 2,070 1,998 4% 8%
Profit 173 171 1%
therein: severance (5) (34)
Profit margin 8.4% 8.6%
excl. severance 8.6% 10.2%
Lower volume from large orders year-over-year; sharp order growth in the Americas due mainly to a contract win worth €0.4 billion for light rail vehicles in the U.S.
Strongest revenue growth from the rolling stock businesses
Solid project execution resulted in approval of operations and homologation in Germany for the Division’s new high-speed train series, the ICE 4, according to the original plan
Profitability impacted by a less favorable revenue mix, due to a larger share from the lower-margin rolling stock business
Digital Factory
Q4 % Change
(in millions of €) FY 2016 FY 2015 Actual Comp.
Orders 2,700 2,520 7% 7%
Revenue 2,787 2,661 5% 4%
Profit 515 468 10%
therein: severance (21) (28)
Profit margin 18.5% 17.6%
excl. severance 19.2% 18.6%
Broad-based order and revenue growth; strongest contributions from the product lifecycle management (PLM) software business, which benefited from the acquisition of CD-adapco, and from the factory automation business
Orders and revenue up in all regions, particularly in China
Business performance of CD-adapco ahead of plan
Profit at record high driven by the PLM and factory automation businesses
Earnings Release Q4 FY 2016 | Industrial Business
5
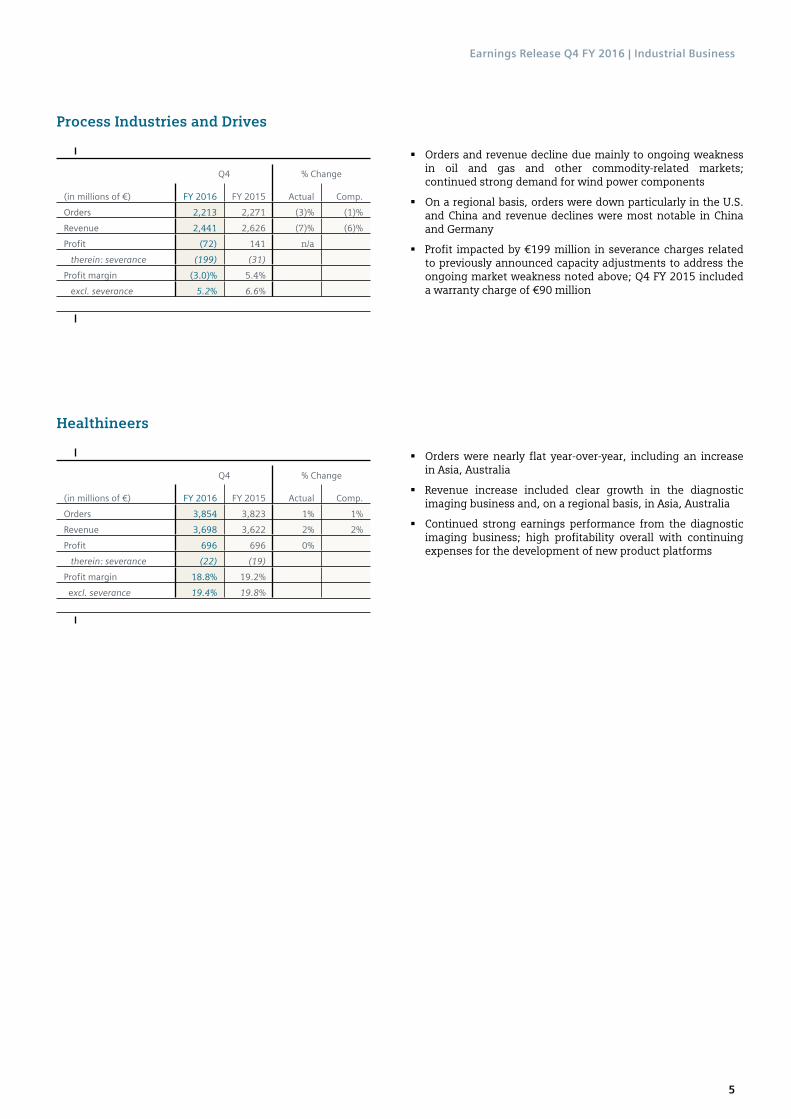
Process Industries and Drives
Q4 % Change
(in millions of €) FY 2016 FY 2015 Actual Comp.
Orders 2,213 2,271 (3)% (1)%
Revenue 2,441 2,626 (7)% (6)%
Profit (72) 141 n/a
therein: severance (199) (31)
Profit margin (3.0)% 5.4%
excl. severance 5.2% 6.6%
Orders and revenue decline due mainly to ongoing weakness in oil and gas and other commodity-related markets; continued strong demand for wind power components
On a regional basis, orders were down particularly in the U.S. and China and revenue declines were most notable in China and Germany
Profit impacted by €199 million in severance charges related to previously announced capacity adjustments to address the ongoing market weakness noted above; Q4 FY 2015 included a warranty charge of €90 million
Healthineers
Q4 % Change
(in millions of €) FY 2016 FY 2015 Actual Comp.
Orders 3,854 3,823 1% 1%
Revenue 3,698 3,622 2% 2%
Profit 696 696 0%
therein: severance (22) (19)
Profit margin 18.8% 19.2%
excl. severance 19.4% 19.8%
Orders were nearly flat year-over-year, including an increase in Asia, Australia
Revenue increase included clear growth in the diagnostic imaging business and, on a regional basis, in Asia, Australia
Continued strong earnings performance from the diagnostic imaging business; high profitability overall with continuing expenses for the development of new product platforms

Earnings Release Q4 FY 2016 | Financial Services, Reconciliation to Consolidated Financial Statements and Outlook
6
Financial Services
Q4
(in millions of €) FY 2016 FY 2015
Income before income taxes 121 144
therein: severance (2) (2)
ROE (after taxes) 15.5% 19.3%
(in millions of €)Sep 30,
2016Sep 30,
2015
Total assets 26,446 24,970
Profit contribution from Financial Services (SFS) included stable results in the equity investments business
While the debt business was generally stable, results were affected by a negative swing in the valuation of derivative instruments embedded in financing contracts, which was triggered by changes in the external interest rate environment
Continued growth in total assets was held back by substantial early terminations of financings during the fiscal year
Reconciliation to Consolidated Financial Statements
Profit
Q4
(in millions of €) FY 2016 FY 2015
Centrally managed portfolio activities (25) (342)
Siemens Real Estate (20) 9
Corporate items (342) (359)
Centrally carried pension expense (127) (105)Amortization of intangible assets acquired in business combinations (170) (168)Eliminations, Corporate Treasury and other reconciling items (111) (80)Reconciliation to Consolidated Financial Statements (796) (1,046)
Centrally managed portfolio activities (CMPA): strong positive swing in the result related to a major asset retirement obligation and a lower loss from at-equity investments; Q4 FY 2015 included an impairment of €138 million related to Siemens’ stake in Primetals Technologies Ltd., which is still operating in a difficult market environment
Results of CMPA are expected to remain volatile in coming quarters
Outlook
We continue to anticipate headwinds for macroeconomic growth and investment sentiment in our markets due to the complex geopolitical environment. Therefore, we expect modest growth in revenue, net of effects from currency translation and portfolio transactions. We further anticipate that orders will exceed revenue for a book-to-bill ratio above 1. For our Industrial Business, we expect a profit margin of 10.5% to 11.5%. We expect basic EPS from net income in the range of €6.80 to €7.20, compared to €6.74 in fiscal 2016 which included €0.23 from discontinued operations.
This outlook assumes stabilization in the market environment for our high-margin short-cycle businesses. It further excludes charges related to legal and regulatory matters as well as potential burdens associated with pending portfolio matters.

Earnings Release Q4 FY 2016 | Notes and forward-looking statements
7
Notes and forward-looking statements
Starting today at 9:00 a.m. CET, the press conference at which Siemens CEO Joe Kaeser and Siemens CFO Ralf P. Thomas discuss the financial figures will be broadcast live at www.siemens.com/pressconference.
Starting today at 11:00 a.m. CET, Joe Kaeser and Ralf P. Thomas will hold a telephone conference in English for analysts and investors, which can be followed live at www.siemens.com/analystcall.
Recordings of the press conference and the conference call for analysts and investors will subsequently be made available as well.
Financial publications are available for download at: www.siemens.com/ir.
This document contains statements related to our future business and financial performance and future events or developments involving Siemens that may constitute forward-looking statements. These statements may be identified by words such as “expect,” “look forward to,” “anticipate,” “intend,” “plan,” “believe,” “seek,” “estimate,” “will,” “project” or words of similar meaning. We may also make forward-looking statements in other reports, in presentations, in material delivered to shareholders and in press releases. In addition, our representatives may from time to time make oral forward-looking statements. Such statements are based on the current expectations and certain assumptions of Siemens’ management, of which many are beyond Siemens’ control. These are subject to a number of risks, uncertainties and factors, including, but not limited to those described in disclosures, in particular in the chapter Risks in the Annual Report. Should one or more of these risks or uncertainties materialize, or should underlying expectations not occur or assumptions prove incorrect, actual results, performance or achievements of Siemens may (negatively or positively) vary materially from those described explicitly or implicitly in the relevant forward-looking statement. Siemens neither intends, nor assumes any obligation, to update or revise these forward-looking statements in light of developments which differ from those anticipated.
This document includes – in the applicable financial reporting framework not clearly defined – supplemental financial measures that are or may be alternative performance measures (non-GAAP-measures). These supplemental financial measures should not be viewed in isolation or as alternatives to measures of Siemens’ net assets and financial positions or results of operations as presented in accordance with the applicable financial reporting framework in its Consolidated Financial Statements. Other companies that report or describe similarly titled alternative performance measures may calculate them differently.
Due to rounding, numbers presented throughout this and other documents may not add up precisely to the totals provided and percentages may not precisely reflect the absolute figures.
All information is preliminary.
Financial Media:Alexander BeckerPhone: +49 89 636-36558E-mail: [email protected]
Wolfram TrostPhone: +49 89 636-34794E-mail: [email protected]
Siemens AG,80333 Munich, Germany
© 2016 by Siemens AG, Berlin and Munich

Financial ResultsFourth Quarter and Fiscal 2016
siemens.com
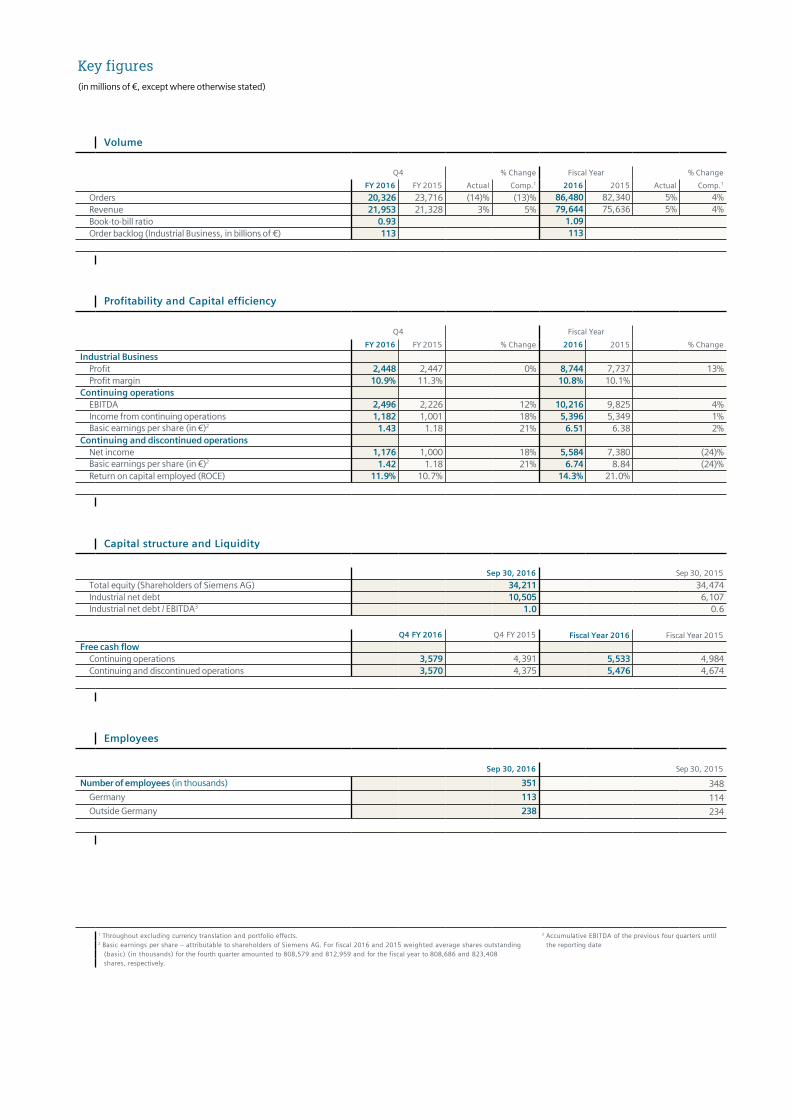
Key figures(in millions of €, except where otherwise stated)
Volume
Q4 % Change Fiscal Year % Change
FY 2016 FY 2015 Actual Comp.1 2016 2015 Actual Comp.1
Orders 20,326 23,716 (14)% (13)% 86,480 82,340 5% 4%Revenue 21,953 21,328 3% 5% 79,644 75,636 5% 4%Book-to-bill ratio 0.93 1.09Order backlog (Industrial Business, in billions of €) 113 113
Profitability and Capital efficiency
Q4 Fiscal Year
FY 2016 FY 2015 % Change 2016 2015 % Change
Industrial BusinessProfit 2,448 2,447 0% 8,744 7,737 13%Profit margin 10.9% 11.3% 10.8% 10.1%
Continuing operationsEBITDA 2,496 2,226 12% 10,216 9,825 4%Income from continuing operations 1,182 1,001 18% 5,396 5,349 1%Basic earnings per share (in €)2 1.43 1.18 21% 6.51 6.38 2%
Continuing and discontinued operationsNet income 1,176 1,000 18% 5,584 7,380 (24)%Basic earnings per share (in €)2 1.42 1.18 21% 6.74 8.84 (24)%Return on capital employed (ROCE) 11.9% 10.7% 14.3% 21.0%
Capital structure and Liquidity
Sep 30, 2016 Sep 30, 2015
Total equity (Shareholders of Siemens AG) 34,211 34,474Industrial net debt 10,505 6,107Industrial net debt / EBITDA3 1.0 0.6
Q4 FY 2016 Q4 FY 2015 Fiscal Year 2016 Fiscal Year 2015
Free cash flowContinuing operations 3,579 4,391 5,533 4,984Continuing and discontinued operations 3,570 4,375 5,476 4,674
Employees
Sep 30, 2016 Sep 30, 2015
Number of employees (in thousands) 351 348
Germany 113 114
Outside Germany 238 234
1 Throughout excluding currency translation and portfolio effects. 3 Accumulative EBITDA of the previous four quarters until2 Basic earnings per share – attributable to shareholders of Siemens AG. For fiscal 2016 and 2015 weighted average shares outstanding 3 the reporting date (basic) (in thousands) for the fourth quarter amounted to 808,579 and 812,959 and for the fiscal year to 808,686 and 823,408 4 Continuing and discontinued operations. shares, respectively.

Consolidated Statements of Income
Q4 Fiscal year
(in millions of €, per share amounts in €) FY 2016 FY 2015 2016 2015
Revenue 21,953 21,328 79,644 75,636
Cost of sales (15,731) (15,348) (55,826) (53,789)
Gross profit 6,222 5,980 23,819 21,847
Research and development expenses (1,322) (1,264) (4,732) (4,483)
Selling and general administrative expenses (3,029) (3,098) (11,669) (11,409)
Other operating income 106 155 328 476
Other operating expenses (187) (144) (427) (389)
Income (loss) from investments accounted for using the equity method, net (37) (126) 134 1,235
Interest income 336 324 1,314 1,260
Interest expenses (248) (246) (989) (818)
Other financial income (expenses), net (69) (35) (373) (500)
Income from continuing operations before income taxes 1,772 1,545 7,404 7,218
Income tax expenses (590) (544) (2,008) (1,869)
Income from continuing operations 1,182 1,001 5,396 5,349
Income (loss) from discontinued operations, net of income taxes (6) (1) 188 2,031
Net income 1,176 1,000 5,584 7,380
Attributable to:
Non-controlling interests 24 41 134 98
Shareholders of Siemens AG 1,152 959 5,450 7,282
Basic earnings per share
Income from continuing operations 1.43 1.18 6.51 6.38
Income (loss) from discontinued operations (0.01) — 0.23 2.47
Net income 1.42 1.18 6.74 8.84
Diluted earnings per share
Income from continuing operations 1.41 1.17 6.42 6.30
Income (loss) from discontinued operations (0.01) — 0.23 2.44
Net income 1.40 1.17 6.65 8.74
Consolidated Statements of Comprehensive Income
Q4 Fiscal year
(in millions of €) FY 2016 FY 2015 2016 2015
Net income 1,176 1,000 5,584 7,380
Remeasurements of defined benefit plans (58) (176) (2,636) (370)therein: Income tax effects 40 (111) 1,065 (107)
Items that will not be reclassified to profit or loss (58) (176) (2,636) (370)
therein: Income (loss) from investments accounted for using the equity method, net — 7 — (42)
Currency translation differences (277) (774) (888) 1,089Available-for-sale financial assets 372 23 434 354
therein: Income tax effects (8) 10 4 (7)
Derivative financial instruments 62 108 210 (43)
therein: Income tax effects (24) (59) (89) (7)
Items that may be reclassified subsequently to profit or loss 157 (643) (244) 1,399
therein: Income (loss) from investments accounted for using the equity method, net 14 (40) (141) 149
Other comprehensive income, net of income taxes 99 (819) (2,879) 1,029Total comprehensive income 1,275 182 2,705 8,408
Attributable to:
Non-controlling interests 27 30 134 133
Shareholders of Siemens AG 1,248 152 2,571 8,275
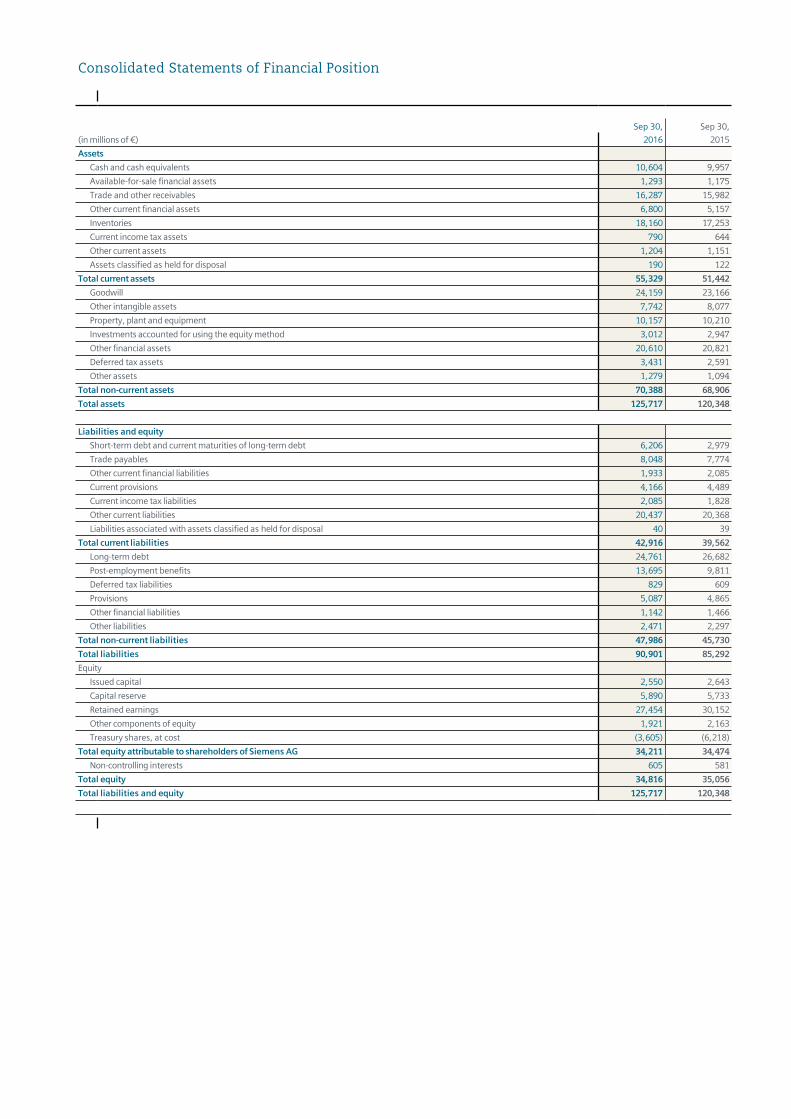
Consolidated Statements of Financial Position
Sep 30, Sep 30,
(in millions of €) 2016 2015
Assets
Cash and cash equivalents 10,604 9,957
Available-for-sale financial assets 1,293 1,175
Trade and other receivables 16,287 15,982
Other current financial assets 6,800 5,157
Inventories 18,160 17,253
Current income tax assets 790 644
Other current assets 1,204 1,151
Assets classified as held for disposal 190 122
Total current assets 55,329 51,442
Goodwill 24,159 23,166
Other intangible assets 7,742 8,077
Property, plant and equipment 10,157 10,210
Investments accounted for using the equity method 3,012 2,947
Other financial assets 20,610 20,821
Deferred tax assets 3,431 2,591
Other assets 1,279 1,094
Total non-current assets 70,388 68,906
Total assets 125,717 120,348
Liabilities and equity
Short-term debt and current maturities of long-term debt 6,206 2,979
Trade payables 8,048 7,774
Other current financial liabilities 1,933 2,085
Current provisions 4,166 4,489
Current income tax liabilities 2,085 1,828
Other current liabilities 20,437 20,368
Liabilities associated with assets classified as held for disposal 40 39
Total current liabilities 42,916 39,562
Long-term debt 24,761 26,682
Post-employment benefits 13,695 9,811
Deferred tax liabilities 829 609
Provisions 5,087 4,865
Other financial liabilities 1,142 1,466
Other liabilities 2,471 2,297
Total non-current liabilities 47,986 45,730
Total liabilities 90,901 85,292
Equity
Issued capital 2,550 2,643
Capital reserve 5,890 5,733
Retained earnings 27,454 30,152
Other components of equity 1,921 2,163
Treasury shares, at cost (3,605) (6,218)
Total equity attributable to shareholders of Siemens AG 34,211 34,474
Non-controlling interests 605 581
Total equity 34,816 35,056
Total liabilities and equity 125,717 120,348

Consolidated Statements of Cash Flows
Q4
(in millions of €) FY 2016 FY 2015
Cash flows from operating activities
Net income 1,176 1,000
Adjustments to reconcile net income to cash flows from operating activities - continuing operations
Loss from discontinued operations, net of income taxes 6 1
Amortization, depreciation and impairments 742 724
Income tax expenses 590 544
Interest (income) expenses, net (88) (78)
(Income) loss related to investing activities (14) 52
Other non-cash (income) expenses 154 339
Change in operating net working capital
Inventories 977 1,112
Trade and other receivables 166 66
Trade payables 600 611
Billings in excess of costs and estimated earnings on uncompleted contracts and related advances (634) 373
Additions to assets leased to others in operating leases (154) (150)
Change in other assets and liabilities 832 725
Income taxes paid (362) (604)
Dividends received 70 93
Interest received 335 292
Cash flows from operating activities - continuing operations 4,396 5,098
Cash flows from operating activities - discontinued operations (9) (17)
Cash flows from operating activities - continuing and discontinued operations 4,387 5,081
Cash flows from investing activities
Additions to intangible assets and property, plant and equipment (817) (707)
Acquisitions of businesses, net of cash acquired (10) (10)
Purchase of investments (143) (24)
Purchase of current available-for-sale financial assets (354) (333)
Change in receivables from financing activities (1,308) (354)
Disposal of investments, intangibles and property, plant and equipment 91 217
Disposal of businesses, net of cash disposed (1) (21)
Disposal of current available-for-sale financial assets 313 284
Cash flows from investing activities - continuing operations (2,230) (948)
Cash flows from investing activities - discontinued operations (1) (10)
Cash flows from investing activities - continuing and discontinued operations (2,232) (958)
Cash flows from financing activities
Purchase of treasury shares (101) (852)
Other transactions with owners — (4)
Issuance of long-term debt 5,300 64
Repayment of long-term debt (including current maturities of long-term debt) (1,779) (5)
Change in short-term debt and other financing activities (1,120) (1,212)
Interest paid (167) (164)
Dividends attributable to non-controlling interests (51) (37)
Cash flows from financing activities - continuing operations 2,082 (2,210)
Cash flows from financing activities - discontinued operations — —
Cash flows from financing activities - continuing and discontinued operations 2,082 (2,210)
Effect of changes in exchange rates on cash and cash equivalents — (163)
Change in cash and cash equivalents 4,237 1,750
Cash and cash equivalents at beginning of period 6,381 8,207
Cash and cash equivalents at end of period 10,618 9,958
Less: Cash and cash equivalents of assets classified as held for disposal and discontinued operations at end of period 13 —
Cash and cash equivalents at end of period (Consolidated Statements of Financial Position) 10,604 9,957

Consolidated Statements of Cash Flows
Fiscal year
(in millions of €) 2016 2015
Cash flows from operating activities
Net income 5,584 7,380
Adjustments to reconcile net income to cash flows from operating activities - continuing operations
Income from discontinued operations, net of income taxes (188) (2,031)
Amortization, depreciation and impairments 2,764 2,549
Income tax expenses 2,008 1,869
Interest (income) expenses, net (325) (442)
(Income) loss related to investing activities (373) (1,603)
Other non-cash (income) expenses 400 366
Change in operating net working capital
Inventories (1,009) (793)
Trade and other receivables (579) (811)
Trade payables 327 (247)
Billings in excess of costs and estimated earnings on uncompleted contracts and related advances 20 914
Additions to assets leased to others in operating leases (484) (451)
Change in other assets and liabilities (281) 852
Income taxes paid (1,718) (2,306)
Dividends received 302 495
Interest received 1,219 1,138
Cash flows from operating activities - continuing operations 7,668 6,881
Cash flows from operating activities - discontinued operations (57) (270)
Cash flows from operating activities - continuing and discontinued operations 7,611 6,612
Cash flows from investing activities
Additions to intangible assets and property, plant and equipment (2,135) (1,897)
Acquisitions of businesses, net of cash acquired (922) (8,254)
Purchase of investments (271) (568)
Purchase of current available-for-sale financial assets (1,139) (899)
Change in receivables from financing activities (1,356) (1,667)
Disposal of investments, intangibles and property, plant and equipment 377 3,474
Disposal of businesses, net of cash disposed 9 445
Disposal of current available-for-sale financial assets 1,031 651
Cash flows from investing activities - continuing operations (4,406) (8,716)
Cash flows from investing activities - discontinued operations 262 2,889
Cash flows from investing activities - continuing and discontinued operations (4,144) (5,827)
Cash flows from financing activities
Purchase of treasury shares (463) (2,700)
Other transactions with owners (13) 10
Issuance of long-term debt 5,300 7,213
Repayment of long-term debt (including current maturities of long-term debt) (2,253) (354)
Change in short-term debt and other financing activities (1,408) 351
Interest paid (809) (596)
Dividends paid to shareholders of Siemens AG (2,827) (2,728)
Dividends attributable to non-controlling interests (236) (145)
Cash flows from financing activities - continuing operations (2,710) 1,051
Cash flows from financing activities - discontinued operations — 5
Cash flows from financing activities - continuing and discontinued operations (2,710) 1,056
Effect of changes in exchange rates on cash and cash equivalents (98) 83
Change in cash and cash equivalents 660 1,923
Cash and cash equivalents at beginning of period 9,958 8,034
Cash and cash equivalents at end of period 10,618 9,958
Less: Cash and cash equivalents of assets classified as held for disposal and discontinued operations at end of period 13 —
Cash and cash equivalents at end of period (Consolidated Statements of Financial Position) 10,604 9,957
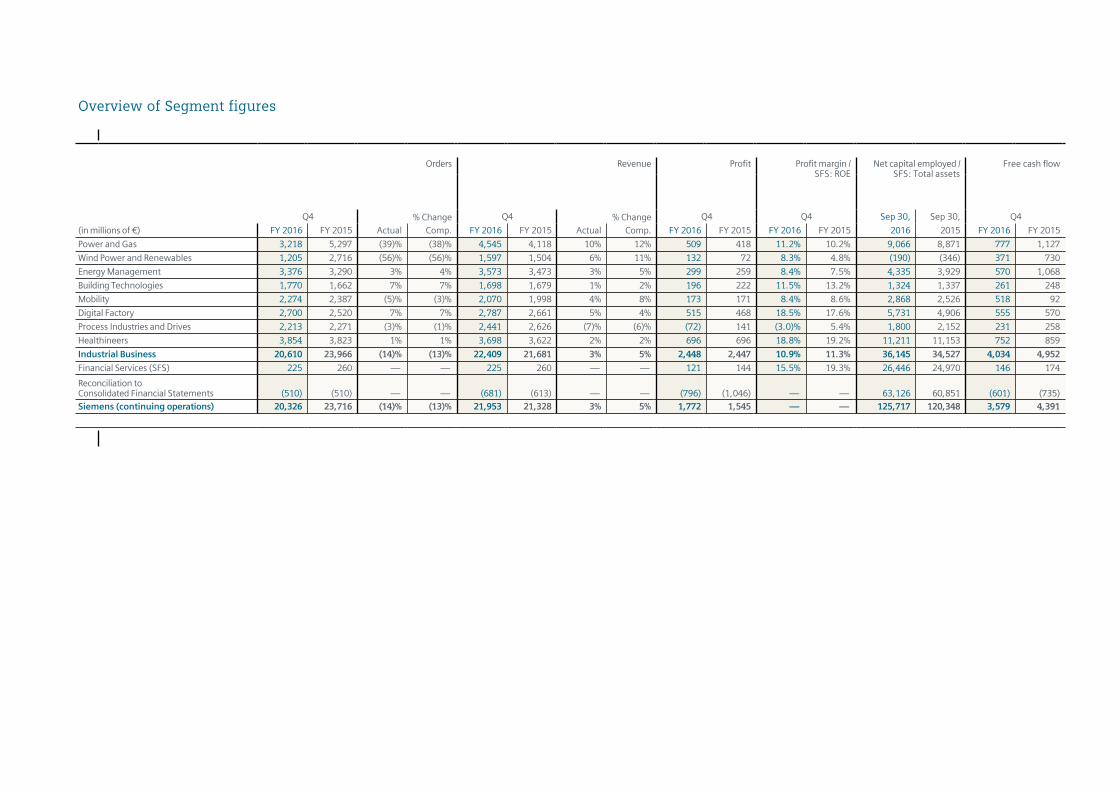
Overview of Segment figures
Orders Revenue Profit Profit margin /SFS: ROE
Net capital employed /SFS: Total assets
Free cash flow
Q4 % Change Q4 % Change Q4 Q4 Sep 30, Sep 30, Q4
(in millions of €) FY 2016 FY 2015 Actual Comp. FY 2016 FY 2015 Actual Comp. FY 2016 FY 2015 FY 2016 FY 2015 2016 2015 FY 2016 FY 2015
Power and Gas 3,218 5,297 (39)% (38)% 4,545 4,118 10% 12% 509 418 11.2% 10.2% 9,066 8,871 777 1,127
Wind Power and Renewables 1,205 2,716 (56)% (56)% 1,597 1,504 6% 11% 132 72 8.3% 4.8% (190) (346) 371 730
Energy Management 3,376 3,290 3% 4% 3,573 3,473 3% 5% 299 259 8.4% 7.5% 4,335 3,929 570 1,068
Building Technologies 1,770 1,662 7% 7% 1,698 1,679 1% 2% 196 222 11.5% 13.2% 1,324 1,337 261 248
Mobility 2,274 2,387 (5)% (3)% 2,070 1,998 4% 8% 173 171 8.4% 8.6% 2,868 2,526 518 92
Digital Factory 2,700 2,520 7% 7% 2,787 2,661 5% 4% 515 468 18.5% 17.6% 5,731 4,906 555 570
Process Industries and Drives 2,213 2,271 (3)% (1)% 2,441 2,626 (7)% (6)% (72) 141 (3.0)% 5.4% 1,800 2,152 231 258
Healthineers 3,854 3,823 1% 1% 3,698 3,622 2% 2% 696 696 18.8% 19.2% 11,211 11,153 752 859
Industrial Business 20,610 23,966 (14)% (13)% 22,409 21,681 3% 5% 2,448 2,447 10.9% 11.3% 36,145 34,527 4,034 4,952
Financial Services (SFS) 225 260 — — 225 260 — — 121 144 15.5% 19.3% 26,446 24,970 146 174
Reconciliation toConsolidated Financial Statements (510) (510) — — (681) (613) — — (796) (1,046) — — 63,126 60,851 (601) (735)Siemens (continuing operations) 20,326 23,716 (14)% (13)% 21,953 21,328 3% 5% 1,772 1,545 — — 125,717 120,348 3,579 4,391
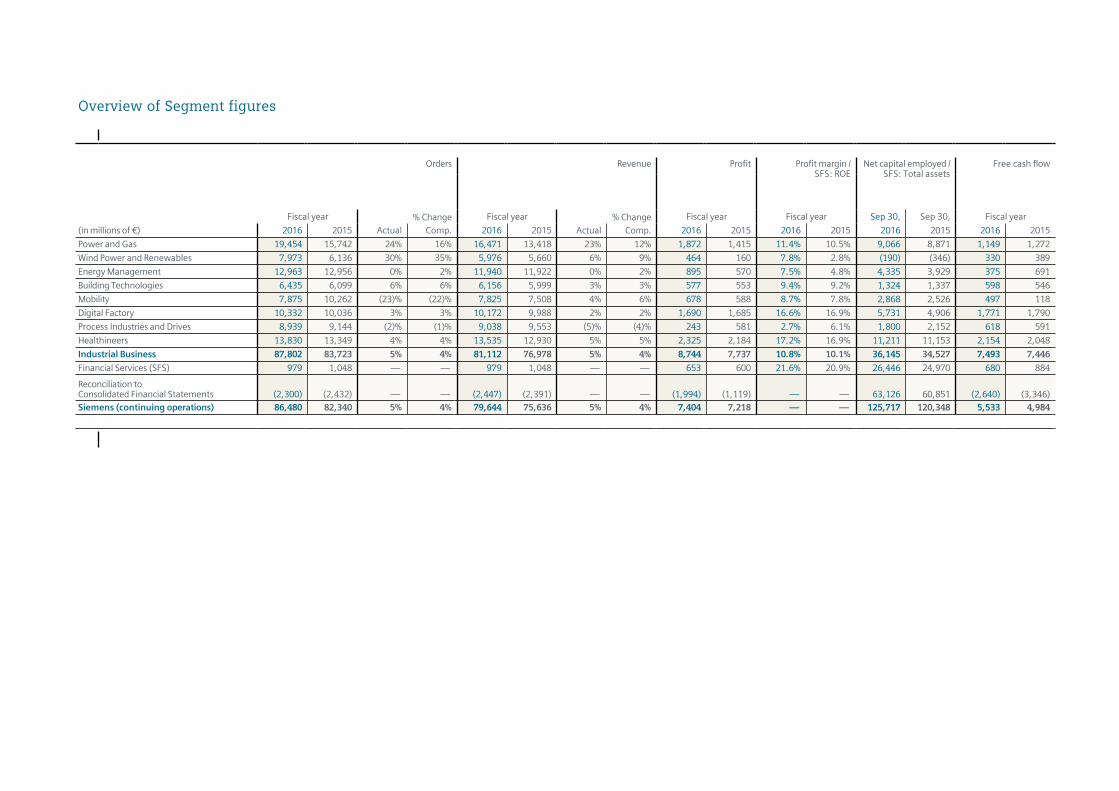
Overview of Segment figures
Orders Revenue Profit Profit margin /SFS: ROE
Net capital employed /SFS: Total assets
Free cash flow
Fiscal year % Change Fiscal year % Change Fiscal year Fiscal year Sep 30, Sep 30, Fiscal year
(in millions of €) 2016 2015 Actual Comp. 2016 2015 Actual Comp. 2016 2015 2016 2015 2016 2015 2016 2015
Power and Gas 19,454 15,742 24% 16% 16,471 13,418 23% 12% 1,872 1,415 11.4% 10.5% 9,066 8,871 1,149 1,272
Wind Power and Renewables 7,973 6,136 30% 35% 5,976 5,660 6% 9% 464 160 7.8% 2.8% (190) (346) 330 389
Energy Management 12,963 12,956 0% 2% 11,940 11,922 0% 2% 895 570 7.5% 4.8% 4,335 3,929 375 691
Building Technologies 6,435 6,099 6% 6% 6,156 5,999 3% 3% 577 553 9.4% 9.2% 1,324 1,337 598 546
Mobility 7,875 10,262 (23)% (22)% 7,825 7,508 4% 6% 678 588 8.7% 7.8% 2,868 2,526 497 118
Digital Factory 10,332 10,036 3% 3% 10,172 9,988 2% 2% 1,690 1,685 16.6% 16.9% 5,731 4,906 1,771 1,790
Process Industries and Drives 8,939 9,144 (2)% (1)% 9,038 9,553 (5)% (4)% 243 581 2.7% 6.1% 1,800 2,152 618 591
Healthineers 13,830 13,349 4% 4% 13,535 12,930 5% 5% 2,325 2,184 17.2% 16.9% 11,211 11,153 2,154 2,048
Industrial Business 87,802 83,723 5% 4% 81,112 76,978 5% 4% 8,744 7,737 10.8% 10.1% 36,145 34,527 7,493 7,446
Financial Services (SFS) 979 1,048 — — 979 1,048 — — 653 600 21.6% 20.9% 26,446 24,970 680 884
Reconciliation toConsolidated Financial Statements (2,300) (2,432) — — (2,447) (2,391) — — (1,994) (1,119) — — 63,126 60,851 (2,640) (3,346)Siemens (continuing operations) 86,480 82,340 5% 4% 79,644 75,636 5% 4% 7,404 7,218 — — 125,717 120,348 5,533 4,984
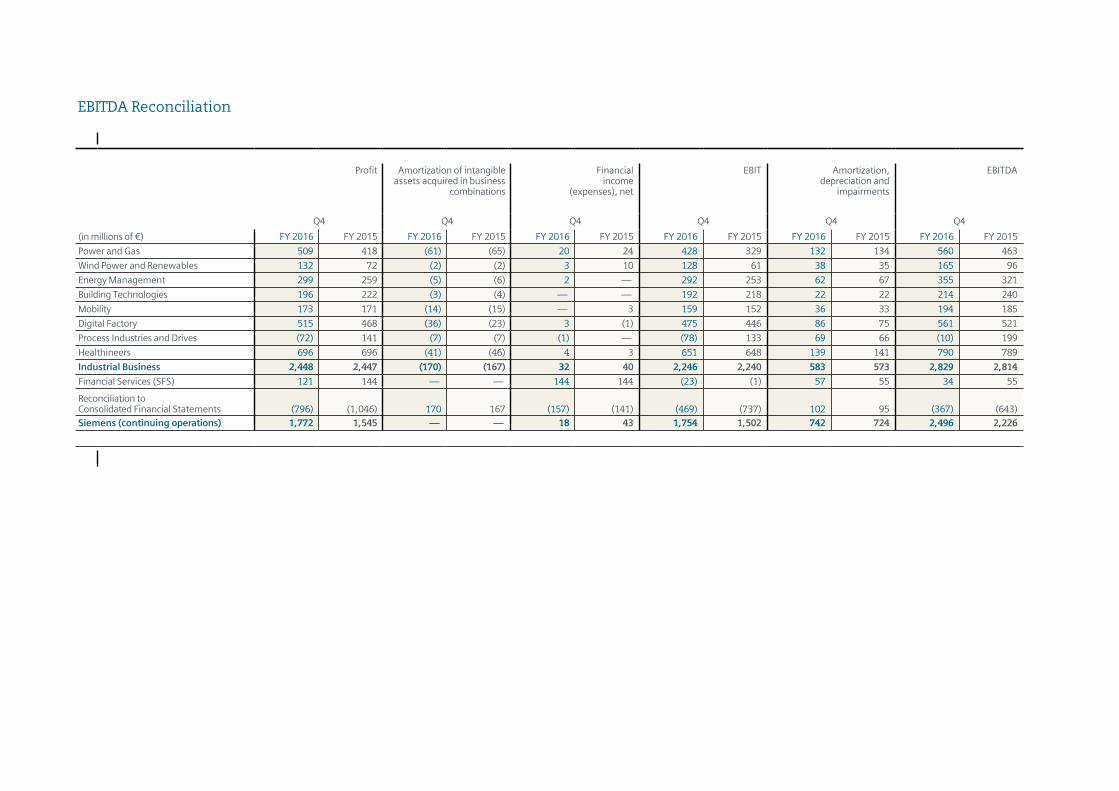
EBITDA Reconciliation
Profit Amortization of intangibleassets acquired in business
combinations
Financialincome
(expenses), net
EBIT Amortization,depreciation and
impairments
EBITDA
Q4 Q4 Q4 Q4 Q4 Q4
(in millions of €) FY 2016 FY 2015 FY 2016 FY 2015 FY 2016 FY 2015 FY 2016 FY 2015 FY 2016 FY 2015 FY 2016 FY 2015
Power and Gas 509— 418— (61)— (65)— 20— 24— 428— 329— 132— 134— 560— 463—
Wind Power and Renewables 132— 72— (2)— (2)— 3— 10— 128— 61— 38— 35— 165— 96—
Energy Management 299— 259— (5)— (6)— 2— — — 292— 253— 62— 67— 355— 321—
Building Technologies 196— 222— (3)— (4)— — — — — 192— 218— 22— 22— 214— 240—
Mobility 173— 171— (14)— (15)— — — 3— 159— 152— 36— 33— 194— 185—
Digital Factory 515— 468— (36)— (23)— 3— (1)— 475— 446— 86— 75— 561— 521—
Process Industries and Drives (72)— 141— (7)— (7)— (1)— — — (78)— 133— 69— 66— (10)— 199—
Healthineers 696— 696— (41)— (46)— 4— 3— 651— 648— 139— 141— 790— 789—
Industrial Business 2,448— 2,447— (170)— (167)— 32— 40— 2,246— 2,240— 583— 573— 2,829— 2,814—
Financial Services (SFS) 121— 144— — — — — 144— 144— (23)— (1)— 57— 55— 34— 55—
Reconciliation toConsolidated Financial Statements (796)— (1,046)— 170— 167— (157)— (141)— (469)— (737)— 102— 95— (367)— (643)
—
Siemens (continuing operations) 1,772— 1,545— — — — — 18— 43— 1,754— 1,502— 742— 724— 2,496— 2,226—

EBITDA Reconciliation
Profit Amortization of intangibleassets acquired in business
combinations
Financialincome
(expenses), net
EBIT Amortization,depreciation and
impairments
EBITDA
Fiscal year Fiscal year Fiscal year Fiscal year Fiscal year Fiscal year
(in millions of €) 2016 2015 2016 2015 2016 2015 2016 2015 2016 2015 2016 2015
Power and Gas 1,872— 1,415— (249)— (120)— 40— 31— 1,583— 1,264— 522— 350— 2,105— 1,615—
Wind Power and Renewables 464— 160— (6)— (6)— 16— 19— 441— 135— 137— 132— 578— 267—
Energy Management 895— 570— (22)— (23)— 16— (3)— 857— 550— 218— 230— 1,074— 780—
Building Technologies 577— 553— (13)— (15)— — — (2)— 564— 539— 85— 86— 649— 625—
Mobility 678— 588— (60)— (61)— 9— 4— 609— 524— 132— 126— 741— 650—
Digital Factory 1,690— 1,685— (117)— (93)— 15— 1— 1,559— 1,590— 304— 281— 1,862— 1,871—
Process Industries and Drives 243— 581— (27)— (41)— (2)— (1)— 219— 541— 231— 240— 450— 780—
Healthineers 2,325— 2,184— (179)— (180)— 18— 17— 2,128— 1,988— 563— 545— 2,691— 2,532—
Industrial Business 8,744— 7,737— (673)— (539)— 113— 66— 7,959— 7,131— 2,191— 1,990— 10,150— 9,120—
Financial Services (SFS) 653— 600— 1— (2)— 618— 582— 36— 17— 216— 219— 252— 235—
Reconciliation toConsolidated Financial Statements (1,994)— (1,119)— 671— 541— (780)— (706)— (543)— 128— 357— 341— (186)— 469
—
Siemens (continuing operations) 7,404— 7,218— — — — — (48)— (58)— 7,452— 7,276— 2,764— 2,549— 10,216— 9,825—
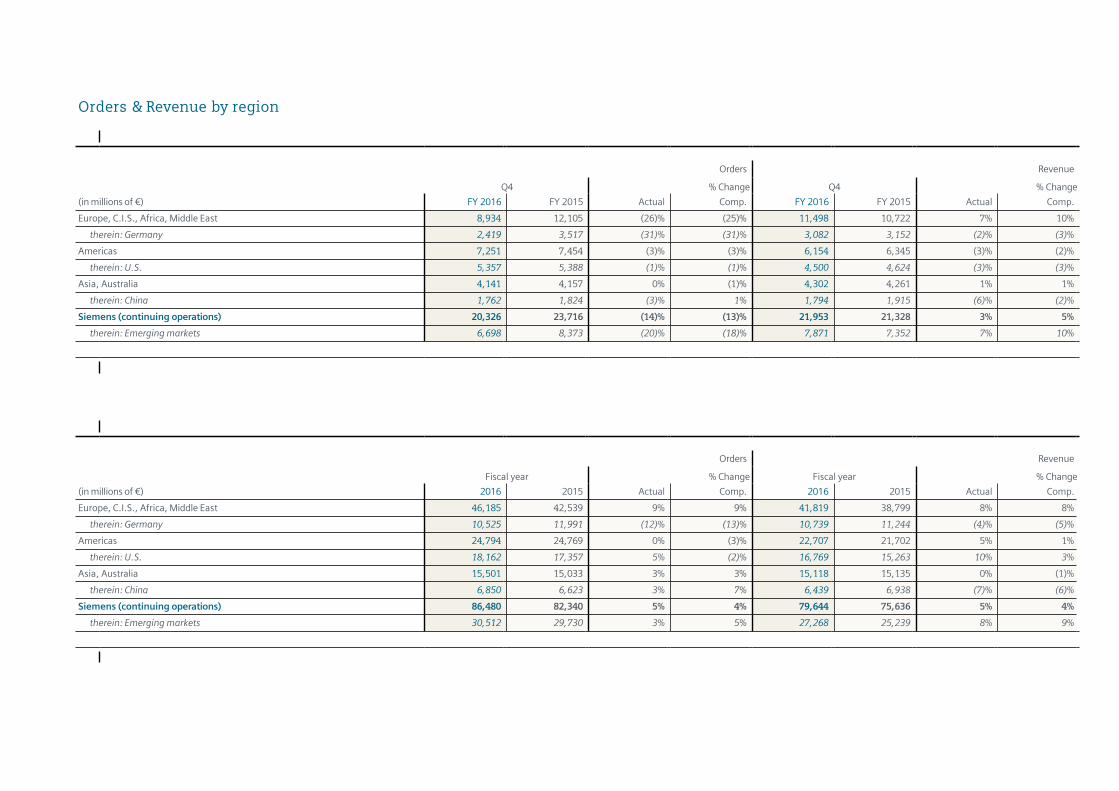
Orders & Revenue by region
Orders Revenue
Q4 % Change Q4 % Change
(in millions of €) FY 2016 FY 2015 Actual Comp. FY 2016 FY 2015 Actual Comp.
Europe, C.I.S., Africa, Middle East 8,934 12,105 (26)% (25)% 11,498 10,722 7% 10%
therein: Germany 2,419 3,517 (31)% (31)% 3,082 3,152 (2)% (3)%
Americas 7,251 7,454 (3)% (3)% 6,154 6,345 (3)% (2)%
therein: U.S. 5,357 5,388 (1)% (1)% 4,500 4,624 (3)% (3)%
Asia, Australia 4,141 4,157 0% (1)% 4,302 4,261 1% 1%
therein: China 1,762 1,824 (3)% 1% 1,794 1,915 (6)% (2)%
Siemens (continuing operations) 20,326 23,716 (14)% (13)% 21,953 21,328 3% 5%
therein: Emerging markets 6,698 8,373 (20)% (18)% 7,871 7,352 7% 10%
Orders Revenue
Fiscal year % Change Fiscal year % Change
(in millions of €) 2016 2015 Actual Comp. 2016 2015 Actual Comp.
Europe, C.I.S., Africa, Middle East 46,185 42,539 9% 9% 41,819 38,799 8% 8%
therein: Germany 10,525 11,991 (12)% (13)% 10,739 11,244 (4)% (5)%
Americas 24,794 24,769 0% (3)% 22,707 21,702 5% 1%
therein: U.S. 18,162 17,357 5% (2)% 16,769 15,263 10% 3%
Asia, Australia 15,501 15,033 3% 3% 15,118 15,135 0% (1)%
therein: China 6,850 6,623 3% 7% 6,439 6,938 (7)% (6)%
Siemens (continuing operations) 86,480 82,340 5% 4% 79,644 75,636 5% 4%
therein: Emerging markets 30,512 29,730 3% 5% 27,268 25,239 8% 9%