Embed Size (px)
DESCRIPTION
Citation preview

BRProperties
EARNINGS RELEASE 1Q10
Webcast 1Q10
Portuguese May 14th, 2010 2:00 P.M. (Brasília) 1:00 P.M. (US EDT) Phone: (55 11) 2188-0155 Replay: (55 11) 2188-0155
English May 14th, 2010 4:00 P.M. (Brasília) 3:00 P.M. (US EDT) Phone: (1 866) 890-2584 Replay: (1 866) 890-2584
BRProperties
-1-
1Q10 BRPR3
BR PROPERTIES ANNOUNCES AN ADJUSTED EBITDA OF R$ 35.5 MILLION IN
1Q10, AN INCREASE OF 53% COMPARED TO 1Q09 WITH AN ADJUSTED EBITDA MARGIN OF 85%, AND A PRO-FORMA ADJUSTED EBITDA MARGIN OF 88%
São Paulo, May 13th, 2010 – BR Properties S.A. (Bovespa: BRPR3), one of Brazil´s largest real estate investment companies, announces today its Earnings Release of the first quarter of 2010 (1Q10). Currently, considering the acquisitions finalized after the end of 1Q10, BR Properties holds 57 commercial properties, which total 868.807 sq m of Gross Leasable Area (GLA), and also 4 development projects of which, once finalized, will add 150.473 sq m of GLA to our portfolio. The Company also manages properties of its portfolio through the subsidiary BRPR A. The following financial and operational information will be presented in R$, except where it is indicated, and follow the same standards put forth by the Corporations Law (Lei das S/A) and the Comissão de Valores Mobiliários (CVM). Contacts Pedro Daltro CFO and IR Officer Leonardo Fernandes IR Manager Marcos Oliveira IR Analyst [email protected] t: +55 11 3201-1000 f: +55 11 3201-1001 Membership
Corporate Governance
Highlights of 1Q10 and Recent Events Gross Revenues of R$ 46.2 million, a 52% increase compared to
1Q09. Estimated Pro-forma gross revenues of R$58.6 million.
Adjusted EBITDA of R$ 35.5 million at the end of 1Q10, an increase of 53% over 1Q09, and a Pro-forma Adjusted EBITDA of R$ 46.8 million.
At the end of 1Q10, the Net Income was of R$11.8 million, an addition of 68% over 1Q09.
Consolidated FFO totaled R$16.6 million, with a margin of 40%.
Consolidation of the financing strategy utilizing real estate financing indexed to TR. This type of credit represents 90% of the total Company debt, and protects us in the higher interest rate scenario
Real growth of 5.4% in value of new leases/renegotiations in 1Q10. Finalized the acquisition of seven remaining properties from 2009: DP
Araucária, five industrial warehouses at Brazilian Business Park, and Torre Nações Unidas, for the amount of R$ 322 million
On April 12th, 2010, we announced the first acquisition after our Initial Public Offering, concluded in March of 2010. We acquired the totality of the office building “Edifício Jacarandá”, located in the Alphaville region, with gross leasable area (GLA) of 31,954 sq m.
On April 20th, 2010, we acquired two Special Purpose Entities,
“ELouveira” and “Vinhedo”, which combined, hold 4 industrial warehouses with total GLA of 106,306 sq m and are fully leased. The properties are located in the city of Louveira/SP, bordering the Anhanguera Highway.
BRProperties
-2-
1Q10 BRPR3
MANAGEMENT REPORT It is with great pleasure that we present the first quarterly earnings release after successfully completing our IPO in March of this year. Confronted with clear indications of the solidity of our business plan, our ability to execute deals, a clear perspective of an improving macroeconomic environment in Brazil, and the support of our shareholders, we initiated our activities in 2010 driven by two strategic goals (i) the vigorous expansion of our property portfolio and (ii) the completion of an initial public offering in the first quarter, given the strong interest demonstrated by investors, both foreign and domestic. The following acquisitions, which were originated in 2009, were finalized: Brazilian Business Park: five industrial/ logistics warehouses located in the city of Atibaia in the state
of São Paulo, with a total combined gross leasable area (GLA) of 59,182 sq m and a total acquisition value of R$ 101 million.
DP Araucária: distribution park located in the city of Araucária in the southern state of Paraná, with a GLA of 42,697 sq m and acquisition value of R$ 69.9 million; and,
Torre Nações Unidas: commercial office building located in the prestigious Berrini Avenue in São Paulo, with 25,555 sq m of GLA and an acquisition value of R$ 148.5 million.
In April of this year, we initiated our ambitious investment plan to deploy the capital raised in the IPO. The Company acquired, for R$ 181 million, the Jacarandá office building, which holds 31,954 sq m of GLA and is part of the Castelo Branco Office Park. With the acquisition, we expanded our already significant presence in the city of Alphaville, in the greater São Paulo region, with yet another high quality property. In the same month, we acquired, for R$ 182 million, four industrial warehouses in the city of Louveira, in greater São Paulo, with a total GLA of 106,306 sq m. With this acquisition, we now own over 250 thousand sq m of GLA in the region. BR Properties’ management would like to sincerely thank all of its associates, business partners and stakeholders for the unconditional support shown, and is at your disposal for any further clarifications or questions that may arise.
BRProperties
-3-
1Q10 BRPR3
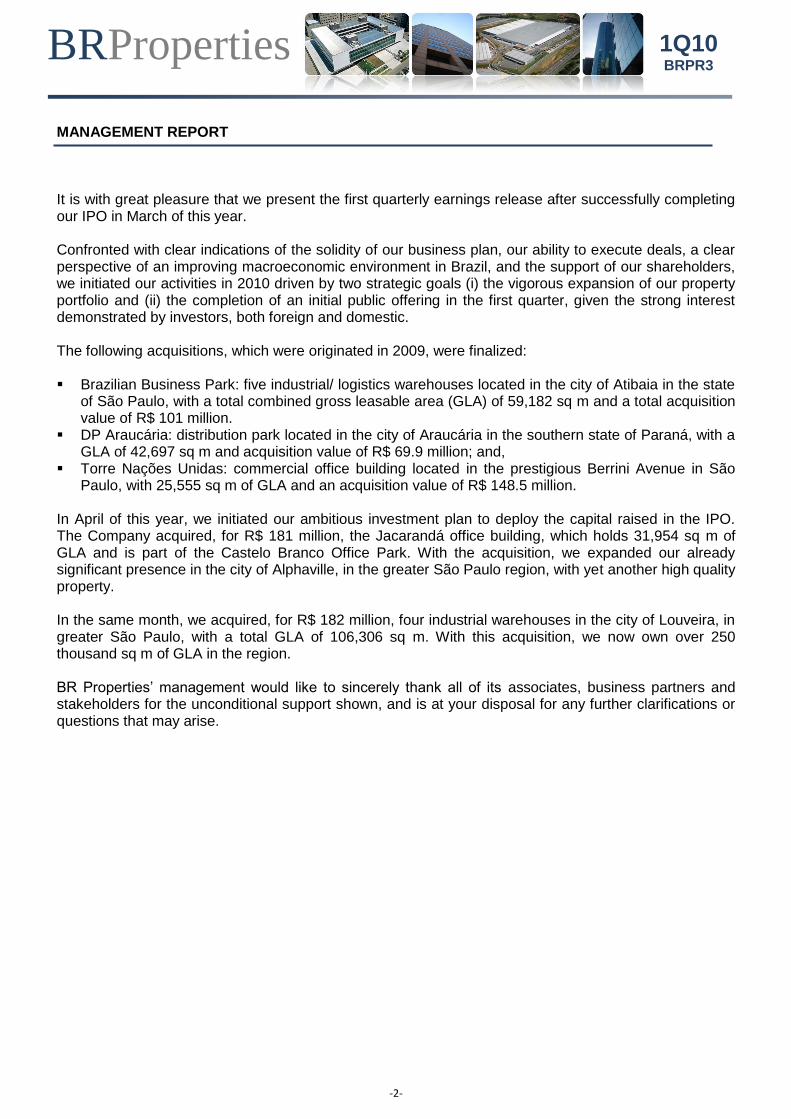
RECENT ACQUISITIONS DP Araucária On January 22nd, 2010, we acquired the property “DP Araucária”, our first acquisition of the year. The distribution park is located in the city of Araucária, in the state of Paraná, an important industrial center close to the state capital Curitiba, and with easy access to the main consumer markets. The property holds 42,697 sq m of gross leasable area (GLA) and was fully leased by DHL at the moment of the acquisition, which allowed for immediate leasing revenues. The property strengthens the presence of BR Properties in the region where it owns other properties. DP Araucária was acquired from Hines, an American real estate investment company, and the negotiations took place without the participation or brokerage fees. The distribution park was built in 2006, in a “Built to Suit” project, that intended to satisfy the needs of the companies DHL/Exel and Kraft Foods, in a seven year contract, with a renewal option of eight more years. The property offers the most sophisticated technical specifications of the region, it is partially refrigerated, and has an expansion potential of 19,610 sq m of gross leasable area (GLA). It is the most important distribution facility for Kraft Foods in Brazil. Brazilian Business Park
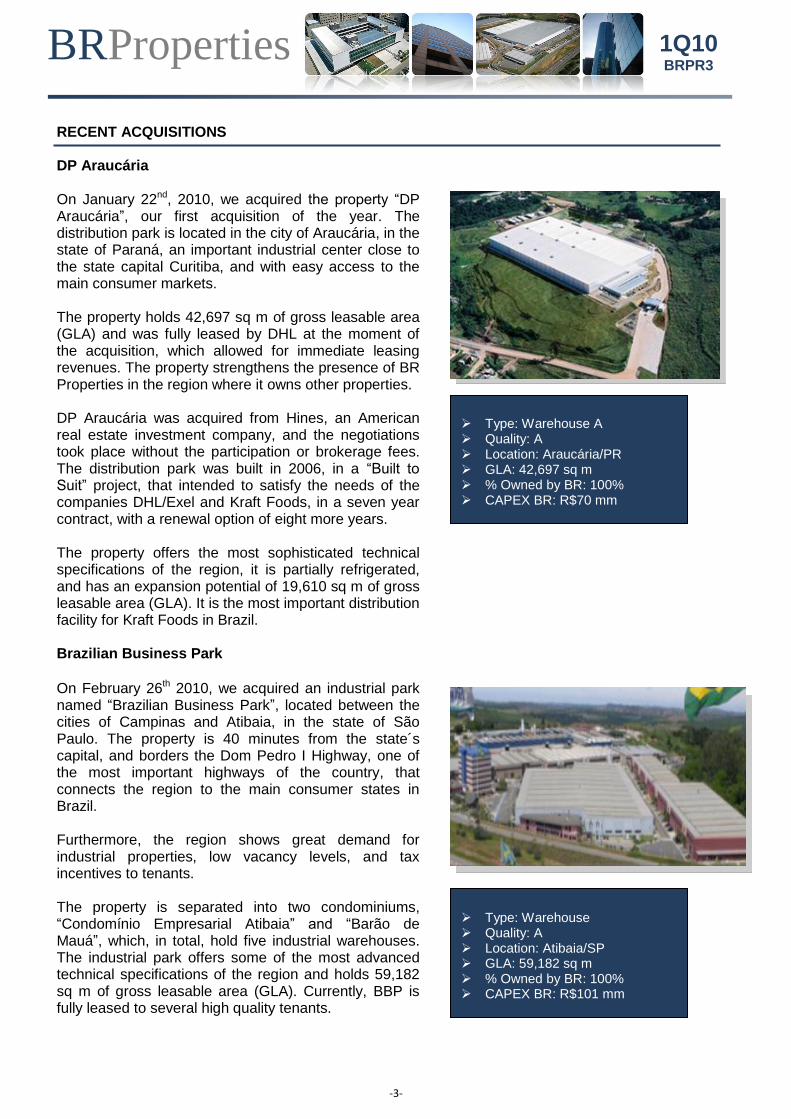
On February 26th 2010, we acquired an industrial park named “Brazilian Business Park”, located between the cities of Campinas and Atibaia, in the state of São Paulo. The property is 40 minutes from the state´s capital, and borders the Dom Pedro I Highway, one of the most important highways of the country, that connects the region to the main consumer states in Brazil. Furthermore, the region shows great demand for industrial properties, low vacancy levels, and tax incentives to tenants. The property is separated into two condominiums, “Condomínio Empresarial Atibaia” and “Barão de Mauá”, which, in total, hold five industrial warehouses. The industrial park offers some of the most advanced technical specifications of the region and holds 59,182 sq m of gross leasable area (GLA). Currently, BBP is fully leased to several high quality tenants.
Type: Warehouse A Quality: A Location: Araucária/PR GLA: 42,697 sq m % Owned by BR: 100% CAPEX BR: R$70 mm
Type: Warehouse Quality: A Location: Atibaia/SP GLA: 59,182 sq m % Owned by BR: 100% CAPEX BR: R$101 mm
BRProperties
-4-
1Q10 BRPR3
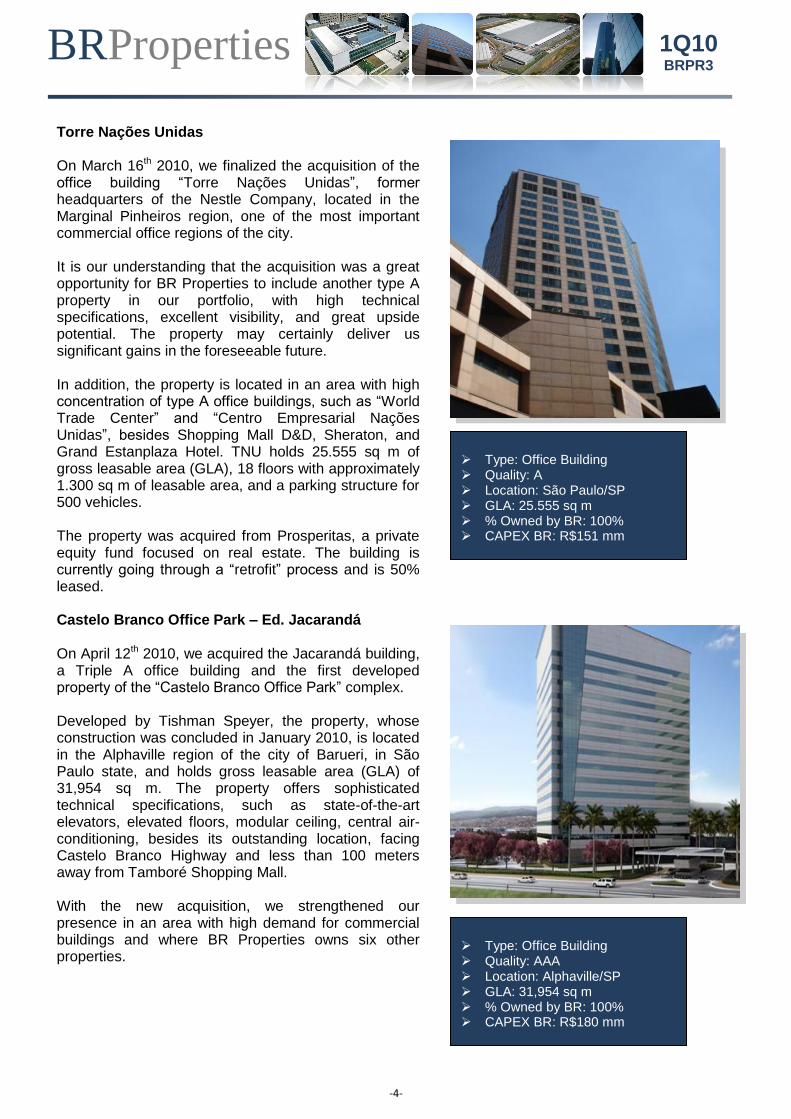
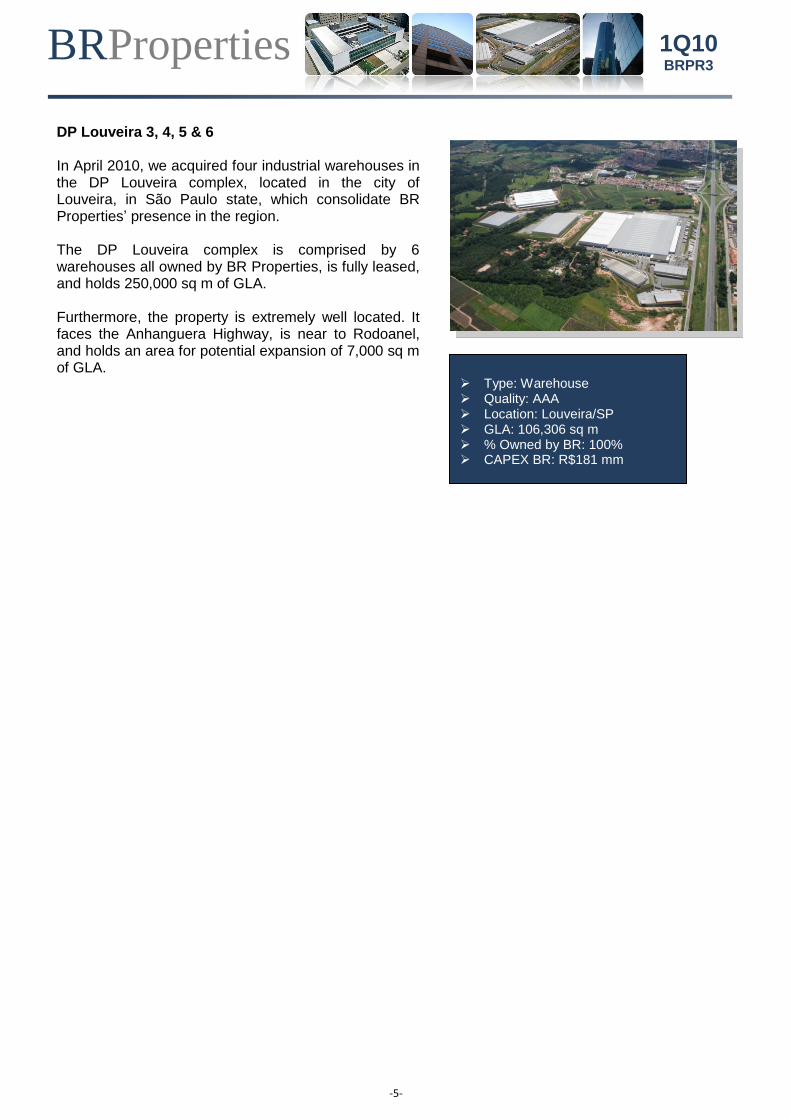
Torre Nações Unidas On March 16th 2010, we finalized the acquisition of the office building “Torre Nações Unidas”, former headquarters of the Nestle Company, located in the Marginal Pinheiros region, one of the most important commercial office regions of the city. It is our understanding that the acquisition was a great opportunity for BR Properties to include another type A property in our portfolio, with high technical specifications, excellent visibility, and great upside potential. The property may certainly deliver us significant gains in the foreseeable future. In addition, the property is located in an area with high concentration of type A office buildings, such as “World Trade Center” and “Centro Empresarial Nações Unidas”, besides Shopping Mall D&D, Sheraton, and Grand Estanplaza Hotel. TNU holds 25.555 sq m of gross leasable area (GLA), 18 floors with approximately 1.300 sq m of leasable area, and a parking structure for 500 vehicles. The property was acquired from Prosperitas, a private equity fund focused on real estate. The building is currently going through a “retrofit” process and is 50% leased. Castelo Branco Office Park – Ed. Jacarandá On April 12th 2010, we acquired the Jacarandá building, a Triple A office building and the first developed property of the “Castelo Branco Office Park” complex. Developed by Tishman Speyer, the property, whose construction was concluded in January 2010, is located in the Alphaville region of the city of Barueri, in São Paulo state, and holds gross leasable area (GLA) of 31,954 sq m. The property offers sophisticated technical specifications, such as state-of-the-art elevators, elevated floors, modular ceiling, central air-conditioning, besides its outstanding location, facing Castelo Branco Highway and less than 100 meters away from Tamboré Shopping Mall. With the new acquisition, we strengthened our presence in an area with high demand for commercial buildings and where BR Properties owns six other properties.
Type: Office Building Quality: AAA Location: Alphaville/SP GLA: 31,954 sq m % Owned by BR: 100% CAPEX BR: R$180 mm
Type: Office Building Quality: A Location: São Paulo/SP GLA: 25.555 sq m % Owned by BR: 100% CAPEX BR: R$151 mm
BRProperties
-5-
1Q10 BRPR3
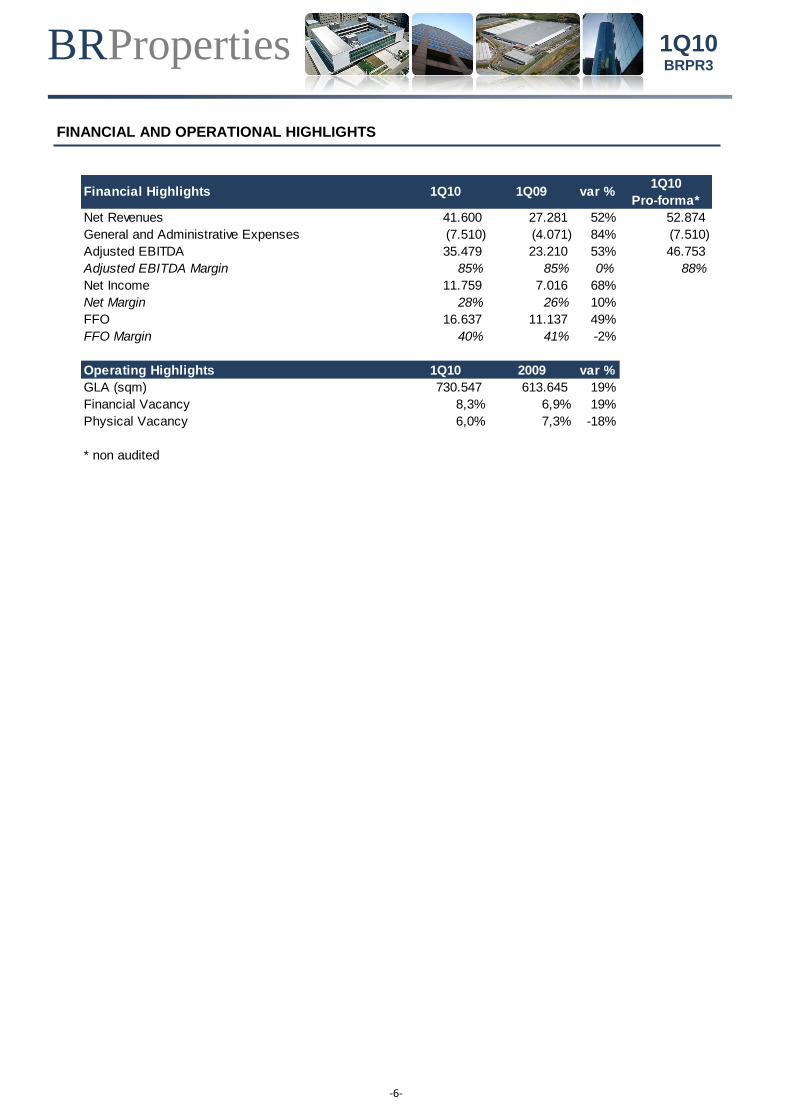
DP Louveira 3, 4, 5 & 6 In April 2010, we acquired four industrial warehouses in the DP Louveira complex, located in the city of Louveira, in São Paulo state, which consolidate BR Properties’ presence in the region. The DP Louveira complex is comprised by 6 warehouses all owned by BR Properties, is fully leased, and holds 250,000 sq m of GLA. Furthermore, the property is extremely well located. It faces the Anhanguera Highway, is near to Rodoanel, and holds an area for potential expansion of 7,000 sq m of GLA.
Type: Warehouse Quality: AAA Location: Louveira/SP GLA: 106,306 sq m % Owned by BR: 100% CAPEX BR: R$181 mm
BRProperties
-6-
1Q10 BRPR3
FINANCIAL AND OPERATIONAL HIGHLIGHTS
Financial Highlights 1Q10 1Q09 var %1Q10
Pro-forma*
Net Revenues 41.600 27.281 52% 52.874
General and Administrative Expenses (7.510) (4.071) 84% (7.510)
Adjusted EBITDA 35.479 23.210 53% 46.753
Adjusted EBITDA Margin 85% 85% 0% 88%
Net Income 11.759 7.016 68%
Net Margin 28% 26% 10%
FFO 16.637 11.137 49%
FFO Margin 40% 41% -2%
Operating Highlights 1Q10 2009 var %
GLA (sqm) 730.547 613.645 19%
Financial Vacancy 8,3% 6,9% 19%
Physical Vacancy 6,0% 7,3% -18%
* non audited
BRProperties
-7-
1Q10 BRPR3
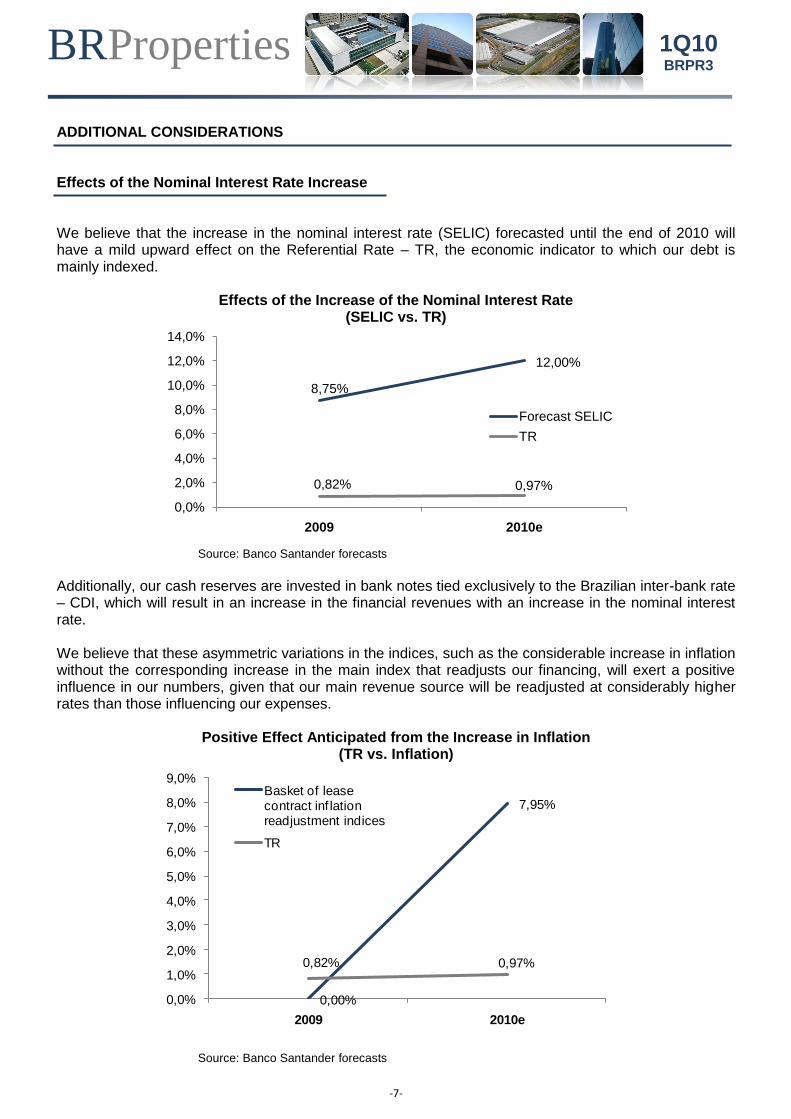
ADDITIONAL CONSIDERATIONS Effects of the Nominal Interest Rate Increase We believe that the increase in the nominal interest rate (SELIC) forecasted until the end of 2010 will have a mild upward effect on the Referential Rate – TR, the economic indicator to which our debt is mainly indexed.
Effects of the Increase of the Nominal Interest Rate
(SELIC vs. TR)
Source: Banco Santander forecasts
Additionally, our cash reserves are invested in bank notes tied exclusively to the Brazilian inter-bank rate – CDI, which will result in an increase in the financial revenues with an increase in the nominal interest rate. We believe that these asymmetric variations in the indices, such as the considerable increase in inflation without the corresponding increase in the main index that readjusts our financing, will exert a positive influence in our numbers, given that our main revenue source will be readjusted at considerably higher rates than those influencing our expenses.
Positive Effect Anticipated from the Increase in Inflation (TR vs. Inflation)
Source: Banco Santander forecasts
8,75%
12,00%
0,82% 0,97%
0,0%
2,0%
4,0%
6,0%
8,0%
10,0%
12,0%
14,0%
2009 2010e
Forecast SELIC
TR
0,00%
7,95%
0,82% 0,97%
0,0%
1,0%
2,0%
3,0%
4,0%
5,0%
6,0%
7,0%
8,0%
9,0%
2009 2010e
Basket of lease contract inf lation readjustment indices
TR
BRProperties
-8-
1Q10 BRPR3
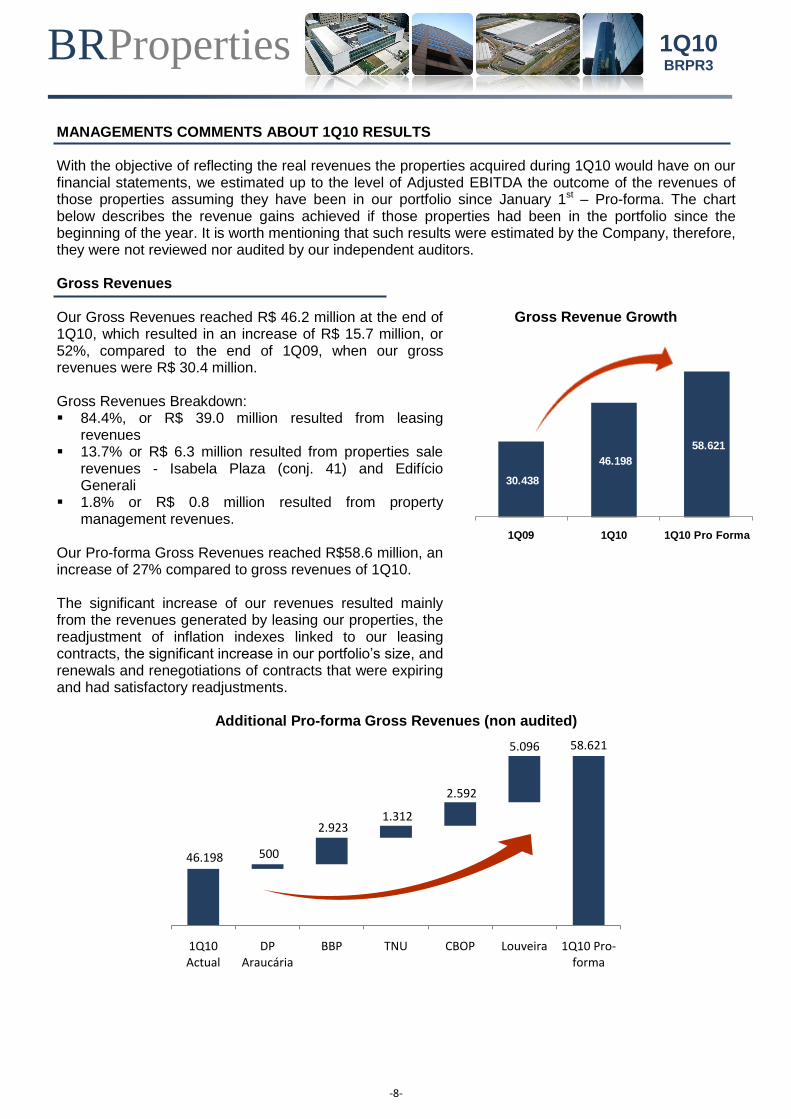
MANAGEMENTS COMMENTS ABOUT 1Q10 RESULTS With the objective of reflecting the real revenues the properties acquired during 1Q10 would have on our financial statements, we estimated up to the level of Adjusted EBITDA the outcome of the revenues of those properties assuming they have been in our portfolio since January 1st – Pro-forma. The chart below describes the revenue gains achieved if those properties had been in the portfolio since the beginning of the year. It is worth mentioning that such results were estimated by the Company, therefore, they were not reviewed nor audited by our independent auditors. Gross Revenues Our Gross Revenues reached R$ 46.2 million at the end of 1Q10, which resulted in an increase of R$ 15.7 million, or 52%, compared to the end of 1Q09, when our gross revenues were R$ 30.4 million. Gross Revenues Breakdown: 84.4%, or R$ 39.0 million resulted from leasing
revenues 13.7% or R$ 6.3 million resulted from properties sale
revenues - Isabela Plaza (conj. 41) and Edifício Generali
1.8% or R$ 0.8 million resulted from property management revenues.
Our Pro-forma Gross Revenues reached R$58.6 million, an increase of 27% compared to gross revenues of 1Q10. The significant increase of our revenues resulted mainly from the revenues generated by leasing our properties, the readjustment of inflation indexes linked to our leasing contracts, the significant increase in our portfolio’s size, and renewals and renegotiations of contracts that were expiring and had satisfactory readjustments.
Gross Revenue Growth
Additional Pro-forma Gross Revenues (non audited)
30.438
46.198
58.621
1Q09 1Q10 1Q10 Pro Forma
46.198
58.621
500
2.923 1.312
2.592
5.096
1Q10 Actual
DP Araucária
BBP TNU CBOP Louveira 1Q10 Pro-forma
BRProperties
-9-
1Q10 BRPR3
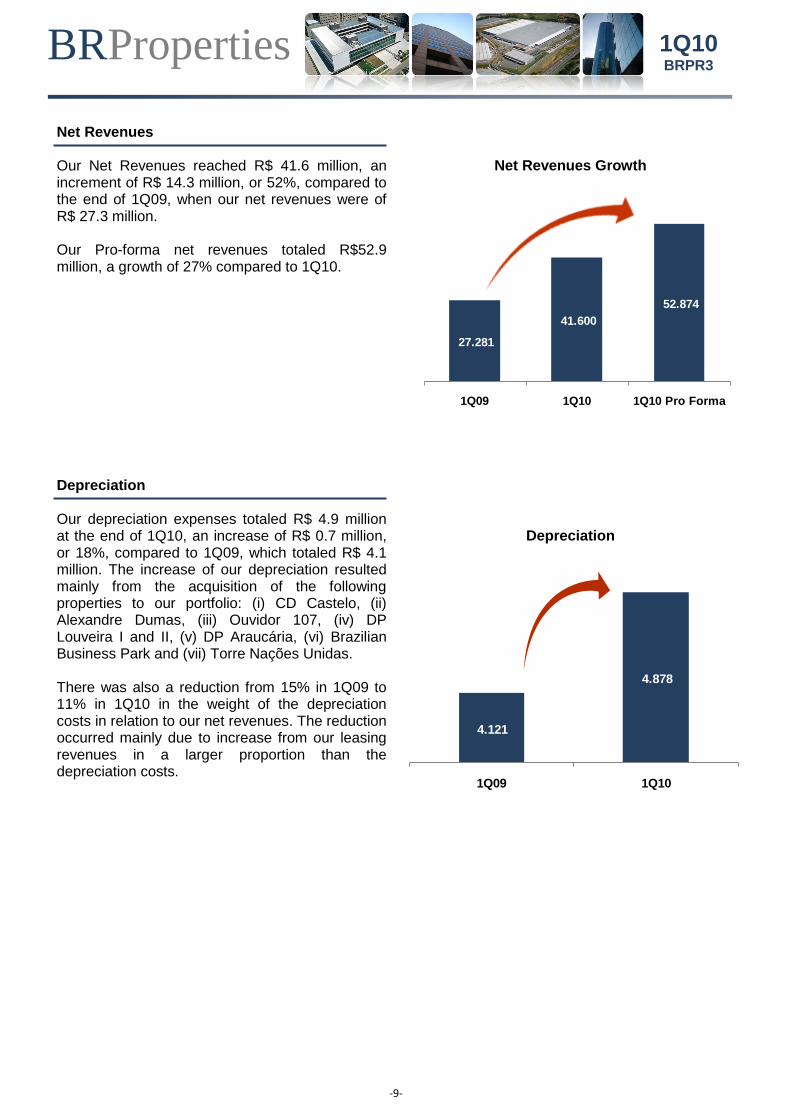
Net Revenues Our Net Revenues reached R$ 41.6 million, an increment of R$ 14.3 million, or 52%, compared to the end of 1Q09, when our net revenues were of R$ 27.3 million. Our Pro-forma net revenues totaled R$52.9 million, a growth of 27% compared to 1Q10.
Net Revenues Growth
Depreciation Our depreciation expenses totaled R$ 4.9 million at the end of 1Q10, an increase of R$ 0.7 million, or 18%, compared to 1Q09, which totaled R$ 4.1 million. The increase of our depreciation resulted mainly from the acquisition of the following properties to our portfolio: (i) CD Castelo, (ii) Alexandre Dumas, (iii) Ouvidor 107, (iv) DP Louveira I and II, (v) DP Araucária, (vi) Brazilian Business Park and (vii) Torre Nações Unidas. There was also a reduction from 15% in 1Q09 to 11% in 1Q10 in the weight of the depreciation costs in relation to our net revenues. The reduction occurred mainly due to increase from our leasing revenues in a larger proportion than the depreciation costs.
Depreciation
27.281
41.600
52.874
1Q09 1Q10 1Q10 Pro Forma
4.121
4.878
1Q09 1Q10
BRProperties
-10-
1Q10 BRPR3
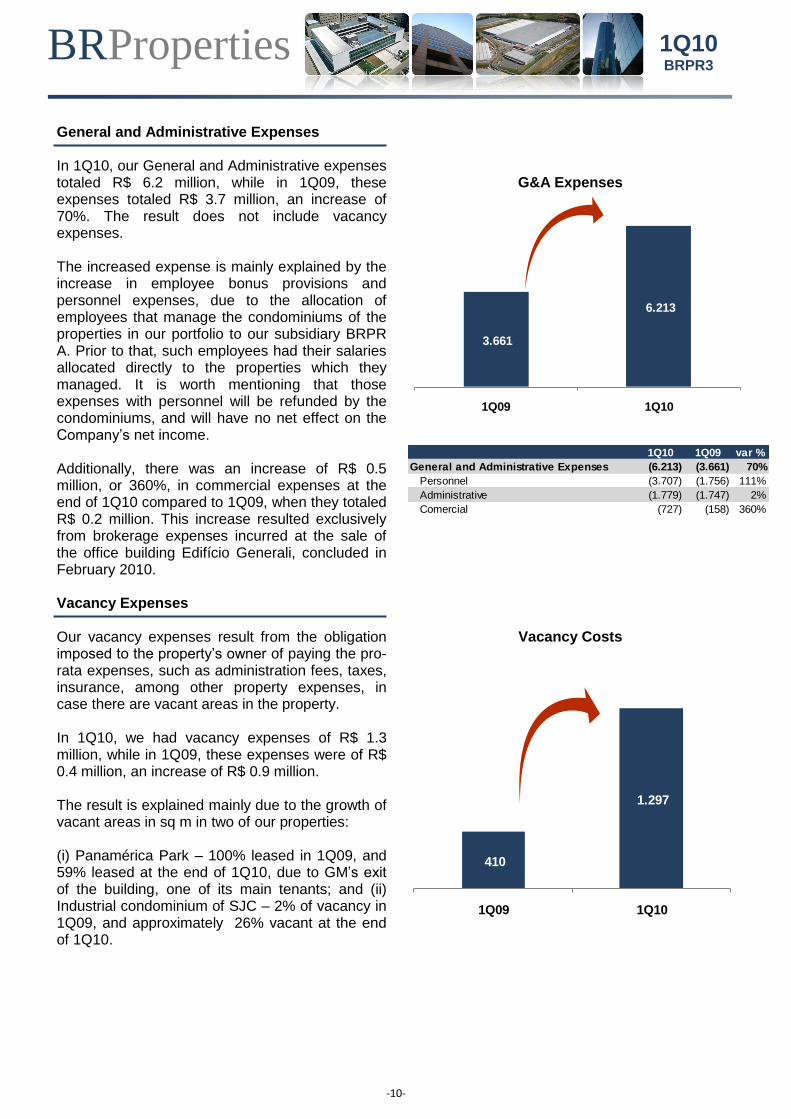
General and Administrative Expenses In 1Q10, our General and Administrative expenses totaled R$ 6.2 million, while in 1Q09, these expenses totaled R$ 3.7 million, an increase of 70%. The result does not include vacancy expenses. The increased expense is mainly explained by the increase in employee bonus provisions and personnel expenses, due to the allocation of employees that manage the condominiums of the properties in our portfolio to our subsidiary BRPR A. Prior to that, such employees had their salaries allocated directly to the properties which they managed. It is worth mentioning that those expenses with personnel will be refunded by the condominiums, and will have no net effect on the Company’s net income. Additionally, there was an increase of R$ 0.5 million, or 360%, in commercial expenses at the end of 1Q10 compared to 1Q09, when they totaled R$ 0.2 million. This increase resulted exclusively from brokerage expenses incurred at the sale of the office building Edifício Generali, concluded in February 2010.
G&A Expenses
Vacancy Expenses Our vacancy expenses result from the obligation imposed to the property’s owner of paying the pro-rata expenses, such as administration fees, taxes, insurance, among other property expenses, in case there are vacant areas in the property. In 1Q10, we had vacancy expenses of R$ 1.3 million, while in 1Q09, these expenses were of R$ 0.4 million, an increase of R$ 0.9 million. The result is explained mainly due to the growth of vacant areas in sq m in two of our properties: (i) Panamérica Park – 100% leased in 1Q09, and 59% leased at the end of 1Q10, due to GM’s exit of the building, one of its main tenants; and (ii) Industrial condominium of SJC – 2% of vacancy in 1Q09, and approximately 26% vacant at the end of 1Q10.
Vacancy Costs
3.661
6.213
1Q09 1Q10
1Q10 1Q09 var %
General and Administrative Expenses (6.213) (3.661) 70%
Personnel (3.707) (1.756) 111%
Administrative (1.779) (1.747) 2%
Comercial (727) (158) 360%
410
1.297
1Q09 1Q10
BRProperties
-11-
1Q10 BRPR3
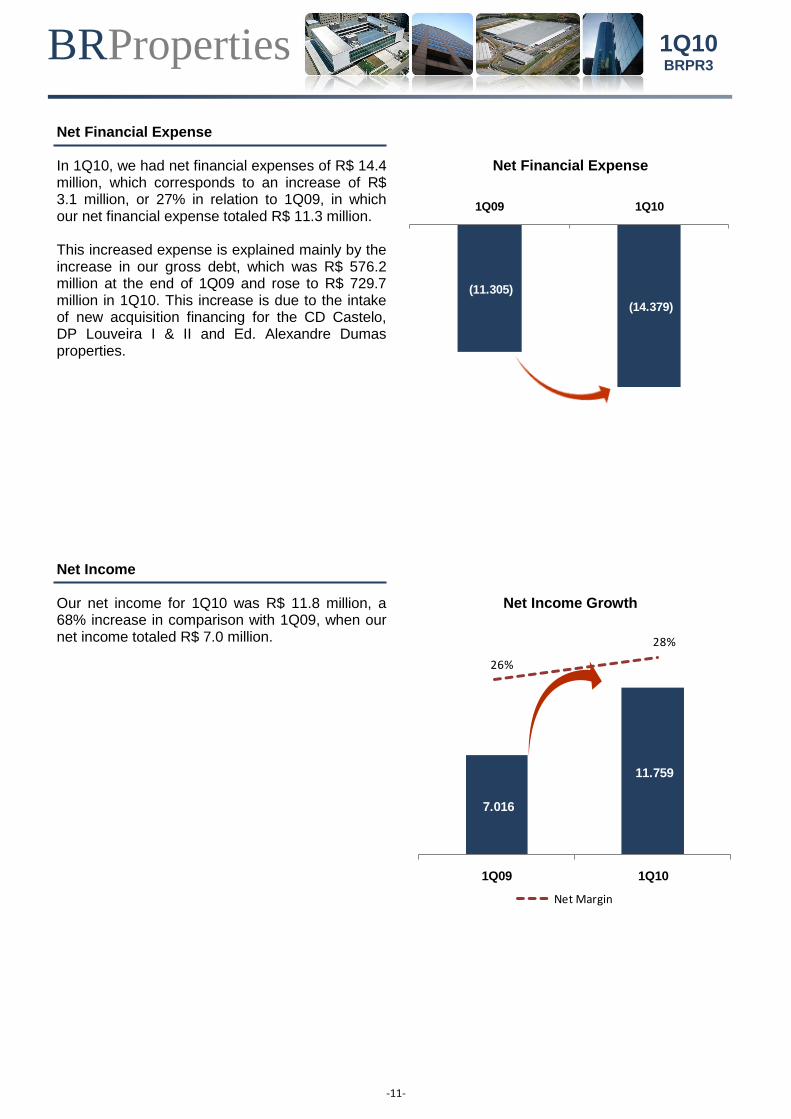
Net Financial Expense In 1Q10, we had net financial expenses of R$ 14.4 million, which corresponds to an increase of R$ 3.1 million, or 27% in relation to 1Q09, in which our net financial expense totaled R$ 11.3 million. This increased expense is explained mainly by the increase in our gross debt, which was R$ 576.2 million at the end of 1Q09 and rose to R$ 729.7 million in 1Q10. This increase is due to the intake of new acquisition financing for the CD Castelo, DP Louveira I & II and Ed. Alexandre Dumas properties.
Net Financial Expense
Net Income Our net income for 1Q10 was R$ 11.8 million, a 68% increase in comparison with 1Q09, when our net income totaled R$ 7.0 million.
Net Income Growth
(11.305)
(14.379)
1Q09 1Q10
7.016
11.759
1Q09 1Q10
26%
28%
Net Margin
BRProperties
-12-
1Q10 BRPR3
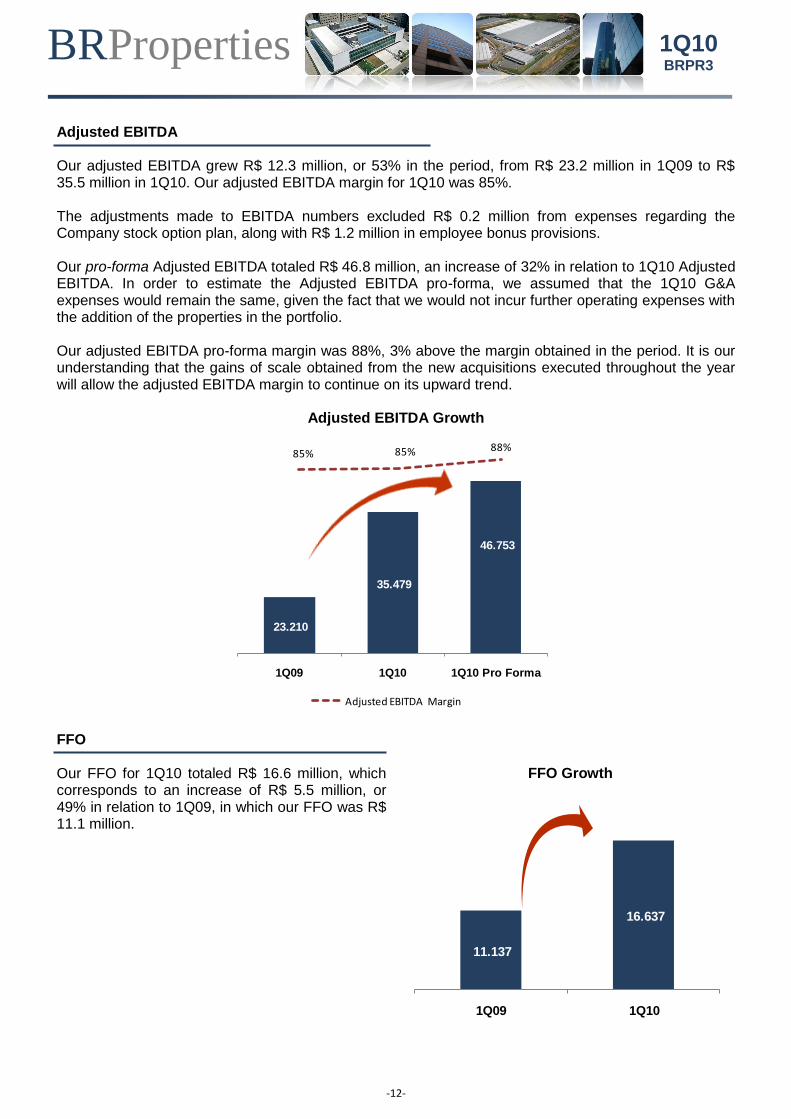
Adjusted EBITDA Our adjusted EBITDA grew R$ 12.3 million, or 53% in the period, from R$ 23.2 million in 1Q09 to R$ 35.5 million in 1Q10. Our adjusted EBITDA margin for 1Q10 was 85%. The adjustments made to EBITDA numbers excluded R$ 0.2 million from expenses regarding the Company stock option plan, along with R$ 1.2 million in employee bonus provisions. Our pro-forma Adjusted EBITDA totaled R$ 46.8 million, an increase of 32% in relation to 1Q10 Adjusted EBITDA. In order to estimate the Adjusted EBITDA pro-forma, we assumed that the 1Q10 G&A expenses would remain the same, given the fact that we would not incur further operating expenses with the addition of the properties in the portfolio. Our adjusted EBITDA pro-forma margin was 88%, 3% above the margin obtained in the period. It is our understanding that the gains of scale obtained from the new acquisitions executed throughout the year will allow the adjusted EBITDA margin to continue on its upward trend.
Adjusted EBITDA Growth
FFO Our FFO for 1Q10 totaled R$ 16.6 million, which corresponds to an increase of R$ 5.5 million, or 49% in relation to 1Q09, in which our FFO was R$ 11.1 million.
FFO Growth
23.210
35.479
46.753
1Q09 1Q10 1Q10 Pro Forma
85% 85% 88%
Adjusted EBITDA Margin
11.137
16.637
1Q09 1Q10
BRProperties
-13-
1Q10 BRPR3
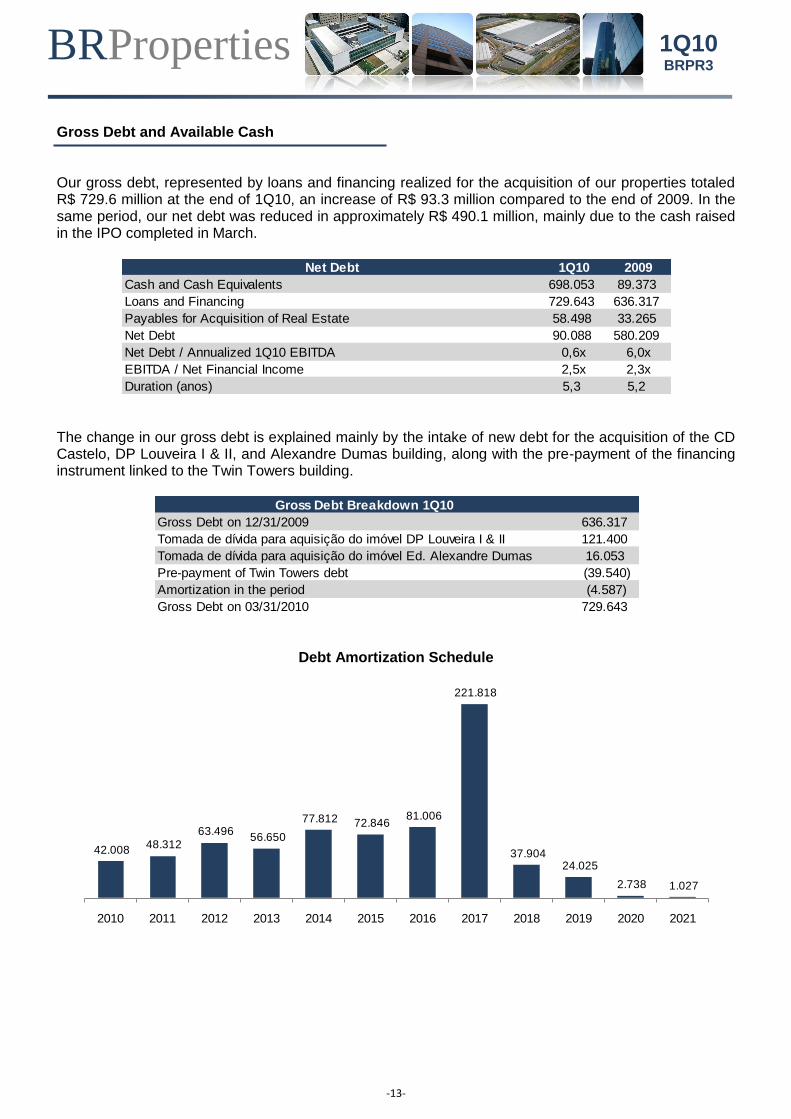
Gross Debt and Available Cash Our gross debt, represented by loans and financing realized for the acquisition of our properties totaled R$ 729.6 million at the end of 1Q10, an increase of R$ 93.3 million compared to the end of 2009. In the same period, our net debt was reduced in approximately R$ 490.1 million, mainly due to the cash raised in the IPO completed in March.
The change in our gross debt is explained mainly by the intake of new debt for the acquisition of the CD Castelo, DP Louveira I & II, and Alexandre Dumas building, along with the pre-payment of the financing instrument linked to the Twin Towers building.
Debt Amortization Schedule
Net Debt 1Q10 2009
Cash and Cash Equivalents 698.053 89.373
Loans and Financing 729.643 636.317
Payables for Acquisition of Real Estate 58.498 33.265
Net Debt 90.088 580.209
Net Debt / Annualized 1Q10 EBITDA 0,6x 6,0x
EBITDA / Net Financial Income 2,5x 2,3x
Duration (anos) 5,3 5,2
Gross Debt Breakdown 1Q10
Gross Debt on 12/31/2009 636.317
Tomada de dívida para aquisição do imóvel DP Louveira I & II 121.400
Tomada de dívida para aquisição do imóvel Ed. Alexandre Dumas 16.053
Pre-payment of Twin Towers debt (39.540)
Amortization in the period (4.587)
Gross Debt on 03/31/2010 729.643
42.008 48.312
63.496 56.650
77.812 72.846 81.006
221.818
37.904 24.025
2.738 1.027
2010 2011 2012 2013 2014 2015 2016 2017 2018 2019 2020 2021
BRProperties
-14-
1Q10 BRPR3
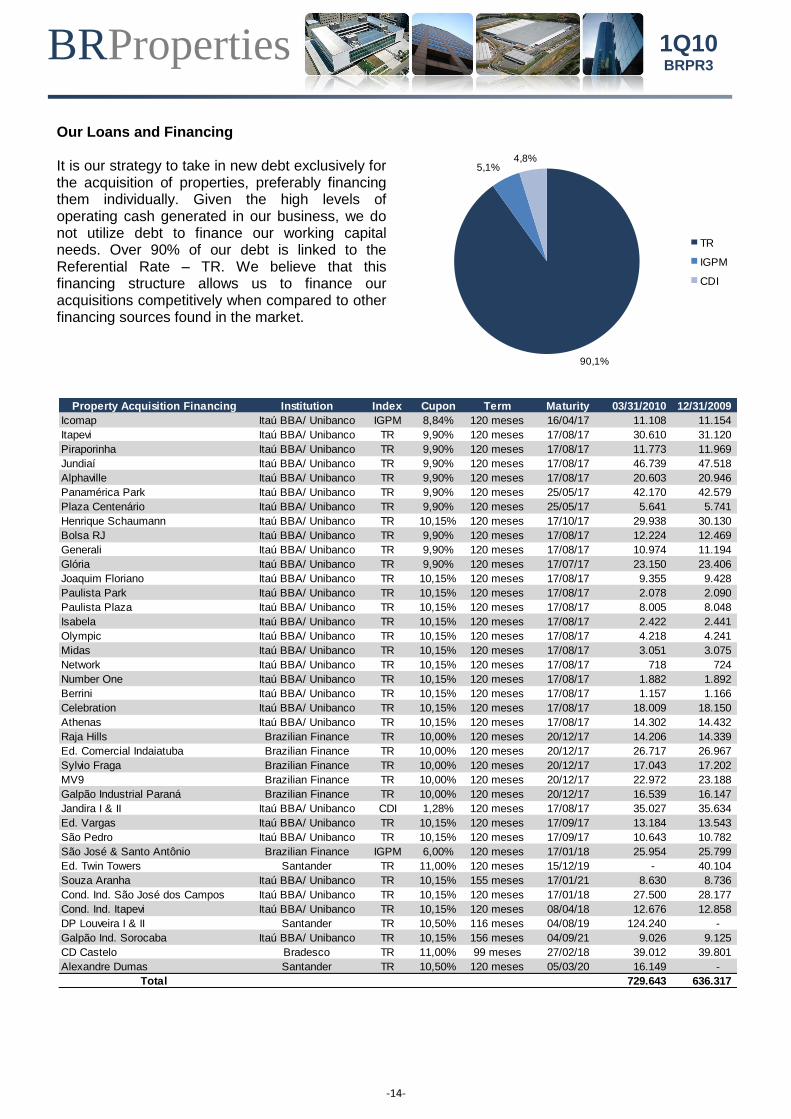
Our Loans and Financing It is our strategy to take in new debt exclusively for the acquisition of properties, preferably financing them individually. Given the high levels of operating cash generated in our business, we do not utilize debt to finance our working capital needs. Over 90% of our debt is linked to the Referential Rate – TR. We believe that this financing structure allows us to finance our acquisitions competitively when compared to other financing sources found in the market.
90,1%
5,1%4,8%
TR
IGPM
CDI
Property Acquisition Financing Institution Index Cupon Term Maturity 03/31/2010 12/31/2009
Icomap Itaú BBA/ Unibanco IGPM 8,84% 120 meses 16/04/17 11.108 11.154
Itapevi Itaú BBA/ Unibanco TR 9,90% 120 meses 17/08/17 30.610 31.120
Piraporinha Itaú BBA/ Unibanco TR 9,90% 120 meses 17/08/17 11.773 11.969
Jundiaí Itaú BBA/ Unibanco TR 9,90% 120 meses 17/08/17 46.739 47.518
Alphaville Itaú BBA/ Unibanco TR 9,90% 120 meses 17/08/17 20.603 20.946
Panamérica Park Itaú BBA/ Unibanco TR 9,90% 120 meses 25/05/17 42.170 42.579
Plaza Centenário Itaú BBA/ Unibanco TR 9,90% 120 meses 25/05/17 5.641 5.741
Henrique Schaumann Itaú BBA/ Unibanco TR 10,15% 120 meses 17/10/17 29.938 30.130
Bolsa RJ Itaú BBA/ Unibanco TR 9,90% 120 meses 17/08/17 12.224 12.469
Generali Itaú BBA/ Unibanco TR 9,90% 120 meses 17/08/17 10.974 11.194
Glória Itaú BBA/ Unibanco TR 9,90% 120 meses 17/07/17 23.150 23.406
Joaquim Floriano Itaú BBA/ Unibanco TR 10,15% 120 meses 17/08/17 9.355 9.428
Paulista Park Itaú BBA/ Unibanco TR 10,15% 120 meses 17/08/17 2.078 2.090
Paulista Plaza Itaú BBA/ Unibanco TR 10,15% 120 meses 17/08/17 8.005 8.048
Isabela Itaú BBA/ Unibanco TR 10,15% 120 meses 17/08/17 2.422 2.441
Olympic Itaú BBA/ Unibanco TR 10,15% 120 meses 17/08/17 4.218 4.241
Midas Itaú BBA/ Unibanco TR 10,15% 120 meses 17/08/17 3.051 3.075
Network Itaú BBA/ Unibanco TR 10,15% 120 meses 17/08/17 718 724
Number One Itaú BBA/ Unibanco TR 10,15% 120 meses 17/08/17 1.882 1.892
Berrini Itaú BBA/ Unibanco TR 10,15% 120 meses 17/08/17 1.157 1.166
Celebration Itaú BBA/ Unibanco TR 10,15% 120 meses 17/08/17 18.009 18.150
Athenas Itaú BBA/ Unibanco TR 10,15% 120 meses 17/08/17 14.302 14.432
Raja Hills Brazilian Finance TR 10,00% 120 meses 20/12/17 14.206 14.339
Ed. Comercial Indaiatuba Brazilian Finance TR 10,00% 120 meses 20/12/17 26.717 26.967
Sylvio Fraga Brazilian Finance TR 10,00% 120 meses 20/12/17 17.043 17.202
MV9 Brazilian Finance TR 10,00% 120 meses 20/12/17 22.972 23.188
Galpão Industrial Paraná Brazilian Finance TR 10,00% 120 meses 20/12/17 16.539 16.147
Jandira I & II Itaú BBA/ Unibanco CDI 1,28% 120 meses 17/08/17 35.027 35.634
Ed. Vargas Itaú BBA/ Unibanco TR 10,15% 120 meses 17/09/17 13.184 13.543
São Pedro Itaú BBA/ Unibanco TR 10,15% 120 meses 17/09/17 10.643 10.782
São José & Santo Antônio Brazilian Finance IGPM 6,00% 120 meses 17/01/18 25.954 25.799
Ed. Twin Towers Santander TR 11,00% 120 meses 15/12/19 - 40.104
Souza Aranha Itaú BBA/ Unibanco TR 10,15% 155 meses 17/01/21 8.630 8.736
Cond. Ind. São José dos Campos Itaú BBA/ Unibanco TR 10,15% 120 meses 17/01/18 27.500 28.177
Cond. Ind. Itapevi Itaú BBA/ Unibanco TR 10,15% 120 meses 08/04/18 12.676 12.858
DP Louveira I & II Santander TR 10,50% 116 meses 04/08/19 124.240 -
Galpão Ind. Sorocaba Itaú BBA/ Unibanco TR 10,15% 156 meses 04/09/21 9.026 9.125
CD Castelo Bradesco TR 11,00% 99 meses 27/02/18 39.012 39.801
Alexandre Dumas Santander TR 10,50% 120 meses 05/03/20 16.149 -
Total 729.643 636.317
BRProperties
-15-
1Q10 BRPR3
Available Cash Our available cash resources totaled R$ 698.1 million at the end of the quarter, an increase of R$ 608.7 million when compared to year-end 2009. This increase is explained mainly by the IPO completed in March, in which we raised net cash from new investors to the sum of R$ 726.7 million. Our conservative stance in regards to our cash resources, along with restrictions imposed by our short-term investment policy approved by our Board of Directors, makes it so that we invest our cash resources exclusively in bank notes from top quality financial institutions. At the end of 1Q10, the average yield on our short-term investments was 100.5% of CDI, the Brazilian inter-bank loan rate.
Cash and Cash Equivalents 1Q10 2009
Cash and Cash Equivalents 698.053 89.373
Average yield on short-term investments (% CDI) 100,5% 99,4%
BRProperties
-16-
1Q10 BRPR3
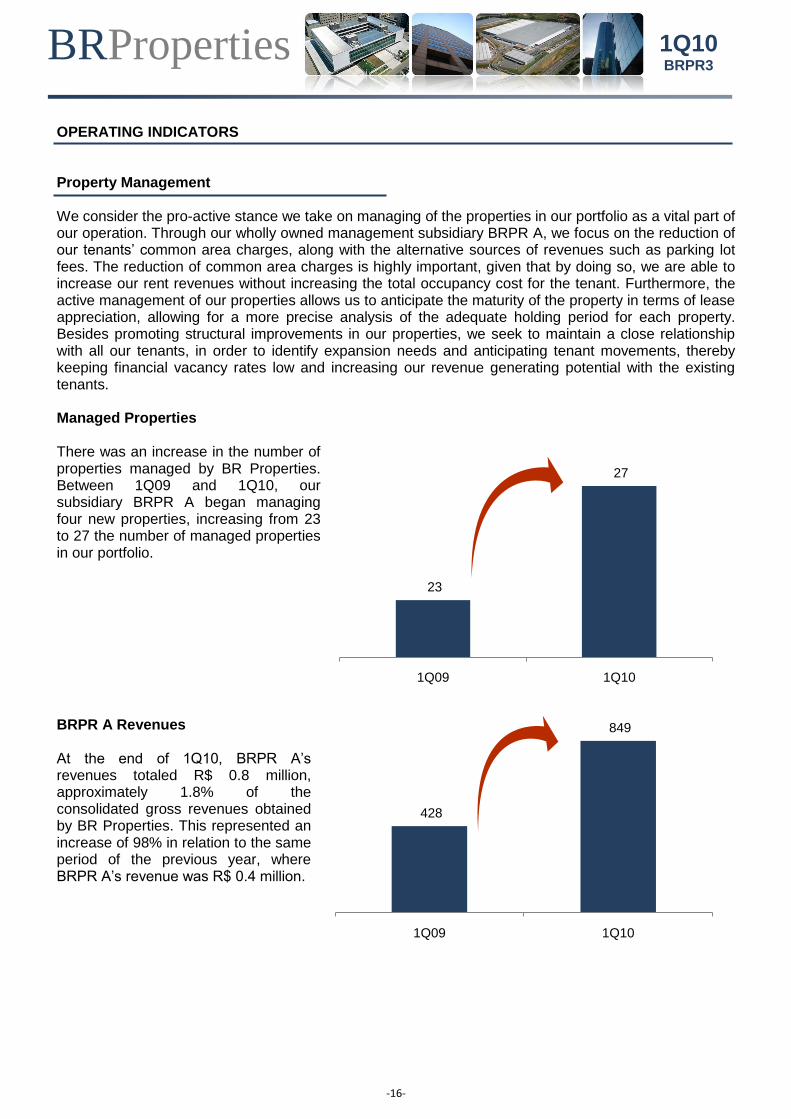
OPERATING INDICATORS Property Management We consider the pro-active stance we take on managing of the properties in our portfolio as a vital part of our operation. Through our wholly owned management subsidiary BRPR A, we focus on the reduction of our tenants’ common area charges, along with the alternative sources of revenues such as parking lot fees. The reduction of common area charges is highly important, given that by doing so, we are able to increase our rent revenues without increasing the total occupancy cost for the tenant. Furthermore, the active management of our properties allows us to anticipate the maturity of the property in terms of lease appreciation, allowing for a more precise analysis of the adequate holding period for each property. Besides promoting structural improvements in our properties, we seek to maintain a close relationship with all our tenants, in order to identify expansion needs and anticipating tenant movements, thereby keeping financial vacancy rates low and increasing our revenue generating potential with the existing tenants. Managed Properties There was an increase in the number of properties managed by BR Properties. Between 1Q09 and 1Q10, our subsidiary BRPR A began managing four new properties, increasing from 23 to 27 the number of managed properties in our portfolio.
BRPR A Revenues At the end of 1Q10, BRPR A’s revenues totaled R$ 0.8 million, approximately 1.8% of the consolidated gross revenues obtained by BR Properties. This represented an increase of 98% in relation to the same period of the previous year, where BRPR A’s revenue was R$ 0.4 million.
23
27
1Q09 1Q10
428
849
1Q09 1Q10
BRProperties
-17-
1Q10 BRPR3
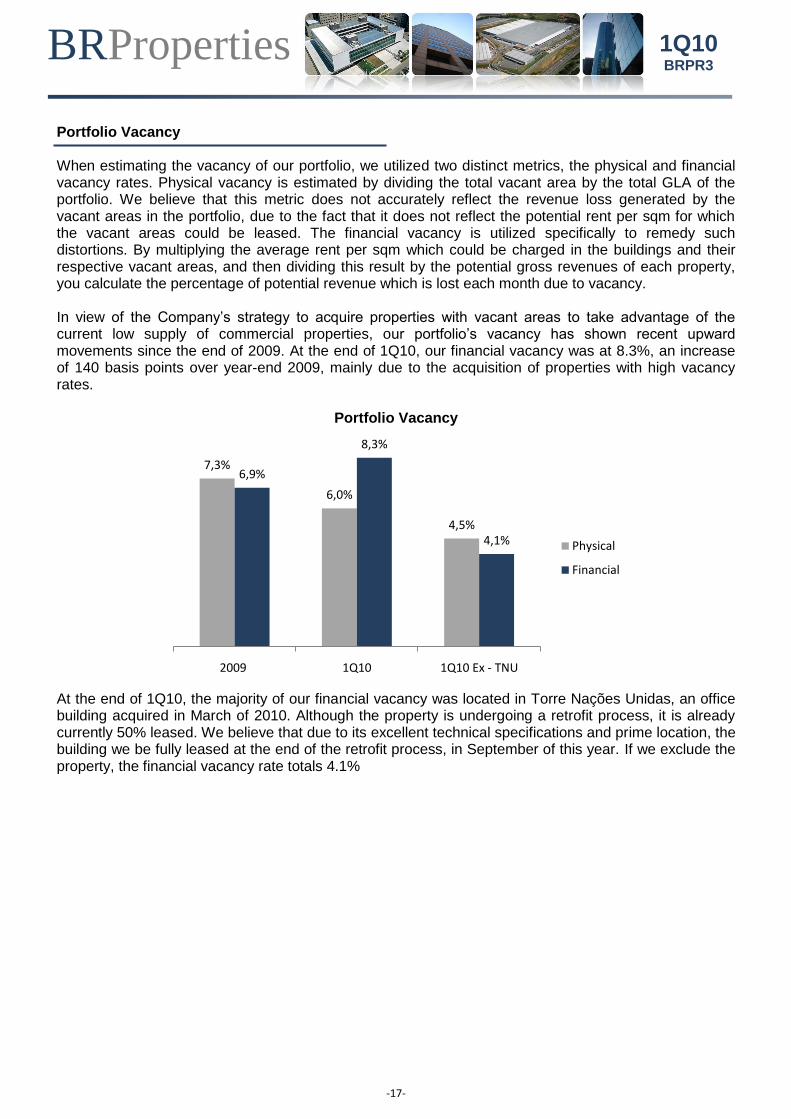
Portfolio Vacancy When estimating the vacancy of our portfolio, we utilized two distinct metrics, the physical and financial vacancy rates. Physical vacancy is estimated by dividing the total vacant area by the total GLA of the portfolio. We believe that this metric does not accurately reflect the revenue loss generated by the vacant areas in the portfolio, due to the fact that it does not reflect the potential rent per sqm for which the vacant areas could be leased. The financial vacancy is utilized specifically to remedy such distortions. By multiplying the average rent per sqm which could be charged in the buildings and their respective vacant areas, and then dividing this result by the potential gross revenues of each property, you calculate the percentage of potential revenue which is lost each month due to vacancy. In view of the Company’s strategy to acquire properties with vacant areas to take advantage of the current low supply of commercial properties, our portfolio’s vacancy has shown recent upward movements since the end of 2009. At the end of 1Q10, our financial vacancy was at 8.3%, an increase of 140 basis points over year-end 2009, mainly due to the acquisition of properties with high vacancy rates.
Portfolio Vacancy
At the end of 1Q10, the majority of our financial vacancy was located in Torre Nações Unidas, an office building acquired in March of 2010. Although the property is undergoing a retrofit process, it is already currently 50% leased. We believe that due to its excellent technical specifications and prime location, the building we be fully leased at the end of the retrofit process, in September of this year. If we exclude the property, the financial vacancy rate totals 4.1%
7,3%
6,0%
4,5%
6,9%
8,3%
4,1%
2009 1Q10 1Q10 Ex - TNU
Physical
Financial
BRProperties
-18-
1Q10 BRPR3
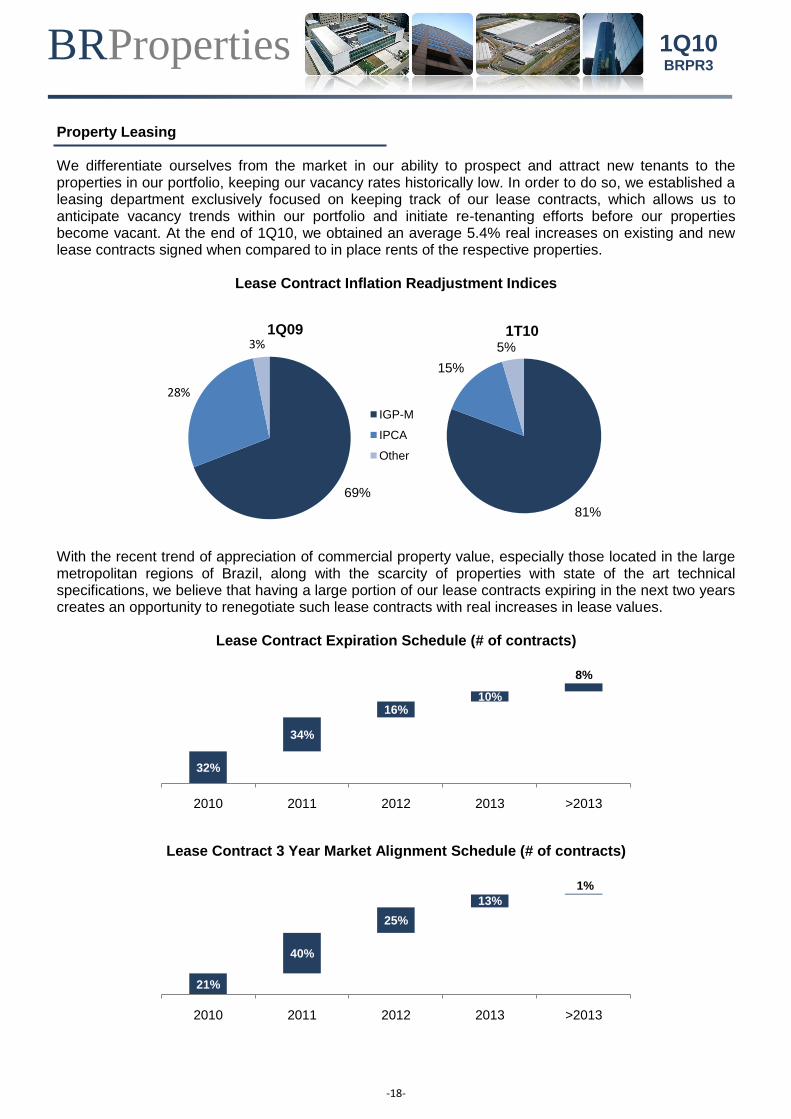
Property Leasing We differentiate ourselves from the market in our ability to prospect and attract new tenants to the properties in our portfolio, keeping our vacancy rates historically low. In order to do so, we established a leasing department exclusively focused on keeping track of our lease contracts, which allows us to anticipate vacancy trends within our portfolio and initiate re-tenanting efforts before our properties become vacant. At the end of 1Q10, we obtained an average 5.4% real increases on existing and new lease contracts signed when compared to in place rents of the respective properties.
Lease Contract Inflation Readjustment Indices
With the recent trend of appreciation of commercial property value, especially those located in the large metropolitan regions of Brazil, along with the scarcity of properties with state of the art technical specifications, we believe that having a large portion of our lease contracts expiring in the next two years creates an opportunity to renegotiate such lease contracts with real increases in lease values.
Lease Contract Expiration Schedule (# of contracts)
Lease Contract 3 Year Market Alignment Schedule (# of contracts)
69%
28%
3%1Q09
IGP-M
IPCA
Other
81%
15%
5%
1T10
32%
34%
16%10%
8%
2010 2011 2012 2013 >2013
21%
40%
25%
13%
1%
2010 2011 2012 2013 >2013
BRProperties
-19-
1Q10 BRPR3
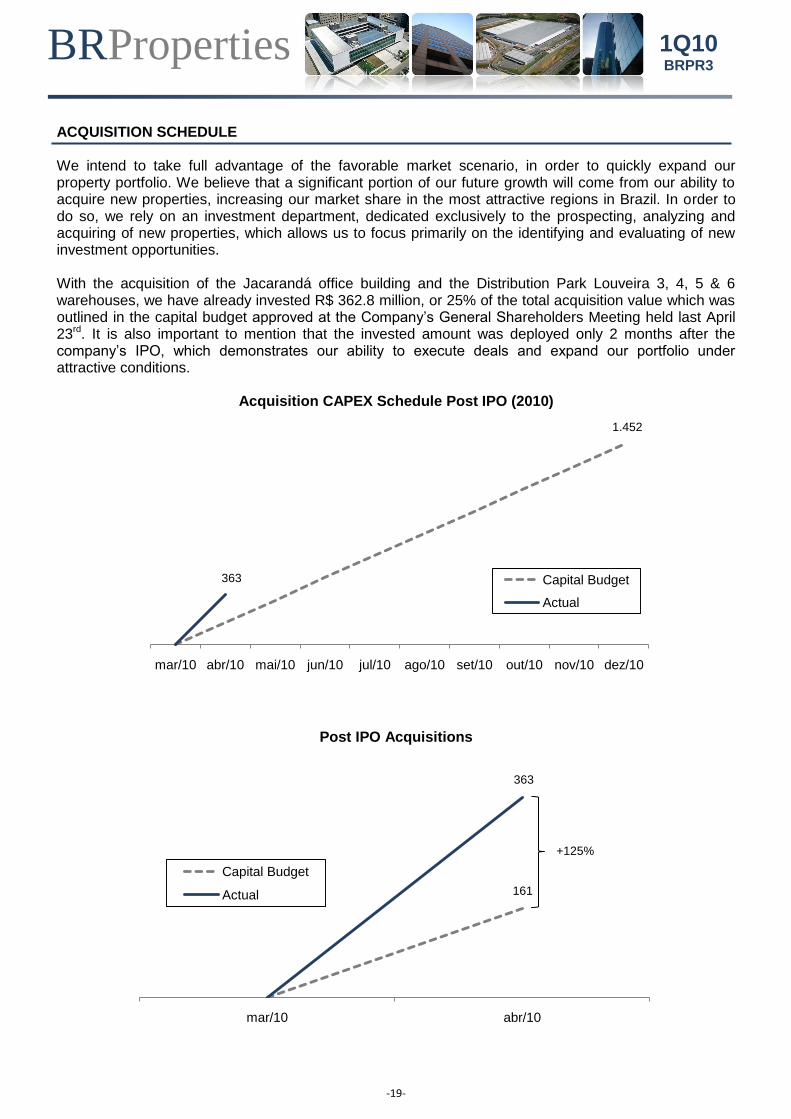
ACQUISITION SCHEDULE We intend to take full advantage of the favorable market scenario, in order to quickly expand our property portfolio. We believe that a significant portion of our future growth will come from our ability to acquire new properties, increasing our market share in the most attractive regions in Brazil. In order to do so, we rely on an investment department, dedicated exclusively to the prospecting, analyzing and acquiring of new properties, which allows us to focus primarily on the identifying and evaluating of new investment opportunities. With the acquisition of the Jacarandá office building and the Distribution Park Louveira 3, 4, 5 & 6 warehouses, we have already invested R$ 362.8 million, or 25% of the total acquisition value which was outlined in the capital budget approved at the Company’s General Shareholders Meeting held last April 23rd. It is also important to mention that the invested amount was deployed only 2 months after the company’s IPO, which demonstrates our ability to execute deals and expand our portfolio under attractive conditions.
Acquisition CAPEX Schedule Post IPO (2010)
Post IPO Acquisitions
mar/10 abr/10 mai/10 jun/10 jul/10 ago/10 set/10 out/10 nov/10 dez/10
Capital Budget
Actual
363
1.452
mar/10 abr/10
Capital Budget
Actual
+125%
363
161
BRProperties
-20-
1Q10 BRPR3
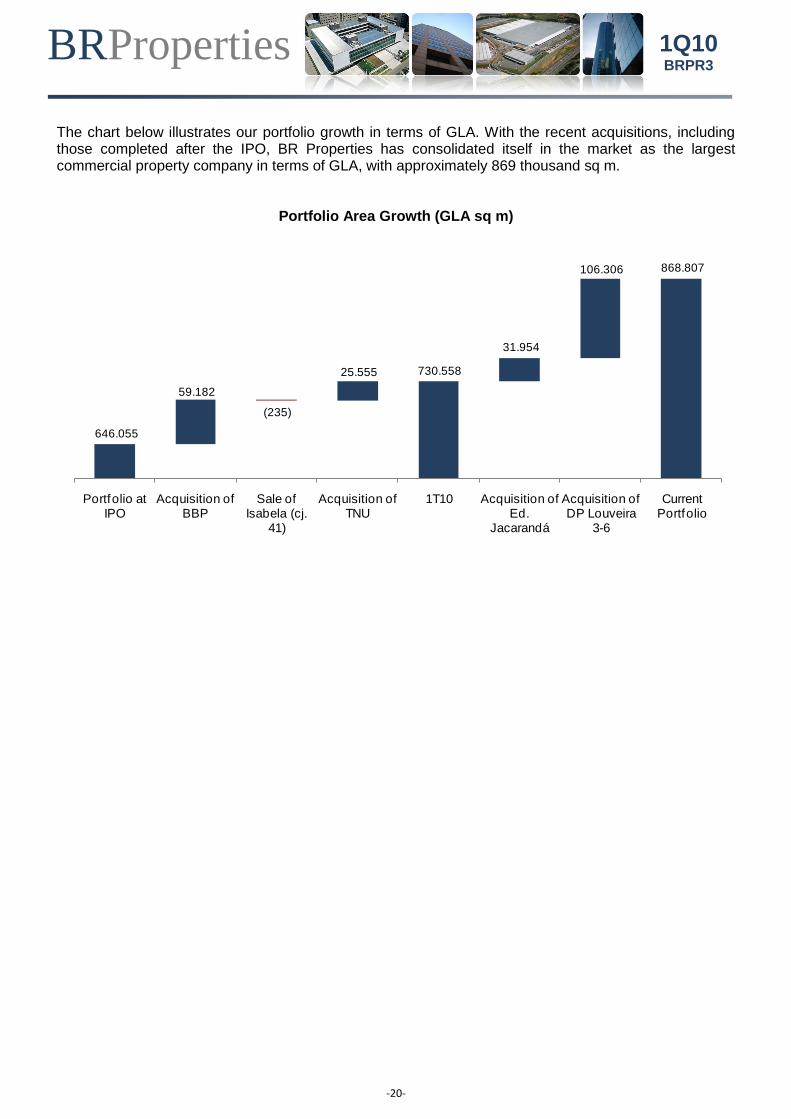
The chart below illustrates our portfolio growth in terms of GLA. With the recent acquisitions, including those completed after the IPO, BR Properties has consolidated itself in the market as the largest commercial property company in terms of GLA, with approximately 869 thousand sq m.
Portfolio Area Growth (GLA sq m)
646.055
730.558
868.807
59.182
(235)
25.555
31.954
106.306
Portfolio at IPO
Acquisition of BBP
Sale of Isabela (cj.
41)
Acquisition of TNU
1T10 Acquisition of Ed.
Jacarandá
Acquisition of DP Louveira
3-6
Current Portfolio
BRProperties
-21-
1Q10 BRPR3
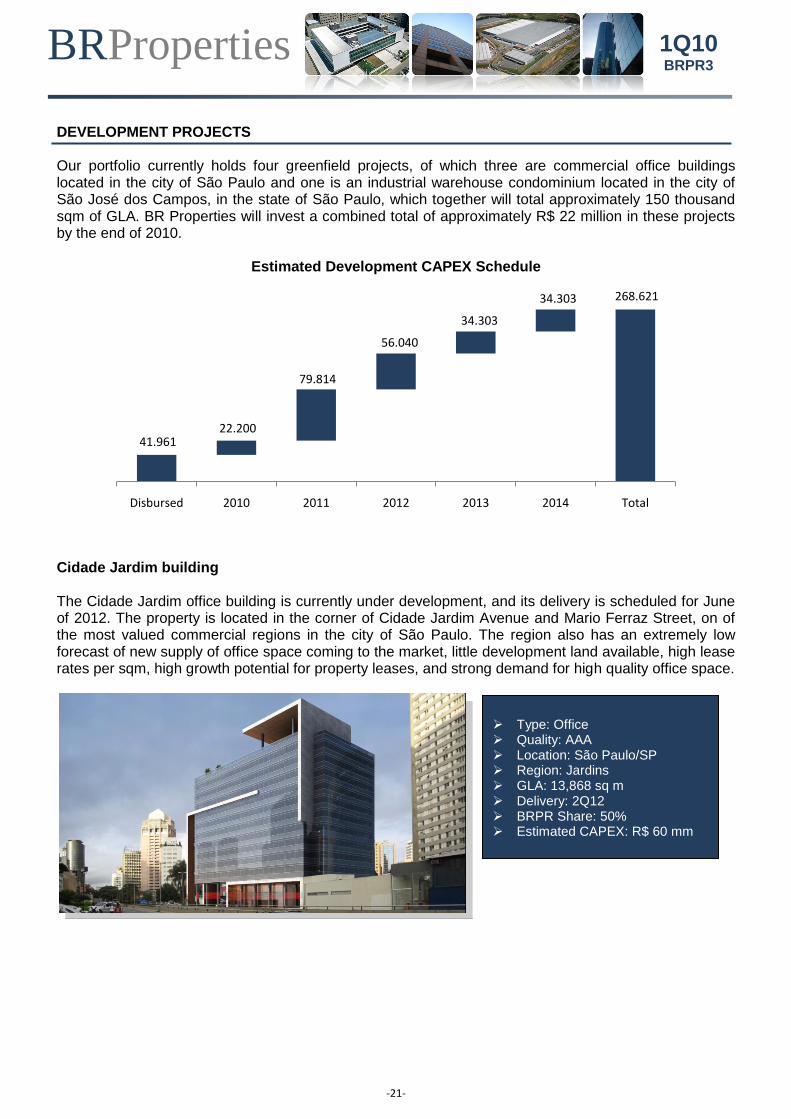
DEVELOPMENT PROJECTS Our portfolio currently holds four greenfield projects, of which three are commercial office buildings located in the city of São Paulo and one is an industrial warehouse condominium located in the city of São José dos Campos, in the state of São Paulo, which together will total approximately 150 thousand sqm of GLA. BR Properties will invest a combined total of approximately R$ 22 million in these projects by the end of 2010.
Estimated Development CAPEX Schedule
Cidade Jardim building The Cidade Jardim office building is currently under development, and its delivery is scheduled for June of 2012. The property is located in the corner of Cidade Jardim Avenue and Mario Ferraz Street, on of the most valued commercial regions in the city of São Paulo. The region also has an extremely low forecast of new supply of office space coming to the market, little development land available, high lease rates per sqm, high growth potential for property leases, and strong demand for high quality office space.
41.961
268.621
22.200
79.814
56.040
34.303
34.303
Disbursed 2010 2011 2012 2013 2014 Total
Type: Office Quality: AAA Location: São Paulo/SP Region: Jardins GLA: 13,868 sq m Delivery: 2Q12 BRPR Share: 50% Estimated CAPEX: R$ 60 mm
BRProperties
-22-
1Q10 BRPR3
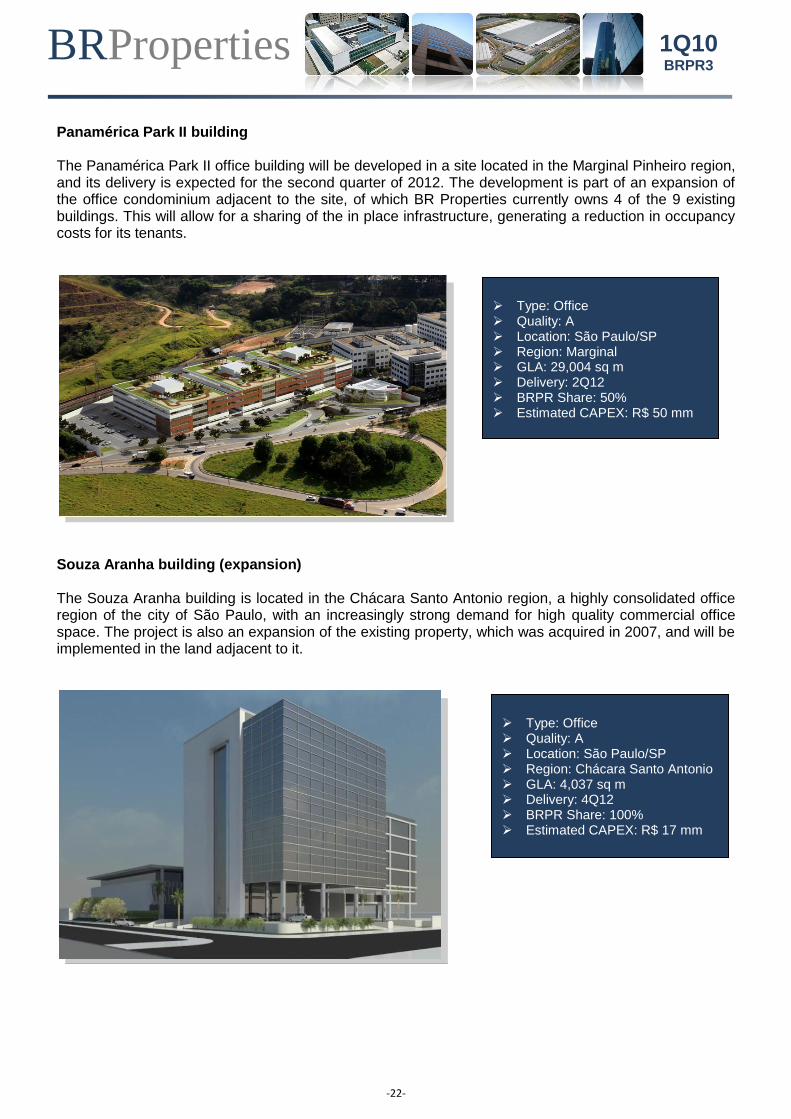
Panamérica Park II building The Panamérica Park II office building will be developed in a site located in the Marginal Pinheiro region, and its delivery is expected for the second quarter of 2012. The development is part of an expansion of the office condominium adjacent to the site, of which BR Properties currently owns 4 of the 9 existing buildings. This will allow for a sharing of the in place infrastructure, generating a reduction in occupancy costs for its tenants.
Souza Aranha building (expansion) The Souza Aranha building is located in the Chácara Santo Antonio region, a highly consolidated office region of the city of São Paulo, with an increasingly strong demand for high quality commercial office space. The project is also an expansion of the existing property, which was acquired in 2007, and will be implemented in the land adjacent to it.
Type: Office Quality: A Location: São Paulo/SP Region: Marginal GLA: 29,004 sq m Delivery: 2Q12 BRPR Share: 50% Estimated CAPEX: R$ 50 mm
Type: Office Quality: A Location: São Paulo/SP Region: Chácara Santo Antonio GLA: 4,037 sq m Delivery: 4Q12 BRPR Share: 100% Estimated CAPEX: R$ 17 mm
BRProperties
-23-
1Q10 BRPR3
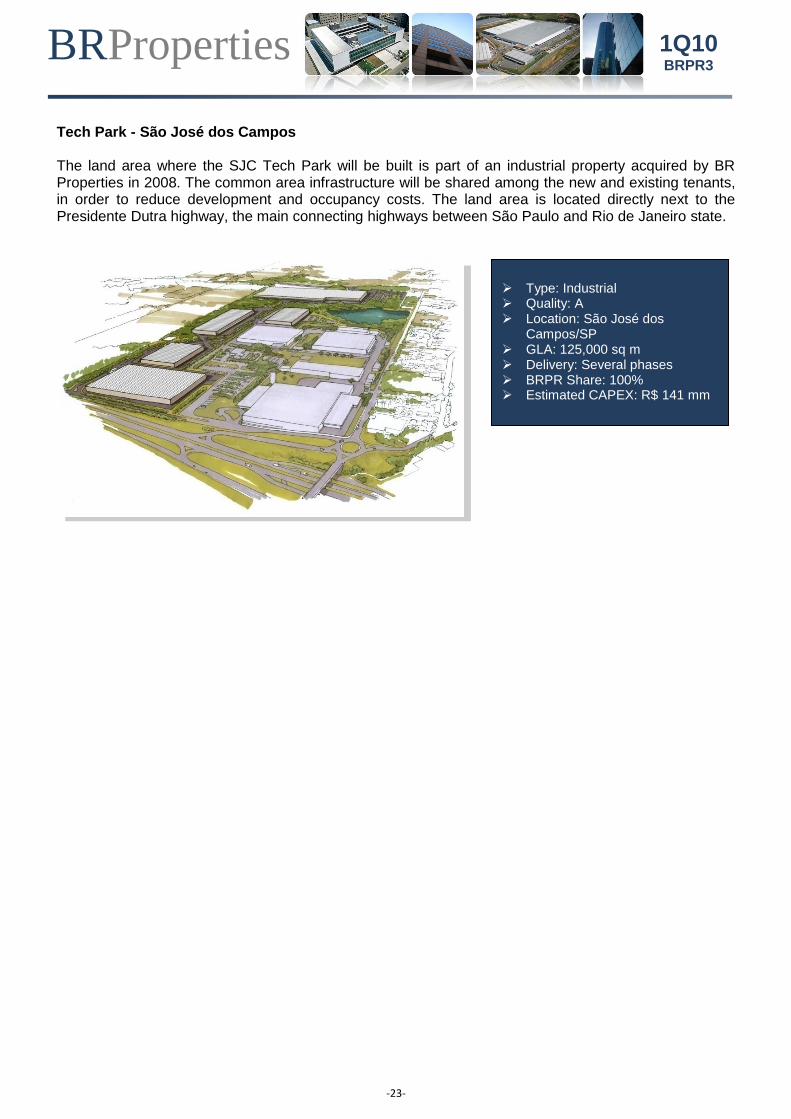
Tech Park - São José dos Campos The land area where the SJC Tech Park will be built is part of an industrial property acquired by BR Properties in 2008. The common area infrastructure will be shared among the new and existing tenants, in order to reduce development and occupancy costs. The land area is located directly next to the Presidente Dutra highway, the main connecting highways between São Paulo and Rio de Janeiro state.
Type: Industrial Quality: A Location: São José dos
Campos/SP GLA: 125,000 sq m Delivery: Several phases BRPR Share: 100% Estimated CAPEX: R$ 141 mm
BRProperties
-24-
1Q10 BRPR3
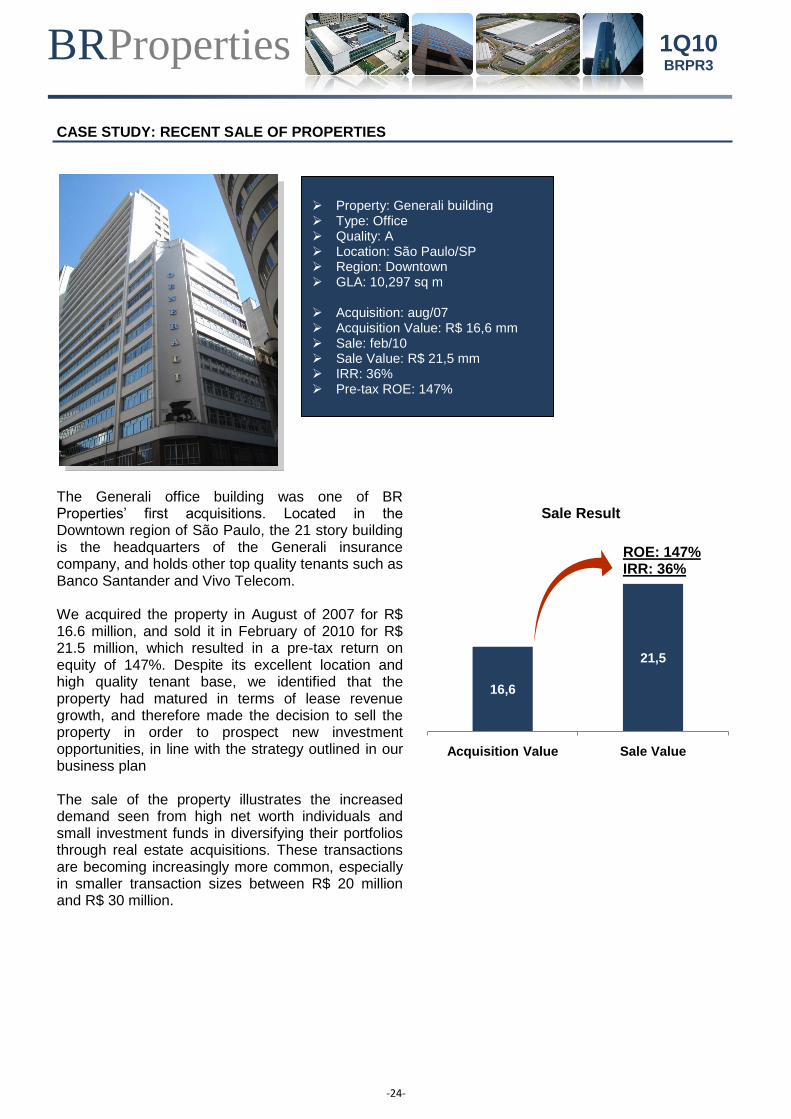
CASE STUDY: RECENT SALE OF PROPERTIES
The Generali office building was one of BR Properties’ first acquisitions. Located in the Downtown region of São Paulo, the 21 story building is the headquarters of the Generali insurance company, and holds other top quality tenants such as Banco Santander and Vivo Telecom. We acquired the property in August of 2007 for R$ 16.6 million, and sold it in February of 2010 for R$ 21.5 million, which resulted in a pre-tax return on equity of 147%. Despite its excellent location and high quality tenant base, we identified that the property had matured in terms of lease revenue growth, and therefore made the decision to sell the property in order to prospect new investment opportunities, in line with the strategy outlined in our business plan The sale of the property illustrates the increased demand seen from high net worth individuals and small investment funds in diversifying their portfolios through real estate acquisitions. These transactions are becoming increasingly more common, especially in smaller transaction sizes between R$ 20 million and R$ 30 million.
Sale Result
16,6
21,5
Acquisition Value Sale Value
ROE: 147%IRR: 36%
Property: Generali building Type: Office Quality: A Location: São Paulo/SP Region: Downtown GLA: 10,297 sq m
Acquisition: aug/07 Acquisition Value: R$ 16,6 mm Sale: feb/10 Sale Value: R$ 21,5 mm IRR: 36% Pre-tax ROE: 147%
BRProperties
-25-
1Q10 BRPR3
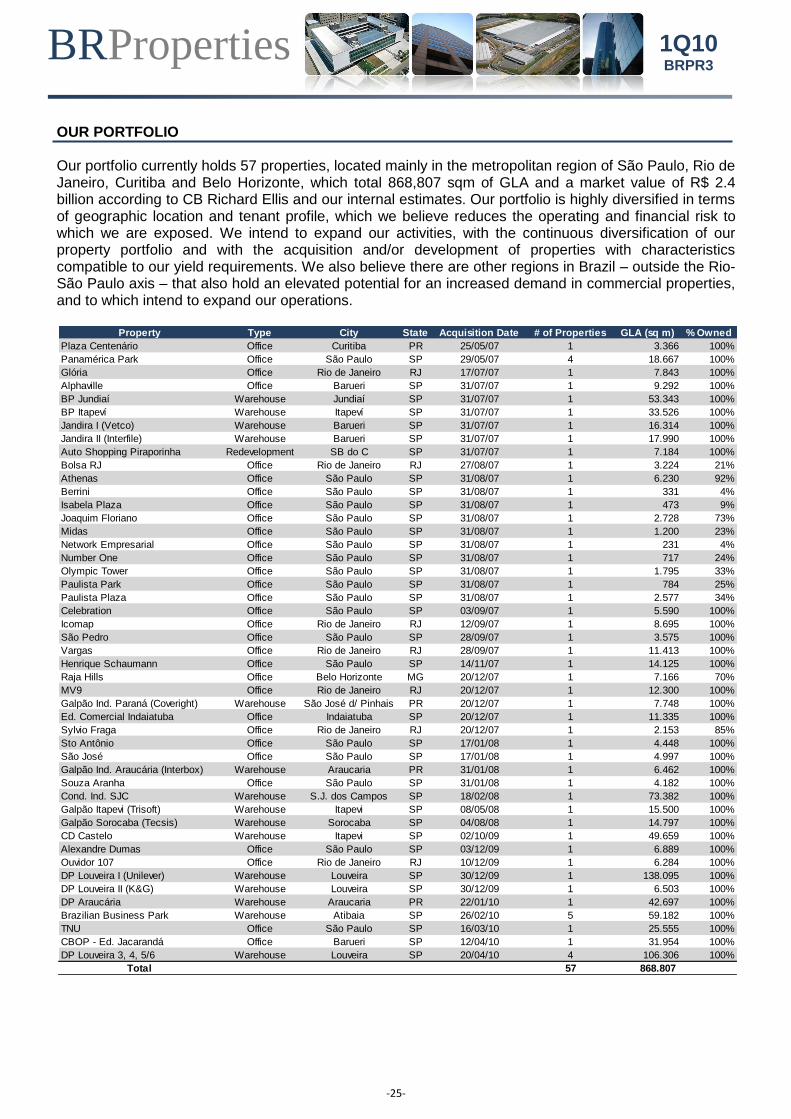
OUR PORTFOLIO Our portfolio currently holds 57 properties, located mainly in the metropolitan region of São Paulo, Rio de Janeiro, Curitiba and Belo Horizonte, which total 868,807 sqm of GLA and a market value of R$ 2.4 billion according to CB Richard Ellis and our internal estimates. Our portfolio is highly diversified in terms of geographic location and tenant profile, which we believe reduces the operating and financial risk to which we are exposed. We intend to expand our activities, with the continuous diversification of our property portfolio and with the acquisition and/or development of properties with characteristics compatible to our yield requirements. We also believe there are other regions in Brazil – outside the Rio-São Paulo axis – that also hold an elevated potential for an increased demand in commercial properties, and to which intend to expand our operations.
Property Type City State Acquisition Date # of Properties GLA (sq m) % Owned
Plaza Centenário Office Curitiba PR 25/05/07 1 3.366 100%
Panamérica Park Office São Paulo SP 29/05/07 4 18.667 100%
Glória Office Rio de Janeiro RJ 17/07/07 1 7.843 100%
Alphaville Office Barueri SP 31/07/07 1 9.292 100%
BP Jundiaí Warehouse Jundiaí SP 31/07/07 1 53.343 100%
BP Itapeví Warehouse Itapeví SP 31/07/07 1 33.526 100%
Jandira I (Vetco) Warehouse Barueri SP 31/07/07 1 16.314 100%
Jandira II (Interfile) Warehouse Barueri SP 31/07/07 1 17.990 100%
Auto Shopping Piraporinha Redevelopment SB do C SP 31/07/07 1 7.184 100%
Bolsa RJ Office Rio de Janeiro RJ 27/08/07 1 3.224 21%
Athenas Office São Paulo SP 31/08/07 1 6.230 92%
Berrini Office São Paulo SP 31/08/07 1 331 4%
Isabela Plaza Office São Paulo SP 31/08/07 1 473 9%
Joaquim Floriano Office São Paulo SP 31/08/07 1 2.728 73%
Midas Office São Paulo SP 31/08/07 1 1.200 23%
Network Empresarial Office São Paulo SP 31/08/07 1 231 4%
Number One Office São Paulo SP 31/08/07 1 717 24%
Olympic Tower Office São Paulo SP 31/08/07 1 1.795 33%
Paulista Park Office São Paulo SP 31/08/07 1 784 25%
Paulista Plaza Office São Paulo SP 31/08/07 1 2.577 34%
Celebration Office São Paulo SP 03/09/07 1 5.590 100%
Icomap Office Rio de Janeiro RJ 12/09/07 1 8.695 100%
São Pedro Office São Paulo SP 28/09/07 1 3.575 100%
Vargas Office Rio de Janeiro RJ 28/09/07 1 11.413 100%
Henrique Schaumann Office São Paulo SP 14/11/07 1 14.125 100%
Raja Hills Office Belo Horizonte MG 20/12/07 1 7.166 70%
MV9 Office Rio de Janeiro RJ 20/12/07 1 12.300 100%
Galpão Ind. Paraná (Coveright) Warehouse São José d/ Pinhais PR 20/12/07 1 7.748 100%
Ed. Comercial Indaiatuba Office Indaiatuba SP 20/12/07 1 11.335 100%
Sylvio Fraga Office Rio de Janeiro RJ 20/12/07 1 2.153 85%
Sto Antônio Office São Paulo SP 17/01/08 1 4.448 100%
São José Office São Paulo SP 17/01/08 1 4.997 100%
Galpão Ind. Araucária (Interbox) Warehouse Araucaria PR 31/01/08 1 6.462 100%
Souza Aranha Office São Paulo SP 31/01/08 1 4.182 100%
Cond. Ind. SJC Warehouse S.J. dos Campos SP 18/02/08 1 73.382 100%
Galpão Itapevi (Trisoft) Warehouse Itapevi SP 08/05/08 1 15.500 100%
Galpão Sorocaba (Tecsis) Warehouse Sorocaba SP 04/08/08 1 14.797 100%
CD Castelo Warehouse Itapevi SP 02/10/09 1 49.659 100%
Alexandre Dumas Office São Paulo SP 03/12/09 1 6.889 100%
Ouvidor 107 Office Rio de Janeiro RJ 10/12/09 1 6.284 100%
DP Louveira I (Unilever) Warehouse Louveira SP 30/12/09 1 138.095 100%
DP Louveira II (K&G) Warehouse Louveira SP 30/12/09 1 6.503 100%
DP Araucária Warehouse Araucaria PR 22/01/10 1 42.697 100%
Brazilian Business Park Warehouse Atibaia SP 26/02/10 5 59.182 100%
TNU Office São Paulo SP 16/03/10 1 25.555 100%
CBOP - Ed. Jacarandá Office Barueri SP 12/04/10 1 31.954 100%
DP Louveira 3, 4, 5/6 Warehouse Louveira SP 20/04/10 4 106.306 100%
Total 57 868.807
BRProperties
-26-
1Q10 BRPR3
GLOSSARY 2009 Acquisitions: refers to the acquisitions initiated in 3Q09: CD Castelo, Ed. Alexandre Dumas, Ed. Ouvidor 107, DP Araucária, Brazilian Business Park and TNU, of which the acquisition of the last three properties was finalized in 1Q10 BRPR A: wholly owned property management subsidiary of BR Properties S/A. Currently manages 27 properties of the Company’s portfolio CAPEX - Acquisition: capital expenditures utilized in the acquisition of new commercial properties for the portfolio CAPEX - Development: capital expenditures utilized in the development of new commercial properties for the portfolio EBITDA (Earnings Before Income, Tax, Depreciation and Amortization): a non accounting measure which measures the Company’s capacity to generate operational revenues, without considering its capital structure. Measured by excluding the operational expenses from Gross Profit and adding back the depreciation and amortization expenses for the period (Gross Profit – General and Administrative Expenses + Depreciation + Amortization) Adjusted EBITDA: adjustments made to EBITDA by excluding R$ 0.2 million from expenses regarding the Company stock option plan, along with R$ 1.2 million in employee bonus provisions FFO (Funds From Operations): non accounting measure, which adds back depreciation to net income in order to determine, utilizing the income statement, the net cash generated in the period (Net Income + Depreciation) Gross Leasable Area (GLA): refers to the area of a property owned by BR Properties which generates revenues. Average rent per sq m, vacancy, and portfolio size are calculated utilizing this metric Post-IPO Acquisitions: refers to the acquisitions completed utilizing the capital raised in the IPO; Ed. Jacarandá and DP Louveira 3, 4, 5 & 6 Rent per square meter (R$/ sq m): refers to the amount charged per square meter of gross leasable area in each property. Does not include the effects of revenue linearization Vacancy - Financial: estimated by multiplying the average rent per sqm which could be charged in the buildings and their respective vacant areas, and then dividing this result by the potential gross revenues of each property. Indicates the percentage of potential revenue which is lost each month due to vacancy Vacancy - Physical: estimated by dividing the total vacant area by the total GLA of the portfolio
BRProperties
-27-
1Q10 BRPR3
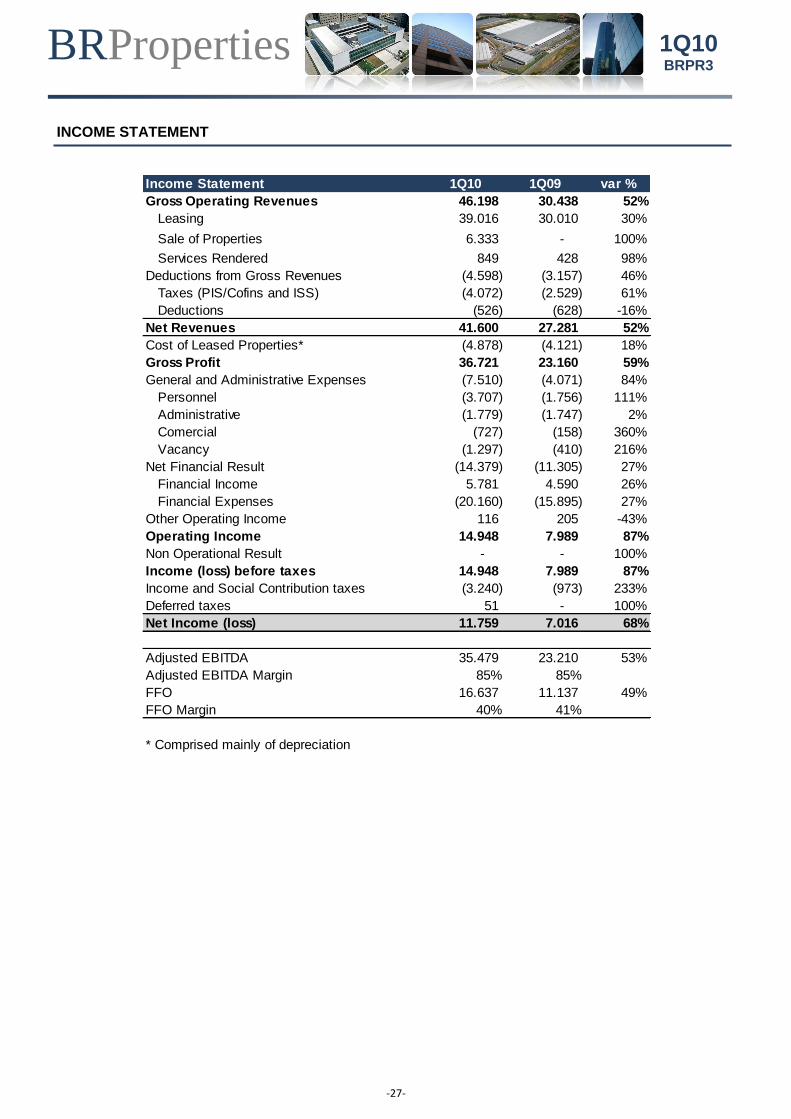
INCOME STATEMENT
Income Statement 1Q10 1Q09 var %
Gross Operating Revenues 46.198 30.438 52%
Leasing 39.016 30.010 30%
Sale of Properties 6.333 - 100%
Services Rendered 849 428 98%
Deductions from Gross Revenues (4.598) (3.157) 46%
Taxes (PIS/Cofins and ISS) (4.072) (2.529) 61%
Deductions (526) (628) -16%
Net Revenues 41.600 27.281 52%
Cost of Leased Properties* (4.878) (4.121) 18%
Gross Profit 36.721 23.160 59%
General and Administrative Expenses (7.510) (4.071) 84%
Personnel (3.707) (1.756) 111%
Administrative (1.779) (1.747) 2%
Comercial (727) (158) 360%
Vacancy (1.297) (410) 216%
Net Financial Result (14.379) (11.305) 27%
Financial Income 5.781 4.590 26%
Financial Expenses (20.160) (15.895) 27%
Other Operating Income 116 205 -43%
Operating Income 14.948 7.989 87%
Non Operational Result - - 100%
Income (loss) before taxes 14.948 7.989 87%
Income and Social Contribution taxes (3.240) (973) 233%
Deferred taxes 51 - 100%
Net Income (loss) 11.759 7.016 68%
Adjusted EBITDA 35.479 23.210 53%
Adjusted EBITDA Margin 85% 85%
FFO 16.637 11.137 49%
FFO Margin 40% 41%
* Comprised mainly of depreciation
BRProperties
-28-
1Q10 BRPR3
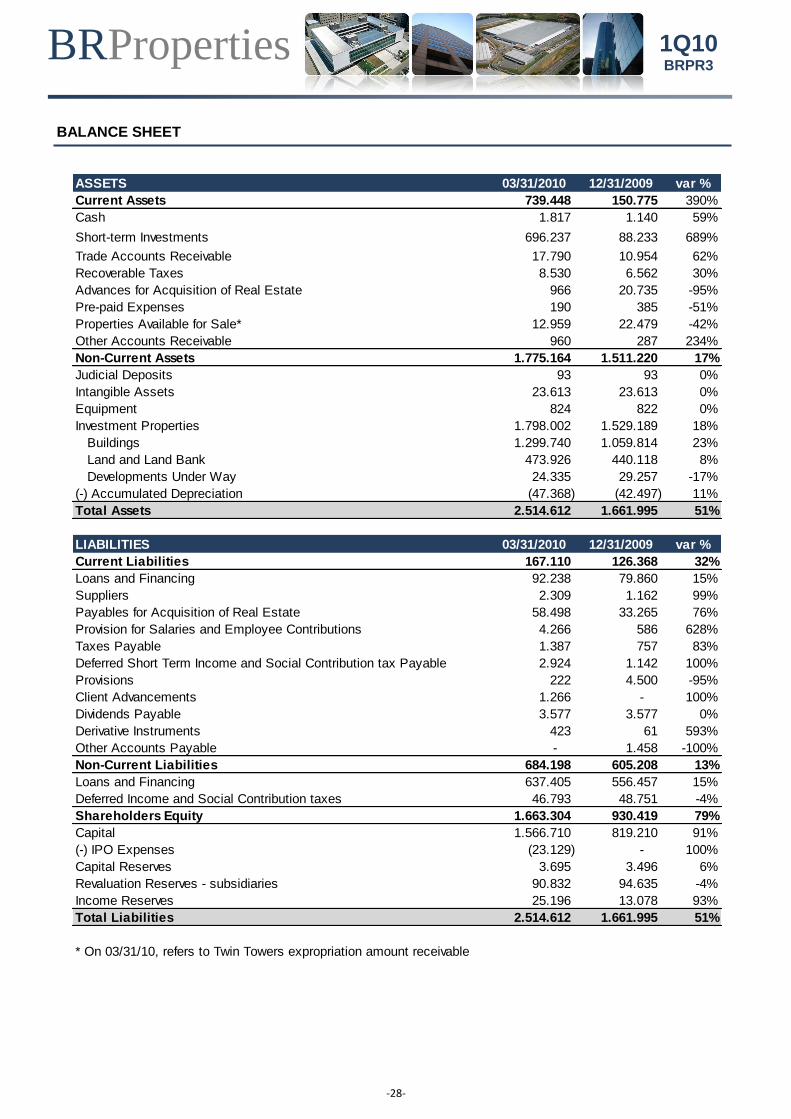
BALANCE SHEET
ASSETS 03/31/2010 12/31/2009 var %
Current Assets 739.448 150.775 390%
Cash 1.817 1.140 59%
Short-term Investments 696.237 88.233 689%
Trade Accounts Receivable 17.790 10.954 62%
Recoverable Taxes 8.530 6.562 30%
Advances for Acquisition of Real Estate 966 20.735 -95%
Pre-paid Expenses 190 385 -51%
Properties Available for Sale* 12.959 22.479 -42%
Other Accounts Receivable 960 287 234%
Non-Current Assets 1.775.164 1.511.220 17%
Judicial Deposits 93 93 0%
Intangible Assets 23.613 23.613 0%
Equipment 824 822 0%
Investment Properties 1.798.002 1.529.189 18%
Buildings 1.299.740 1.059.814 23%
Land and Land Bank 473.926 440.118 8%
Developments Under Way 24.335 29.257 -17%
(-) Accumulated Depreciation (47.368) (42.497) 11%
Total Assets 2.514.612 1.661.995 51%
LIABILITIES 03/31/2010 12/31/2009 var %
Current Liabilities 167.110 126.368 32%
Loans and Financing 92.238 79.860 15%
Suppliers 2.309 1.162 99%
Payables for Acquisition of Real Estate 58.498 33.265 76%
Provision for Salaries and Employee Contributions 4.266 586 628%
Taxes Payable 1.387 757 83%
Deferred Short Term Income and Social Contribution tax Payable 2.924 1.142 100%
Provisions 222 4.500 -95%
Client Advancements 1.266 - 100%
Dividends Payable 3.577 3.577 0%
Derivative Instruments 423 61 593%
Other Accounts Payable - 1.458 -100%
Non-Current Liabilities 684.198 605.208 13%
Loans and Financing 637.405 556.457 15%
Deferred Income and Social Contribution taxes 46.793 48.751 -4%
Shareholders Equity 1.663.304 930.419 79%
Capital 1.566.710 819.210 91%
(-) IPO Expenses (23.129) - 100%
Capital Reserves 3.695 3.496 6%
Revaluation Reserves - subsidiaries 90.832 94.635 -4%
Income Reserves 25.196 13.078 93%
Total Liabilities 2.514.612 1.661.995 51%
* On 03/31/10, refers to Twin Towers expropriation amount receivable
BRProperties
-29-
1Q10 BRPR3
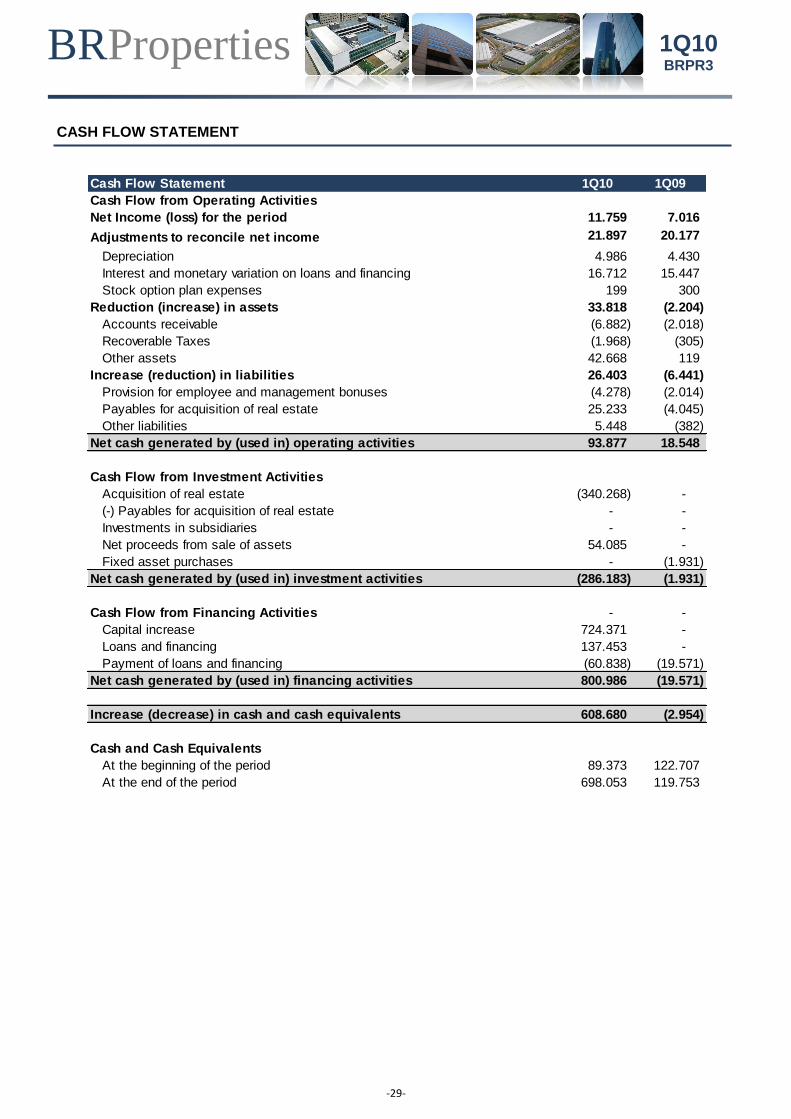
CASH FLOW STATEMENT
Cash Flow Statement 1Q10 1Q09
Cash Flow from Operating Activities
Net Income (loss) for the period 11.759 7.016
Adjustments to reconcile net income 21.897 20.177
Depreciation 4.986 4.430
Interest and monetary variation on loans and financing 16.712 15.447
Stock option plan expenses 199 300
Reduction (increase) in assets 33.818 (2.204)
Accounts receivable (6.882) (2.018)
Recoverable Taxes (1.968) (305)
Other assets 42.668 119
Increase (reduction) in liabilities 26.403 (6.441)
Provision for employee and management bonuses (4.278) (2.014)
Payables for acquisition of real estate 25.233 (4.045)
Other liabilities 5.448 (382)
Net cash generated by (used in) operating activities 93.877 18.548
Cash Flow from Investment Activities
Acquisition of real estate (340.268) -
(-) Payables for acquisition of real estate - -
Investments in subsidiaries - -
Net proceeds from sale of assets 54.085 -
Fixed asset purchases - (1.931)
Net cash generated by (used in) investment activities (286.183) (1.931)
Cash Flow from Financing Activities - -
Capital increase 724.371 -
Loans and financing 137.453 -
Payment of loans and financing (60.838) (19.571)
Net cash generated by (used in) financing activities 800.986 (19.571)
Increase (decrease) in cash and cash equivalents 608.680 (2.954)
Cash and Cash Equivalents
At the beginning of the period 89.373 122.707
At the end of the period 698.053 119.753