Embed Size (px)
Citation preview

Earnings Call Slides – 3Q19
November 2019

This presentation has been prepared by Goodrich Petroleum Corporation (the “Company”) solely for information purposes and may include "forward-
looking statements" within the meaning of the U.S. Private Litigation Securities Reform Act of 1995. The Company, its respective employees, directors,
officers or advisors, does not make any representation or warranty as to the accuracy or completeness of the information contained in the presentation
materials. The Company shall have no liability for this presentation, information contained herein, or any representations (expressed or implied),
whether the communications were oral or written. The statements, other than statements of historical facts, included in this presentation that address
activities, events or developments that the Company expects, believes or anticipates will or may occur in the future are forward-looking statements.
These statements include, but are not limited to forward-looking statements about acquisitions, divestitures, trades, potential strategic alliances, the
availability of capital, the expectations of plans, strategies, objectives and anticipated financial and operating results of the Company, including the
Company's drilling program, production, hedging activities, capital expenditure levels and other guidance that may be included in this presentation.
These statements are based on certain assumptions made by the Company based on management's experience and perception of historical trends,
current conditions, anticipated future developments and other factors believed to be appropriate. Such statements are subject to a number of
assumptions, risks and uncertainties, many of which are beyond the control of the Company, which may cause actual results to differ materially from
those implied or expressed by the forward-looking statements. These include risks relating to the Company's financial performance and results,
availability of sufficient cash flow to execute its business plan, prices and demand for oil, natural gas and natural gas liquids, the ability to replace
reserves and efficiently develop current reserves, the ability to access the capital markets and finance operations, including capital expenditures, and
other important factors that could cause actual results to differ materially from those projected as described in this presentation and the Company's
reports filed with the Securities and Exchange Commission. See "Risk Factors" in the Company's Annual Report on Form 10-K, Quarterly Reports on
Form 10-Q and other public filings and press releases.
Any forward-looking statement speaks only as of the date on which such statement is made and the Company undertakes no obligation to correct or
update any forward-looking statement, whether as a result of new information, future events or otherwise.
November 2019 2
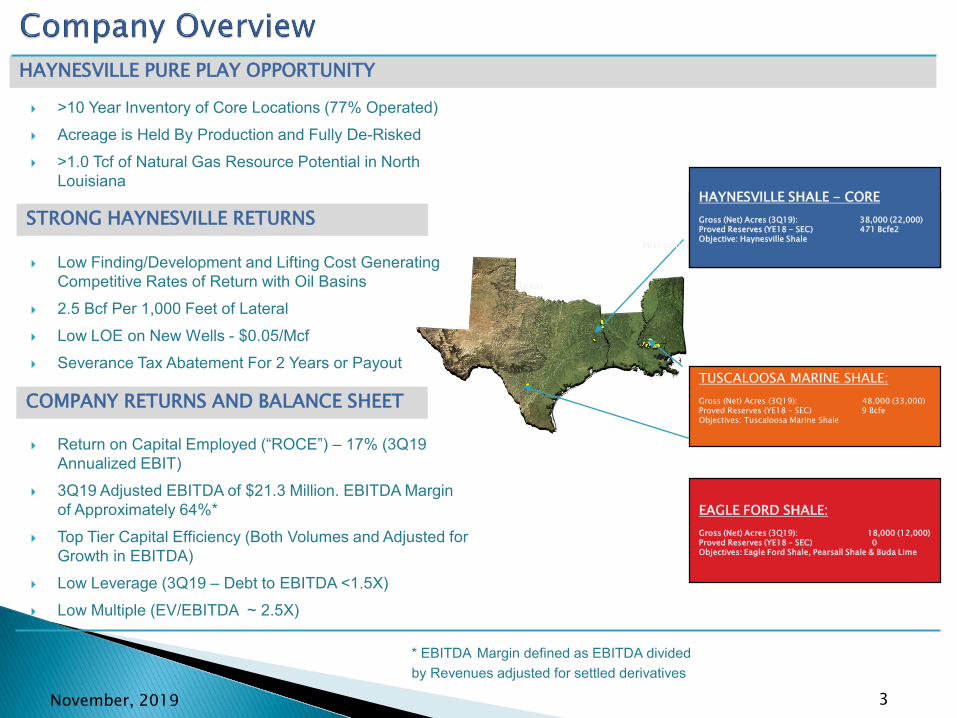
>10 Year Inventory of Core Locations (77% Operated) Acreage is Held By Production and Fully De-Risked >1.0 Tcf of Natural Gas Resource Potential in North
Louisiana
Low Finding/Development and Lifting Cost Generating Competitive Rates of Return with Oil Basins
2.5 Bcf Per 1,000 Feet of Lateral Low LOE on New Wells - $0.05/Mcf Severance Tax Abatement For 2 Years or Payout
Return on Capital Employed (“ROCE”) – 17% (3Q19 Annualized EBIT)
3Q19 Adjusted EBITDA of $21.3 Million. EBITDA Margin of Approximately 64%*
Top Tier Capital Efficiency (Both Volumes and Adjusted for Growth in EBITDA)
Low Leverage (3Q19 – Debt to EBITDA <1.5X) Low Multiple (EV/EBITDA ~ 2.5X)
TUSCALOOSA MARINE SHALE:Gross (Net) Acres (3Q19): 48,000 (33,000)Proved Reserves (YE18 – SEC) 9 BcfeObjectives: Tuscaloosa Marine Shale
EAGLE FORD SHALE:Gross (Net) Acres (3Q19): 18,000 (12,000)Proved Reserves (YE18 – SEC) 0Objectives: Eagle Ford Shale, Pearsall Shale & Buda Lime
HAYNESVILLE / BOSSIER SHALEANGELINA RIVER TREND (“ART”)Gross (Net) Acres (4Q18): 7,000 (3,000)Proved Reserves (YE18 - SEC) Objective: Haynesville & Bossier Shale
HAYNESVILLE SHALE - COREGross (Net) Acres (3Q19): 38,000 (22,000)Proved Reserves (YE18 - SEC) 471 Bcfe2Objective: Haynesville Shale
HAYNESVILLE PURE PLAY OPPORTUNITY
STRONG HAYNESVILLE RETURNS
COMPANY RETURNS AND BALANCE SHEET
Texas
Mississippi
November, 2019 3
* EBITDA Margin defined as EBITDA divided by Revenues adjusted for settled derivatives

PD-127 (26%)
PUD-353 (74%)
Oil (2%)
Natural Gas (98%)
NLA HAY CORE-471
(98%)
TMS-9 (2%)
4
55
303
428
480
0
100
200
300
400
500
600
2015 2016 2017 2018*
ETX TMS NLA - Haynesville Total
* SEC PV10 of $418 Million
YE18 Proved Reserves by Area (Bcfe, %)
YE18 Proved Reserves by Category (Bcfe, %)
SEC Proved Reserves (Bcfe) YE18 Proved Reserves by Commodity
November, 2019
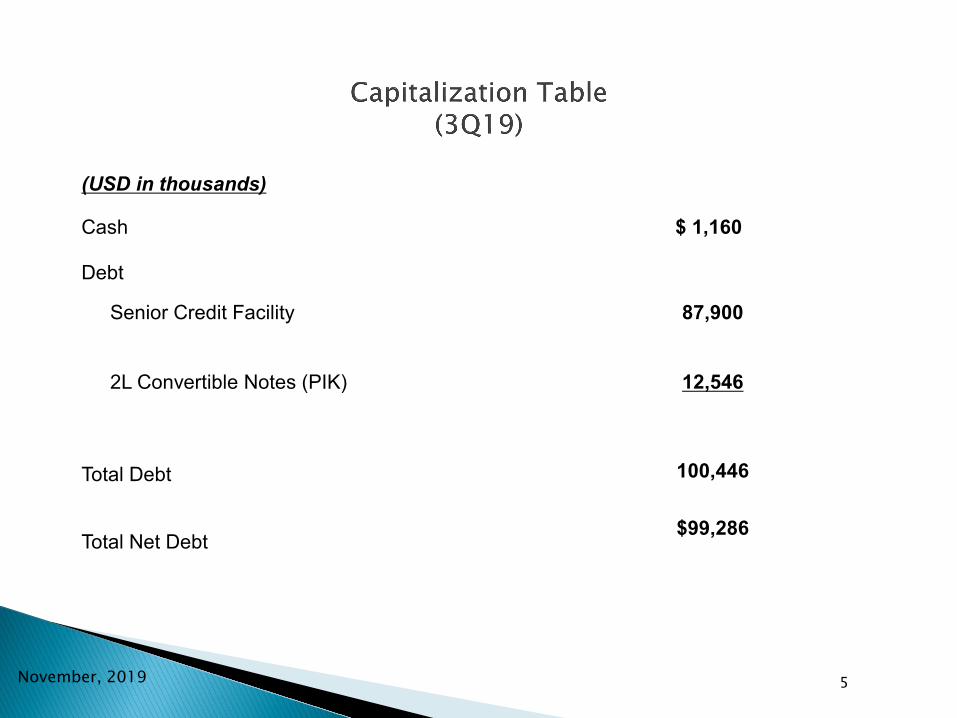
(USD in thousands)
Cash $ 1,160
Debt
Senior Credit Facility 87,900
2L Convertible Notes (PIK) 12,546
Total Debt 100,446
Total Net Debt $99,286
November, 2019 5

November, 2019
- 20,000 40,000 60,000 80,000
100,000 120,000 140,000 160,000 Mcfe/Day
Mcfe/Day
6* Mid-Point of Guidance

Period Natural Gas Volumes Swap Volumes Collar Volumes Swap Price Collar Prices (MCFPD) (MCFPD) (MCFPD)
3Q19 100,000 100,000 0 $2.89 4Q19 100,000 100,000 0 $2.89 1Q20 70,000 70,000 0 $2.87 2Q20 70,000 47,000 23,000 $2.54 $2.40 - $2.62 3Q20 70,000 45,000 25,000 $2.56 $2.40 - $2.62 4Q20 70,000 45,000 25,000 $2.59 $2.40 - $2.62 1Q21 70,000 43,000 27,000 $2.64 $2.40 - $2.62
Period Oil Volumes Swap Volumes Collar Volumes Swap Price Collar Prices (BOPD) (BOPD) (BOPD)
3Q19 300 300 0 $51.08 4Q19 300 300 0 $51.08 1Q20 250 250 0 $60.44 2Q20 225 225 0 $59.41 3Q20 210 210 0 $58.36 4Q20 200 200 0 $57.51 1Q21 200 200 0 $56.58
November, 2019 7

Production 2019E
Annual Net Production: 46.4 – 49.3 Bcfe Avg Daily Production (Mid-Point): 130,000 Mcfe/d
Natural Gas: 98%
Capex (MM) $90 - 95
Price Realization HH Less $0.20 – 0.30
Unit Costs (Per Mcfe)
LOE $0.20 – 0.30 Taxes $0.05 – 0.07 Transportation $0.40 – 0.48 G&A (Cash) $0.25 – 0.35
Activity (Turned In Line) Wells
Gross (Net) Wells: 8 (7.2) Average Net Lateral Length: ~7,500’ Percentage Operated (Net): 100%
Net Capital Allocation
Bethany-Longstreet 67% Thorn Lake 33%
Quarterly Completion (TIL) Cadence
1Q19 2 Gross (2.0 Net) 2Q19 3 Gross (2.6 Net) 3Q19 1 Gross (0.9 Net) 4Q19 2 Gross (1.7 Net) Total 8 Gross (7.2 Net)
November, 2019 8
Estimated YE19 Haynesville DUCs – 5 Gross (2.5 Net) Wells

-20%
-10%
0%
10%
20%
30%
40%
GDP
ROCE
November, 2019Peer Group Includes: AMPY.APA,AR,AXAS,BCEI,BRY,CDEV,CHAP,CHK,CLR,COG,CPE,CRK,CRZO,CXO,DNR,DVN,ECA,EOG,EQT,ESTE,FANG,GDP,GPOR,HPR,JAG,KOS,LONE,LPI,MCF,MGY,MR,MTDR,MUR,NBL,NOG,OAS,PDCE,PE,PVAC,PXD,QEP,REI,RRC,SBOW,SD,SM,SRCI,SWN,TALO,WLL,WPX,WTI,XOG Source: Bloomberg, Company (October 30, 2019) 9

0.0010.0020.0030.0040.0050.0060.0070.0080.00
GDP
Capital Efficiency
November, 201910
Peer Group Includes: AXAS,BCEI,BRY,CHAP,CHK,COG,CPE,CRK,CRZO,CXO,DNR,DVN,ECA,EOG,ESTE,FANG,GDP,HPR,JAG,KOS,LLEX,LONE,MGY,MR,MTDR,MUR,OAS,PDCE,PE,PVAC,PXD,REI,SBOW,SRCI,TALO,WPX
Source: Bloomberg, Company (October 30, 2019)

0.00
1.00
2.00
3.00
4.00
5.00
GDP
NET DEBT/EBITDA
November, 2019
Peer Group Includes: APA,AR,AREX,AXAS,BCEI,BRY,CDEV,CHAP,CHK,CLR,COG,CPE,CRK,CRZO,CXO,DNR,DVN,ECA,EOG,EQT,ESTE,FANG,GDP,GPOR,HPR,JAG,KOS,LONE,LPI,MCF,MGY,MPO,MR,MTDR,MUR,NBL,OAS,PDCE,PE,PVAC,PXD,QEP,REI,RRC,SBOW,SD,SM,SNEC,SRCI,SWN,TALO,UPL,WLL,WPX,WTI,XOG
Source: Bloomberg, Company (October 30, 2019) 11

0.00
2.00
4.00
6.00
8.00
10.00
GDP
EV/EBITDA
November, 2019Peer Group Includes: AMPY,APA,AR,AREX,AXAS,BCEI,BRY,CDEV,CHAP,CHK,CLR,COG,CPE,CRK,CRZO,CXO,DNR,DVN,ECA,EOG,EQT,ESTE,FANG,GDP,GPOR,HPR,JAG,KOS,LONE,LPI,MCF,MGY,MR,MTDR,MUR,NBL,OAS,PDCE,PE,PVAC,PXD,QEP,REI,RRC,SBOW,SD,SM,SRCI,SWN,TALO,UPL,WLL,WPX,WTI,XOG Source: Bloomberg, Company (October 30, 2019) 12

GDP 22,000 Net Acres
Pay Zones
} 100 – 300 feet
November, 2019 13

November, 2019 14
North Louisiana (Haynesville)
Total Gross/Net Acres: ~34,000/20,000
Average WI/NRI: ~59%/43%
Acreage HBP: 100%
113 total producing wells (31 Operated)
1/1/19 – Inventory of 214 gross (99 net) potential locations on 880’ spacing
Operator for Approximately 73% of the NLA core position
CHK Joint Venture on most of the remaining 27% of NLA Core Acreage
Recent Acreage Swaps Adding to Operated and Long Lateral Acreage
Continuing to Look For Bolt-On Opportunities
Shelby Trough/Angelina River Trend (ART)
Haynesville and Bossier Shales:
Total Gross/Net Acres: ~8,000/ 3,000
Average WI/NRI: ~40% / 30%
Sale of Producing Wells and a Portion of the Company’s Acreage for $23 Million
HAYNESVILLE SHALE~22,000 net Ac
Greenwood-Waskom /
Metcalf/Longwood2,700 Net Ac
Swan Lake/Thorn
Lake1,300 Net Ac
ART3,000 Net
Ac
BethanyLongstreet
15,000 Net Ac
Rig Source: Ulterra Bits

HAYNESVILLE – RECENT INDUSTRY ACTIVITY
November, 2019 15
(8) CHKROTC 1 & 2
10,000’ LateralsIP: 72,000 Mcf/d
19 Bcf in 19 months
(11) GDP-Wurtsbaugh25-24 #2&3
7,500’ LateralsIP: 25,000 Mcf/dIP: 29,000 Mcf/d
(10) GDP Wurtsbaugh 264,600’ Lateral
IP: 22,000 Mcf/d
(9) GDPMSR - Hunt 5H-1
4,600’ LateralIP: 17,000 Mcf/d
(22) CHK Black 1H
IP: 44,000 Mcf/d10,000’ Lateral
(21) VineHA RA SU74;L L
Golson 3 - 003-ALTIP: 18,800 Mcf/d
4,661’ Lateral
5. CHKGEPH Unit
IP: 47,988 Mcf/d15,000’ Lateral
4. CRKHUNTER 28-21HC 1&2 IP: 27,000 Mcf/d each
9,200’ Laterals
(13) GDPFranks 25&24 #1IP: 30,000 Mcf/d
9,600’ Lateral
(12) GDPWurtsbaugh 25-24 #1
8,800’ LateralIP: 31,000 Mcf/d
(19) GDPCason-Dickson #1&2
IP: 31 MMcf/d, IP: 23 MMcf/d
8,000 & 3,000’ Laterals
3. CRKFLORSHEIM 9-16 HC #1&2 10,000’ Laterals
IP: 26,500 Mcf/dIP: 27,600 Mcf/d
(20) GDPCason-Dickson 23&24
#3&4IP: 62,000 Mcf/d9,300’ Laterals
(18) GDPHarris 14&23 #1&2
IP: 27,500 Mcf/dIP: 26,000 Mcf/d
6,100’ & 9450’ Laterals
(14) GDPLoftus 27&22 #1 & 2
26,000 Mcfe/d25,000 Mcfe/d 7,500’ Laterals
(15) GDPDemmon 34H #1
22,500 Mcf/d4,600’ Lateral
(16) GDPWurtsbaugh 35H #1
IP: 22,500 Mcf/d4,600’ Lateral
(7) CRKCook 21-28 HC #2
10,000’ LateralIP: 26,800 Mcf/d
3,798#/ft
(6) CRKCook 21-28 HC #1
10,000’ LateralIP: 25,600 Mcf/d
3,803#/ft
(2) CRKNissen 28-21HC #2
10,000’ LateralIP: 25,000 Mcf/d
3,801#/ft
(1) CRKNissen 28-21HC #1
10,000’ LateralIP: 27,000 Mcf/d
3,796#/ft
(17) Covey ParkTucker 31-6C H1IP 18,045 Mcf/d
7,466’ Lateral
12
34
567
8
9
10-16
1718-20
21
22
(22) GDPMelody Jones 20H-1
4,600’ LateralIP: 22,000 Mcf/d
22

299 298 294 288 285 278 274 263 251 251 235 217 209 200 199 194 179163 159 153 145 136 131 121 116 108
99 93 88 84 7965 62 58
47 46
10
100
1,000
10,000
100
1,000
10,000
100,000
0 2 4 6 8 10 12 14 16 18 20 22 24 26 28 30 32 34 36
Wel
l Cou
nt
Gas
Pro
duct
ion,
Mcf
pd
Months
Recent Haynesville 4,600' Wells
Company Type Curve: EUR: 11.5 Bcf (2.5 Bcf/1,000 ft)
Company Type Curve: EUR: 9.2 Bcf (2.0 Bcf/1,000 ft)
GDP, 6 Well Average(Avg 4,097' LL; 4,127 #/ft Frac)
Industry Average Well Performance 299 Wells (3,057 #/ft Frac)
Industry Average 3,453 #/ft
Industry Average 3,242 #/ft
Industry Average 2,352 #/ft
November, 201916

206 202 201 201 197 191 188 184 178 178 174 162 158 152 144 138 137 131 124 117100 96
84 8267 67
57 5448
44 4136
33 33 31 29
10
100
1,000
10,000
100
1,000
10,000
100,000
0 2 4 6 8 10 12 14 16 18 20 22 24 26 28 30 32 34 36
Wel
l Cou
nt
Gas
Pro
duct
ion,
Mcf
pd
Months
Recent Haynesville 7,500' Wells
Company Type Curve: EUR: 18.75 Bcf (2.5 Bcf/1,000 ft)
Company Type Curve EUR: 15.0 Bcf (2.0 Bcf/1,000 ft)
Industry Average Well Performance 206 Wells (2,962 #/ft Frac)
GDP, 9 Well Average(Avg 7,780' LL, 3,692 #/ft Frac)
Industry Average 3,401 #/ft
Industry Average 3,283 #/ft
Industry Average 2,394 #/ft
November, 2019 17

187 179 178 177 173 163 156 143 138 133 122 119 113 103 9586
7567 61
52 52 5043
36
27 2623 21
18 17
12 1210
10
100
1,000
10,000
100
1,000
10,000
100,000
0 2 4 6 8 10 12 14 16 18 20 22 24 26 28 30 32 34 36
Wel
l Cou
nt
Gas
Pro
duct
ion,
Mcf
pd
Months
Recent Haynesville 10,000' Wells
Company Type Curve: EUR: 25 Bcf (2.5 Bcf/1,000 ft)
Company Type Curve EUR: 20 Bcf (2.0 Bcf/1,000 ft)
Industry Average Well Performance187 Wells (2,950 #/ft Frac)
GDP, 9 Well Average(Avg 9,602' LL; 3,495 #/ft)
Industry Average 3,340 #/ft
Industry Average 2,222 #/ft
November, 2019 18

November, 2019 19
Assumptions Louisiana
EUR 11.5 Bcf (2.5 Bcf/1,000’)
Sales Gas BTU Price Adjustment
1.020
Pricing Differentials/Transportation
Average - NYMEX less $0.15 / MMBtuTransportation: $0.35 / Mcf
Fixed Opex Fixed Opex: $3,290 / month
Variable Opex $0.07 / Mcf
Severance Tax Payout or 24 month tax holiday;thereafter $0.12 / Mcf
Ad Val Tax $0.04 / Mcf
Royalty Burden 27.0%
D&C Capex $8.5 MM
Facilities Capex $0.185 MM, included in D&C Capex
Spud to 1st Sale 60 Days
PV10 (M$)($3.00/Mcf Pricing) $4,875
Economic EUR’s vary depending on gas price assumptions.
100
1,000
10,000
100,000
0 20 40 60 80 100 120
Avg
Dai
ly P
rodu
ctio
n (M
cfpd
)
Months
4,600' Lateral Type Curve
4,600' Lateral
IRR Sensitivity Analysis (IRR sensitivity to EURs and Capex)IRRs Incorporates Early Time Outperformance
EUR Capex(Mmcfe) ($M)
90% 100% 110% 90% 100% 110%2.25 4.5% 11.8% 20.3% 2.25 19.1% 11.8% 6.5%2.50 14.7% 25.0% 37.3% 2.50 35.8% 25.0% 17.2%2.75 27.0% 41.3% 58.3% 2.75 56.5% 41.3% 30.3%3.00 41.9% 61.0% 83.6% 3.00 81.4% 61.0% 46.2%3.50 80.0% 111.5% 148.8% 3.50 145.5% 111.5% 86.8%
Ownership: WI 100% - NRI 73%Pricing: Flat PricingAFE: Two well pad.
Gas
Pric
e
Gas
Pric
e

November, 2019 20
Assumptions Louisiana
EUR 18.75 Bcf (2.5 Bcf/1,000’)
Sales Gas BTU Price Adjustment
1.020
Pricing Differentials/Transportation
Average - NYMEX less $0.15 / MMBtuTransportation - $0.35 / Mcf
Fixed Opex Fixed Opex: $3,290 / month
Variable Opex $0.07 / Mcf
Severance Tax Payout or 24 month tax holiday;thereafter $0.12 / Mcf
Ad Val Tax $0.04 / Mcf
Royalty Burden 27.0%
D&C Capex $10.9 MM
Facilities Capex $0.185 MM, included in D&C Capex
Spud to 1st Sale 60 Days
PV10 (M$)($3.00/Mcf Pricing)
$10,198
Economic EUR’s vary depending on gas price assumptions.
100
1,000
10,000
100,000
0 20 40 60 80 100 120
Avg
Dai
ly P
rodu
ctio
n (M
cfpd
)
Months
7,500' Lateral Type Curve
7,500' Lateral
IRR Sensitivity Analysis (IRR sensitivity to EURs and Capex)IRRs Incorporates Early Time Outperformance
EUR Capex(Mmcfe) ($M)
90% 100% 110% 90% 100% 110%2.25 18.3% 27.7% 38.7% 2.25 37.8% 27.7% 20.4%2.50 31.4% 44.7% 60.0% 2.50 58.9% 44.7% 34.2%2.75 47.1% 65.0% 85.7% 2.75 84.2% 65.0% 50.8%3.00 44.7% 88.9% 115.9% 3.00 114.1% 88.9% 70.4%3.50 65.7% 148.7% 192.1% 3.50 189.3% 148.7% 119.0%
Ownership: WI 100% - NRI 73%Pricing: Flat PricingAFE: Two well pad.
Gas
Pric
e
Gas
Pric
e

November, 2019 21
Assumptions Louisiana
EUR 25.0 Bcf (2.5 Bcf/1,000’)
Sales Gas BTU Price Adjustment
1.020
Pricing Differentials/Transportation
Average - NYMEX less $0.15 / MMBtuTransportation - $0.35 / Mcf
Fixed Opex Fixed Opex: $3,290 / month
Variable Opex $0.07 / Mcf
Severance Tax Payout or 24 month tax holiday;thereafter $0.12 / Mcf
Ad Val Tax $0.03 / Mcf
Royalty Burden 27.0%
D&C Capex $13.1 MM
Facilities Capex $0.185 MM, included in D&C Capex
Spud to 1st Sale 60 Days
PV10 (M$)($3.00/Mcf Pricing)
$14,376
Economic EUR’s vary depending on gas price assumptions.
100
1,000
10,000
100,000
0 20 40 60 80 100 120
Avg
Dai
ly P
rodu
ctio
n (M
cfpd
)
Months
10,000' Lateral Type Curve
10,000' Lateral
IRR Sensitivity Analysis (IRR sensitivity to EURs and Capex)IRRs Incorporates Early Time Outperformance
EUR Capex(Mmcfe) ($M)
90% 100% 110% 90% 100% 110%2.25 24.8% 35.9% 48.5% 2.25 47.6% 35.9% 27.1%2.50 40.1% 55.4% 72.9% 2.50 71.8% 55.4% 43.1%2.75 58.2% 78.5% 101.9% 2.75 100.5% 78.5% 62.2%3.00 79.3% 105.6% 135.8% 3.00 134.1% 105.6% 84.4%3.50 131.0% 172.3% 220.3% 3.50 217.6% 172.3% 138.9%
Ownership: WI 100% - NRI 73%Pricing: Flat PricingAFE: Two well pad.
Gas
Pric
e
Gas
Pric
e

Haynesville Generating Good Returns on High Volume Wells, Favorable Hedging and Low Cost Structure
Strong EBITDA Growth in 2019 Driven by Substantial Increase in Production on a Much Lower Unit Cost Structure
Eagle Ford and TMS Positions Provide Leverage to Oil Prices and Strategic Optionality
Optionality on 2020 Capital Plans Expected to Deliver Growth and Free Cash
November, 2019 22