Embed Size (px)
Citation preview

Earnings Call Presentation9M 2019
November 2019

2
The information in this presentation has not been independently verified and is subject to updating, completion, revision and further amendment. The presentationdoes not purport to contain all information that a prospective lender may require. While the information contained herein has been prepared in good faith, neither theBorrower nor its shareholders, directors, officers, agents, employees, or advisors, give, has given or has authority to give, any representations or warranties(expressed or implied) as to, or in relation to, the accuracy, reliability or completeness of the information in this presentation or any revision thereof, or of any otherwritten or oral information made or to be made available to any interested party or its advisors (all such information being referred to as information) and liabilitytherefore is expressly disclaimed save by each person in respect of their own fraud. Accordingly, the Borrower and its shareholders, directors, officers, agents,employees or advisors do not take any responsibility for, and will not accept any liability whether direct or indirect, expressed or implied, contractual, statutory orotherwise, in respect of the accuracy or completeness of the information or for any of the opinions contained herein or for any errors, omissions or misstatements orfor any loss, how so ever arising from the use of this presentation.
Information contained in this presentation is confidential information and the property of the Borrower. It is made available strictly for the purposes referred to above.The presentation and any further confidential information made available to any recipient must be held in complete confidence and documents containing suchinformation may not be reproduced, used or disclosed without the prior written consent of the Borrower. This presentation shall not be copied, published, reproducedor distributed in whole or in part at any time without the prior written consent of the Borrower. By accepting delivery of this presentation, the recipient agrees to returnit to the Borrower at the request of the Borrower.
This presentation should not be considered as the giving of investment advice by the Borrower or any of its shareholders, directors, officers, agents, employees oradvisors. Each party to whom this presentation is made available must make its own independent assessment of the Borrower after making such investigations andtaking such advice as may be deemed necessary. In particular, any estimates or projections or opinions contained herein necessarily involve significant elements ofsubjective judgment, analysis and assumption and each recipient should satisfy itself in relation to such matters. Neither the issue of this presentation nor any part ofits contents is to be taken as any form of commitment on the part of the Borrower to proceed with any transaction nor is the right reserved to terminate anydiscussions or negotiations with any prospective lenders. In no circumstances will the Borrower be responsible for any costs, losses or expenses incurred inconnection with any appraisal or investigation of the Borrower.
This presentation does not constitute, or form part of, any offer or invitation to sell or issue, or any solicitation of any offer to subscribe for or purchase any securitiesin the Borrower, nor shall it, or the fact of its distribution, form the basis of, or be relied upon in connection with, or act as any inducement to enter into, any contractorcommitment what so ever with respect to such securities. The Borrower assumes that the recipient has professional experience and is a high-net worth individual orBorrower this presentation has not been approved as any governmental agency.
By accepting this presentation, the recipient represents and warrants that it is a person to whom this presentation may be delivered or distributed without a violationof the laws of any relevant jurisdiction. This presentation is not to be disclosed to any other person or used for any other purpose and any other person who receivesthis presentation should not rely or act upon it. Neither the Borrower nor its directors make any recommendation as to the matters set out in the presentation.Prospective lenders interested in investing in the Borrower are recommended to seek their own independent legal, tax and/or financial investment advice from acompetent financial advisor. The whole of the presentation should be read. Reliance on this presentation for the purposes of engaging in any investment in theBorrower may expose an individual to a significant risk of losing the entire investment and may not be suitable for all recipients.
Disclaimer

Presenters
Modestas SudniusChief Executive Officer
Maris KreicsChief Financial Officer
● Maris has been at Mogo Finance since 2015● Before joining Mogo Finance he spent two years in a
corporate finance role working for the largest telecommunications service company in Latvia – Tet (prev. Lattelecom). Before that, he spent seven years at PwC with two of them in New York, working exclusively on one of the largest S&P 500 Tech company’s lead audit team, which was responsible for managing other audit teams globally
● Maris holds a Master’s degree in Finance from BA School of Business and Finance
● Maris is a CFA Charterholder and a member of ACCA since 2011 (Fellow since 2016)
● Modestas has been at Mogo Finance since 2013 ● He started as country manager for Lithuania, where he
established successful operations and subsequently inJanuary 2018 was promoted to regional CEO for core markets of Mogo Finance in Latvia, Lithuania, Estonia, Georgia and Armenia
● In November 2018, he joined the Mogo Finance management team as CEO
● Prior to Mogo Finance, Modestas worked at international organizations, such as EY and EPS LT, UAB
● Modestas is a graduate of the Management program from ISM University of Management and Economics and also holds a Master’s degree from the Stockholm School of Economics
3

4
Operational highlights
Interest and similar income, including income from used car rent grew by
42.0% equalling 55.8m (9M 2018: EUR 39.3m)
Number of active customers in mid-tier markets1) up significantly by
approx. 100.0% to over 17,000 (31.12.2018: approx. 8,500)
39.3
55.8
9M 2018 9M 2019
Stable growth in interest and similar income including income from used car rent
in EURm42.0%
Mogo Finance group
Significant growth in loans issued
in EURm
94.6
132.6
9M 2018 9M 2019
40.2%
Mogo Finance group
Increase in issuances continue to drive strong results
1) Mid-tier countries: Bulgaria, Moldova, Romania, Belarus and Albania. Excluding Poland due to the stopped issuances
Near-prime product launched in Latvia in cooperation with local Latvian
bank
After the testing phase Mogo Finance decided to temporarily stop
operations in Ukraine market
All of these operational highlights lead to a 82.1% increase in net profit for
the period reaching EUR 5.1m (9M 2018: EUR 2.8m) and significant
increase in EBITDA by 55.1% reaching EUR 22.8m (9M 2018: EUR
14.7m)
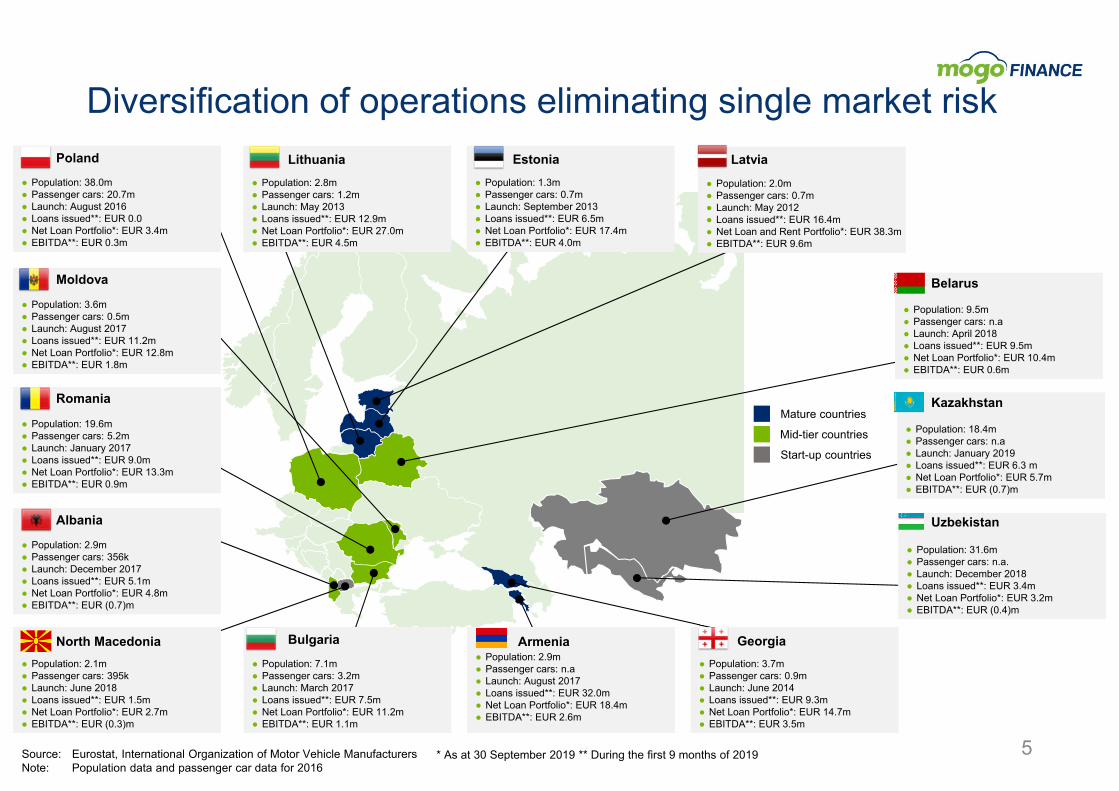
Diversification of operations eliminating single market risk
Source: Eurostat, International Organization of Motor Vehicle ManufacturersNote: Population data and passenger car data for 2016
Mature countries
Mid-tier countries
Start-up countries
* As at 30 September 2019 ** During the first 9 months of 2019
● Population: 38.0m● Passenger cars: 20.7m● Launch: August 2016● Loans issued**: EUR 0.0● Net Loan Portfolio*: EUR 3.4m● EBITDA**: EUR 0.3m
● Population: 38.0m● Passenger cars: 20.7m● Launch: August 2016● Loans issued**: EUR 0.0● Net Loan Portfolio*: EUR 3.4m● EBITDA**: EUR 0.3m
Poland
● Population: 2.8m● Passenger cars: 1.2m● Launch: May 2013● Loans issued**: EUR 12.9m● Net Loan Portfolio*: EUR 27.0m● EBITDA**: EUR 4.5m
● Population: 2.8m● Passenger cars: 1.2m● Launch: May 2013● Loans issued**: EUR 12.9m● Net Loan Portfolio*: EUR 27.0m● EBITDA**: EUR 4.5m
Lithuania● Population: 1.3m● Passenger cars: 0.7m● Launch: September 2013● Loans issued**: EUR 6.5m● Net Loan Portfolio*: EUR 17.4m● EBITDA**: EUR 4.0m
● Population: 1.3m● Passenger cars: 0.7m● Launch: September 2013● Loans issued**: EUR 6.5m● Net Loan Portfolio*: EUR 17.4m● EBITDA**: EUR 4.0m
Estonia● Population: 2.0m● Passenger cars: 0.7m● Launch: May 2012● Loans issued**: EUR 16.4m● Net Loan and Rent Portfolio*: EUR 38.3m● EBITDA**: EUR 9.6m
● Population: 2.0m● Passenger cars: 0.7m● Launch: May 2012● Loans issued**: EUR 16.4m● Net Loan and Rent Portfolio*: EUR 38.3m● EBITDA**: EUR 9.6m
Latvia
● Population: 9.5m● Passenger cars: n.a● Launch: April 2018● Loans issued**: EUR 9.5m● Net Loan Portfolio*: EUR 10.4m● EBITDA**: EUR 0.6m
● Population: 9.5m● Passenger cars: n.a● Launch: April 2018● Loans issued**: EUR 9.5m● Net Loan Portfolio*: EUR 10.4m● EBITDA**: EUR 0.6m
Belarus
● Population: 31.6m● Passenger cars: n.a.● Launch: December 2018● Loans issued**: EUR 3.4m● Net Loan Portfolio*: EUR 3.2m● EBITDA**: EUR (0.4)m
● Population: 31.6m● Passenger cars: n.a.● Launch: December 2018● Loans issued**: EUR 3.4m● Net Loan Portfolio*: EUR 3.2m● EBITDA**: EUR (0.4)m
Uzbekistan
● Population: 18.4m● Passenger cars: n.a● Launch: January 2019● Loans issued**: EUR 6.3 m● Net Loan Portfolio*: EUR 5.7m● EBITDA**: EUR (0.7)m
● Population: 18.4m● Passenger cars: n.a● Launch: January 2019● Loans issued**: EUR 6.3 m● Net Loan Portfolio*: EUR 5.7m● EBITDA**: EUR (0.7)m
Kazakhstan
● Population: 3.7m● Passenger cars: 0.9m● Launch: June 2014● Loans issued**: EUR 9.3m● Net Loan Portfolio*: EUR 14.7m● EBITDA**: EUR 3.5m
● Population: 3.7m● Passenger cars: 0.9m● Launch: June 2014● Loans issued**: EUR 9.3m● Net Loan Portfolio*: EUR 14.7m● EBITDA**: EUR 3.5m
Georgia● Population: 2.9m● Passenger cars: n.a● Launch: August 2017● Loans issued**: EUR 32.0m● Net Loan Portfolio*: EUR 18.4m● EBITDA**: EUR 2.6m
● Population: 2.9m● Passenger cars: n.a● Launch: August 2017● Loans issued**: EUR 32.0m● Net Loan Portfolio*: EUR 18.4m● EBITDA**: EUR 2.6m
Armenia● Population: 7.1m● Passenger cars: 3.2m● Launch: March 2017● Loans issued**: EUR 7.5m● Net Loan Portfolio*: EUR 11.2m● EBITDA**: EUR 1.1m
● Population: 7.1m● Passenger cars: 3.2m● Launch: March 2017● Loans issued**: EUR 7.5m● Net Loan Portfolio*: EUR 11.2m● EBITDA**: EUR 1.1m
Bulgaria
● Population: 2.1m● Passenger cars: 395k● Launch: June 2018● Loans issued**: EUR 1.5m● Net Loan Portfolio*: EUR 2.7m ● EBITDA**: EUR (0.3)m
● Population: 2.1m● Passenger cars: 395k● Launch: June 2018● Loans issued**: EUR 1.5m● Net Loan Portfolio*: EUR 2.7m ● EBITDA**: EUR (0.3)m
North Macedonia
● Population: 2.9m● Passenger cars: 356k● Launch: December 2017● Loans issued**: EUR 5.1m● Net Loan Portfolio*: EUR 4.8m● EBITDA**: EUR (0.7)m
● Population: 2.9m● Passenger cars: 356k● Launch: December 2017● Loans issued**: EUR 5.1m● Net Loan Portfolio*: EUR 4.8m● EBITDA**: EUR (0.7)m
Albania
● Population: 19.6m● Passenger cars: 5.2m● Launch: January 2017● Loans issued**: EUR 9.0m● Net Loan Portfolio*: EUR 13.3m● EBITDA**: EUR 0.9m
● Population: 19.6m● Passenger cars: 5.2m● Launch: January 2017● Loans issued**: EUR 9.0m● Net Loan Portfolio*: EUR 13.3m● EBITDA**: EUR 0.9m
Romania
● Population: 3.6m● Passenger cars: 0.5m● Launch: August 2017● Loans issued**: EUR 11.2m● Net Loan Portfolio*: EUR 12.8m● EBITDA**: EUR 1.8m
● Population: 3.6m● Passenger cars: 0.5m● Launch: August 2017● Loans issued**: EUR 11.2m● Net Loan Portfolio*: EUR 12.8m● EBITDA**: EUR 1.8m
Moldova
5

18.0
24.2
9M 2018 9M 2019
35.241.2
9M 2018 9M 2019
6
Financial highlights
Interest and similar income including income from used car rent
39.3
55.8
9M 2018 9M 2019
14.7
22.8
9M 2018 9M 2019
● Rapid growth in net interest income of 35.5% to EUR
37.8m (9M 2018: EUR 27.9m)
Mature and mid-tier countries:
● Significant increase in EBITDA by 34.4% and 1,808% to
EUR 24.2m (9M 2018: EUR 18.0m) and EUR 3.7m (9M
2018: EUR -0.7m) in mature and mid-tier countries
respectively
● Interest and similar income including income from used
car rent up strongly by 17.0% and 158.8% to EUR 41.2m
(9M 2018: EUR 35.2m) and EUR 13.2m (9M 2018: EUR
5.1m) in mature and mid-tier countries respectively
EBITDA improved notably
42.0% 17.0%
34.4%55.1%
Mogo Finance group Mature countries
Mogo Finance group Mature countries1)
1)
1) Mature countries: Latvia, Lithuania, Estonia, Georgia, Armenia
-0.7
3.7
Mid-tier countries
1,808%
5.1
13.2
9M 2018 9M 2019
Mid-tier countries
158.8%
9M 2018
9M 2019
Mid-tier markets deliver strong performance

39.3
55.8
9M 2018 9M 2019
7
Financial highlights
2.85.1
7% 10%
-20.00%
-15.00%
-10.00%
-5.00%
0.00%
5.00%
10.00%
15.00%
20.00%
-2.0
0.0
2.0
4.0
6.0
8.0
10.0
12.0
9M 2018 9M 2019
9.0
4.6
25%
9%
-20.00%
-15.00%
-10.00%
-5.00%
0.00%
5.00%
10.00%
15.00%
20.00%
25.00%
-2.0
0.0
2.0
4.0
6.0
8.0
10.0
12.0
2017 2018
Net profit Net profit margin
32%
46%
9M 2018 9M 2019
1.41.8
9M 2018 9M 2019
14.7
22.8
9M 2018 9M 2019
35.6
54.4
2017 2018
Revenue EUR m Net profit EUR m and margin
Interest coverage ratio Cost to income ratio Capitalization ratio
EBITDA EUR m
20.0 20.4
2017 2018
2.4
1.6
2017 2018
28%
35%
2017 2018
11.8% 12.7%
2017 2018
12.2%14.5%
9M 2018 9M 2019
1)
1) Cost to income ratio increased due to introduction of HUB structure2) Financial covenant - Interest coverage ratio of at least 1.25
Minimum 1.252)
Min8.0%3)
Min10.0%3)
3) Financial covenant - Capitalisation ratio of at least 8.0% until the end of the financial year ending on 31 December 2018; and 10.0% until the end of the financial year ending on 31 December 2019
9m 2019 results already exceed FY2018

Mid-tier markets getting closer to maturity
7.5
23.419.8
37.3
2017 2018 9M 2018 9M 2019
Net loan portfolio Cost to income ratio
130%
45%52%
32%
2017 2018 9M 2018 9M 2019
0.9
6.95.0
10.4
2017 2018 9M 2018 9M 2019
Revenue EUR m EBITDA EUR m
-1.2
-2.2-133%
-31%
-140%
-120%
-100%
-80%
-60%
-40%
-20%
0%
20%
-2.50
-2.00
-1.50
-1.00
-0.50
0.00
Net profit EUR m and margin
-0.9
1.0
-14%
-9%
-4%
1%
6%
-1.00
-0.50
0.00
0.50
1.00
2017
2018
9M 2018
9M 2019
2017 2018 9M 2018
9M 2019
-1.0
0.1
-0.1
3.8
1) Mid-tier countries (operating since 2017): Bulgaria, Moldova and Romania. Poland is excluded as Mogo has stopped issuing loans in Poland. 8
-18%
9%
1)
21%
15%11%
09%8%
7%7%
7% 4% 2% 2% 3.0% 2% 1%
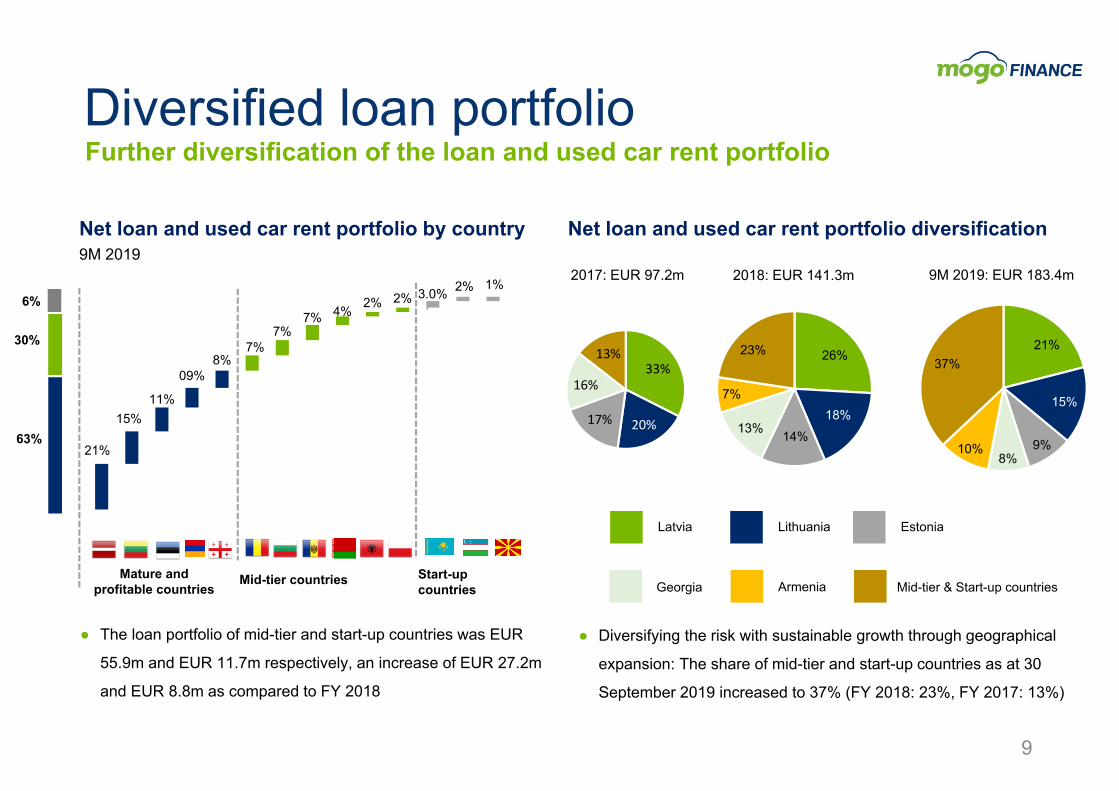
Diversified loan portfolio
9
Net loan and used car rent portfolio by country9M 2019
Net loan and used car rent portfolio diversification
2017: EUR 97.2m 9M 2019: EUR 183.4m
Mid-tier & Start-up countries
Latvia Lithuania Estonia
Georgia
2018: EUR 141.3m
Armenia
● Diversifying the risk with sustainable growth through geographical
expansion: The share of mid-tier and start-up countries as at 30
September 2019 increased to 37% (FY 2018: 23%, FY 2017: 13%)
33%
20%17%
16%
13% 26%
18%14%13%
7%
23%
Mature and profitable countries
Mid-tier countries Start-up countries
6%
63%
30% 21%
15%
9%8%
10%
37%
● The loan portfolio of mid-tier and start-up countries was EUR
55.9m and EUR 11.7m respectively, an increase of EUR 27.2m
and EUR 8.8m as compared to FY 2018
Further diversification of the loan and used car rent portfolio
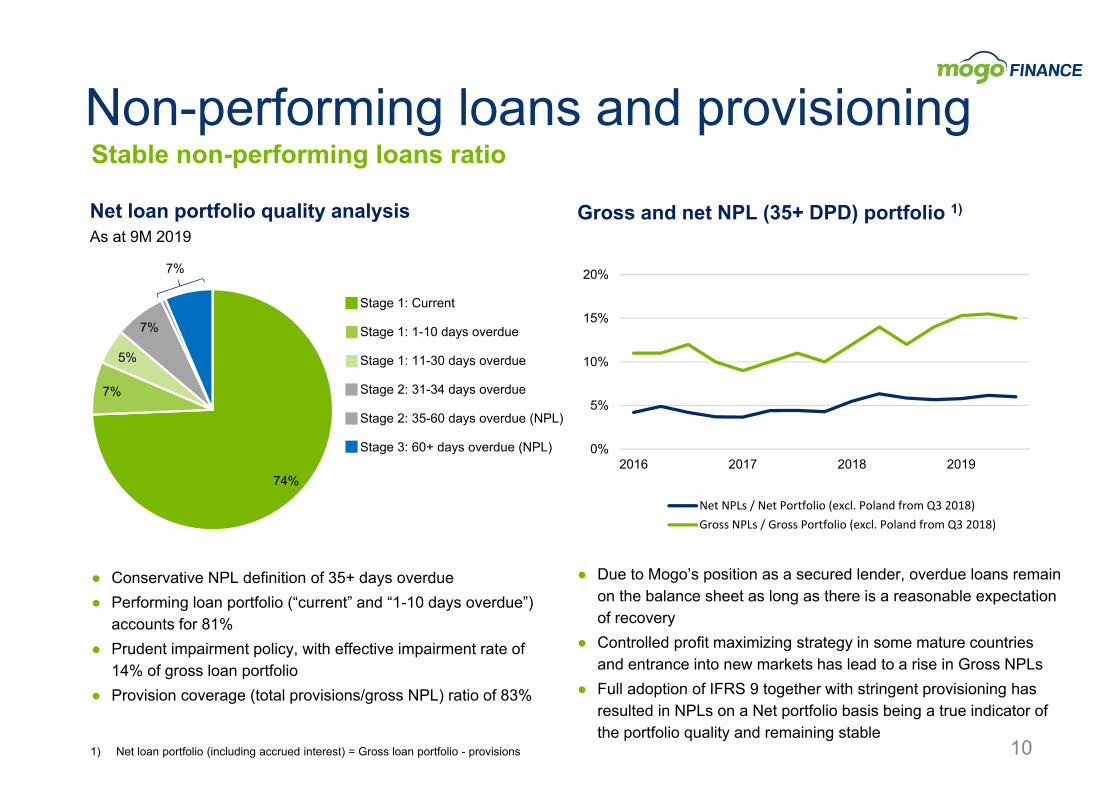
Non-performing loans and provisioning
101) Net loan portfolio (including accrued interest) = Gross loan portfolio - provisions
74%
7%
5%
7%
Stage 1: Current
Stage 1: 1-10 days overdue
Stage 1: 11-30 days overdue
Stage 2: 31-34 days overdue
Stage 2: 35-60 days overdue (NPL)
Stage 3: 60+ days overdue (NPL)
Net loan portfolio quality analysisAs at 9M 2019
7%
● Due to Mogo’s position as a secured lender, overdue loans remain on the balance sheet as long as there is a reasonable expectation of recovery
● Controlled profit maximizing strategy in some mature countries and entrance into new markets has lead to a rise in Gross NPLs
● Full adoption of IFRS 9 together with stringent provisioning has resulted in NPLs on a Net portfolio basis being a true indicator of the portfolio quality and remaining stable
● Conservative NPL definition of 35+ days overdue ● Performing loan portfolio (“current” and “1-10 days overdue”)
accounts for 81%● Prudent impairment policy, with effective impairment rate of
14% of gross loan portfolio● Provision coverage (total provisions/gross NPL) ratio of 83%
0%
5%
10%
15%
20%
2016 2017 2018 2019
Net NPLs / Net Portfolio (excl. Poland from Q3 2018)Gross NPLs / Gross Portfolio (excl. Poland from Q3 2018)
Gross and net NPL (35+ DPD) portfolio 1)
Stable non-performing loans ratio
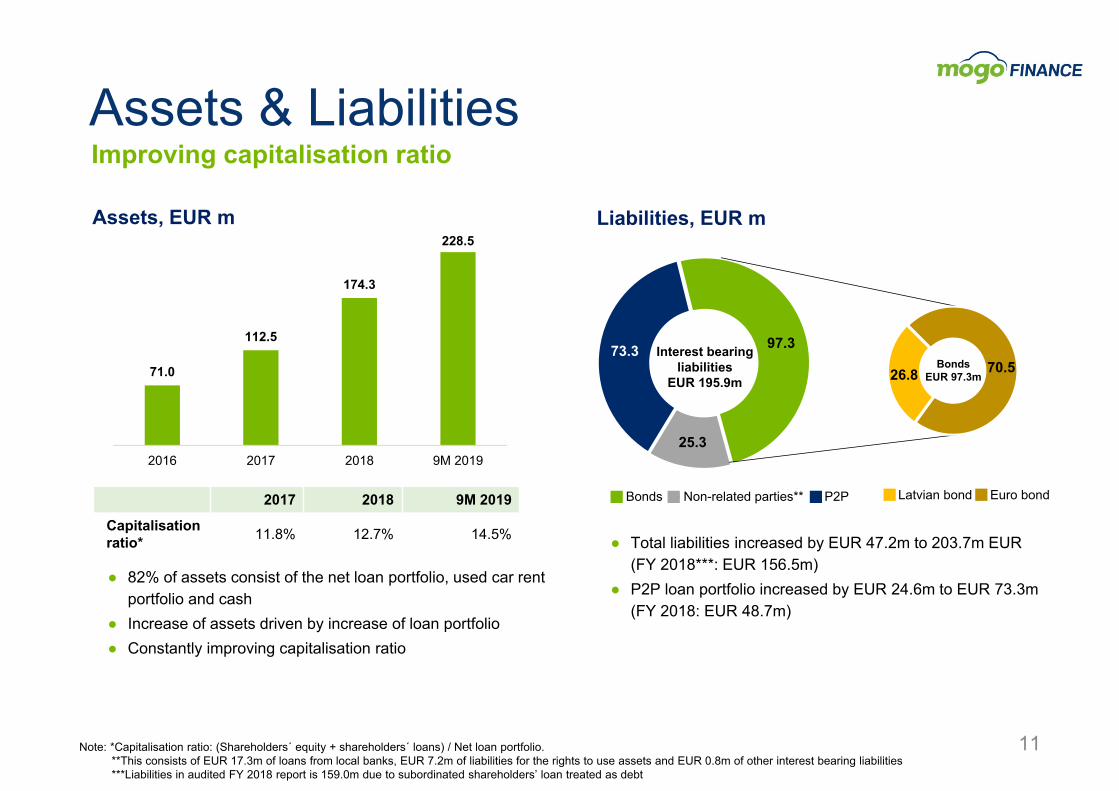
Assets & Liabilities
97.3
25.3
73.3
Bonds Non-related parties** P2P
Assets, EUR m Liabilities, EUR m
● 82% of assets consist of the net loan portfolio, used car rent portfolio and cash
● Increase of assets driven by increase of loan portfolio● Constantly improving capitalisation ratio
Interest bearing liabilities
EUR 195.9m
2017 2018 9M 2019
Capitalisationratio* 11.8% 12.7% 14.5%
71.0
112.5
174.3
228.5
2016 2017 2018 9M 2019
● Total liabilities increased by EUR 47.2m to 203.7m EUR (FY 2018***: EUR 156.5m)
● P2P loan portfolio increased by EUR 24.6m to EUR 73.3m (FY 2018: EUR 48.7m)
Note: *Capitalisation ratio: (Shareholders´ equity + shareholders´ loans) / Net loan portfolio. **This consists of EUR 17.3m of loans from local banks, EUR 7.2m of liabilities for the rights to use assets and EUR 0.8m of other interest bearing liabilities ***Liabilities in audited FY 2018 report is 159.0m due to subordinated shareholders’ loan treated as debt
26.8 70.5
Latvian bond Euro bond
11
BondsEUR 97.3m
Improving capitalisation ratio
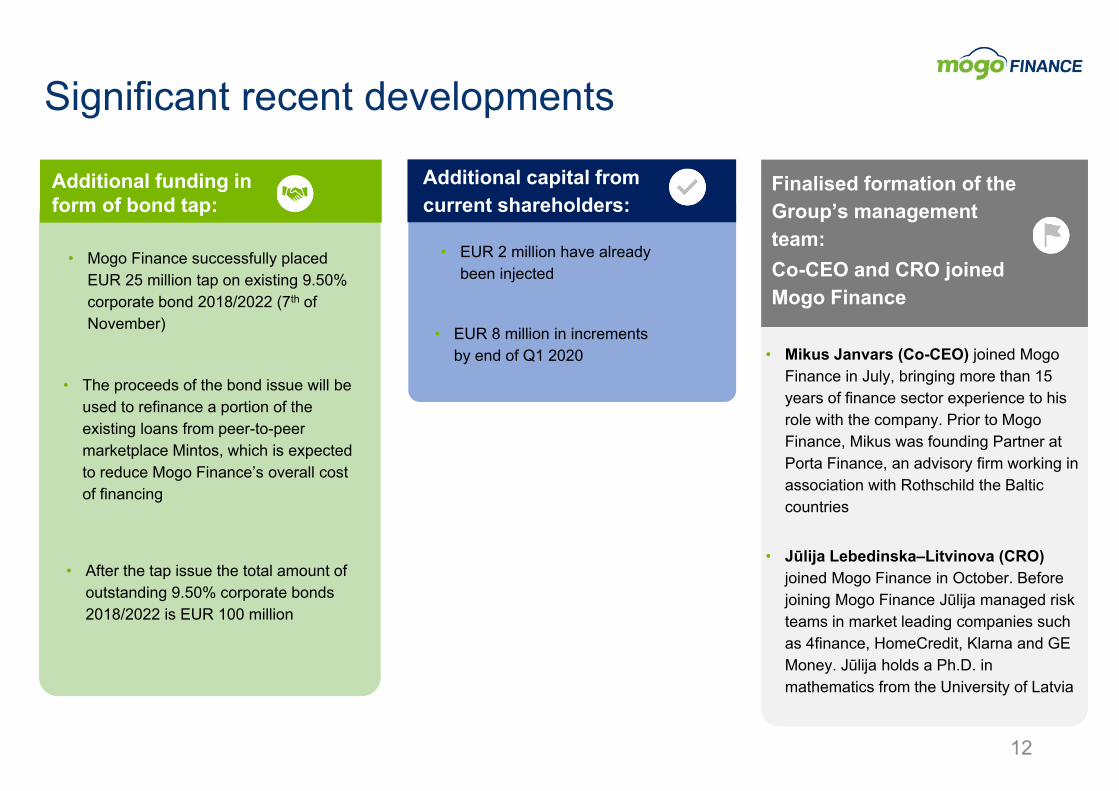
• Mikus Janvars (Co-CEO) joined Mogo Finance in July, bringing more than 15 years of finance sector experience to his role with the company. Prior to Mogo Finance, Mikus was founding Partner at Porta Finance, an advisory firm working in association with Rothschild the Baltic countries
• Jūlija Lebedinska–Litvinova (CRO) joined Mogo Finance in October. Before joining Mogo Finance Jūlija managed risk teams in market leading companies such as 4finance, HomeCredit, Klarna and GE Money. Jūlija holds a Ph.D. in mathematics from the University of Latvia
Finalised formation of the Group’s management team: Co-CEO and CRO joined Mogo Finance
Additional funding in form of bond tap:
• Mogo Finance successfully placed EUR 25 million tap on existing 9.50% corporate bond 2018/2022 (7th of November)
12
Significant recent developments
• EUR 2 million have already been injected
Additional capital from current shareholders:
• EUR 8 million in increments by end of Q1 2020
• The proceeds of the bond issue will be used to refinance a portion of the existing loans from peer-to-peer marketplace Mintos, which is expected to reduce Mogo Finance’s overall cost of financing
• After the tap issue the total amount of outstanding 9.50% corporate bonds 2018/2022 is EUR 100 million

13
Appendix

* Represents different HUB organizational units1) Are not yet part of the consolidated group2) Share purchase agreement has been signed
14
Mogo Latvia
Mogo Estonia
Mogo Moldova
Mogo Poland
Mogo Bulgaria
Mogo Albania
Mogo RomaniaMogo Georgia
Mogo Finance
Founders Management, current and former employees
95% 5%
Mogo Lithuania
Mogo Armenia
Mogo Belarus
Mogo Uzbekistan Longo Netherlands
Longo Georgia
Longo Estonia
Longo Lithuania
Mogo Baltics and Caucasus* Mogo Balkans* Mogo Eastern
Europe* Mogo Central Asia* Longo Group*
Mogo Bosnia and Herzegovina
Mogo Macedonia
Mogo Kosovo Longo Latvia
Longo Belgium
Mogo Kazakhstan
Operational structure
1) 2)
1) 2)
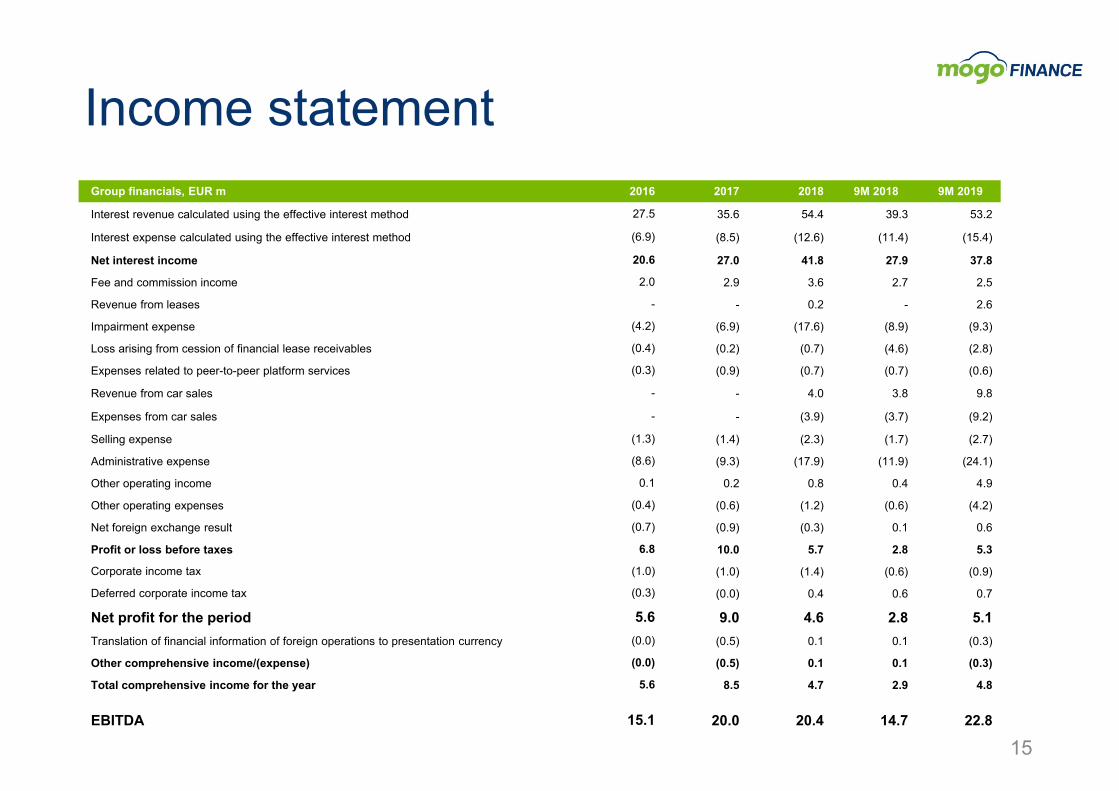
Income statement
15
Group financials, EUR m 2016 2017 2018 9M 2018 9M 2019
Interest revenue calculated using the effective interest method 27.5 35.6 54.4 39.3 53.2
Interest expense calculated using the effective interest method (6.9) (8.5) (12.6) (11.4) (15.4)
Net interest income 20.6 27.0 41.8 27.9 37.8
Fee and commission income 2.0 2.9 3.6 2.7 2.5
Revenue from leases - - 0.2 - 2.6
Impairment expense (4.2) (6.9) (17.6) (8.9) (9.3)
Loss arising from cession of financial lease receivables (0.4) (0.2) (0.7) (4.6) (2.8)
Expenses related to peer-to-peer platform services (0.3) (0.9) (0.7) (0.7) (0.6)
Revenue from car sales - - 4.0 3.8 9.8
Expenses from car sales - - (3.9) (3.7) (9.2)
Selling expense (1.3) (1.4) (2.3) (1.7) (2.7)
Administrative expense (8.6) (9.3) (17.9) (11.9) (24.1)
Other operating income 0.1 0.2 0.8 0.4 4.9
Other operating expenses (0.4) (0.6) (1.2) (0.6) (4.2)
Net foreign exchange result (0.7) (0.9) (0.3) 0.1 0.6
Profit or loss before taxes 6.8 10.0 5.7 2.8 5.3
Corporate income tax (1.0) (1.0) (1.4) (0.6) (0.9)
Deferred corporate income tax (0.3) (0.0) 0.4 0.6 0.7
Net profit for the period 5.6 9.0 4.6 2.8 5.1Translation of financial information of foreign operations to presentation currency (0.0) (0.5) 0.1 0.1 (0.3)
Other comprehensive income/(expense) (0.0) (0.5) 0.1 0.1 (0.3)
Total comprehensive income for the year 5.6 8.5 4.7 2.9 4.8
EBITDA 15.1 20.0 20.4 14.7 22.8

16
Balance sheetAssets, EUR m 2016 2017 2018 9M 2019
ASSETS
Cash and cash equivalents 2.2 5.2 6.5 3.6
Non-current finance lease receivables 42.3 63.8 88.2 107.8
Non-current loans and advances to customers - 0.7 2.2 2.1
Current finance lease receivables 21.5 32.1 46.4 53.3
Current loans and advances to customers - 0.5 3.1 7.6
Current loans to related parties 0.0 0.0 0.1 -
Assets held for sale 1.1 2.2 2.6 2.0
Goodwill 1.5 1.5 1.7 2.1
Internally generated intangible assets 1.0 1.2 1.9 3.2
Other intangible assets 0.1 0.1 0.1 0.1
Right-of-use assets - - 2.4 7.1
Rental fleet - - 1.4 12.6
Property, plant and equipment 0.5 0.4 1.0 1.9
Leasehold improvements 0.0 0.0 0.3 0.6
Advance payments for assets 0.0 - 0.2 0.3
Deferred tax asset 0.2 0.2 0.6 1.4
Inventories 0.0 0.8 1.7 5.2
Prepaid expense 0.1 0.7 0.8 1.7
Trade receivables - - 0.8 0.4
Non-current loans to related parties - 0.6 5.3 9.7
Other non-current financial assets - - 1.0 1.5
Other short-term receivables from related parties 0.0 0.1 0.0 -
Other non-current receivables from related parties 0.1 - - -
Other loans and receivables - - 4.7 0.9
Corporate income tax receivable - - - 0.4
Other receivables 0.3 2.3 1.3 3.0
TOTAL ASSETS 71.0 112.5 174.3 228.5
Equity & Liabilities, EUR m 2016 2017 2018 9M 2019
EQUITY
Share capital 0.0 0.0 0.0 1.0
Share premium 10.0 - - -
Retained earnings 3.0 11.5 15.1 20.1
Foreign currency translation reserve 0.0 (0.5) (0.4) (0.7)
Reserves 0.0 0.1 0.1 0.2
Equity attributable to equity holders of the Parent Company 13.0 11.1 14.8 20.6
Non-controlling interest 0.2 0.4 0.5 0.4
Subordinated debt - - 2.5 3.8
TOTAL EQUITY 13.2 11.5 17.8 24.8
LIABILITIES
Non-current borrowings 51.9 70.8 120.1 162.3
Current borrowings 3.4 25.8 30.3 33.6
Other non-current financial liabilities - 0.1 0.1 -Prepayments and other payments received from customers 0.6 0.8 0.1 0.2
Trade payable 0.3 0.7 1.2 1.3
Corporate income tax payable 0.5 0.7 0.6 0.3
Taxes payable 0.2 0.2 0.6 0.8
Other liabilities 0.2 0.1 0.2 1.5
Accrued liabilities 0.6 1.0 1.8 2.4
Other current financial liabilities - 0.1 0.1 0.1
Non-current provisions 0.2 0.7 1.1 0.6
TOTAL LIABILITIES 57.8 101.0 156.5 203.7
Current provisions - - 0.4 0.6
TOTAL EQUITY + LIABILITIES 71.0 112.5 174.3 228.5
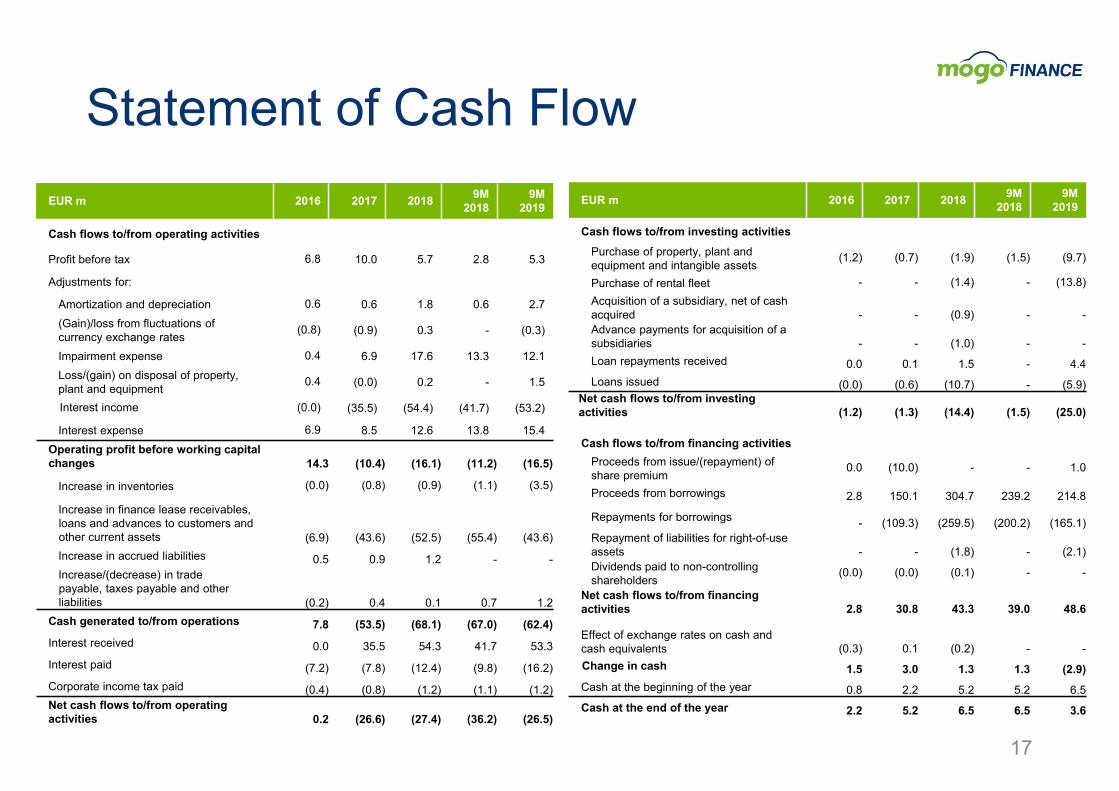
Statement of Cash Flow
17
EUR m 2016 2017 2018 9M 2018
9M 2019
Cash flows to/from operating activities
Profit before tax 6.8 10.0 5.7 2.8 5.3
Adjustments for:
Amortization and depreciation 0.6 0.6 1.8 0.6 2.7(Gain)/loss from fluctuations of currency exchange rates (0.8) (0.9) 0.3 - (0.3)
Impairment expense 0.4 6.9 17.6 13.3 12.1Loss/(gain) on disposal of property, plant and equipment 0.4 (0.0) 0.2 - 1.5
Interest income (0.0) (35.5) (54.4) (41.7) (53.2)
Interest expense 6.9 8.5 12.6 13.8 15.4Operating profit before working capital changes 14.3 (10.4) (16.1) (11.2) (16.5)
Increase in inventories (0.0) (0.8) (0.9) (1.1) (3.5)
Increase in finance lease receivables, loans and advances to customers and other current assets (6.9) (43.6) (52.5) (55.4) (43.6)Increase in accrued liabilities 0.5 0.9 1.2 - -Increase/(decrease) in trade payable, taxes payable and other liabilities (0.2) 0.4 0.1 0.7 1.2
Cash generated to/from operations 7.8 (53.5) (68.1) (67.0) (62.4)Interest received 0.0 35.5 54.3 41.7 53.3Interest paid (7.2) (7.8) (12.4) (9.8) (16.2)Corporate income tax paid (0.4) (0.8) (1.2) (1.1) (1.2)Net cash flows to/from operating activities 0.2 (26.6) (27.4) (36.2) (26.5)
EUR m 2016 2017 2018 9M 2018
9M 2019
Cash flows to/from investing activitiesPurchase of property, plant and equipment and intangible assets
(1.2) (0.7) (1.9) (1.5) (9.7)
Purchase of rental fleet - - (1.4) - (13.8)Acquisition of a subsidiary, net of cash acquired - - (0.9) - -Advance payments for acquisition of a subsidiaries - - (1.0) - -Loan repayments received 0.0 0.1 1.5 - 4.4Loans issued (0.0) (0.6) (10.7) - (5.9)
Net cash flows to/from investing activities (1.2) (1.3) (14.4) (1.5) (25.0)
Cash flows to/from financing activitiesProceeds from issue/(repayment) of share premium
0.0 (10.0) - - 1.0
Proceeds from borrowings 2.8 150.1 304.7 239.2 214.8
Repayments for borrowings - (109.3) (259.5) (200.2) (165.1)Repayment of liabilities for right-of-use assets - - (1.8) - (2.1)Dividends paid to non-controlling shareholders
(0.0) (0.0) (0.1) - -
Net cash flows to/from financing activities 2.8 30.8 43.3 39.0 48.6
Effect of exchange rates on cash and cash equivalents (0.3) 0.1 (0.2) - -Change in cash 1.5 3.0 1.3 1.3 (2.9)Cash at the beginning of the year 0.8 2.2 5.2 5.2 6.5Cash at the end of the year 2.2 5.2 6.5 6.5 3.6
Thank you for your attention!Mogo Finance GroupSkanstes street 50 LV-1013 Riga, LatviaHome page: www.mogofinance.com
Contact personMāris Kreics, Group CFO Phone: +371 66 900 900E-mail: [email protected]