Embed Size (px)
Citation preview

Earnings and the Value of Voting Rights*
Umit G. Gurun and
19 September 2016
Abs
We examine the impact of earnings announcem of shareholder voting rights (i.e., voting premium) estimated using a new ploits option prices. We find voting premium is negatively related t elation is primarily driven by unfavorable earnings surprises, stre of impending shareholder meetings, and attenuated when manag with shareholders. Variation in voting premium around earnings an future exercises of control rights in firms, such as CEO ructurings. Our results highlight a strong link between ated in earnings announcements.
JEL cla Keywo ts, Earnings Announcements, Corporate Govern
* Umit G as at Dallas, 800 W Campbell Rd. SM 41, Richardson, TX 75024, USA. Phone: + [email protected]. : Boston College, Carroll School of Manag Commonwealth Avenue, Chestnut Hill, MA 02467, USA. Phone: +1-617-552-1175. Email: [email protected]. We have benefited from comments by participants at the seminars at Boston College, Singapore Management University, Nanyang Technological University, National University of Singapore, Korea University, and the Early Ideas Session of the Drexel 2016 Corporate Governance Conference. We thank Rui Albuquerque, Vladimir Atanasov, Sudipta Basu, Bernard Black, Geoffrey Booth, Mark Bradshaw, Alex Butler, Tom Chemmanur, Lauren Cohen, Francesca Cornelli, Julian Franks, Edith Hotchkiss, Amy Hutton, Alan Marcus, Jordan Nickerson, Naim Bugra Ozel, Sugata Roychowdhury, Susan Shu, Ewa Sletten, and Phil Strahan for useful comments. All errors are ours. An earlier version of this study was circulated under the title ‘Control Rights and Earnings Announcements’.
1
Earnings and the Value of Voting Rights
Abstract
We examine the impact of earnings announcements on t r voting rights
(i.e., voting premium) estimated using a new rices. We find
voting premium is negatively related to earning arily driven by
unfavorable earnings surprises, strengthened of impending shareholder
meetings, and attenuated when manag with shareholders. Variation
in voting premium around earnings an re exercises of control rights
in firms, such as CEO ructurings. Our results highlight
a strong link between ated in earnings announcements.
JEL cla
Keywo , Control Rights, Earnings Announcements, Corporate
Governance

2
Earnings announcements and their impact in capital markets attract considerable attention in
the literature and among practitioners. Nevertheless, compared to other information events,
earnings announcements seem to provide a surprisingly modest amount of incremental
information to the stock returns (Ball and Shivakumar 2008). This suggests that perhaps the
primary economic role of earnings in capital markets is to provide a benchmark for
assessment and/or settlement of contractual agreements ( 1986, Collins
and DeAngelo 1990, Holthausen and Watts 2001). Adve reflect and/or
trigger disagreements among investors regard ms’ assets, and
increase the chances of a control contest.
In this study, we bring a new persp ht the relation between the
accounting information released in th and the shareholder voting
rights, one of the mo t f d t l hareholders have. In addition to
informing investors ows (ownership role), earnings
influence the contro r shareholders to express their
concern pressure management for corporate reform
(control y maps into the separation of ownership and
control ern corporations (Berle and Means 1932, Manne 1964, Jensen
and Me ensen 1983).
It is difficult to discern the control role of earnings, because voting rights are hard to
isolate from cash flows. We overcome this problem by utilizing a new, market-based, and
daily measure of the value of shareholder voting rights. We test whether this value of voting 1 The lower information costs amidst free-riding problems, and the assurance of standards under public scrutiny of the accounting information may explain the common practice of using earnings as benchmarks for contracts (see, e.g., Li 2011, Christensen and Nikolaev 2012, and Christensen, Nikolaev, and Wittenberg-Moerman 2016).
3
rights varies with earnings information. Potential conflicts or disagreements among investors
about how to run the firm in a world with incomplete contracts make control valuable
(Aghion and Bolton 1986, 1992). In particular, the value of voting rights increases with the
possibility of capital gains from improving the management of the company (Manne 1964,
Easterbrook and Fischel 1983, Cox and Roden 2002, Karakaş and Mohseni 2016). Therefore,
given that negative earnings announcements are ass icative of the
inefficiencies in the management of the company, we e ouncements to
be negatively related with the value of voting r
We estimate the value of voting rights ting premium),
following the method introduced in Kalay Ka 014). Specifically, we define
voting premium as the price differen the non-voting share that is
synthesized using th t ll it percentage of the stock price.2
The key insight for t he cash flows of the underlying
stocks, but not the ke other, common methods of
estimati es of block shareholders or dual-class stocks,
enables rge sample of widely held firms and hence is
less sub ection biases.3 Voting premium is not driven by non-control
2 Voting premium reflects the value of the vote to the “marginal investor,” which can be incumbent management and/or (potential) outside investors. Throughout the text, we use the terms “the value of voting rights,” “the value of control,” and “the voting premium” interchangeably to refer to the market value of shareholder voting rights. 3 The method of estimating the value of control using (i) trades of block shareholders: takes price difference between the share price in a block trade and the general stock price right after the block sale, (ii) dual-class stocks: takes price difference between superior and inferior voting classes of shares. Voting premium we estimate is conceptually closer to the latter method. This is because our method essentially synthesizes a benchmark stock (i.e., an inferior voting share) using options. See Kalay, Karakaş, and Pant (2014) for a more detailed discussion.

4
related liquidity concerns, is on average positive, and increases around events in which
control is likely to be contested – such as shareholder meetings (particularly the meetings with
close votes), hedge fund activisms, and mergers and acquisitions (Kalay, Karakaş, and Pant
2014)
Analyzing 4,481 US public firms over the period 1996 to 2013, and earnings surprises
based on seasonal random walk expected earnings, we s voting rights is
negatively related to earnings surprises, i.e., a firm’s ases with the
unfavorable earnings surprises. This baselin etween voting
premium and earnings surprises is robust to co arket, absolute
abnormal returns around the earnings announc year fixed effects. The result
is driven more by negative earnings su nings surprises, and is robust
to truncating the extr i r results to our baseline findings
when we use analyst alculation of earnings surprises,
instead of using seas gs are in line with the view that
unfavor gger, the potential disagreements among
investor assets and increase the chances of a control
contest, the voting premium.
d dividend changes following earnings announcements may
create biases in our estimations. Under the scenario of litigation risk, unexpected bad earnings
4 DeAngelo (1988) suggests that market participants largely rely upon simple earnings measures, since more complex earnings measures are likely to be difficult to interpret for most outside shareholders. Hence, we believe using earnings surprises based on seasonal random walk earnings is more appropriate for our baseline analysis. Nevertheless, we repeat the analysis using analyst consensus as expected earnings to calculate earnings surprise, and find our results to be qualitatively the same, though our sample size decreases considerably with the analyst consensus.
5
may lead to firms being sued due to substantial drops in their stock prices (Skinner 1994). In
such a case, the shareholders who own the stock at the time of the announcement retain the
rights to claim potential impending settlements, which in turn can introduce a positive bias in
the voting premium. Under the scenario of dividend changes, firms experiencing unfavorable
earnings may reduce their dividends (DeAngelo and DeAngelo 1990), which in turn can
introduce a negative bias in the voting premium. To hese plausible
alternative mechanisms drive the relationship we docum analysis again
after excluding (i) stocks with earnings annou price declines,
which proxies for high litigation likelihood, an espectively. In
both cases, we find that our baseline result d for the remaining stocks,
suggesting neither potential litig anges following earnings
announcements drive the negative earnings news and voting
premium.
Competitive p of managers play an important
role in isclosed prior to earnings announcements,
particul gers may disclose a considerable amount of
good or forecasts to manage the expectations of the market before the
upcomi gs announcement (see Skinner 1994, 1997, Kasznik and Lev
1995, Soffer, Thiagarajan, and Walther 2000, Matsumoto 2002, Miller 2002, Richardson,
Teoh, and Wysocki 2004, and Field, Lowry, and Shu 2005). These studies suggest that for the
subset of firms that use voluntary disclosure mechanisms to disseminate news in advance,
there may be contaminations in the information incorporated into the voting premium. We
find that our baseline result continues to hold after excluding firms that provide guidance for
6
future earnings, and hence is not driven by voluntary disclosure practices.
Earnings reporting process is geared toward uncovering information (particularly bad
news) that has not yet been disclosed in other sources (Van Buskirk 2011, Roychowdhury and
Sletten 2012). This further confirms that, on average, earnings events are likely to contain
information that would matter for the pricing of voting rights. While we cannot perfectly
assure that the earnings news on the actual announcemen surprise to the
market, we can check whether market prices the voting r n-earnings day
that exhibit an equivalent amount of equity announcement
day”). We find evidence that information dis ment days are
perceived to be more important than days with uring the quarter, in terms of
market’s valuation of voting rights earnings reports are often
accompanied by th t l fi ntain detailed information to
supplement earnings 88) shows that in proxy contests
with the agenda of a shareholders are more likely to
cite poo s price performances, when they express and
act on t
es around shareholder meetings, particularly when the control
is conte nd Pant 2014). This insight combined with DeAngelo’s (1988)
above-mentioned findings suggests that voting premium should be more responsive to
earnings information especially before shareholder meetings. Using information from over
29,000 shareholder meetings between 1996 and 2013, we find the effect of earnings on voting
premium to be stronger when the next shareholder meeting, at which control rights can be
exercised, is close. DeAngelo (1988) also shows that incumbent CEOs, on average, report
7
more favorable earnings during the election campaigns. Similarly, Collins and DeAngelo
(1990) provide evidence indicating earnings management during proxy contests. If the market
anticipates CEOs’ tendency to manage earnings upwards prior to annual meetings, this may
contaminate the information incorporated into the voting premium.5 To address this concern,
we restrict our sample to earnings that contain a lower accrual component, which allows us to
focus on firms that are less likely to be contaminated wi nt expectations
(Sloan 1996). In this restricted sample, we continue to s is negatively
related in voting premium, suggesting our resu erial tendency
to manage earnings upward prior to critical me
Shareholders are unlikely to know exa ctions are value maximizing,
and hence compensation contracts are areholder value. By granting
an ownership stake i th fi it reates incentives for the CEO to
take actions that ben compensation contracts depends
on the alternative go e environment of the firm. We
find tha of voting rights and earnings is stronger for
firms w y-for-performance sensitivity. 6 This finding
suggest the internal governance mechanism of compensation contracts
(reflecte nce sensitivity) and the external governance mechanism of
market for corporate control (reflected in voting premium) as substitutes in aligning
incentives.
5 For instance, the market may respond to the same amount of negative earnings more harshly if the earnings report is issued right before the annual meetings. 6 We capture the pay-for-performance sensitivity by using the “scaled wealth-performance sensitivity” measure of Edmans, Gabaix, and Landier (2009).
8
Asset composition of firms helps us to further distinguish whether voting premium
varies across firms in the cross section. Owners of firms occasionally resort to liquidation of
firm assets if they cannot bear predictable losses. Such a liquidation option would, ceteris
paribus, be more valuable for firms with tangible assets and generalizable assets, because
these assets fetch a higher value when they are sold at a fire sale (Shleifer and Vishny 2011).
Indeed, Berger, Ofek, and Swary (1996) show that the va alizable assets
does not decline as much as the value of its specialized a (1995) shows
that when future cash flows become disappo as much they
should, suggesting shareholders would prefer t ear predictable
losses.7 We use book-to-market ratio to meas ngibility (Daniel and Titman
2006). We use R&D-to-sales ratio t generalizability with the
assumption that R&D creates firm spe ould cause the assets of firms
to have lower deplo thers. We find that the voting
premium responds m news when the firm has more
tangible , and when the firm has more generalizable
assets (i
7 Change n potentially explain some of the reported liquidation, or abandonment, option va owing earnings announcements. In fact, consistent with Hayn (1995), we find the r to earnings surprises to be driven more by negative earnings surprises, as mentioned earlier. It is, however, important to note that the liquidation option value and the voting premium are separate concepts. The former refers to the cash flows of the underlying security, whereas the latter refers to the control/voting rights. Cash flow and control rights are typically not separated in earlier studies, in part due to the lack of a broadly applicable measure of the value of voting rights. The (potential) changes in the liquidation option value cannot explain the voting premium, since any change in the cash flows of the underlying security is also identically reflected in the synthetic security created using options, due to the no arbitrage principle. 8 Skinner and Sloan (2002) argue that low book-to-market stocks (growth stocks) exhibit an asymmetrically large negative price reactions to negative earnings surprises, compared to high book-to-market stocks (value stocks), due to overoptimistic expectation errors. This “earnings torpedo” effect would bias against us finding a stronger negative relation between the earnings surprises and voting premium for the high book-to-market stocks.
9
Given that the earnings announcements are instrumental in the pricing of voting rights,
we should also observe their impact on the real effects of the subsequent control decisions
(i.e., on the subsequent realized exercises of control). Consistent with this conjecture, we find
that the predicted values of voting premium from earnings surprises explain the CEO
turnovers, M&As, and restructurings in the firms that occur within the following two years. In
other words, we find higher instances of corporate cont the increased
voting premiums that are predicted from negative earning
This paper relates and contributes to the ce/control and
accounting (see, e.g., DeAngelo 1988, Collin Schipper, and
Vincent 2005) by highlighting the control ro ion released in the earnings
announcements. To our knowledge, document that accounting
disclosure has a dire t ( ti ) ff eholder voting rights in a share,
which is the opposite sh flows.
Our paper is ud es t at e amine the relationship between
option particularly around major events such as
earning nts, and analyst recommendations (see, e.g.,
Amin a en, and Griffin 2005, Doran, Fodor, and Krieger 2010, Jin,
Livnat, son and So 2012). A common theme in these papers is that
informed traders choose to use options market before they trade in the underlying stocks,
without being explicit about the nature of such private information. Our study complements
these studies by offering an economic meaning to the behavior of option pricing and
Consistent with our results, Feldhütter, Hotchkiss, and Karakaş (2016) find that creditor voting premium in bonds matter more for firms with more tangible assets.

10
associated private information around earnings announcements from the perspective of the
market for corporate control.
In the following section, we discuss the conceptual relation between the value of
voting rights and earnings, and outline the principal hypothesis we test in the paper. In Section
2, we provide a detailed explanation of the methodology to measure the daily voting premium.
Section 3 describes the data and sample construction details on the
empirical analysis, and Section 5 concludes.
1. Conceptual Relation between the V Rights and Earnings
Control rights matter to inves y if investment contracts are
incomplete and investors differ in ter e ts, beliefs, expectations, risk-
aversions, and reputa 86, 1992). In particular, voting
rights have value if t use their voting power to exert
discipli ance (Manne 1964, Easterbrook and Fischel
1983, C i 2016).
arnings would lower investors’ assessment of the incumbent
manage higher profits in the future. Negative earnings surprises also
increase investors’ anxiety that incumbent management does not possess the ability to turn the
company around. In such cases, earning reports would play an important role in determining
the existence and nature of competition among different management teams to keep, acquire,
or exercise the control over the firm in an attempt to fix/improve the firm’s performance (e.g.,
through a CEO turnover or a takeover). The value of voting rights should increase with the

11
possibility of capital gains from improving the management/performance of the company.
Therefore, given that negative earnings announcements are associated with and indicative of
the inefficiencies in the management of the company, we expect the earnings announcements
to be negatively related with the value of voting rights. We expect the effect of earnings
announcements on the value of voting rights to be particularly driven after negative earnings
announcements, since negative earnings are more likely t ons/changes.
The value of voting rights is also interpreted as ate benefits of
control (Barclay and Holderness 1989, Nenov and Mohseni
2016). However, we assert that such interpre hts is not very
relevant for our setting and analysis First rivate benefits is likely not
immediately affected by the earnings of private benefits of control
are, at least partially, t ll d i ariables and fixed effects. Third,
high private benefits n and Jayaraman 2012) that is
likely to bias against ion in the volatility of earnings
surprise
p hood of a disagreement situation arising and
its econ discussed in Zingales (1995), and hence is time varying.
Conseq analysis in Section 4, we exploit various settings that shape
voting rights to test whether impact of earnings on voting premium varies over time and
9 In the case of a sharp decrease in earnings that breaks the artificially low volatility due to earnings managements, we would expect to observe a negative relation between the voting premium and the earnings. In untabulated results, we find evidence consistent with this expectation. However, in Regression 3 of Table 4, we show that our main results are not driven by such extreme effects.
12
across firms.10
2. Estimation of the Voting Premium
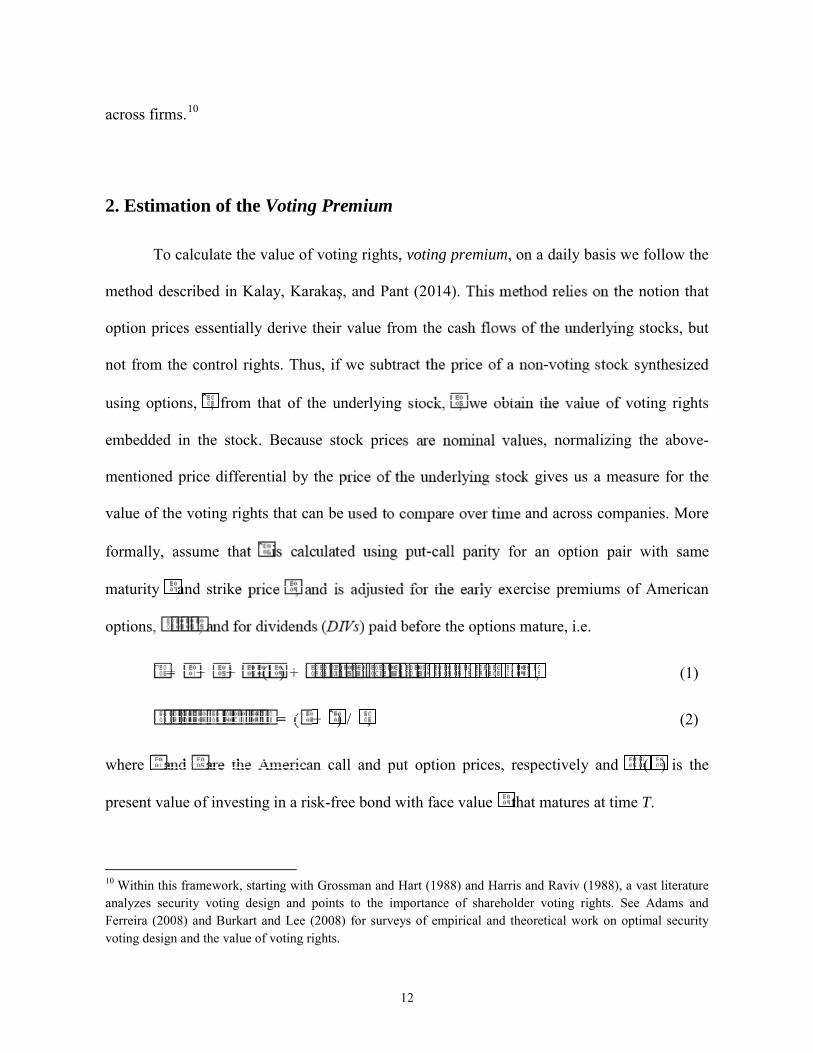
To calculate the value of voting rights, voting premium, on a daily basis we follow the
method described in Kalay, Karakaş, and Pant (2014). T he notion that
option prices essentially derive their value from the cas ng stocks, but
not from the control rights. Thus, if we subtra ck synthesized
using options, ̂ , from that of the underlying f voting rights
embedded in the stock. Because stock price ues, normalizing the above-
mentioned price differential by the p k gives us a measure for the
value of the voting rights that can be and across companies. More
formally, assume th for an option pair with same
maturity and strike xercise premiums of American
options ore the options mature, i.e.
, (1)
− ̂ ) / , (2)
where an call and put option prices, respectively and ( ) is the
present value of investing in a risk-free bond with face value that matures at time T.
10 Within this framework, starting with Grossman and Hart (1988) and Harris and Raviv (1988), a vast literature analyzes security voting design and points to the importance of shareholder voting rights. See Adams and Ferreira (2008) and Burkart and Lee (2008) for surveys of empirical and theoretical work on optimal security voting design and the value of voting rights.
13
Kalay, Karakaş, and Pant (2014) show that neither stock or option liquidity nor non-
control-related frictions drive the changes in voting premium. In addition, they show that
voting premium is positive on average and increases around the events that matter more for
control rights. These events include special shareholder meetings and/or meetings with close
votes, episodes of hedge fund activism (particularly with hostile engagements), and merger
and acquisition events.
An important advantage of the method we emplo ate the market
value of voting rights for a large number of wi nt in time. The
two other, common ways to calculate the valu (i) using price
difference between the share price in a block ral stock price right after the
block sale, (ii) using price difference rior voting classes of shares.
The former method r i bl k t be easily observable for a large
subset of stocks for a measuring the value of control is
not possible if the c addition, block sales are often
triggere selection biases. The latter method requires
firms to th different voting rights, and there are few
firms w here both classes of shares are publicly.12 Moreover, even if
both cla d, one might be less liquid than the other. More importantly,
these samples are potentially subject to selection biases (DeAngelo and DeAngelo 1985, and
Smart and Zutter 2003). Indeed, Francis, Schipper, and Vincent (2005) find that earnings are
generally less informative for dual-class firms, compared to single-class firms.
11 See, e.g., Barclay and Holderness (1989) and Dyck and Zingales (2004). 12 See, e.g., Lease, McConnell, and Mikkelson (1983), Levy (1983), Zingales (1994), Zingales (1995), Rydqvist (1996), Nenova (2003), Hauser and Lauterbach (2004), and Karakaş (2010).

14
Our method provides a way to explore how the value of voting rights behaves when a
block sale event is not present and/or when a dual listed stock does not exist. Voting premium
we estimate is conceptually closer to the method using dual-class shares. This is because our
method essentially synthesizes a benchmark stock (i.e. an inferior voting share) using options.
There is an important technical difference between the two approaches: the maturity of the
non-voting synthetic stock is finite in our method, where inferior voting
share in dual-class method. This difference, ceteris pari ad to a higher
voting premium measured with the dual-clas paring the two
measures in a sample of firms with dual-class erior classes of
shares, Kalay, Karakaş, and Pant (2014) show remium estimated from both
methods are strongly positively correl
3. Sample Descri
the calculation of daily voting premium.
OptionM tudies on options and provides data on US
equity o 996. This database provides end-of-day bid and ask quotes,
trading and option-specific data (e.g., implied volatility, maturity,
strike p , ) can call and put options on stocks traded on US exchanges. It
also provides the stock price and dividends of the underlying stocks and zero-coupon interest
rates.
Voting premium calculation requires availability of option prices (both put and call).
Following Kalay, Karakaş, and Pant (2014), we form option pairs that are used to construct
15
the synthetic stock. An option pair consists of a matched call and put options written on the
same underlying stock and with identical strike price and time to maturity. We discard option
pairs where the quotes for either the call or the put options are locked or crossed. The option
prices are taken as the midpoints of the bid and ask quotes, which are the best closing prices
across all exchanges on which the option trades. Since the options are all American style, we
compute the early exercise premium for the put and the c option-pricing
model. In our calculations, we use the most liquid option 13
We use several other databases to obt for which we
have daily voting premium estimates. We use es, which help
us measure market response to earnings annou of stock return and volatility.
Using Compustat quarterly database, nnouncement dates, earnings
amount, as well as st k h t i ti , book the market ratio, research
and development (R& S Guidance database to identify
firms that provide ea ES to obtain analyst forecasts of
earning e wealth performance sensitivity of CEOs,
using E od. We obtain annual meeting dates from ISS
(former e. Finally, we use Capital IQ Key developments database to
identify and restructuring-related events.
Throughout the paper, we use earnings surprises based on seasonal random walk
earnings. With this setup, our sample baseline sample includes all the firms that have an
13 The most liquid option pair for each firm at each day is defined as the one with the highest volume (minimum volume of call and put), closest at the money and shortest maturity. We use only the options with positive volume. Using the closest at the money options also minimizes the potential downward biases in the voting premium due to the early exercise possibilities of the American options. See Kalay, Karakaş, and Pant (2014) for a more detailed discussion.

16
earnings announcement available four quarters ago, and the four-quarter lagged earnings
values provide the benchmark for earnings expectation. DeAngelo (1988) suggests that
market participants largely rely upon simple earnings measures, since more complex earnings
measures are likely to be difficult to interpret for most outside shareholders. Hence, we
believe using earnings surprises based on seasonal random walk earnings is more appropriate
for our baseline analyses. Nevertheless, we repeat and analysis using
analyst consensus as expected earnings to calculate earn our results to
be qualitatively the same, though our sample th the analyst
consensus (see Section 4.2).
( ~Insert Table
Our main sample covers 4,48 6-2013. In Table 1, Panel A
we report summary ur study. Firm equity size is the
product of number o of calendar year prior to fiscal
year. The pooled av ue o equ ty in our sample is $2.52 billion
($2.15 b arket ratio where the book value of equity is
calculat q y ed tax, investment tax credit minus preferred
stock. T o of the sample has a mean (median) of 0.357 (0.373). We
measure quarterly earnings announcement as the absolute value of
cumulative return (-2,+2) days around the quarterly earnings announcement date. Mean
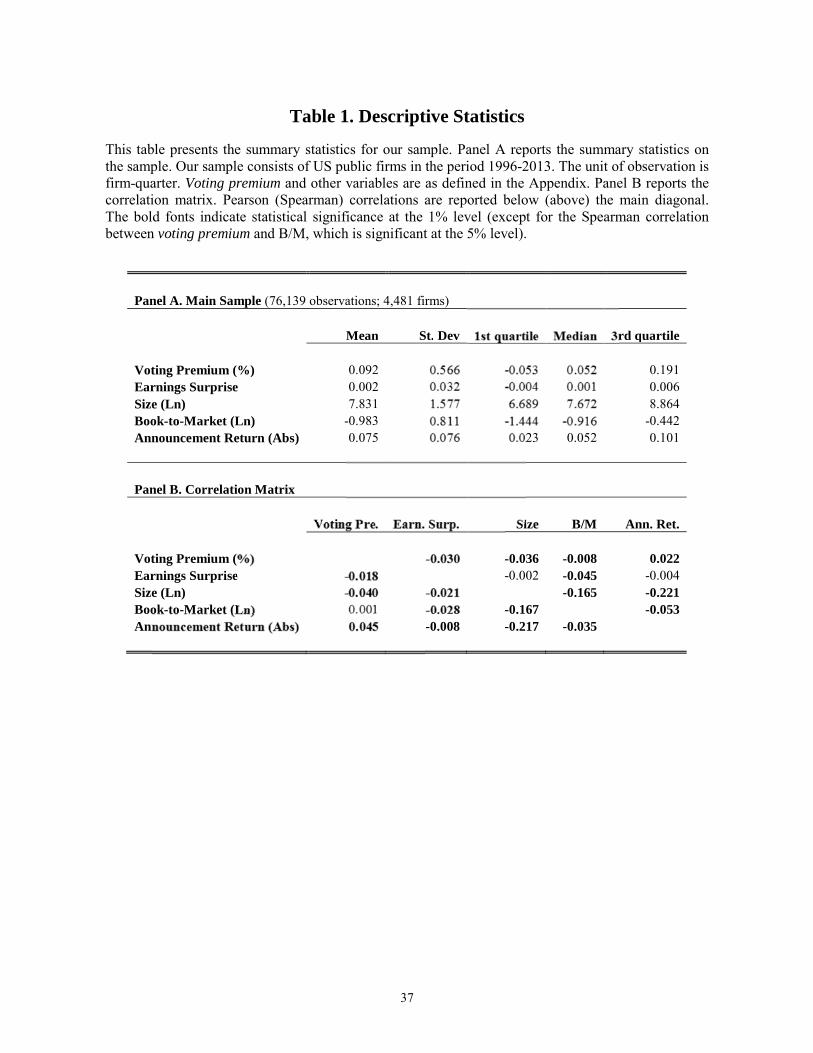
(median) market response is 7.46% (5.22%).14 The voting premium of the sample has a mean
(median) of 0.092% (0.052%). Given the average maturity of options in our sample is 48
14 Throughout the tests, announcement day refers to (-2,+2) window around the earnings announcement day.

17
days, the annualized mean (median) voting premium is 0.69% (0.39%).15
Table 1, Panel B shows the correlation matrix of key variables in the pooled sample.
Pearson (Spearman) correlations are reported below (above) the main diagonal. The earnings
surprise measure is significantly and negatively correlated with the voting premium. This
provides preliminary support for our main thesis that voting premium increases if the firm
announces lower-than-expected earnings.
4. Analysis
We present our baseline regression ana he dependent variable for all
the three regressions is voting premiu erest is the earnings surprise,
which is calculated as the difference gs per share and the expected
earnings (earnings pe by price at the beginning of the
year. Because larger th respect the corporate control
market the firm. We also include proxies for growth
of the f s could be more subject to a control contest
(Chemm monyan 2011). Finally, we include absolute announcement
return t esults are not driven by non-control related volatility of the
stock. We include firm fixed effects to capture unobserved time invariant firm specific voting
premium, and year fixed effects to capture variation in voting premium specific to every year.
( ~Insert Table 2 about here~ )
15 Voting premium for options with maturity T can be annualized using the following formula: 1–(1–voting premium)365/T (see Kalay, Karakaş, and Pant (2014) for more details).

18
We find a negative relation between the voting premium and the earnings surprise. As
shown in Table 2, the coefficient of earnings surprise is statistically significant in all the
Regressions 1, 2, and 3. One standard deviation decrease in earnings surprise corresponds to
about 0.008 to 0.011 percentage point increase in voting premium (t-statistics vary from -2.87
to -3.76), depending upon the specification. Compared to the sample mean voting premium
(0.092%), and taking the large size of firms in our s his amount is
economically sizeable.
4.1. Robustness of Baseline Results
In Table 3, we find that our baseline g the extreme
observations of earnings surprises at th 1st Table 3, Regression 1). When
we analyze the positive and negative e y, we find that our results are
driven more by the n ession 2).16
)
d that earnings are generally less informative
for dua firms. 17 In order to check whether some
unobser ne the choice of being a dual-class stock matter for the relation
we doc ms that have dual-class stocks (about 1.33% of our sample
observations) from our sample (Table 3, Regression 3). We find that our results remain
similar to baseline specification.
16 Interestingly, we find that tail events in the earnings surprise distribution, irrespective of their sign, increase the voting premium (untabulated). 17 Firms with dual-class shares constitute about 6% of the number of public firms in the US. Dual-class firms are subject to sample selection biases, and superior voting shares tend to suffer from low liquidity (Gompers, Ishii, and Metrick 2010).

19
In the last specification Table 3, we exclude firms that pay dividends regularly
(Regression 4). When we calculate the voting premium, we adjust for dividend payments
within the maturity of the options utilized. However, firms that experience a negative earnings
shock are more likely to cancel such dividends (DeAngelo and DeAngelo 1990), which in
turn may introduce a negative bias in the voting premium. This potential bias is less of a
concern since it would work against us finding our resu last column of
Table 3, we restrict our sample to stocks that do not pa peat our tests,
and find that our results are not affected if ocks from the
sample.
4.2. Extensions of Baseline Results
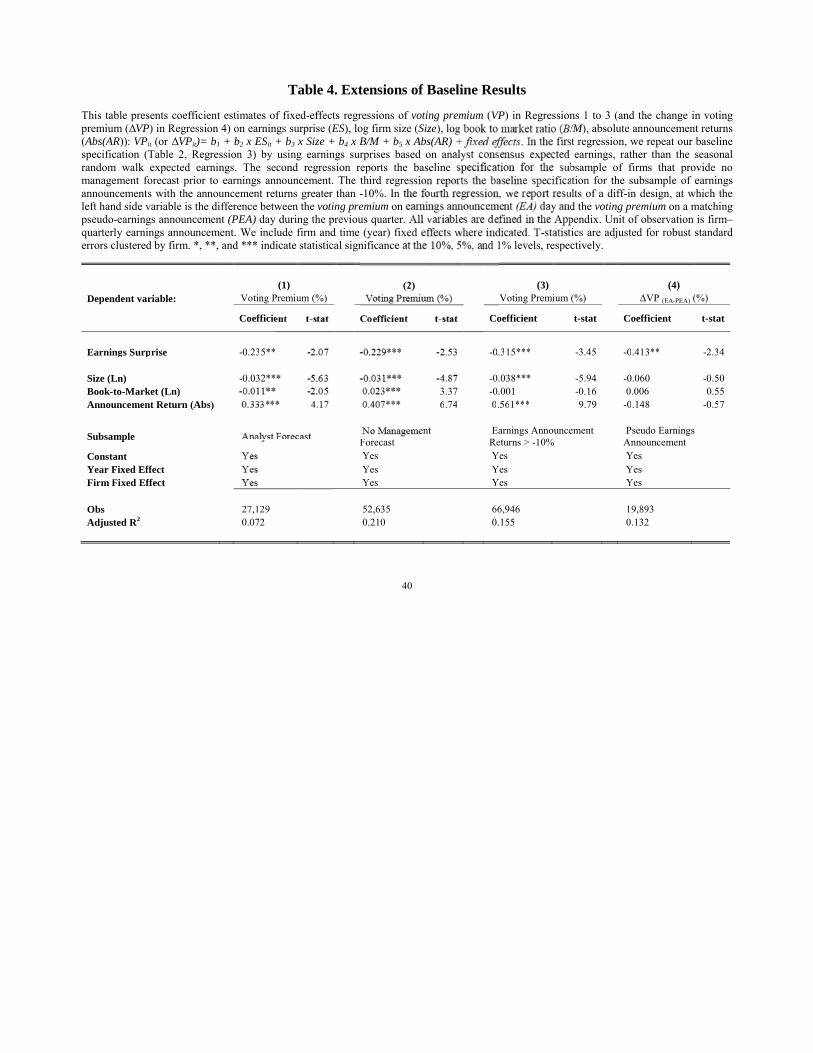
We find similar results to our b mploy an alternative earnings
surprise measure co cast as the expected earnings,
though the sample s consensus (Table 4, Regression
1). The consensus fo a o a a yst forecasts issued within 90 days
before a analyst issues multiple forecasts, we use the
latest fo p companies with analysts following are, on
average lower voting premium and also lower earnings announcement
day retu
( ~Insert Table 4 about here~ )
Prior literature has shown that competitive pressures among firms and incentives of
the managers play a consequential role in timeliness and nature of information disclosed prior
to earnings announcements, particularly through voluntary disclosures. For instance,

20
qualitative disclosures about the firms’ successful operations, press releases about awarding
of important contracts etc. tend to increase when firm performance improves, suggesting that
voluntary disclosures are used to convey good news about the firm (Miller 2002). In contrast,
managers tend to disclose considerable amount of bad news in earnings forecasts, to manage
the anticipated market disappointment arising from the upcoming release of the bad earnings
announcement (Skinner 1994, 1997, Kasznik and Lev 19 n, and Walther
2000, Matsumoto 2002, Richardson, Teoh, and Wysoc owry, and Shu
2005). Hence, for firms using voluntary di inate news in
advance, there may be contaminations in to the voting
premium. Relatedly, Rogers and Van Buskirk nce for managers decreasing
the provision of voluntary disclosure r be held accountable. More
recently, Donelson et al. (2012) fin nings news constant, earlier
revelation of bad ea tigation. They find that a large
portion of bad news i
ng the voluntary disclosure and its impact on
earning eline results hold after excluding stocks that
provide earnings (Regression 2 of Table 4). In order to identify firms
that pro ings guidance to marketplace, we use the IBES Guidance
database that provides information on the timing and the nature of earnings guidance (e.g.,
“Earnings Shortfall,” “Beat Earnings,” “Meet Earnings”). We find that our results continue to
hold for stocks that do not provide earnings guidance.
To further examine the potential impact of litigation risk on voting premium through
earnings announcements, in the spirit of Francis, Philbrick, and Schipper (1994), we identify

21
earnings announcements followed with the large negative stock prices responses (less than -
10% five-day earnings announcement returns) in Regression 3 of Table 4. By doing so, we
essentially determine the earnings announcements that are more likely to be used as a reason
to sue the firm in a class action.18 Unexpected bad earnings often lead to large drops in stock
prices (Bernard, Thomas, and Abarbanell 1993). If the firm is more likely to be sued due to
these sizeable drops, then shareholders who own the sto announcement
retain the rights to claim potential future settlements. uture expected
settlement payments can increase the value ely when the
unexpected bad earnings hit the market. To ble alternative
mechanism plays a role in our documented rela voting premium and earnings
announcements, we repeat our ana gs announcements that are
accompanied by large price declines. esult remains robust (in fact,
becomes stronger) fo likely to be driven by potential
litigation risks. Our f ined with findings in
t whether variation of voting premium on an
actual e rom that of a random date with similar size
equity r ding quarter. In other words, imagine a security that has the
same e parate days: a random day in the given quarter, and actual
earnings announcement day of the same quarter. If we compare the voting premiums on these
two days, we essentially ask whether earnings are perceived to be different by the market in
explaining voting premiums, from the set of events that created a similar return move in the
18 Stock returns are a strong predictor of litigation (Palmrose and Scholz 2004, and Donelson et al. 2012). Our results in Regression 3 of Table 4 are not sensitive to the particular choice of the -10% cutoff for the earnings announcement returns.
22
same quarter. Using a diff-in-diff design, if we find the voting premium to react stronger on
actual announcement days compared to pseudo-earnings announcement days, then that would
suggest that earnings announcement dates are particularly special/influential days for
corporate control purposes. This could be because earnings are deemed more credible by
investors in evaluating the firm performance and/or because other information disseminated
around the earnings announcement, such as actual finan ontain detailed
information to supplement earnings, contain information rposes.
To implement this experiment, we id ment days by
comparing the stock return on earnings annou r days prior to
actual earnings day. To increase match quality r days that are within 5% of
actual earnings announcement return s the closest return to actual
earnings announcem t t th uncement day.” Option market
can be more active r (Amin and Lee 1997). In cases
where the voting pre gs announcement day, we fill it
with m g firm.19 The evidence in Regression 4 of
Table 4 n earnings announcement days are generally
perceiv than pseudo-earnings announcement day to explain market’s
valuatio his is consistent with the conclusion of Collins and DeAngelo
(1990, p.237) analyzing the earnings and proxy contests: “…the prominent role of reported
earnings in the corporate governance process reflects their increased usefulness to investors
attempting to evaluate managerial performance and/or to predict the contest outcome.”
19 Our results are similar if we use the median voting premium instead of mean voting premium. 20 We find that, akin to the earnings announcement days, voting premium reacts negatively to the stock price changes in pseudo-earnings announcement days as well (untabulated).
23
4.3. Shareholder Meetings and Accruals
Markets respond to information content of earnings more when there is greater
uncertainty about a firm’s future prospects (Lang 1991). The uncertainties regarding the
firm’s prospect and disagreements among investors about how to run the firm also make
control valuable (Aghion and Bolton 1986, 1992). Timing of the meetings, content, and
voting outcomes of the proposals play important roles real effects of
earnings in exercising control. Voting premium incre der meetings,
particularly when the control is contested ( 4)). Dissident
shareholders attempting to unseat manageme ally cite poor
accounting performance as evidence of manag e (DeAngelo (1988)). Taking
all these insights into account, and oming shareholder meeting
heightens investor un t i t d in resolving that uncertainty, we
expect that voting d be especially strong before
shareholder meetings
about here~ )
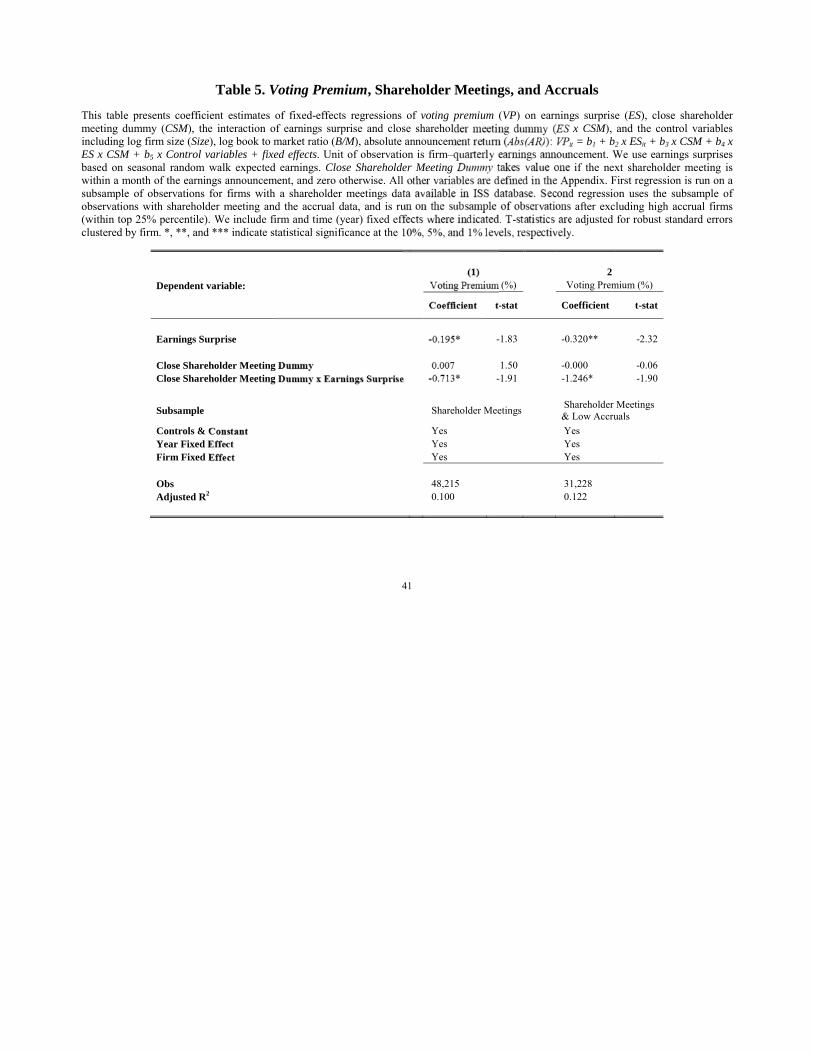
we augment the baseline specification to incorporate the timing
of upco eting. Using the shareholder meeting dates reported ISS
(former e, we define close shareholder meeting dummy (CSM) to take
the value of one if the next shareholder meeting is within a month of the earnings
announcement, and of zero otherwise. We include an interaction term of earnings surprise
(ES) and close shareholder meeting dummy, (ES x CSM), which indicates the incremental
variation captured by the earnings surprise if the shareholder meeting is within the following

24
month. Consistent with our hypothesis, we find the effect of earnings on voting premium to be
stronger when the next shareholder meeting, at which control rights can be exercised, is closer
(Table 5, Regression 1).
Next, we test whether these results can be explained by managerial tendency to
manage earnings upward prior to critical meetings (Collins and DeAngelo 1990). If
incumbent CEOs, on average, report more favorable ea ion campaign,
and if the market anticipates CEOs’ tendency to manag ght before the
annual meetings, depending on the expectatio respond to the
same amount of negative earnings surprises m gs report come
right before the annual meetings. In other word may react differently for the
same amount of negative earnings cts earnings of the firm is
managed.
To investigat ve earnings announcements that
are more likely to c gs. Specifically, for each earnings, we
calculat are within the top 25% in the cross section in
that yea y p ability of upward managed earnings (Sloan
1996), r irms give us a sample that is less contaminated with earnings
manage eported in Regression 2 of Table 5, we continue to find that
the negative impact of earnings on voting premium holds, particularly if the shareholder
meeting is close. It is worthwhile to note that the magnitudes of the coefficients of interest
(i.e., the coefficients of ES and ES x CSM) and the adjusted R-squared figures are higher,
compared to the Regression 1 of Table 5. These results suggest that managerial tendency to
manage earnings prior to critical meetings likely contaminates, but does not drive our results.
25
4.4. Interaction Analysis
Incentive alignment of the manager matters in the market for corporate control. This is
because a firm’s output performance depends on the manager’s effort and the project’s
unobserved long-run profitability (i.e., profitability uncertainty). In his survey, Prendergast
(2002) argues that in a more uncertain environment, the principal (shareholders) may want to
delegate control of most decision making to the agent (m positive risk–
incentive relation. Consistent with this view, we find ation between
earnings and the voting premium is stronger lower pay-for-
performance sensitivity (Table 6, Regression hat the market
views the internal governance mechanism of ntracts (pay-for-performance
sensitivity) and the external governan for corporate control (voting
premium) as substitut h li i
)
Next we use o distinguish whether voting premium varies
across f ms occasionally resort to liquidation of firm
assets i ictable losses. Liquidation option would, ceteris paribus, be
more v angible assets and generalizable assets, because these assets
fetch a are sold at a fire sale (Shleifer and Vishny 2011). Relatedly,
Hayn (1995) shows that when future cash flows become disappointing, stock prices do not fall
as much they should, suggesting shareholders would prefer to liquidate the firm rather than
bear predictable losses. For the firms with higher liquidation option, we expect the voting
21 We capture the pay-for-performance sensitivity by using the “scaled wealth-performance sensitivity” measure of Edmans, Gabaix, and Landier (2009).
26
premium to respond more strongly to unfavorable earnings surprises. Following Daniel and
Titman (2006), we use B/M to proxy for tangibility. Berger, Ofek, and Swary (1996) show
that the value of the firm’s generalizable assets does not decline as much as the value of its
specialized assets. To capture whether a firm has generalizable assets, we use R&D-to-sales
ratio, which is often used as a measure of R&D intensity (Cohen, Diether, and Malloy 2013).
We use R&D-to-sales ratio as our asset generalizabilit sumption that
R&D creates firm specific know-how – ceteris paribu h higher R&D
spending will have lower deployability in the onsistent with
our hypothesis, we find that the voting prem ly to negative
earnings news when the firm does not have ding and when the firm has
more tangible assets (Regressions 2 an
It is importa t t t th t t donment, option value and the
voting premium are r them imply predictions of stock
price changes in the he cash flows of the underlying
security oting rights. Cash flow and control rights are
typicall rt due to the lack of a broadly applicable
measure rights. Changes in the voting premium can potentially explain
some o on option values in the stock prices. In fact, consistent with
Hayn (1995), we find the response of voting premium to earnings surprises to be driven more
by negative earnings surprises (Table 3, Regression 2). The (potential) changes in the
abandonment option value cannot explain the voting premium, since any change in the cash
flows of the underlying security is also identically reflected in the synthetic security created
using options, due to the no arbitrage principle.
27
Skinner and Sloan (2002) argue that low book-to-market stocks (growth stocks)
exhibit an asymmetrically large negative price reactions to negative earnings surprises,
compared to high book-to-market stocks (value stocks), due to overoptimistic expectation
errors. This “earnings torpedo” effect would bias against us finding a stronger negative
relation between the earnings surprises and voting premium for the high book-to-market
stocks in Regression 2 of Table 6. Consistent with ou Hotchkiss, and
Karakaş (2016) find that creditor voting premium in bo rms with more
tangible assets.
4.5. Real Effects of Earnings in Exercising C
Our main argument is that i e the voting premium via
increases in the prospects of exercisi mprove the firm. We have so
far demonstrated evi his argument: negative earnings
increase the voting p the latter part of the argument:
higher voting premiu a ces o cases with control being exercised.
As for t e corporate restructuring, CEO turnovers (as
an inter (as an external exercise of control).
( ~Insert Table 7 about here~ )
To isolate the real effects coming from the earnings announcements, we employ a
two-step procedure such that we first estimate the voting premium changes around the
earnings announcements. We then use the estimated voting premium to see its relation to the
subsequent CEO turnover, restructuring, and takeover events. In Table 7, we report the
estimates of our cross-sectional regressions that include both firm and time fixed effects. We
28
calculate our main variable of interest, voting premium, using the coefficient estimates
reported in Regression 3 of Table 2. We regress three future outcome variables on predicted
voting premium. We obtain these outcome variables using Capital IQ database key
developments file: (1) CEO turnovers, (2) M&A-related news about a firm, and (3)
restructuring-related news (e.g., discontinued operations and downsizing). In all these three
cases, we count the number of unique control-related in 24 months
following a quarterly earnings announcement.
If the unexpectedly bad earnings new he subsequent
control decisions, then we should also observ of the control
decisions (i.e., on the realized exercises of nt with this conjecture, our
evidence suggests that the predicted v om earnings surprises explain
future CEO turnover M&A d gressions 1, 2, and 3).
It is worth no gs announcements indicates the
need for change wit e y to crease if the earnings fall below
expecta tion between corporate control events and
voting p g is in regard to the attempts to change the
compan g of bad earnings may trigger talks about potential takeover
attempt effective as an actual takeover to discipline the incumbent
managerial team. Thus, by explicitly focusing on the intensity of the news regarding a certain
form of a particular control event, our measures allow us to capture not only the actual

29
changes occurred in the company, but also the attempts to change the company.22
Our results resonate well with the basic tenets of the economics. When faced with
losses, firms (are pressured to) take real actions to curtail operations, stem future possible
losses, and/or offer better ways to bolster firm earnings. These actions could involve CEO
turnovers, being a target for potential acquisitions, or major corporate restructurings. Stock
prices respond favorably to value increasing CEO restructuring
announcements. In our framework, voting premium pr novers, M&A
activities, and corporate restructurings, long ts of control-
related events take place. This important distin tion content of
earnings regarding corporate control Collect his section suggest earnings
announcements impact the voting pre redicting real changes in the
company.
5. Con l i
r issue in capital markets, its tie to financial
reportin , in part due to the lack of a broadly applicable measure of the
value o ortant contribution of this study is to bring a new perspective,
and to highlight the control rights implications of certain accounting information by focusing
on the value of voting rights and the earnings announcements. To the best of our knowledge,
this study is the first to point out that accounting disclosure has direct effects on the value of
voting rights in a share. 22 Our results are not driven particularly by this approach. We find similar results if we use the actual realizations of M&As, or focus on a binary variable, rather than the count, of the control-related events.
30
Using a new methodology that utilizes option prices, we estimate the value of voting
rights for a large set of widely-held public firms, and show that the value of voting rights
increases when a firm announces unexpectedly negative earnings. Importantly, variation in
the value of voting rights attributed to earnings surprises predicts realized future exercises of
control, such as CEO turnovers, acquisition offers, and corporate restructurings.
Although we focus on the earnings announcem we believe our
insight and technique of separating the cash flow and vo e stock can be
applied to other important corporate governa closure issues.
This might help explain some of the observed rature such as
the asymmetric stock price reaction to ear at is usually linked to the
liquidation/abandonment option value ether such an explanation is
empirically important i t b t cope of this paper.
31
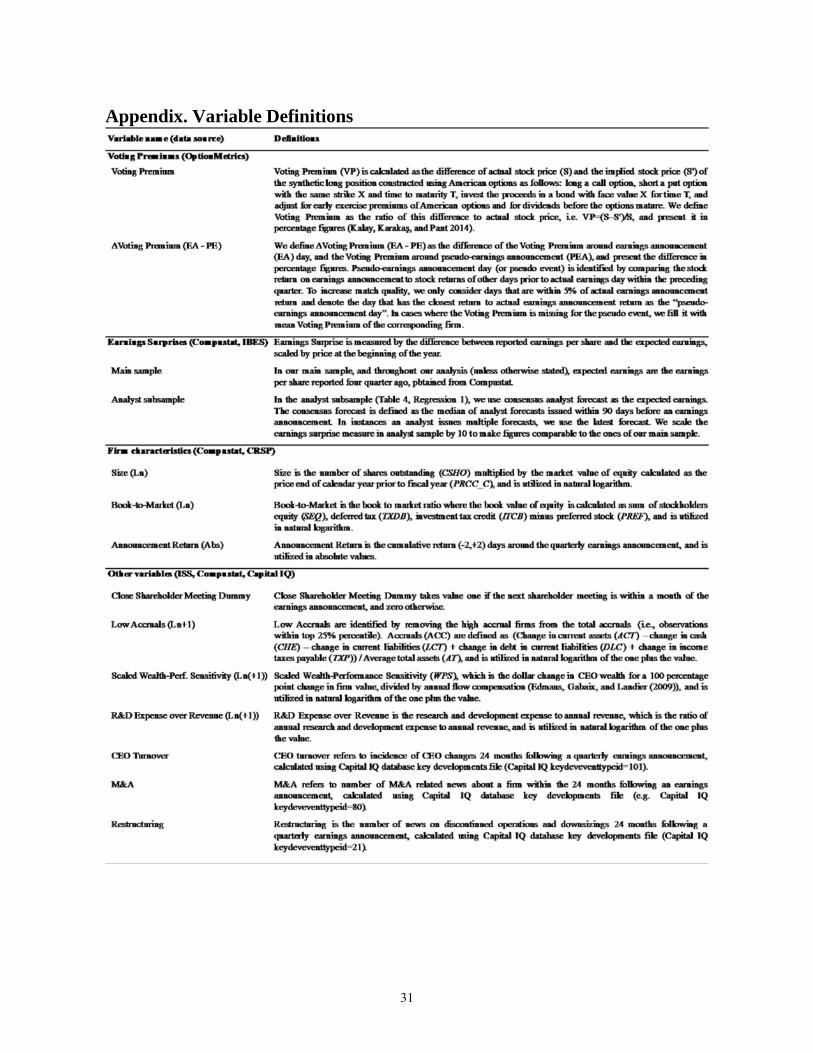
Appendix. Variable Definitions

32
References
Adams, R., and D. Ferreira, 2008, One Share-One Vote: The Empirical Evidence, Review of Finance 12, 51-91.
Aghion, P., and P. Bolton, 1986, An “Incomplete Contracts” Approach to Bankruptcy and the Optimal Financial Structure of the Firm, IMSSS Discussion Paper, Harvard University and University of California, Berkeley.
Aghion, P., and P. Bolton, 1992, An Incomplete Contracts Approach to Financial Contracting, Review of Economic Studies 59, 473-494.
Amin, K.I., and C. Lee, 1997, Option Trading, Pri arnings News Dissemination, Contemporary Accounting Resear
Ball, R., and. L. Shivakumar, 2008, How M in Earnings?, Journal of Accounting Research 46(5),
Barclay, M.J., and C.G. Holderness, 1989 rol of Public Corporations, Journal of Financial Eco 5.
Berger, P.G., E. Ofek, and I. Swary, of the Abandonment Option, Journal of Financial Economic
Berle, A.A., and G C M 193 oration and Private Property (Macmillan, N
Bernard, V.L., J.K. T w Sophisticated Is the Market in Interpreting E orate Finance 6(2), 54-63.
Burkart Vote: The Theory, Review of Finance 12, 1-
Cao, C. mational Content of Option Volume Prior to usiness 78(3), 1073–1109.
Chemm d K. Simonyan, 2011, Management Quality and Antitakeover aw and Economics 54(3), 651-692.
Christensen, H.B., and V.V. Nikolaev, 2012, Capital versus Performance Covenants in Debt Contracts, Journal of Accounting Research, 50(1), 75-116.
Christensen, H.B., V.V. Nikolaev, and R. Wittenberg-Moerman, 2016, Accounting Information in Financial Contracting: The Incomplete Contract Theory Perspective, Working Paper, University of Chicago, and University of Southern California.
Cohen, L., K. Diether, and C. Malloy, 2013, Misvaluing Innovation, Review of Financial Studies 26(3), 635-666.

33
Collins, D.W., and L. DeAngelo, 1990, Accounting Information and Corporate Governance: Market and Analyst Reactions to Earnings of Firms Engaged in Proxy Contests, Journal of Accounting and Economics 13, 213-247.
Cox, S.R., and D.M. Roden, 2002, The Source of Value of Voting Rights and Related Dividend Promises, Journal of Corporate Finance 8, 337-351.
DeAngelo, H., and L. DeAngelo, 1985, Managerial Ownership of Voting Rights: A Study of Public Corporations with Dual Classes of Common Stock, Journal of Financial Economics 14, 33-69.
DeAngelo, L.E., 1988, Managerial Competition, I nd Corporate Governance: The Use of Accounting Perform oxy Contests, Journal of Accounting and Economics 10, 3-36.
DeAngelo, H., and L. DeAngelo, 1990, Divide An Empirical Investigation of Troubled NYSE Firms 1431.
Donelson, D.C., J.M. McInnis, R.D. Mergenth , eliness of Bad Earnings News and Litigation Risk, Th ew 87(6), 1967-1991.
Doran, J.S., A. Fodor, and K. Kr ket Efficiency and Analyst Recommendations, Journal of nting 37(5-6), 560-590.
Dyck, A., and L. Zin l 2004 i : An International Comparison, Journal of Fin
Easterbrook, F.H., a orate Law, Journal of Law and Economics 26
Edmans A Multiplicative Model of Optimal CEO of Financial Studies 22(12), 4881-4917.
Fama, E p of Ownership and Control, Journal of Law 01-325.
Feldhüt and O. Karakaş, 2016, The Value of Creditor Control in al of Financial Economics 121(1), 1-27.
Field, L., M. Lowry, and S. Shu, 2005, Does Disclosure Deter or Trigger Litigation? Journal of Accounting and Economics 39, 487-507.
Francis, J., D. Philbrick, and K. Schipper, 1994, Shareholder Litigation and Corporate Disclosure, Journal of Accounting Research 32(2), 137–164.
Francis, J., K. Schipper, and L. Vincent, 2005, Earnings and Dividend Informativeness When Cash Flow Rights are Separated from Voting Rights, Journal of Accounting and Economics 39(2), 329-360.

34
Gopalan, R., and S. Jayaraman, 2012, Private Control Benefits and Earnings Management: Evidence from Insider Controlled Firms, Journal of Accounting Research 50(1), 117-157.
Gompers, P., J. Ishii, and A. Metrick, 2010, Extreme Governance: An Analysis of Dual-Class Firms in the United States, Review of Financial Studies 23(3), 1051-1088.
Grossman, S.J., and O.D. Hart, 1988, One Share-One Vote and the Market for Corporate Control, Journal of Financial Economics 20, 175-202.
Harris, M., and A. Raviv, 1988, Corporate Governance Majority Rules, Journal of Financial Economics 20, 203-235.
Hauser, S., and B. Lauterbach, 2004, The Value of Vot Shareholders: Evidence from Dual-Class Stock Unifications R dies 17, 1167-1184.
Hayn, C., 1995, The Information Content of nd Economics 20, 125-153.
He, Z., S. Li, B. Wei, and J. Yu, 2013 U and Incentives: Theory and Evidence, Management Scienc
Holthausen, R.W., and R.L. Watts, 2 Value-Relevance Literature for Financial A ti St f Accounting and Economics 31, 3-75.
Jensen, M.C., and W : Managerial Behavior, Agency Costs and Ow Economics 3(4), 305-360.
Jin, W. n Prices Leading Equity Prices: Do Option e?, Journal of Accounting Research 50(2),
Johnson 012, The Option to Stock Volume Ratio and Future Returns, onomics 106(2), 262-286.
Kalay, A ant, 2014, The Market Value of Corporate Votes: Theory and rices, Journal of Finance 69(3), 1235-1271.
Karakaş, O., 2010, Mean Reversion between Different Classes of Shares in Dual-Class Firms: Evidence and Implications, Working Paper, Boston College.
Karakaş, O., and M. Mohseni, 2016, Staggered Boards and the Value of Voting Rights, Working Paper, Boston College and Texas A&M University.
Kasznik, R., and B. Lev, 1995, To Warn or Not to Warn: Management Disclosures in the Face of an Earnings Surprise, The Accounting Review 70, 113-134.

35
Lang, M., 1991, Time-varying Stock Price Response to Earnings Induced by Uncertainty About the Time-series Process of Earnings, Journal of Accounting Research 29(2), 229-257.
Lease, R.C., J.J. McConnell, and W.H. Mikkelson, 1983, The Market Value of Control in Publicly-Traded Corporations, Journal of Financial Economics 11, 439-471.
Levy, H., 1983, Economic Evaluation of Voting Power of Common Stock, Journal of Finance 38, 79-93.
Li, N., 2010, Negotiated Measurement Rules in Deb of Accounting Research 48, 1103-1143.
Manne, H.G., 1964, Some Theoretical Aspects of Share Honor of Adolf A. Berle, Columbia Law Review 64, 1426-1445
Manne, H.G., 1965, Mergers and the Marke al of Political Economy 73(2), 110-120.
Matsumoto, D.A., 2002, Management’s Incent ative Earnings Surprises, The Accounting Review 77, 483-514.
Miller, G.S., 2002, Earnings Perf ry Disclosure, Journal of Accounting Research 40, 173-
Palmrose, Z.-V., and nd Legal consequences of Non-GAAP Repor emporary Accounting Research 21(1), 139–18
Prendergast, C., 200 isk and Incentives, Journal of
Richard 004, The Walk-down to Beatable Analyst suance and Insider Trading Incentives,
ng Research 21, 885-924.
Rogers, irk, 2009, Shareholder Litigation and Changes in Disclosure counting and Economics 47(1), 136-156.
Roychowdhury S., and E. Sletten, 2012, Voluntary Disclosure Incentives and Earnings Informativeness, The Accounting Review 87(5), 1679-1708.
Rydqvist, K., 1996, Takeover Bids and the Relative Prices of Shares that Differ in Their Voting Rights, Journal of Banking and Finance 20, 1407-1425.
Nenova, T., 2003, The Value of Corporate Voting Rights and Control: A Cross-Country Analysis, Journal of Financial Economics 68(3), 325-351.
Shleifer, A., and R.W. Vishny, 2011, Fire Sales in Finance and Macroeconomics, Journal of

36
Economic Perspectives 25(1), 29-48.
Skinner, D.J., 1994, Why Firms Voluntarily Disclose Bad News, Journal of Accounting Research 32, 38-60.
Skinner, D.J., 1997, Earnings Disclosures and Shareholder Lawsuits, Journal of Accounting and Economics 23, 249-282.
Skinner, D.J., and R.G. Sloan, 2002, Earnings Surprises, Growth Expectations, and Stock Returns or Don't Let an Earnings Torpedo Sink Your Portfolio, Review of Accounting Studies 7(2), 289-312.
Smart, S.B., and C.J. Zutter, 2003, Control as a Motivat A Comparison of Dual and Single-Class IPOs, Journal of Financ 110.
Soffer, L.C., S.R. Thiagarajan, and B.R. announcement Strategies, Review of Accounting Studie
Van Buskirk, A., 2011, Volatility Skew, Earn redictability of Crashes, Working Paper, Ohio State Un
Watts, R.L., and J.L. Zimmerman, 19 eory (Englewood Cliffs, N.J.: Prentice-Hall).
Zingales, L., 1994, The Value of the y of the Milan Stock Exchange Experience, R .
Zingales, L., 1995, W e Votes?, Quarterly Journal of Economics 11
37
Table 1. Descriptive Statistics
This table presents the summary statistics for our sample. Panel A reports the summary statistics on the sample. Our sample consists of US public firms in the period 1996-2013. The unit of observation is firm-quarter. Voting premium and other variables are as defined in the Appendix. Panel B reports the correlation matrix. Pearson (Spearman) correlations are reported below (above) the main diagonal. The bold fonts indicate statistical significance at the 1% level (except for the Spearman correlation between voting premium and B/M, which is significant at the 5% level).
Panel A. Main Sample (76,139 observations; 4,481 firms)
Mean St. Dev rd quartile
Voting Premium (%) 0.092 0.191 Earnings Surprise 0.002 0.006 Size (Ln) 7.831 8.864 Book-to-Market (Ln) -0.983 -0.442 Announcement Return (Abs) 0.075 23 0.052 0.101
Panel B. Correlation Matrix
Voting Size B/M Ann. Ret.
Voting Premium (% -0.036 -0.008 0.022 Earnings Surprise -0.002 -0.045 -0.004 Size (Ln) -0.165 -0.221 Book-to-Market (L 0.028 -0.167 -0.053 Ann -0.008 -0.217 -0.035

38
Table 2. Panel Regressions of Voting Premium and Earnings Surprises
This table presents coefficient estimates of fixed-effects regressions of voting premium (VP) on earnings surprise (ES), log firm size (Size), log book to market ratio (B/M), absolute announcement returns (Abs(AR)): VPit = b1 + b2 x ESit + b3 x Size + b4 x B/M + b5 x Abs(AR) + fixed effects. Unit of observation is firm–quarterly earnings announcement. We calculate earnings surprises based on seasonal random walk expected earnings. All variables are defined in the Appendix. We include firm and time (year) fixed effects where indicated. We treat Regression 3 as our baseline regression throughout the paper. T-statistics are adjusted for robust standard errors clustered by firm. *, **, and *** indicate statistical significance at the 10%, 5%, and 1% levels, respectively.
(1) (3)
Dependent variable: Voting Premium (%) Voting Premium (%)
Coefficient t-stat cient t-stat
Earnings Surprise -0.315*** -3.76 *** -2.87
Size (Ln) 8.14 -0.039*** -7.32 Book-to-Market (Ln) 1.26 0.002 0.44 Announcement Return (Abs) 6.62 0.266*** 5.55
Constant 0.092*** 9.95 0.421*** 9.12
Year Fixed Effect Yes Firm Fixed Effect Yes
Obs 76,139 Adjusted R2 0.176 0.179

39
Table 3. Robustness of Baseline Results
This table presents coefficient estimates of fixed-effects regressions of voting premium (VP) on earnings surprise (ES), log firm size (Size), log book to market ratio (B/M), absolute announcement returns (Abs(AR)): VPit = b1 + b4 x B/M + b5 x Abs(AR) + fixed effects. The first regression repeats our baseline specification (Table 2, Regres arnings surprise at the 1st and 99th percentile. The second regression repeats the baseline specification with truncate with only negative earnings. In the third regression, we repeat the baseline specification after excluding dual-class . The fourth regression reports the baseline specification after excluding dividend-paying stocks from the sample All the Appendix. Unit of observation is firm–quarterly earnings announcement. We include firm and time (y T-statistics are adjusted for robust standard errors clustered by firm. *, **, and *** indicate statistical sign els, respectively.
(1) (3) (4)
Dependent variable: Voting Premium (%) Voting Voting Premium (%) Voting Premium (%)
Coefficient t-stat Coefficient t-stat Coefficient t-stat
Earnings Surprise -0.206** 1 94 -0.237*** -2.61 -0.243** -2.64
Size (Ln) -0.037* -0.040*** -6.20 -0.035*** -5.50 Book-to-Market (Ln) 0.000 0.002 0.32 0.006 0.82 Announcement Return (Abs) 0.251* 0.265*** 5.05 0.240*** 4.77
Subsample
& Negative
Excluding Dual-Class Firms
Excluding Dividend Paying Firms
Constant Yes Yes Year Fixed Effect Yes Yes Firm Fixed Effect Yes Yes Yes
Obs 31,903 75,129 72,085 Adjusted R2 0.219 0.151 0.151
40
Table 4. Extensions of Baseline Results
This table presents coefficient estimates of fixed-effects regressions of voting premium (VP) in Regressions 1 to 3 (and the change in voting premium (ΔVP) in Regression 4) on earnings surprise (ES), log firm size (Size), lo /M), absolute announcement returns (Abs(AR)): VPit (or ΔVPit)= b1 + b2 x ESit + b3 x Size + b4 x B/M + b5 x Abs(AR) st regression, we repeat our baseline specification (Table 2, Regression 3) by using earnings surprises based on ana earnings, rather than the seasonal random walk expected earnings. The second regression reports the baseline bsample of firms that provide no management forecast prior to earnings announcement. The third regression repo ation for the subsample of earnings announcements with the announcement returns greater than -10%. In ults of a diff-in design, at which the left hand side variable is the difference between the voting premium on d the voting premium on a matching pseudo-earnings announcement (PEA) day during the previous quarter pendix. Unit of observation is firm–quarterly earnings announcement. We include firm and time (year) fix tics are adjusted for robust standard errors clustered by firm. *, **, and *** indicate statistical significance a 1% levels, respectively.
(1) (3) (4)
Dependent variable: Voting Premium (%) Voting Premium (%) ΔVP (EA-PEA) (%)
Coefficie Coefficient t-stat Coefficient t-stat
Earnings Surprise -0.235** -0.315*** -3.45 -0.413** -2.34
Size (Ln) -0.032** 4.87 -0.038*** -5.94 -0.060 -0.50 Book-to-Market (Ln) 3.37 -0.001 -0.16 0.006 0.55 Announcement Return (Abs 6.74 0.561*** 9.79 -0.148 -0.57
Subsample
ent Forecast
Earnings Announcement Returns > -10%
Pseudo Earnings Announcement
Constant Yes Yes Yes Year Fixed Effect Yes Yes Yes Firm Fixed Effect Yes Yes Yes
Obs 27,129 52,635 66,946 19,893 Adjusted R2 0.072 0.210 0.155 0.132
41
Table 5. Voting Premium, Shareholder Meetings, and Accruals
This table presents coefficient estimates of fixed-effects regressions of voting premium (VP) on earnings surprise (ES), close shareholder meeting dummy (CSM), the interaction of earnings surprise and close sharehol x CSM), and the control variables including log firm size (Size), log book to market ratio (B/M), absolute announcem it = b1 + b2 x ESit + b3 x CSM + b4 x ES x CSM + b5 x Control variables + fixed effects. Unit of observation is firm–q ncement. We use earnings surprises based on seasonal random walk expected earnings. Close Shareholder Meeting if the next shareholder meeting is within a month of the earnings announcement, and zero otherwise. All other varia ppendix. First regression is run on a subsample of observations for firms with a shareholder meetings dat d regression uses the subsample of observations with shareholder meeting and the accrual data, and is ru after excluding high accrual firms (within top 25% percentile). We include firm and time (year) fixed eff e adjusted for robust standard errors clustered by firm. *, **, and *** indicate statistical significance at the 1 y.
2
Dependent variable: m (%) Voting Premium (%)
-stat Coefficient t-stat
Earnings Surprise -1.83 -0.320** -2.32
Close Shareholder Meeting 1.50 -0.000 -0.06 Close Shareholder Meeting 0.713 -1.91 -1.246* -1.90
Subsample
Shareholder Meetings Shareholder Meetings & Low Accruals
Controls & C Yes Yes Year Fixed E Yes Yes Firm Fixed E Yes Yes
Obs 48,215 31,228 Adjusted R2 0.100 0.122

42
Table 6. Interaction Analysis of Voting Premium and Earnings Surprises
This table presents coefficient estimates of fixed-effects regressions of voting premium (VP) on earnings surprise (ES) and on the interaction of the earnings surprise with the following interacting variables: (i) log of one plus s e sensitivity (WPS), (ii) log book to market ratio (B/M), and (iii) log of one plus research and development expense to a n the regressions, we also control for log firm size (Size), log book to market ratio (B/M), and absolute announcement re mate the following regression: VPit = b1+ b2 x ESit + b3 x ESit x Interacting Variable + b4 x Control Variables + fixed ef ification (where interaction variable is B/M) control variables (denoted with ^) refer to Size and Abs(AR) Unit of arterly earnings announcement. All variables are defined in the Appendix. We include firm and time (y T-statistics are adjusted for robust standard errors clustered by firm. *, **, and *** indicate statistical sign els, respectively.
(1) (2) (3) Wea B/M R&D-to-Sales
Dependent variable: Voti Premium (%) Voting Premium (%)
Coef ient t-stat Coefficient t-stat
Earnings Surprise 59*** -3.53 -0.316*** -3.44
Interacting Variables Scaled Wealth-Perf. Sensitivity Book-to-Market 0.004 0.76 R&D Expense o 0.024 0.29
Earnings Surpri 09 -0.287*** -2.76 1.532* 1.68
Controls & Con Yes Yes^ Yes Year Fixed Effec Yes Yes Yes Firm Fixed Effe Yes Yes Yes
Obs 49,165 76,139 76,131 Adjusted R2 0.090 0.180 0.180

43
Table 7. Real Effects of Earnings Surprises through Voting Premium
This table presents coefficient estimates of fixed-effects regressions in which three distinct future outcome variables are regressed on “predicted” voting premium, earnings surprise, and firm characteristics including log firm size (Size), log book to market ratio (B/M), absolute announcement return (Abs(AR)), firm and time (year) fixed effects. We use the coefficient estimates reported in our baseline regressions (Table 2, Regression 3) to estimate the voting premium around an earnings announcement. Outcome variables are calculated using Capital IQ database key developments file. CEO turnover refers to incidence of CEO changes 24 months following a quarterly earnings announcement. M&A refers to the number of M&A-related news about a firm within the 24 months following an earnings announcement. Restructuring refers to h b f ing-related news (e.g., discontinued operations and downsizings) 24 mo rterly earnings announcement. All variables are defined and detailed in the A s surprise based on seasonal random walk expected earnings. T-statistics a standard errors clustered by firm. *, **, and *** indicate statistical signifi and 1% levels, respectively.
(1) (3) Dependent variable: CEO Turnov A Restructuring Real Effect within 24 Months
Coe t-stat Coefficient t-stat
Voting Premium 0.37 2.78 1.124*** 2.62 [predicted via Table 2 Reg 3] Earnings Surprise 0.78 -0.028 -0.09 Controls & Constant Yes Year Fixed Effect Yes Firm F Yes Yes
Obs 65,372 65,372 Adjuste 0.476 0.421